Abstract
The vertical transition zone of mountain vegetation is characterized by high species diversity, and the width of the transition zone may serve as an indirect indicator of climate change. However, research into the differential characteristics of vegetation response to climate changes at the boundary of vertical transition zones has been limited. This study employs MODIS and climate data spanning 2001 to 2018 to investigate spatiotemporal trends in precipitation (PRE), temperature (TMP), radiation (RAD), and Normalized Difference Vegetation Index (NDVI) across nine montane deciduous broad-leaved forests in the eastern monsoon region of China. It explores the time-lag and -accumulation effects of climatic variables on NDVI, quantifying their relative contributions to both its short-term and interannual variations. Results show that, notably, with the Qinling-Daba Mountains as a demarcation, northern regions exhibit significant increases in RAD (0.874–2.047 W m−2/a), whereas southern regions demonstrate notable rises in TMP (0.59–0.73 °C/10a). Areas of lower annual PRE correspond to the most rapid increases in annual average NDVI (5.045 × 10⁻³/a). NDVI’s lag time and cumulative duration responses to TMP are the shortest (0 and 2~4 periods), while its correlation with RAD is the strongest (0.815–0.975), generally decreasing from higher to lower latitudes. TMP significantly affects NDVI variations, impacting both short-term and interannual trends, with PRE driving short-term fluctuations and RAD dictating long-term shifts. This research provides critical data and a theoretical framework that enhances our understanding of how regional vegetation’s vertical zonation responds to climate change, thereby making a substantial contribution to the study of mountain vegetation’s diverse adaptability to climatic variations.
1. Introduction
The sixth assessment report on climate change by the Intergovernmental Panel on Climate Change (IPCC) highlighted that greenhouse gas emissions from human activities have led to an increase of approximately 1.1 °C in global temperatures since the period 1850–1950; projections suggest that global temperatures will likely reach or exceed 1.5 °C within the next 20 years [1]. Against the backdrop of global warming, habitat conditions in mountain landscapes have experienced notable changes [2]. Engler et al. conducted simulation studies on 2632 representative species across European mountain ranges with established long-term observation sites; they predict that in a scenario where temperatures rise by 1.8 °C, between 19% and 46% of mountain forest species are at risk of losing up to 80% of their suitable habitats [3]. There is evidence of migration phenomena in the vertical band spectra. Through the analysis of images from the Spanish Central Mountain range between 1957 and 1991, Sanz-Elorza et al. discovered that low-altitude shrubs, such as Juniperus. and Cytisus., have supplanted high-altitude alpine meadows, primarily consisting of Festuca. [4]. Utilizing historical climate data and comparative photography, Baker et al. observed that warming trends have resulted in glacier retreat and a rise in the elevation of high mountain forest lines [5]. Körner posits that temperature acts as a limiting factor for tree line positions, suggesting an upward shift of these tree lines amid warming conditions [6]. This phenomenon exhibits spatial heterogeneity on a global level: Wang et al. reviewed the literature and revealed that among 179 sampling points in the Northern Hemisphere, approximately 56% of tree line positions in Europe and North America demonstrated upward movement, compared to 64% in Asia [2]. Certain areas that remain unchanged might be influenced by terrain conditions [7] and wind speed [8], potentially hindering the upward movement of forest lines.
Earlier research indicates that transitional areas between vertical zones of mountain vegetation, marked by forest and tree lines, harbor significant species diversity and turnover rates [9], with the width of these zones indirectly mirroring the climate’s variability and sensitivity [10]. This is attributed to the mass elevation effect and aspect effect, among others, influencing the climate of mountains and their surroundings, thereby creating new habitats different from the local climatic zone; and then components typical of one vertical zone exploit this locally non-zonal habitat to expand into adjacent vertical zones, a phenomenon that endows transitional areas between vertical zones with heightened environmental heterogeneity and biodiversity [11]. In the context of global warming, discerning the spatiotemporal dynamics of climate and vegetation within vertical transition zones of mountainous areas across various regions is crucial for understanding the diverse responses of regional vegetation to climate change.
The vegetation indices, derived from remote sensing images, are extensively utilized for monitoring surface vegetation coverage owing to their rapid and broad-scale capabilities. However, due to various factors including sensor calibration, atmospheric conditions, illumination and observation angles, terrain, and soil background, vegetation indices data are often accompanied by noise [12]. Currently, several vegetation indices have been devised to mitigate specific noises: the Global Environmental Monitoring Index (GEMI) targets atmospheric noise reduction [13]; the soil line-based vegetation index aims to minimize soil background influence [14,15]; the Reduced Simple Ratio (RSR) vegetation index suppresses surface background effects [16]; the Enhanced Vegetation Index (EVI) concurrently diminishes the impacts of soil background and atmospheric conditions [17]. Given that nonvegetative noise often exerts a uniform directional effect on the reflectance across different bands, employing band ratios can more effectively mitigate this noise [18].
Among these, the Normalized Difference Vegetation Index (NDVI) is notably one of the most prevalent vegetation indices for assessing terrestrial vegetation productivity [19]. It is applied in ecologically sensitive areas including the Tibetan Plateau [20], the Loess Plateau [21], the Greater Khingan Mountains [22], arid and semi-arid regions [23], southwest karst regions [24], the Northeast Plain [25], the North China Plain [26], and other regions experiencing intense human activity, as well as across the Chinese mainland [27]. However, within the context of climate change, the impact on vegetation is not always immediate. Braswell et al. identified a time-lag effect between temperature fluctuations and the global carbon dioxide growth rate [28]. Guo et al. discovered that the productivity alterations in grasslands are influenced by both the delayed and accumulative effects of precipitation [29]. Currently, research on the time-lag and -accumulation effects of vegetation’s response to climatic factors within vertical transition zones remains relatively scarce.
Montane deciduous broad-leaved forests (MDBF) in the eastern monsoon region of China represent a quintessential example of zonal vegetation adapted to the semi-humid temperate climate [30] and play a pivotal role in the country’s forest biomass carbon storage [31]. The eastern monsoon region of China constitutes the most extensive monsoon climate zone in Asia, and global warming has rendered this region increasingly susceptible to cold waves and droughts, marking it as a climate-sensitive zone within China [32,33]. Precipitation and temperature changes exhibit significant spatial variability in their impact on mountain vegetation cover in the eastern monsoon region of China: the correlation between vegetation NDVI and precipitation and temperature shows an increasing trend with increasing altitude [34,35,36]; the correlation between temperature and vegetation NDVI in most mountainous areas is higher than that of precipitation [37,38]; in the Dabie Mountains, the impact of temperature on NDVI changes within the same year exceeds that of precipitation, whereas precipitation from the preceding year had a greater influence than temperature [39]; additionally, in the Wuling and Xuefeng mountains, winter precipitation positively impacts NDVI changes [40]. However, the specific influence of climate indicators on the relative contributions to NDVI changes, and how these contributions vary among different indicators across various mountains, remains unclear.
In this study, we hypothesize that the NDVI variations at the upper limit of MDBF exhibit spatial heterogeneity, attributable to differences in geographical location and the influence of climatic factors. This work sought to address the following questions: 1. What spatiotemporal differences exist in climatic factors and NDVI at the upper limit of MDBF in the eastern monsoon region of China? 2. What characterizes the spatial differentiation of the time-lag and -accumulation effects of NDVI in response to climatic factors of the upper limit of MDBF in the eastern monsoon region of China? 3. Which climate factors predominantly influence NDVI changes at the upper limit of MDBF in the eastern monsoon region of China, across both short-term and interannual scales? The research results offer data and a theoretical foundation for understanding the differential characteristics of regional vegetation vertical transition zones in response to climate change and are significant for advancing the study of mountain vegetation response to climate change.
2. Materials and Methods
2.1. Study Area
The study area is situated in the eastern monsoon region of China, spanning from 104.5° E to 131.2° E and from 25.7° N to 45.3° N, and encompasses nine mountain ranges: the Changbai, Yanshan, Taihang, Lvliang, Qinling, Daba, Dabie, Wuling, and Xuefeng Mountains (Figure 1). The ecological boundary between the eastern monsoon region and the northwest arid region is typically delineated by a precipitation line of 400 mm, while the boundary with the Tibetan Plateau is roughly defined by an elevation of 4000 m and a terrain slope greater than 7° [41]. The eastern monsoon region is defined by the Qinling Mountains and the Huai River, with the northern area exhibiting a temperate continental monsoon climate. This climate features an annual temperature below 10 °C and annual precipitation ranging from 400 to 800 mm, predominantly concentrated in July and August. The southern region is characterized by tropical and subtropical monsoon climates, with an annual temperature of 10 to 20 °C and annual precipitation exceeding 800 mm, chiefly concentrated in the summer months [32]. The MDBF constitutes the zonal forest type in the temperate and warm-temperate regions of northern China. In the subtropical mountainous areas, owing to the variations in vertical climatic conditions, some types of MDBF also emerge in the upper parts of the mountains [30].
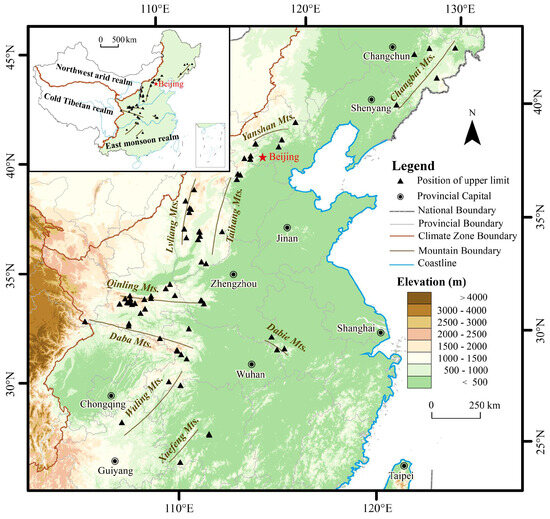
Figure 1.
Study area and distribution of upper limit position points of montane deciduous broad-leaved forests.
2.2. Data
The distribution data of the upper limit of MDBF were obtained from the Global Change Science Research Data Publishing & Repository [42]. This dataset is derived from records documented in the literature, covering 68 sampling locations across nine mountainous areas in the eastern monsoon region of China. It utilized composite elevation information global land surface fine classification product data and Google Earth imagery to extract 100 data points for each sampling location. The correlation coefficient between the extracted mean values and the literature values stands at 0.698, with a fitted line slope of 0.959, indicating statistical significance at the 0.001 level for both. The dataset comprises 6800 sampling points for the upper limit of MDBF in the study area. The recorded data comprise latitude, longitude, and altitude (Figure 1, Table 1).

Table 1.
Distribution position and number of sample points for the upper limit of montane deciduous broad-leaved forests in the east monsoon region of China.
The NDVI data are derived from the MOD13Q1 dataset of the United States Geological Survey (MOD13Q1 MODIS/Terra Vegetation Indices 16-Day L3 Global 250 m SIN Grid). The spatial resolution of the climate data stands at 250 m, with a temporal resolution of 8 d, spanning the period from 2001 to 2018, comprising a total of 414 images. The MODIS NDVI products are computed from atmospherically corrected bi-directional surface reflectances that have been masked for water, clouds, heavy aerosols, and cloud shadows [43]. To mitigate the terrain illumination error associated with the NDVI [18,44], the data points selected for this study, pertaining to mountainous deciduous broad-leaved forests, are situated within relatively lower latitudes (from 27.06° to 42.73°) and lower altitudes (from 965.77 m to 1951.11 m) and exhibit relatively gentle terrain slopes (from 16.99° to 31.28°). In coarser resolution images, the topographic effects might be moderated due to large samples of slopes and illumination conditions within pixels and less illumination from adjacent pixels [45]. Therefore, MOD13Q1 NDVI (band-ratio vegetation index) was used to analyze vegetation dynamic characteristics without terrain correction.
Precipitation, temperature, and radiation data were sourced from the National Ecological Science Data Center. Precipitation and temperature data were obtained from the 2000–2018 China Meteorological Data Spatial Interpolation Dataset. This dataset is derived from observed data from the National Meteorological Information Center of China Meteorological Administration and the Daily Global Historical Climatology Net-work-Daily and was interpolated using ANUSPLINE software v4.4 [46]. Radiation data were obtained from the 2000–2018 National 1 km 8-day Land Surface Net Radiation Dataset. The surface net radiation data was derived from the simulation results of the GLOPEM-CEVSA model, specifically utilizing the model’s radiation module [47]. The spatial resolution of the climate data stands at 1 km, with a temporal resolution of 8 d, spanning the period from 2000 to 2018, comprising a total of 874 images.
2.3. Methods
This study initially examined the spatial distribution and temporal trends of climate factors and NDVI, as illustrated in Figure 2. Subsequently, it investigated the time-lag, accumulation, and combined effects of these climatic factors on NDVI. Utilizing the periods of maximum correlation between climatic factors and NDVI, the study quantified their relative contributions to both short-term and interannual NDVI variations.
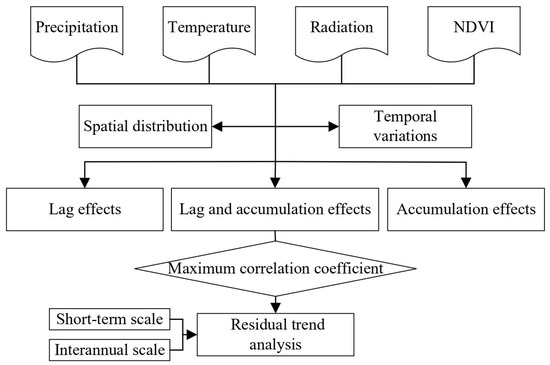
Figure 2.
The workflow of this study.
2.3.1. Preprocessing of Climatic Factors and NDVI
Step 1: First, we reproject, concatenate, and apply a scale factor transformation to the obtained NDVI data. Then, S-G filtering is applied to the time series NDVI data (with the smoothing polynomial of order 3 and a sliding window width of 7). Secondly, quality control is performed using the SummaryQA band of MOD13Q1. A mask is created using pixels with a SummaryQA value of 0 (indicating good data, use with confidence) to extract these data. Then, pixel values with a SummaryQA value that is not 0 are substituted with S-G filtering values. Finally, pixels with NDVI values greater than 1 or less than 0 are replaced with the mean of their adjacent pixels in the time series.
Step 2: We aggregate precipitation [48], temperature [49], and radiation [50] data over 16 d to match the NDVI temporal resolution. Precipitation and radiation are aggregated using the sum method, while temperature is aggregated using the mean method.
Step 3: The ArcMap software v4.4 (https://desktop.arcgis.com/en/arcmap/, accessed on 15 March 2024) is used to extract the aforementioned data to 6800 locations representing the upper limit of MDBF.
Step 4: To analyze the spatial distribution of climatic factors and NDVI, calculations of annual average precipitation, temperature, and radiation flux from 2001 to 2018 are conducted. For the analysis of short-term and interannual trends in climatic factors and NDVI, precipitation, temperature, and radiation are calculated for each period and year from 2001 to 2018.
2.3.2. Spatial Distribution of Climatic Factors and NDVI
The spatial distribution of climatic factors and NDVI at the upper limit of MDBF was explored using the mean values and standard deviation [51]. Mean values represent the overall distribution of PRE, TMP, RAD, and NDVI at the upper limit of MDBF, whereas standard deviation indicates the dispersion among these variables at the sample points.
2.3.3. Temporal Variations in Climatic Factors and NDVI
The Theil–Sen method is a robust non-parametric statistical approach for trend computation. Known for its computational efficiency and insensitivity to small outliers and missing values, this method is widely used in the trend analysis of long-term time series data [52]. In this study, Sen’s slope is utilized to estimate temporal trends in annual climatic factors including annual precipitation, temperature, and radiation and NDVI. The formula is presented as follows:
In Equation (1), the median represents the median function; i and j represent time series data; a β value greater than 0 represents an upward trend, whereas β less than 0 indicates a downward trend in the time series.
The Mann–Kendall test, a non-parametric method, is known for its robustness and stability, enabling the accurate determination of NDVI trends within a specific time scale [53]. When applied to a time series , the test statistic Z is used for trend analysis, with the formula as follows:
In Equations (2)–(5), sgn represents the sign function; and denote the climatic factor or NDVI data for periods i and j (where j > i); n is the length of the time series; S is the test statistic, and ≥ 1.96 indicates that the time series trend has passed a significance test at the 95% confidence level, while < 1.96 indicates a non-significant trend [24].
2.3.4. Time-Lag and -Accumulation Effects of Climatic Factors
This study aims to analyze the magnitude of the time-lag and -accumulation effects of various climatic factors on NDVI in different mountainous MDBF by comparing the correlation coefficients [35].
This study analyzes the differential time-lag and -accumulation effects of various climatic factors on NDVI in the upper limit of MDBF across three scenarios:
- (1)
- Considering time-lag effects, the analysis examines the differential impacts of climatic factors on NDVI with a cumulative period of 1 and lag periods ranging from 0 to 6.
- (2)
- Considering time-accumulation effects, the analysis examines the differential impacts of climatic factors on NDVI with lag period of 0 and cumulative periods ranging from 1 to 6.
- (3)
- Considering time-lag and -accumulation effects, the analysis examines the comprehensive impacts of climatic factors on NDVI through 42 combined forms of lag (from 0 to 6 periods) and cumulative (from 1 to 6 periods) periods [54], as outlined in Table 2. The lag and cumulative periods that correspond to the maximum correlation coefficient between climatic factors and NDVI indicate the optimal lag time and cumulative duration for these climatic factors. Research has indicated that sequences of climatic factors with optimal time-lag and -accumulation effects exert a greater influence on NDVI than scenarios considering only one of these effect [50].
Table 2. Combination of lag time and cumulative duration for climatic factors.
2.3.5. Relative Contributions of Climate Factors to the NDVI Variations
Using the residual trend analysis method, this study quantifies the relative contributions of PRE, TMP, and RAD (with optimal time-lag and -accumulation effects) and other factors to the upper limit NDVI of MDBF across two temporal scales: short-term and interannual NDVI variations. The calculation steps and formulas [55,56] are as follows:
Step 1 involves computing the linear trend rate of NDVI at the upper limit of MDBF using Equation (6).
Step 2 calculates the impact of various climate factors on the linear trend rate of NDVI using Equation (7).
Step 3 entails calculating the force of action of each climate factor on the linear trend rate of NDVI, according to Equation (8).
Finally, Step 4 computes the relative contribution of each climate factor to the linear trend rate of NDVI using Equation (9).
In these equations, θslope represents the slope derived from a simple linear regression between NDVI and n, with n being the time series length. PRE, TMP, and RAD represent precipitation, temperature, and radiation, respectively. Slope(PRE), slope(TMP), and slope(RAD) quantify the impacts of PRE, TMP, and RAD on NDVI’s linear trend, respectively. Slope(PRE) is calculated from (∂NDVI/∂PRE) and (∂PRE/∂n), where (∂NDVI/∂PRE) represents the linear regression slope between NDVI and PRE and (∂PRE/∂n) represents the linear regression slope between PRE and n. The methodologies for calculating slope(TMP) and slope(RAD) follow similarly. Other factor (OF) represents the residual between NDVI’s actual variations and those attributed to climatic factors, highlighting the effects of other factors (e.g., natural disasters, wind) on NDVI fluctuations. Given this study’s focus on natural vegetation zone boundaries—typically minimally impacted by human activities—the influence of human actions is not considered at this study. c(factor) measures the driving force’s magnitude from PRE, TMP, RAD, and OF on NDVI trend variations, whereas C(factor) details the relative contributions of each climate factor.
3. Results
3.1. Spatial and Temporal Variations in Climatic Factors at the Upper Limit of MDBF
3.1.1. Spatial Distribution
From 2001 to 2018, the annual average precipitation at the upper limit of MDBF in the nine mountainous areas ranged from 619.65 to 1552.1 mm (Figure 3). The annual average precipitation decreased moving from the coastal areas (the Changbai Mts., 127.28°E) to the inland areas (the Lvliang Mts., 111.41° E) and increased moving from higher latitudes (the Qinling Mts., 33.80° N) to lower latitudes (the Xuefeng Mts., 27.06° N). The standard deviation of the annual average precipitation varied from 32.46 to 210.57 mm. With the increase in the annual average precipitation, the distribution of standard deviation in the northern mountainous areas (32.46 to 105.28 mm) exhibited a dispersion. The standard deviation of the annual average precipitation in the Wuling and Daba Mts. (210.57 and 129.21 mm) exceeded that of other mountainous areas.
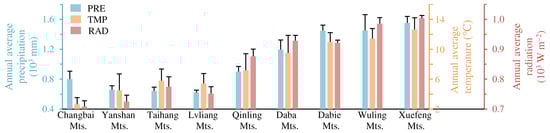
Figure 3.
Distributional characteristics of the annual average precipitation, temperature, and radiation at the upper limit of montane deciduous broad-leaved forests in nine mountainous areas. The black vertical line denotes the standard deviation.
The annual average temperature at the upper limit of MDBF in the nine mountainous areas ranged from 2.63 to 12.62 °C, and the annual average radiation varied from 705.91 to 1003.67 W m−2. The standard deviation of the annual average radiation varied from 9.13 to 33.52 W m−2, with the larger latitudinal span of the Taihang Mts. resulting in the least concentrated distribution of the annual average radiation (33.52 W m−2) (Figure 1).
3.1.2. Temporal Variations
From 2001 to 2018, the Sen’s slope of the annual precipitation at the upper limit of MDBF in the nine mountainous areas varied from 3.303 to 10.083 mm/a (Figure 4). Among these regions, the Daba, Lvliang, Yanshan, and Changbai Mts. exhibited a notably steep increase in the annual precipitation (5.01 to 10.083 mm/a), whereas the remaining mountainous areas showed variations ranging from 3.289 to 3.375 mm/a. The Lvliang, Yanshan, and Changbai Mts. showed a significant increase in the annual precipitation (9.113, 6.048, and 5.025 mm/a).
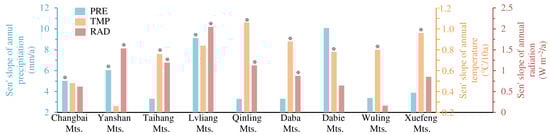
Figure 4.
Sen’s slope of the annual precipitation, temperature, and radiation at the upper limit of montane deciduous broad-leaved forests in nine mountainous areas. * represent a significance level of 0.05.
The Sen’s slopes of the annual temperature and radiation at the upper limit of MDBF ranged from 0.33 to 0.73 °C/10a and 0.162 to 2.047 W m−2/a, respectively. Among these regions, the Qinling Mts. exhibited the most pronounced increase in the annual temperature (0.73 °C/10a), while the Lvliang Mts. displayed the most significant increase in the annual radiation (2.047 W m−2/a). The mountainous regions south of the Taihang and Qinling Mts. experienced significant increases in the annual temperature, while the mountainous regions north of the Daba Mts. exhibited notable increases in the annual radiation.
3.2. Spatial and Temporal Variations in NDVI at the Upper Limit of MDBF
3.2.1. Spatial Distribution
From 2001 to 2018, the annual average NDVI at the upper limit of DBLF in the nine mountainous areas ranged from 0.503 to 0.626 (Figure 5). As precipitation and temperature increase, the annual average NDVI exhibits an increasing trend, with the Dabie and Yanshan Mts. recording the maximum and minimum values, respectively. The standard deviation of the annual average NDVI ranged from 0.027 to 0.051. The distribution of the annual average NDVI in the Xuefeng Mts. is the least concentrated, whereas the Dabie Mts. displayed the opposite pattern.
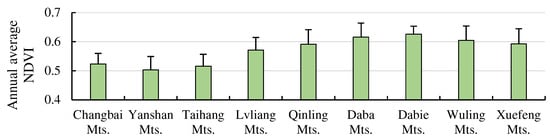
Figure 5.
Distributional characteristics of the annual average NDVI at the upper limit of montane deciduous broad-leaved forests in nine mountainous areas. The black vertical line denotes the standard deviation.
3.2.2. Temporal Variations
From 2001 to 2018, the Sen’s slope of the annual NDVI at the upper limit of MDBF in the nine mountainous areas ranged from −0.541 to 5.045 × 10⁻³/a (Figure 6). Only the Xuefeng Mts. showed a decreasing trend in the annual NDVI, whereas the other mountainous areas exhibited an increasing trend, with Lvliang Mts. recording the highest slope of increase (5.045 × 10⁻³/a). The Sen’s slope of the annual NDVI demonstrated a clear north–south variation, with a trend of increasing followed by decreasing from the Changbai Mts. to the Xuefeng Mts. The mountainous areas north of the Daba Mts. showed a significant increase in the annual NDVI (2.271 to 5.045 × 10⁻³/a), whereas the trend in the southern mountainous areas (−0.541 to 2.413 × 10⁻³/a) was not significant.
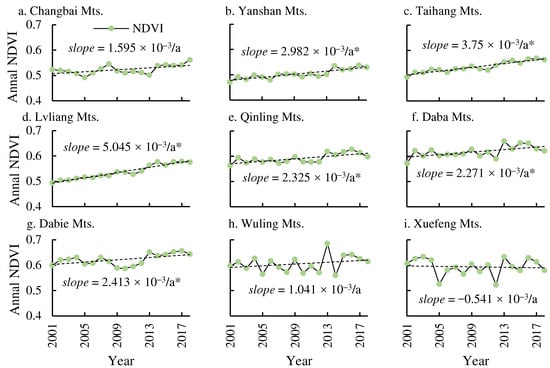
Figure 6.
Sen’s slope of the annual NDVI at the upper limit of montane deciduous broad-leaved forests in nine mountainous areas. * represent a significance level of 0.05.
3.3. Analysis of the Time-Lag and -Accumulation Effects of Climatic Factors at the Upper Limit of MDBF
3.3.1. Analysis of the Time-Lag Effect
From 2001 to 2018, the lag time of PRE, TMP, and RAD at the upper limit of MDBF in the nine mountainous areas was 0 to 4, 0 to 2, and 2 to 4 periods, respectively (Figure 7). The impact of climatic factors on NDVI was found to be in the order of RAD > TMP > PRE. As the lag time increased, the correlation between PRE, TMP, and NDVI showed a significant decreasing trend, while RAD exhibited an initial increase followed by a significant decrease. The changing trends of each climatic factor were more pronounced, with a significant increase in NDVI in the area north of the Daba Mts. The correlation between climatic factors and NDVI showed significant spatial differentiation during the lag periods of 0 to 4, exhibiting a significant decreasing trend from high latitude (the Changbai Mts.) to low latitude (the Daba Mts.).
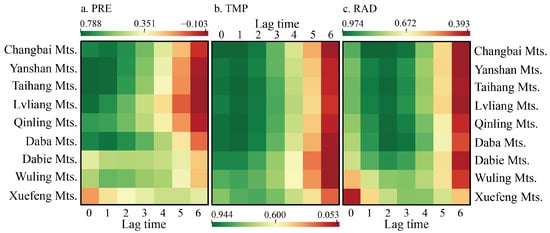
Figure 7.
Correlation between precipitation (a), temperature (b), and radiation (c) with different lag times and the NDVI at the upper limit of montane deciduous broad-leaved forests in nine mountainous areas.
3.3.2. Analysis of the Time-Accumulation Effect
From 2001 to 2018, the cumulative duration of PRE, TMP, and RAD at the upper limit of MDBF in the nine mountainous areas was 3 to 6, 2 to 5, and 5 to 6 periods, respectively (Figure 8). The correlation between climatic factors and NDVI was found to be in the order of RAD > TMP > PRE. The cumulative duration increased and the correlation of PRE and TMP, and NDVI showed a trend of initially increasing and then decreasing, while RAD exhibited a consistently increasing trend. However, there is little difference in the correlation between climatic factors and NDVI at different cumulative periods. It was observed that the climatic factors at the lag 0 period had a greater impact on NDVI, while the time-accumulation effects were not significant. The correlation between climatic factors and NDVI at different lag times showed distinct spatial variations, with the influence decreasing significantly from higher latitudes (the Changbai Mts.) to lower latitudes (the Xuefeng Mts.).
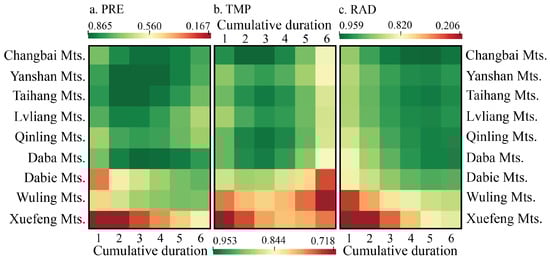
Figure 8.
Correlation between precipitation (a), temperature (b), and radiation (c) with different cumulative durations and the NDVI at the upper limit of montane deciduous broad-leaved forests in nine mountainous areas.
3.3.3. Analysis of Time-Lag and -Accumulation Effects
The optimal lag time for PRE, TMP, and RAD at the upper limit of MDBF in the nine major mountainous areas is 0 to 2, 0, and 0 to 3 periods, respectively, and the optimal cumulative duration is 2 to 6, 2 to 4, and 2 to 5 periods, respectively (Table 3). The lag time and cumulative duration of climatic factors in the Yanshan, Taihang, and Qinling Mts. were equal, while the Changbai and Wuling Mts. were similar. The correlation between PRE, TMP, RAD, and NDVI corresponding to the optimal lag time and cumulative duration is as follows: RAD > TMP > PRE, and it shows a significant decreasing trend from high latitude (the Changbai Mts.) to low latitude (the Daba Mts.).
Table 3.
Combination of optimal lag time and cumulative duration.
3.4. The Relative Contribution of Climate Factors to the NDVI Variations at the Upper Limit of MDBF
3.4.1. Short-Term Scale
TMP and PRE are the main climate factors for the temporal NDVI variation at the upper limit of MDBF in nine mountainous areas, with relative contributions ranging from 20.17% to 38.88% and 1.08% to 40.71%, respectively (Figure 9). PRE, TMP, and RAD all contribute positively to the temporal NDVI variation in nine mountainous areas, while OF are all negative. The Taihang and Lvliang Mts. are less affected by OF (−16.87% and −17.17%).
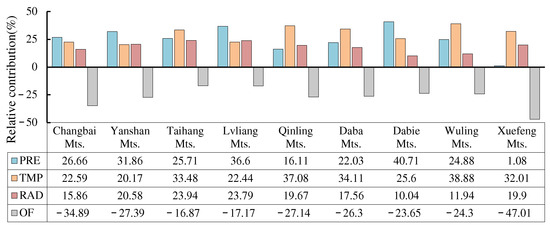
Figure 9.
Relative contribution of different climate factors to the short-term NDVI variation at the upper limit of montane deciduous broad-leaved forests in nine mountainous areas.
3.4.2. Interannual Scale
TMP and RAD are the main climate factors for the annual NDVI variation at the upper limit of MDBF in nine mountainous areas, with relative contributions ranging from −37.62% to 86.76% and −4.15% to 43.65%, respectively (Figure 10). TMP only has a significant negative contribution to the annual NDVI variation of the Xuefeng Mts., with a relative contribution of −37.62%. RAD from the Xuefeng and Wuling Mts. has a negative contribution to annul NDVI variation (−3.75% and −4.15%). PRE has the greatest negative contribution to the Changbai Mts. (−8.8%), while OF has the greatest negative contribution to the Lvliang Mts.
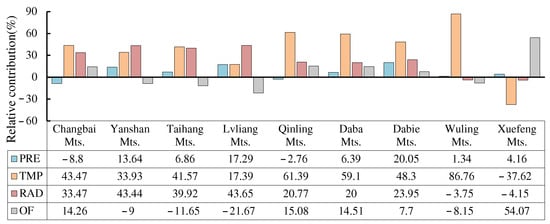
Figure 10.
Relative contribution of climate factors to the annual NDVI variation at the upper limit of montane deciduous broad-leaved forests in nine mountainous areas.
4. Discussion
4.1. Time-Lag and -Accumulation Effects of Climatic Factors at the Upper Limit of MDBF
At present, scholars generally realize that climate dynamically affects the growth status of vegetation asymmetrically [48,57,58]. Ding et al. [49] confirmed that climatic factors have a combined time-lag and -accumulation effects on global vegetation growth. The analysis results of this work indicate that PRE, TMP, and RAD at the upper limit of MDBF in the eastern monsoon region of China have certain lag time and cumulative duration (Figure 7 and Figure 8, Table 3). The above results indicate that the lag time and cumulative duration of vegetation response to TMP in mountainous MDBF is the shortest, followed by PRE and RAD. This analysis result is similar to Ding [49]. The time-accumulation effect of PRE has a significant impact on the growth of global vegetation, and for MDBF, the cumulative duration of PRE exceeds two months [49]. This may be because MDBF have a higher transpiration rate and require a large amount of water to maintain responsive photosynthesis [59]. The accumulation of TMP is beneficial for the growth of vegetation at low temperatures, and the increase in radiation can enhance the activity of photosynthetic enzymes [60]. In summary, for individual plants, the accumulation of PRE, TMP, and RAD affects the plant life cycle [61]; At the ecosystem scale, the geochemical cycling of soil nutrients for plant growth and development also requires time-accumulation effects [62].
In addition, there are significant differences in the time-lag and -accumulation effects between PRE, TMP, and RAD. As the lag time increases, the effects of PRE and TMP on the NDVI of MDBF gradually decrease, while RAD shows a trend of first increasing and then decreasing (Figure 7). This may be the vegetation at the upper limit of MDBF requires a certain amount of time to utilize soil moisture and adapt to new temperature conditions [63,64], and appropriate hydrothermal conditions are conducive to the positive impact of radiation on the growth of vegetation at the upper limit of MDBF. As the cumulative duration increases, the correlation between PRE and TMP with NDVI does not show significant changes, while RAD gradually increases (Figure 8). This may be the stable state of water and heat at the upper limit of MDBF within a certain range, and the time-accumulation effect is not significant. RAD is the main energy source for the growth of vegetation at the upper limit of MDBF, and the accumulation of RAD promotes vegetation growth [65]. Meanwhile, the maximum correlation between climatic factors and NDVI also shows significant spatial differentiation (Figure 7 and Figure 8, Table 3). The maximum correlation coefficients between PRE, TMP, RAD, and NDVI in the MDBF of the nine mountainous areas are the Northern Mts. > the Central Mts. > the Southern Mts. The upper limit vegetation of MDBF in the Northern Mts. is more sensitive to climatic factors, mainly due to the smaller amplitude of climate change in the Southern Mts. and the less limited water and heat on the vegetation. The seasonal changes in TMP and PRE in the Northern Mts. are significant, and the vegetation phenological characteristics are obvious, with a more significant response to climatic factors [66,67].
4.2. The Impact of Climatic Factors on NDVI Variations at the Upper Limit of MDBF
On a global scale, climatic factors significantly impact vegetation change in terrestrial ecosystems, with PRE, TMP, and RAD explaining 64.04% of vegetation growth changes [58]. The analysis results of this work indicate that climatic factors dominate the increasing trend of short-term and annual NDVI in the upper limit of MDBF in nine mountainous areas (Table 4). This is because the study subject of this work is the vertical boundary of natural vegetation, which is rarely disturbed by human activities, and climate change has a significant impact on vegetation growth in sparsely populated areas of China [54]. The relative contribution of PRE to short-term NDVI variation is higher than that to annual NDVI variation, with the greatest relative contribution being the Dabie Mts. (40.71% and 20.05%, respectively). On a longer time scale, vegetation tends to adapt to the environment, thus developing higher water use efficiency [68]. The annual NDVI of vegetation at the upper limit of MDBF in mountainous areas is less affected by PRE. In summary, the difference in the relative contribution of PRE to NDVI variation at different temporal scales is mainly due to the high water demand for vegetation growth at the upper limit of MDBF in the short term, while the impact of PRE over the long term is relatively small, indicating that the upper limit vegetation of MDBF has adapted to water changes.
Table 4.
Comparative analysis of this study’s findings with the existing literature.
TMP is the first climate factor for short-term and annual NDVI variations, while RAD is an important climate factor for annual NDVI variation. TMP and RAD are thermal factors for vegetation growth, and their effects on long-term vegetation growth are relatively high. This analysis result is consistent with the research conducted by Sun et al. [69]. The increase in vegetation coverage in the Northern Hemisphere is influenced by global warming [70]. Ding et al. [49] believe that vegetation growth in the Northern Hemisphere is mainly influenced by TMP and RAD, while in China, it is mainly driven by TMP. The analysis results of Wu et al. [58] indicate that TMP plays a dominant role in the growth of NDVI. Jin et al. [27] believes that the increase in NDVI during China’s growth season in the past 34 years is closely related to TMP, while Yang [71] believes that the increase in RAD is beneficial for vegetation photosynthesis and can effectively promote vegetation to enter the growth season earlier. For example, in the upper limit of MDBF of the Yanshan, Taihang, and Lvliang Mts., the relative contribution of RAD to temporal NDVI variation exceeds 20%, and that to annual NDVI variation exceeds 35% (Figure 9 and Figure 10). TMP and RAD have a positive contribution to the upper limit NDVI of MDBF in nine mountainous areas. While TMP has a significant negative contribution to the annual NDVI variation at the upper limit of MDBF in the Xuefeng Mts, this is related to the decreasing trend of annual NDVI.
4.3. The Impact of Other Factors on NDVI Variations at the Upper Limit of MDBF
Vegetation changes that cannot be explained by climatic factors may be attributed to OF. For the temporal NDVI variation, OF have a negative contribution to the upper limit NDVI of MDBF in nine mountainous areas, which show a decreasing and then increasing trend from high latitude (the Changbai Mts.) to low latitude (the Xuefeng Mts.). The main reason is that the temporal NDVI variation in vegetation growth at the upper limit of MDBF is mainly influenced by water and heat factors. The upper limit NDVI of MDBF is the Taihang and Lvliang Mts., which are least affected by OF, possibly due to the higher distribution of MDBF in the nine mountainous areas (Table 1). The NDVI of vegetation at the upper limit of MDBF is more sensitive to climatic factors (Table 3). The annual NDVI variation reflects the fluctuation trend of the upper limit vegetation of MDBF under long-term climate influence, and the contributions of OF to the annual NDVI variation show significant spatial differentiation. Among them, OF promoted the increase in annual NDVI variation in the Xuefeng, Qinling, Daba, Changbai, and Dabie Mts. (7.7% to 54.07%). Studies have shown that carbon dioxide fertilization and nitrogen deposition promoted vegetation growth in the region [72]. OF have the most significant negative contributions to the Taihang and Lvliang Mts. in the northern mountainous areas (–11.65% and –21.67%), which indicates that under relatively low water conditions for a long time, OF have a significant negative impact on the vegetation at the upper limit of MDBF. OF are the first driving factors (–47.01% and 54.01%) for the short-term and annual NDVI variations of MDBF in the Xuefeng Mts. It indicates that the vegetation at the upper limit of MDBF is influenced by OF besides climate, which may be related to the occurrence of extreme climate events [73].
4.4. The Impact of Elevation and Aspect on the Vegetation at the Upper Limit of MDBF
In the context of global climate change, terrain and topography are relatively constant environmental factors. They create local microclimates by redistributing water and heat, thus affecting the distribution pattern of terrestrial ecosystems [74]. Recent studies have found that altitude affects the response of vegetation to climate change in the three river source areas of the Tibetan Plateau by regulating temperature [75]. Due to the focus of this research on the upper limit of MDBF, significant variations in altitude are observed (Table 1). To explore the influence of altitude on PRE, TMP, RAD, and NDVI at the upper limit of MDBF, a univariate linear regression analysis was conducted. Climatic factors and NDVI from 68 mountain sites were treated as dependent variables and altitude as the independent variable. Figure 11a illustrates a decreasing trend in PRE at the upper limit of MDBF as altitude increases, and PRE decreases by 112.01 mm per 1 km increase in altitude. Previous studies have indicated that PRE in the western Himalayas increases with altitude [76]. It is hypothesized that, on a broader scale, the observed decrease in PRE at the upper limit of MDBF with increasing altitude reflects alterations in PRE of their dominant tree species. Scholars have noted that in the eastern monsoon region of China, the distribution height of the upper limit of MDBF is unaffected by PRE, as the region’s annual precipitation suffices for their growth and development needs, with temperature primarily determining their distribution height [77,78]. As depicted in Figure 11b,c, both TMP and RAD exhibit an increase with altitude, indicating that per 1 km increase in altitude, TMP and RAD increase by 0.704 °C and 37.272 W m−2, respectively. This phenomenon occurs due to the high altitude of mountains, resulting in the slopes of these terrains receiving increased solar radiation. Solar radiation received during the day is emitted as long-wave radiation at night, altering the thermal conditions of both the mountains and their surroundings [79]. Temperature indirectly reflects the mass elevation effect, while solar radiation serves as its mechanistic cause and exhibits greater explanatory power than temperature [80]. Therefore, it is evident that NDVI on the upper limit of MDBF increases with altitude, and NDVI increases by 0.021 per 1 km increase in altitude. It should be noted that the changes in climatic factors and NDVI with altitude are not statistically significant (p > 0.05), likely due to the limited number and uneven distribution points of the upper limit of MDBF.
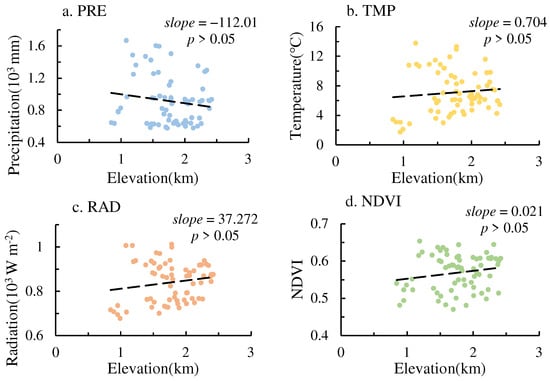
Figure 11.
Variation trend of precipitation (a), temperature (b), radiation (c), and NDVI (d) with elevation at the upper limit of montane deciduous broad-leaved forests in nine mountainous areas.
Slope orientations, considered an important topographic factor in mountain research, have the potential to alter many ecological factors such as light, temperature, water, and soil nutrients for plant growth. For example, in the Hengduan Mountains, due to the influence of the mountain on the local prevailing monsoon, significant disparities exist in water and thermal conditions between the windward and leeward slopes, resulting in the development of different types of vertical mountain band spectra [81]. To explore the spatiotemporal changes of vegetation in different slope orientations, we analyze the annual average NDVI spatial distribution characteristics and interannual variation trends of shady and sunny slopes. As illustrated in Figure 12, the annual average NDVI of the shady and sunny slopes ranges from 0.5 to 0.65, suggesting a higher NDVI on the shady slope compared to the sunny slope, with the Wuling and Xuefeng Mts. being the most prominent. Bochet et al. [82] found that the soil on the sunny slope has a shorter water-holding time compared to the shady slope. After precipitation, the soil on the sunny slope quickly reaches the dry point, which implies that the water conservation capacity of the shady slope is greater than that of the sunny slope [82]. Simultaneously, owing to the limitation of available water, the vegetation coverage of the sunny slope is low, characterized by a shallow root system, increased susceptibility to wind and water erosion, and more severe soil erosion [83]. The Sen’s slope of the annual NDVI for the shady and sunny slopes ranges from –0.647 to 4.29, exhibiting an increase in all slopes except for the Xuefeng Mts. In the mountainous areas south of the Qinling Mts., the Sen’s slope of the annual NDVI is higher on the sunny slope than on the shady slope. Conversely, the opposite is true for other mountainous areas. Recent studies [44] have pointed out that the NDVI on shady slopes is not always greater than that on sunny slopes, a phenomenon attributed to the seasonal transition from water-limitation to energy-limitation. Additional consideration is needed regarding the impact of water evaporation and soil water availability on NDVI in different slope orientations.
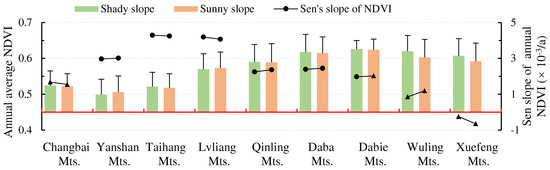
Figure 12.
Distribution and trend of different slope orientations of the annual average NDVI at the upper limit of montane deciduous broad-leaved forests in nine mountainous areas. Shady slopes range from 0 to 90 degrees and from 270 to 360 degrees, while sunny slopes range from 90 to 270 degrees. Circles and triangles represent significant levels at 0.05 and insignificant levels, respectively.
4.5. Limitations of This Study
It is essential to acknowledge certain limitations of this study. Firstly, the study faces limitations due to the limited availability of distribution data collected at the upper limit of MDBF. Although 100 sampling points were extracted for each upper limit position point of MDBF, significant variations existed in the number of areas surveyed. The mean method was employed to characterize the collective distribution traits of NDVI and climatic factors in each mountainous area, aiming to mitigate the constraints posed by insufficient data. Secondly, the current analysis does not account for the effects of soil moisture, changes in carbon dioxide concentration, and nitrogen deposition on NDVI, a topic extensively examined by previous research. Thirdly, due to the constraints of mountain remote sensing, a temporal resolution of 16 d was chosen, along with spatial resolutions of 1 km for climate data and 250 m for NDVI data, to ensure coherence in capturing vegetation dynamics and to maintain temporal and spatial consistency in data resolution. This approach was adopted to address the potential impact of uncertainty superposition at various spatial resolutions on the study’s findings. As this study concentrates on the eastern monsoon region of China and encompasses a large scale, its primary focus lies in delineating the disparities in climate and vegetation alterations across varied mountainous regions. We maintain that the analysis results derived from this dataset continue to hold significance in elucidating the variations in how the upper limit vegetation of MDBF respond to climate factors across diverse mountainous regions.
The next phase of research primarily encompasses the following points: Firstly, leveraging multi-source remote sensing data, digital extraction of the upper limit of MDBF is conducted to augment the sample dataset. Secondly, temperature and precipitation data are downscaled to acquire high-precision climate data. Thirdly, to enhance the ability to capture vegetation dynamics, high-spatial-resolution multi-vegetation index data (Landsat, Sentinel, Himawari) are chosen. However, this approach requires consideration of the composite processing of data from different sensors, along with the implementation of various data correction algorithms including terrain correction, atmospheric correction, and cloud removal processing. Simultaneously, it is crucial to account for how the sensitivity of various spectral bands responds to changes in soil background, atmospheric conditions, Bidirectional Reflectance Distribution Function (BRDF) effects, and the terrain of the surface. Lastly, we will employ spatiotemporal geographic weighted regression analysis or geographic detector methods to examine the spatiotemporal dynamic characteristics of vegetation growth on the upper limit of MDBF in response to climate change at different scales. Simultaneously, it is imperative to consider the impacts of extreme climate events on changes in vegetation cover, thereby advancing research on the response of mountain vegetation vertical zone boundaries to climate change.
5. Conclusions
This study utilizes MODIS NDVI and climate data from 2001 to 2018 to analyze the spatiotemporal variation trends of PRE, TMP, RAD, and NDVI across nine MDBF in the eastern monsoon region of China. It explores the time-lag and -accumulation effects of climatic factors on NDVI, quantifying their relative contributions to both short-term and annual NDVI variations. The key findings are as follows: (1) PRE, TMP, RAD, and NDVI exhibit a general increasing trend from higher to lower latitudes. The Qinling-Daba Mountains mark a significant geographical division, with northern mountainous areas showing a notable trend of increasing annual RAD and southern mountainous areas showing a significant trend in rising annual TMP; mountainous areas with comparatively lower annual PRE demonstrate the fastest rates of increase in annual NDVI. (2) The shortest lag time and cumulation duration in NDVI response were observed for TMP, followed by PRE and RAD. The correlation of NDVI response is strongest with RAD, followed by TMP and PRE, with the correlation between NDVI and these climatic factors generally decreasing from higher to lower latitudes. (3) TMP is identified as the primary driver of both short-term and annual NDVI variations, with short-term NDVI variation being predominantly influenced by PRE and long-term NDVI variation by RAD. In the Taihang and Lvliang Mountains, OF has the smallest negative impact on temporal NDVI variation but the greatest negative impact on annual NDVI variation. The analyses presented in this paper provide valuable data and a theoretical basis for understanding the differential responses of regional vegetation vertical zones to climate change, offering insights significant for advancing research into the diverse reactions of mountain vegetation to climatic variations.
Author Contributions
Conceptualization, Z.W. (Zhiyong Wang) and F.H.; software, Z.W. (Zhiyong Wang); resources, Z.W. (Zhiyong Wang); writing—original draft preparation, Z.W. (Zhiyong Wang); writing—review and editing, Z.W. (Zhiyong Wang), F.H., C.L., K.L. and Z.W. (Zhe Wang); visualization, Z.W. (Zhiyong Wang); supervision, F.H., C.L. and K.L.; project administration, F.H.; funding acquisition, F.H. All authors have read and agreed to the published version of the manuscript.
Funding
This research was supported by the National Natural Science Foundation of China (41401111), Natural Science Foundation of Shandong Province (ZR2021MD080), and Open Research Fund Program of Shandong Provincial Key Laboratory of Eco-Environmental Science for Yellow River Delta (2022KFJJ03).
Data Availability Statement
Dataset available on request from the authors.
Conflicts of Interest
The authors declare no conflicts of interest.
References
- IPCC. Climate Change 2021: The Physical Science Basis; Cambridge University Press: Cambridge, UK, 2021. [Google Scholar]
- Wang, G.X.; Liu, G.H.; Shen, Z.H.; Wang, W.Z. Research progress and future perspectives on the landscape ecology of mountainous areas. Acta Ecol. Sin. 2017, 37, 3967–3981. [Google Scholar]
- Engler, R.; Randin, C.F.; Thuiller, W.; Dullinger, S.; Zimermann, N.E.; Araújo, M.B.; Pearman, P.B.; Lay, G.L.; Piedallu, C.; Albert, C.H.; et al. 21st century climate change threatens mountain flora unequally across Europe. Glob. Chang. Biol. 2011, 17, 2330–2341. [Google Scholar] [CrossRef]
- Sanz-Elorza, M.; Dana, E.D.; González, A.; Sobrino, E. Changes in the high-mountain vegetation of the central Iberian Peninsula as a probable sign of global warming. Ann. Bot. 2003, 92, 273–280. [Google Scholar] [CrossRef] [PubMed]
- Baker, B.B.; Moseley, R.K. Advancing treeline and retreating glaciers: Implications for conservation in Yunnan, P.R. China. Arct. Antarct. Alp. Res. 2007, 39, 200–209. [Google Scholar] [CrossRef]
- Körner, C. Alpine Treelines: Treeline Formation-Currently, in the Past and in the Future; Springer: Basel, Switzerland, 2012. [Google Scholar]
- Greenwood, S.; Chen, J.C.; Chen, C.T.; Jump, A.S. Strong topographic sheltering effects lead to spatially complex treeline advance and increased forest density in a subtropical mountain region. Glob. Chang. Biol. 2014, 20, 3756–3766. [Google Scholar] [CrossRef] [PubMed]
- Takahashi, K.; Hirosawa, T.; Morishima, R. How the timberline formed: Altitudinal changes in stand structure and dynamics around the timberline in central Japan. Ann. Bot. 2012, 109, 1165–1174. [Google Scholar]
- Lu, X.L.; Hu, N.; Ding, S.Y.; Fan, Y.L.; Liao, B.H.; Zhai, Y.J.; Liu, J. The pattern of plant species diversity of Funiu Mountain Nature Reserve. Acta Ecol. Sin. 2010, 30, 5790–5798. [Google Scholar]
- Zhang, B.P.; Yao, Y.H.; Xiao, F.; Zhou, W.Z.; Zhu, L.Q.; Zhang, J.H.; Zhao, F.; Bai, H.Y.; Wang, J.; Yu, F.Q.; et al. The finding and significance of the super altitudinal belt of montane deciduous broad-leaved forests in central Qinling Mountains. Acta Geogr. Sin. 2022, 77, 2236–2248. [Google Scholar]
- Guo, D. The Study of Topographic Controls on Altitudinal Belt on Changbai Mountain; Northeast Normal University: Changchun, China, 2014; pp. 14–20. [Google Scholar]
- LePrieur, C.; Verstraete, M.M.; Pinty, B. Evaluation of the performance of various vegetation indices to retrieve vegetation cover from AVHRR data. Remote Sens. Rev. 1994, 10, 265–284. [Google Scholar] [CrossRef]
- Pinty, B.; Verstraete, M.M. GEMI: A non-linear index to monitor global vegetation from satellites. Vegetatio 1992, 101, 15–20. [Google Scholar] [CrossRef]
- Huete, A.R. A soil-adjusted vegetation index (SAVI). Remote Sens. Environ. 1988, 25, 295–309. [Google Scholar] [CrossRef]
- Baret, F.; Guyot, G. Potentials and limits of vegetation indices for LAI and APAR assessment. Remote Sens. Environ. 1991, 35, 161–173. [Google Scholar] [CrossRef]
- Brown, L.J.; Chen, J.M.; Leblanc, S.G.; Cihlar, J. A shortwave infrared modification to the simple ratio for LAI retrieval in boreal forests: An image and model analysis. Remote Sens. Environ. 2000, 71, 16–25. [Google Scholar] [CrossRef]
- Liu, H.Q.; Huete, A. A feedback based modification of the NDVI to minimize canopy background and atmospheric noise. IEEE T. Geosci. Remote. 1995, 33, 457–465. [Google Scholar] [CrossRef]
- Holben, B.N.; Justice, C.O. The topographic effect on spectral response from nadir-pointing sensors. Photogramm. Eng. Remote Sens. 1980, 46, 1191–1200. [Google Scholar]
- Jiang, R.G.; Xie, J.C.; He, H.L.; Kuo, C.C.; Zhu, J.W.; Yang, M.X. Spatiotemporal variability and predictability of Normalized Difference Vegetation Index (NDVI) in Alberta, Canada. Int. J. Biometeorol. 2016, 60, 1389–1403. [Google Scholar] [CrossRef] [PubMed]
- Liang, D.L.; Tang, H.P. Analysis of vegetation changes and water temperature driving factors in two alpine grasslands on the Qinghai-Tibet Plateau. Acta Ecol. Sin. 2022, 42, 287–300. [Google Scholar]
- Ji, Z.X.; Pei, T.T.; Chen, Y.; Qing, G.X.; Hou, Q.Q.; Xie, B.P.; Wu, H.W. Vegetation phenology change and its response to seasonal climate changes on the Loess Plateau. Acta Ecol. Sin. 2021, 41, 6600–6612. [Google Scholar]
- Shi, S.; Li, W.; Qu, C.; Yang, Z.Y. Spatiotemporal evolution and quantitative attribution analysis of vegetation NDVI in Greater Khingan Mountains Forest-Steppe Ecotone. Environ. Sci. 2024, 45, 248–261. [Google Scholar]
- Xu, L.; Gao, G.Y.; Wang, X.F.; Chen, Y.Z.; Zhou, C.W.; Wang, K.; Fu, B.J. Quantifying the contributions of climate change and human activities to vegetation greening in the drylands of northern China. Acta Ecol. Sin. 2023, 43, 7274–7283. [Google Scholar]
- Jing, J.L.; Deng, Q.F.; He, C.X.; Wang, Y.F.; Ma, B.X. Spatiotemporal evolution of NDVI and its climatic driving factors in the Southwest Karst area from 1999 to 2019. Res. Soil Water Conserv. 2023, 30, 232–239. [Google Scholar]
- Bao, C.L.; Chen, H.G. On time-lag response of vegetation cover to climate change in Northeast Plain. Std. Surv. Map. 2020, 36, 14–20. [Google Scholar]
- Yuan, J.G.; Zhang, S.; Hu, C.Z. Multitemporal SPOT-VGT NDVI change in growing seasons and relationships to climatic factors in Heibei Province. Bull. Sci. Technol. 2015, 31, 47–52. [Google Scholar]
- Jin, K. Spatio-Temporal Variations of Vegetation Cover and Its Relationships between Climate Change and Human Activities over China; Northwest A & F University: Yangling, China, 2019. [Google Scholar]
- Braswell, B.H.; Schimel, D.S.; Linder, E.; Moore III, B. The response of global terrestrial ecosystems to interannual temperature variability. Science 1977, 278, 870–873. [Google Scholar] [CrossRef]
- Guo, L.; Cheng, J.M.; Luedeling, E.; Koerner, S.E.; He, J.S.; Xu, J.C.; Gang, C.C.; Li, W.; Luo, R.M.; Peng, C.H. Critical climate periods for grassland productivity on China’s Loess Plateau. Agric. For. Meteorol. 2017, 233, 101–109. [Google Scholar] [CrossRef]
- Chen, L.Z. Flora and Vegetation Geography of China; Science Press: Beijing, China, 2014. [Google Scholar]
- Guo, Z.D.; Hu, H.F.; Li, P.; Li, N.Y.; Fang, J.Y. Spatio-temporal changes in biomass carbon sinks in China’s forest during 1977–2008. Sci. China Life Sci. 2013, 43, 421–431. [Google Scholar]
- Liu, Y.L.; Hua, Y.; Zhou, H.C.; Ye, L.; Wang, G.Q.; Jin, J.L.; Bao, Z.X. Precipitation variation and trend projection in the eastern monsoon region of China since 1470. Adv. Water Sci. 2022, 33, 1–14. [Google Scholar]
- Zheng, J.Y.; Hao, Z.X.; Fang, X.Q.; Ge, Q.S. Changing characteristics of extreme climate events during past 2000 years in China. Prog. Geogr. 2014, 33, 3–12. [Google Scholar]
- Qin, J.; Bai, H.Y.; Zhao, P.; Yang, N.J.; Yue, J.W. Age-dependent response of Abies fargesii tree radial growth to climatic factors in the Qinling Mountains. Acta Ecol. Sin. 2022, 42, 7167–7176. [Google Scholar]
- Hou, G.L.; Zhang, H.Y.; Guo, D.; Guo, X.Y. Spatial-temporal variation of NDVI in the growing season and its sensitivity to climatic factors in Changbai Mountains. Prog. Geogr. 2012, 31, 285–292. [Google Scholar]
- Deng, C.H.; Bai, H.Y.; Gao, S.; Liu, R.J.; Ma, X.P.; Huang, X.Y.; Meng, Q. Spatial-temporal variation of the vegetation coverage in Qinling Mountains and its dual response to climate change and human activities. J. Nat. Res. 2018, 33, 425–438. [Google Scholar]
- Liu, Q.; Jing, H.T.; Liu, P.P.; Tang, J.Y.; Wang, L. Research on the relationship between temporal and spatial changes of NDVI and climate factors in the Taihang Mountains. J. Northeast For. Univ. 2023, 38, 1–9+33. [Google Scholar]
- Li, M.W.; Luan, Q.; Zhang, N.; Chang, Q.; Fan, Z.H.; Yang, Q.; Zhao, Y.Q.; Mi, X.L. Analysis of spatiotemporal dynamics and influencing factors of vegetation NDVI in Lvliang city from 2000 to 2019. Res. Soil Water Conserv. 2022, 29, 248–254. [Google Scholar]
- Zhang, L.; Jiang, J. Temporal and spatial variation characteristics of surface vegetation and its relationship with environmental factors based on MODIS-NDVI. J. Anhui Agric. Sci. 2022, 50, 57–63. [Google Scholar]
- Huang, C.X.; Hu, S.S.; Huang, Y. Analysis on spatiotemporal variation characteristics and influencing factors of NDVI in Hunan Province. Ecol. Sci. 2023, 42, 114–126. [Google Scholar]
- Liu, C.; Shi, R.X. GIS dataset of boundaries among four geo-eco regions of China. J. Glob. Change Data Discov. 2018, 2, 42–50+173–181. [Google Scholar]
- Wang, Z.Y.; Han, F.; Li, C.R.; Mu, H.X.; Wang, Z. Dataset of the upper limit of montane deciduous broad-leaved forests in the east monsoon realm of China. Digit. J. Glob. Change Data Repos. 2023. [CrossRef]
- Didan, K.; Munoz, A.B. MODIS Vegetation Index User’s Guide (MOD13 Series); University of Arizona: Tucson, AZ, USA, 2019. [Google Scholar]
- Kumari, N.; Saco, P.M.; Rodrigues, J.F.; Johnstone, S.A.; Srivastava, A.; Chun, K.P.; Yetemen, O. The grass is not always greener on the other side: Seasonal reversal of vegetation greenness in aspect-driven semiarid ecosystems. Geophys. Res. Lett. 2020, 47, e2020GL088918. [Google Scholar] [CrossRef]
- Zhu, G.L.; Liu, Y.B.; Ju, W.M.; Chen, J.M. Evaluation of topographic effects on four commonly used vegetation indices. J. Remote Sens. 2013, 17, 210–234. [Google Scholar]
- Wang, J.B.; Wang, J.W.; Ye, H.; Liu, Y.; He, H.L. An interpolated temperature and precipitation dataset at 1-km grid resolution in China (2000–2012). China Sci. Data 2017, 2, 73–80+205–212. [Google Scholar]
- Wang, J.B. The Nation’s 1 km of the Country’s Surface Net Radiating Data Set during 2000–2018; National Ecological Science Data Center: Beijing, China, 2021. [Google Scholar]
- Peng, S.S.; Piao, S.L.; Ciais, P.; Myneni, R.B.; Chen, A.; Chevallier, F.; Dolman, A.J.; Janssens, I.A.; Penuelas, J.; Zhang, G.X.; et al. Asymmetric effects of daytime and night-time warming on Northern Hemisphere vegetation. Nature 2013, 501, 88–92. [Google Scholar] [CrossRef] [PubMed]
- Ding, Y.X.; Li, Z.; Peng, S.Z. Global analysis of time-lag and -accumulation effects of climate on vegetation growth. Int. J. Appl. Earth Obs. 2020, 92, 102179. [Google Scholar] [CrossRef]
- Gourdji, S.M.; Sibley, A.M.; Lobell, D.B. Global crop exposure to critical high temperatures in the reproductive period: Historical trends and future projections. Environ. Res. Lett. 2013, 8, 024041. [Google Scholar] [CrossRef]
- Zhuo, G.; Chen, S.R.; Zhou, B. Spatio-temporal variation of vegetation coverage over the Tibetan Plateau and its responses to climatic factors. Acta Ecol. Sin. 2018, 38, 3208–3218. [Google Scholar]
- Sen, P.K. Estimates of the regression coefficient based on Kendall’s tau. J. Am. Stat. Assoc. 1968, 63, 1379–1389. [Google Scholar] [CrossRef]
- Xu, Y.; Huang, W.T.; Dou, S.Q.; Guo, Z.D.; Li, X.Y.; Zheng, Z.W.; Jing, J.L. Responding mechanism of vegetation cover to climate change and human activities in Southwest China from 2000 to 2020. Environ. Sci. 2022, 43, 3230–3240. [Google Scholar]
- Gessner, U.; Naeimi, V.; Klein, I.; Kuenzer, C.; Klein, D.; Dech, S. The relationship between precipitation anomalies and satellite-derived vegetation activity in Central Asia. Global Planet. Change 2013, 110, 74–87. [Google Scholar] [CrossRef]
- Ge, W.Y.; Deng, L.Q.; Wang, F.; Han, J.Q. Quantifying the contributions of human activities and climate change to vegetation net primary productivity dynamics in China from 2001 to 2006. Sci. Total Environ. 2021, 773, 145648. [Google Scholar] [CrossRef] [PubMed]
- Liu, Y.; Liu, H.H.; Chen, Y.; Gang, C.C. Spatio-temporal dynamics of vegetation optical depth and its driving forces in China from 2000 to 2018. Acta Geogr. Sin. 2023, 78, 729–745. [Google Scholar]
- Nemani, R.R.; Keeling, C.D.; Hashimoto, H.; Jolly, W.M.; Piper, S.C.; Tucker, C.J.; Myneni, R.B.; Running, S.W. Climate-driven increases in global terrestrial net primary production from 1982 to 1999. Science 2003, 300, 1560–1563. [Google Scholar] [CrossRef] [PubMed]
- Wu, D.H.; Zhao, X.; Liang, S.L.; Zhou, T.; Huang, K.C.; Tang, B.J.; Zhao, W.Q. Time-lag effects of global vegetation responses to climate change. Global Change Biol. 2015, 21, 3520–3531. [Google Scholar] [CrossRef] [PubMed]
- Ershadi, A.; McCabe, M.F.; Evans, J.P.; Wood, E.F. Impact of model structure and parameterization on Penman-Monteith type evaporation models. J. Hydrol. 2015, 525, 521–535. [Google Scholar] [CrossRef]
- Shi, C.G.; Sun, G.; Zhang, H.X.; Xiao, B.X.; Zhang, N.N.; Wu, N. Effects of warming on chlorophyll degradation and carbohydrate accumulation of alpine herbaceous species during plant senescence on the Tibetan Plateau. PLoS ONE 2014, 9, e107874. [Google Scholar] [CrossRef]
- Busetto, L.; Colombo, R.; Migliavacca, M.; Cremonese, E.; Meroni, M.; Galvagno, M.; Rossini, M.; Siniscalco, C.; Morra Di Cella, U.; Pari, E. Remote sensing of larch phenological cycle and analysis of relationships with climate in the Alpine region. Global Change Biol. 2010, 16, 2504–2517. [Google Scholar] [CrossRef]
- Vicente-Serrano, S.M.; Julio Camarero, J.; Azorin-Molina, C. Diverse responses of forest growth to drought time-scales in the Northern Hemisphere. Global Ecol. Biogeogr. 2014, 23, 1019–1030. [Google Scholar] [CrossRef]
- Lin, P.F.; Zhu, X.; He, Z.B.; Du, J.; Chen, L.F. Research progress on soil moisture temporal stability. Acta Ecol. Sin. 2018, 38, 3403–3413. [Google Scholar]
- Wei, S.J.; Luo, B.Z.; Sun, L.; Wei, S.W.; Liu, F.F.; Hu, H.Q. Spatial and temporal heterogeneity and effect factors of soil respiration in forest ecosystems: A review. Ecol. Environ. Sci. 2013, 22, 689–704+17. [Google Scholar]
- Liu, Y.N.; Ao, M.; Li, B.; Guan, Y.X. Effect of ultraviolet-B (UV-B) radiation on plant growth and development and its application value. Soils Crops 2020, 9, 191–202. [Google Scholar]
- Lei, Q.; Hu, Z.W.; Wang, J.Z.; Zhang, Y.H.; Wu, G.F. Spatiotemporal dynamics of NDVI in China from 1985 to 2015, Ecosystem variation, regional differences, and response to climatic factors. Acta Ecol. Sin. 2023, 43, 6378–6391. [Google Scholar]
- Liu, Y.L.; Guo, R.Q.; Sun, S.C. Variations in the vertical vegetation zonation of subtropical Chinese mountains: The importance of climatic seasonality. Acta Ecol. Sin. 2010, 30, 3912–3922. [Google Scholar]
- Liu, X.F.; Hu, B.Y.; Ren, Z.Y. Spatiotemporal variation of water use efficiency and its driving forces on the Loess Plateau during 2000–2014. Sci. Agric. Sin. 2018, 51, 302–314. [Google Scholar]
- Sun, R.; Chen, S.H.; Su, H.B. Climate Dynamics of the Spatiotemporal Changes of Vegetation NDVI in Northern China from 1982 to 2015. Remote Sens. 2021, 13, 187. [Google Scholar] [CrossRef]
- Kaufmann, R.K.; Zhou, L.; Tucker, C.J.; Slayback, D.; Shabanov, N.V.; Myneni, R.B. Reply to comment on “Variations in northern vegetation activity inferred from satellite data of vegetation index during 1981–1999” by J. R. Ahlbeck. J. Geophys. Res. 2022, 107, 4127. [Google Scholar] [CrossRef]
- Yang, X.M. Spatial-Temporal Variations of Desert Vegetation and Its Response to Climate Change in Hexi Area during 1982–2013; Lanzhou University: Lanzhou, China, 2015. [Google Scholar]
- Zhu, Z.C.; Piao, S.L.; Myneni, R.B.; Huang, M.T.; Zeng, Z.Z.; Canadell, J.G.; Ciais, P.; Sitch, S.; Fridelingstein, P.; Arneth, A.; et al. Greening of the Earth and its drivers. Nat. Clim. Change 2016, 6, 791–795. [Google Scholar] [CrossRef]
- Wang, P.X.; Gong, J.Y.; Li, X.W.; Wang, J.D. Advances in drought monitoring by using remotely sensed normalized difference vegetation index and land surface temperature products. Adv. Earth Sci. 2003, 18, 527–533. [Google Scholar]
- Cantón, Y.; Del Barrio, G.; Solé-Benet, A.; Lázaro, R. Topographic controls on the spatial distribution of ground cover in the Tabernas badlands of SE Spain. CATENA 2004, 55, 341–365. [Google Scholar] [CrossRef]
- Xiong, X.T.; Li, C.H.; Chen, J.H. Topographic regulatory role of vegetation response to climate change. Acta Geogr. Sin. 2023, 78, 2256–2270. [Google Scholar]
- Singh, P.; Kumar, N. Effect of orography on precipitation in the western Himalayan region. J. Hydrol. 1997, 199, 183–206. [Google Scholar] [CrossRef]
- Wang, J.; Zhang, B.; Yao, Y. The spatial pattern of the upper limit of montane deciduous broad-leaved forests and its geographical interpretation in the east monsoon realm of China. Forests 2021, 12, 1225. [Google Scholar] [CrossRef]
- Wang, Z.Y.; Han, F.; Li, C.R.; Li, K.; Mu, H.X.; Wang, Z. Distribution characteristics and geographical interpretation of the upper limit of montane deciduous broad-leaved forests in the eastern monsoon region of China. Acta Geogr. Sin. 2024, 79, 240–258. [Google Scholar]
- Liu, J.J. Study on the Influence of Mass Elevation Effect on Solar Radiation and Altitudinal Belt of Vegetation in the Qinling-Daba Mountains; Henan University: Zhengzhou, China, 2020. [Google Scholar]
- Suo, N.D.Z.; Yao, Y.H.; Zhang, B.P. Comparative study on the mountain elevation effect of the Tibetan Plateau and the Alps. Geogr. Res. 2020, 39, 2568–2580. [Google Scholar]
- Yao, Y.H.; Zhang, B.P.; Han, F.; Pang, Y. Spatial pattern and exposure effect of altitudinal belts in the Hengduan Mountains. Mount. Res. 2010, 28, 11–20. [Google Scholar]
- Bochet, E.; García-Fayos, P. Factors controlling vegetation establishment and water erosion on motorway slopes in Valencia, Spain. Restor. Ecol. 2004, 12, 166–174. [Google Scholar] [CrossRef]
- Yang, W.J.; Wang, Y.H.; Webb, A.A.; Li, Z.Y.; Tian, X.; Han, Z.T.; Wang, S.L.; Yu, P.T. Influence of climatic and geographic factors on the spatial distribution of Qinghai spruce forests in the dryland Qilian Mountains of Northwest China. Sci. Total Environ. 2018, 612, 1007–1017. [Google Scholar] [CrossRef] [PubMed]
Disclaimer/Publisher’s Note: The statements, opinions and data contained in all publications are solely those of the individual author(s) and contributor(s) and not of MDPI and/or the editor(s). MDPI and/or the editor(s) disclaim responsibility for any injury to people or property resulting from any ideas, methods, instructions or products referred to in the content. |
© 2024 by the authors. Licensee MDPI, Basel, Switzerland. This article is an open access article distributed under the terms and conditions of the Creative Commons Attribution (CC BY) license (https://creativecommons.org/licenses/by/4.0/).