
Method for Determining the Coefficient of Friction Variation Pattern as a Function of Density at Low Temperatures Using the Example of Dry Ice–Steel Contact


Abstract
1. Introduction
2. Materials and Methods
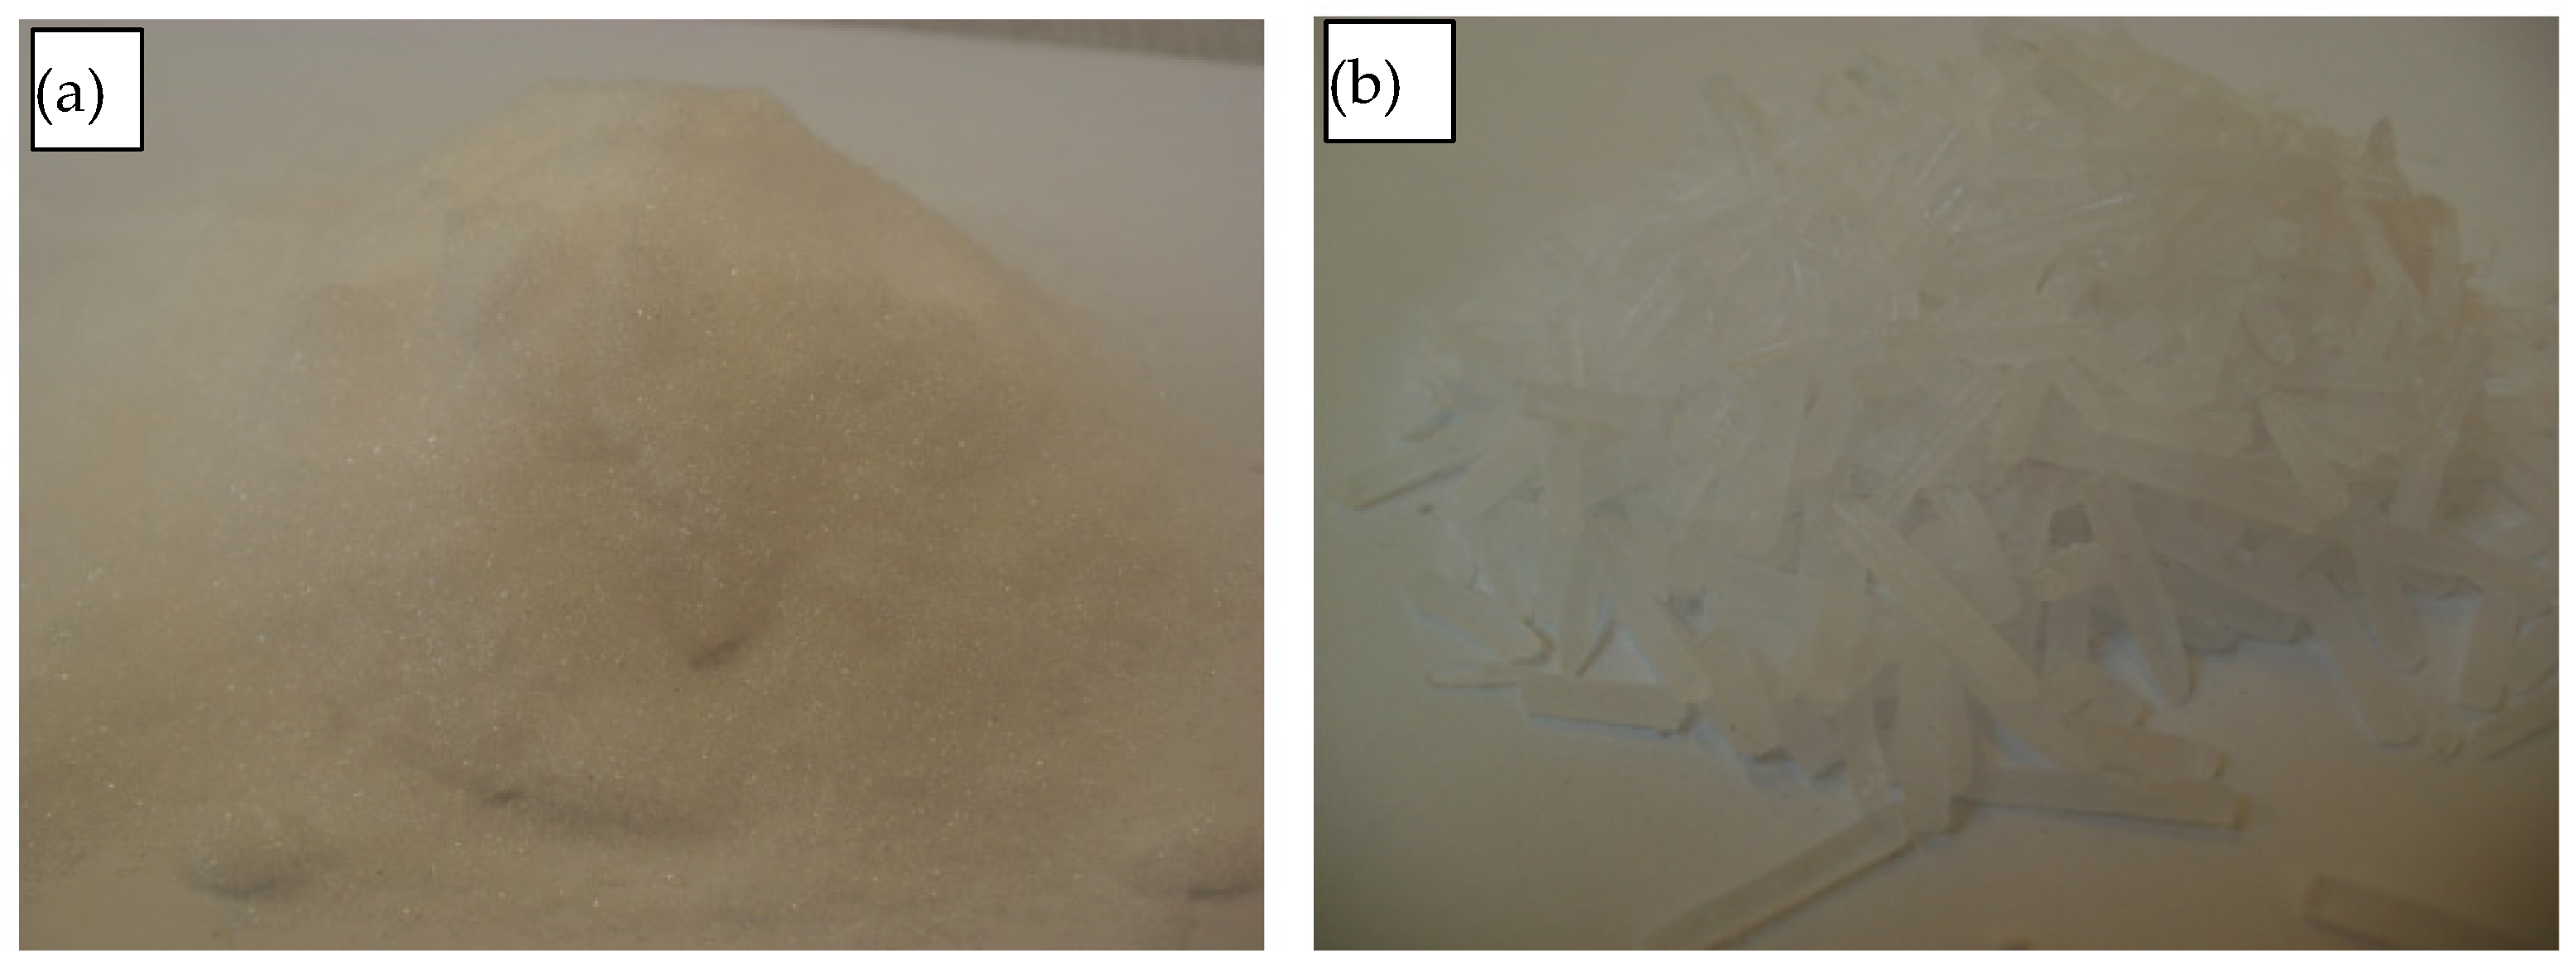
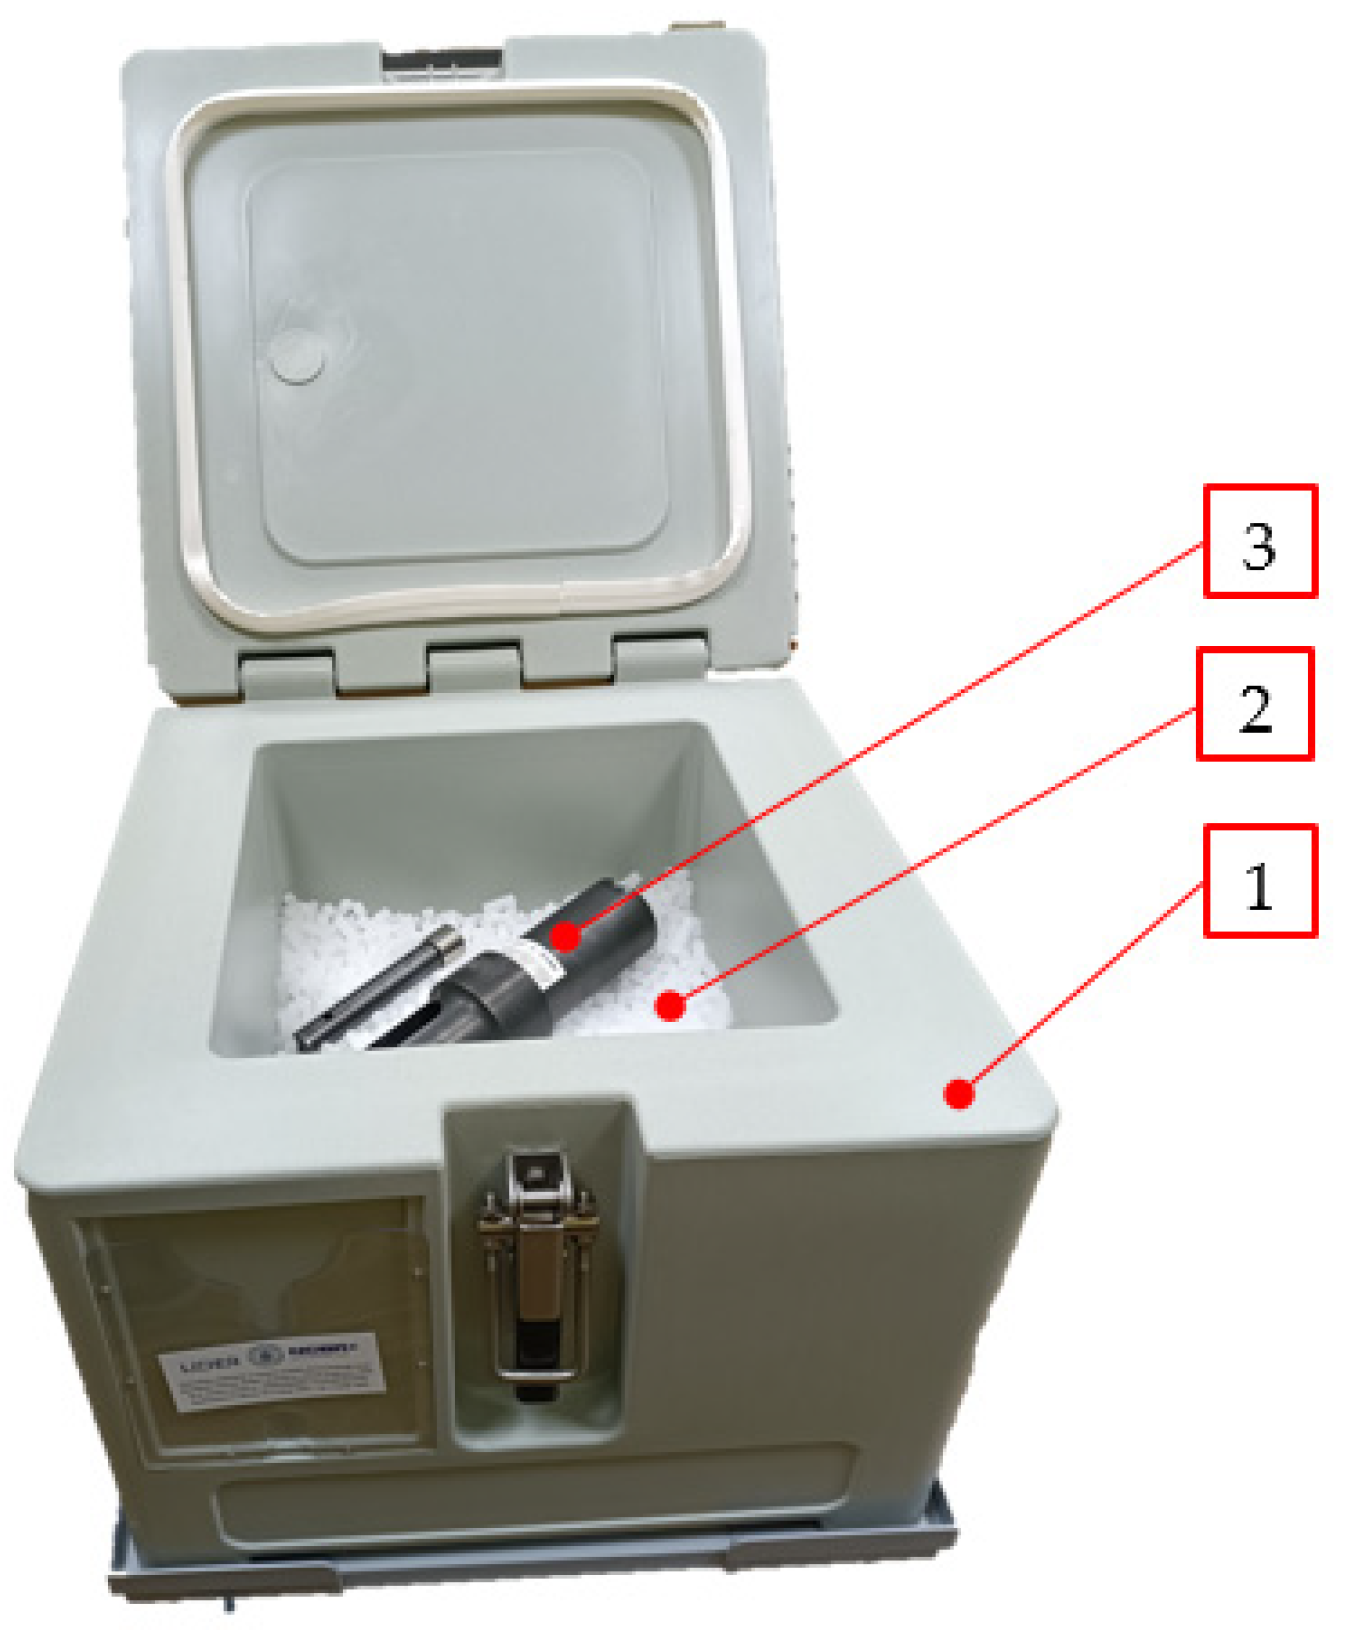
2.1. Materials
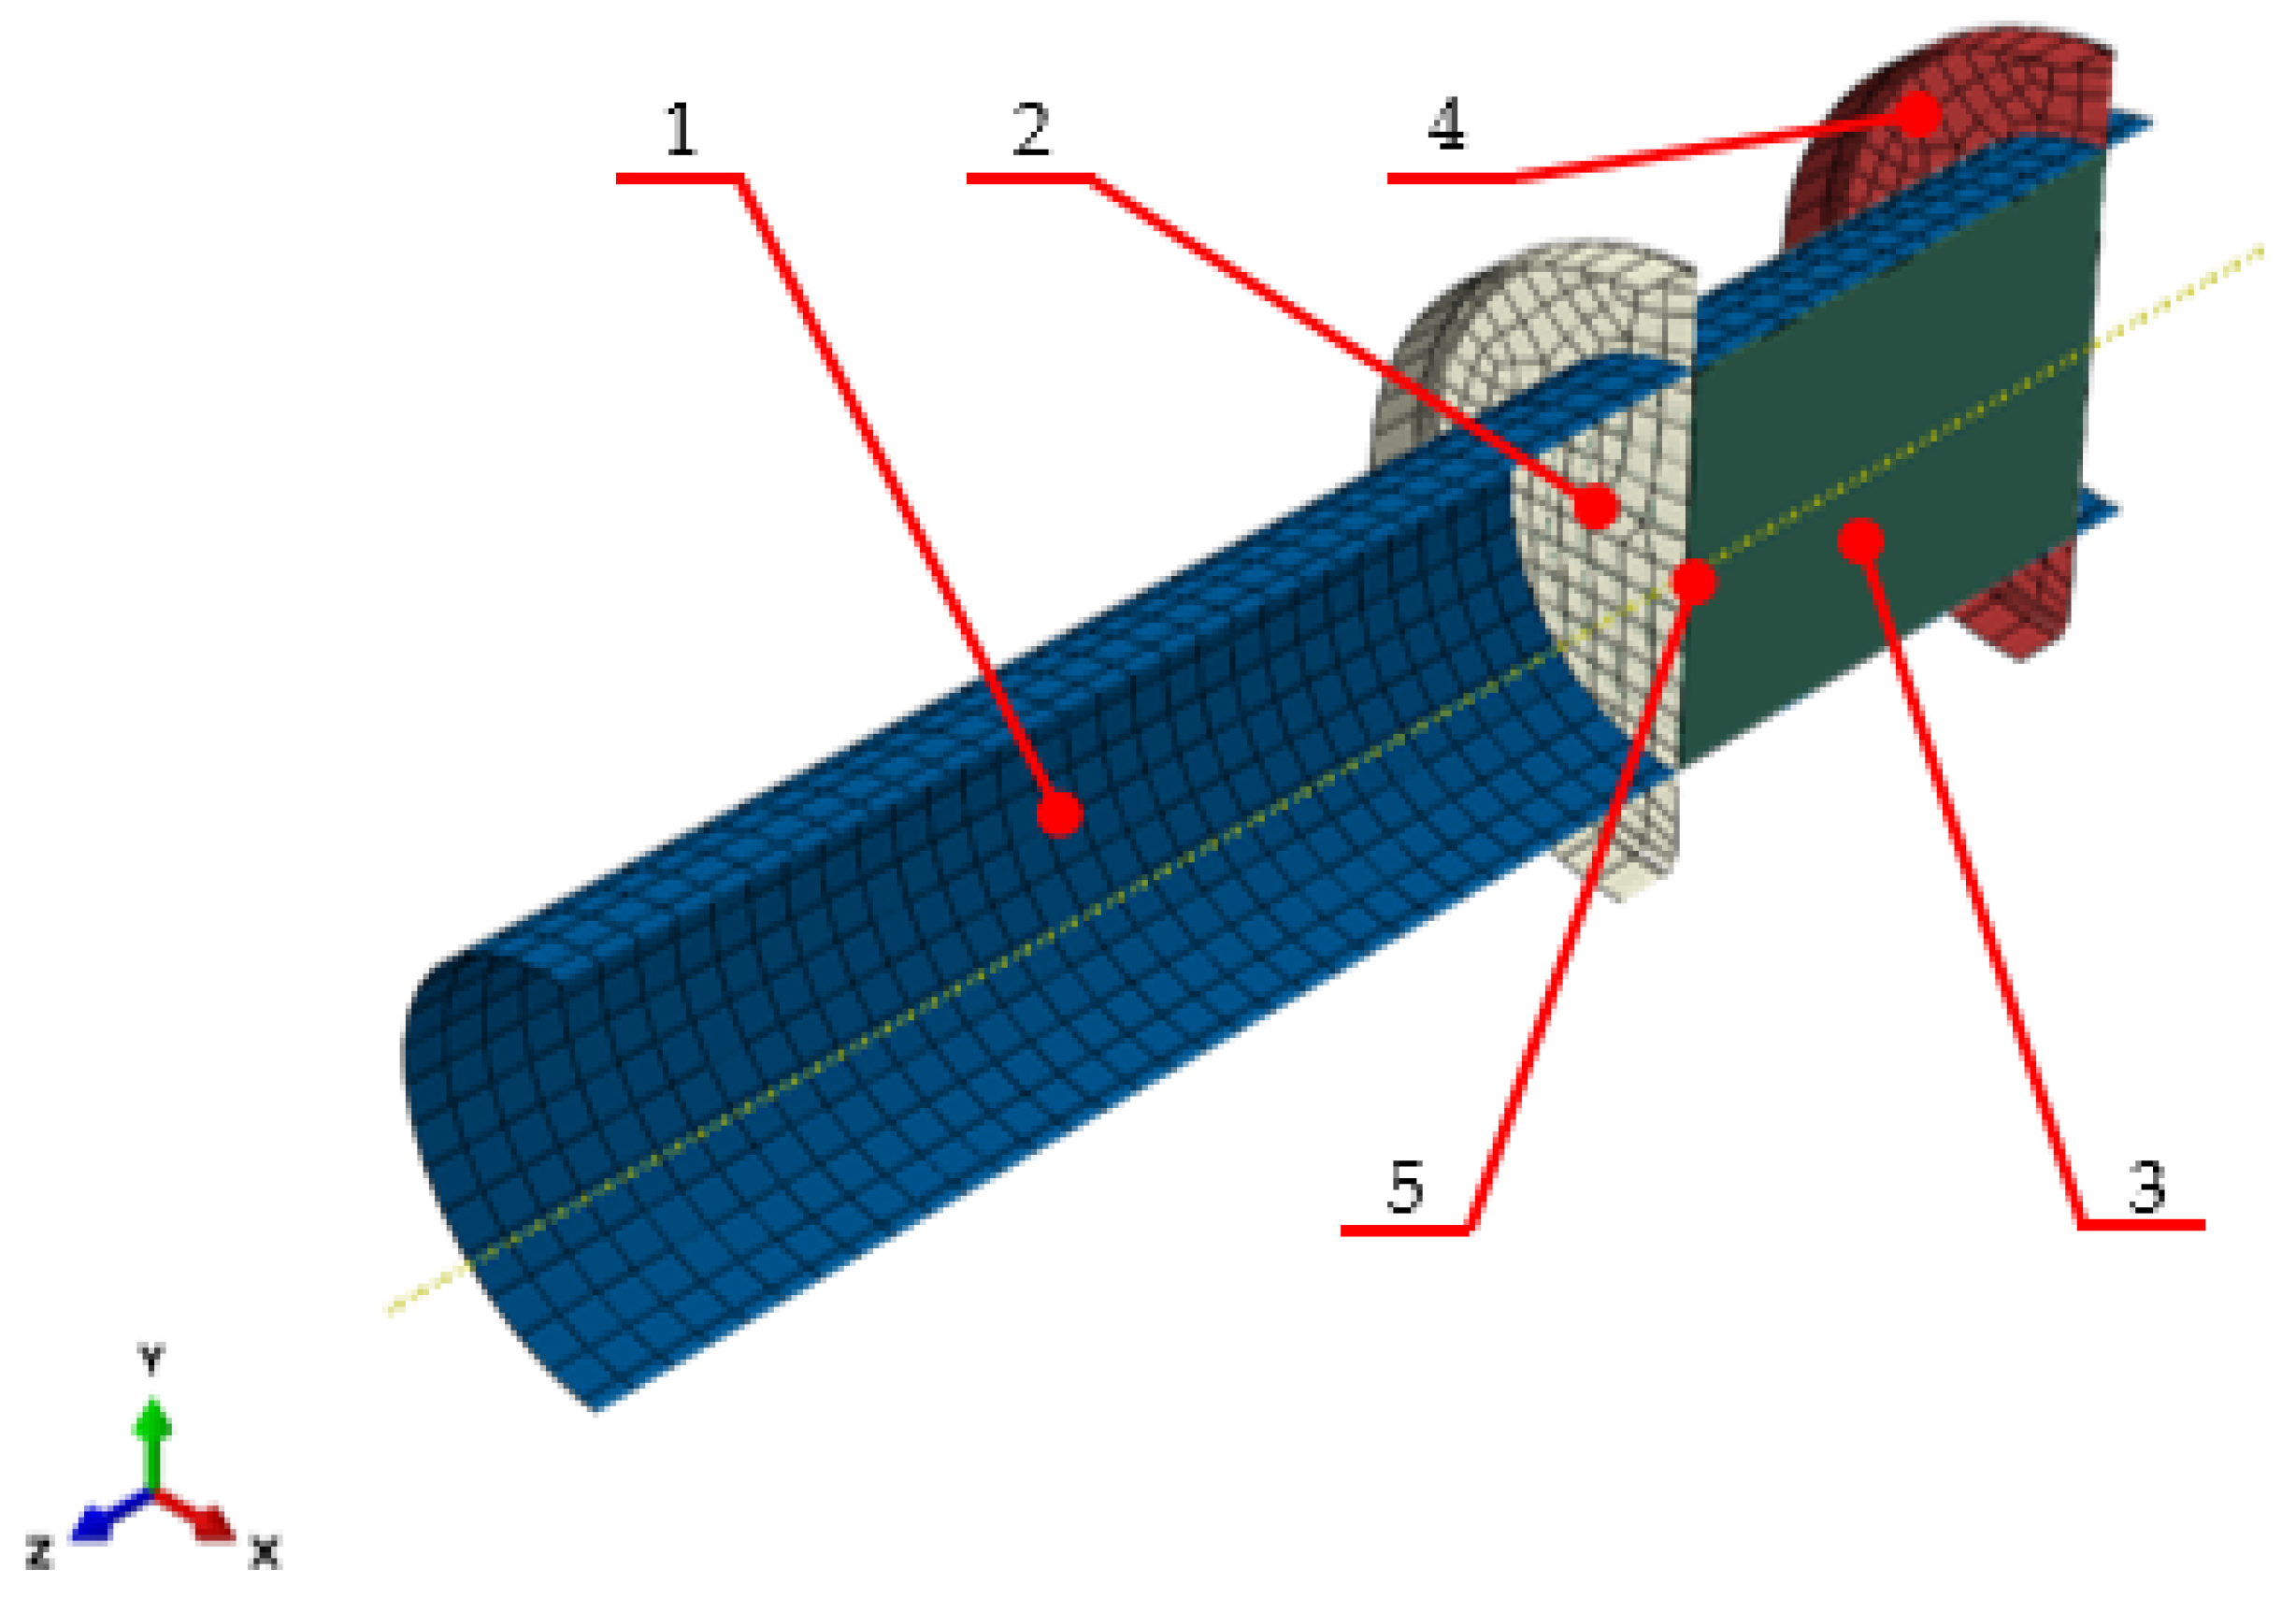
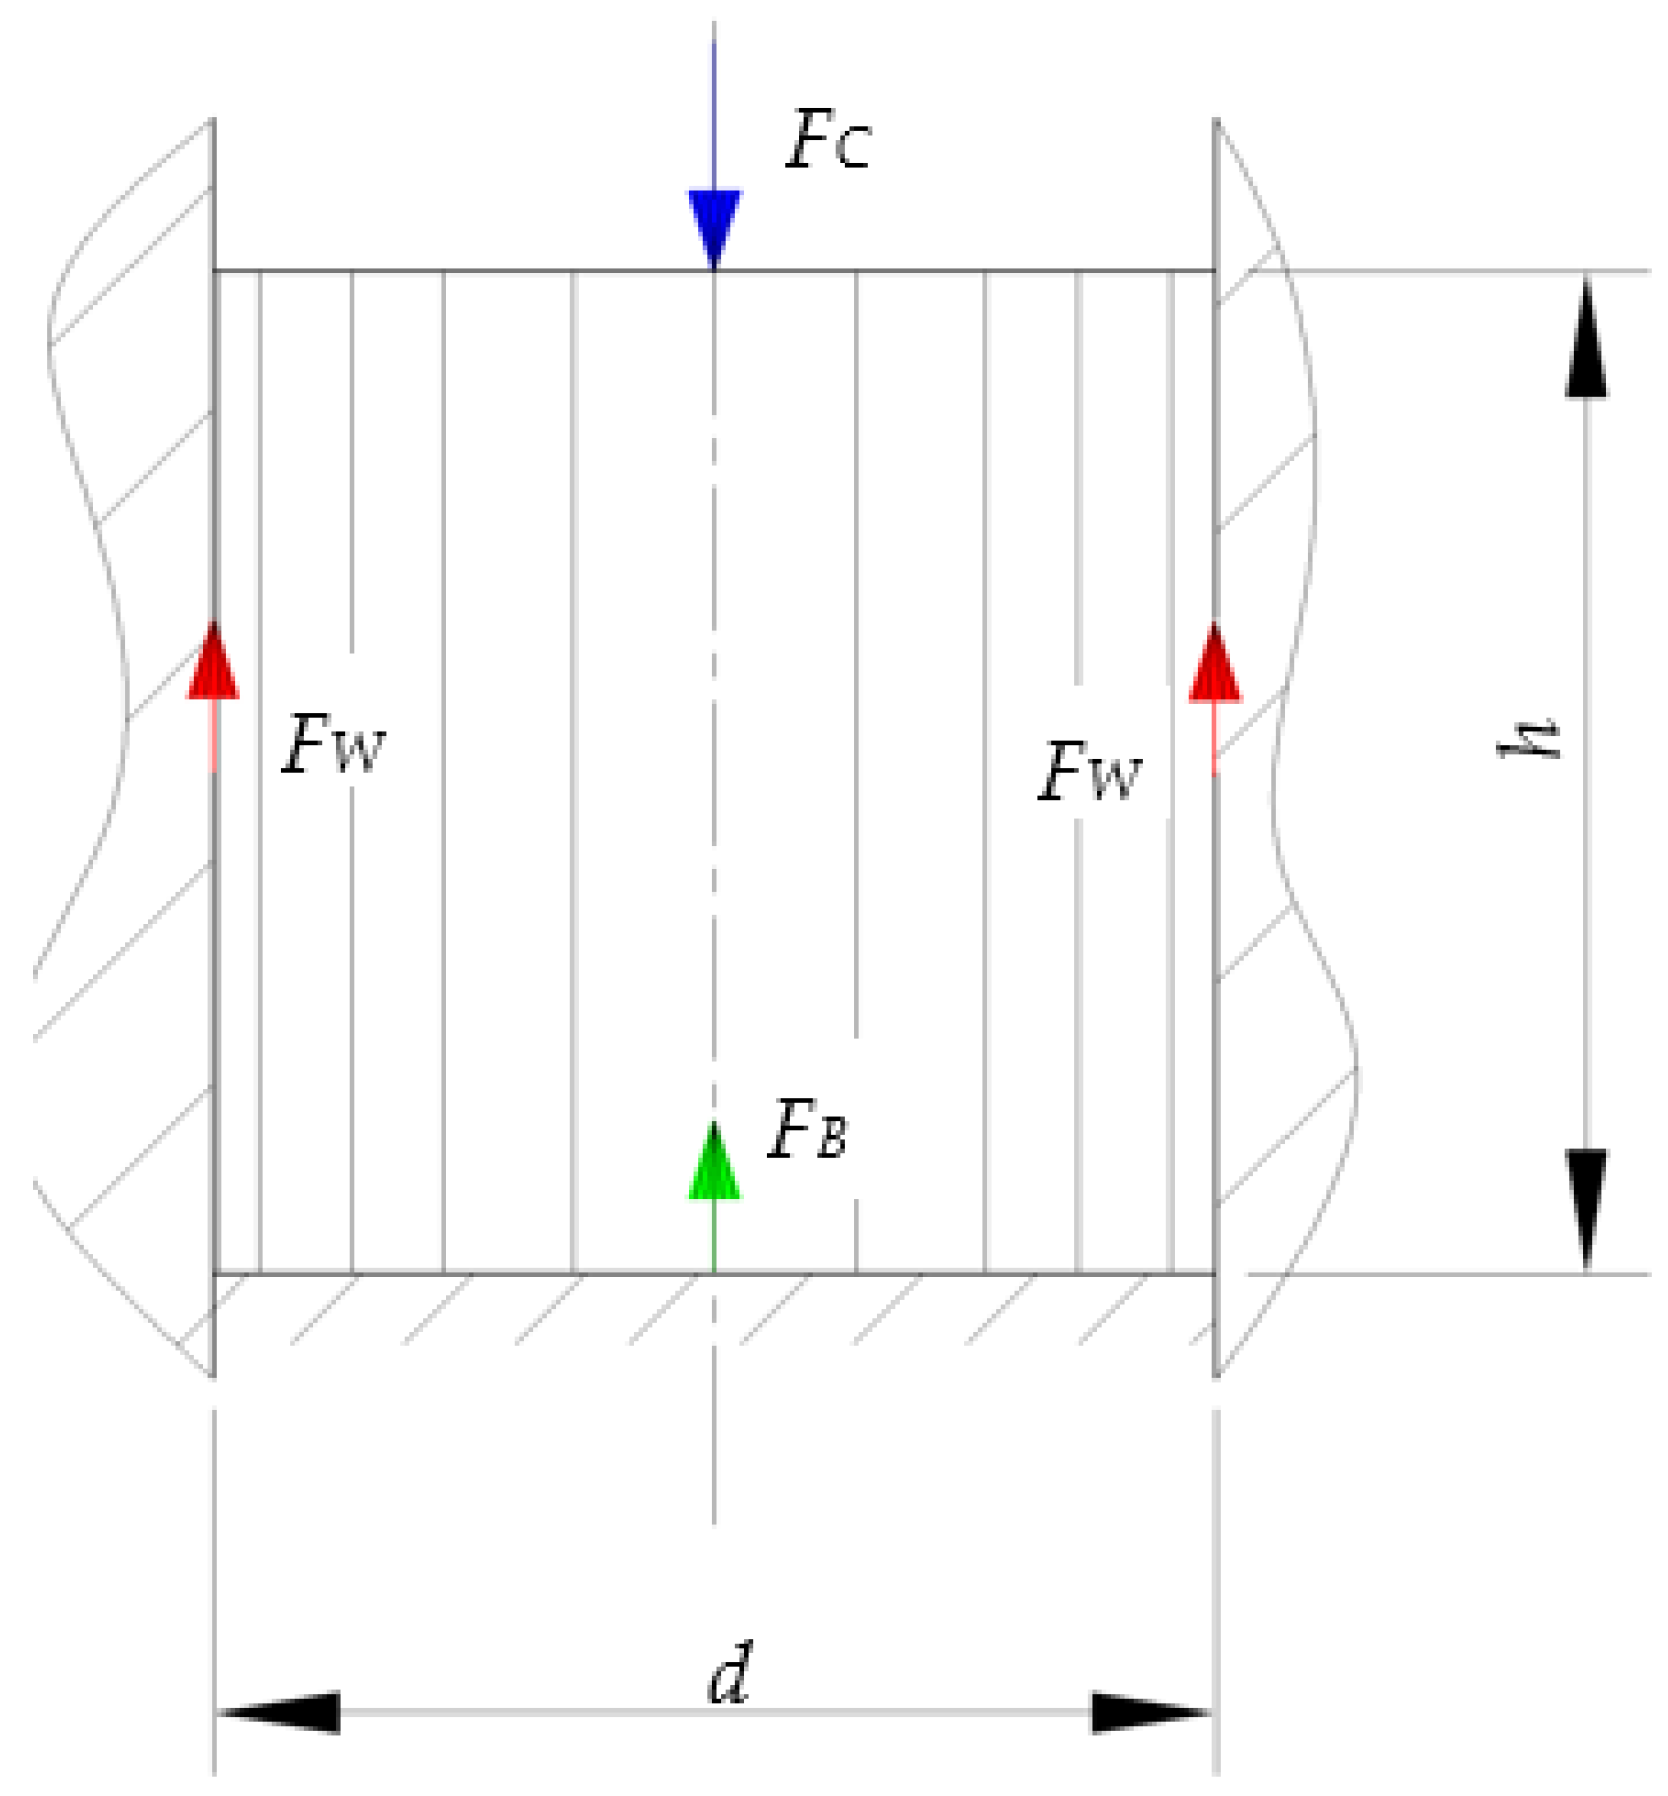
2.2. Method
2.3. Test Rig Calibration
3. Results and Discussion
4. Conclusions
Author Contributions
Funding
Institutional Review Board Statement
Informed Consent Statement
Data Availability Statement
Conflicts of Interest
References
- Thirupathi, N.; Kore, S. Experimental and numerical studies on electromagnetic axial powder compaction of Al 6061 powder. Powder Technol. 2023, 425, 118595. [Google Scholar] [CrossRef]
- Bai, Y.; Li, L.; Fu, L.; Wang, Q. A review on the high velocity compaction mechanism of powder metallurgy. Sci. Prog. 2021, 104, 00368504211016945. [Google Scholar] [CrossRef] [PubMed]
- Kumar, N.; Baharti, A.; Dixit, M. Powder Compaction Dies and Compressivity of various Materials. Theory Technol. Form. Process 2021, 60, 403–409. [Google Scholar] [CrossRef]
- Cabiscol, R.; Shi, H.; Wünsch, I.; Magnanimo, V.; Finke, J.H.; Luding, S.; Kwade, A. effect of particle size on powder compaction and tablet strength using limestone. Adv. Powder Technol. 2020, 31, 1280–1289. [Google Scholar] [CrossRef]
- Wilczyński, D.; Talaśka, K.; Wojtkowiak, D.; Górecki, J.; Wales, K. Energy consumption of the biomass cutting process anticipating the biofuel production. Biosyst. Eng. 2024, 237, 142–156. [Google Scholar] [CrossRef]
- Buljak, V.; Baivier-Romero, S.; Kallel, A. Calibration of Drucker–Prager Cap Constitutional Model for Ceramic Powder Compaction through Inverse Analysis. Materials 2021, 14, 4044. [Google Scholar] [CrossRef] [PubMed]
- Diarra, H.; Mazel, V.; Busignies, V.; Tchoreloff, P. Comparative study between Drucker-Prager/Cap and modified Cam-Clay models for the numerical simulation of die compaction of pharmaceutical powders. Powder Technol. 2017, 320, 420–539. [Google Scholar] [CrossRef]
- Cricrì, G.; Perrella, M. Modelling the mechanical behavior of metal powder during die compaction process. Fract. Struct. Integr. 2016, 10, 333–341. [Google Scholar] [CrossRef]
- Wang, Y.; Li, C.; Jia, T.; Pan, S. a parameters identification method and experimental analysis of contact friction interface in thermal environment. Mech. Based Des. Struct. Mach. 2024. [Google Scholar] [CrossRef]
- Dzido, A.; Krawczyk, P.; Badyda, K.; Chondrokostas, P. Operational parameters impact on the performance of dry-ice blasting nozzle. Energy 2021, 214, 118847. [Google Scholar] [CrossRef]
- Yan, L.; Huang, J.; Guo, Z.; Dong, X.; Wang, Z.; Wang, Y. Solid-State Proton Battery operated at Ultralow Temperature. ACS Energy Lett. 2020, 5, 346–691. [Google Scholar] [CrossRef]
- Gorecki, J.; Lindner, T.; Walesa, K. Evaluation of Density Fields of Numerical Analysis Output of Solid Carbon dioxide Extrusion process. Adv. Sci. Technol. Res. J. 2023, 17, 235–248. [Google Scholar] [CrossRef]
- Liu, Y.; Calvert, G.; Hare, C.; Ghadiri, M.; Matsusaka, S. Size measurement of dry ice particles produced form liquid carbon dioxide. J. Aerosol Sci. 2012, 48, 1–9. [Google Scholar] [CrossRef]
- Biszczanik, A.; Wojtkowiak, D.; Wałęsa, K. Influence of the geometric parameters of convergent extrusion channel of die on the maximum value of compaction stress of dry ice and on the quality of the obtained pellets. In Proceedings of the 27th International Polish-Slovak Conference on Machine Modelling and Simulations 2022, Rydzyna, Poland, 5–8 September 2023; p. 2976. [Google Scholar] [CrossRef]
- Zhao, Y.; Ning, J.; Sun, Z. Establishment and experimental verification of temperature prediction model for quick-frozen strawberry jetted with dry ice. Food Process Eng. 2022, 45, e14098. [Google Scholar] [CrossRef]
- Dzido, A.; Krawczyk, P. Abrasive Technologies with Dry Ice as a Blasting Medium—Review. Energies 2023, 16, 1014. [Google Scholar] [CrossRef]
- Berdychowski, M.; Górecki, J.; Wałęsa, K. Numerical Simulation of Dry Ice Compaction process: Comparison of the Mohr–Coulomb Model with the Experimental Results. Materials 2022, 15, 7932. [Google Scholar] [CrossRef] [PubMed]
- Walesa, K.; Górecki, J.; Berdychowski, M.; Biszczanik, A.; Wojtkowiak, D. Modelling of the process of Extrusion of Dry Ice through a Single-Hole Die using the smoothed Particle Hydrodynamics (SPH) Method. Materials 2022, 15, 8242. [Google Scholar] [CrossRef] [PubMed]
- Vu, T.; Nezamabadi, S.; Mora, S. Compaction of elastic granular materials: Inter-particles friction effects and plastic events. Soft Matter 2020, 16, 679–687. [Google Scholar] [CrossRef] [PubMed]
- Briscoe, B.J.; Rough, S.L. The effects of wall friction in powder compaction. Colloids Surf. A Physicochem. Eng. Asp. 1998, 137, 103–116. [Google Scholar] [CrossRef]
- Saloda, M.A. To Study the influence of Frictional conditions and Die Land Length on Component Error and Die Deflecion in Cold Extrusion by Finite Element Analysis. J. Metall. Eng. 2013, 2, 29–37. [Google Scholar]
- Yusof, Y.; Ng, S.; Chin, N.; Talib, R. Compaction pressure, wall friction and surface roughness upon compaction strength of Andrographis paniculata tablets. Tribol. Int. 2010, 43, 1168–1174. [Google Scholar] [CrossRef]
- Briscoe, B.J.; Evans, P.D. Wall friction in the compaction of agglomerated ceramic powders. Powder Technol. 1991, 65, 7–20. [Google Scholar] [CrossRef]
- Brewin, P.; Coube, O.; Doremus, P.; Tweed, J. Modeling of Powder Die Compaction; Springer: London, UK, 2008. [Google Scholar]
- Wilczyński, D.; Berdychowski, M.; Talaśka, K.; Wojtkowiak, D. Experimental and numerical analysis of the effect of compaction conditions on briquette properties. Fuel 2021, 288, 119613. [Google Scholar] [CrossRef]
- Biszczanik, A.; Górecki, J.; Kukla, M.; Walesa, K.; Wojtkowiak, D. Experimental investigation on the effect of Dry Ice Compression on the Poisson Ratio. Materials 2022, 15, 1555. [Google Scholar] [CrossRef] [PubMed]
- Jassim, A.; Khalaf, H. Dry Ice Cleaning based Sustainable Cleaning Technology for Oil and Gas Storage Tanks. In Proceedings of the 1st International Multi-Disciplinary Conference Theme: Sustainable Development and Smart Planning, Online, 28–30 June 2020. [Google Scholar] [CrossRef]
- Mikołajczak, A.; Krawczyk, P.; Kurkus-Gruszecka, M.; Badyda, K. Analysis of the Liquid Natural Gas Energy Storage based on the mathematical model. Energy Process 2019, 159, 231–236. [Google Scholar] [CrossRef]
- Biszczanik, A.; Walesa, K.; Kukla, M.; Górecki, J. The influence of Density on the Value of Young’s Modulus for Dry Ice. Materials 2021, 14, 7763. [Google Scholar] [CrossRef]
- Górecki, J.; Malujda, I.; Talaska, K.; Tarkowski, P.; Kukla, M. Influence of the value of limit density stress on the quality of the pellets during the agglomeration process of CO2. Procedia Eng. 2016, 136, 269–274. [Google Scholar] [CrossRef]
- Górecki, J.; Wiktor, L. Influence of Die Land Length on the Maximum Extrusion Force and Dry Ice Pellets Density in Ram Extrusion process. Materials 2023, 16, 4281. [Google Scholar] [CrossRef]
- Marques, F.; Flores, P.; Claro, J.C.P.; Lankarani, H.M. A survey and comparison of several friction force models for dynamic analysis of multibody mechanical systems. Nonlinear Dyn. 2016, 86, 1407–1443. [Google Scholar] [CrossRef]
- Southwards, S.C.; Radcliffe, C.J.; MacCluer, C.R. Robust nonlinear stick-slip friction compensation. J. Dyn. Syst. Meas. Control 1991, 113, 639–645. [Google Scholar] [CrossRef]
- Mundry, R.; Nunn, C. Stewise Model Fitting and Statistical Inference: Turning Noise into Signal Pollution. Am. Nat. 2009, 173, 119–123. [Google Scholar] [CrossRef] [PubMed]
- Shah, M.; Fazil, S.; Ali, S.; Pandey, Y.; Faisal, S.; Mehraj, I. Modeling of Runoff using Curve Expert for Dachigam-Telbal Catchment of Kashmir Valley, India. Int. J. Curr. Microbiol. Appl. Sci. 2017, 6, 3822–3826. [Google Scholar] [CrossRef]
- Middelhoff, M.; Cuisinier, O.; Masrouri, F.; Talandier, J.; Conil, N. Combined impact of selected material properties and environmental conditions on the swelling pressure of compacted claystone/bentonite mixes. Appl. Clay Sci. 2020, 184, 105389. [Google Scholar] [CrossRef]
- Ku, Q.; Zhao, J.; Mallon, G.; Zhao, S. Compaction of highly deformable coherent granular powders. Powder Technol. 2023, 421, 118455. [Google Scholar] [CrossRef]
- Greaves, G.; Greer, A.; Lakes, R.; Rouxel, T. Poissons’s ratio and modern materials. Nat. Mater. 2011, 10, 823–837. [Google Scholar] [CrossRef]
- Kaufmann, E.; Attree, N.; Bradwell, T.; Hagermann, A. Hardness and Yield Strength of CO2 Ice under Martian Temperature Conditions. J. Geophys. Res. Planets 2020, 125, e2019JE006217. [Google Scholar] [CrossRef]
- Xu, F.; Wang, H.; Wu, X.; Ye, Z.; Lie, H. A Densoty-dependent Modified Doraivelu Model for the Cold Compaction of Poly (Ether Ketone Ketone Ketone) Powders. Polymers 2022, 14, 1270. [Google Scholar] [CrossRef]


| No. | m0I [g] | m0II [g] | m0III [g] | m0IV [g] |
|---|---|---|---|---|
| 1 | 10.1 | 12.0 | 14.2 | 16.1 |
| 2 | 10.0 | 12.1 | 14.0 | 16.2 |
| 3 | 9.9 | 12.0 | 14.1 | 16.2 |
| 4 | 10.0 | 12.1 | 14.1 | 16.0 |
| 5 | 10.1 | 11.9 | 14.3 | 16.0 |
| 6 | 10.0 | 12.0 | 14.2 | 16.1 |
| 7 | 10.0 | 12.0 | 14.2 | 16.1 |
| 8 | 9.9 | 12.0 | 14.1 | 16.1 |
| 9 | 10.1 | 11.8 | 14.2 | 16.0 |
| 10 | 10.1 | 11.9 | 13.9 | 16.0 |
| Exponential | Geometric | Sinusoidal | Natural Logarithmic | |
|---|---|---|---|---|
| a | 2 | 2 | 6.79 | 2.36 |
| b | −3 | −4 | 6.77 | −3.23 |
| c | - | - | −4 | - |
| d | - | - | 8.76 | - |
| Exponential | Geometric | Sinusoidal | Natural Logarithmic | |
|---|---|---|---|---|
| R2 | 0.95 | 0.95 | 0.94 | 0.93 |
| R | 0.91 | 0.91 | 0.90 | 0.87 |
| AICc | −131.04 | −130.93 | −123.77 | −123.43 |
| Standard Error | 0.057 | 0.059 | 0.064 | 0.068 |
Disclaimer/Publisher’s Note: The statements, opinions and data contained in all publications are solely those of the individual author(s) and contributor(s) and not of MDPI and/or the editor(s). MDPI and/or the editor(s) disclaim responsibility for any injury to people or property resulting from any ideas, methods, instructions or products referred to in the content. |
© 2024 by the authors. Licensee MDPI, Basel, Switzerland. This article is an open access article distributed under the terms and conditions of the Creative Commons Attribution (CC BY) license (https://creativecommons.org/licenses/by/4.0/).
Share and Cite
Górecki, J.; Łykowski, W.; Husar, J.; Knapčíková, L.; Berdychowski, M. Method for Determining the Coefficient of Friction Variation Pattern as a Function of Density at Low Temperatures Using the Example of Dry Ice–Steel Contact. Materials 2024, 17, 2396. https://doi.org/10.3390/ma17102396
Górecki J, Łykowski W, Husar J, Knapčíková L, Berdychowski M. Method for Determining the Coefficient of Friction Variation Pattern as a Function of Density at Low Temperatures Using the Example of Dry Ice–Steel Contact. Materials. 2024; 17(10):2396. https://doi.org/10.3390/ma17102396
Chicago/Turabian StyleGórecki, Jan, Wiktor Łykowski, Jozef Husar, Lucia Knapčíková, and Maciej Berdychowski. 2024. "Method for Determining the Coefficient of Friction Variation Pattern as a Function of Density at Low Temperatures Using the Example of Dry Ice–Steel Contact" Materials 17, no. 10: 2396. https://doi.org/10.3390/ma17102396
APA StyleGórecki, J., Łykowski, W., Husar, J., Knapčíková, L., & Berdychowski, M. (2024). Method for Determining the Coefficient of Friction Variation Pattern as a Function of Density at Low Temperatures Using the Example of Dry Ice–Steel Contact. Materials, 17(10), 2396. https://doi.org/10.3390/ma17102396