1. Introduction
According to the World Health Organization (WHO), automobile crashes are one of the world’s leading causes of death, with road injuries ranking among the top ten leading causes of death worldwide [
1]. In recent years, globalization has led to an increase in the number of people worldwide who have died in these types of car crashes, which is a cause for concern. According to [
2], driver distractions are responsible for approximately 81% of all automobile crashes that occur on public highways. According to the study, more than 1.98 million people die from traffic-related injuries each year in the United States alone. Every year, hundreds of thousands of people are killed or seriously injured in car crashes, resulting in significant human and financial losses [
3]. Researchers have discovered that motorists who are capable of signaling drivers and are traveling with one or more passengers are less likely (29–41%) than those traveling alone to cause collision-related damage. This research resulted in the development of an ADAT [
4], which has gained widespread acceptance in both the automotive industry and academia due to its effectiveness. These systems are designed to aid drivers in making decisions while driving to improve overall vehicle and road safety. The ADAT is becoming increasingly common in mid-range and lower-end vehicles [
5], bucking the current trend. Many studies are being conducted to advance the development of systems based on analyses of the physical characteristics of drivers in vehicle crashes (to improve the safety of the drivers involved).
In several recent studies, researchers discovered that driver fatigue could impact driving performance (comparable to that of alcohol in some circumstances). Driver fatigue monitoring systems have been researched and developed for more than two decades and they are now being used worldwide. An investigation into the use of a single-channel electroencephalographic device to monitor driver fatigue was recently conducted [
6], with particular attention being paid to the saccadic movement of the eyes. This is demonstrated in [
7], where the driver’s blinks were analyzed to determine his or her level of fatigue, using a standard USB camera as the input device. In other research, there was precedence in using velocity as a reference index of fatigue; this is an example of such a technique being used in other research. Implementing an automatic system to warn or inform the driver of an impending crash must occur after an important design flaw is identified and addressed before moving forward with implementing the system itself. A recent investigation discovered that sloppy engineering in warning systems could hurt the driver’s ability to operate the vehicle safely. Regarding drivers, it has been demonstrated that increasing their workloads while driving causes them to lose sight of their surroundings, which is dangerous. As previously mentioned, the accumulation of unnecessary information can be overwhelming, leading to apathy and, eventually, deactivation of the warning system. This project proposes a technique using computer vision and deep learning technologies to detect various types of head movements and eye gaze directions via a simple RGB camera. There is a hierarchy of alarms [
6,
8]; as a result, the system will only alert the driver when necessary. An ADAT can only warn a driver in two situations: when the driver is not paying attention to the road and when the situation is extremely hazardous.
In these situations, if the driver is not paying attention while driving, the ADAT will not issue any warnings to the driver. Following the application of this development method, we successfully developed an entirely new proposal that was in sync with the most recent technological advancements. According to scientists, a camera-based eye tracker is used in the proposed system and the data collected could be used for a variety of purposes, depending on the circumstances. Drowsiness and fatigue, among other things, could be detected using this technology. A modern ADAT provides drivers with assistance to improve overall safety in and around their vehicles and on the highway. The Prometheus Project (Program for European Traffic of Maximum Efficiency and Unprecedented Safety), which began in 1986 and was tasked with developing solutions to traffic congestion, brought together several European automotive companies and research institutes to collaborate on the project. A watershed moment in the history of the automotive industry was marked by this collaboration, which was widely hailed as a success. To begin the research, it was initially necessary to wait until the last two decades, when significant progress in this type of research has been made. This was necessary because the technology was still in its infancy throughout those years, making it difficult to begin the research. In the last few years, scientists have concentrated their efforts on this area, achieving great success in improving road safety.
The development of an ADAT is currently underway to increase road traffic safety. Its capabilities include the ability to intervene in a variety of ways to avoid potentially hazardous situations [
6], and to improve driver and vehicle safety [
9] to accomplish these objectives. Considering that human error is responsible for 93% of all traffic crashes [
10], it is essential to research technological areas related to the development of an increasingly powerful and comprehensive ADAT. When it comes to driver-centered assisted driving technologies [
11], the information gathered from the motorist is used to provide the driver with assistance. If a driver information system does not incorporate driver information into its design, it will be impossible to detect vehicle departures that are not intentional, such as those detected by lane departure detection techniques. The technique may be unable to distinguish between intentional and unintentional vehicle departures during a crash, resulting in a potentially fatal crash. We can infer that the vehicle’s departure is not planned if the driver appears to be distracted or sleepy during the incident. If the investigating officer determines that it is necessary, an official written warning can be issued to the driver due to the incident. This paper proposes a real-time (non-intrusive and non-invasive) gaze tracking technique for drivers.
This technique continuously determines where the driver is looking, providing the information required (e.g., the driver’s concentration level) to the advanced driver-assistance system. The system can then use this information to assist the driver in various ways. Installing a gaze tracking system in a vehicle is required for an ADAT and other in-vehicle warning systems to determine whether or not the driver needs to be informed about a specific risk that may arise during the journey. Using a visual area analysis to determine if the driver is distracted is the underlying concept; warning systems on the vehicle will be activated due to this determination. To avoid the need for time-consuming calibration procedures, users can be instructed to look at specific points on the screen to adjust the intrinsic parameters of the eye model. Additionally, integrating a gaze tracking system model into a driver-centered active safety system that is data-fusion based, in which the driver’s gaze is tracked in real-time, is being explored.
One of the most common causes of car crashes is a driver’s lack of concentration. These crashes could be avoided if alert and monitoring systems are in place. Developing an intelligent monitoring system to detect driver inattention based on eye gaze is proposed. The driver’s gaze also provides sufficient information to predict whether or not the driver is looking at the road. It captures facial images with the help of a camera. Computer vision and deep learning technologies enable us to (1) detect if the driver is in an inactive state and (2) pay attention to the driver. The proposed system is about developing a system that will predict the head pose and eye gaze information deployed in a car or truck. The predicted information of the driver will be input into an automatic driver-assistance system. In case of any abnormal event, or if the driver is detected, an automatic vehicle control system will take control of the vehicle and reduce its speed to park the vehicle, avoid the road, and provide safety to human lives and public property.
The key objectives/contributions of the proposed study are as follows;
We propose a novel deep learning approach to detect and estimate the driver’s gaze.
We propose the CNN regression model, elaborated with other deep learning models, to detect and extract the features from the given dataset and the detection of real-time data.
We propose an ADAT technique with the deep learning InceptionResNet-v2 to observe and detect the data from input and output processes.
We evaluated the proposed work based on MSE, RAE, and RMSE performance evaluation metrics to check for accuracy and loss.
The remainder of the paper is organized as follows: a high-level abstraction is used to provide an overview of the development of driver inattention monitoring techniques, as well as related work for intelligent vehicles, such as gaze tracking techniques.
Section 2 consists of a detailed literature review.
Section 3 is the research methodology section, which contains dataset descriptions and frameworks of the proposed models along with the mechanisms of model training and hyperparameter tuning for optimal feature weights.
Section 4 contains information about the experimentation performed, performance evaluation, model performance comparison, and results.
Section 5 concludes the paper.
2. Literature Review
Currently, available research focuses on which gaze direction of the driver could be divided into single and multiple cameras. Because of the maximized motion (e.g., rotation of the head) of the driver, detecting the driver’s gaze with a single camera is more difficult in a vehicle environment [
10,
11,
12,
13,
14,
15,
16,
17,
18,
19,
20,
21]. As the driver rotates his or her head in numerous directions or gazes at an object with only his/her eyes moving while keeping his/her head stable, the accuracy of a single-camera method tends to deteriorate. As a result, researchers have looked into methods for addressing these flaws involving multiple cameras. Dual cameras are frequently mounted near the vehicle’s A-pillar or dashboard when they are used. In a previous study [
11], cameras with dual lenses were used to detect the gaze of the driver and to estimate his/her inattention. However, when using the available Smart Eye Pro 4.0 eye tracker at the commercial level, the accuracy of real-time eye detection performance was different, depending on the price of the equipment. Additionally, there were times when user calibration for glasses wearers was not supported [
12]. Furthermore, while the fatigue and inattention algorithms directly depended on the driver’s accuracy (of the gaze detection), only 23% of the dataset (for the overall distance throughout the research) showed a low detection of gaze reliability. In a previously published study, SVM was used to detect driver inattention in real-time [
22]. However, each driver must undergo initial calibration for eye tracking, which takes about 5 to 15 min. Additionally, because wearing glasses or eye makeup can affect tracking accuracy, drivers are not permitted to do so. The authors of [
3] used a three-lens camera to track the driver’s facial features in order to compute the driver’s head position. However, the facial feature tracking accuracy and recognition of the position were determining factors in the performance.
The three-lens camera did not require any additional adjustment compared to stereo cameras. On the other hand, the proposed framework was used independently, and the results from the three-lens camera necessitated further analysis. Furthermore, it was difficult to detect the changes in eye poses caused by pupil movements since it only measured the facial movements of the driver and ignored the pupil movements. The authors of [
23] proposed a technique to capture the facial images of the driver via two USB cameras. On the other hand, a camera with two stereos required to be adjusted to a map of depth. Furthermore, their research was conducted in an office—an indoor scenario setting—instead of a vehicle. The gaze zone was estimated using the driver’s head pose in a previous study [
24]. Since the live photo was taken from the drive with the help of a visible-light camera without the illumination of NIR, the driver’s performance was affected by variations in illumination. Furthermore, while the driver’s gaze accuracy was high, the gaze region of the front was segregated into approximately eight regions, which resulted in multiple regions that were excluded from the measurement of the accuracy. Furthermore, the gaze was tracked using the driver’s head movements rather than the position of the pupil center; accuracy of the gaze-tracking suffered at the time—only the pupils from the eye movements and the head did not (they remained stationary). The authors of [
25] proposed the gaze zone of the driver based on the association among the head directions of the driver, the iris, and the eye. The framework for the continuous movements of head estimations projected in [
26] was utilized to achieve an appropriate estimation of the head pose selectively with the utilization of many cameras. The methods used to track the driver’s gaze, via multiple cameras, are extremely accurate. However, as the input images grow in proportion to the cameras, the required processing time will grow. As a result, the current study proposes using a single deep residual network to combine two images acquired from two cameras, with NIR and with the illuminator, into single three-channel images, tracking the eyes of the driver in the vehicle (ResNet).
From the above, it appears that more investigations are required into eye gaze estimations with numerous approaches and multiple angles while a driver sits in the vehicle. Due to the various measurement methods used, no general conclusions can be drawn. Eye contact-seeking can be inferred from capacities such as the orientation of the head, which can result in reports, by examining standing on the side of the road, or could be captured by cameras inside or outside the vehicle [
7,
8,
13,
27,
28]. The authors of [
10] proposed an approach that involved walkway pedestrians looking at a vehicle’s arriving direction for one second; in this way, they might experience eye contact. This was based on a video taken in an urban driving scenario. On the other hand, the orientation of the head does not determine (as compared to the rotation of the eye). In their paper, they proposed an eye-tracking system to detect eye contact. This system could determine the location and direction of the gaze without clearly ‘requesting’ road users or relying on third-party annotations. Numerous research studies have been conducted on this approach, concerning a driver’s eye gaze without head orientation or looking at the pedestrian [
25,
26]. Drivers, for instance, look at a cyclist’s face first; after that, they look at the other parts of the body, according to Walker [
14] and Walker and Brosnan [
15]. The authors of [
16] proposed an eye-tracking system to examine the gaze estimation of a driver and found that in the majority of interactions, pedestrian body postures/movements and eye gazes were enough to decide passage engagements without the use of eye contact or hand gestures. The authors developed a novel method [
17], in a scenario that used simulations and eye-tracking, and found that the pedal response of a driver (to turn the brakes on) was categorized by the eye gaze estimation at a level of 0.4–2.4 s regarding the earlier pedestrian. The authors of [
29] tackled a system named eye-tracking in which contributors watched real-time videos of traffic from the driver’s perspective, pressing a button whenever they saw hazardous activity. According to the writers, the drivers fixated on walkers on the road more frequently compared to those on ‘restrictions’. The authors of [
30], in another research study conducted on the eye movements of pedestrians, proposed a study in which the eye-tracking movements of pedestrians were utilized in a parking lot during interactions with vehicles; they discovered that walkers often pursued and made eye contact with the drivers. The authors of [
18] used a handheld slider to track walkers at a restriction; they measured the willingness of pedestrians regarding incoming vehicles. Even though approaching car interiors are shady, and replications on the windshields make eye contact problematic, pedestrians still looked at the windshields for evidence of the intentions of the drivers when there were vehicles close by. The authors of [
19] proposed a study for pedestrians in which eye contact and tracking were discovered. They noticed a flaw in this approach because of the physical movements and the eye gaze movements whenever a pedestrian came in the way or near the road. This limitation could be overcome by combining image recognition with eye-tracking. An important additional warning in the study by [
19], e.g., [
19,
20,
29], involving eye tracking in traffic, is that merely one viewpoint (the driver’s or the pedestrian) was dignified, providing a non-complete since eye contact is a shared occurrence [
31,
32]; a dual eye contact approach for study (in social kinds of interactions) was proposed. Detecting the gaze of only one of the two get-togethers provides information regarding the get-together’s desire for eye contact; nevertheless, this does not indicate whether or not eye contact has been recognized. The authors of [
33] reported similar issues with operational types of investigation for eye tracking in their literature reviewing human–human interactions. The approaches that are used to detect eye gaze and pedestrian eye contact could fill this gap in the literature.
4. Experiments
4.1. Face Detection Results
Figure 9 and
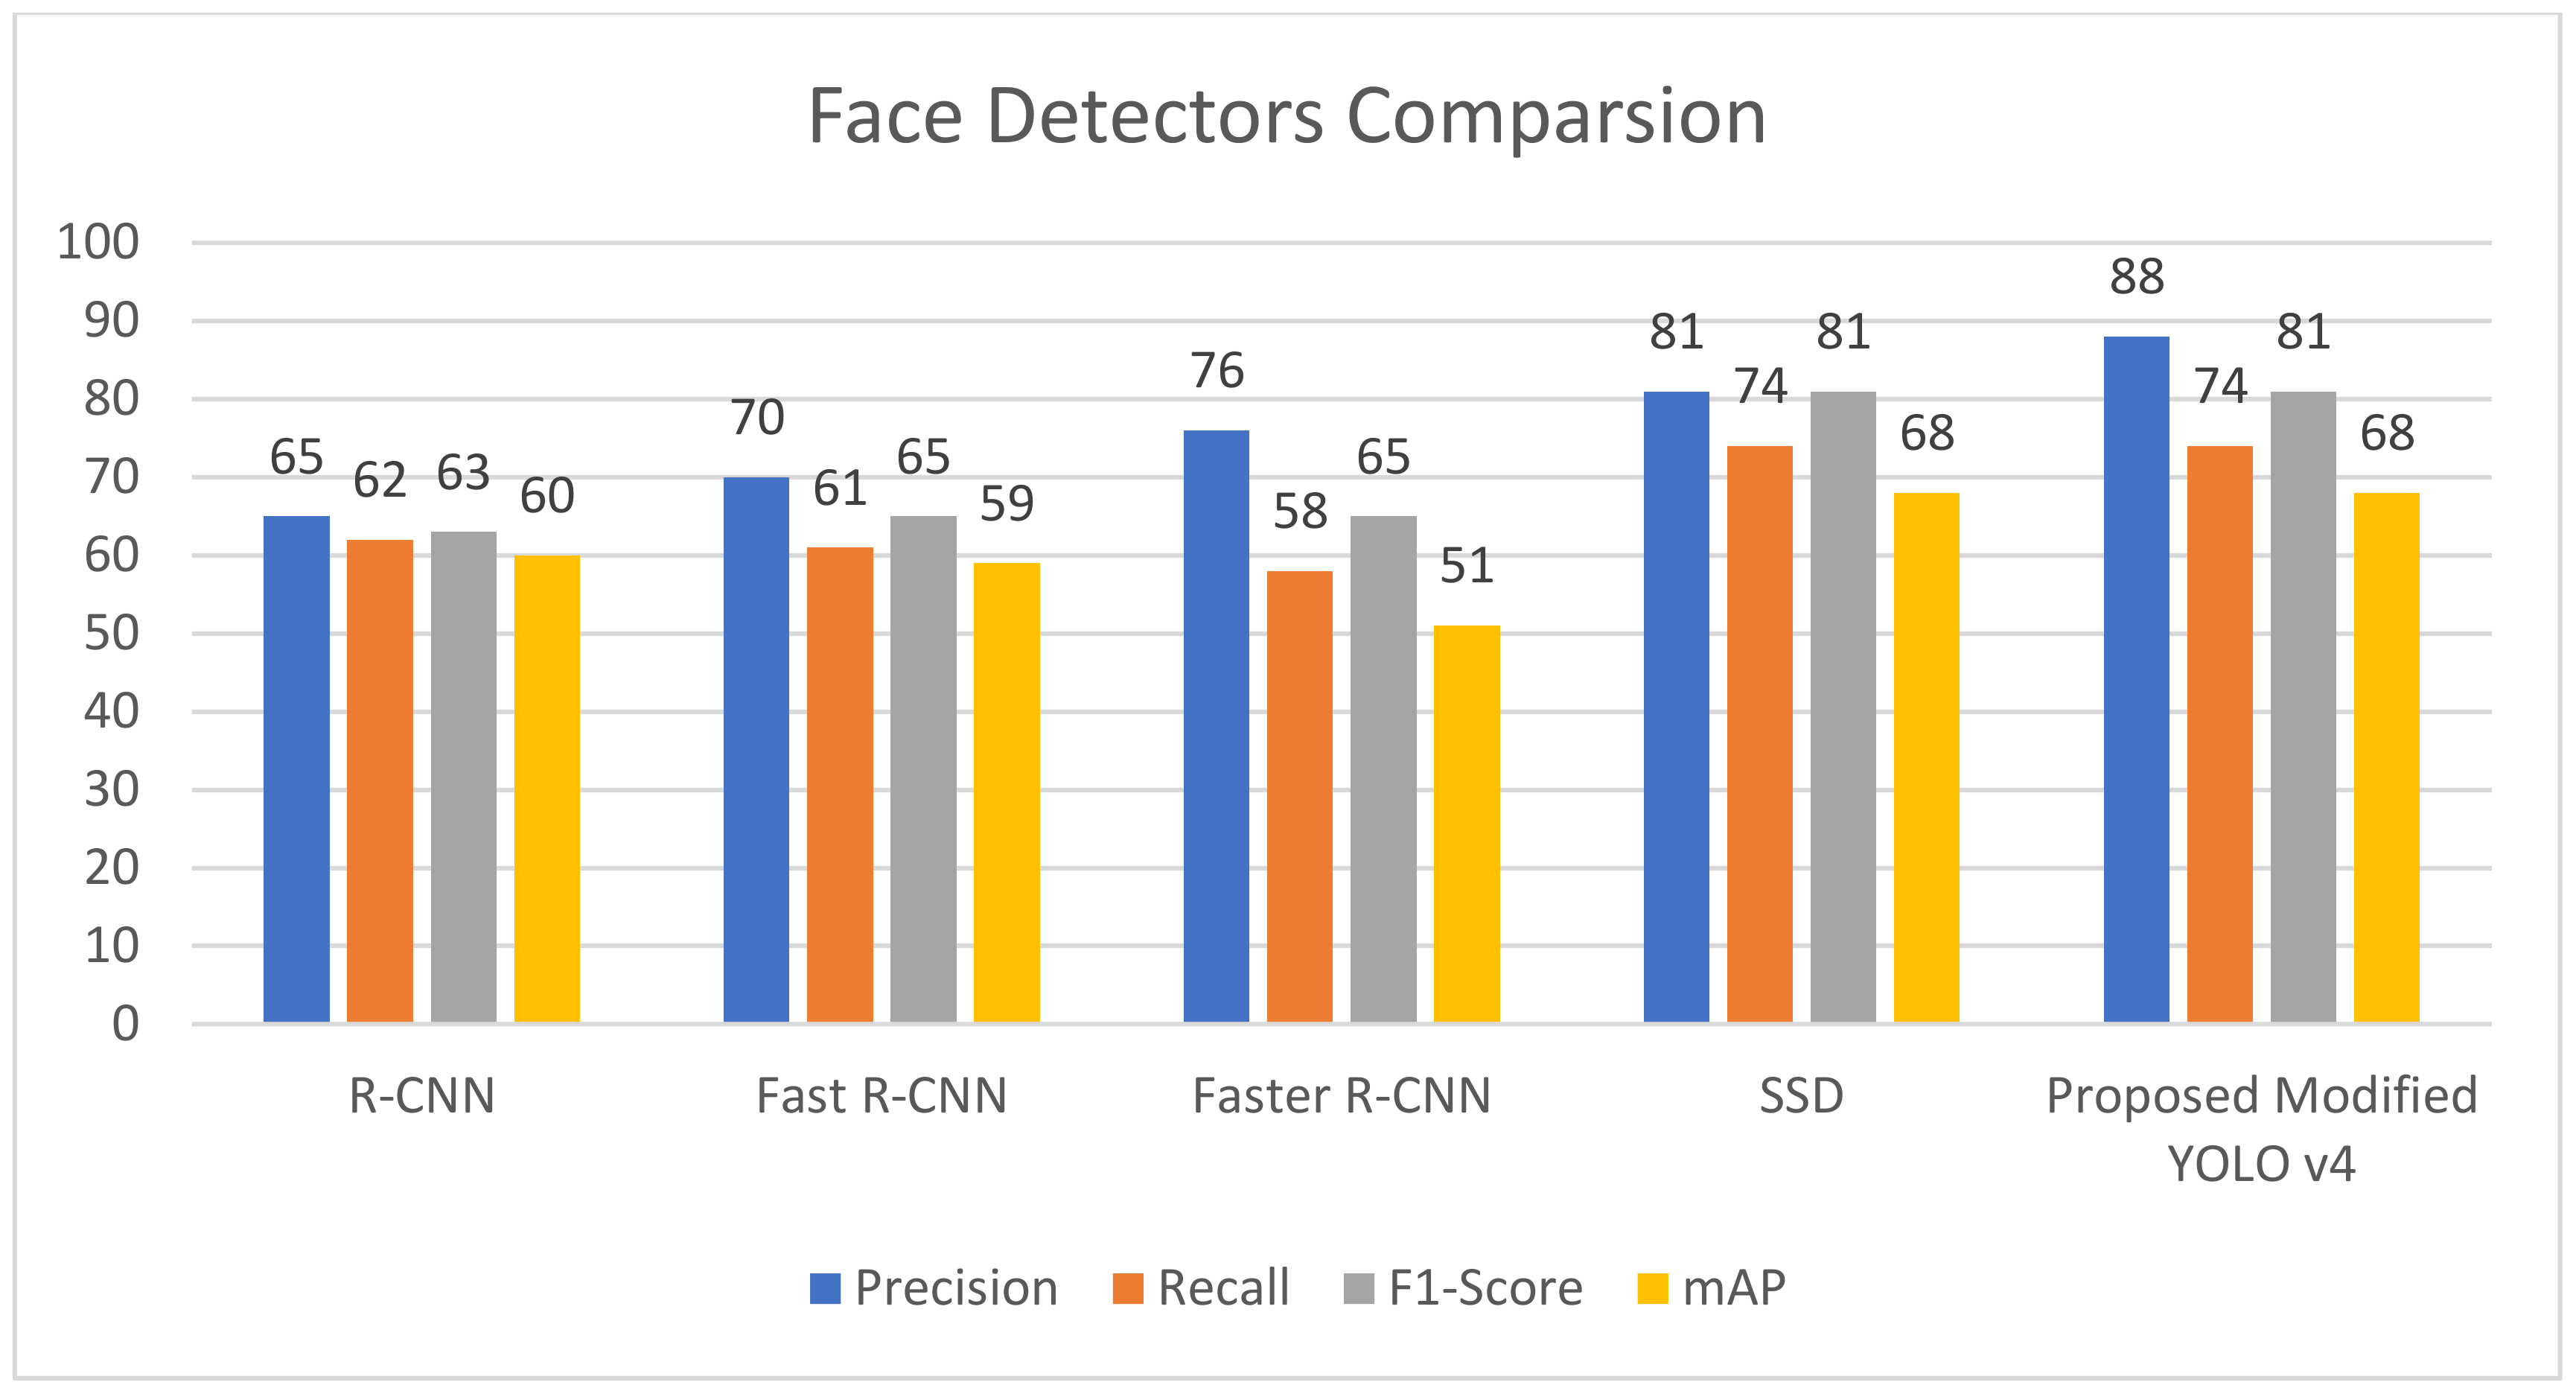
Table 3 compare the results of the proposed modified YOLO-V4 network with the performance metrics of its corresponding network implementation. We coupled the previous work with the custom mask detection dataset stated above and split the dataset into 80% for the training set, 10% for the testing set, and 10% for the validation set, and trained and tested the network to obtain the performance metric values, as shown in
Table 4. We trained and tested R-CNN, Fast R-CNN, Faster R-CNN, single shot detector (SSD), and improved YOLO-V4 on the employed mask detection dataset; we analyzed the performance metrics to compare the proposed network to its YOLO counterpart. When the performance metrics of the proposed modified YOLO-V4 were compared to those of other object detection networks used for the face detection task, the proposed method achieved good results with a mean accuracy (mAP) value of 64.31 %, which is 6.6% better than the original tiny YOLO-V4 and exceeds the performance of R-CNN, fast R-CNN, faster R-CNN, and SSD; the enhanced YOLO-V4 network described in this study is an incremental enhancement to the feature extraction network and overall performance of the original little YOLO-V4, displaying remarkable findings by recognizing the presence of masks in photos when masks are present everywhere on the facial area.
The proposed network achieves an 84.42% average precision (AP) for the mask-like region, which is 14.05% higher than YOLO-V4 and higher than R-CNN, fast R-CNN, and faster R-CNN; thus, it enables the proposed network to detect almost all of the dataset’s small objects in images, such as masks, under different conditions. Furthermore, using the chosen dataset, the proposed upgraded YOLO-V4 network obtains 83.22% of the joint intersection (IoU) value, showing that the target detection network has excellent detection accuracy. In the intensely congested setting, the missing results also give a chance to investigate viable remedies. By calculating tiny anchor frames and training the network with picture samples from the occluded face, the detection accuracy and precision of such cases may be further enhanced.
Figure 10 is regarding the performance comparison of different models.
4.2. Gaze Detection Results
To test the suggested gaze analysis approach, a specially-built driven gaze picture dataset with seven classes was integrated into this part. The goal of our suggested technique was to create an image-based human gaze identification technique that identifies and forecasts the human eye’s head attitude and angle. A holdout cross-validation approach was used to split the dataset into a training set and a test set for performance assessment.
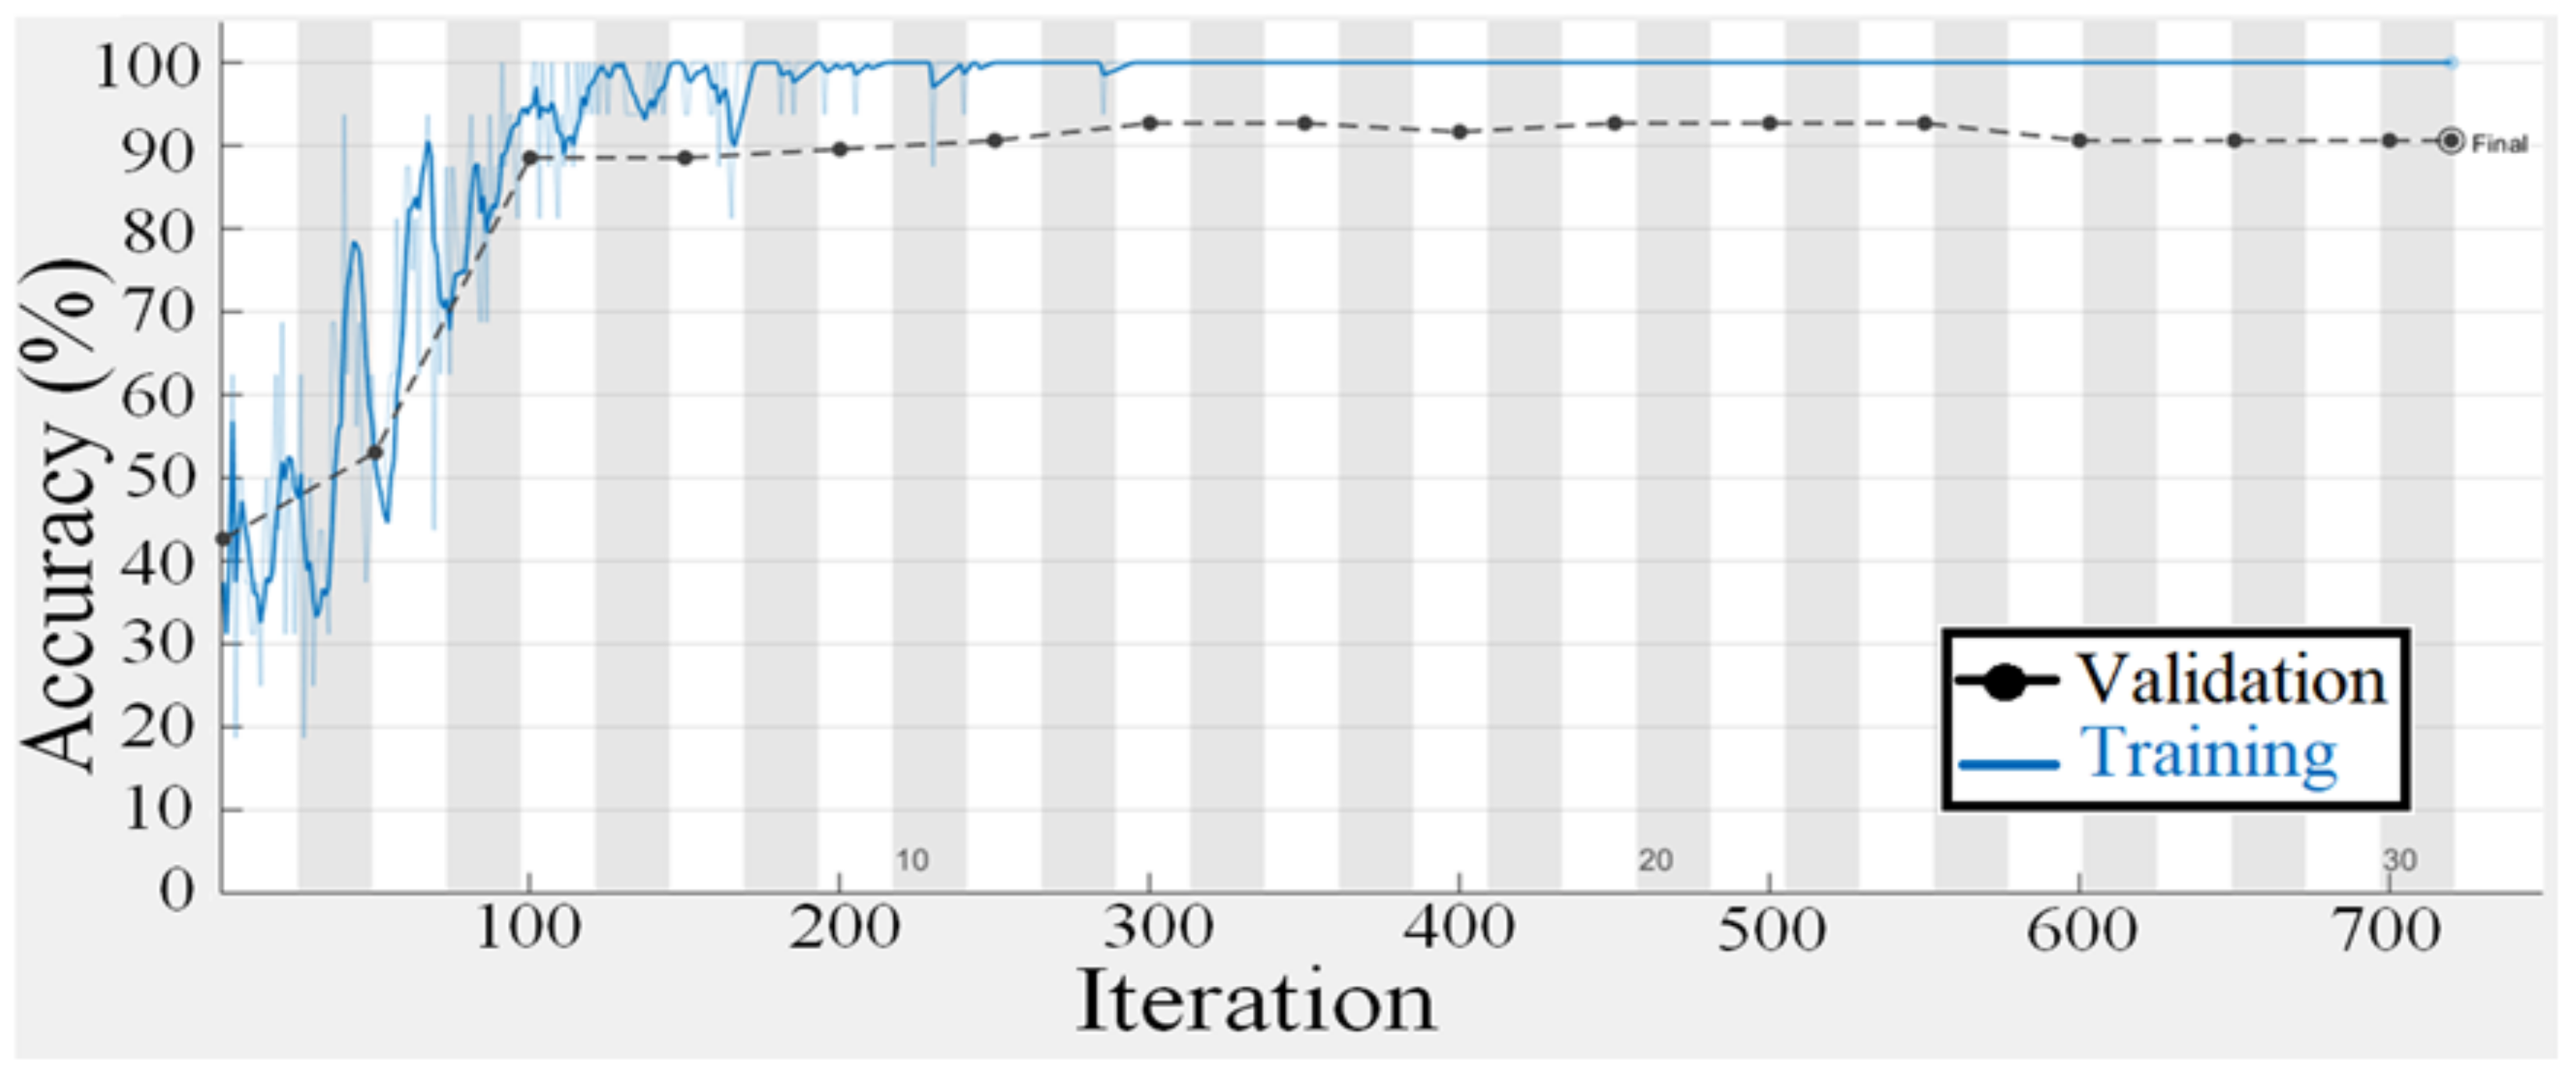
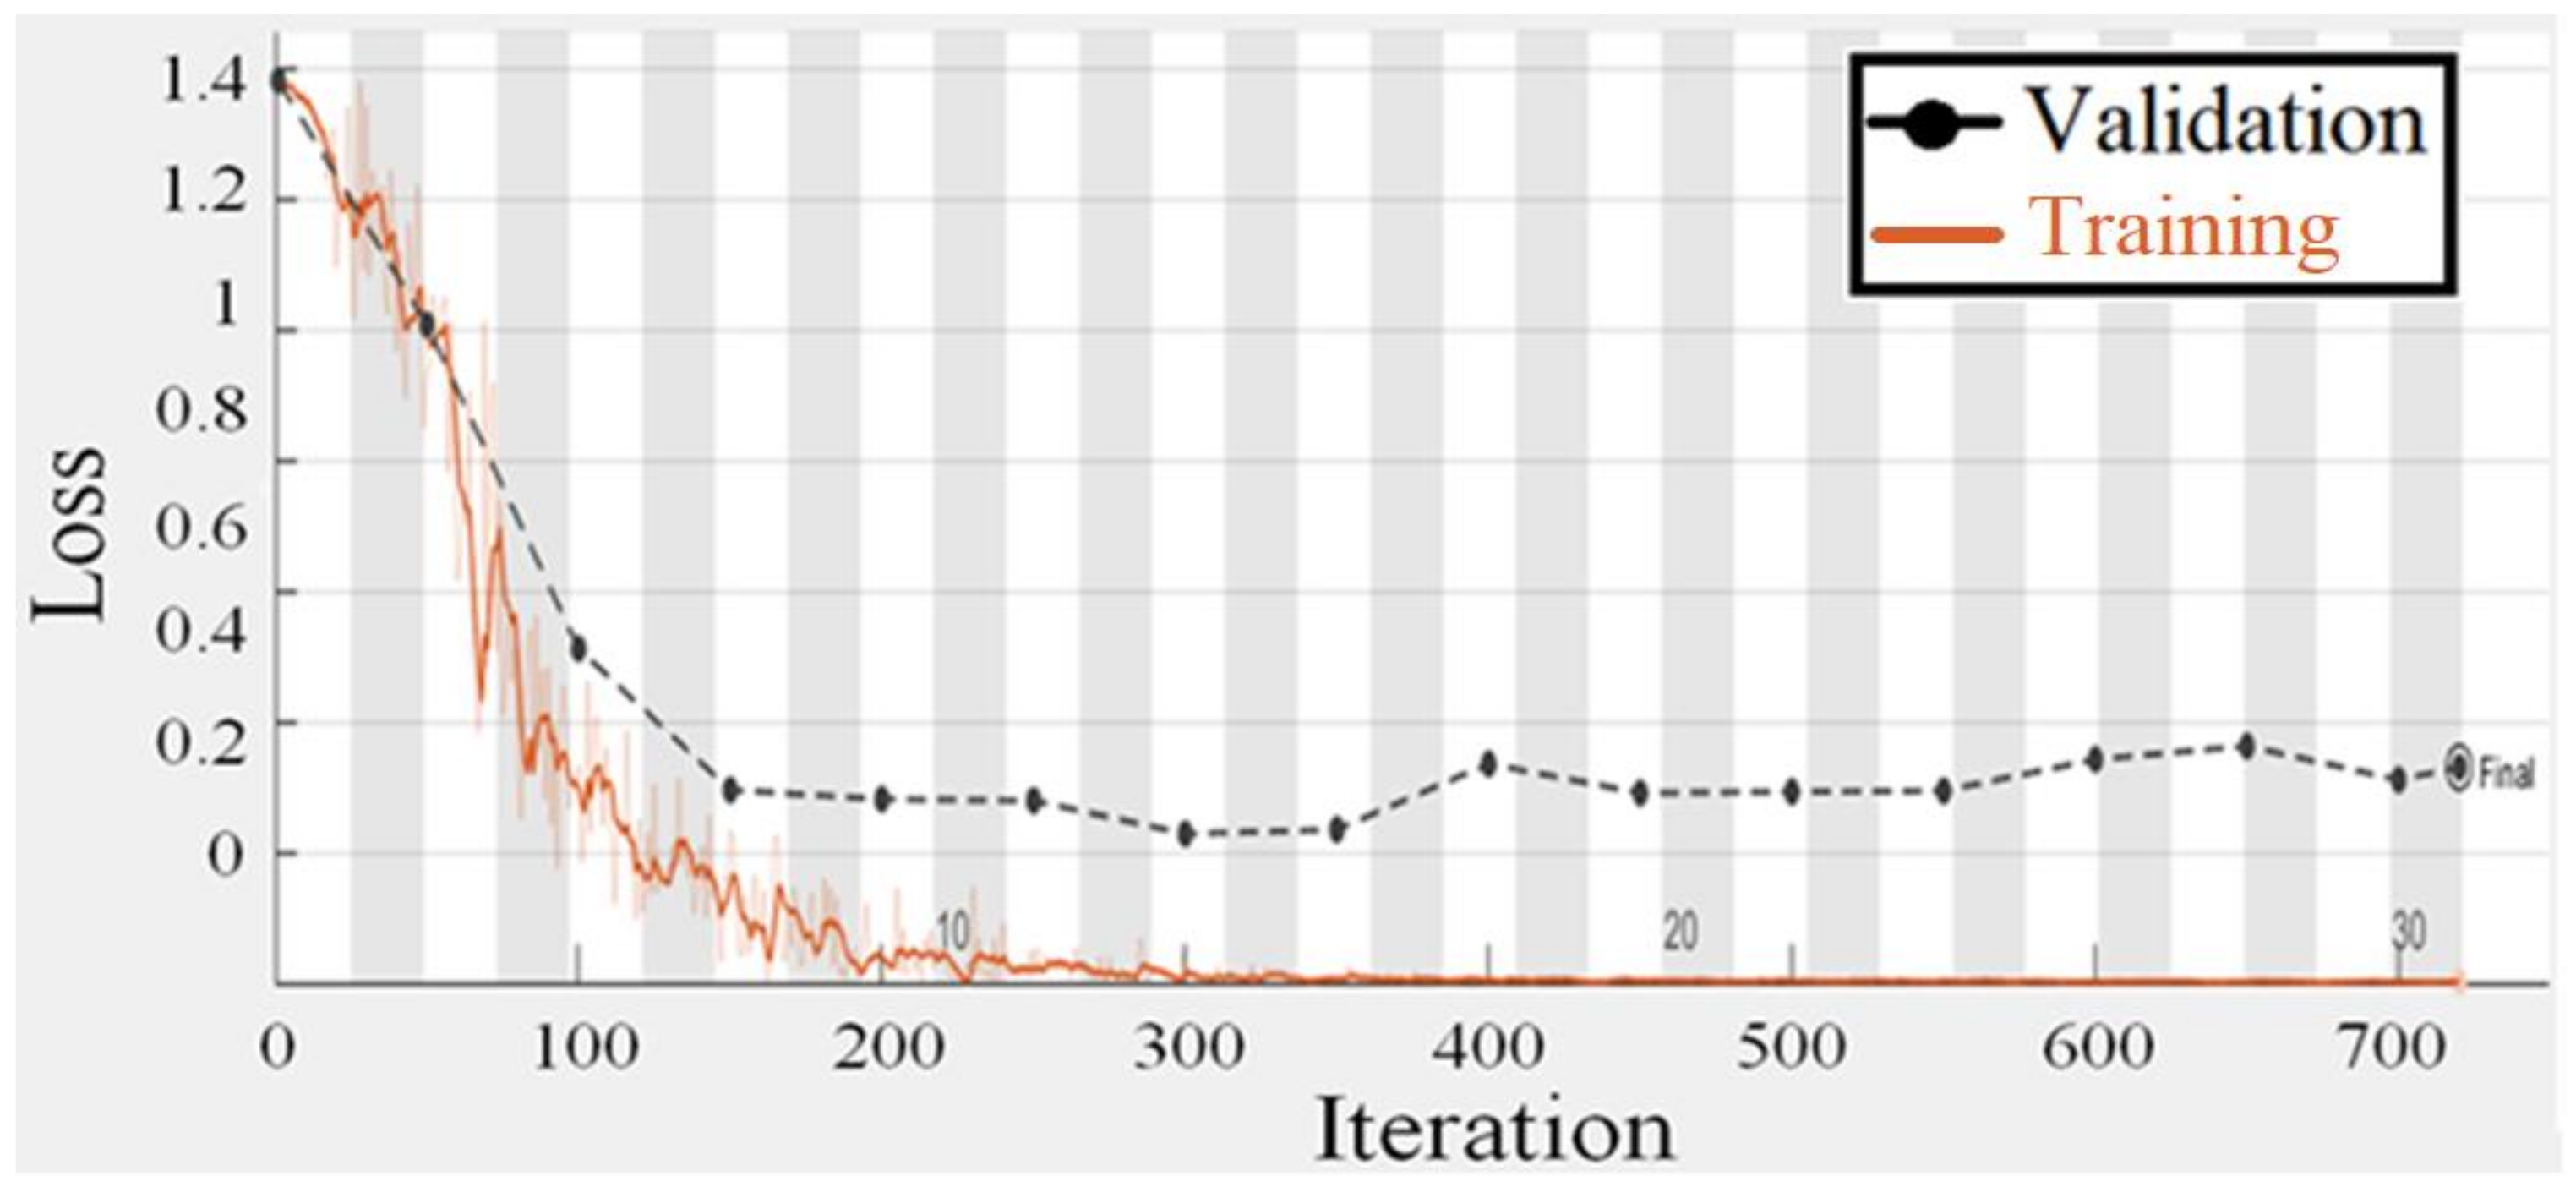
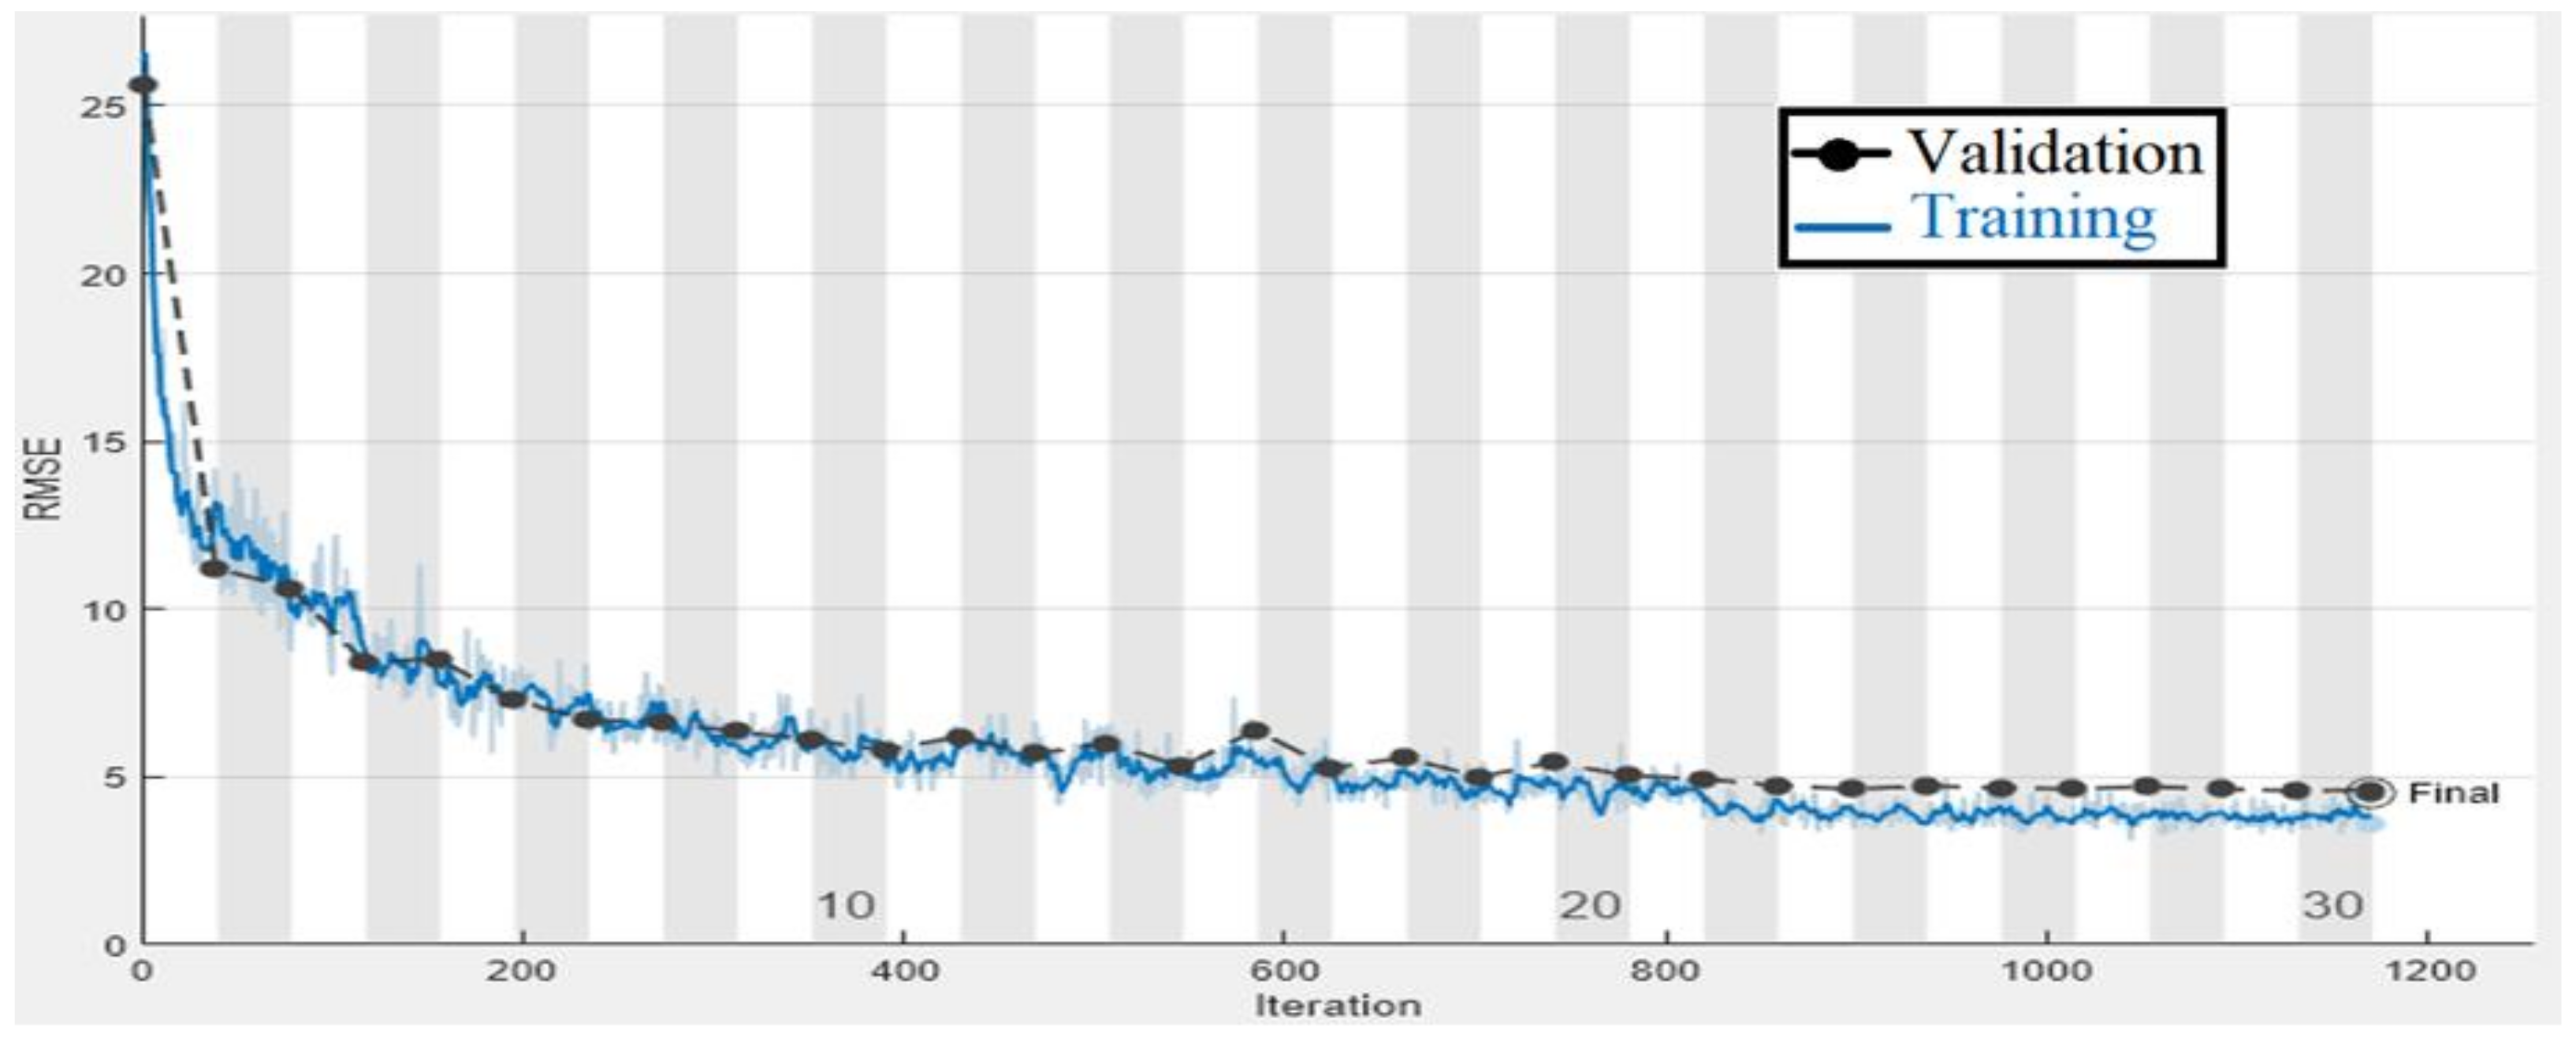
Figure 11 and
Figure 12 are regarding the training and validation of the gaze technique. While
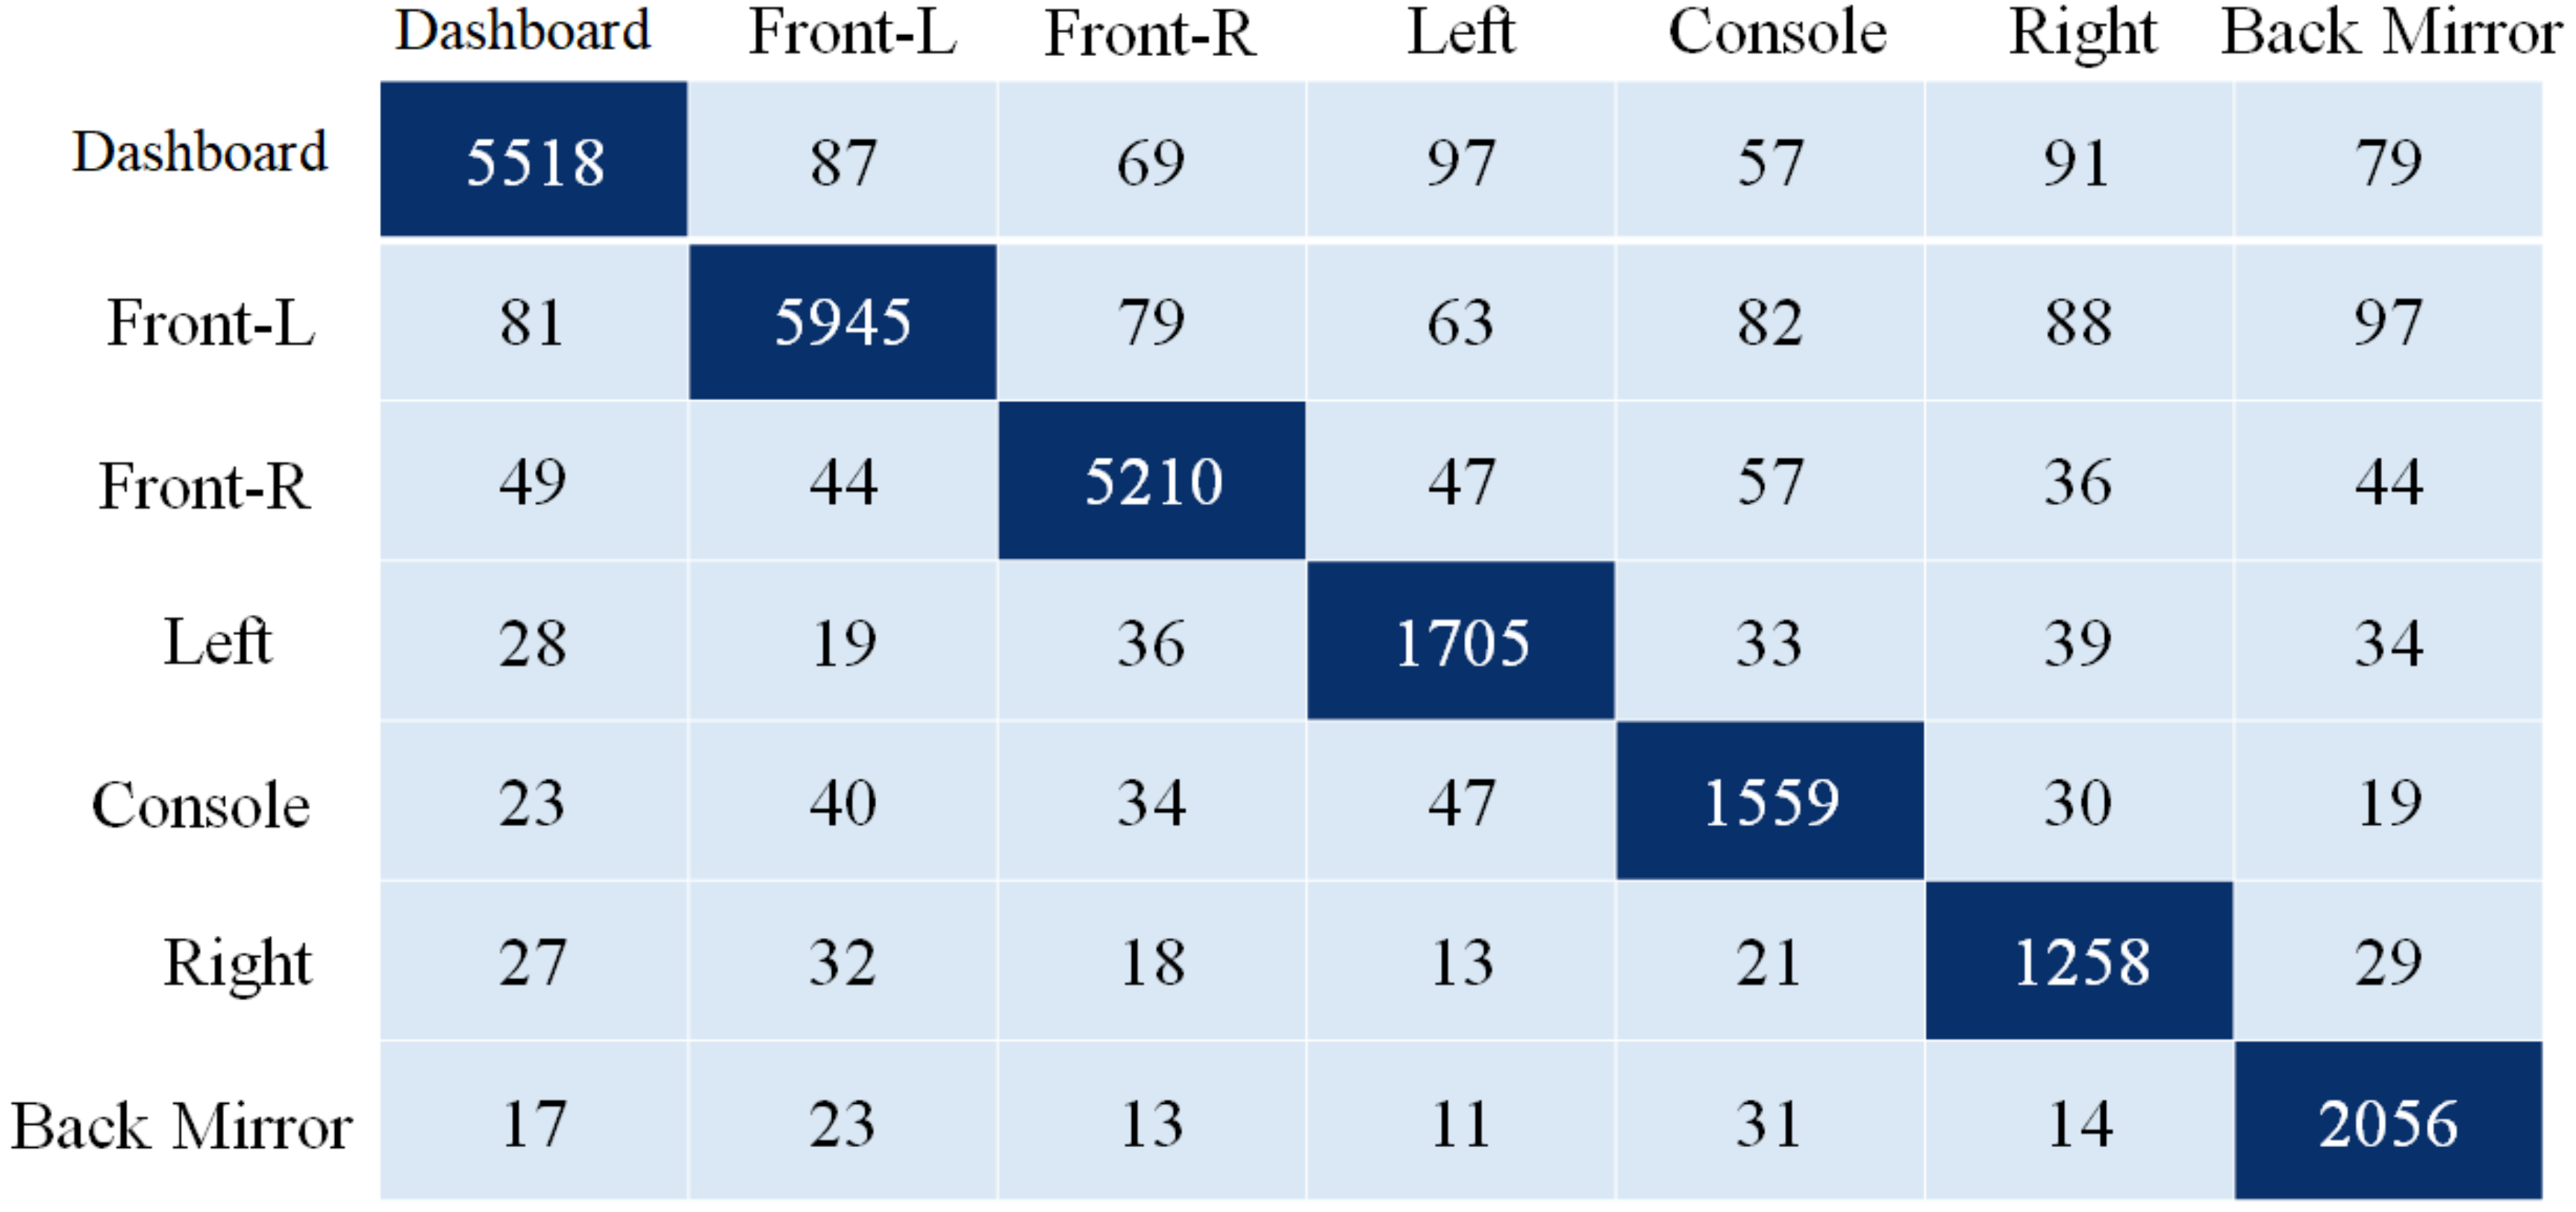
Figure 13 is regarding the confusion matrix.
The proposed model’s performance was assessed using the classification evaluation metrics of accuracy, precision, recall, and F-Measure in
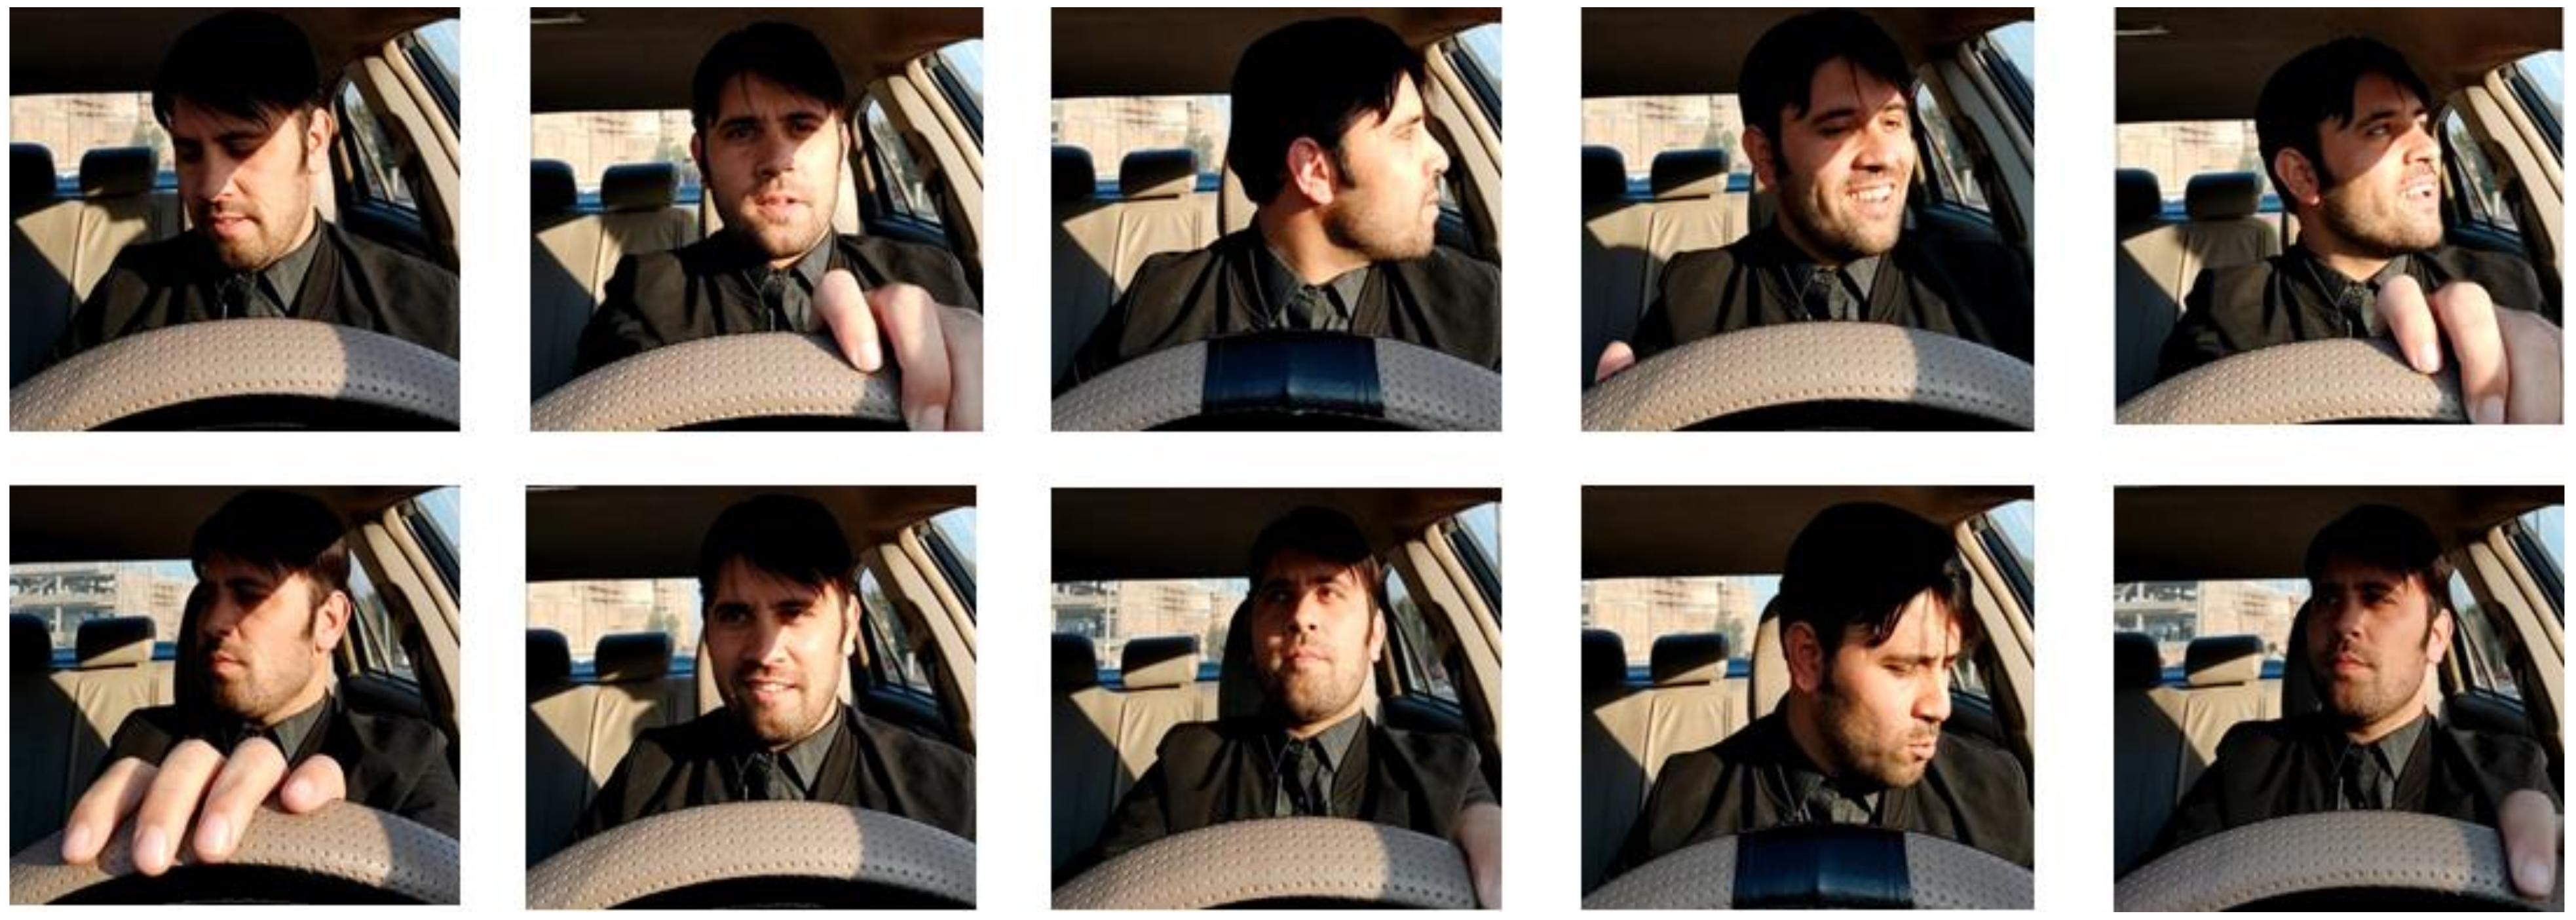
Table 5. For gaze detection, seven classes indicate head posture and eye orientation. A pre-trained CNN model for migration learning achieves higher accuracy, and CNN training takes one week owing to the size of the seven classes. For training the CNN, the epoch number is 50, the batch size is 64, and the optimization approach is Adam. The suggested model’s average accuracy is 92.71% and its average F-measure is 93.01%.
4.3. Eye Gaze Estimation Using CNN Regression
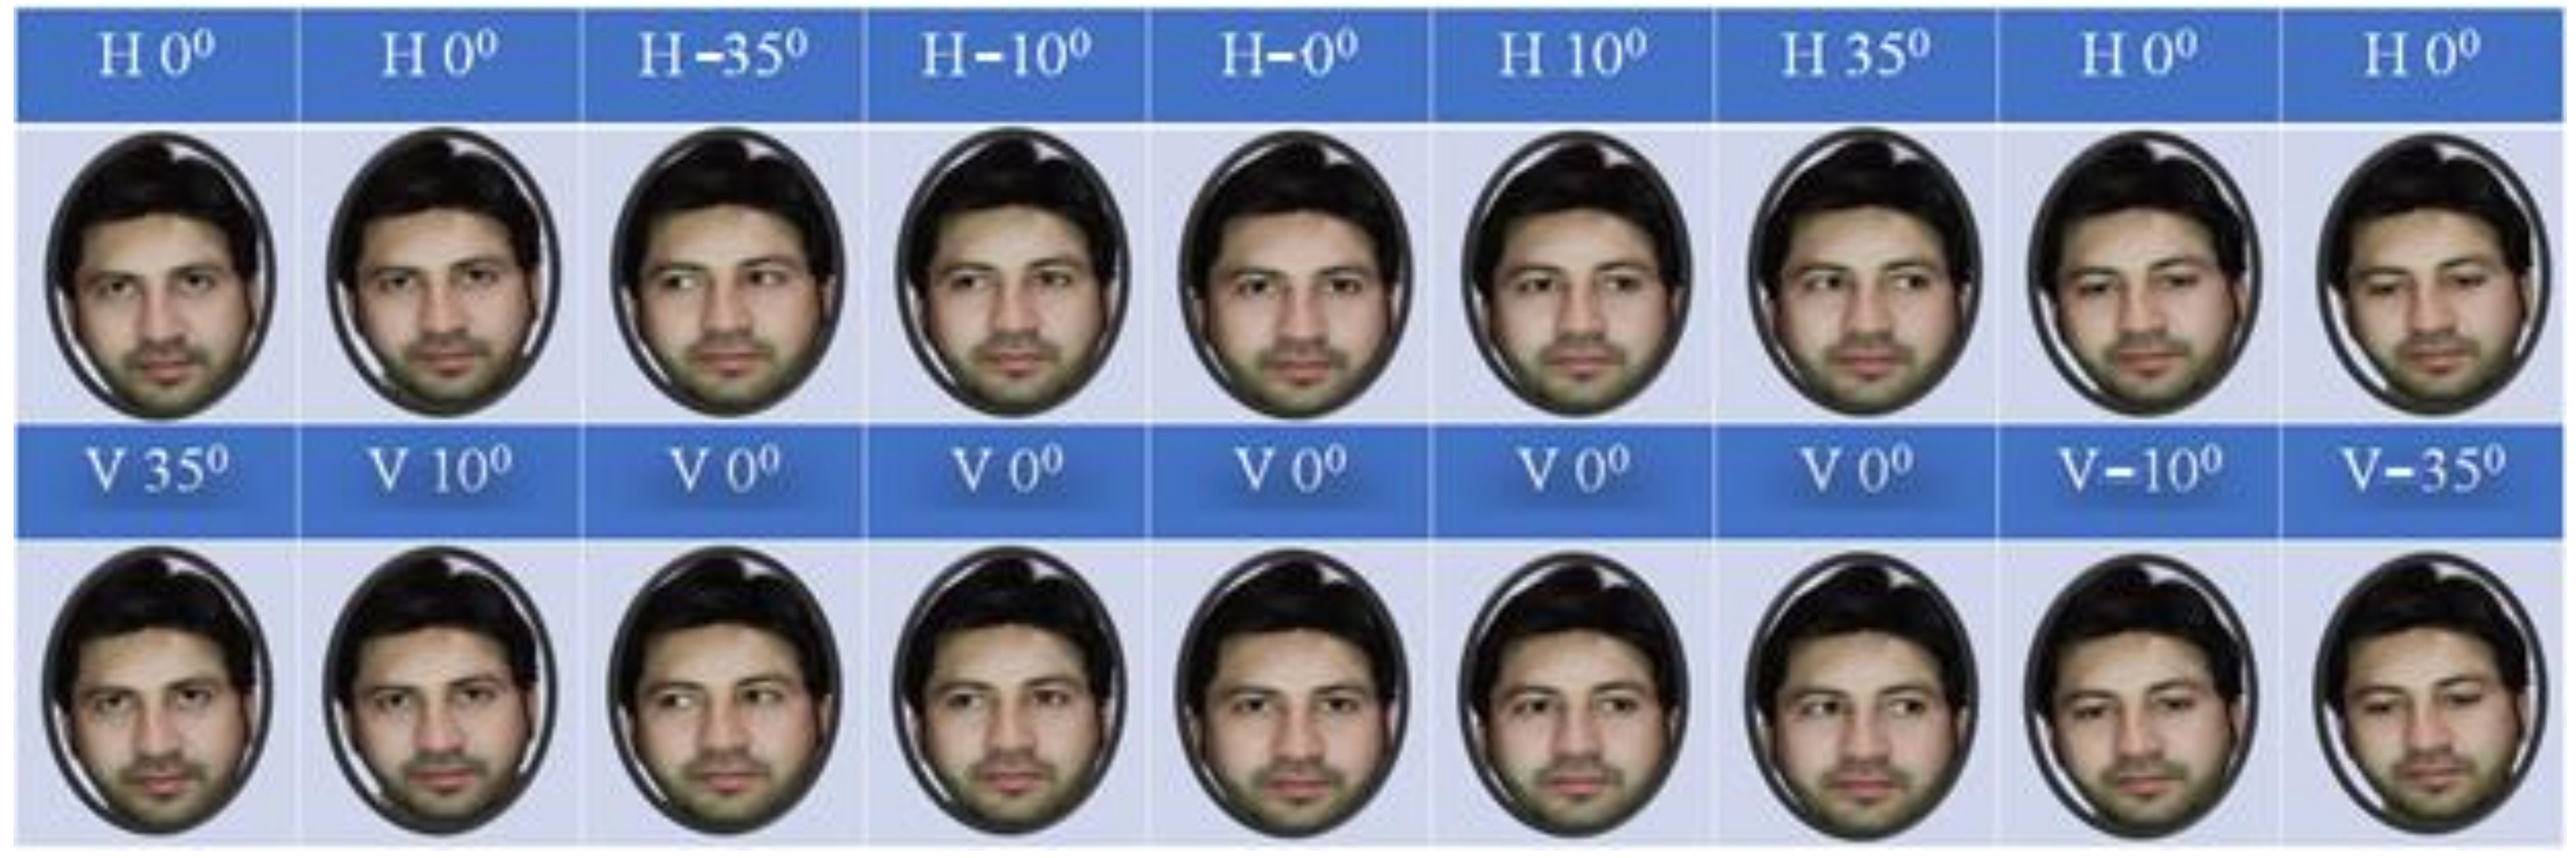
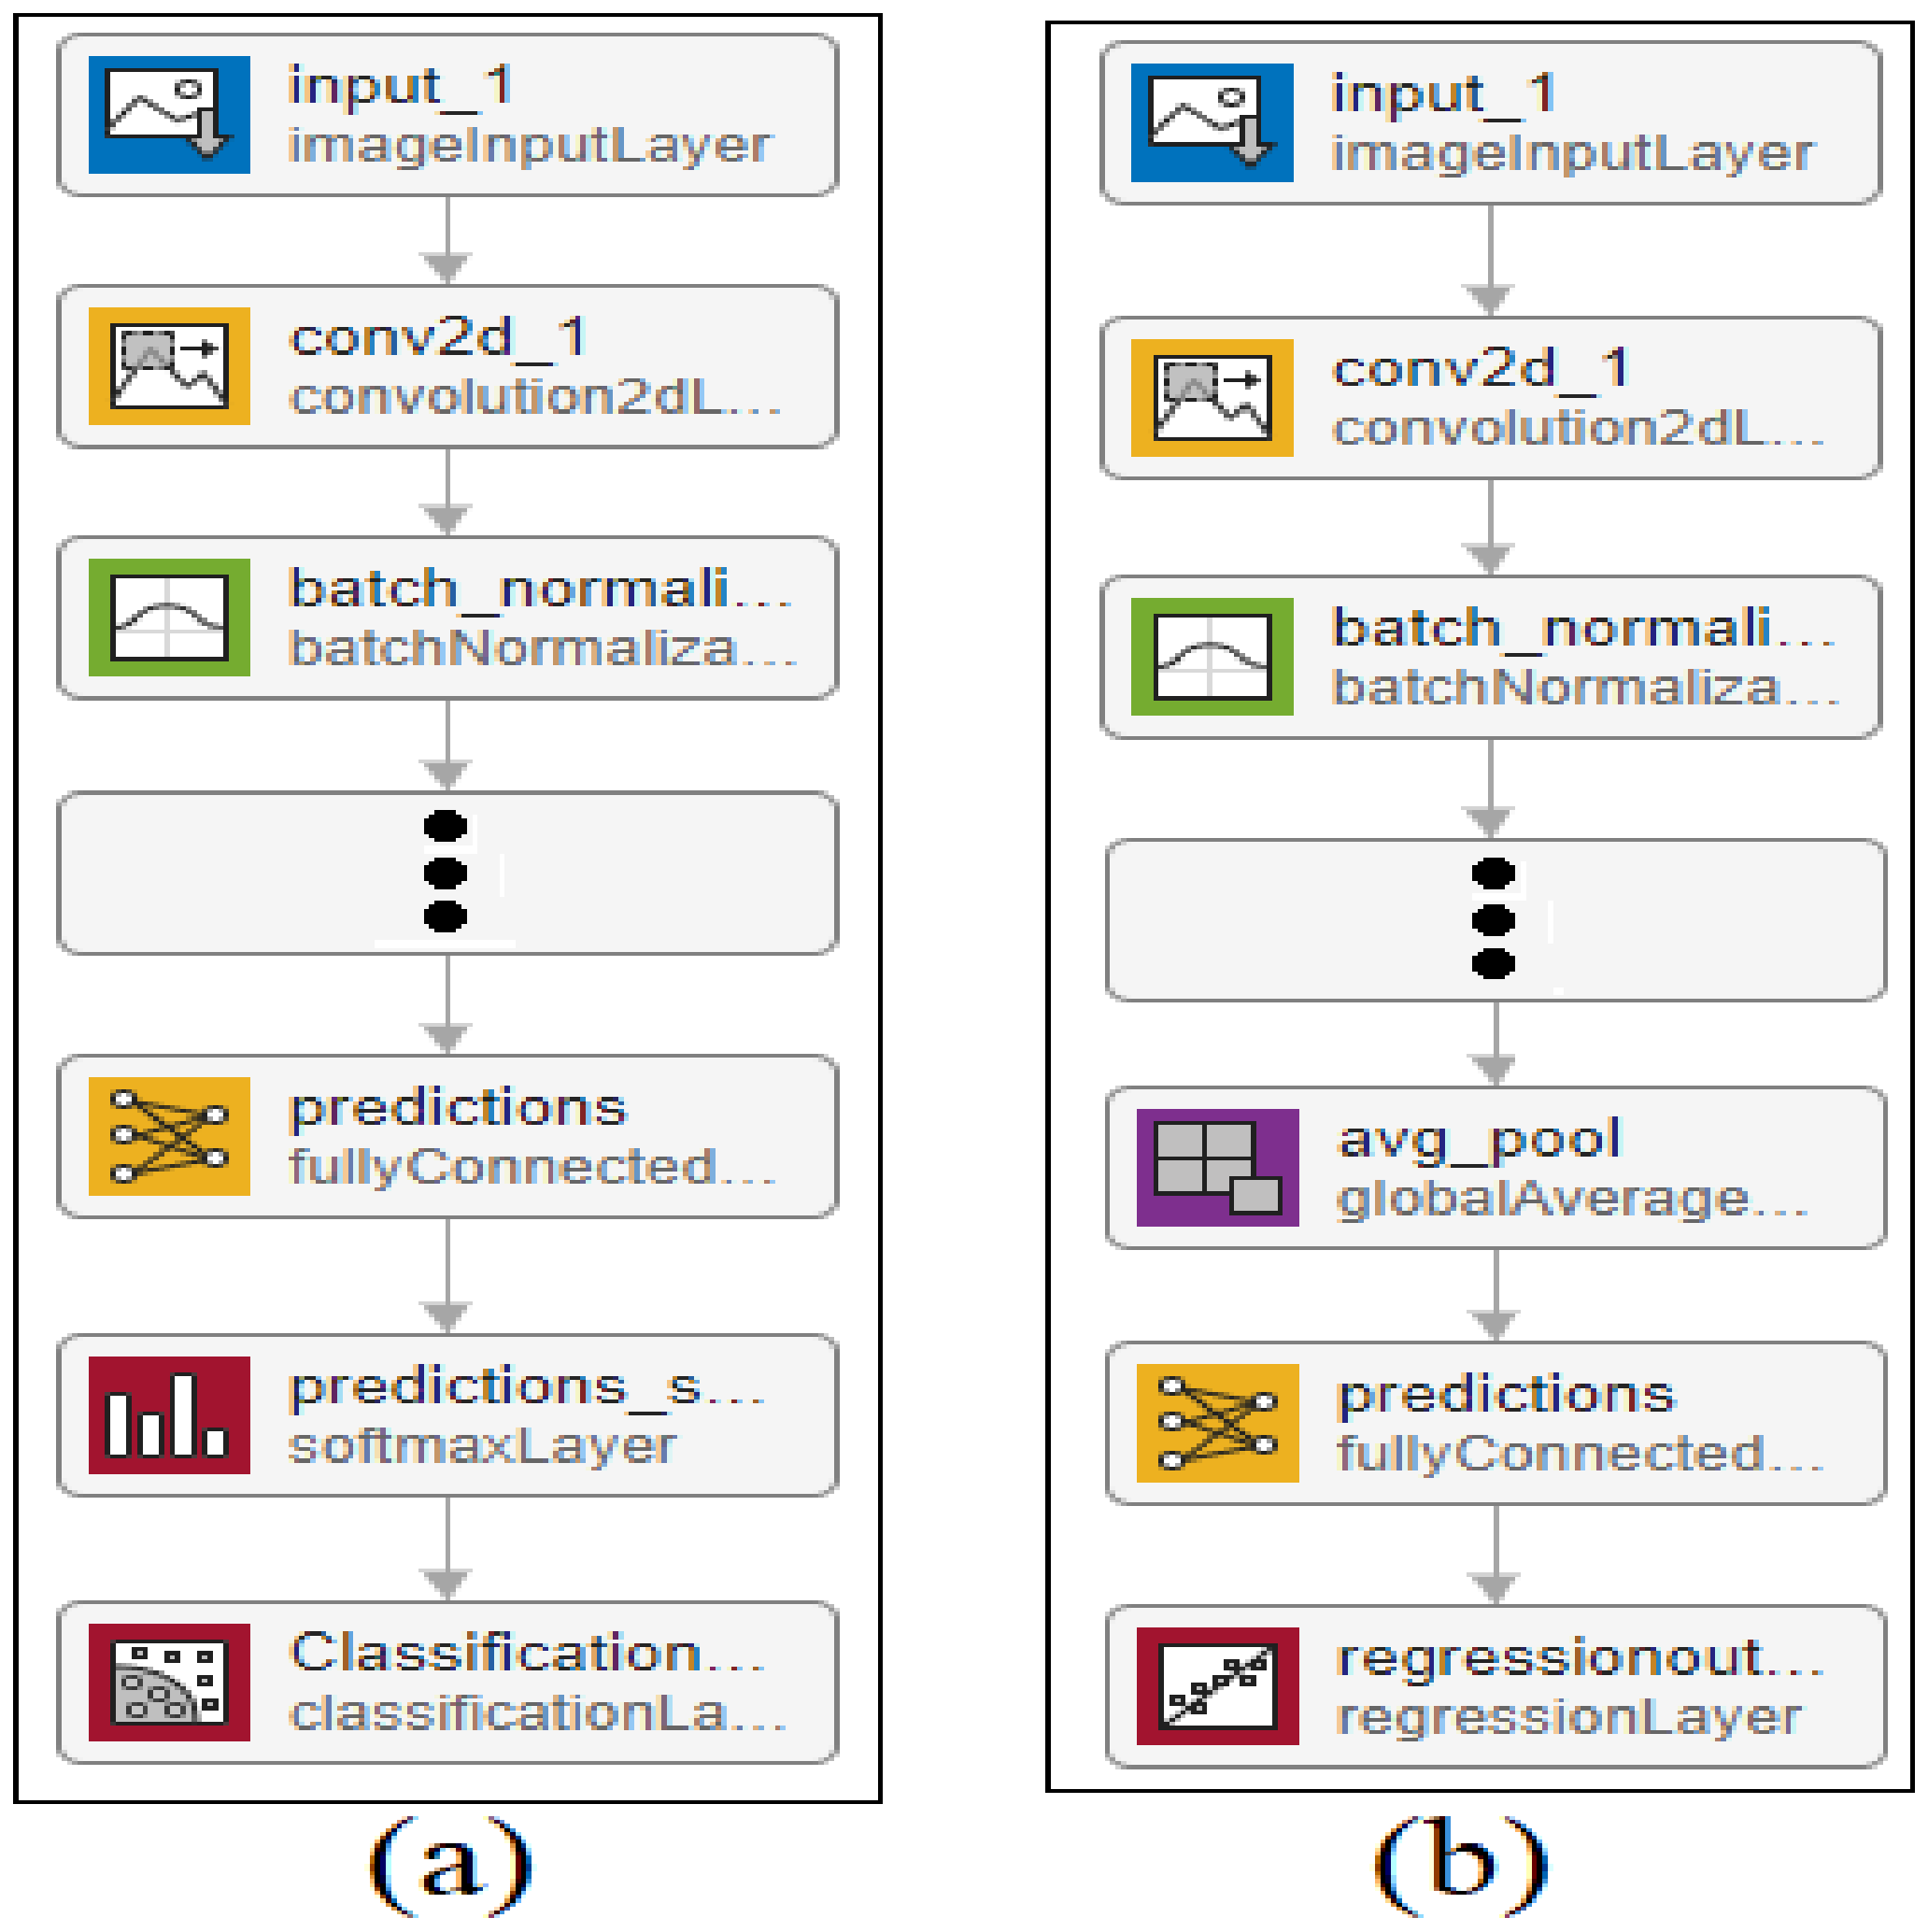
The class labels of eye direction are vertical and horizontal angles that are numerical values; these values can be predicted using a regression model. Our gaze consists of nine gaze directions, where each angle consists of different numbers of images. The proposed eye gaze estimation model was developed by performing transfer learning InceptionResNet-v2 and replacing the final two layers with a regression output layer. The hyperparameter used for model training was the optimization algorithm ‘Adam’, the number of epochs = 50, mini-batch size = 16, and an initial learning rate of 0.0001.
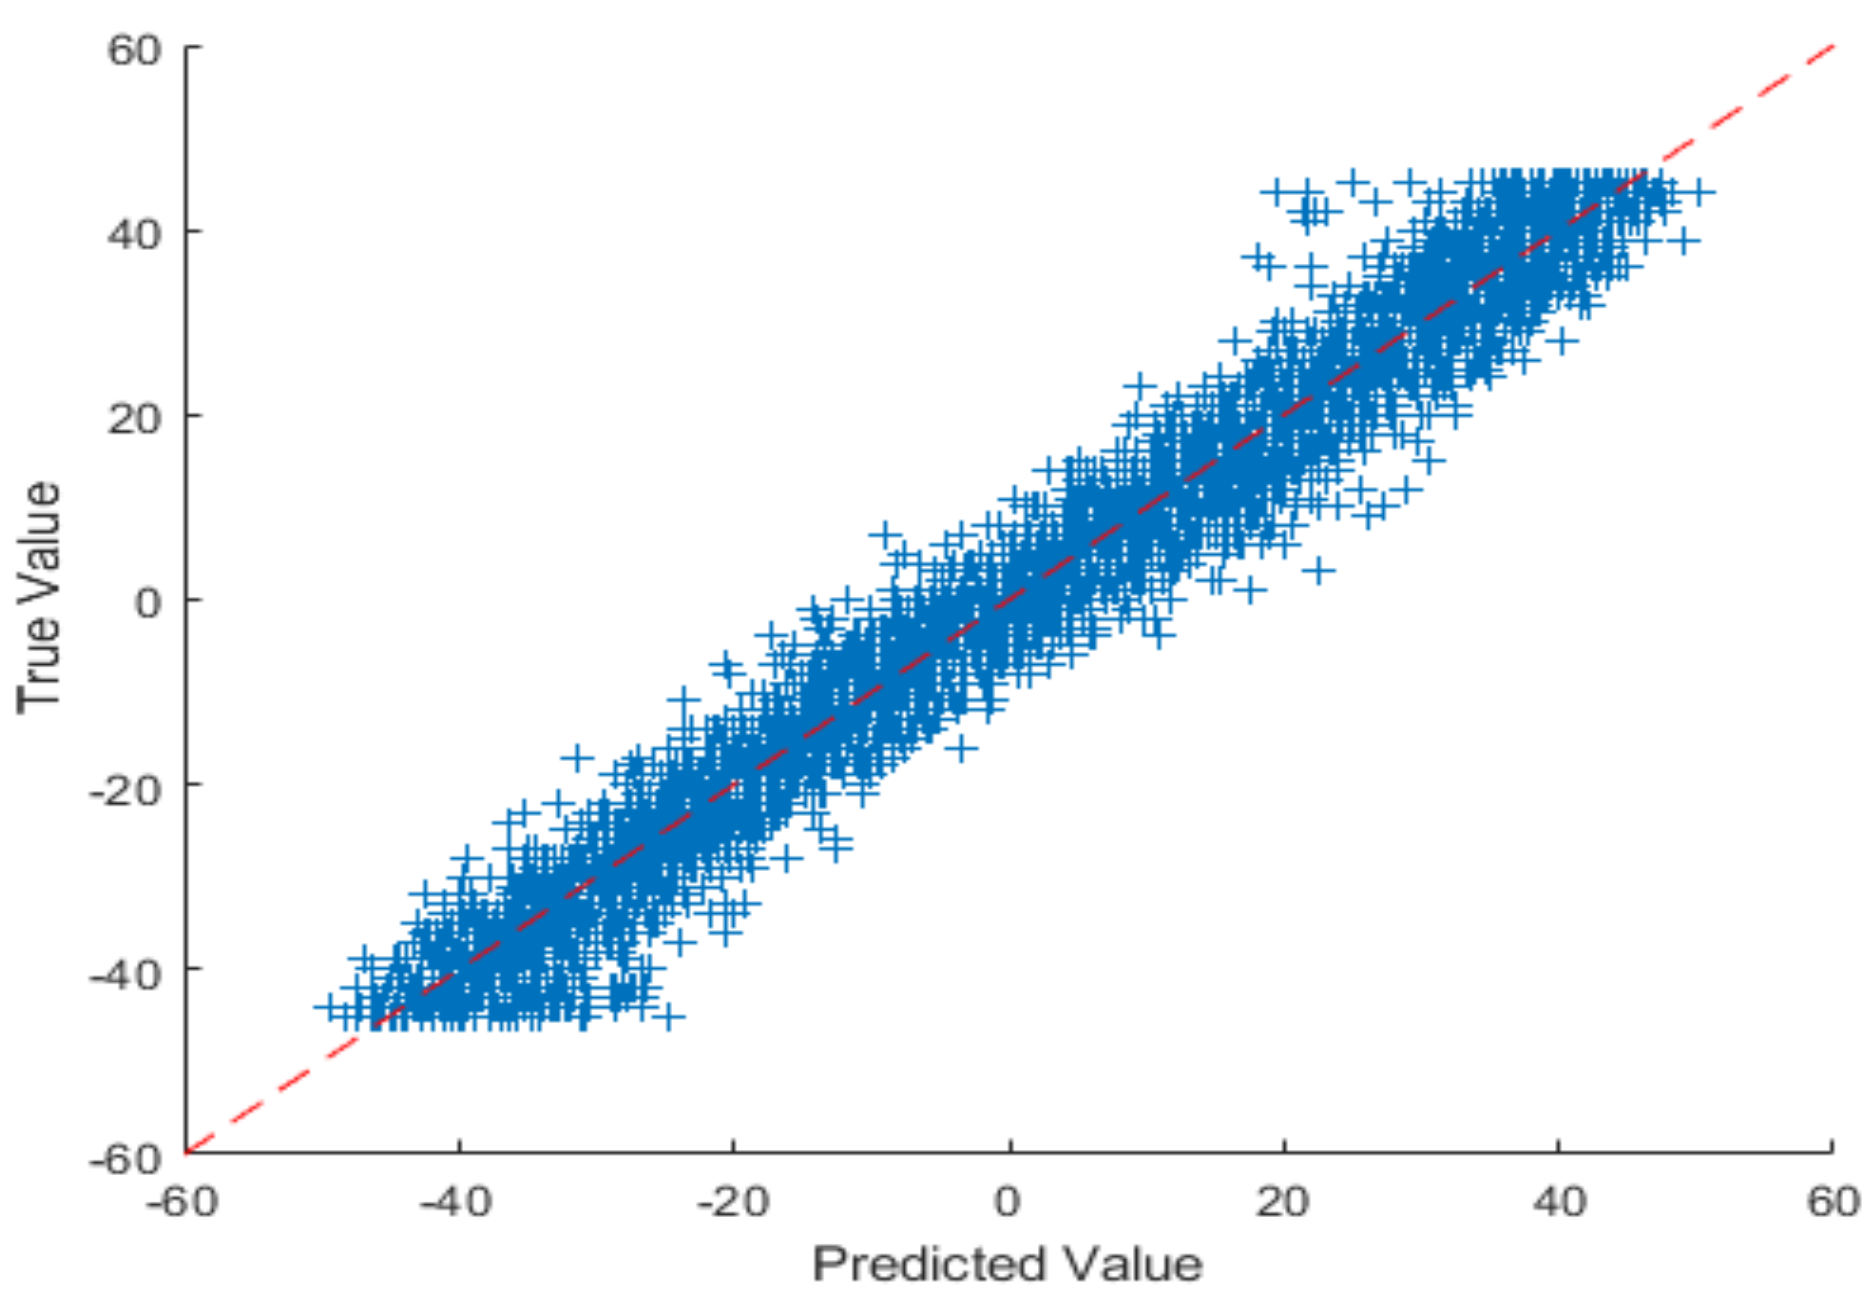
To estimate the eye gaze angles, a regression model was utilized that predicted numerical values; the regression model could be linear or non-linear. As the data were linear, the proposed CNN model drew the line between the data points; the line passed between the data points, meaning that the model is the best fit and it receives a minimum RMSE score as illustrated in
Table 6.
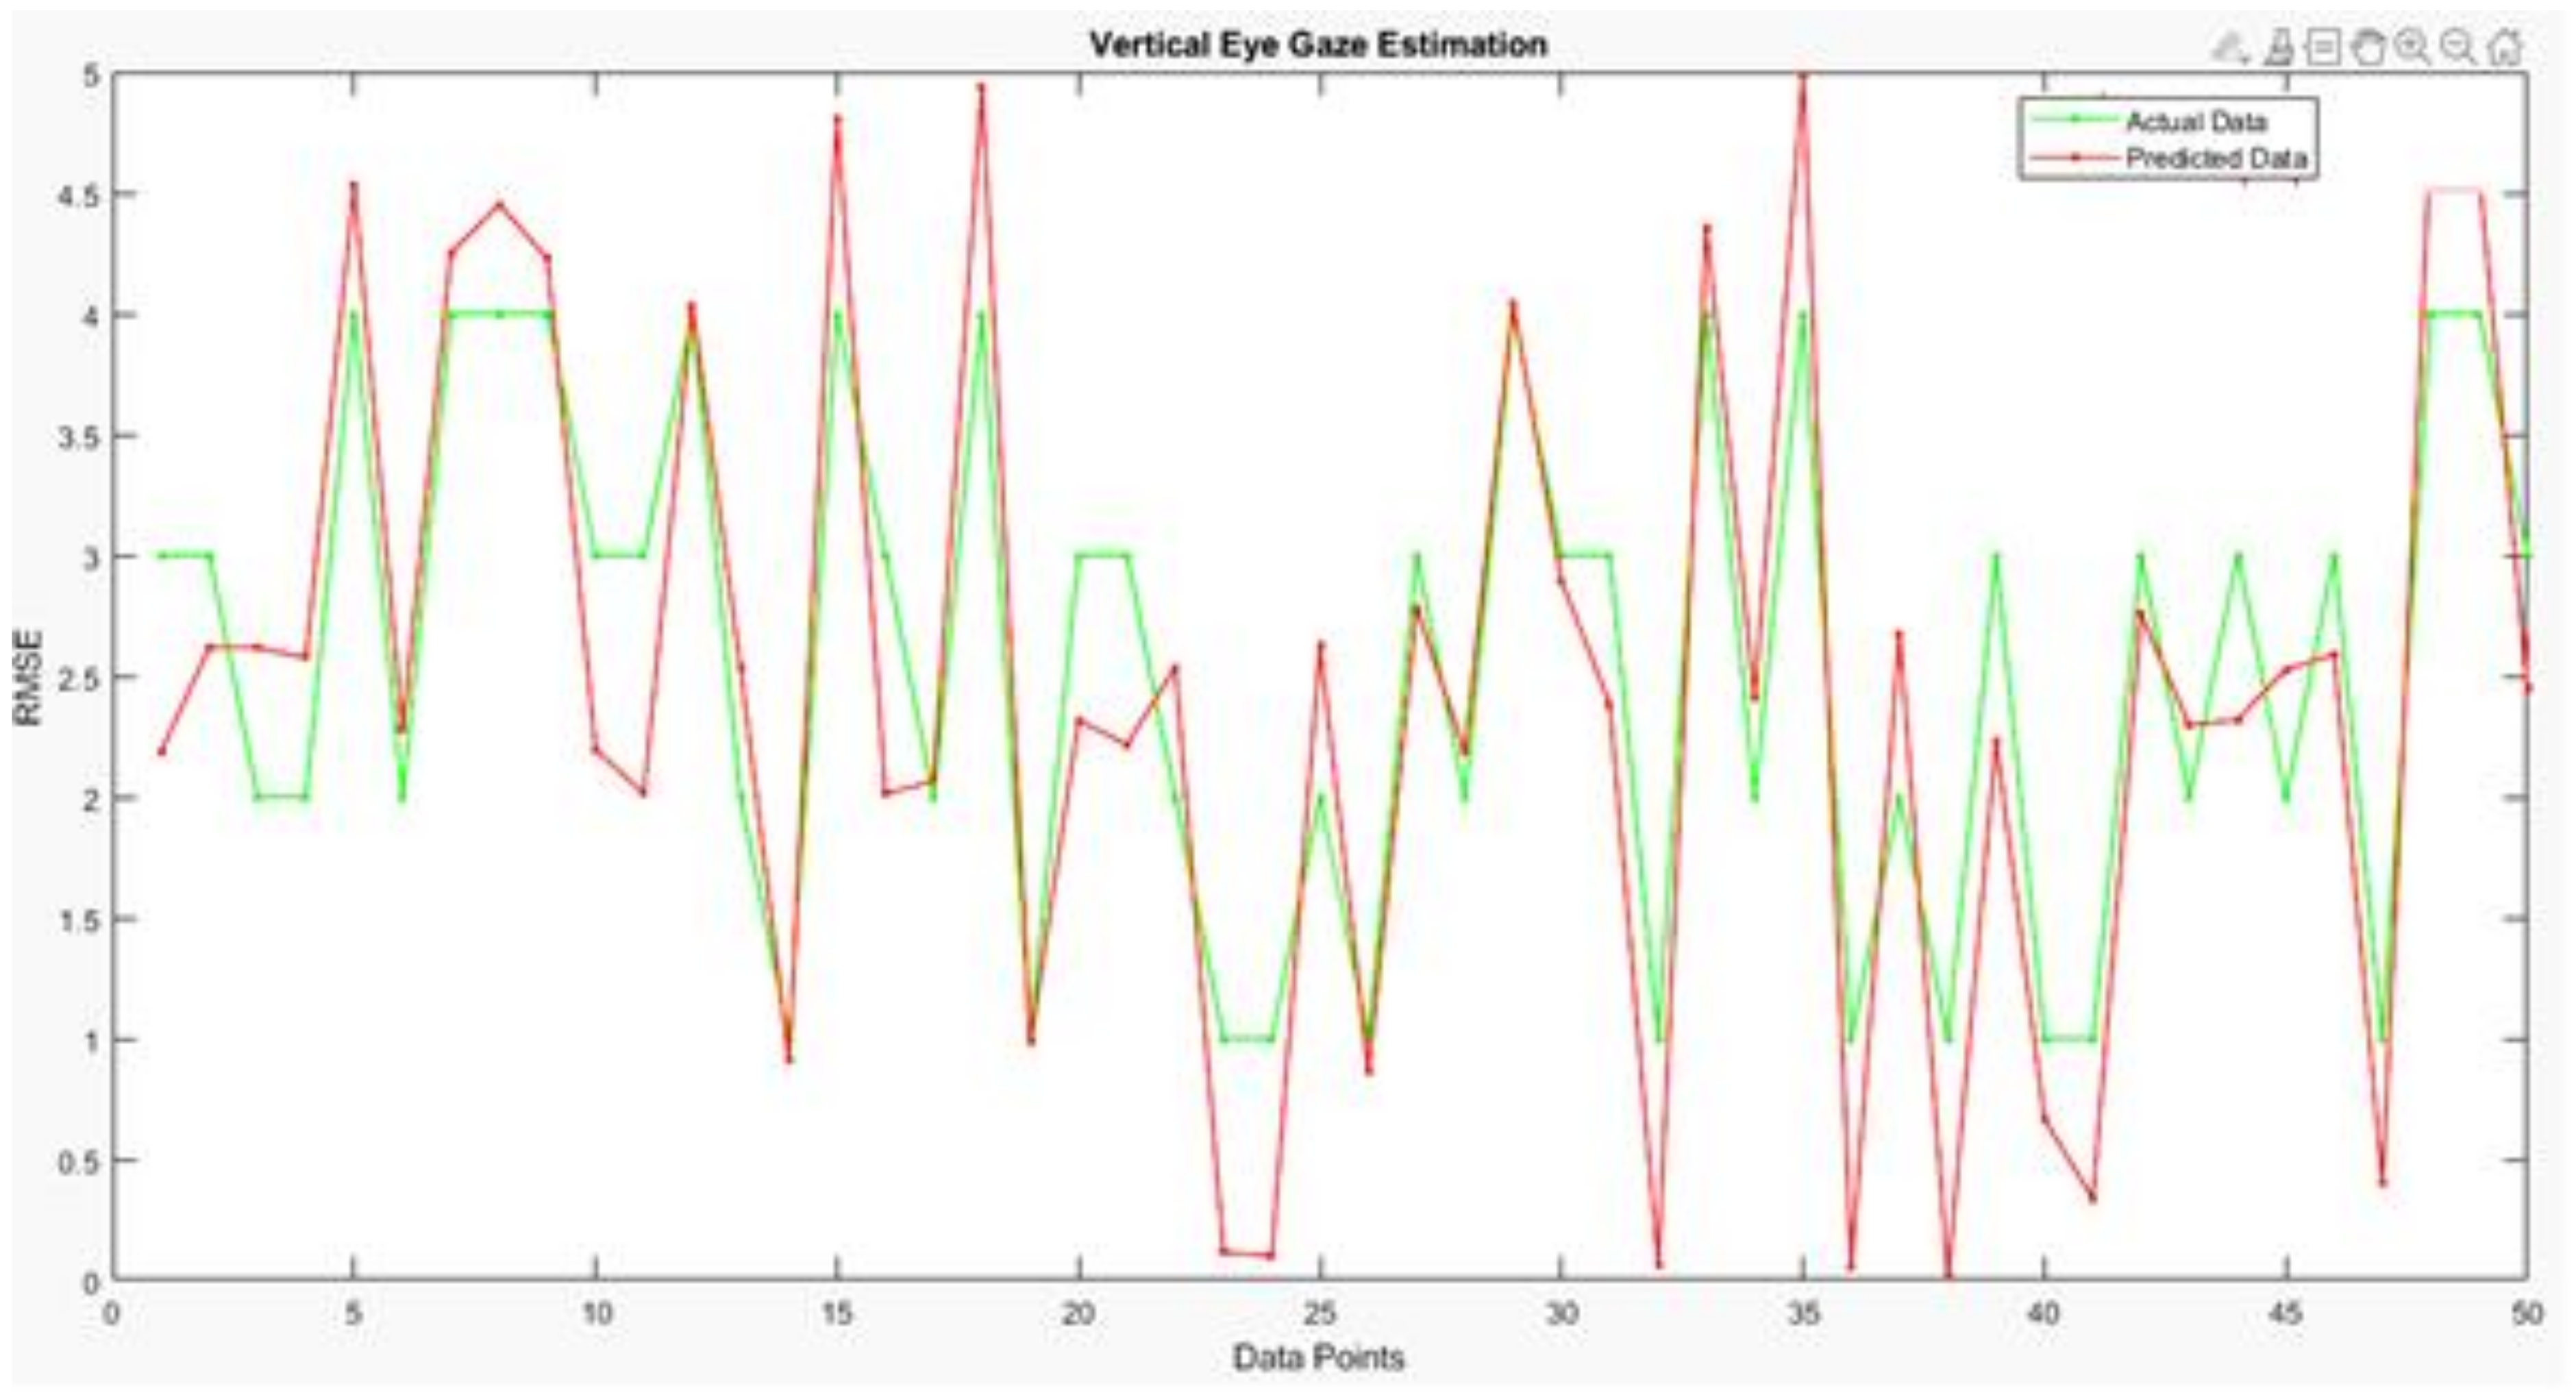
Analysis of the proposed vertical eye gaze estimation model using the line plot.
Figure 17 depicts the results of the difference between the actual and predicted model’s vertical gaze angles using a line plot. The proposed model achieved a low RMSE of 2.68, which can also be visualized using the difference between the green and red markers in the line plot.
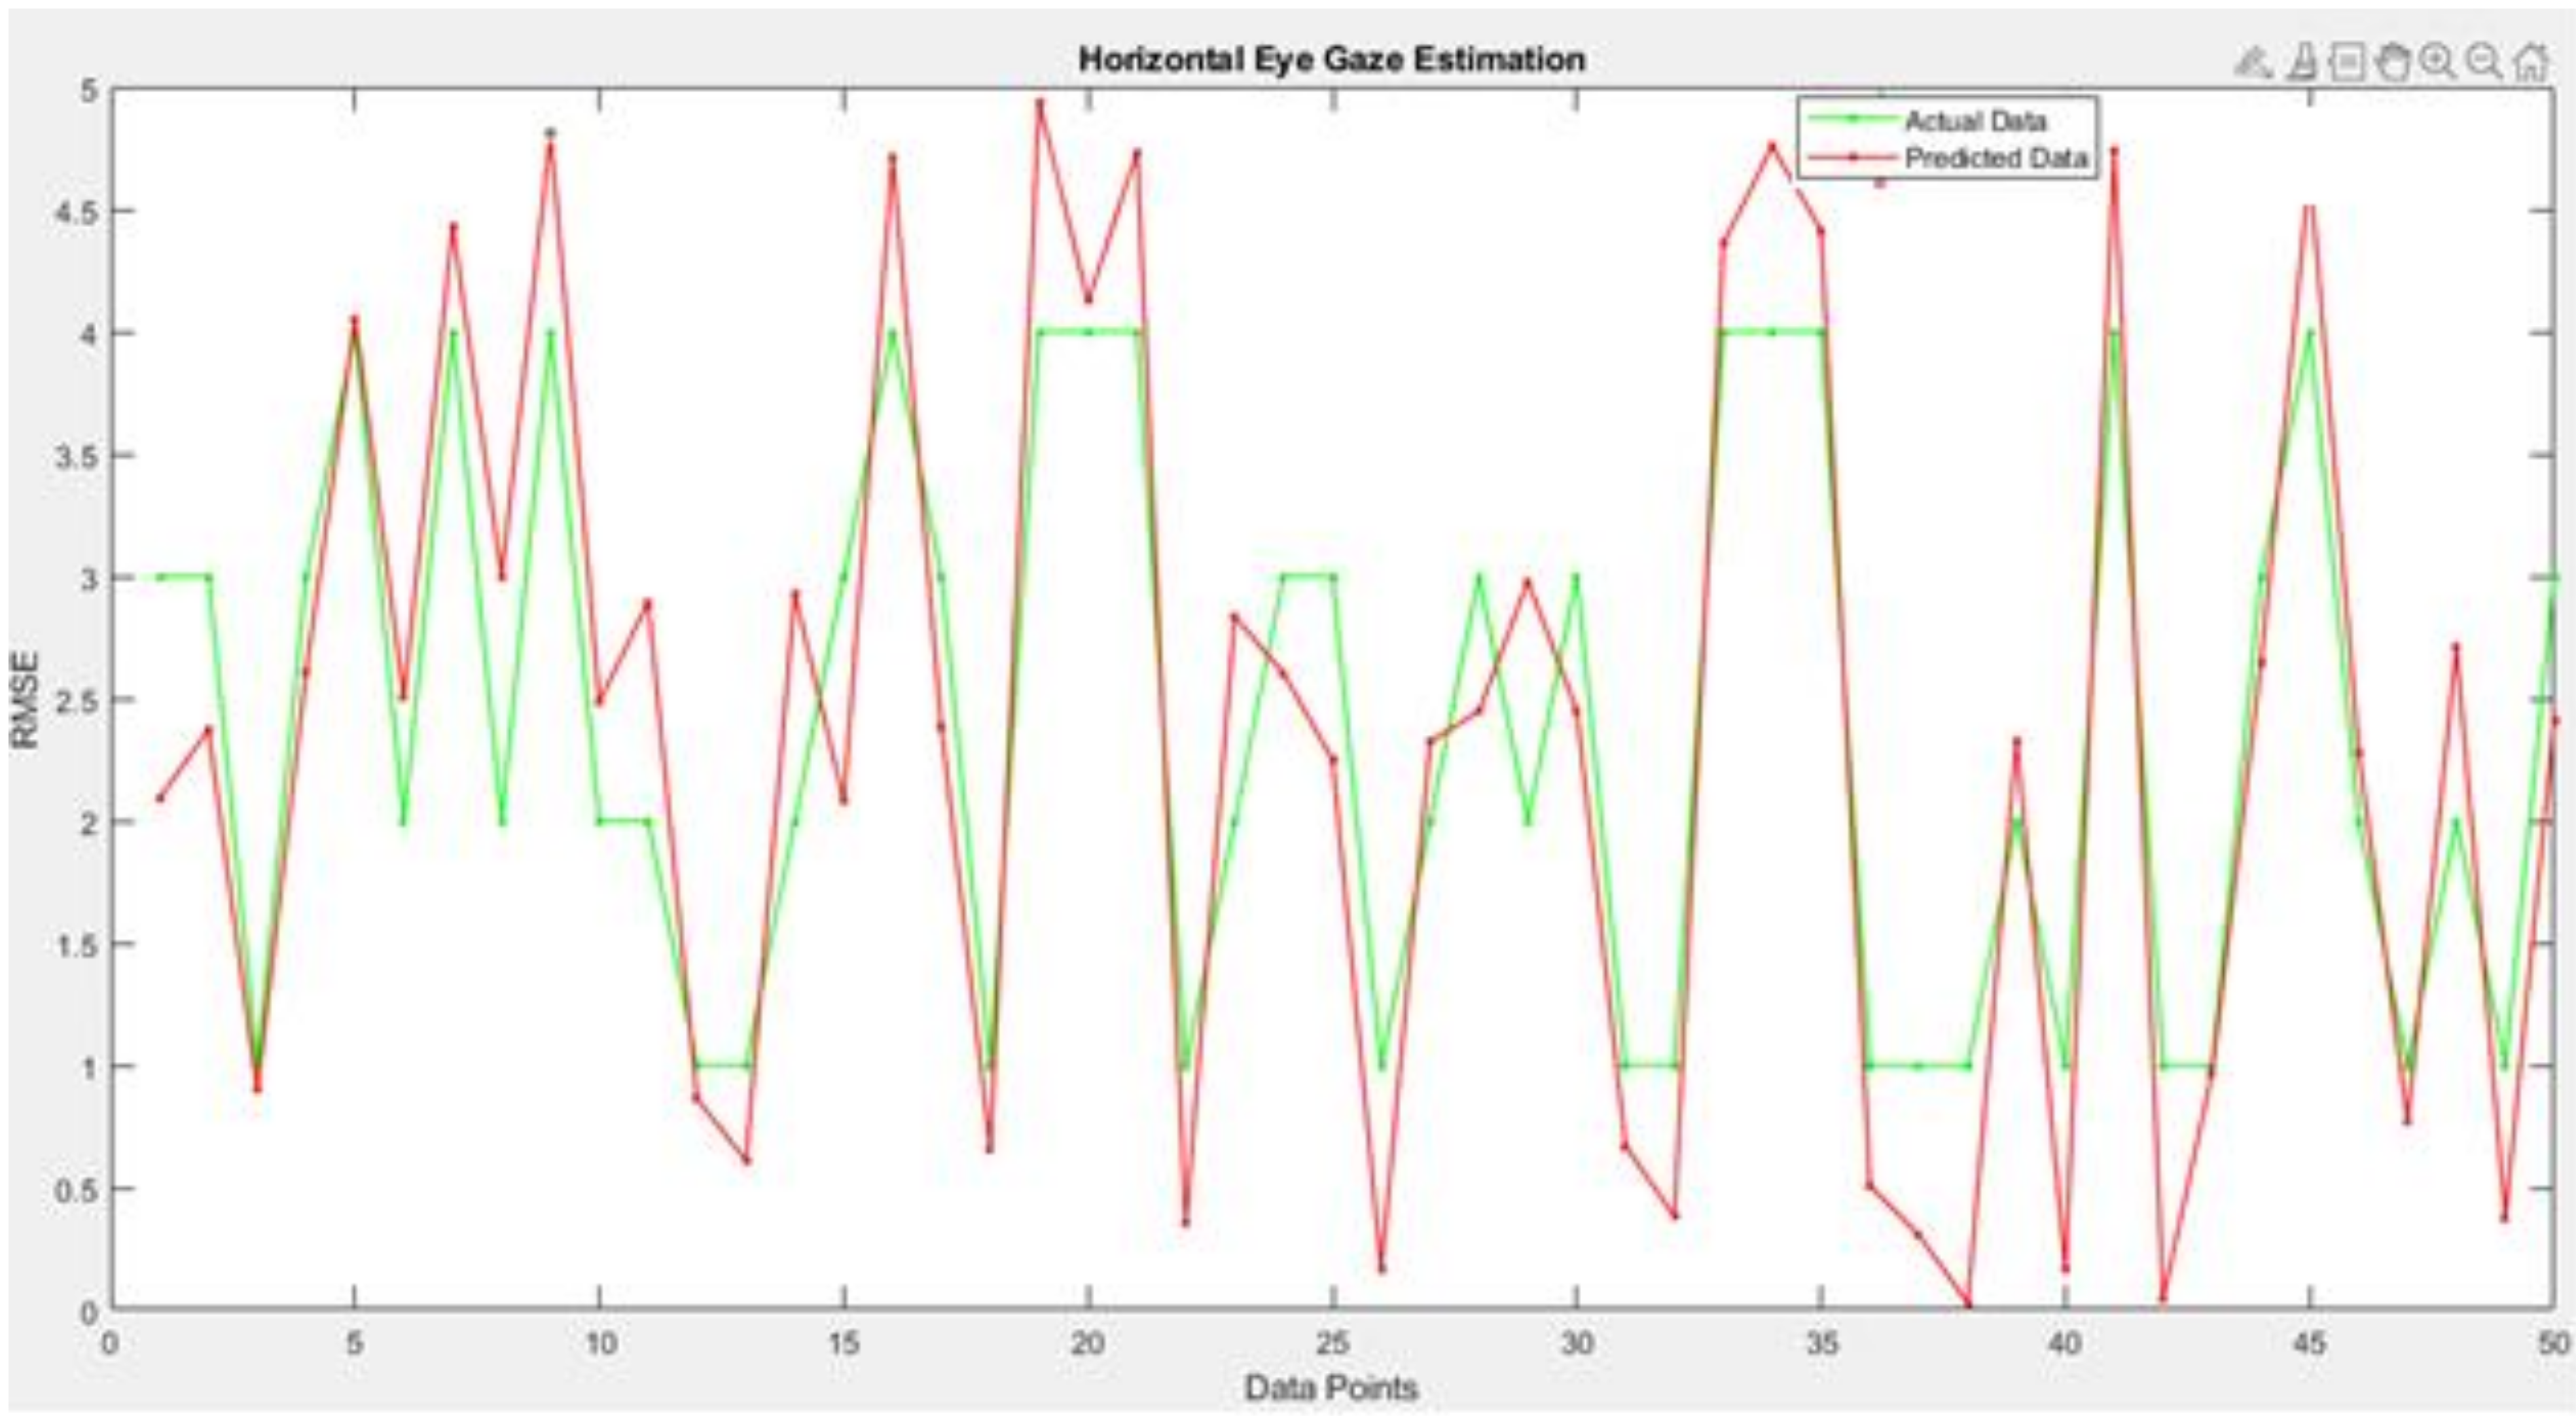
Figure 18 and
Table 7 depicts the results of the difference between the actual and predicted model’s horizontal gaze angles using a line plot. The proposed model achieved a low RMSE of 3.61, which could also be visualized using the difference between the green and red markers in the line plot.
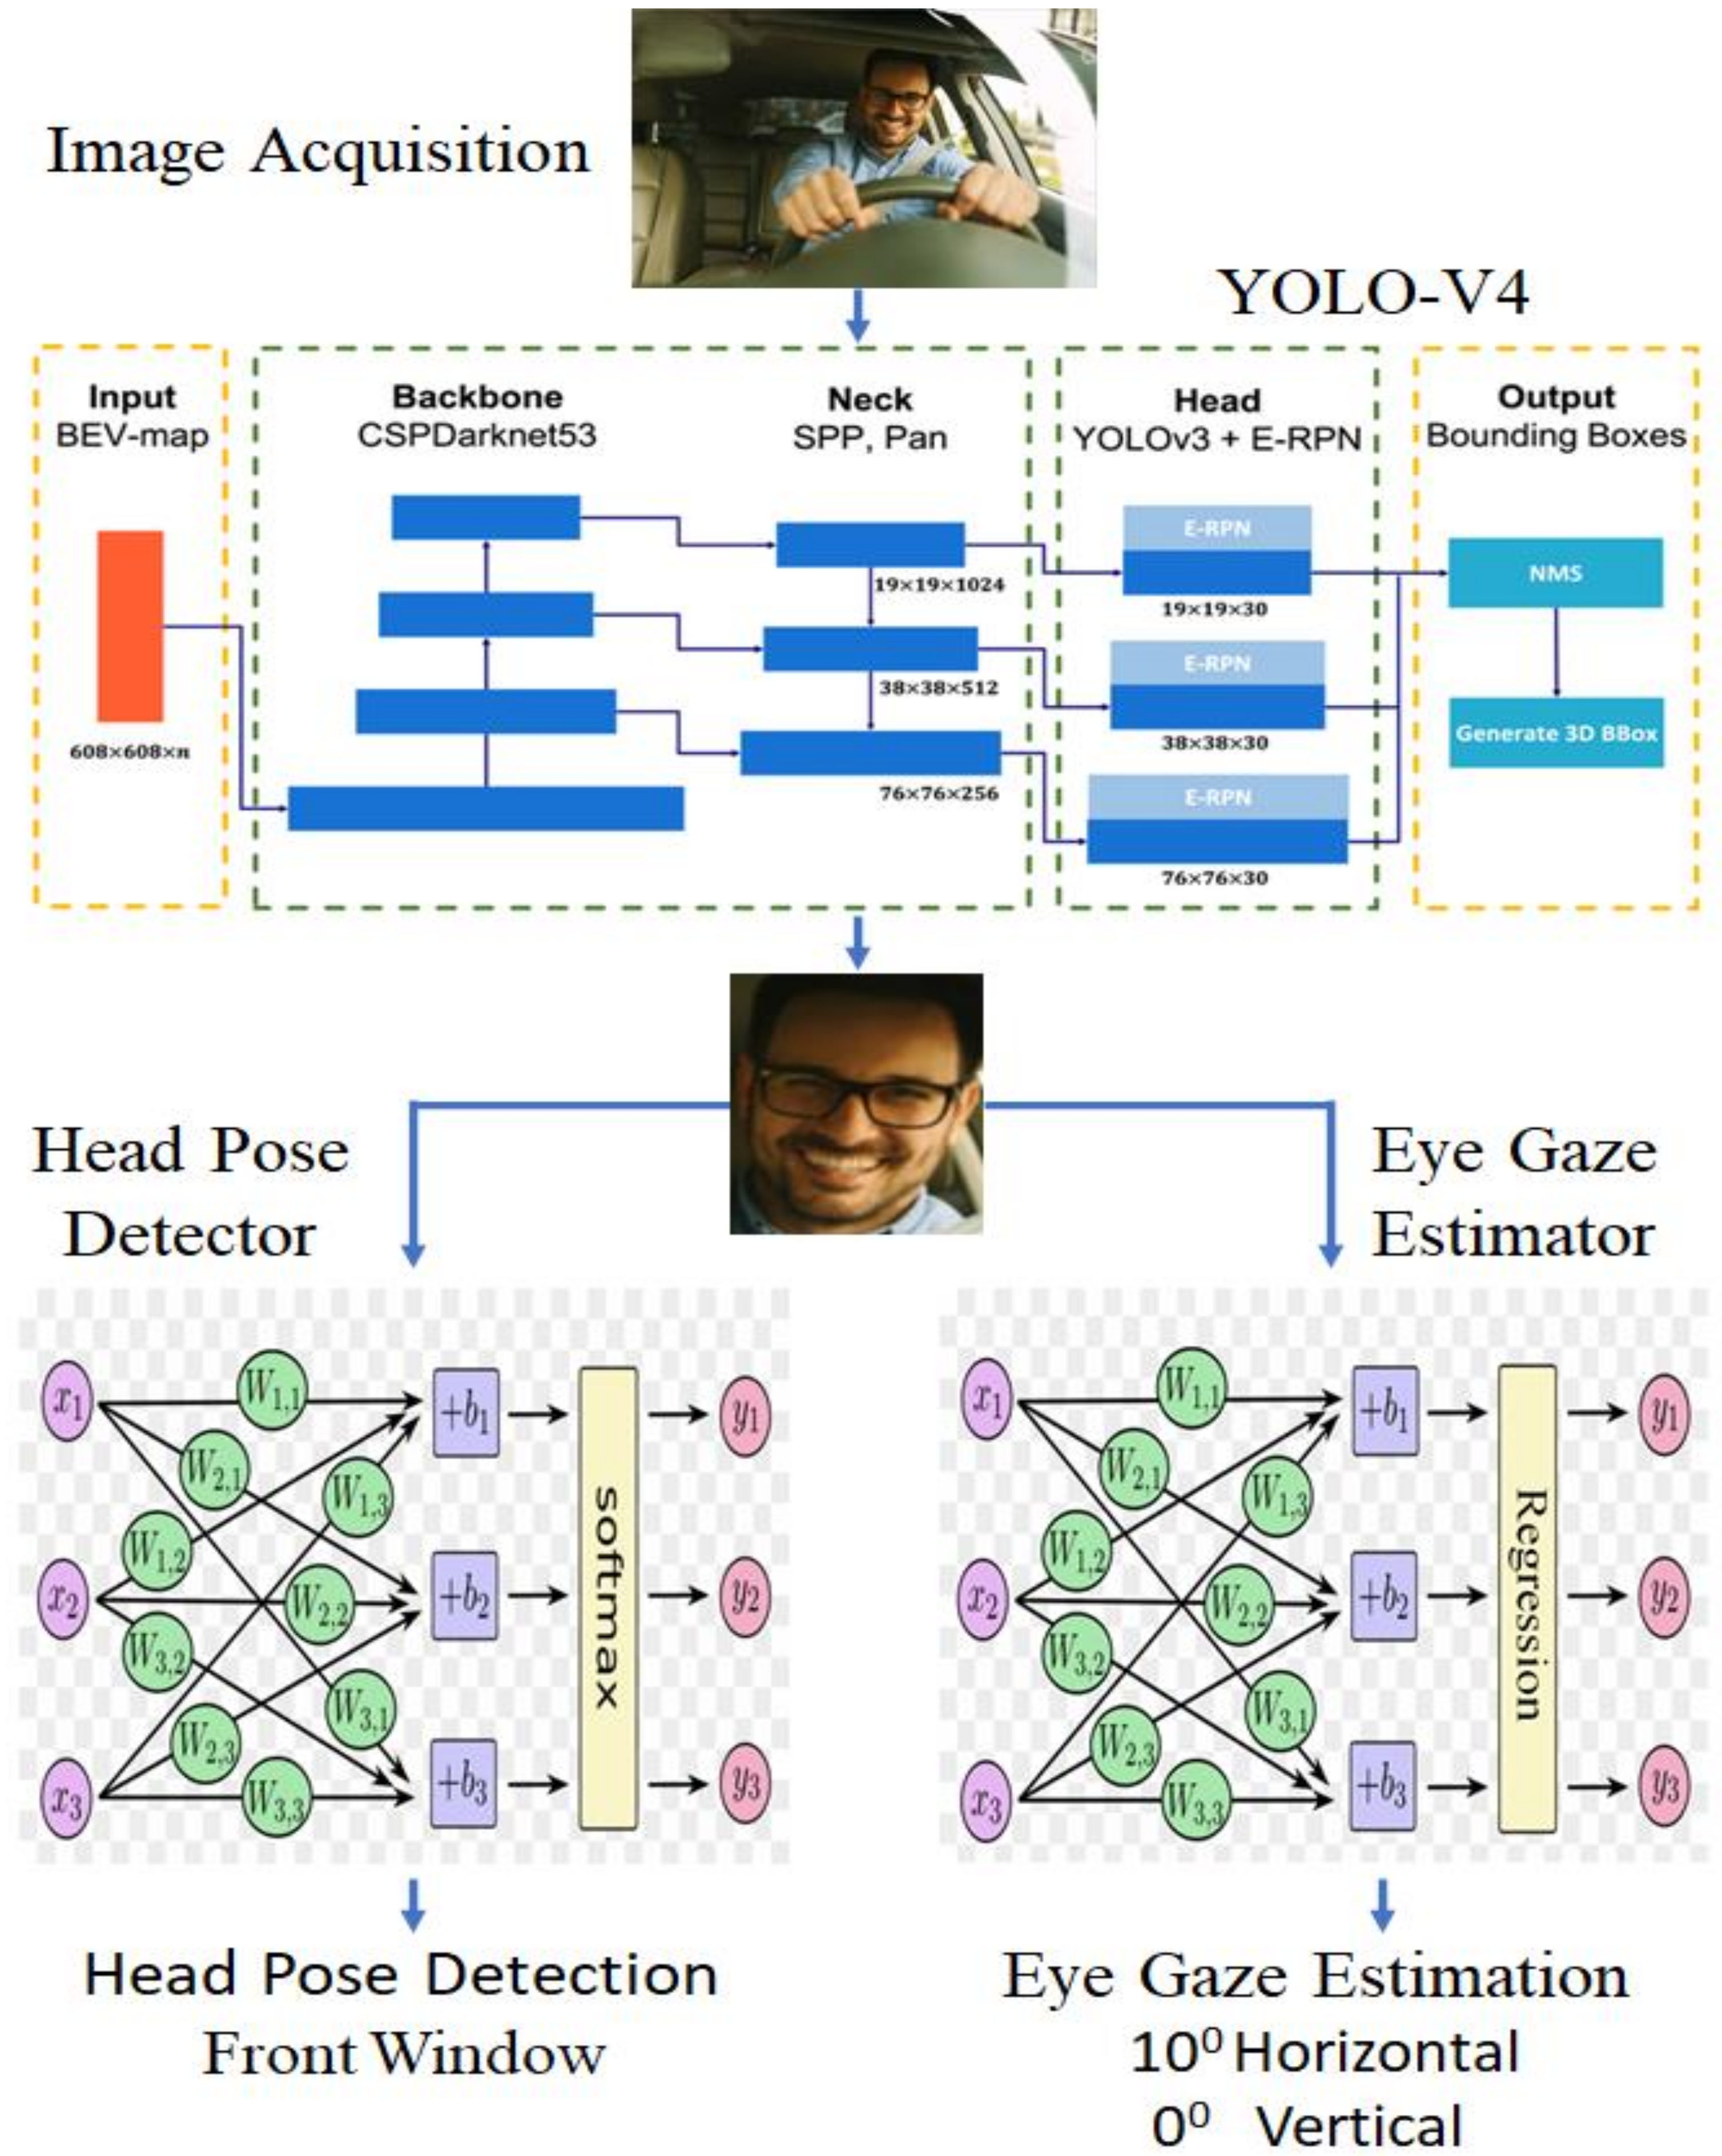
In the research article, a novel method for the driver gaze detection technique was developed using computer vision and deep learning-based technologies. The first task in this research involved developing a benchmark dataset; the dataset was composed of both labels, i.e., head pose detection and eye gaze estimation. There were seven classes of drivers’ head poses in the custom dataset, which were nominal labels, while the eye gaze estimation labels were vertical and horizontal angles (numeric values). The head pose detection in this research was performed using classification in machine learning while the eye gaze estimation was done using deep learning-based regression models. To accurately detect the gaze, it is important to select the face region only, which was performed using YOLO-V4 architecture.
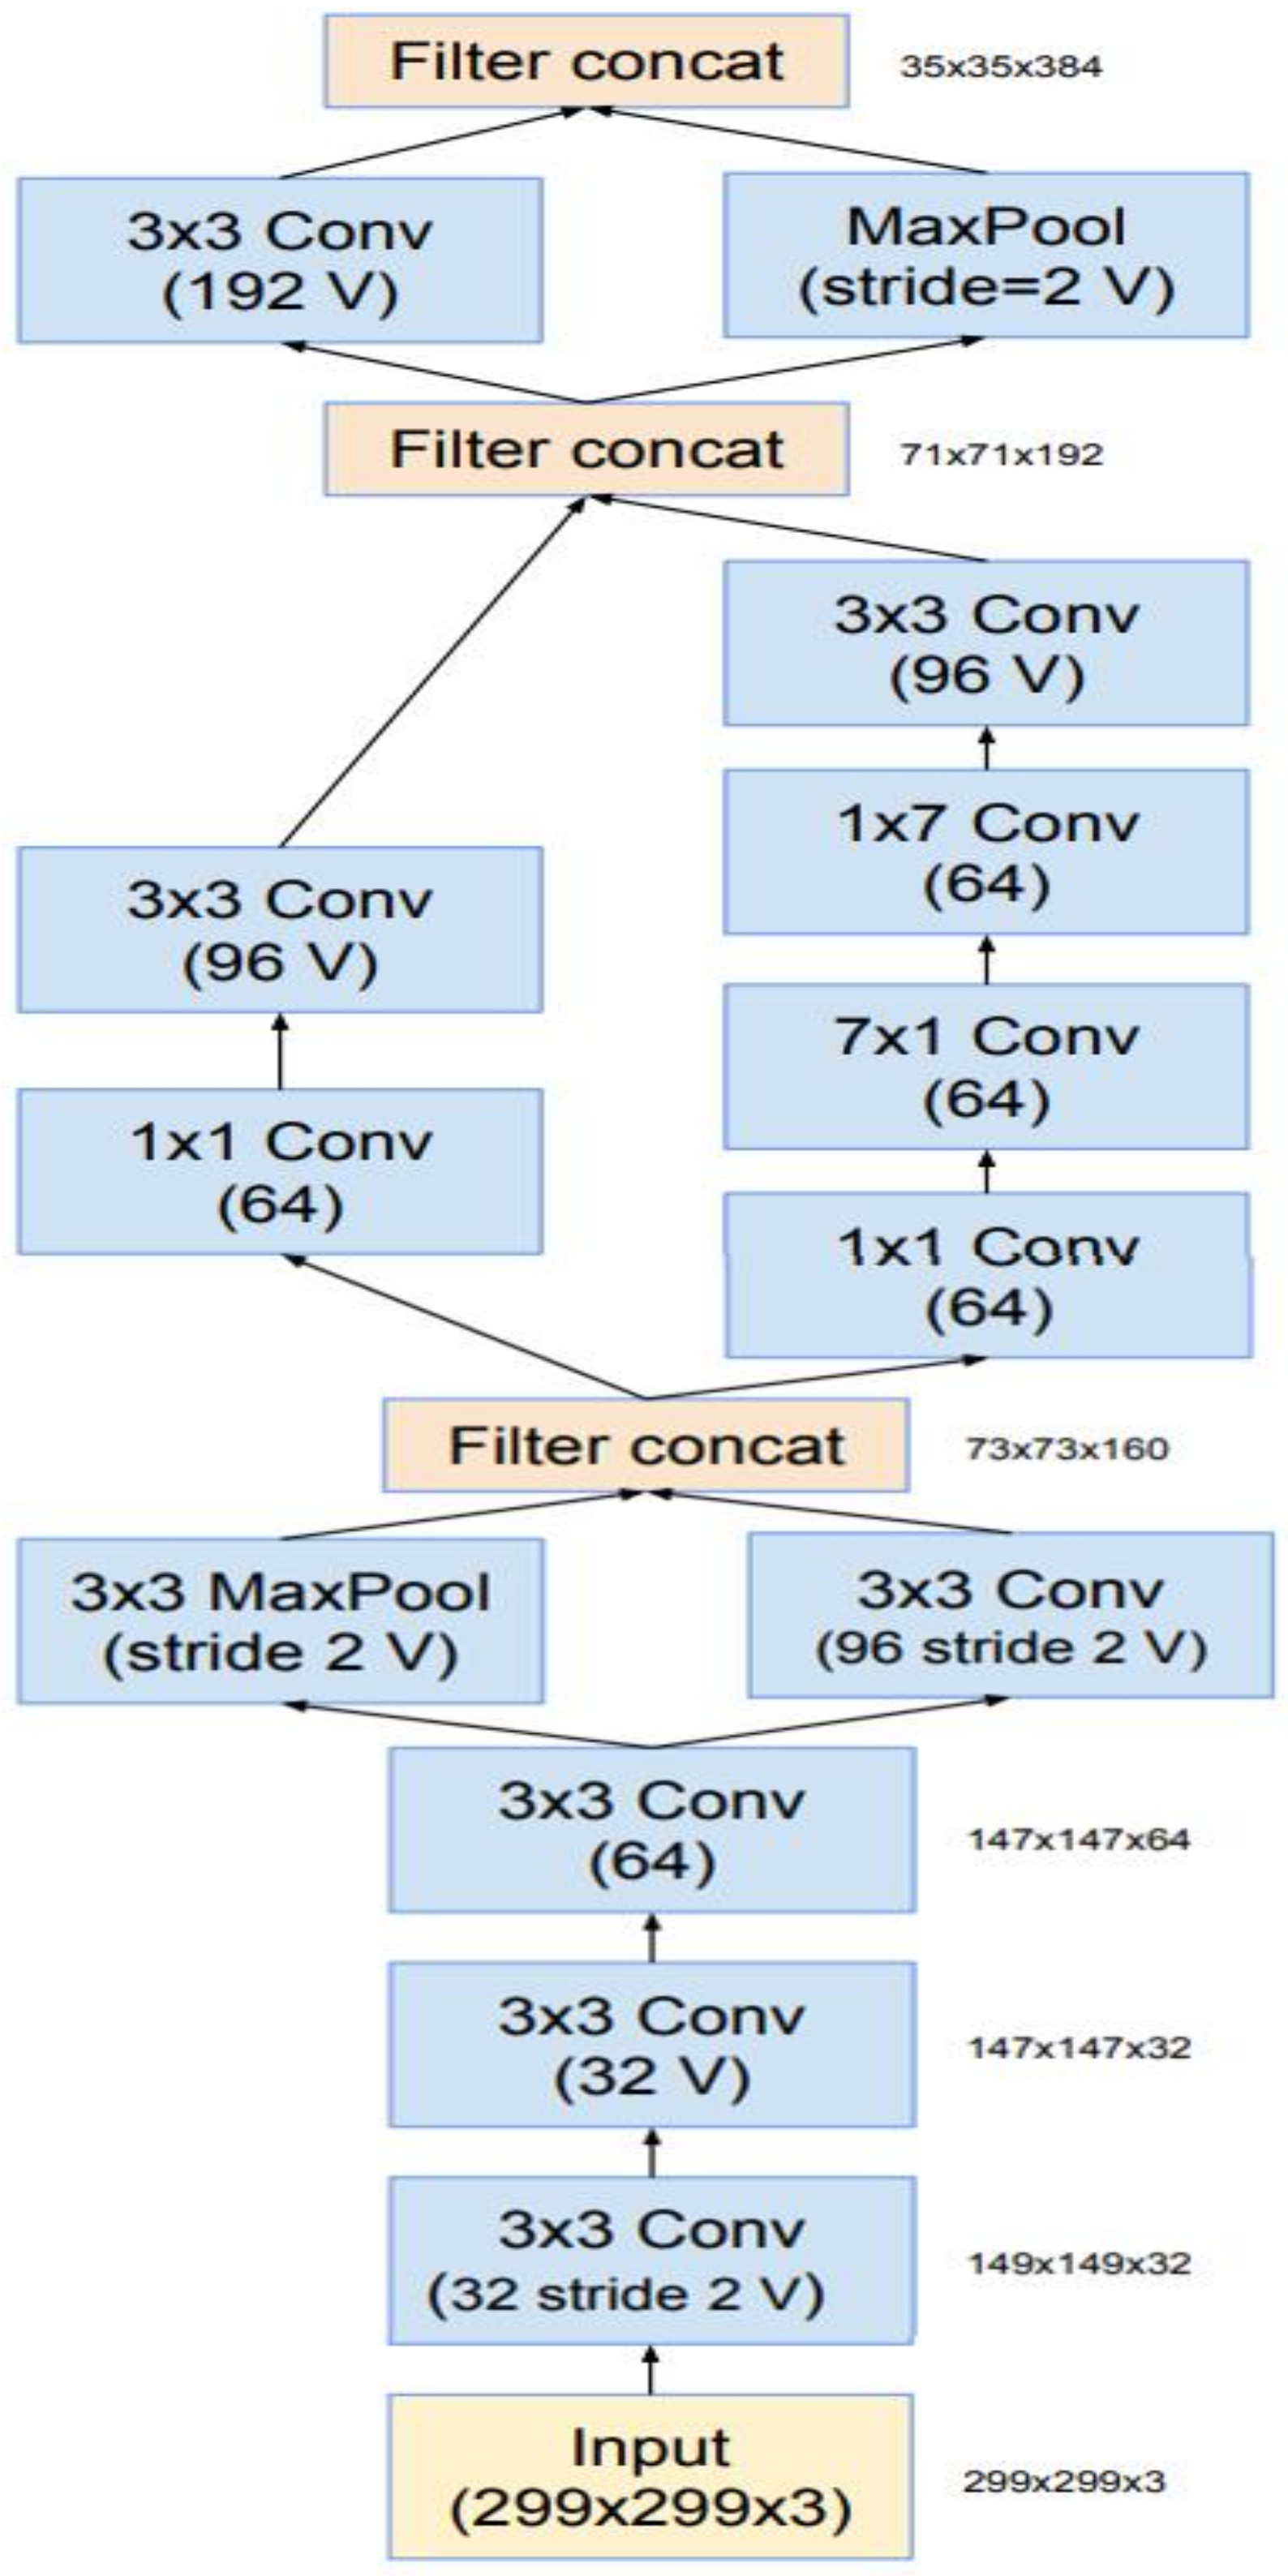
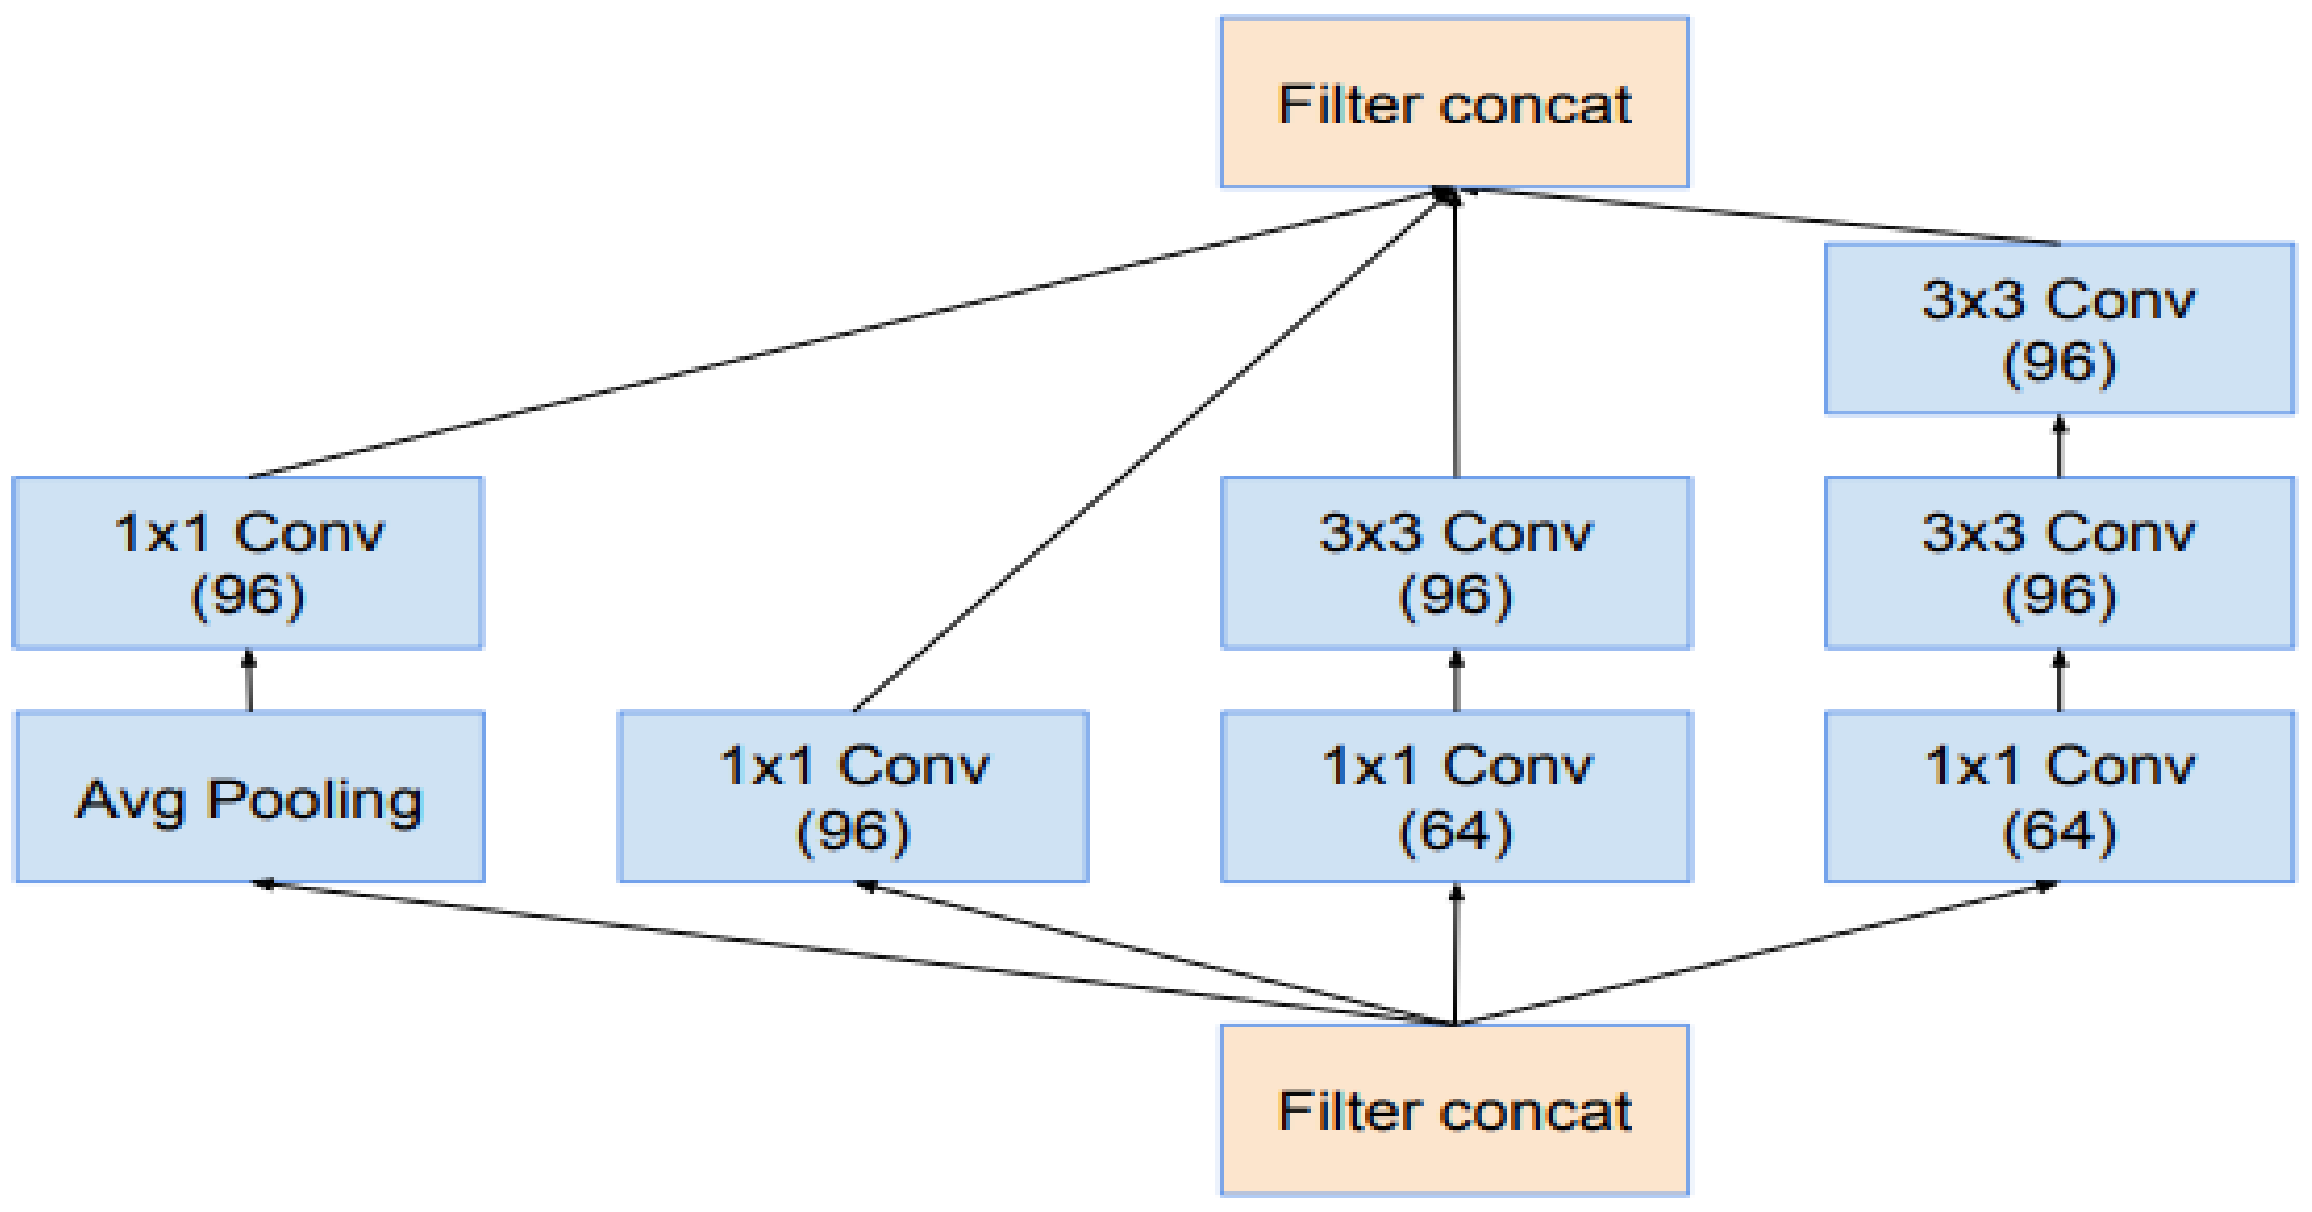
The existing architecture of YOLO-V4 was modified by replacing the CNN model, which is used for feature learning. As a base, the YOLO-V4 model Darknet-53 was used for feature learning. In this research work, the existing YOLO-V4 Darknet-53 architecture was replaced with Inception-v3 to extract more robust facial features and improve the performance of the drive face detection technique. For the head pose detection and eye gaze estimation, two parallel CNN models were used; the first CNN model detecting the head pose was a classification model while the second CNN model was a regression model that estimated the gaze directions vertically and horizontally. For the sake of developing these two models, various state-of-the-art transfer learning approaches were considered and validated by custom datasets. InceptionResNet-v2 achieved the highest accuracy for head pose detection and gaze estimation. For hyperparameter tuning, the model was trained several times with different hyperparameters. The developed model was tested in various challenging environments, i.e., low illumination, high illumination, noisy images, scale and translation changes of face regions; the proposed model performed the best by outperforming the CNN model by achieving the highest accuracy for head pose detection and the least RMSE for eye gaze estimation.
The objective of this study was to create a research framework that could improve the performance of driver gaze detection using head poses and eye gazes; the first and most important step was to accurately detect the driver’s face, which was done using a YOLO object detector. For the driver, head pose transfer learning in the InceptionResNet-v3 CNN model was performed by replacing the number of nodes from 1000 to 7 and discarding all ImageNet data. Similarly, the same CNN model was used for eye gaze direction estimation; the difference between the CNN classification and the regression model is based on the last layer; the last two layers of the CNN classification model were replaced with a single regression layer of two nodes, where the first node estimated vertical eye angles and the second node was responsible for horizontal eye gaze angle estimation. The development of a custom benchmark dataset was the main objective of this study. A total of three datasets were developed; the first was used to train and validate the face detection system based on YOLO, the second dataset has seven classes, used for the head pose detection; the third (and final dataset) consists of face images with the driver’s eyes (horizontal and vertical directions).


 ,
, 


