Article

Integrating Species Distribution Models to Estimate the Population Size of Forest Musk Deer (Moschus berezovskii) in the Central Qinling Mountains of Shaanxi

1
College of Forestry, Northwest A&F University, No.3 Taicheng Road, Yangling 712100, China
2
College of Life Sciences, Northwest A&F University, No.22 Xinong Road, Yangling 712100, China
*
Author to whom correspondence should be addressed.
Diversity 2023, 15(10), 1071; https://doi.org/10.3390/d15101071
Submission received: 6 September 2023 / Revised: 27 September 2023 / Accepted: 28 September 2023 / Published: 9 October 2023
(This article belongs to the Topic Ecology, Management and Conservation of Vertebrates)

Abstract

:
Understanding the population size of animals is crucial for formulating scientific management policies, especially for endangered species. The central area of the Qinling Mountains in Shaanxi is a vital area for forest musk deer, but research is insufficient and estimates of its population size are lacking. In this study, we constructed a species distribution model for the forest musk deer in the central Qinling Mountains in Shaanxi using topography, land-use, and bioclimatic variables alongside forest musk deer occurrence data. The Time-to-Event (TTE) model was employed to estimate the population density of forest musk deer in the selected survey area. By utilizing the suitable habitat area provided by the species distribution model, the population density in the central Qinling Mountains of Shaanxi was estimated by extrapolating from the survey area. Our estimate of the population size of forest musk deer in the central Qinling Mountains of Shaanxi is approximately 2722 ± 788. Similar population estimation methods could be more widely applied, especially in areas with limited survey resources.

1. Introduction

The forest musk deer (Moschus berezovskii) belongs to the Moschidae family in the Artiodactyla [1]. It is found in Central and Southwestern China, as well as northeastern Vietnam [2,3]. Due to severe poaching and habitat loss, the number of forest musk deer has been decreasing [4,5]. In the 1950s, the wild forest musk deer population was estimated to be between 2 and 3 million; by the 1980s, it had dropped to below 600,000; and in the 2010s, there were approximately 50,000 [6]. Currently, the forest musk deer is listed as an endangered species on the IUCN Red List and urgently needs stronger protection [7,8].
Understanding population size is essential for wildlife conservation efforts [9,10]. In reality, since every field survey requires considerable effort, it is sometimes impractical to intensively survey the entire research area [11]. This presents a significant challenge for large-scale population assessments. More commonly, researchers have broader species occurrence data from sources such as citizen science, historical literature, news reports, etc., while conducting intensive field surveys in smaller areas [12]. Scientifically combining these data sources to obtain broad population estimates is an essential and practical application.
Due to the secretive nature and low density of the forest musk deer, coupled with their partial habitats (such as extremely steep slopes) which are difficult for humans to access [13,14], it is challenging to observe or survey all of the individuals using traditional methods like transect or strip methods [10,15]. Recently, an increasing number of studies have proposed using analysis methods based on camera traps to estimate population sizes [16,17,18]. Remote cameras are non-invasive, function continuously over protracted periods, save manpower, and can monitor animals day and night [19,20]. Recently developed methods allow the use of camera trap data to estimate the abundance/density of individuals without distinctive markings [10,21], such as the forest musk deer. The Time-to-Event (TTE) model is one such model that has been applied in several studies, including those on low-density species [22].
The central area of the Qinling Mountains in Shaanxi is a vital distribution area for the forest musk deer. Nevertheless, besides the national survey of terrestrial wildlife resources over a decade ago [23], there have been no recent estimates of the population size of the forest musk deer in this area. It is imperative to estimate the population size of the forest musk deer in the central area of the Qinling Mountains in Shaanxi for conservation purposes. In this study, we aimed (1) to employ the TTE model to calculate the population density of forest musk deer within the survey area, (2) to utilize species distribution models to estimate the suitable habitat area for forest musk deer in the central Qinling Mountains of Shaanxi, providing vital data related to the distribution of forest musk deer, (3) to innovatively combine the calculated population density with the suitable habitat area for the forest musk deer in the central Qinling Mountains in Shaanxi in order to estimate the population size of forest musk deer in the region. This provides foundational data for conservation efforts and scientific grounds for future researchers to estimate population sizes.

2. Materials and Methods

2.1. Research Area

The Qinling Mountains act as the geographical, climatic, and biogeographical boundary between Northern and Southern China [24], and also as the watershed between the Yangtze and Yellow River basins. Its main body is located in southern Shaanxi [25]. The Qinling Mountains are the climate transition belt in China where the typical subtropical zone changes gradually toward the warm temperate zone and the humid zone changes gradually toward the semi-humid zone [26]. This significant delineation has resulted in the Qinling Mountains being listed as a key area of terrestrial biodiversity of global importance [27].
Presently, the Qinling Mountains are known to host 94 species of mammals, constituting 18.5% of the total species in the country; 338 species of birds, making up 28.4% of the national total; over 68 species of amphibians and reptiles, accounting for 8% of the total species in China; and over 100 species of fish [25]. The Qinling Mountains also house 3451 species of seed plants, 311 species of mosses, and over 270 species of ferns. The Qinling Mountains provide refuge to seven species of wild ungulates, including the forest musk deer; golden takin (Budorcas taxicolor bedfordi), Chinese goral (Naemorhedus griseus), mainland serow (Capricornis milneedwardsii), tufted deer (Elaphodus cephalophus), reeves muntjac (Muntiacus reevesi), and wild boar (Sus scrofa) [28].
The central region of the Qinling Mountains in Shaanxi, located between 106°24′ E and 111°15′ E longitude and 32°58′ N and 34°24′ N latitude (Figure 1), contains the most important forest areas in Shaanxi and is an essential distribution area for the forest musk deer.

2.2. Species Distribution Model

Species Distribution Models (SDMs) leverage the relationships between environmental factors and species occurrence points to estimate species niches and project them onto the landscape [29,30]. This allows for the establishment of predictive models to analyze habitat suitability, species habitat preferences, and occurrence probabilities, among others [31,32]. The MaxEnt model is one such species distribution model. This model was first proposed by Phillips in 2006 [33]. It is not only versatile in operation but also boasts high predictive accuracy. As such, it has garnered the favor of many scholars and is widely used in species distribution simulations [34,35]. In this study, the occurrence data of the forest musk deer, combined with topographical variables, land-use variables, and bioclimatic variables, are incorporated into a MaxEnt model, aiming to calculate the suitable habitat area for the forest musk deer.

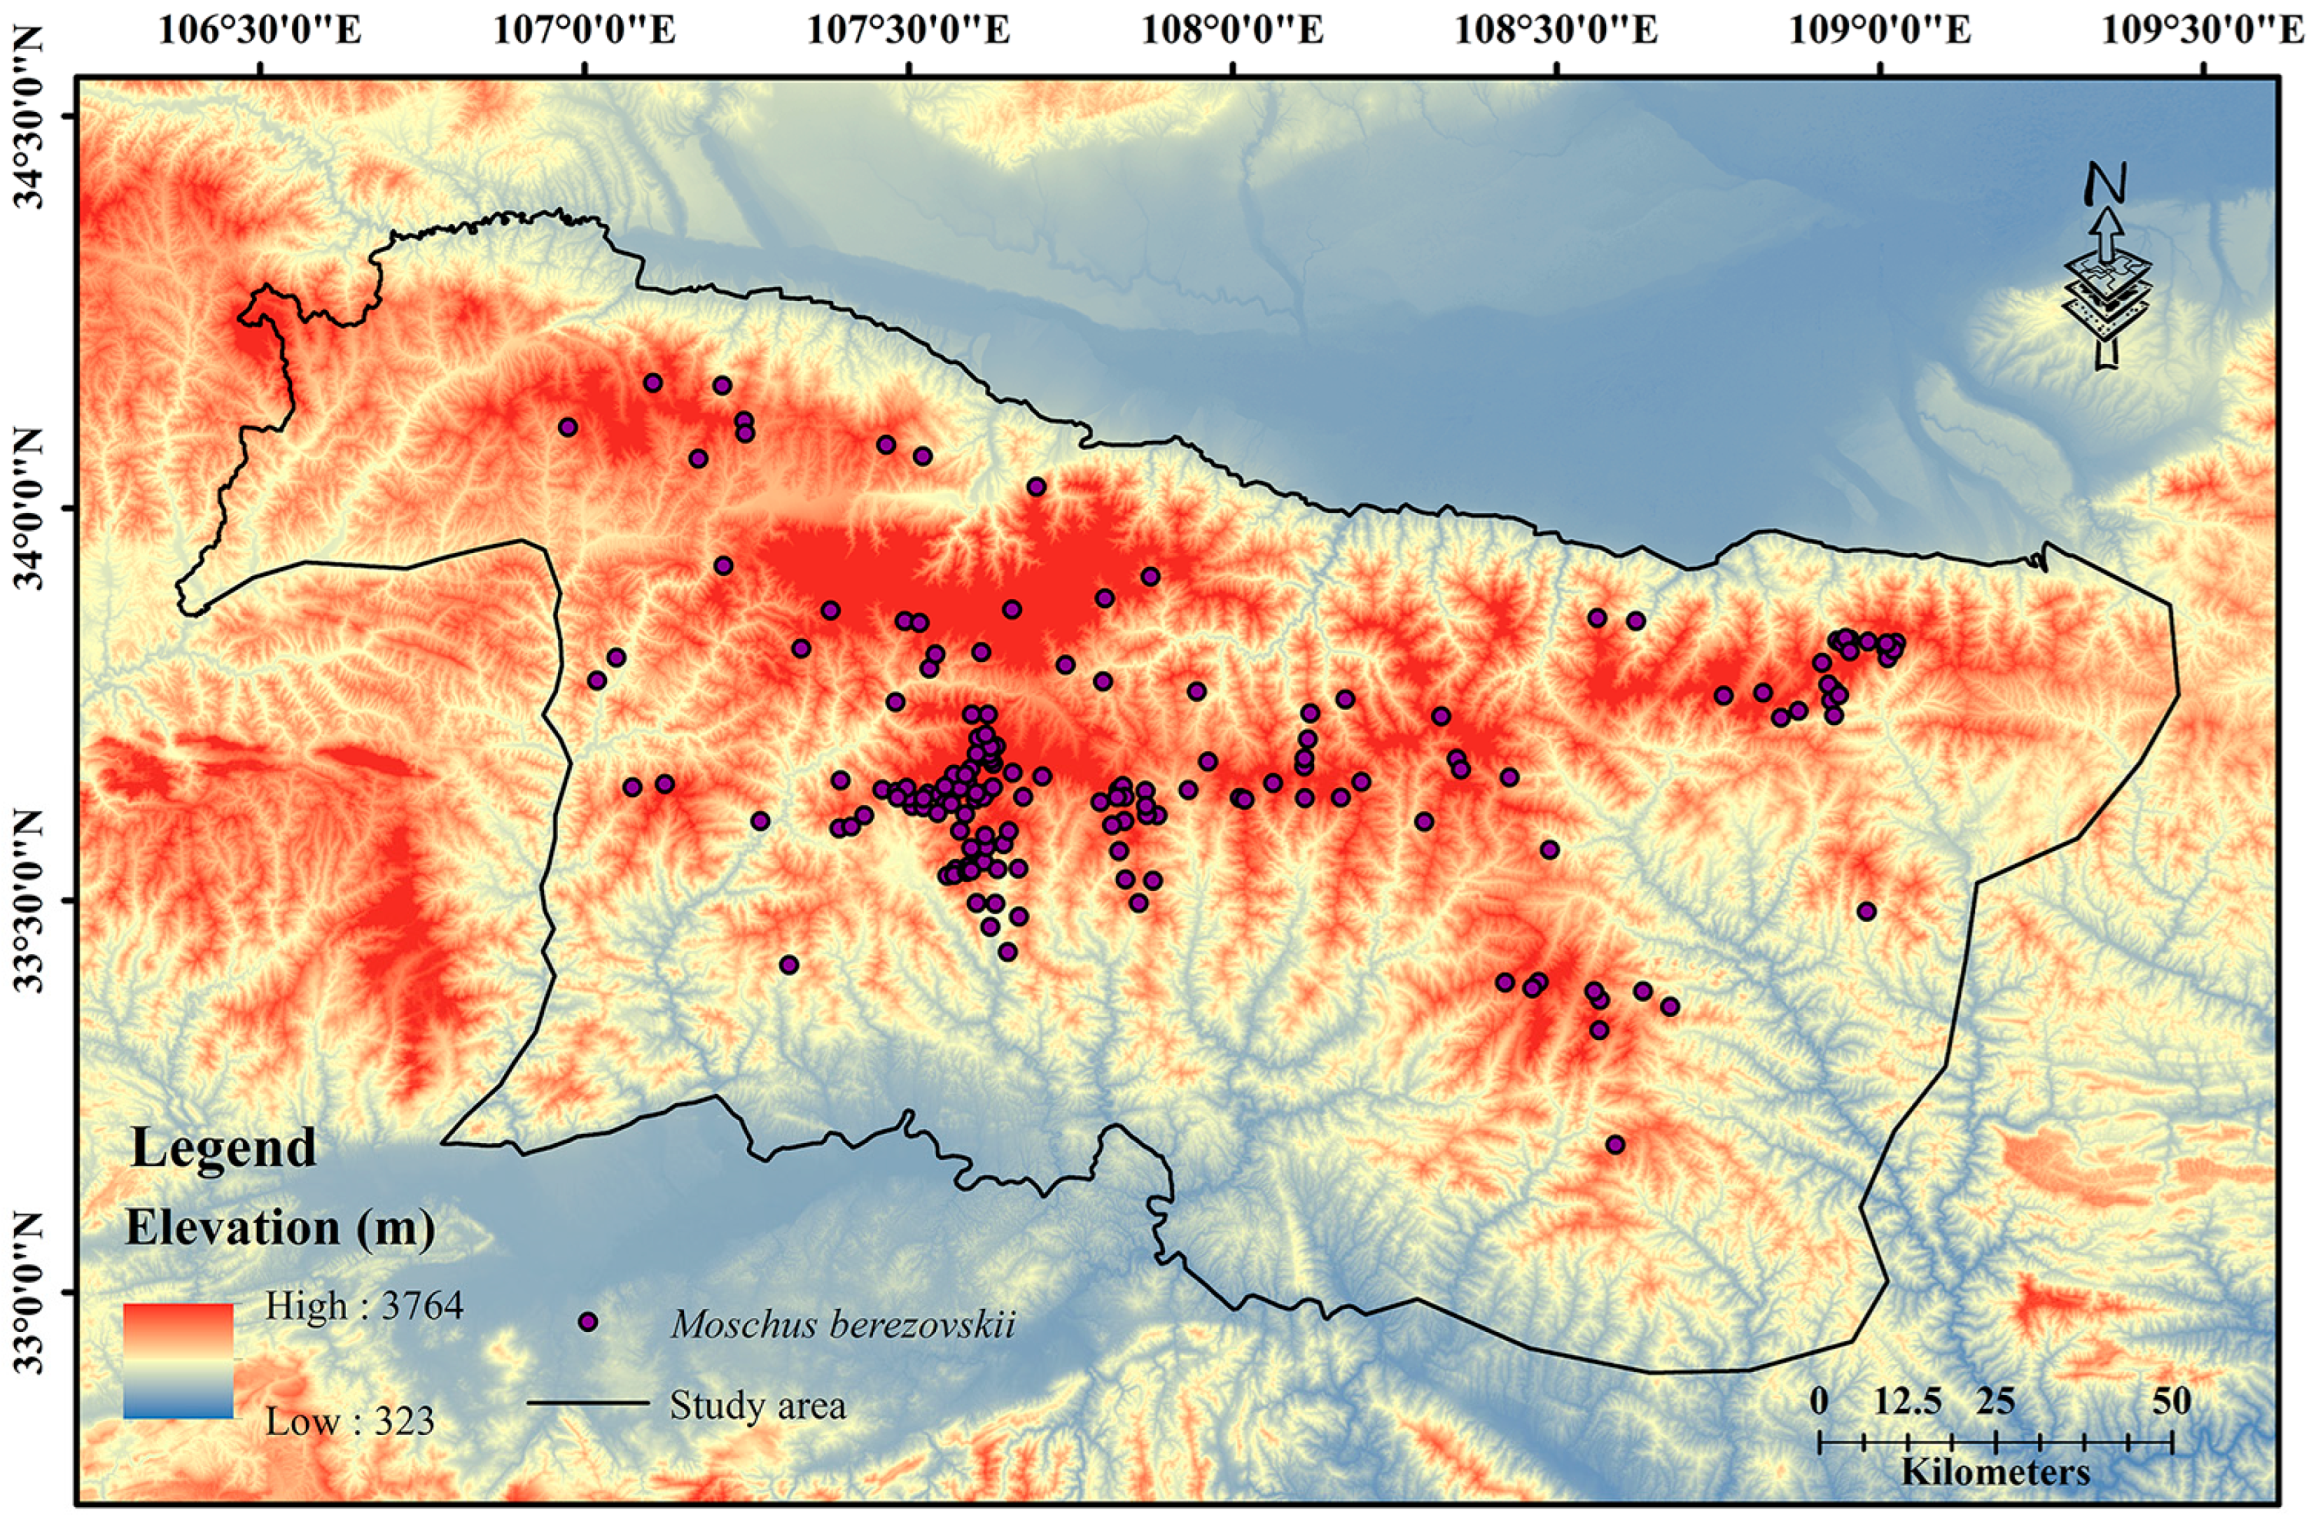
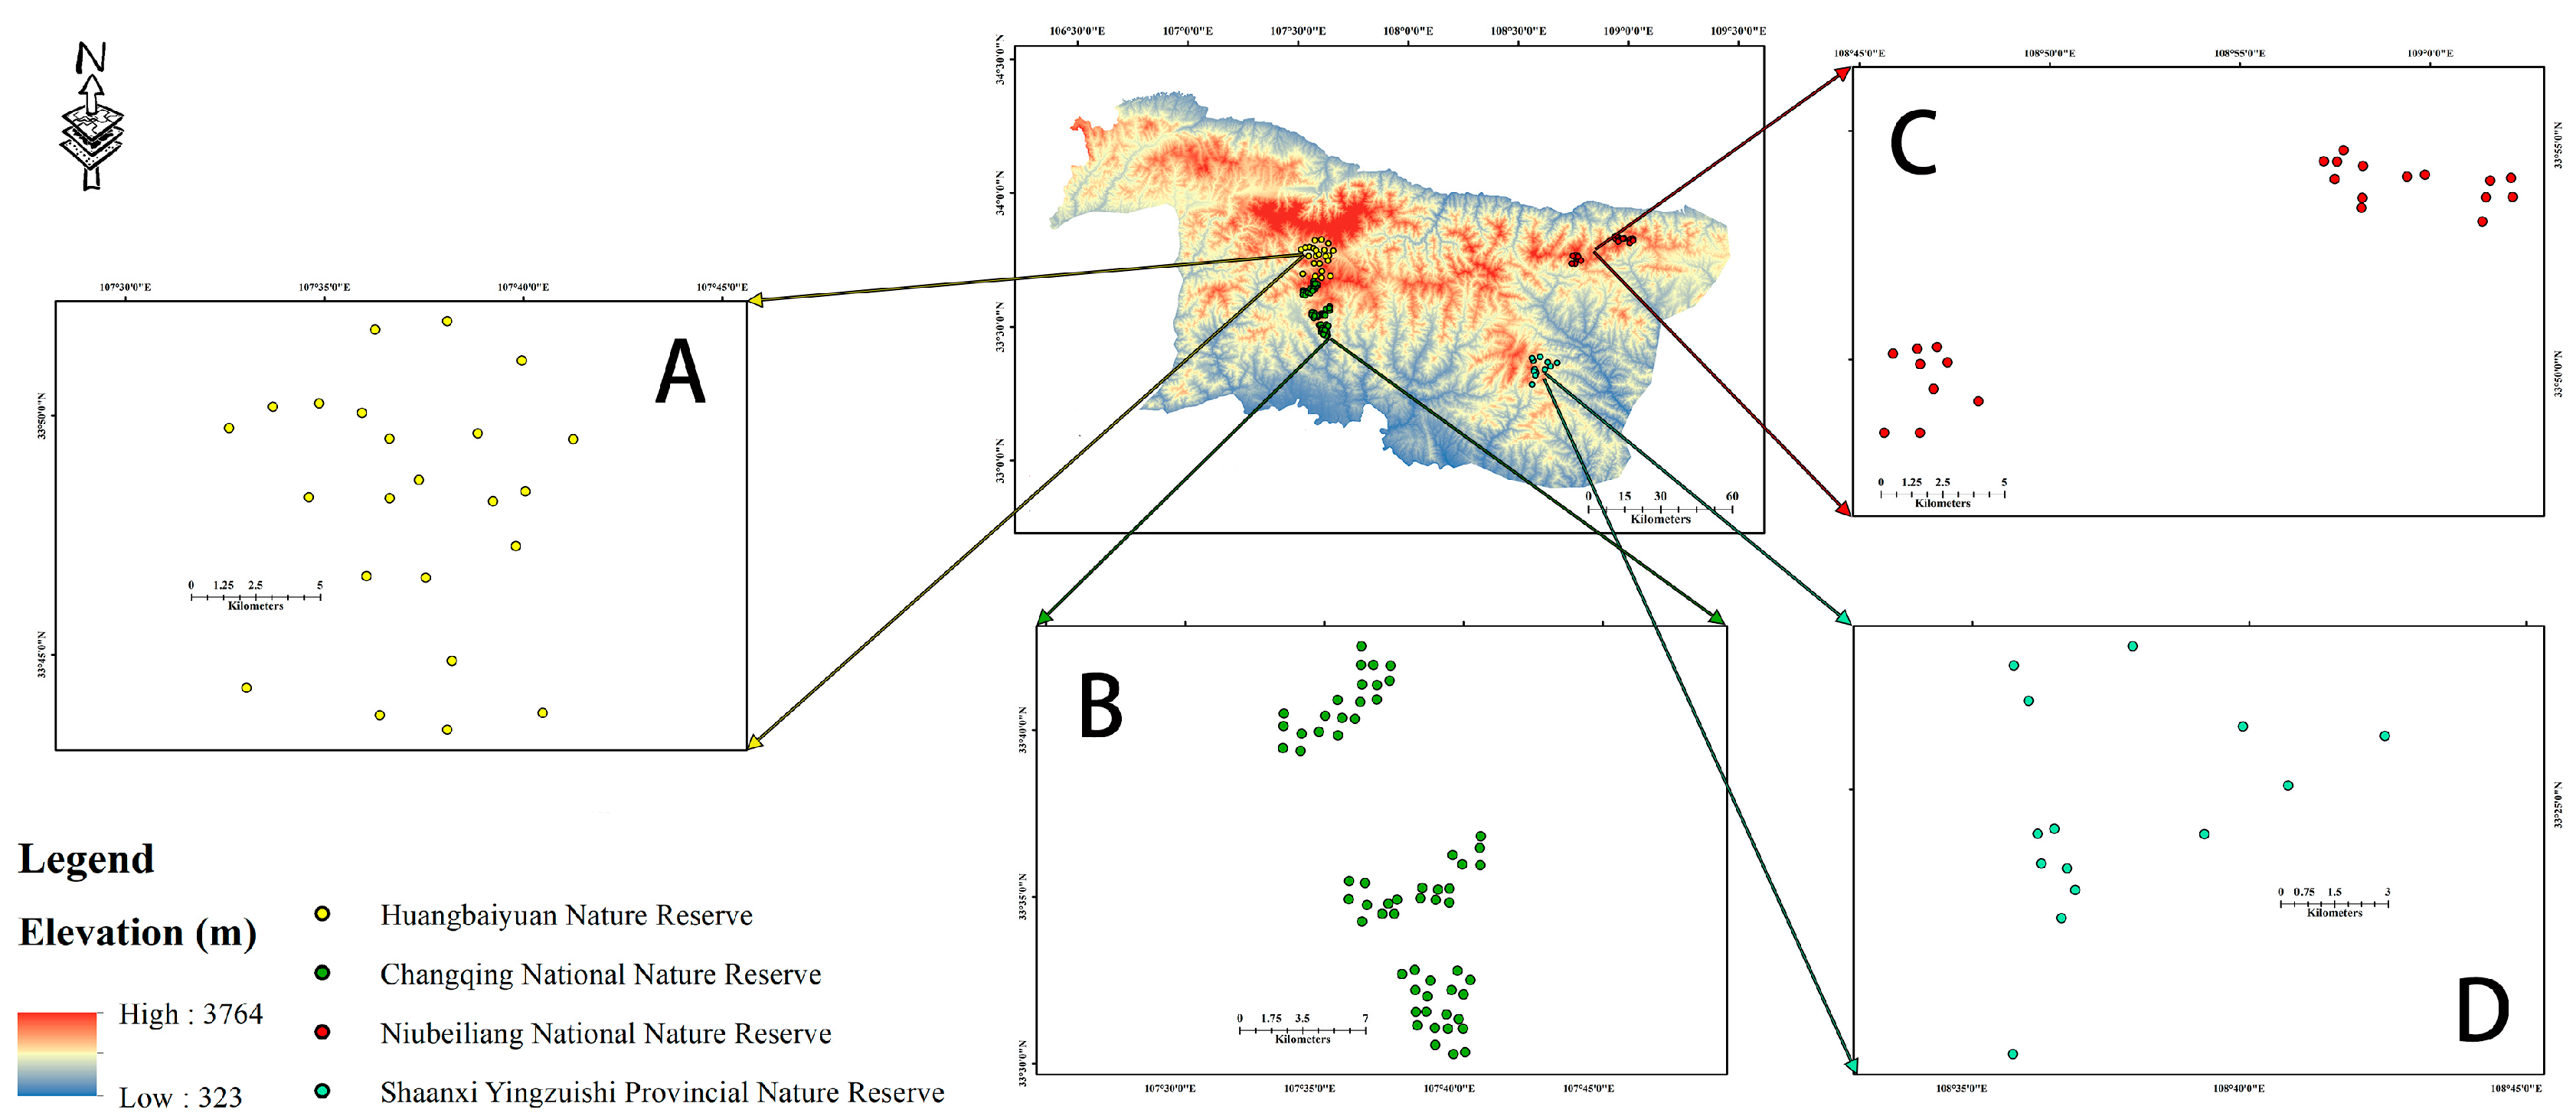
2.2.1. Forest Musk Deer Occurrence Data

We collected a total of 205 occurrence points for the forest musk deer in the central Qinling Mountains of Shaanxi. Among them, 115 were from 2015–2021 camera trap monitoring data, 8 were from a 2021–2022 sample line survey, and 82 were from the historical literature [36,37]. To prevent spatial autocorrelation, records were filtered using the SDMtoolbox plugin in ArcGIS. The spatial filtering range was set to 1 km2, based on the home range area of the forest musk deer [38]. After filtering, 167 spatially independent forest musk deer occurrence points were obtained (Figure 1).

2.2.2. Environmental Variable Data

Nineteen bioclimatic variables, three topographical variables (elevation, slope, slope direction), land-use, and distances to water systems were considered as environmental factors in the central Qinling Mountains of Shaanxi (Table S1). Using R (version 4.1.1), we analyzed twelve environmental variables using the Variance Inflation Factor (VIF), selecting those with a VIF less than 3 [39]. After filtering, two bioclimatic variables (BIO2, BIO15), three topographic variables (elevation, slope, slope direction), land-use, and distance to water systems remained.
Three topographic variables, elevation, slope, and aspect, were calculated from the 30 m resolution digital elevation data from GDEM V3 (www.gscloud.cn, accessed on 1 June 2023), using ArcGIS spatial analysis tools. To prevent circularity issues with the aspect variable, it was converted to a continuous variable between 0 and 1 using the formula
Aspect = [1 − cos((π/180) × (α − 30))]/2
where α is the circular aspect. This conversion assigns a value of 0 to the coolest and wettest north—northeast slope and a value of 1 to the hotter and drier south—southwest slope [40].
The ENMeval package (version 2.0.3) in R was used to optimize the parameters of the MaxEnt model [41]. The regularization multiplier (RM) was set to 0.5–8, with a 0.5 increase each time. Six feature combination (FC) multipliers were used: L, LQ, H, LQH, LQHP, and LQHPT. Finally, the RM was set to 4 and the FC was set to LQHPT.
A bias file was created using the Gaussian kernel density function in the SDMtoolbox and imported to MaxEnt to correct for sampling bias [42].
The maximum iterations were set to the default value of 500.

2.2.3. Model Evaluation

In total, 25 replications were performed to run the model. The closer the value of the result was to 1, the more suitable the area was for forest musk deer survival [43]. A binary habitat suitability map was created using the maximum training sensitivity plus specificity Cloglog threshold [44,45]. The variable contributions were assessed using the jackknife test.
Model performance was assessed based on the area under the curve (AUC) of the receiver operating characteristic (ROC) curves and true skill statistic (TSS). An AUC closer to 1 indicated better performance [46]. TSS ranges from −1 to 1, and TSS values closer to 1 indicate higher prediction accuracy of the model [47]. When TSS is greater than 0.75, model performance is very good.

2.3. Estimation of Forest Musk Deer Population

2.3.1. Camera Traps Survey

Four representative areas of forest musk deer in the central Qinling Mountains of Shaanxi were selected as the survey areas. In total, 135 camera traps were deployed across these sites to record the activity of the forest musk deer (Figure 2).
From August 2016 to June 2017, 37 camera traps were deployed in the Huangbaiyuan Nature Reserve. From February to May 2021, 60 camera traps were deployed in the Changqing National Nature Reserve. From April 2020 to April 2021, 24 camera traps were deployed in the Niubeiliang National Nature Reserve. From February to May 2022, 14 camera traps were deployed in the Shaanxi Yingzuishi Provincial Nature Reserve.
All camera traps points were placed more than 500 m apart without any bait. The average maximum detection range of the camera traps was 18 m, with an average FOV of 55 degrees.

2.3.2. Estimation of Forest Musk Deer Population Density in the Survey Area

The TTE model requires an estimate of the animal’s movement speed to set appropriate sampling periods [22]. The movement speed of the forest musk deer was calculated by multiplying the travel speed (μ) by the proportion of active time spent (p). The travel speed (μ) was determined by dividing the distance travelled while in the detection zone by the time the animal was seen on the video. The proportion of time spent active (p), and its variance, was obtained using the R package activity [48]. Ultimately, the sampling periods were set to 15 min, with sampling occasions of 1 day, and a total of 96 sampling periods.
R was used for the analysis of the TTE model. To avoid violating the demographic and geographic closure assumption of the TTE model [22], the mating season of the forest musk deer from October to January was excluded from the analysis [49].

2.3.3. Model Accuracy Assessment

At the Shaanxi Yingzuishi Provincial Nature Reserve site, we conducted a long-term census of the forest musk deer population in 2022. We searched for traces of forest musk deer through sightings, tracks, and infrared cameras and identified individual forest musk deer through sightings and infrared camera photos, combined with the territoriality of the forest musk deer. Eventually, we determined the accurate number of forest musk deer to be four.
On the other hand, using the TTE model, the number of forest musk deer within the site was calculated. This estimate was compared to the actual number obtained through the forest musk deer census to assess the model’s accuracy.

2.3.4. Integrating Density Estimation with the Species Distribution Model

The average population density of the forest musk deer in the survey area was calculated and extrapolated to the central Qinling Mountains of Shaanxi to estimate the overall population of the forest musk deer. The specific calculation formula is as follows:
N = D × S
where
N represents the number of forest musk deer in the central Qinling Mountains of Shaanxi,
D represents the average population density of the forest musk deer in the survey area, and
S represents the area of suitable habitat for the forest musk deer in the central Qinling Mountains of Shaanxi.

3. Results

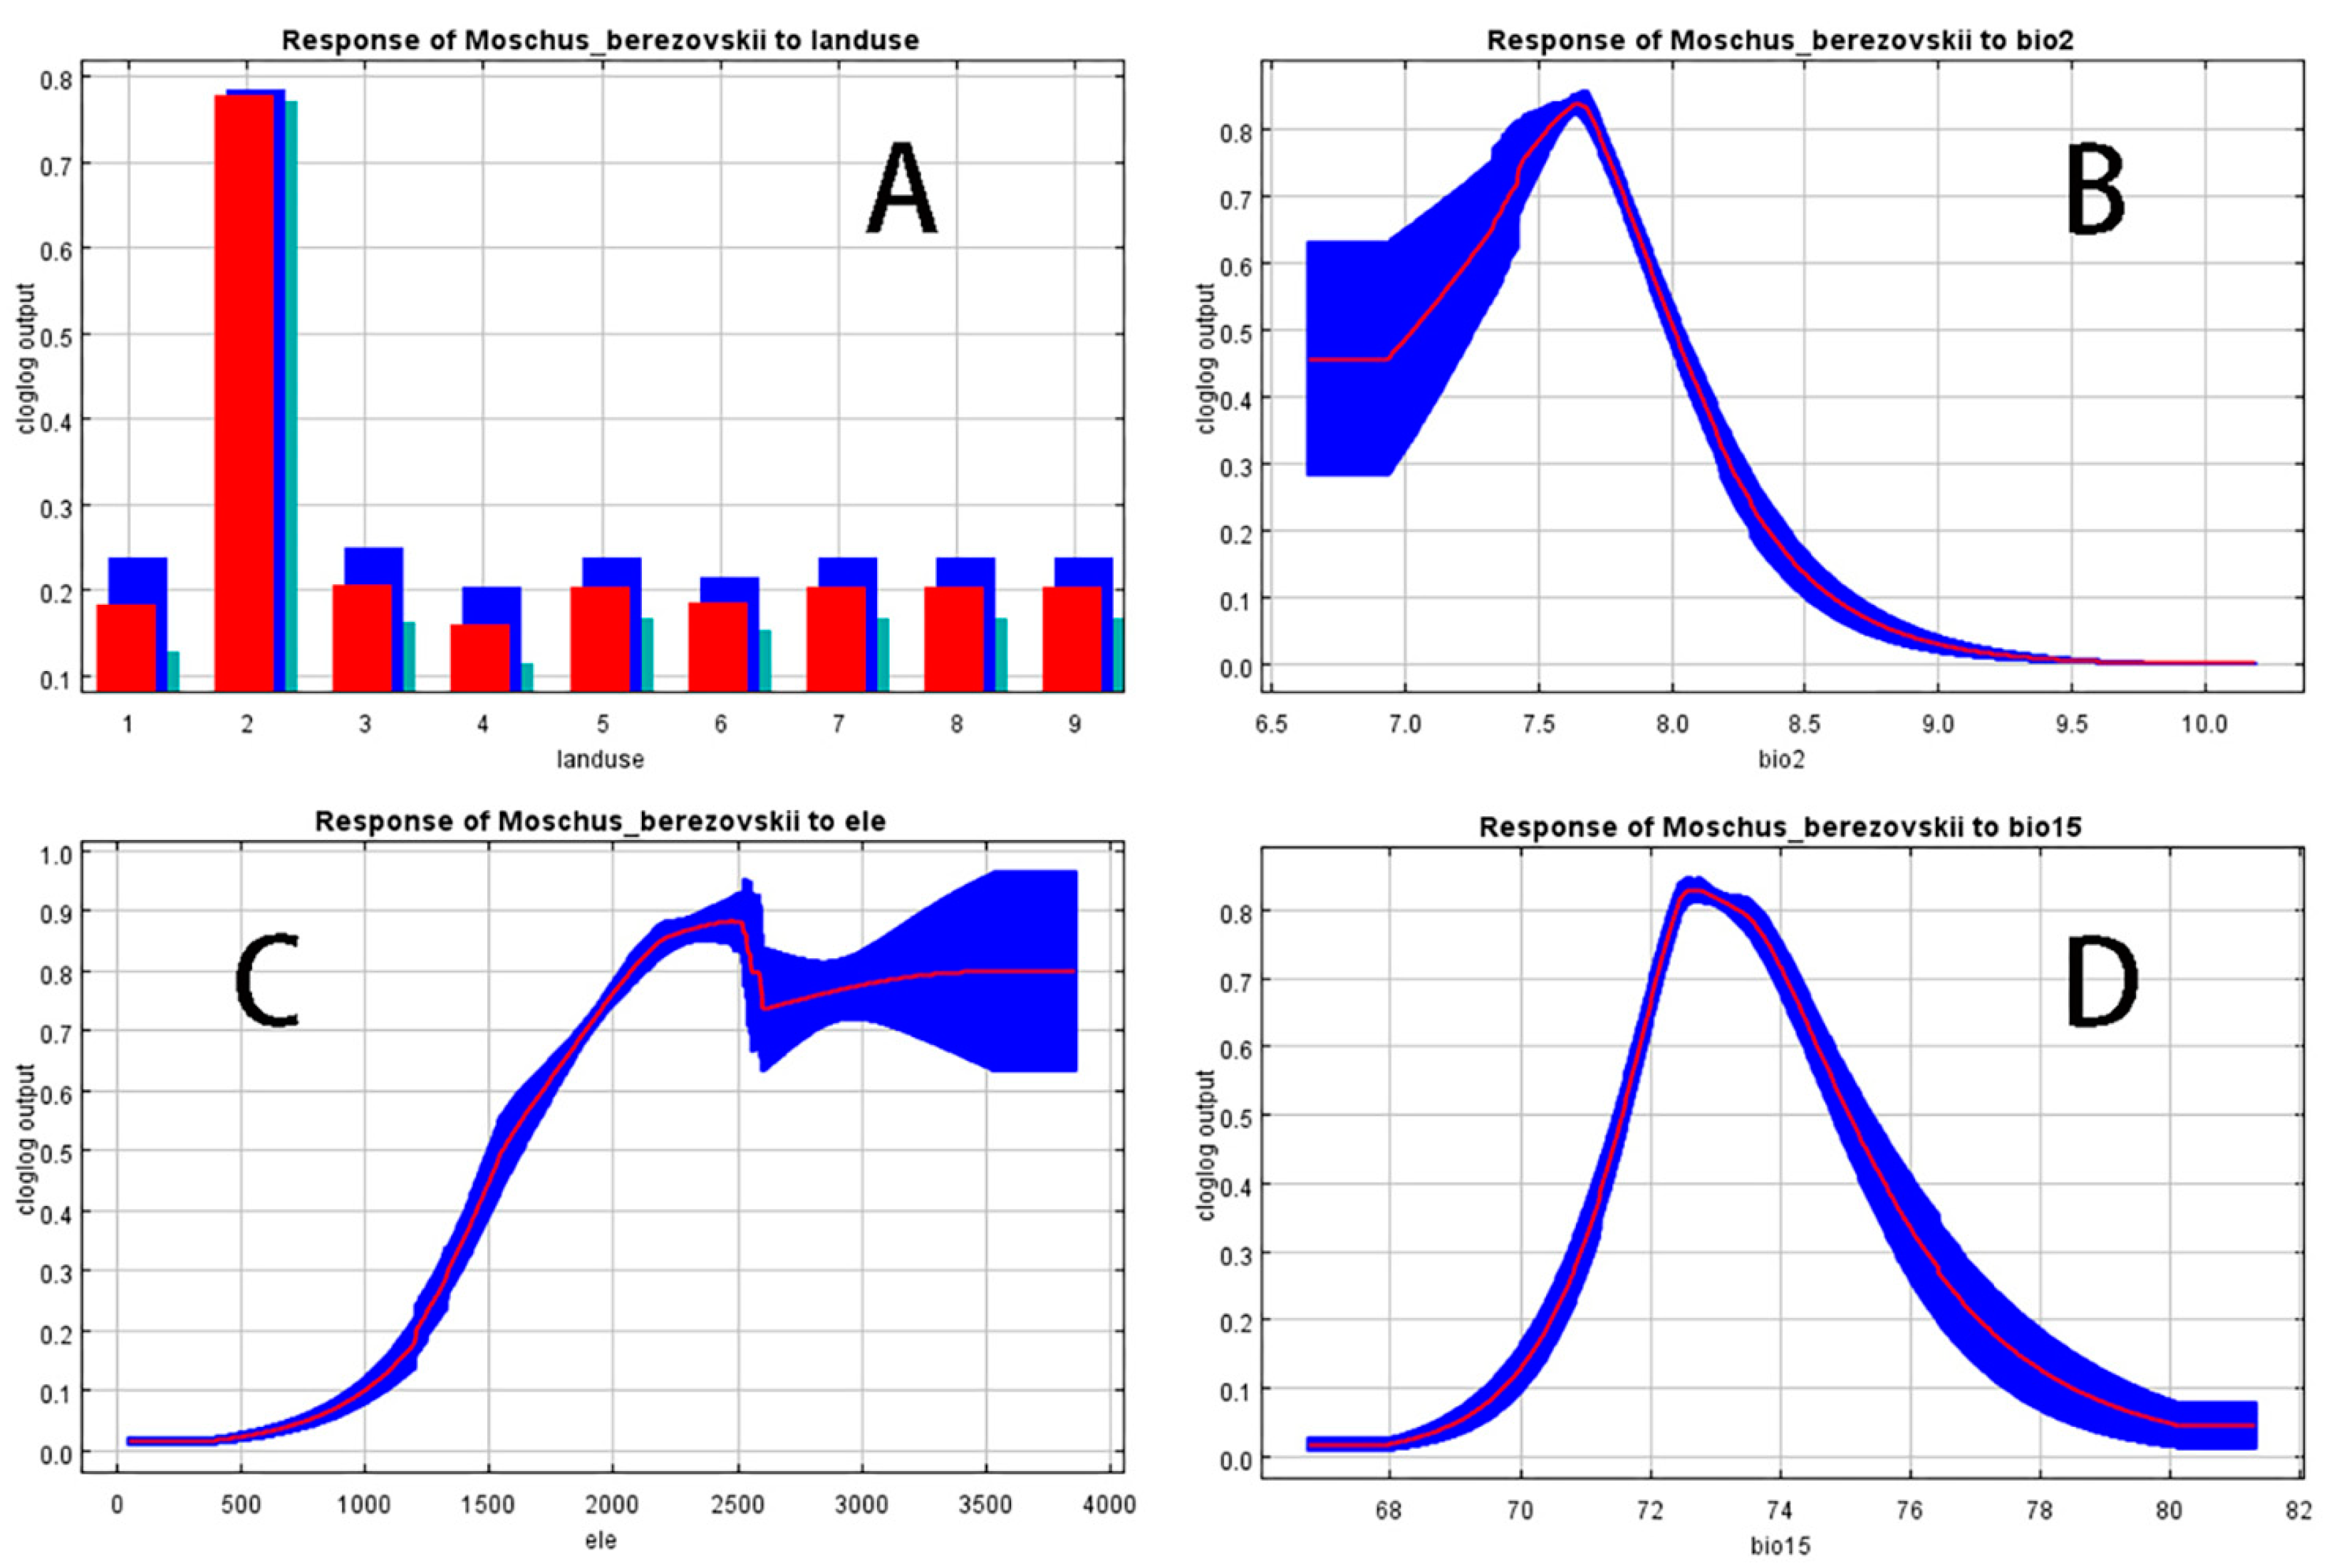
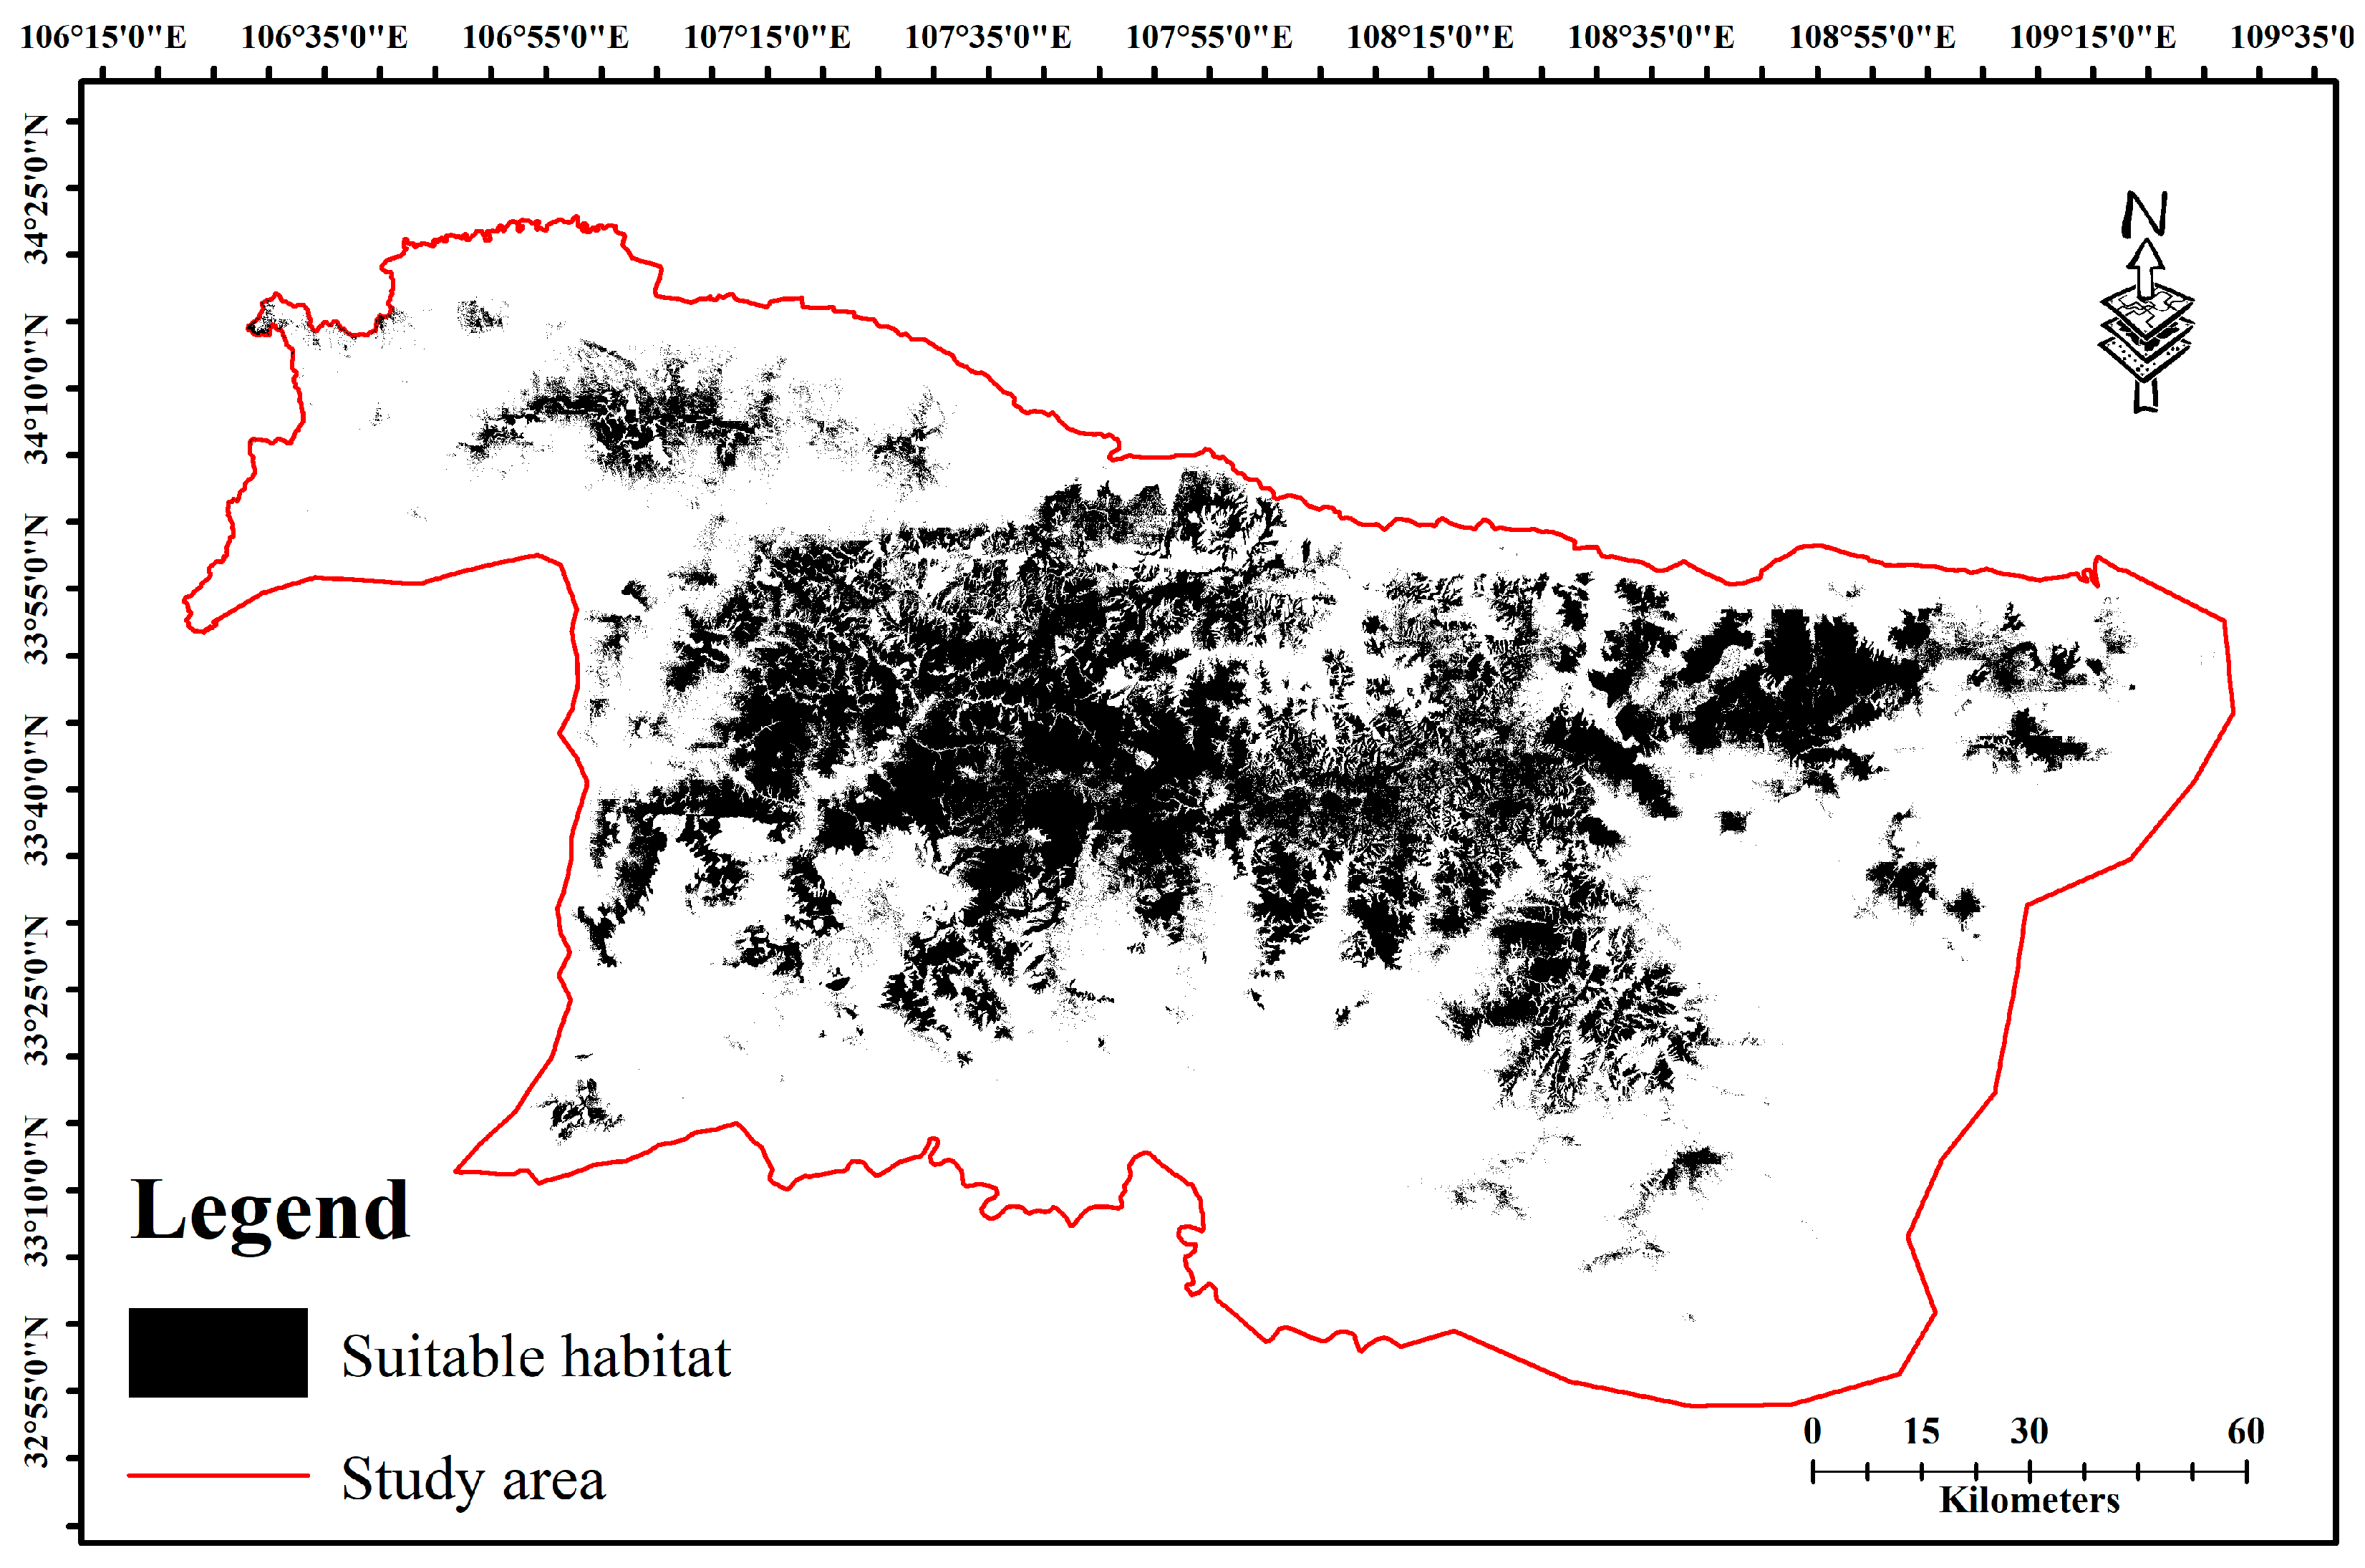
3.1. Species Distribution Model

The AUC value of the MaxEnt model was 0.884, and the mean TSS was 0.763, indicating that the accuracy of prediction was found to be “excellent”.
Results from the Jackknife test showed that when used in isolation (Figure 3), the variable with the highest gain is BIO2 (mean diurnal range of temperature), followed by land-use, elevation, and BIO15 (seasonality of precipitation). The model performed significantly worse after removing the land-use variable, suggesting that land-use provided the most effective information.
By analyzing the response curves of environmental variables, the suitable range of environmental variables for forest musk deer habitats can be elucidated. The four most important environmental variables for forest musk deer were selected for response curve analysis (Figure 4).
Figure 4A shows that forest is the most suitable land-use type for forest musk deer.
Figure 4B indicates that forest musk deer are most likely found in areas with a mean diurnal range of 7.75 °C.
Figure 4C shows that the suitability gradually increases with an elevation gradient from 0 to 2500 m, peaks at 2500 m, then declines and slowly rises at around 2600 m.
Figure 4D reveals that the most suitable seasonality of precipitation for forest musk deer is around 72.5.
The suitable habitat area for the forest musk deer in the central Qinling Mountains of Shaanxi is approximately 6189.76 km2 (Figure 5). This suitable habitat is primarily located in the central part of the research area, with a relatively concentrated distribution.

3.2. Population Estimation

3.2.1. Camera Traps Method

Based on the TTE model calculations, we found the following:
The population abundance of forest musk deer in the Huangbaiyuan Nature Reserve was estimated at 59.4272 ± 13.4721 individuals, with a population density of approximately 0.6064 ± 0.1375 individuals/km2.
In the Changqing National Nature Reserve, the population abundance is 17.8599 ± 6.3224 individuals, with a population density of approximately 0.2977 ± 0.1054 individuals/km2.
The Niubeiliang National Nature Reserve has an estimated population abundance of 11.1912 ± 4.5676 individuals, with a population density of about 0.3197 ± 0.1305 individuals/km2.
In the Shaanxi Yingzuishi Provincial Nature Reserve, the population abundance was estimated at 4.3180 ± 1.6279 individuals, with a density of about 0.2399 ± 0.0900 individuals/km2.

3.2.2. Model Accuracy Estimation

The TTE model estimates a forest musk deer population abundance of 4.3180 ± 1.6279 individuals in the Shaanxi Yingzuishi Provincial Nature Reserve. When compared to the actual number of forest musk deer in this area, which is four, it can be observed that the number of forest musk deer calculated by the TTE model is overestimated by 7.95%. However, the confidence interval of this estimation overlaps with the true value.

3.2.3. Integration of Density Estimation and Species Distribution Model

Upon calculation, the Habitat Suitability Index (HSI) for the locations where the camera traps were placed ranged from 0.577 to 0.994. This essentially covers the upper and lower limits of the HSI values in suitable habitats, indicating high representativeness.
The estimated density of forest musk deer in the survey area is shown in Table 1.
After calculation, the average density of the forest musk deer in the survey area is approximately 0.4398 ± 0.1232 individuals/km2. According to the results of the MaxEnt model, the total area of suitable habitats for the forest musk deer in the central Qinling Mountains of Shaanxi is approximately 6189.76 km2. Using the formula N = D × S, the forest musk deer population in the central Qinling Mountains of Shaanxi was estimated to be around 2722 ± 788 individuals.

4. Discussion

4.1. Species Distribution Model

The MaxEnt model results reveal that the significant influencing factors for the distribution of forest musk deer in the central Qinling Mountains of Shaanxi are elevation, BIO2 (mean diurnal range), BIO15 (precipitation seasonality), and land-use, with a suitable habitat area of about 6189.76 km2.
It is widely recognized that land-use and climate factors have a significant impact on the distribution of wildlife. For instance, climate and land-use changes play a significant role together in shaping the spatial distribution patterns of ticks [50]. Liu et al. emphasized the importance of an integrated approach to predicting future species distributions by assessing the combined impacts of future climate and land-use changes on the potential distribution range of the Giant Panda (Ailuropoda melanoleuca) in Sichuan Province, China [51].
Consistent with the findings of previous studies, we discovered that the suitable habitats for forest musk deer are closely related to elevation, forest type, and climate. For instance, forest areas are more suitable for forest musk deer compared to other woodland types, aligning with previous studies [13,37], which could be because closed forest cover can provide more food and safer shelter for them [14]. Additionally, the lower elevation areas are densely populated and have a high level of human activity; therefore, forest musk deer mainly inhabit the middle and higher mountain areas. On the other hand, as some high-elevation areas in certain regions have lacustrine landscapes and forest musk deer are forest-dwelling species [52], such landscapes are evidently unsuitable for the survival of forest musk deer, making an elevation of around 2500 m the most suitable for them.
To enhance the reliability of population estimates, it is imperative to ensure accuracy in calculating the suitable habitat areas. This requires researchers to take into consideration all limiting factors for the survival of the forest musk deer to minimize computational errors. However, currently, there are no studies discussing the combined impact of climate and land-use factors on the forest musk deer. This might lead to the previous predictions of suitable habitats for forest musk deer being inaccurate. After combining land-use and climate factors, this study predicts the suitable habitats for forest musk deer and indicates that the mean diurnal range, elevation, land-use, and precipitation seasonality significantly influence the forest musk deer population. This finding has crucial implications for efforts to conserve the forest musk deer, it not only provides accurate predictions for the suitable habitats of forest musk deer but also emphasizes that maintaining suitable climatic conditions and land-use patterns is equally important when conserving forest musk deer.

4.2. Population Size Estimation

In this study, the TTE model was used to estimate the population density of forest musk deer in the survey area, and by combining this with the suitable habitat area determined using the species distribution model, the average population density in the survey areas was extrapolated to the central Qinling Mountains of Shaanxi. The estimated population size of forest musk deer in the central Qinling Mountains of Shaanxi is 2722 ± 788 individuals.
High-quality data are vital. Due to the elusive and low-density nature of forest musk deer, traditional survey methods, such as transect or strip methods, rarely allow for direct sightings of the forest musk deer in the field [52]. Fecal count could be a useful and straightforward method, but identification based on fecal morphology may lead to misidentification of species. In areas with dense vegetation, feces may be hard to detect [53]. Additionally, the fecal count method requires knowledge of the defecation rate of the target population, which is challenging to ascertain in practice. Recent technological advancements have made camera traps a desirable alternative for estimating animal densities, particularly for models involving unmarked individuals, such as the TTE model, which eliminates the need for individual animal identification [22].
In this study, some remote camera locations were not randomly placed but were positioned around roads or areas where forest musk deer are frequently active. This may introduce unknown biases into the estimation results. However, the comparison between the TTE model calculation results and the actual population size of forest musk deer in the Shaanxi Yingzuishi Provincial Nature Reserve indicates that the TTE model’s estimates were about 7.95% higher than the actual numbers, but the confidence intervals overlapped with the true values, suggesting the TTE model’s estimates are of some referential value.
Due to factors such as localized extinction from hunting and incomplete dispersal throughout all suitable distribution areas, the distribution of species within the suitable habitat areas may not be uniform. Hence, it is crucial to ensure that the chosen small-scale intensive survey area accurately represents the broader suitable habitat areas. In this study, the HSI values for the chosen locations where camera traps were set up ranged from 0.577 to 0.994, which essentially covers the upper and lower limits of the HSI values for suitable forest musk deer habitat, which suggests a high level of representativeness.
When using the TTE model or other unmarked individual count models to estimate the population density in the future, researchers should aim to adhere to the underlying assumptions of the model whilst accurately determining the required parameters, such as the random placement of remote cameras and precise estimation of target animal movement rates in the survey areas. Under these premises, using camera traps for population density estimation may become a superior alternative to traditional survey methods like transect surveys for forest musk deer.
In 1985, Jiang, by setting up 12 sampling plots in the hinterland of the Qinling Mountains, Fengxian County, and using the ratio of musk production per unit area (km2) in other producing counties to that of Fengxian County as a correction value, estimated that the population of forest musk deer in Shaanxi Province was between 74,800 and 95,600 individuals [54]. In contrast, a 2009 report from the State Forestry Administration of China guessed a population size of 1300 individuals in Shaanxi Province [23]. This significant decline indicates a worrying trend. The population size of the forest musk deer in the central Qinling Mountains of Shaanxi estimated in this study is higher than the overall population size reported for Shaanxi Province by the State Forestry Administration, possibly indicating some population recovery. The central Qinling Mountains of Shaanxi are the main distribution area for forest musk deer in Shaanxi Province. The population of forest musk deer in the central Qinling Mountains of Shaanxi estimated in this study is significantly lower than the overall population size of Shaanxi estimated by Jiang, suggesting that there is substantial room for the forest musk deer population to recover, underlining the urgent need for intensified protection efforts.

4.3. Management Recommendation

By estimating the population size of a species, we can assess the species’ long-term viability and understand its risk of extinction. Related studies suggest that a population size of 500 individuals is required to maintain the evolutionary potential of a population [55], and 5000 individuals is required to prevent the loss of genetic variation [56,57]. Increased conservation efforts are urgently needed to ensure the survival of the forest musk deer.
To better protect the forest musk deer, it is recommended to ensure that all suitable habitats for forest musk deer are turned into protected areas, and within these areas, the logging of forest area should be reduced or prohibited. In addition to protecting the habitat of forest musk deer, strengthening efforts to combat poaching and intensifying law enforcement are also crucial for the protection of forest musk deer. Concurrently, there is a need to establish an effective monitoring system to periodically survey and protect the wild populations of forest musk deer, ensuring their prosperous reproduction and survival status.

Supplementary Materials

The following supporting information can be downloaded at: https://www.mdpi.com/article/10.3390/d15101071/s1, Table S1: List of environment variables used in MaxEnt modelling.

Author Contributions

X.G., S.B. and X.Z.: Conceptualization, Methodology, Investigation, Resources, Validation. X.G.: Data curation, Formal analysis, Software, Visualization, Writing. S.B. and X.Z.: Funding acquisition, Project administration, Supervision, Review. All authors have read and agreed to the published version of the manuscript.

Funding

This research was funded by Giant Panda National Park Ningtai Management Branch 2020 Central Financial Subsidy Fund Project, grant number 2017YFC0505202.

Institutional Review Board Statement

Not applicable.

Data Availability Statement

The data that support the findings of this study are available on request from the corresponding author. The data are not publicly available due to privacy restrictions.

Acknowledgments

Authors are thankful to the Shaanxi Provincial Administration of the Giant Panda National Park and Administration of Niubeiliang National Nature Reserve for their support to the field surveys. This work is funded by the Central Government’s Financial Subsidy Fund for Giant Panda National Park.

Conflicts of Interest

The authors declare no conflict of interest.

References

  1. Fan, Z.; Li, W.; Jin, J.; Cui, K.; Yan, C.; Peng, C.; Jian, Z.; Bu, P.; Price, M.; Zhang, X.; et al. The draft genome sequence of forest musk deer (Moschus berezovskii). Gigascience 2018, 7, giy038. [Google Scholar] [CrossRef] [PubMed]
  2. Cai, R.; Shafer, A.B.A.; Laguardia, A.; Lin, Z.; Liu, S.; Hu, D. Recombination and selection in the major histocompatibility complex of the endangered forest musk deer (Moschus berezovskii). Sci. Rep. 2015, 5, 17285. [Google Scholar] [CrossRef] [PubMed]
  3. Tran, D.V.; Viet, D.P.; Tien, T.V.; Nguyen, A.; Van, C.P.; Tilker, A. New records of the forest musk deer Moschus berezovskii in Viet Nam revealed by camera traps. Oryx 2021, 55, 494–495. [Google Scholar] [CrossRef]
  4. Yang, Q.; Meng, X.; Xia, L.; Feng, Z. Conservation status and causes of decline of musk deer (Moschus spp.) in China. Biol. Conserv. 2003, 109, 333–342. [Google Scholar] [CrossRef]
  5. Sun, X.; Cai, R.; Jin, X.; Shafer, A.B.A.; Hu, X.; Yang, S.; Li, Y.; Qi, L.; Liu, S.; Hu, D. Blood transcriptomics of captive forest musk deer (Moschus berezovskii) and possible associations with the immune response to abscesses. Sci. Rep. 2018, 8, 599. [Google Scholar] [CrossRef] [PubMed]
  6. Wen, R.S. The Distributions and Changes of Rare Wild Animals in China (Sequel); Shandong Science and Technology Press: Jinan, China, 2018; pp. 740–741. [Google Scholar]
  7. Wang, Y.; Harris, R. Moschus berezovskii. The IUCN Red List of Threatened Species 2015; IUCN Red List: Cambridge, UK, 2015. [Google Scholar]
  8. Gao, Y.; Duszynski, D.W.; Yuan, F.; Hu, D.; Zhang, D. Coccidian parasites in the endangered forest musk deer (Moschus berezovskii) in China, with the description of six new species of Eimeria (Apicomplexa: Eimeriidae). Parasite 2021, 28, 70. [Google Scholar] [CrossRef]
  9. Noon, B.R.; Bailey, L.L.; Sisk, T.D.; Mckelvey, K.S. Efficient Species-Level Monitoring at the Landscape Scale. Conserv. Biol. 2012, 26, 432–441. [Google Scholar] [CrossRef]
  10. Morin, D.J.; Boulanger, J.; Bischof, R.; Lee, D.C.; Ngoprasert, D.; Fuller, A.K.; McLellan, B.; Steinmetz, R.; Sharma, S.; Garshelis, D.; et al. Comparison of methods for estimating density and population trends for low-density asian bears. Glob. Ecol. Conserv. 2022, 35, e2058. [Google Scholar] [CrossRef]
  11. Legault, A.; Theuerkauf, J.; Chartendrault, V.; Rouys, S.; Saoumoé, M.; Verfaille, L.; Desmoulins, F.; Barré, N.; Gula, R. Using ecological niche models to infer the distribution and population size of parakeets in New Caledonia. Biol. Conserv. 2013, 167, 149–160. [Google Scholar] [CrossRef]
  12. Pagel, J.; Anderson, B.J.; Ohara, R.B.; Cramer, W.; Fox, R.C.; Jeltsch, F.; Roy, D.B.; Thomas, C.D.; Schurr, F.M. Quantifying range-wide variation in population trends from local abundance surveys and widespread opportunistic occurrence records. Methods Ecol. Evol. 2014, 5, 751–760. [Google Scholar] [CrossRef]
  13. Hu, Z.; Wang, Y.; Xue, W.; Jiang, H.; Xu, H. Studies on Habitat Selection by Moschus Berezovskii in Winter in Zibaishan Nature Reserve. J. Henan Univ. (Nat. Sci.) 2006, 36, 70–74. [Google Scholar]
  14. Jiang, H.; Xue, W.; Wang, Y.; Hu, Z.; Xiao, Y. Spring Habitat Selection of Forest Musk Deer (Moschus berezovskii) in Fengxian County, Shaanxi Province. Sichuan J. Zool. 2008, 27, 115–119. [Google Scholar]
  15. Anile, S.; Ragni, B.; Randi, E.; Mattucci, F.; Rovero, F. Wildcat population density on the Etna volcano, Italy: A comparison of density estimation methods. J. Zool. 2014, 293, 252–261. [Google Scholar] [CrossRef]
  16. Bessone, M.; Kühl, H.S.; Hohmann, G.; Herbinger, I.; N’Goran, K.P.; Asanzi, P.; Da Costa, P.B.; Dérozier, V.; Fotsing, E.D.B.; Beka, B.I.; et al. Drawn out of the shadows: Surveying secretive forest species with camera trap distance sampling. J. Appl. Ecol. 2020, 57, 963–974. [Google Scholar] [CrossRef]
  17. Zwerts, J.A.; Stephenson, P.J.; Maisels, F.; Rowcliffe, M.; Astaras, C.; Jansen, P.A.; Waarde, J.; Sterck, L.E.H.M.; Verweij, P.A.; Bruce, T.; et al. Methods for wildlife monitoring in tropical forests: Comparing human observations, camera traps, and passive acoustic sensors. Conserv. Sci. Pract. 2021, 3, 1. [Google Scholar] [CrossRef]
  18. Bohnett, E.; Poya Faryabi, S.; Lewison, R.; An, L.; Bian, X.; Rajabi, A.M.; Jahed, N.; Rooyesh, H.; Mills, E.; Ramos, S.; et al. Human expertise combined with artificial intelligence improves performance of snow leopard camera trap studies. Glob. Ecol. Conserv. 2023, 41, e2350. [Google Scholar] [CrossRef]
  19. Rich, L.N.; Miller, D.A.W.; Muñoz, D.J.; Robinson, H.S.; McNutt, J.W.; Kelly, M.J. Sampling design and analytical advances allow for simultaneous density estimation of seven sympatric carnivore species from camera trap data. Biol. Conserv. 2019, 233, 12–20. [Google Scholar] [CrossRef]
  20. Zero, V.H.; Sundaresan, S.R.; O’Brien, T.G.; Kinnaird, M.F. Monitoring an Endangered savannah ungulate, Grevy’s zebra Equus grevyi: Choosing a method for estimating population densities. Oryx 2013, 47, 410–419. [Google Scholar] [CrossRef]
  21. Santini, G.; Abolaffio, M.; Ossi, F.; Franzetti, B.; Cagnacci, F.; Focardi, S. Population assessment without individual identification using camera-traps: A comparison of four methods. Basic. Appl. Ecol. 2022, 61, 68–81. [Google Scholar] [CrossRef]
  22. Moeller, A.K.; Lukacs, P.M.; Horne, J.S. Three novel methods to estimate abundance of unmarked animals using remote cameras. Ecosphere 2018, 9, e2331. [Google Scholar] [CrossRef]
  23. National Forestry and Grassland Administration. Investigation on Major Terrestrial Wildlife Resources in China; China Forestry Publishing House: Beijing, China, 2009; pp. 282–283. [Google Scholar]
  24. Zhang, Y.; Li, F.; Li, K.; Sun, L.; Yang, H. The Influence of Space Transformation of Land Use on Function Transformation and the Regional Differences in Shaanxi Province. Int. J. Environ. Res. Public Health 2022, 19, 11793. [Google Scholar] [CrossRef] [PubMed]
  25. Li, J.; Ren, Z.; Zhou, Z. Ecosystem services and their values: A case study in the Qinba mountains of China. Ecol. Res. 2006, 21, 597–604. [Google Scholar] [CrossRef]
  26. Wang, B.; Xu, G.; Li, P.; Li, Z.; Zhang, Y.; Cheng, Y.; Jia, L.; Zhang, J. Vegetation dynamics and their relationships with climatic factors in the Qinling Mountains of China. Ecol. Indic. 2020, 108, 105719. [Google Scholar] [CrossRef]
  27. Gong, M.; Fan, Z.; Wang, J.; Liu, G.; Lin, C. Delineating the ecological conservation redline based on the persistence of key species: Giant pandas (Ailuropoda melanoleuca) inhabiting the Qinling Mountains. Ecol. Model. 2017, 345, 56–62. [Google Scholar] [CrossRef]
  28. Hu, J.; Jiang, Z. Climate Change Hastens the Conservation Urgency of an Endangered Ungulate. PLoS ONE 2011, 6, e22873. [Google Scholar] [CrossRef]
  29. Buonincontri, M.P.; Bosso, L.; Smeraldo, S.; Chiusano, M.L.; Pasta, S.; Di Pasquale, G. Shedding light on the effects of climate and anthropogenic pressures on the disappearance of Fagus sylvatica in the Italian lowlands: Evidence from archaeo-anthracology and spatial analyses. Sci. Total Environ. 2023, 877, 162893. [Google Scholar] [CrossRef]
  30. Taylor, A.; Sigona, A.; Kelly, M. Modeling spatial distributions of Amah Mutsun priority cultural plants to support Indigenous cultural revitalization. Ecosphere 2023, 14, e4374. [Google Scholar] [CrossRef]
  31. Engler, J.O.; Stiels, D.; Schidelko, K.; Strubbe, D.; Quillfeldt, P.; Brambilla, M. Avian SDMs: Current state, challenges, and opportunities. J. Avian Biol. 2017, 48, 1483–1504. [Google Scholar] [CrossRef]
  32. Guisan, A.; Thuiller, W. Predicting species distribution: Offering more than simple habitat models. Ecol. Lett. 2005, 8, 993–1009. [Google Scholar] [CrossRef]
  33. Phillips, S.J.; Anderson, R.P.; Schapire, R.E. Maximum entropy modeling of species geographic distributions. Ecol. Model. 2006, 190, 231–259. [Google Scholar] [CrossRef]
  34. Ahmadi, M.; Hemami, M.; Kaboli, M.; Shabani, F. MaxEnt brings comparable results when the input data are being completed; Model parameterization of four species distribution models. Ecol. Evol. 2023, 13, e9827. [Google Scholar] [CrossRef] [PubMed]
  35. Emad, K.; Victoria, N.; Abdulaziz, A.; Francis, G. A comparison between Ensemble and MaxEnt species distribution modelling approaches for conservation: A case study with Egyptian medicinal plants. Ecol. Inf. Inform. 2020, 60, 101150. [Google Scholar]
  36. Zhang, Y.; Chen, P. Distribution and Conservation of Moschus berezovskii in Changqing National Nature Reserve. Shaanxi For. Sci. Technol. 2013, 3, 28–30. [Google Scholar]
  37. Luo, C.; Xu, W.; Zhou, Z.; Ouyang, Z.; Zhang, L. Habitat prediction for forest musk deer (Moschus berezovskii) in Qinling mountain range based on niche model. Acta Ecol. Sin. 2011, 31, 1221–1229. [Google Scholar]
  38. Liu, J.; Wang, Y.; Bian, K.; Tang, J.; Wang, W.; Guo, L.; Wang, B.; Fang, G.; Zhao, L.; Qi, X. Home range utilization and individual dispersal of re-introduced forest musk deer (Moschus berezovskii). Acta Theriol. Sin. 2020, 40, 109–119. [Google Scholar]
  39. Alain, F.Z.; Elena, N.I.; Chris, S.E. A protocol for data exploration to avoid common statistical problems. Methods Ecol. Evol. 2010, 1, 3–14. [Google Scholar]
  40. Sun, X.; Long, Z.; Jia, J. A multi-scale Maxent approach to model habitat suitability for the giant pandas in the Qionglai mountain, China. Glob. Ecol. Conserv. 2021, 30, e1766. [Google Scholar] [CrossRef]
  41. Kass, J.M.; Muscarella, R.; Galante, P.J.; Bohl, C.L.; Pinilla-Buitrago, G.E.; Boria, R.A.; Soley-Guardia, M.; Anderson, R.P. ENMeval 2.0: Redesigned for customizable and reproducible modeling of species’ niches and distributions. Methods Ecol. Evol. 2021, 12, 1602–1608. [Google Scholar] [CrossRef]
  42. Ohashi, H.; Hasegawa, T.; Hirata, A.; Fujimori, S.; Takahashi, K.; Tsuyama, I.; Nakao, K.; Kominami, Y.; Tanaka, N.; Hijioka, Y.; et al. Biodiversity can benefit from climate stabilization despite adverse side effects of land-based mitigation. Nat. Commun. 2019, 10, 5240. [Google Scholar] [CrossRef]
  43. Phillips, S.J.; Anderson, R.P.; Dudík, M.; Schapire, R.E.; Blair, M.E. Opening the black box: An open-source release of Maxent. Ecography 2017, 40, 887–893. [Google Scholar] [CrossRef]
  44. Ali, H.; Din, J.U.; Bosso, L.; Hameed, S.; Kabir, M.; Younas, M.; Nawaz, M.A. Expanding or shrinking? range shifts in wild ungulates under climate change in Pamir-Karakoram mountains, Pakistan. PLoS ONE 2021, 16, e0260031. [Google Scholar] [CrossRef]
  45. Martínez-Díaz, M.G.; Reef, R. A biogeographical approach to characterizing the climatic, physical and geomorphic niche of the most widely distributed mangrove species, Avicennia marina. Divers. Distrib. 2023, 29, 89–108. [Google Scholar] [CrossRef]
  46. Halvorsen, R.; Mazzoni, S.; Dirksen, J.W.; Næsset, E.; Gobakken, T.; Ohlson, M. How important are choice of model selection method and spatial autocorrelation of presence data for distribution modelling by MaxEnt? Ecol. Model. 2016, 328, 108–118. [Google Scholar] [CrossRef]
  47. ALLOUCHE, O.; TSOAR, A.; KADMON, R. Assessing the accuracy of species distribution models: Prevalence, kappa and the true skill statistic (TSS): Assessing the accuracy of distribution models. J. Appl. Ecol. 2006, 43, 1223–1232. [Google Scholar] [CrossRef]
  48. Rowcliffe, J.M.; Kays, R.; Kranstauber, B.; Carbone, C.; Jansen, P.A.; Fisher, D. Quantifying levels of animal activity using camera trap data. Methods Ecol. Evol. 2014, 5, 1170–1179. [Google Scholar] [CrossRef]
  49. Qi, W.; Li, J.; Zhang, X.; Wang, Z.; Li, X.; Yang, C.; Fu, W.; Yue, B. The reproductive performance of female Forest musk deer (Moschus berezovskii) in captivity. Theriogenology 2011, 76, 874–881. [Google Scholar] [CrossRef] [PubMed]
  50. Yang, X.; Gao, Z.; Wang, L.; Xiao, L.; Dong, N.; Wu, H.; Li, S. Projecting the potential distribution of ticks in China under climate and land use change. Int. J. Parasitol. 2021, 51, 749–759. [Google Scholar] [CrossRef]
  51. Liu, Z.; Zhao, X.; Wei, W.; Hong, M.; Zhou, H.; Tang, J.; Zhang, Z. Predicting range shifts of the giant pandas under future climate and land use scenarios. Ecol. Evol. 2022, 12, e9298. [Google Scholar] [CrossRef]
  52. Hu, Z.; Wang, Y.; Xue, W.; Jiang, H.; Xu, H. Population density of Moschus berezovskii in Zibaishan Nature Reserve. J. Zhejiang For. Coll. 2007, 24, 65–71. [Google Scholar]
  53. Pfeffer, S.E.; Spitzer, R.; Allen, A.M.; Hofmeester, T.R.; Ericsson, G.; Widemo, F.; Singh, N.J.; Cromsigt, J.P.G.M.; Sveriges, L.; Rowcliffe, M.; et al. Pictures or pellets? Comparing camera trapping and dung counts as methods for estimating population densities of ungulates. Remote Sens. Ecol. Con 2018, 4, 173–183. [Google Scholar] [CrossRef]
  54. Jiang, T. Estimated population of forest musk deer in Shaanxi Province. J. Shaanxi Norm. Univ. Nat. Sci. Ed. 1997, 25, 127–130. [Google Scholar]
  55. Jamieson, I.G.; Allendorf, F.W. How does the 50/500 rule apply to MVPs? Trends Ecol. Evol. 2012, 27, 578–584. [Google Scholar] [CrossRef] [PubMed]
  56. Frankham, R. Effective population size/adult population size ratios in wildlife: A review. Genet. Res. 1995, 66, 95–107. [Google Scholar] [CrossRef]
  57. Zeng, Q.; Zhang, Y.; Sun, G.; Duo, H.; Wen, L.; Lei, G. Using Species Distribution Model to Estimate the Wintering Population Size of the Endangered Scaly-Sided Merganser in China. PLoS ONE 2015, 10, e0117307. [Google Scholar] [CrossRef]
Figure 1. Study area and occurrence points of forest musk deer.
Diversity 15 01071 g001
Figure 2. Camera trap deployment status (A) Huangbaiyuan Nature Reserve; (B) Changqing National Nature Reserve; (C) Niubeiliang National Nature Reserve; (D) Shaanxi Yingzuishi Provincial Nature Reserve).
Diversity 15 01071 g002
Figure 3. Variable contributions (aspect = Aspect; bio15 = BIO15; bio2 = BIO2; ele = Elevation; landuse = Land-use; river = Distance to water system; slope = Slope).
Diversity 15 01071 g003
Figure 4. Response curves for: (A) Land-use (1 = Cropland; 2 = Forest; 3 = Shrub; 4 = Woods; 5 = Other woodland; 6 = Grassland; 7 = Waterbody; 8 = Build-up land; 9= Unused land); (B) BIO2; (C) Elevation; (D) BIO15. The curves show the mean response of the 25 replicate MaxEnt runs (red) and the mean +/− one standard deviation (blue, two shades for categorical variables).
Diversity 15 01071 g004
Figure 5. Suitable habitat for forest musk deer in the central Qinling Mountains of Shaanxi.
Diversity 15 01071 g005
Table 1. Population density of forest musk deer in the survey area.
Survey AreaArea (km2)Population Density of Forest Musk Deer (Individuals/km2)
Huangbaiyuan Nature Reserve980.6064 ± 0.1375
Changqing National Nature Reserve600.2977 ± 0.1054
Niubeiliang National Nature Reserve350.3197 ± 0.1305
Shaanxi Yingzuishi Provincial Nature Reserve180.2399 ± 0.0900
Disclaimer/Publisher’s Note: The statements, opinions and data contained in all publications are solely those of the individual author(s) and contributor(s) and not of MDPI and/or the editor(s). MDPI and/or the editor(s) disclaim responsibility for any injury to people or property resulting from any ideas, methods, instructions or products referred to in the content.

