Resolving Metabolic Heterogeneity in Experimental Models of the Tumor Microenvironment from a Stable Isotope Resolved Metabolomics Perspective


Abstract
:1. Introduction
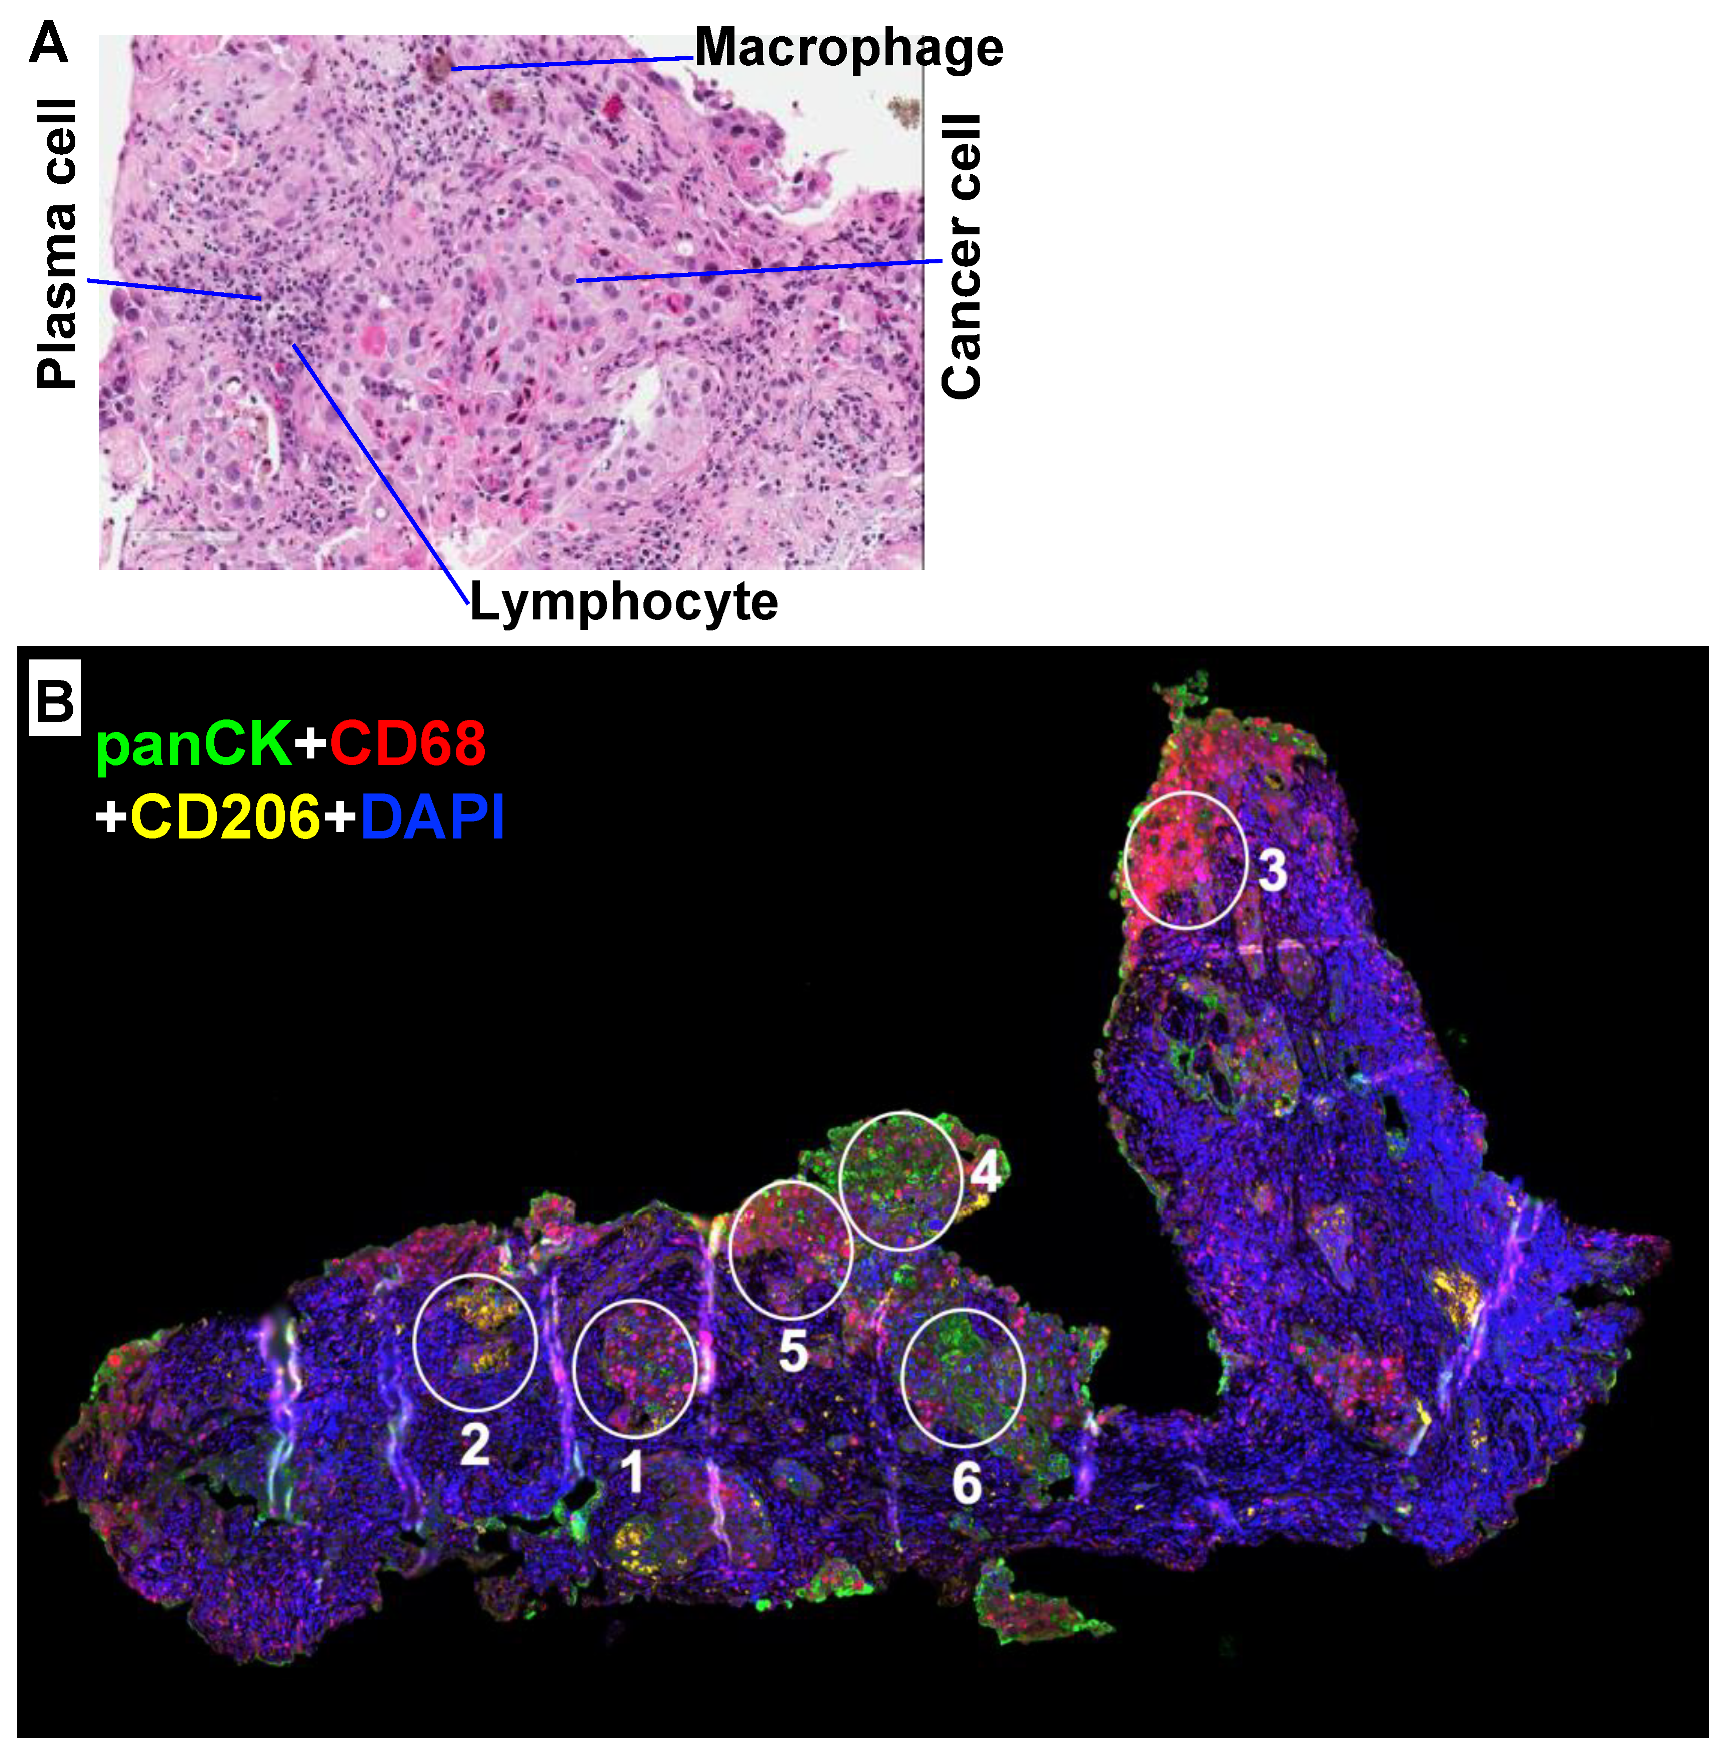
1.1. Heterogeneity in the Tumor Microenvironment (TME)
1.2. Stable Isotope Resolved Metabolomics (SIRM)
2. Advantages and Disadvantages of Different Model Systems
2.1. 2D Cell Models
2.2. Xenograft and PDX Mouse Models
2.3. 3D Spheroids and Organoids
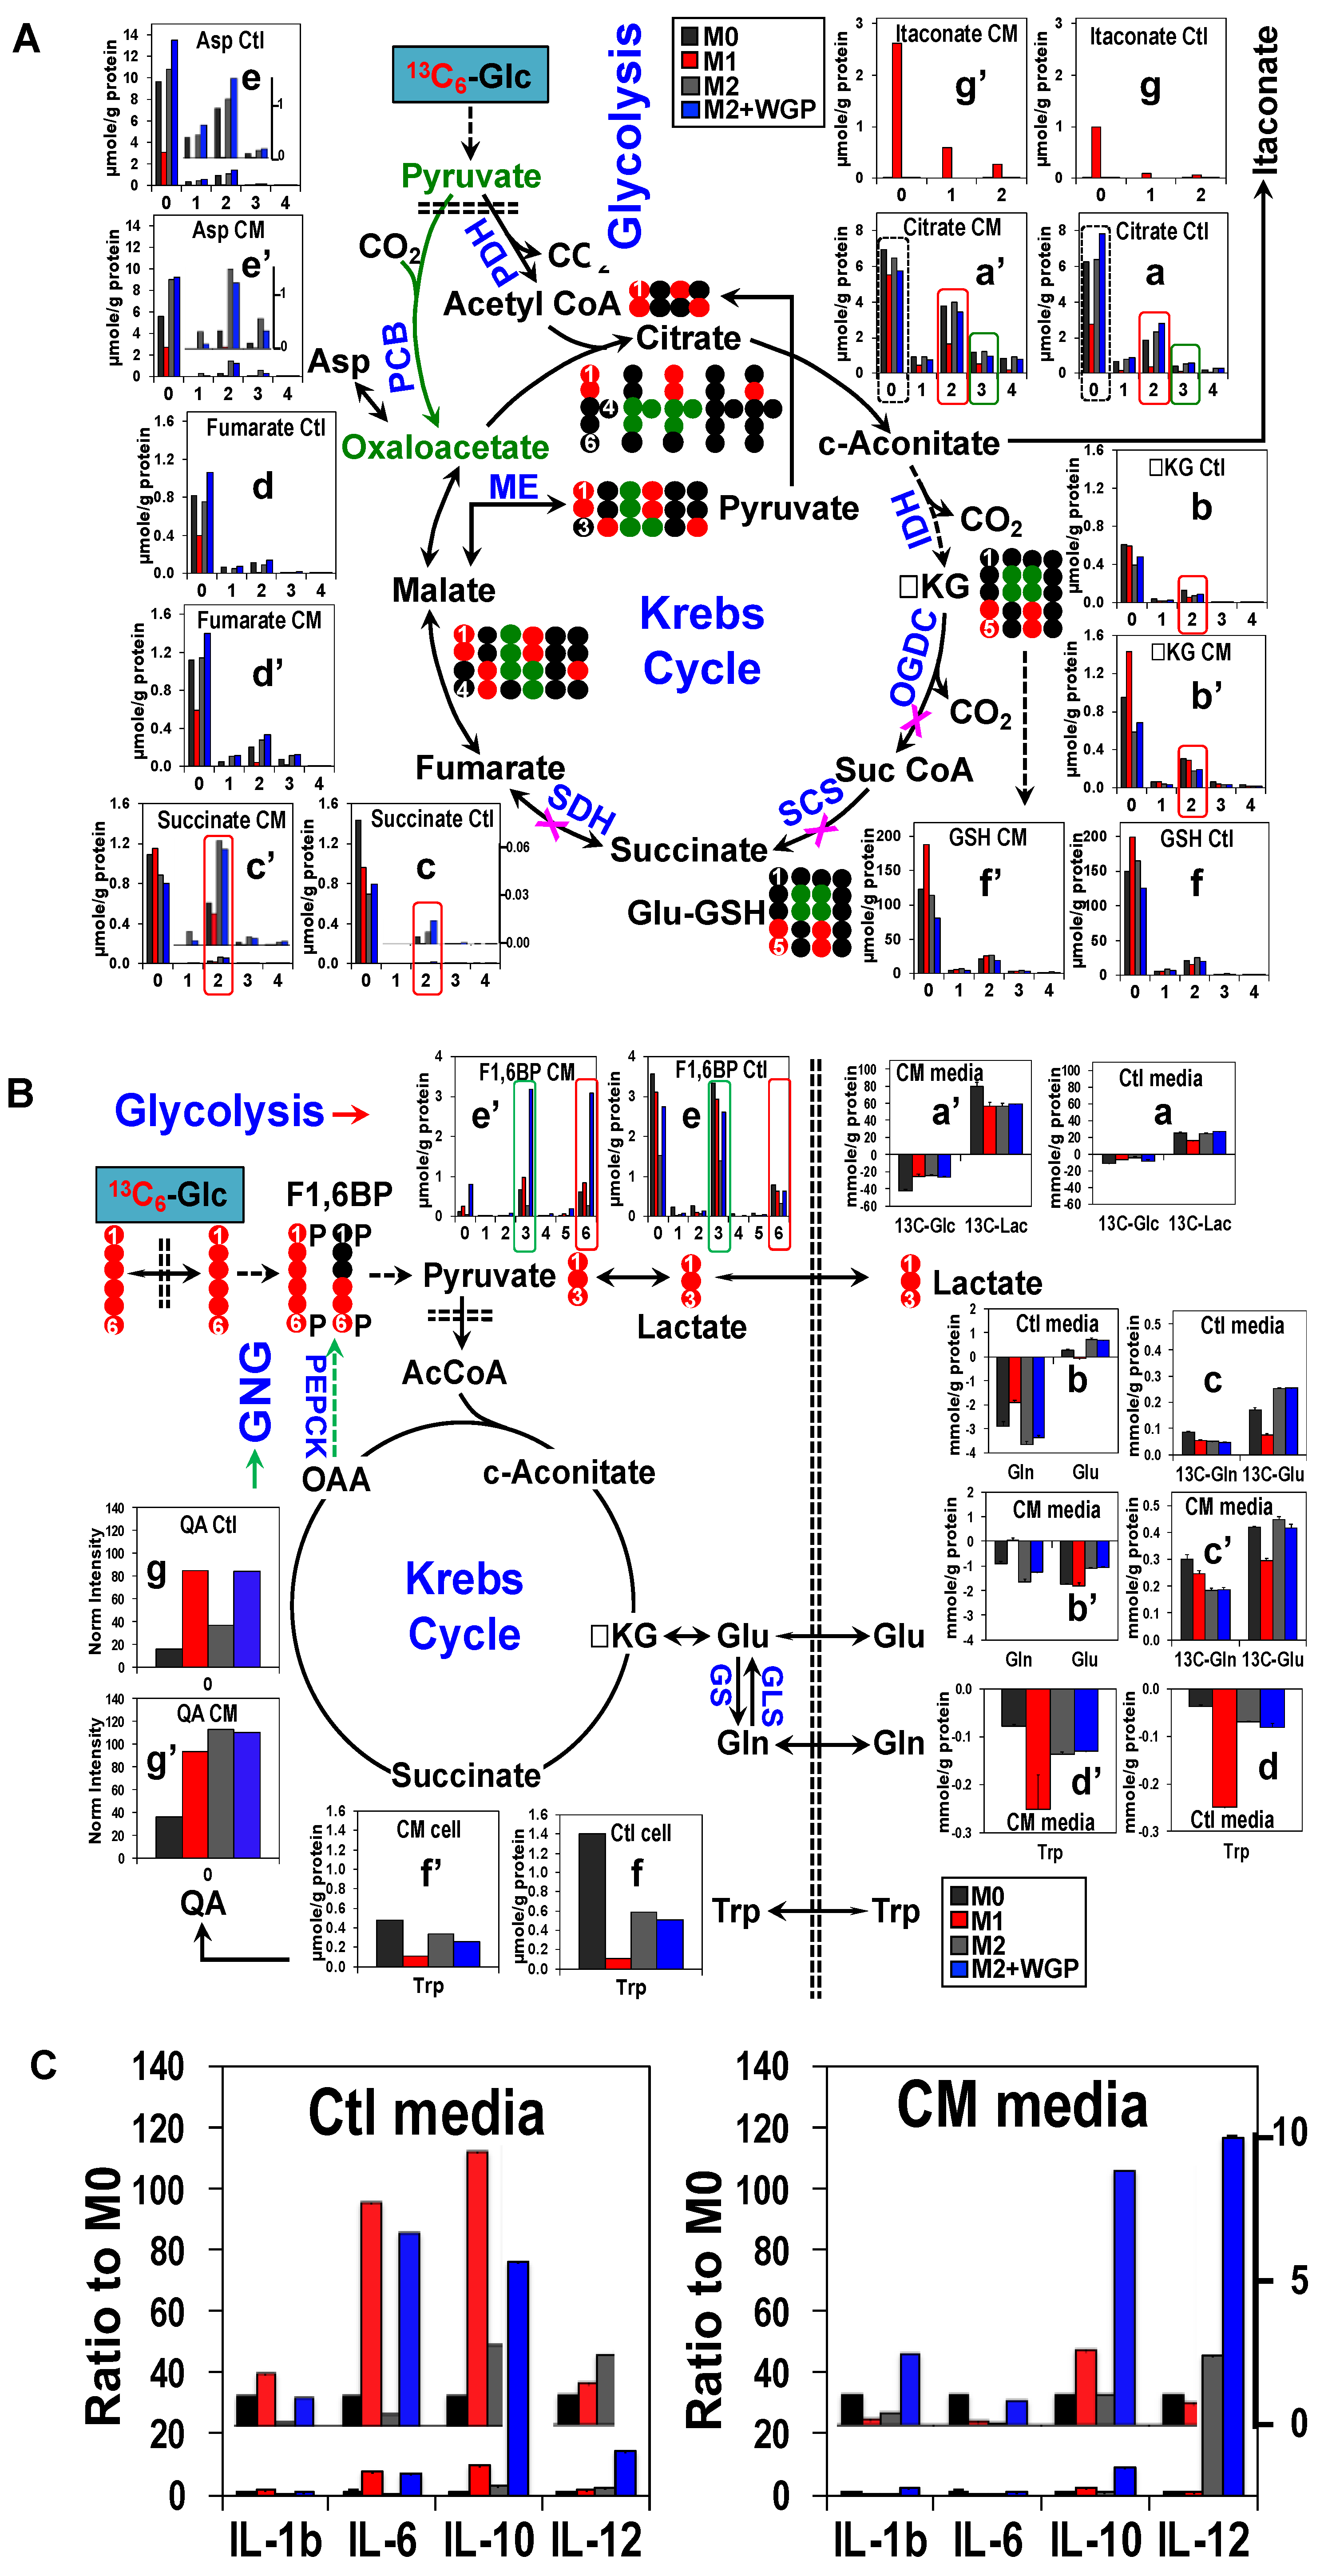
3. Cancer Cell Conditioned Medium Has a Profound Effect on Human Mφ Metabolism and Effector Release
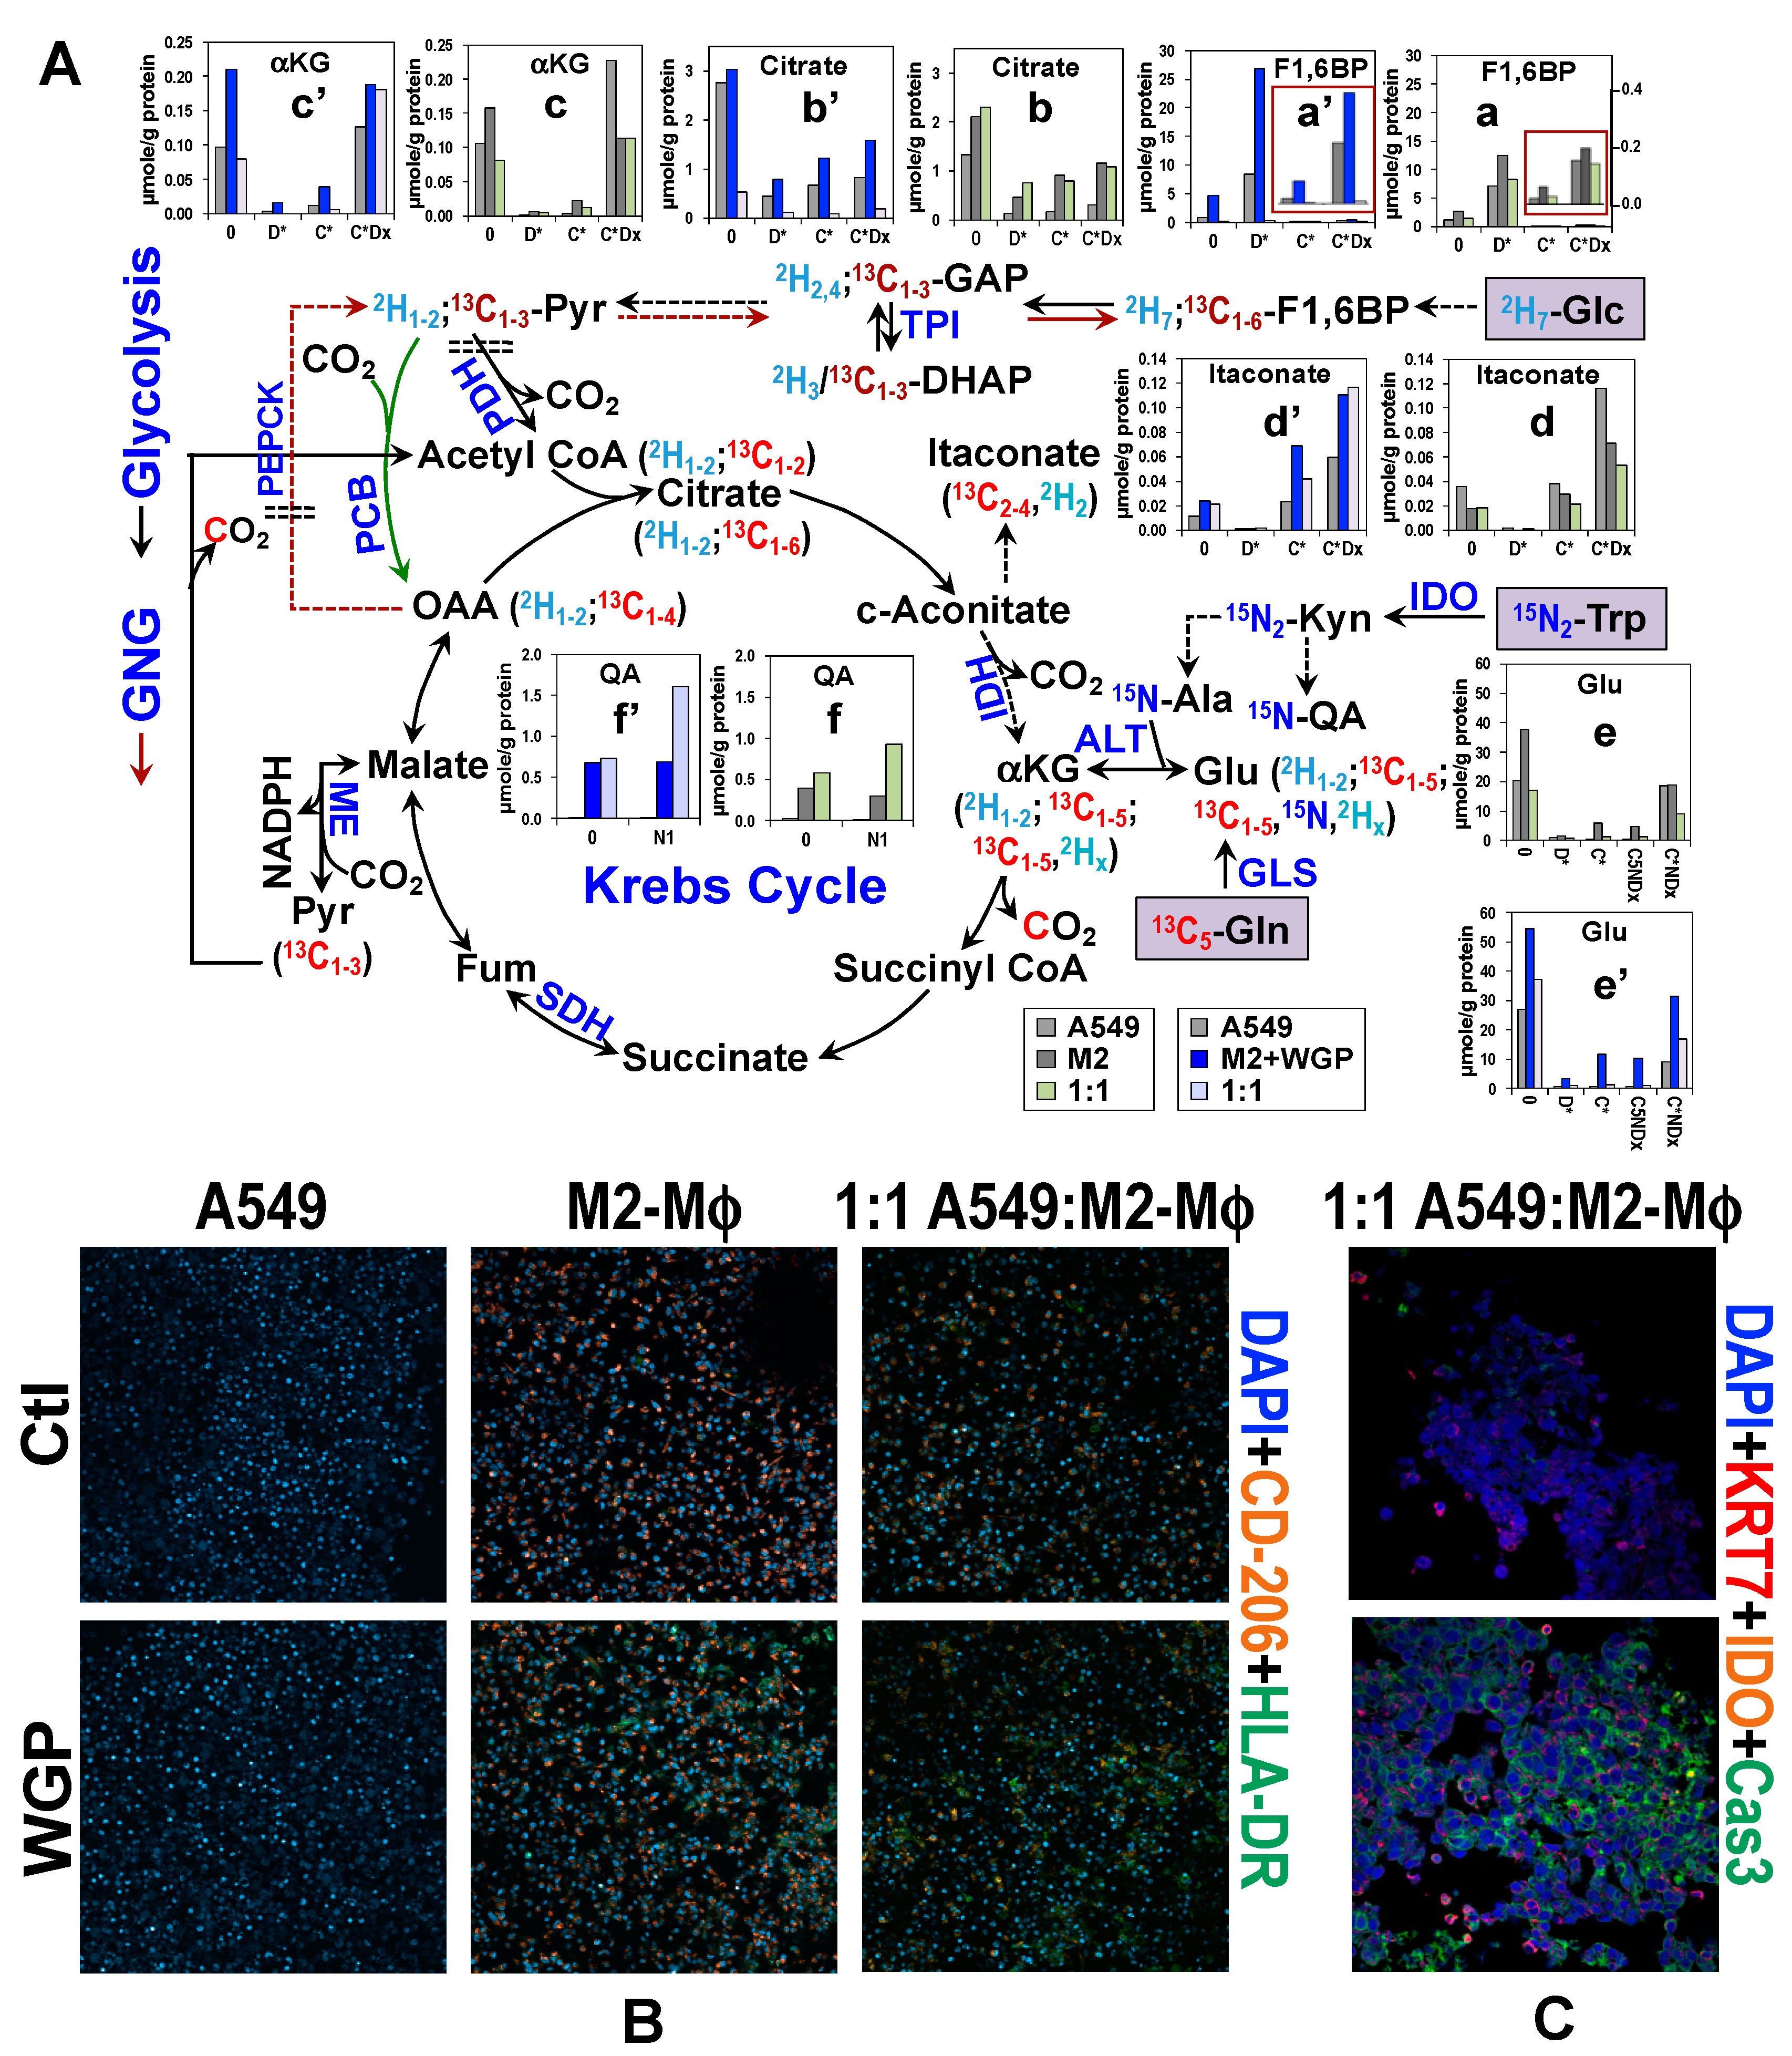
4. Co-Culturing of Cancer Cell with Mφ Alters Metabolic Response of Human M2-Mφ Spheroids to WGP
5. Concluding Remarks and Future Directions
6. Materials and Methods
6.1. H&E Staining
6.2. DSP (Nanostring)
6.3. Monocytes Isolation, Differentiation, and Polarization
6.4. SIRM of Macrophage Spheroids and A549-Macrophage Organoid Cultures
Author Contributions
Funding
Acknowledgments
Conflicts of Interest
Abbreviations
References
- Voigt, W.; Manegold, C.; Pilz, L.; Wu, Y.-L.; Mullauer, L.; Pirker, R.; Filipits, M.; Niklinski, J.; Petruzelka, L.; Prosch, H. Beyond tissue biopsy: A diagnostic framework to address tumor heterogeneity in lung cancer. Curr. Opin. Oncol. 2020, 32, 68–77. [Google Scholar] [CrossRef] [PubMed]
- Reina-Campos, M.; Diaz-Meco, M.T.; Moscat, J. The complexity of the serine glycine one-carbon pathway in cancer. J. Cell Biol. 2020, 219, e20190722. [Google Scholar] [CrossRef] [PubMed]
- Lukina, M.M.; Shimolina, L.E.; Kiselev, N.M.; Zagainov, V.E.; Komarov, D.V.; Zagaynova, E.V.; Shirmanova, M.V. Interrogation of tumor metabolism in tissue samples ex vivo using fluorescence lifetime imaging of NAD(P)H. Methods Appl. Fluoresc. 2020, 8, 0140002. [Google Scholar] [CrossRef] [PubMed]
- Liu, D.; Paczkowski, P.; Mackay, S.; Ng, C.; Zhou, J. Single-Cell Multiplexed Proteomics on the IsoLight Resolves Cellular Functional Heterogeneity to Reveal Clinical Responses of Cancer Patients to Immunotherapies. Methods Mol. Biol. 2020, 2055, 413–431. [Google Scholar] [CrossRef]
- Kudou, M.; Nakanishi, M.; Kuriu, Y.; Murayama, Y.; Arita, T.; Kishimoto, M.; Konishi, E.; Goto, M.; Yamada, K.; Otsuji, E. Value of intra-tumor heterogeneity evaluated by diffusion-weighted MRI for predicting pathological stages and therapeutic responses to chemoradiotherapy in lower rectal cancer. J. Cancer 2020, 11, 168–176. [Google Scholar] [CrossRef]
- Kim, J.Y.; Kim, J.J.; Hwangbo, L.; Lee, J.W.; Lee, N.K.; Nam, K.J.; Choo, K.S.; Kang, T.; Park, H.; Son, Y.; et al. Diffusion-weighted MRI of estrogen receptor-positive, HER2-negative, node-negative breast cancer: Association between intratumoral heterogeneity and recurrence risk. Eur. Radiol. 2020, 30, 66–76. [Google Scholar] [CrossRef] [PubMed]
- Eng, J.; Thibault, G.; Luoh, S.-W.; Gray, J.W.; Chang, Y.H.; Chin, K. Cyclic Multiplexed-Immunofluorescence (cmIF), a Highly Multiplexed Method for Single-Cell Analysis. Methods Mol. Biol. 2020, 2055, 521–562. [Google Scholar] [CrossRef]
- Seth Nanda, C.; Venkateswaran, S.V.; Patani, N.; Yuneva, M. Defining a metabolic landscape of tumours: Genome meets metabolism. Br. J. Cancer 2019, 122, 136–149. [Google Scholar] [CrossRef]
- Sato, T.; Yoo, S.; Kong, R.; Sinha, A.; Chandramani-Shivalingappa, P.; Patel, A.; Fridrikh, M.; Nagano, O.; Masuko, T.; Beasley, M.B.; et al. Epigenomic Profiling Discovers Trans-lineage SOX2 Partnerships Driving Tumor Heterogeneity in Lung Squamous Cell Carcinoma. Cancer Res. 2019, 79, 6084–6100. [Google Scholar] [CrossRef] [Green Version]
- Leung, J.Y.; Chia, K.; Ong, D.S.T.; Taneja, R. Interweaving Tumor Heterogeneity into the Cancer Epigenetic/Metabolic Axis. Antioxid. Redox Signal. 2019. [Google Scholar] [CrossRef]
- Kishimoto, S.; Brendert, J.R.; Crooks, D.R.; Matsumoto, S.; Seki, T.; Oshima, N.; Merkle, H.; Lin, P.; Reed, G.; Chen, A.P.; et al. Imaging of glucose metabolism by 13C-MRI distinguishes pancreatic cancer subtypes in mice. eLife 2019, 8, e46312. [Google Scholar] [CrossRef] [PubMed]
- Januskeviciene, I.; Petrikaite, V. Heterogeneity of breast cancer: The importance of interaction between different tumor cell populations. Life Sci. 2019, 239, 117009. [Google Scholar] [CrossRef] [PubMed]
- Nguyen, Q.H.; Pervolarakis, N.; Blake, K.; Ma, D.; Davis, R.T.; James, N.; Phung, A.T.; Willey, E.; Kumar, R.; Jabart, E.; et al. Profiling human breast epithelial cells using single cell RNA sequencing identifies cell diversity. Nat. Commun. 2018, 9, 2028. [Google Scholar] [CrossRef] [PubMed]
- Young, A.; Mittal, D.; Stagg, J.J.; Smyth, M.J. Targeting Cancer-Derived Adenosine: New Therapeutic Approaches. Cancer Discov. 2014, 4, 879–888. [Google Scholar] [CrossRef] [PubMed] [Green Version]
- Gordon, S.R.; Maute, R.L.; Dulken, B.W.; Hutter, G.; George, B.M.; McCracken, M.N.; Gupta, R.; Tsai, J.M.; Sinha, R.; Corey, D.; et al. PD-1 expression by tumour-associated macrophages inhibits phagocytosis and tumour immunity. Nature 2017, 545, 495–499. [Google Scholar] [CrossRef]
- Akbar, S.; Peikari, M.; Salama, S.; Panah, A.Y.; Nofech-Mozes, S.; Martel, A.M. Automated and Manual Quantification of Tumour Cellularity in Digital Slides for Tumour Burden Assessment. Sci. Rep. 2019, 9, 14099. [Google Scholar] [CrossRef] [Green Version]
- Smits, A.J.J.; Kummer, J.A.; de Bruin, P.C.; Bol, M.; van den Tweel, J.G.; Seldenrijk, K.A.; Willems, S.M.; Offerhaus, G.J.A.; de Weger, R.A.; van Diest, P.J.; et al. The estimation of tumor cell percentage for molecular testing by pathologists is not accurate. Mod. Pathol. 2013, 27, 168–174. [Google Scholar] [CrossRef]
- Fukumura, D.; Duda, D.G.; Munn, L.L.; Jain, R.K. Tumor Microvasculature and Microenvironment: Novel Insights Through Intravital Imaging in Pre-Clinical Models. Microcirculation 2010, 17, 206–225. [Google Scholar] [CrossRef] [Green Version]
- Schroeder, T.; Yuan, H.; Viglianti, B.L.; Peltz, C.; Asopa, S.; Vujaskovic, Z.; Dewhirst, M.W. Spatial Heterogeneity and Oxygen Dependence of Glucose Consumption in R3230Ac and Fibrosarcomas of the Fischer 344 Rat. Cancer Res. 2005, 65, 5163–5171. [Google Scholar] [CrossRef] [Green Version]
- Sonveaux, P.; Végran, F.; Schroeder, T.; Wergin, M.C.; Verrax, J.; Rabbani, Z.N.; De Saedeleer, C.J.; Kennedy, K.M.; Diepart, C.; Jordan, B.F.; et al. Targeting lactate-fueled respiration selectively kills hypoxic tumor cells in mice. J. Clin. Investig. 2008, 118, 3930–3942. [Google Scholar] [CrossRef] [Green Version]
- Asp, M.; Giacomello, S.; Larsson, L.; Wu, C.; Furth, D.; Qian, X.; Wardell, E.; Custodio, J.; Reimegard, J.; Salmen, F.; et al. A Spatiotemporal Organ-Wide Gene Expression and Cell Atlas of the Developing Human Heart. Cell 2019, 179, 1647–1660. [Google Scholar] [CrossRef] [PubMed]
- Baccin, C.; Al-Sabah, J.; Velten, L.; Helbling, P.M.; Grunschlager, F.; Hernandez-Malmierca, P.; Nombela-Arrieta, C.; Steinmetz, L.M.; Trumpp, A.; Haas, S. Combined single-cell and spatial transcriptomics reveal the molecular, cellular and spatial bone marrow niche organization. Nat. Cell Biol. 2019, 22, 38–48. [Google Scholar] [CrossRef]
- Zhang, Q.; He, Y.; Luo, N.; Patel, S.J.; Han, Y.; Gao, R.; Modak, M.; Carotta, S.; Haslinger, C.; Kind, D.; et al. Landscape and Dynamics of Single Immune Cells in Hepatocellular Carcinoma. Cell 2019, 179, 829–845. [Google Scholar] [CrossRef] [PubMed]
- Junttila, M.R.; De Sauvage, F.J. Influence of tumour micro-environment heterogeneity on therapeutic response. Nature 2013, 501, 346–354. [Google Scholar] [CrossRef] [PubMed]
- Guzman-Herrera, A.; Mao, Y. Polarity during tissue repair, a multiscale problem. Curr. Opin. Cell Biol. 2020, 62, 31–36. [Google Scholar] [CrossRef] [PubMed]
- Bryant, D.M.; Mostov, K.E. From cells to organs: Building polarized tissue. Nat. Rev. Mol. Cell Biol. 2008, 9, 887–901. [Google Scholar] [CrossRef]
- Connolly, J.L.; Schnitt, S.J.; Wang, H.H.; Longtine, J.A.; Dvorak, A.; Dvorak, H.F. Tumor Structure and Tumor Stroma Generation, 6th ed.; BC Decker: Hamilton, ON, Canada, 2003. [Google Scholar]
- Hanahan, D.; Weinberg, R.A. Hallmarks of Cancer: The Next Generation. Cell 2011, 144, 646–674. [Google Scholar] [CrossRef] [Green Version]
- Marusyk, A.; Polyak, K. Tumor heterogeneity: Causes and consequences. Biochim. Biophys. Acta 2010, 1805, 105–117. [Google Scholar] [CrossRef] [Green Version]
- Marusyk, A.; Almendro, V.; Polyak, K. Intra-tumour heterogeneity: A looking glass for cancer? Nat. Rev. Cancer 2012, 12, 323–334. [Google Scholar] [CrossRef]
- Bredholt, G.; Mannelqvist, M.; Stefansson, I.M.; Birkeland, E.; Bø, T.H.; Øyan, A.M.; Trovik, J.; Kalland, K.-H.; Jonassen, I.; Salvesen, H.B.; et al. Tumor necrosis is an important hallmark of aggressive endometrial cancer and associates with hypoxia, angiogenesis and inflammation responses. Oncotarget 2015, 6, 39676–39691. [Google Scholar] [CrossRef] [Green Version]
- Faubert, B.; DeBerardinis, R.J. Analyzing Tumor Metabolism In Vivo. Annu. Rev. Cancer Biol. 2017, 1, 99–117. [Google Scholar] [CrossRef]
- Zhang, H.; Fillmore Brainson, C.; Koyama, S.; Redig, A.J.; Chen, T.; Li, S.; Gupta, M.; Garcia-de-Alba, C.; Paschini, M.; Herter-Sprie, G.S.; et al. Lkb1 inactivation drives lung cancer lineage switching governed by Polycomb Repressive Complex 2. Nat. Commun. 2017, 8, 14922. [Google Scholar] [CrossRef]
- Lamouille, S.; Xu, J.; Derynck, R. Molecular mechanisms of epithelial-mesenchymal transition. Nat. Rev. Mol. Cell Biol. 2014, 15, 178–196. [Google Scholar] [CrossRef] [PubMed] [Green Version]
- Aguilar, E.; Marin de Mas, I.; Zodda, E.; Marin, S.; Morrish, F.; Selivanov, V.; Meca-Cortes, O.; Delowar, H.; Pons, M.; Izquierdo, I.; et al. Metabolic Reprogramming and Dependencies Associated with Epithelial Cancer Stem Cells Independent of the Epithelial-Mesenchymal Transition Program. Stem Cells 2016, 34, 1163–1176. [Google Scholar] [CrossRef] [PubMed] [Green Version]
- Graf, T.; Enver, T. Forcing cells to change lineages. Nature 2009, 462, 587–594. [Google Scholar] [CrossRef] [PubMed]
- Orkin, S.H.; Zon, L.I. Hematopoiesis: An evolving paradigm for stem cell biology. Cell 2008, 132, 631–644. [Google Scholar] [CrossRef] [Green Version]
- Stadhouders, R.; Filion, G.J.; Graf, T. Transcription factors and 3D genome conformation in cell-fate decisions. Nature 2019, 569, 345–354. [Google Scholar] [CrossRef]
- Forbes, M. Cell Structure. In Cell Physiology Source Book; Sperelakis, N., Ed.; Academic Press: Cambridge, MA, USA, 2012; pp. 67–83. [Google Scholar]
- Kyrochristos, I.D.; Ziogas, D.E.; Goussia, A.; Glantzounis, G.K.; Roukos, D.H. Bulk and Single-Cell Next-Generation Sequencing: Individualizing Treatment for Colorectal Cancer. Cancers 2019, 11, 1809. [Google Scholar] [CrossRef] [Green Version]
- Close, H.J.; Stead, L.F.; Nsengimana, J.; Reilly, K.A.; Droop, A.; Wurdak, H.; Mathew, R.K.; Corns, R.; Newton-Bishop, J.; Melcher, A.A.; et al. Expression profiling of single cells and patient cohorts identifies multiple immunosuppressive pathways and an altered NK cell phenotype in glioblastoma. Clin. Exp. Immunol. 2019, 200, 33–44. [Google Scholar] [CrossRef] [Green Version]
- Al-Sabah, J.; Baccin, C.; Haas, S. Single-cell and spatial transcriptomics approaches of the bone marrow microenvironment. Curr. Opin. Oncol. 2019, 32, 146–153. [Google Scholar] [CrossRef]
- Zilionis, R.; Engblom, C.; Pfirschke, C.; Savova, V.; Zemmour, D.; Saatcioglu, H.D.; Krishnan, I.; Maroni, G.; Meyerovitz, C.V.; Kerwin, C.M.; et al. Single-Cell Transcriptomics of Human and Mouse Lung Cancers Reveals Conserved Myeloid Populations across Individuals and Species. Immunity 2019, 50, 1317–1334. [Google Scholar] [CrossRef] [PubMed]
- Yang, L.; George, J.; Wang, J. Deep Profiling of Cellular Heterogeneity by Emerging Single-Cell Proteomic Technologies. Proteomics 2019, 1900226. [Google Scholar] [CrossRef] [PubMed]
- Kalb, D.M.; Adikari, S.H.; Hong-Geller, E.; Werner, J.H. Single-cell correlations of mRNA and protein content in a human monocytic cell line after LPS stimulation. PLoS ONE 2019, 14, e0215602. [Google Scholar] [CrossRef] [PubMed]
- Luecken, M.D.; Theis, F.J. Current best practices in single-cell RNA-seq analysis: A tutorial. Mol. Syst. Biol. 2019, 15, e8746. [Google Scholar] [CrossRef] [PubMed]
- Bartoschek, M.; Oskolkov, N.; Bocci, M.; Lovrot, J.; Larsson, C.; Sommarin, M.; Madsen, C.D.; Lindgren, D.; Pekar, G.; Karlsson, G.; et al. Spatially and functionally distinct subclasses of breast cancer-associated fibroblasts revealed by single cell RNA sequencing. Nat. Commun. 2018, 9, 5150. [Google Scholar] [CrossRef] [PubMed] [Green Version]
- Cohen, M.; Giladi, A.; Gorki, A.-D.; Solodkin, D.G.; Zada, M.; Hladik, A.; Miklosi, A.; Salame, T.-M.; Halpern, K.B.; David, E.; et al. Lung Single-Cell Signaling Interaction Map Reveals Basophil Role in Macrophage Imprinting. Cell 2018, 175, 1031–1044. [Google Scholar] [CrossRef] [Green Version]
- Neal, J.T.; Li, X.; Zhu, J.; Giangarra, V.; Grzeskowiak, C.L.; Ju, J.; Liu, I.H.; Chiou, S.-H.; Salahudeen, A.A.; Smith, A.R.; et al. Organoid Modeling of the Tumor Immune Microenvironment. Cell 2018, 175, 1972–1988. [Google Scholar] [CrossRef] [Green Version]
- Mistry, A.M.; Greenplate, A.R.; Ihrie, R.A.; Irish, J.M. Beyond the message: Advantages of snapshot proteomics with single-cell mass cytometry in solid tumors. FEBS J. 2019, 286, 1523–1539. [Google Scholar] [CrossRef] [Green Version]
- Lundberg, E.; Borner, G.H.H. Spatial proteomics: A powerful discovery tool for cell biology. Nat. Rev. Mol. Cell Biol. 2019, 20, 285–302. [Google Scholar] [CrossRef]
- Liu, Y.; Chen, X.; Zhang, Y.; Liu, J. Advancing single-cell proteomics and metabolomics with microfluidic technologies. Analyst 2019, 144, 846–858. [Google Scholar] [CrossRef]
- Misra, B.B. Open-Source Software Tools, Databases, and Resources for Single-Cell and Single-Cell-Type Metabolomics. Methods Mol. Biol. 2020, 2064, 191–217. [Google Scholar] [CrossRef] [PubMed]
- Gilmore, I.S.; Heiles, S.; Pieterse, C.L. Metabolic Imaging at the Single-Cell Scale: Recent Advances in Mass Spectrometry Imaging. In Annual Review of Analytical Chemistry; Bohn, P.W., Pemberton, J.E., Eds.; Annual Reviews: Palo Alto, CA, USA, 2019; Volume 12, pp. 201–224. [Google Scholar]
- Ali, A.; Abouleila, Y.; Shimizu, Y.; Hiyama, E.; Emara, S.; Mashaghi, A.; Hankemeier, T. Single-cell metabolomics by mass spectrometry: Advances, challenges, and future applications. TrAC-Trends Anal. Chem. 2019, 120, 115436. [Google Scholar] [CrossRef]
- Thiele, C.; Wunderling, K.; Leyendecker, P. Multiplexed and single cell tracing of lipid metabolism. Nat. Methods 2019, 16, 1123–1130. [Google Scholar] [CrossRef] [PubMed]
- Neumann, E.K.; Ellis, J.F.; Triplett, A.E.; Rubakhin, S.S.; Sweedler, J.V. Lipid Analysis of 30 000 Individual Rodent Cerebellar Cells Using High-Resolution Mass Spectrometry. Anal. Chem. 2019, 91, 7871–7878. [Google Scholar] [CrossRef] [PubMed]
- Zhu, C.; Li, M.; Vincent, T.; Martin, H.L.; Crouch, B.T.; Martinez, A.F.; Madonna, M.C.; Palmer, G.M.; Dewhirst, M.W.; Ramanujam, N. Simultaneous in vivo optical quantification of key metabolic and vascular endpoints reveals tumor metabolic diversity in murine breast tumor models. J. Biophotonics 2019, 12, e201800372. [Google Scholar] [CrossRef] [PubMed]
- Madonna, M.C.; Fox, D.B.; Crouch, B.T.; Lee, J.; Zhu, C.; Martinez, A.F.; Alvarez, J.V.; Ramanujam, N. Optical Imaging of Glucose Uptake and Mitochondrial Membrane Potential to Characterize Her2 Breast Tumor Metabolic Phenotypes. Mol. Cancer Res. 2019, 17, 1545–1555. [Google Scholar] [CrossRef] [Green Version]
- Zhu, C.; Martin, H.L.; Crouch, B.T.; Martinez, A.F.; Li, M.; Palmer, G.M.; Dewhirst, M.W.; Ramanujam, N. Near-simultaneous quantification of glucose uptake, mitochondrial membrane potential, and vascular parameters in murine flank tumors using quantitative diffuse reflectance and fluorescence spectroscopy. Biomed. Opt. Express 2018, 9, 3399–3412. [Google Scholar] [CrossRef]
- Walsh, A.J.; Cook, R.S.; Sanders, M.E.; Aurisicchio, L.; Ciliberto, G.; Arteaga, C.L.; Skala, M.C. Quantitative Optical Imaging of Primary Tumor Organoid Metabolism Predicts Drug Response in Breast Cancer. Cancer Res. 2014, 74, 5184–5194. [Google Scholar] [CrossRef] [Green Version]
- Rak, J. Microparticles in Cancer. Semin. Thromb. Hemost. 2010, 36, 888–906. [Google Scholar] [CrossRef] [Green Version]
- Beloribi-Djefaflia, S.; Siret, C.; Lombardo, D. Exosomal lipids induce human pancreatic tumoral MiaPaCa-2 cells resistance through the CXCR4-SDF-1alpha signaling axis. Oncoscience 2015, 2, 15–30. [Google Scholar] [CrossRef] [Green Version]
- Decalf, J.; Albert, M.L.; Ziai, J. New tools for pathology: A user’s review of a highly multiplexed method for in situ analysis of protein and RNA expression in tissue. J. Pathol. 2019, 247, 650–661. [Google Scholar] [CrossRef] [PubMed] [Green Version]
- Johnson, D.B.; McDonnell, W.J.; Gonzalez-Ericsson, P.I.; Al-Rohil, R.N.; Mobley, B.C.; Salem, J.E.; Wang, D.Y.; Sanchez, V.; Wang, Y.; Chastain, C.A.; et al. A case report of clonal EBV-like memory CD4(+) T cell activation in fatal checkpoint inhibitor-induced encephalitis. Nat. Med. 2019, 25, 1243–1250. [Google Scholar] [CrossRef] [PubMed]
- Toki, M.I.; Merritt, C.R.; Wong, P.F.; Smithy, J.W.; Kluger, H.M.; Syrigos, K.N.; Ong, G.T.; Warren, S.E.; Beechem, J.M.; Rimm, D.L. High-Plex Predictive Marker Discovery for Melanoma Immunotherapy-Treated Patients Using Digital Spatial Profiling. Clin. Cancer Res. 2019, 25, 5503–5512. [Google Scholar] [CrossRef] [PubMed]
- Davis-Marcisak, E.F.; Sherman, T.D.; Orugunta, P.; Stein-O’Brien, G.L.; Puram, S.V.; Torres, E.T.R.; Hopkins, A.C.; Jaffee, E.M.; Favorov, A.V.; Afsari, B.; et al. Differential Variation Analysis Enables Detection of Tumor Heterogeneity Using Single-Cell RNA-Sequencing Data. Cancer Res. 2019, 79, 5102–5112. [Google Scholar] [CrossRef] [PubMed]
- Eberwine, J.; Sul, J.-Y.; Bartfai, T.; Kim, J. The promise of single-cell sequencing. Nat. Methods 2014, 11, 25–27. [Google Scholar] [CrossRef]
- Savas, P.; Virassamy, B.; Ye, C.; Salim, A.; Mintoff, C.P.; Caramia, F.; Salgado, R.; Byrne, D.J.; Teo, Z.L.; Dushyanthen, S.; et al. Single-cell profiling of breast cancer T cells reveals a tissue-resident memory subset associated with improved prognosis. Nat. Med. 2018, 24, 986–993. [Google Scholar] [CrossRef]
- Perl, K.; Ushakov, K.; Pozniak, Y.; Yizhar-Barnea, O.; Bhonker, Y.; Shivatzki, S.; Geiger, T.; Avraham, K.B.; Shamir, R. Reduced changes in protein compared to mRNA levels across non-proliferating tissues. BMC Genom. 2017, 18, 305. [Google Scholar] [CrossRef]
- Liu, Y.; Beyer, A.; Aebersold, R. On the Dependency of Cellular Protein Levels on mRNA Abundance. Cell 2016, 165, 535–550. [Google Scholar] [CrossRef] [Green Version]
- Edfors, F.; Danielsson, F.; Hallstrom, B.M.; Kall, L.; Lundberg, E.; Ponten, F.; Forsstrom, B.; Uhlen, M. Gene-specific correlation of RNA and protein levels in human cells and tissues. Mol. Syst. Biol. 2016, 12, 883. [Google Scholar] [CrossRef]
- Vogel, C.; Marcotte, E.M. Insights into the regulation of protein abundance from proteomic and transcriptomic analyses. Nat. Rev. Genet. 2012, 13, 227–232. [Google Scholar] [CrossRef]
- Brahimi-Horn, M.C.; Pouyssegur, J. Hypoxia in cancer cell metabolism and pH regulation. Essays Biochem. 2007, 43, 165–178. [Google Scholar] [CrossRef] [PubMed] [Green Version]
- Fukumura, D.; Jain, R.K. Tumor microvasculature and microenvironment: Targets for anti-angiogenesis and normalization. Microvasc. Res. 2007, 74, 72–84. [Google Scholar] [CrossRef] [PubMed] [Green Version]
- Giussani, M.; Merlino, G.; Cappelletti, V.; Tagliabue, E.; Daidone, M.G. Tumor-extracellular matrix interactions: Identification of tools associated with breast cancer progression. Semin. Cancer Biol. 2015, 35, 3–10. [Google Scholar] [CrossRef] [PubMed] [Green Version]
- Fan, T.W.M.; El-Amouri, S.S.; Macedo, J.K.A.; Wang, Q.J.; Song, H.; Cassel, T.; Lane, A.N. Stable Isotope-Resolved Metabolomics Shows Metabolic Resistance to Anti-Cancer Selenite in 3D Spheroids versus 2D Cell Cultures. Metabolites 2018, 8, 40. [Google Scholar] [CrossRef] [PubMed] [Green Version]
- Jiang, L.; Shestov, A.A.; Swain, P.; Yang, C.; Parker, S.J.; Wang, Q.A.; Terada, L.S.; Adams, N.D.; McCabe, M.T.; Pietrak, B.; et al. Reductive carboxylation supports redox homeostasis during anchorage-independent growth. Nature 2016, 532, 255–258. [Google Scholar] [CrossRef]
- Lane, A.N.; Higashi, R.M.; Fan, T.W.-M. Metabolic reprogramming in tumors: Contributions of the tumor microenvironment. Genes Dis. 2019, 7, 185–198. [Google Scholar] [CrossRef]
- Zhang, L.; Zheng, J.; Ahmed, R.; Huang, G.; Reid, J.; Mandal, R.; Maksymuik, A.; Sitar, D.S.; Tappia, P.S.; Ramjiawan, B.; et al. A High-Performing Plasma Metabolite Panel for Early-Stage Lung Cancer Detection. Cancers 2020, 12, 622. [Google Scholar] [CrossRef] [Green Version]
- Schmidt, J.A.; Fensom, G.K.; Rinaldi, S.; Scalbert, A.; Appleby, P.N.; Achaintre, D.; Gicquiau, A.; Gunter, M.J.; Ferrari, P.; Kaaks, R.; et al. Patterns in metabolite profile are associated with risk of more aggressive prostate cancer: A prospective study of 3,057 matched case-control sets from EPIC. Int. J. Cancer 2020, 146, 720–730. [Google Scholar] [CrossRef] [Green Version]
- His, M.; Viallon, V.; Dossus, L.; Gicquiau, A.; Achaintre, D.; Scalbert, A.; Ferrari, P.; Romieu, I.; Onland-Moret, N.C.; Weiderpass, E.; et al. Prospective analysis of circulating metabolites and breast cancer in EPIC. BMC Med. 2019, 17, 178. [Google Scholar] [CrossRef]
- Fan, T.W.M.; Zhang, X.; Wang, C.; Yang, Y.; Kang, W.-Y.; Arnold, S.; Higashi, R.M.; Liu, J.; Lane, A.N. Exosomal lipids for classifying early and late stage non-small cell lung cancer. Anal. Chim. Acta 2018, 1037, 256–264. [Google Scholar] [CrossRef]
- Martin, J.C.; Maillot, M.; Mazerolles, G.; Verdu, A.; Lyan, B.; Migne, C.; Defoort, C.; Canlet, C.; Junot, C.; Guillou, C.; et al. Can we trust untargeted metabolomics? Results of the metabo-ring initiative, a large-scale, multi-instrument inter-laboratory study. Metabolomics 2015, 11, 807–821. [Google Scholar] [CrossRef] [PubMed]
- Deda, O.; Virgiliou, C.; Orfanidis, A.; Gika, H.G. Study of Fecal and Urinary Metabolite Perturbations Induced by Chronic Ethanol Treatment in Mice by UHPLC-MS/MS Targeted Profiling. Metabolites 2019, 9, 232. [Google Scholar] [CrossRef] [PubMed] [Green Version]
- Want, E.J.; Wilson, I.D.; Gika, H.; Theodoridis, G.; Plumb, R.S.; Shockcor, J.; Holmes, E.; Nicholson, J.K. Global metabolic profiling procedures for urine using UPLC-MS. Nat. Protoc. 2010, 5, 1005–1018. [Google Scholar] [CrossRef] [PubMed]
- Ballester, L.Y.; Lu, G.; Zorofchian, S.; Vantaku, V.; Putluri, V.; Yan, Y.; Arevalo, O.; Zhu, P.; Riascos, R.F.; Sreekumar, A.; et al. Analysis of cerebrospinal fluid metabolites in patients with primary or metastatic central nervous system tumors. Acta Neuropathol. Commun. 2018, 6, 85. [Google Scholar] [CrossRef] [PubMed] [Green Version]
- Yoo, B.C.; Lee, J.H.; Kim, K.-H.; Lin, W.; Kim, J.H.; Park, J.B.; Park, H.J.; Shin, S.H.; Yoo, H.; Kwon, J.W.; et al. Cerebrospinal fluid metabolomic profiles can discriminate patients with leptomeningeal carcinomatosis from patients at high risk for leptomeningeal metastasis. Oncotarget 2017, 8, 101203–101214. [Google Scholar] [CrossRef] [Green Version]
- Vignoli, A.; Paciotti, S.; Tenori, L.; Eusebi, P.; Biscetti, L.; Chiasserini, D.; Scheltens, P.; Turano, P.; Teunissen, C.; Luchinat, C.; et al. Fingerprinting Alzheimer’s Disease by 1H Nuclear Magnetic Resonance Spectroscopy of Cerebrospinal Fluid. J. Proteome Res. 2020, 19, 1696–1705. [Google Scholar] [CrossRef]
- Fan, T.W.; Lane, A.N.; Higashi, R.M.; Farag, M.A.; Gao, H.; Bousamra, M.; Miller, D.M. Altered regulation of metabolic pathways in human lung cancer discerned by (13)C stable isotope-resolved metabolomics (SIRM). Mol. Cancer 2009, 8, 41. [Google Scholar] [CrossRef] [Green Version]
- Sellers, K.; Fox, M.P.; Bousamra, M., 2nd; Slone, S.P.; Higashi, R.M.; Miller, D.M.; Wang, Y.; Yan, J.; Yuneva, M.O.; Deshpande, R.; et al. Pyruvate carboxylase is critical for non-small-cell lung cancer proliferation. J. Clin. Investig. 2015, 125, 687–698. [Google Scholar] [CrossRef] [Green Version]
- Bruntz, R.C.; Higashi, R.M.; Lane, A.N.; Fan, T.W.-M. Exploring Cancer Metabolism using Stable Isotope Resolved Metabolomics (SIRM). J. Biol. Chem. 2017, 292, 11601–11609. [Google Scholar] [CrossRef] [Green Version]
- Rao, T.N.; Hansen, N.; Hilfiker, J.; Rai, S.; Majewska, J.-M.; Lekovic, D.; Gezer, D.; Andina, N.; Galli, S.; Cassel, T.; et al. JAK2-mutant hematopoietic cells display metabolic alterations that can be targeted to treat myeloproliferative neoplasms. Blood 2019, 134, 1832–1846. [Google Scholar] [CrossRef]
- Malloy, C.R.; Maher, E.; Marin-Valenica, I.; Mickey, B.; DeBerardinis, R.J.; Sherry, A.D. Carbon-13 Nuclear Magnetic Resonance for Analysis of Metabolc Pathways. In Methodologies for Metabolomics: Experimental Strategies and Techniques; Lutz, N., Sweedler, J.V., Weevers, R.A., Eds.; Cambridge University Press: Cambridge, UK, 2013; pp. 415–445. [Google Scholar]
- Winnike, J.H.; Pediaditakis, P.; Wolak, J.E.; McClelland, R.W.; Watkins, P.B.; Macdonald, J.M. Stable isotope resolved metabolomics of primary human hepatocytes reveals a stressed phenotype. Metabolomics 2012, 8, 34–49. [Google Scholar] [CrossRef]
- Liu, X.; Cooper, D.E.; Cluntun, A.A.; Warmoes, M.O.; Zhao, S.; Reid, M.A.; Liu, J.; Lund, P.J.; Lopes, M.; Garcia, B.A.; et al. Acetate Production from Glucose and Coupling to Mitochondrial Metabolism in Mammals. Cell 2018, 175, 502–513. [Google Scholar] [CrossRef] [Green Version]
- Lane, A.N.; Higashi, R.M.; Fan, T.W.M. NMR and MS-based Stable Isotope-Resolved Metabolomics and applications in cancer metabolism. TrAC-Trends Anal. Chem. 2019, 120, 115322. [Google Scholar] [CrossRef] [PubMed]
- Niedenfuhr, S.; Wiechert, W.; Noh, K. How to measure metabolic fluxes: A taxonomic guide for (13)C fluxomics. Curr. Opin. Biotechnol. 2015, 34, 82–90. [Google Scholar] [CrossRef] [PubMed]
- Wiechert, W.; Noh, K. Isotopically non-stationary metabolic flux analysis: Complex yet highly informative. Curr. Opin. Biotechnol. 2013, 24, 979–986. [Google Scholar] [CrossRef] [PubMed]
- Murphy, T.A.; Dang, C.V.; Young, J.D. Isotopically nonstationary 13C flux analysis of Myc-induced metabolic reprogramming in B-cells. Metab. Eng. 2013, 15, 206–217. [Google Scholar] [CrossRef] [Green Version]
- Fan, T.W.-M.; Bandura, L.; Higashi, R.M.; Lane, A.N. Metabolomics-edited transcriptomics analysis of Se anticancer action in human lung cancer cells. Metabolomics 2005, 1, 325–339. [Google Scholar] [CrossRef]
- Fan, T.W.-M.; Lane, A.N.; Higashi, R.M.; Yan, J. Stable Isotope Resolved Metabolomics of Lung Cancer in a SCID Mouse Model. Metabolomics 2011, 7, 257–269. [Google Scholar] [CrossRef] [Green Version]
- Fan, T.W.-M.; Tan, J.L.; McKinney, M.M.; Lane, A.N. Stable Isotope Resolved Metabolomics Analysis of Ribonucleotide and RNA Metabolism in Human Lung Cancer Cells. Metabolomics 2012, 8, 517–527. [Google Scholar] [CrossRef] [Green Version]
- Ren, J.G.; Seth, P.; Clish, C.B.; Lorkiewicz, P.K.; Higashi, R.M.; Lane, A.N.; Fan, T.W.M.; Sukhatme, V.P. Knockdown of Malic Enzyme 2 Suppresses Lung Tumor Growth, Induces Differentiation and Impacts PI3K/AKT Signaling. Sci. Rep. 2014, 4, 5414. [Google Scholar] [CrossRef] [Green Version]
- Xie, H.; Hanai, J.; Ren, J.-G.; Kats, L.; Burgess, K.; Bhargava, P.; Signoretti, S.; Billiard, J.; Duffy, K.J.; Grant, A.; et al. Targeting lactate dehydrogenase-A (LDH-A) inhibits tumorigenesis and tumor progression in mouse models of lung cancer and impacts tumor initiating cells. Cell Metab. 2014, 19, 795–809. [Google Scholar] [CrossRef] [PubMed] [Green Version]
- Sun, R.C.; Fan, T.W.-M.; Deng, P.; Higashi, R.M.; Lane, A.N.; Le, A.-T.; Scott, T.J.; Sun, Q.; Warmoes, M.O.; Yang, Y. Noninvasive liquid diet delivery of stable isotopes into mouse models for deep metabolic network tracing. Nat. Commun. 2017, 8, 1646. [Google Scholar] [CrossRef] [PubMed]
- Fan, T.W.-M.; Bruntz, R.C.; Yang, Y.; Song, H.; Chernyavskaya, Y.; Deng, P.; Zhang., Y.; Shah, P.P.; Beverly, L.J.; Chi, Z.; et al. De novo synthesis of serine and glycine fuels purine nucleotide biosynthesis in human lung cancer tissues. J. Biol. Chem. 2019, 294, 13464–13477. [Google Scholar] [CrossRef] [PubMed]
- Lane, A.N.; Higashi, R.M.; Fan, T.W.-M. Preclinical models for interrogating drug action in human cancers using Stable Isotope Resolved Metabolomics (SIRM). Metabolomics 2016, 12, 1–15. [Google Scholar] [CrossRef] [Green Version]
- Edmondson, R.; Broglie, J.J.; Adcock, A.F.; Yang, L. Three-Dimensional Cell Culture Systems and Their Applications in Drug Discovery and Cell-Based Biosensors. Assay Drug Dev. Technol. 2014, 12, 207–218. [Google Scholar] [CrossRef] [Green Version]
- Hay, M.; Thomas, D.W.; Craighead, J.L.; Economides, C.; Rosenthal, J. Clinical development success rates for investigational drugs. Nat. Biotechnol. 2014, 32, 40–51. [Google Scholar] [CrossRef]
- Kapałczyńska, M.; Kolenda, T.; Przybyła, W.; Zajączkowska, M.; Teresiak, A.; Filas, V.; Ibbs, M.; Bliźniak, R.; Łuczewski, Ł.; Lamperska, K. 2D and 3D cell cultures – a comparison of different types of cancer cell cultures. Arch. Med. Sci. 2018, 14, 910–919. [Google Scholar]
- Langhans, S. Three-Dimensional in Vitro Cell Culture Models in Drug Discovery and Drug Repositioning. Front. Pharmacol. 2018, 9, 6. [Google Scholar] [CrossRef]
- Farge, T.; Saland, E.; de Toni, F.; Aroua, N.; Hosseini, M.; Perry, R.; Bosc, C.; Sugita, M.; Stuani, L.; Fraisse, M.; et al. Chemotherapy-Resistant Human Acute Myeloid Leukemia Cells Are Not Enriched for Leukemic Stem Cells but Require Oxidative Metabolism. Cancer Discov. 2017, 7, 716–735. [Google Scholar] [CrossRef] [Green Version]
- Maykel, J.; Liu, J.H.; Li, H.; Shultz, L.D.; Greiner, D.L.; Houghton, J. NOD-scidIl2rg (tm1Wjl) and NOD-Rag1 (null) Il2rg (tm1Wjl): A model for stromal cell-tumor cell interaction for human colon cancer. Dig. Dis. Sci. 2014, 59, 1169–1179. [Google Scholar] [CrossRef] [Green Version]
- Whittle, J.R.; Lewis, M.T.; Lindeman, G.J.; Visvader, J.E. Patient-derived xenograft models of breast cancer and their predictive power. Breast Cancer Res. 2015, 17, 17. [Google Scholar] [CrossRef]
- Lee, G.Y.; Kenny, P.A.; Lee, E.H.; Bissell, M.J. Three-dimensional culture models of normal and malignant breast epithelial cells. Nat. Methods 2007, 4, 359–365. [Google Scholar] [CrossRef] [PubMed] [Green Version]
- Radisky, D.C.; Bissell, M.J. Respect thy neighbor! Science 2004, 303, 775–777. [Google Scholar] [CrossRef] [PubMed] [Green Version]
- Bissell, M.J.; Rizki, A.; Mian, I.S. Tissue architecture: The ultimate regulator of breast epithelial function. Curr. Opin. Cell Biol. 2003, 15, 753–762. [Google Scholar] [CrossRef] [PubMed] [Green Version]
- Holokai, L.; Chakrabarti, J.; Broda, T.; Chang, J.; Hawkins, J.A.; Sundaram, N.; Wroblewski, L.E.; Peek, R.M., Jr.; Wang, J.; Helmrath, M.; et al. Increased Programmed Death-Ligand 1 is an Early Epithelial Cell Response to Helicobacter pylori Infection. PLoS Pathog. 2019, 15, e1007648. [Google Scholar] [CrossRef] [PubMed] [Green Version]
- Takebe, T.; Wells, J.M. Organoids by design. Science 2019, 364, 956–959. [Google Scholar] [CrossRef]
- Fan, T.W.-M.; El-Amouri, S.S.; Macedo, J.K.A.; Wang, Q.J.; Cassel, T.A.; Lane, A.N. Mapping Metabolic Networks in 3D Spheroids Using Stable Isotope-Resolved Metabolomics. In Proceedings of the 2nd International Electronic Conference on Metabolomics, Melbourne, Australia, 20–27 November 2017. [Google Scholar]
- Tseng, H.; Gage, J.A.; Shen, T.; Haisler, W.L.; Neeley, S.K.; Shiao, S.; Chen, J.; Desai, P.K.; Liao, A.; Hebel, C.; et al. A spheroid toxicity assay using magnetic 3D bioprinting and real-time mobile device-based imaging. Sci. Rep. 2015, 5, 13987. [Google Scholar] [CrossRef] [Green Version]
- Tsukikawa, S.; Matsuoka, H.; Kurahashi, Y.; Konno, Y.; Satoh, K.; Satoh, R.; Isogai, A.; Kimura, K.; Watanabe, Y.; Nakano, S.; et al. A new method to prepare multicellular spheroids in cancer cell lines using a thermo-reversible gelation polymer. Artif. Organs 2003, 27, 598–604. [Google Scholar] [CrossRef]
- Wehrle, J.P.; Ng, C.E.; McGovern, K.A.; Aiken, N.R.; Shungu, D.C.; Chance, E.M.; Glickson, J.D. Metabolism of alternative substrates and the bioenergetic status of EMT6 tumor cell spheroids. NMR Biomed. 2000, 13, 349–360. [Google Scholar] [CrossRef]
- Pawlik, T.M.; Souba, W.W.; Sweeney, T.J.; Bode, B.P. Amino acid uptake and regulation in multicellular hepatoma spheroids. J. Surg. Res. 2000, 91, 15–25. [Google Scholar] [CrossRef]
- Nath, S.; Devi, G.R. Three-dimensional culture systems in Cancer research: Focus on tumor spheroid model. Pharmacol. Ther. 2016, 163, 94–108. [Google Scholar] [CrossRef] [PubMed] [Green Version]
- Marrella, A.; Dondero, A.; Aiello, M.; Casu, B.; Olive, D.; Regis, S.; Bottino, C.; Pende, D.; Meazza, R.; Caluori, G.; et al. Cell-Laden Hydrogel as a Clinical-Relevant 3D Model for Analyzing Neuroblastoma Growth, Immunophenotype, and Susceptibility to Therapies. Front. Immunol. 2019, 10, 1876. [Google Scholar] [CrossRef] [PubMed] [Green Version]
- Cavo, M.; Caria, M.; Pulsoni, I.; Beltrame, F.; Fato, M.; Scaglione, S. A new cell-laden 3D Alginate-Matrigel hydrogel resembles human breast cancer cell malignant morphology, spread and invasion capability observed "in vivo". Sci. Rep. 2018, 8, 5333. [Google Scholar] [CrossRef] [PubMed] [Green Version]
- Hassani, F.; Ebrahimi, B.; Moini, A.; Ghiaseddin, A.; Bazrafkan, M.; Hassanzadeh, G.; Valojerdi, M.R. Chitosan Hydrogel Supports Integrity of Ovarian Follicles during In Vitro Culture: A Preliminary of A Novel Biomaterial for Three Dimensional Culture of Ovarian Follicles. Cell J. 2020, 21, 479–493. [Google Scholar] [CrossRef] [PubMed]
- Jiang, J.-P.; Liu, X.-Y.; Zhao, F.; Zhu, X.; Li, X.-Y.; Niu, X.-G.; Yao, Z.-T.; Dai, C.; Xu, H.-Y.; Ma, K.; et al. Three-dimensional bioprinting collagen/silk fibroin scaffold combined with neural stem cells promotes nerve regeneration after spinal cord injury. Neural Regen. Res. 2020, 15, 959–968. [Google Scholar] [CrossRef] [PubMed]
- Kruger, M.; Oosterhoff, L.A.; van Wolferen, M.E.; Schiele, S.A.; Walther, A.; Geijsen, N.; De Laporte, L.; van der Laan, L.J.W.; Kock, L.M.; Spee, B. Cellulose Nanofibril Hydrogel Promotes Hepatic Differentiation of Human Liver Organoids. Adv. Healthc. Mater. 2020, 9, 1901658. [Google Scholar] [CrossRef] [PubMed] [Green Version]
- Oliveira, N.M.; Martins-Cruz, C.; Oliveira, M.B.; Reis, R.L.; Mano, J.F. Coculture of Spheroids/2D Cell Layers Using a Miniaturized Patterned Platform as a Versatile Method to Produce Scaffold-Free Tissue Engineering Building Blocks. Adv. Biosyst. 2018, 2, 17800069. [Google Scholar] [CrossRef]
- Vives, J.; Batlle-Morera, L. The challenge of developing human 3D organoids into medicines. Stem Cell Res. Ther. 2020, 11. [Google Scholar] [CrossRef] [Green Version]
- Yoshioka, K.; Ito, A.; Kawabe, Y.; Kamihira, M. Novel neuromuscular junction model in 2D and 3D myotubes co-cultured with induced pluripotent stem cell-derived motor neurons. J. Biosci. Bioeng. 2020, 129, 486–493. [Google Scholar] [CrossRef]
- Augustine, T.N.; Dix-Peek, T.; Duarte, R.; Candy, G.P. Establishment of a heterotypic 3D culture system to evaluate the interaction of TREG lymphocytes and NK cells with breast cancer. J. Immunol. Methods 2015, 426, 1–13. [Google Scholar] [CrossRef]
- Maritan, S.M.; Lian, E.Y.; Mulligan, L.M. An Efficient and Flexible Cell Aggregation Method for 3D Spheroid Production. J. Vis. Exp. 2017, 121, e55544. [Google Scholar] [CrossRef] [PubMed]
- Sant, S.; Johnston, P. The production of 3D tumor spheroids for cancer drug discovery. Drug Discov. Today: Technol. 2017, 23, 27–36. [Google Scholar] [CrossRef] [PubMed] [Green Version]
- Djomehri, S.I.; Burman, B.; Gonzalez, M.E.; Takayama, S.; Kleer, C.G. A reproducible scaffold-free 3D organoid model to study neoplastic progression in breast cancer. J. Cell Commun. Signal. 2019, 13, 129–143. [Google Scholar] [CrossRef] [PubMed]
- Eder, T.; Eder, I.E. 3D Hanging Drop Culture to Establish Prostate Cancer Organoids. In 3d Cell Culture: Methods and Protocols; Koledova, Z., Ed.; Springer: Berlin, Germany, 2017; Volume 1612, pp. 167–175. [Google Scholar]
- Workman, M.J.; Mahe, M.M.; Trisno, S.; Poling, H.M.; Watson, C.L.; Sundaram, N.; Chang, C.-F.; Schiesser, J.; Aubert, P.; Stanley, E.G.; et al. Engineered human pluripotent-stem-cell-derived intestinal tissues with a functional enteric nervous system. Nat. Med. 2017, 23, 49–59. [Google Scholar] [CrossRef] [PubMed] [Green Version]
- Arnadottir, S.S.; Jeppesen, M.; Lamy, P.; Bramsen, J.B.; Nordentoft, I.; Knudsen, M.; Vang, S.; Madsen, M.R.; Thastrup, O.; Thastrup, J.; et al. Characterization of genetic intratumor heterogeneity in colorectal cancer and matching patient-derived spheroid cultures. Mol. Oncol. 2018, 12, 132–147. [Google Scholar] [CrossRef]
- Bejoy, J.; Yuan, X.G.; Song, L.Q.; Hua, E.; Jeske, R.; Sart, S.; Sang, Q.X.A.; Li, Y. Genomics Analysis of Metabolic Pathways of Human Stem Cell-Derived Microglia-Like Cells and the Integrated Cortical Spheroids. Stem Cells Int. 2019, 2019, 2382534. [Google Scholar] [CrossRef] [Green Version]
- Bhagwat, S.R.; Chandrashekar, D.S.; Kakar, R.; Davuluri, S.; Bajpai, A.K.; Nayak, S.; Bhutada, S.; Acharya, K.; Sachdeva, G. Endometrial Receptivity: A Revisit to Functional Genomics Studies on Human Endometrium and Creation of HGEx-ERdb. PLoS ONE 2013, 8, e58419. [Google Scholar] [CrossRef]
- Eckert, M.A.; Pan, S.; Hernandez, K.M.; Loth, R.M.; Andrade, J.; Volchenboum, S.L.; Faber, P.; Montag, A.; Lastra, R.; Peter, M.E.; et al. Genomics of Ovarian Cancer Progression Reveals Diverse Metastatic Trajectories Including Intraepithelial Metastasis to the Fallopian Tube. Cancer Discov. 2016, 6, 1342–1351. [Google Scholar] [CrossRef] [Green Version]
- Horman, S.R.; Hogan, C.; Delos Reyes, K.; Lo, F.; Antczak, C. Challenges and opportunities toward enabling phenotypic screening of complex and 3D cell models. Future Med. Chem. 2015, 7, 513–525. [Google Scholar] [CrossRef]
- Morrison, E.; Wai, P.; Leonidou, A.; Bland, P.; Khalique, S.; Farnie, G.; Daley, F.; Peck, B.; Natrajan, R. Utilizing Functional Genomics Screening to Identify Potentially Novel Drug Targets in Cancer Cell Spheroid Cultures. J. Vis. Exp. 2016, 118, 54738. [Google Scholar] [CrossRef] [Green Version]
- Nowack, E.C.M.; Weber, A.P.M. Genomics-Informed Insights into Endosymbiotic Organelle Evolution in Photosynthetic Eukaryotes. In Annual Review of Plant Biology; Merchant, S.S., Ed.; Annual Reviews: Palo Alto, CA, USA, 2018; Volume 69, pp. 51–84. [Google Scholar]
- Powell, C.D.; Paullin, T.R.; Aoisa, C.; Menzie, C.J.; Ubaldini, A.; Westerheide, S.D. The Heat Shock Transcription Factor HSF1 Induces Ovarian Cancer Epithelial-Mesenchymal Transition in a 3D Spheroid Growth Model. PLoS ONE 2016, 11, e0168389. [Google Scholar] [CrossRef] [PubMed] [Green Version]
- Alfoldi, R.; Balog, J.A.; Farago, N.; Halmai, M.; Kotogany, E.; Neuperger, P.; Nagy, L.I.; Feher, L.Z.; Szebeni, G.J.; Puskas, L.G. Single Cell Mass Cytometry of Non-Small Cell Lung Cancer Cells Reveals Complexity of In Vivo and Three-Dimensional Models over the Petri-Dish. Cells 2019, 8, 1093. [Google Scholar] [CrossRef] [PubMed] [Green Version]
- Chumarina, M.; Russ, K.; Azevedo, C.; Heuer, A.; Pihl, M.; Collin, A.; Frostner, E.A.; Elmer, E.; Hyttel, P.; Cappelletti, G.; et al. Cellular alterations identified in pluripotent stem cell-derived midbrain spheroids generated from a female patient with progressive external ophthalmoplegia and parkinsonism who carries a novel variation (p.Q811R) in the POLG1 gene. Acta Neuropathol. Commun. 2019, 7, 208. [Google Scholar] [CrossRef] [Green Version]
- Ayerim Mandujano-Tinoco, E.; Carlos Gallardo-Perez, J.; Marin-Hernandez, A.; Moreno-Sanchez, R.; Rodriguez-Enriquez, S. Anti-mitochondrial therapy in human breast cancer multi-cellular spheroids. Biochim. Biophys. Acta-Mol. Cell Res. 2013, 1833, 541–551. [Google Scholar] [CrossRef] [PubMed] [Green Version]
- Desai, P.K.; Tseng, H.; Souza, G.R. Assembly of Hepatocyte Spheroids Using Magnetic 3D Cell Culture for CYP450 Inhibition/Induction. Int. J. Mol. Sci. 2017, 18, 1085. [Google Scholar] [CrossRef]
- Kalfe, A.; Telfah, A.; Lambert, J.; Hergenroeder, R. Looking into Living Cell Systems: Planar Waveguide Microfluidic NMR Detector for in Vitro Metabolomics of Tumor Spheroids. Anal. Chem. 2015, 87, 7402–7410. [Google Scholar] [CrossRef]
- Kozyra, M.; Johansson, I.; Nordling, A.; Ullah, S.; Lauschke, V.M.; Ingelman-Sundberg, M. Human hepatic 3D spheroids as a model for steatosis and insulin resistance. Sci. Rep. 2018, 8, 14297. [Google Scholar] [CrossRef] [Green Version]
- Lee, J.; Kee, H.J.; Min, S.; Park, K.C.; Park, S.; Hwang, T.H.; Ryu, D.H.; Hwang, G.-S.; Cheong, J.-H. Integrated omics-analysis reveals Wnt-mediated NAD(+) metabolic reprogramming in cancer stem-like cells. Oncotarget 2016, 7, 48562–48576. [Google Scholar] [CrossRef] [Green Version]
- Loverdou, N.; Hall, G.N.; Papantoniou, I.; Geris, L. Metabolomics as a quality control tool for spheroid-based chondrogenic differentiation-towards characterized endochondral bone regeneration. Cytotherapy 2018, 20, S67. [Google Scholar] [CrossRef]
- Michishita, M.; Saito, N.; Nozawa, S.; Furumoto, R.; Nakagawa, T.; Sato, T.; Ochiai, K.; Azakami, D.; Katayama, K.; Nakahira, R.; et al. Metabolite profiling in sphere-forming cells from canine mammary adenocarcinoma cell lines using gas chromatography-mass spectrometry. J. Vet. Med. Sci. 2019, 81, 1238–1248. [Google Scholar] [CrossRef] [Green Version]
- Okkelman, I.A.; Neto, N.; Papkovsky, D.B.; Monaghan, M.G.; Dmitriev, R.I. A deeper understanding of intestinal organoid metabolism revealed by combining fluorescence lifetime imaging microscopy (FLIM) and extracellular flux analyses. Redox Biol. 2020, 30, 101420. [Google Scholar] [CrossRef] [PubMed]
- Russell, S.; Wojtkowiak, J.; Neilson, A.; Gillies, R.J. Metabolic Profiling of healthy and cancerous tissues in 2D and 3D. Sci. Rep. 2017, 7, 15285. [Google Scholar] [CrossRef] [PubMed]
- Sato, M.; Kawana, K.; Adachi, K.; Fujimoto, A.; Yoshida, M.; Nakamura, H.; Nishida, H.; Inoue, T.; Taguchi, A.; Takahashi, J.; et al. Spheroid cancer stem cells display reprogrammed metabolism and obtain energy by actively running the tricarboxylic acid (TCA) cycle. Oncotarget 2016, 7, 33297–33305. [Google Scholar] [CrossRef] [PubMed] [Green Version]
- Tanaka, K.; Matsuura, T.; Nakada, K. Method of Assessment for 3D Reconstructed Bioartificial Liver Using C-13-glucose Breath Test. Radioisotopes 2010, 59, 435–440. [Google Scholar] [CrossRef]
- van Gorsel, M.; Elia, I.; Fendt, S.-M. 13C Tracer Analysis and Metabolomics in 3D Cultured Cancer Cells. Methods Mol. Biol. 2019, 1862, 53–66. [Google Scholar] [CrossRef]
- Vermeersch, K.A.; Wang, L.; Mezencev, R.; McDonald, J.F.; Styczynski, M.P. OVCAR-3 Spheroid-Derived Cells Display Distinct Metabolic Profiles. PLoS ONE 2015, 10, e0118262. [Google Scholar] [CrossRef] [Green Version]
- Vorrink, S.U.; Ullah, S.; Schmidt, S.; Nandania, J.; Velagapudi, V.; Beck, O.; Ingelman-Sundberg, M.; Lauschke, V.M. Endogenous and xenobiotic metabolic stability of primary human hepatocytes in long-term 3D spheroid cultures revealed by a combination of targeted and untargeted metabolomics. FASEB J. 2017, 31, 2696–2708. [Google Scholar] [CrossRef] [Green Version]
- Yan, Y.; Bejoy, J.; Marzano, M.; Li, Y. The Use of Pluripotent Stem Cell-Derived Organoids to Study Extracellular Matrix Development during Neural Degeneration. Cells 2019, 8, 242. [Google Scholar] [CrossRef] [Green Version]
- Northcutt, L.A.; Suarez-Arnedo, A.; Rafat, M. Emerging Biomimetic Materials for Studying Tumor and Immune Cell Behavior. Ann. Biomed. Eng. 2019. [Google Scholar] [CrossRef]
- Kawai, T.; Ota, N.; Okada, K.; Imasato, A.; Owa, Y.; Morita, M.; Tada, M.; Tanaka, Y. Ultrasensitive Single Cell Metabolomics by Capillary Electrophoresis–Mass Spectrometry with a Thin-Walled Tapered Emitter and Large-Volume Dual Sample Preconcentration. Anal. Chem. 2019, 91, 10564–10572. [Google Scholar] [CrossRef]
- Lane, A.N. Principles of NMR for applications in metabolomics. In Handbook of Metabolomics; Fan, T.W.-M., Lane, A.N., Higashi, R.M., Eds.; Humana: Louisville, KY, USA, 2012; Volume 17, pp. 127–197. [Google Scholar]
- Ardenkjaer-Larsen, J.H.; Fridlund, B.; Gram, A.; Hansson, G.; Hansson, L.; Lerche, M.H.; Servin, R.; Thaning, M.; Golman, K. Increase in signal-to-noise ratio of > 10,000 times in liquid-state NMR. Proc. Natl. Acad. Sci. USA 2003, 100, 10158–10163. [Google Scholar] [CrossRef] [PubMed] [Green Version]
- Yang, Y.; Fan, W.W.-M.; Lane, A.N.; Higashi, R.M. Chloroformate Derivatization for Tracing the Fate of Amino Acids in Cells by Multiple Stable Isotope Resolved Metabolomics (mSIRM). Anal. Chim. Acta 2017, 976, 63–73. [Google Scholar] [CrossRef] [Green Version]
- Liu, M.; Luo, F.; Ding, C.; Albeituni, S.; Hu, X.; Ma, Y.; Cai, Y.; McNally, L.; Sanders, M.A.; Jain, D.; et al. Dectin-1 Activation by a Natural Product beta-Glucan Converts Immunosuppressive Macrophages into an M1-like Phenotype. J. Immunol. 2015, 195, 5055–5065. [Google Scholar] [CrossRef] [PubMed]
- Jaguin, M.; Houlbert, N.; Fardel, O.; Lecureur, V. Polarization profiles of human M-CSF-generated macrophages and comparison of M1-markers in classically activated macrophages from GM-CSF and M-CSF origin. Cell. Immunol. 2013, 281, 51–61. [Google Scholar] [CrossRef] [PubMed]
- Minhas, P.S.; Liu, L.; Moon, P.K.; Joshi, A.U.; Dove, C.; Mhatre, S.; Contrepois, K.; Wang, Q.; Lee, B.A.; Coronado, M.; et al. Macrophage de novo NAD(+) synthesis specifies immune function in aging and inflammation. Nat. Immunol. 2019, 20, 50–63. [Google Scholar] [CrossRef] [PubMed]
- El Kasmi, K.C.; Stenmark, K.R. Contribution of metabolic reprogramming to macrophage plasticity and function. Semin. Immunol. 2015, 27, 267–275. [Google Scholar] [CrossRef] [Green Version]
- O’Neill, L.A. A broken krebs cycle in macrophages. Immunity 2015, 42, 393–394. [Google Scholar] [CrossRef] [Green Version]
- Palmieri, E.M.; Gonzalez-Cotto, M.; Baseler, W.A.; Davies, L.C.; Ghesquière, B.; Maio, N.; Rice, C.M.; Rouault, T.A.; Cassel, T.; Higashi, R.M.; et al. Nitric Oxide Orchestrates the Rewiring of Carbon Utilization During M1 Macrophage Polarization. Nat. Commun. 2020, 11, 698. [Google Scholar] [CrossRef]
- Nonnenmacher, Y.; Hiller, K. Biochemistry of proinflammatory macrophage activation. Cell Mol. Life Sci. 2018, 75, 2093–2109. [Google Scholar] [CrossRef] [Green Version]
- Lampropoulou, V.; Sergushichev, A.; Bambouskova, M.; Nair, S.; Vincent, E.E.; Loginicheva, E.; Cervantes-Barragan, L.; Ma, X.; Huang, S.C.; Griss, T.; et al. Itaconate Links Inhibition of Succinate Dehydrogenase with Macrophage Metabolic Remodeling and Regulation of Inflammation. Cell Metab. 2016, 24, 158–166. [Google Scholar] [CrossRef]
- Mills, E.L.; Ryan, D.G.; Prag, H.A.; Dikovskaya, D.; Menon, D.; Zaslona, Z.; Jedrychowski, M.P.; Costa, A.S.H.; Higgins, M.; Hams, E.; et al. Itaconate is an anti-inflammatory metabolite that activates Nrf2 via alkylation of KEAP1. Nature 2018, 556, 113. [Google Scholar] [CrossRef] [PubMed]
- Kwon, D.H.; Lee, H.; Park, C.; Hong, S.H.; Hong, S.H.; Kim, G.Y.; Cha, H.J.; Kim, S.; Kim, H.S.; Hwang, H.J.; et al. Glutathione Induced Immune-Stimulatory Activity by Promoting M1-Like Macrophages Polarization via Potential ROS Scavenging Capacity. Antioxidants 2019, 8, 413. [Google Scholar] [CrossRef] [PubMed] [Green Version]
- Chang, H.D.; Radbruch, A. The pro- and anti-inflammatory potential of interleukin-12. Ann. N. Y. Acad. Sci. 2007, 1109, 40–46. [Google Scholar] [CrossRef]
- Gonzalez-Dominguez, E.; Samaniego, R.; Flores-Sevilla, J.L.; Campos-Campos, S.F.; Gomez-Campos, G.; Salas, A.; Campos-Pena, V.; Corbi, A.L.; Sanchez-Mateos, P.; Sanchez-Torres, C. CD163L1 and CLEC5A discriminate subsets of human resident and inflammatory macrophages in vivo. J. Leukoc. Biol. 2015, 98, 453–466. [Google Scholar] [CrossRef]
- Sun, Q.; Fan, T.W.M.; Lane, A.N.; Higashi, R.M. Applications of chromatography-ultra high-resolution MS for stable isotope-resolved metabolomics (SIRM) reconstruction of metabolic networks. TrAC-Trends Anal. Chem. 2020, 123, 115676. [Google Scholar] [CrossRef]
- Higashi, R.M.; Fan, T.W.-M.; Lorkiewicz, P.K.; Moseley, H.N.B.; Lane, A.N. Stable Isotope Labeled Tracers for Metabolic Pathway Elucidation by GC-MS and FT-MS. In Mass Spectrometry Methods in Metabolomics; Raftery, D., Ed.; Humana: Louisville, KY, USA, 2014; Volume 1198, pp. 147–167. [Google Scholar]
- Moffett, J.R.; Namboodiri, M.A. Tryptophan and the immune response. Immunol. Cell Biol. 2003, 81, 247–265. [Google Scholar] [CrossRef] [PubMed]
- Fan, T.W.; Warmoes, M.O.; Sun, Q.; Song, H.; Turchan-Cholewo, J.; Martin, J.T.; Mahan, A.; Higashi, R.M.; Lane, A.N. Distinctly perturbed metabolic networks underlie differential tumor tissue damages induced by immune modulator beta-glucan in a two-case ex vivo non-small-cell lung cancer study. Cold Spring Harb. Mol. Case Stud. 2016, 2, a000893. [Google Scholar] [CrossRef]
- Sellers, K.; Allen, T.D.; Bousamra, M., II; Tan, J.; Mendez-Lucas, A.; Lin, W.; Bah, N.; Chernyayskaya, Y.; MacRae, J.I.; Higashi, R.M.; et al. Metabolic reprogramming and Notch activity distinguish between non-small cell lung cancer subtypes. Br. J. Cancer 2019, 121, 51–64. [Google Scholar] [CrossRef] [Green Version]
- Unger, F.T.; Bentz, S.; Krüger, J.; Rosenbrock, C.; Schaller, J.; Pursche, K.; Sprüssel, A.; Juhl, H.; David, K.A. Precision Cut Cancer Tissue Slices in Anti-Cancer Drug Testing. J. Mol. Pathophysiol. 2015, 4, 108–121. [Google Scholar] [CrossRef] [Green Version]
- Hell, S.W.; Wichmann, J. Breaking the Diffraction Resolution Limit by Stimulated-Emission–Stimulated-Emission-Depletion Fluorescence Microscopy. Opt. Lett. 1994, 19, 780–782. [Google Scholar] [CrossRef]
- Huang, B.; Bates, M.; Zhuang, X. Super-Resolution Fluorescence Microscopy. Annu. Rev. Biochem. 2009, 78, 993–1016. [Google Scholar] [CrossRef] [Green Version]
- Moore, R.P.; Legant, W.R. Improving probes for super-resolution. Nat. Methods 2018, 15, 659–660. [Google Scholar] [CrossRef] [PubMed]
- Strack, R. Gentler super-resolution microscopy. Nat. Methods 2018, 15, 764. [Google Scholar] [CrossRef] [PubMed]
- Wu, Y.; Shroff, H. Faster, sharper, and deeper: Structured illumination microscopy for biological imaging. Nat. Methods 2018, 15, 1011–1019. [Google Scholar] [CrossRef] [PubMed]
- Stringari, C.; Donovan, P.; Gratton, E. Phasor FLIM metabolic mapping of stem cells and cancer cells in live tissues. In Multiphoton Microscopy in the Biomedical Sciences Xii; Periasamy, A., Konig, K., So, P.T.C., Eds.; SPIE: Bellingham, WA, USA, 2012; Volume 8226. [Google Scholar]
- Ishikawa-Ankerhold, H.C.; Ankerhold, R.; Drummen, G.P.C. Advanced Fluorescence Microscopy Techniques—FRAP, FLIP, FLAP, FRET and FLIM. Molecules 2012, 17, 4047–4132. [Google Scholar] [CrossRef] [PubMed]
- Rose, J.; Martin, C.; MacDonald, T.; Ellis, C. High-resolution intravital NADH fluorescence microscopy allows measurements of tissue bioenergetics in rat ileal mucosa. Microcirculation 2006, 13, 41–47. [Google Scholar] [CrossRef]
- Gong, L.; Zheng, W.; Ma, Y.; Huang, Z. Higher-order coherent anti-Stokes Raman scattering microscopy realizes label-free super-resolution vibrational imaging. Nat. Photonics 2020, 14, 115–122. [Google Scholar] [CrossRef]
- Szafraniec, E.; Wiercigroch, E.; Czamara, K.; Majzner, K.; Staniszewska-Slezak, E.; Marzec, K.M.; Malek, K.; Kaczor, A.; Baranska, M. Diversity among endothelial cell lines revealed by Raman and Fourier-transform infrared spectroscopic imaging. Analyst 2018, 143, 4323–4334. [Google Scholar] [CrossRef]
- Czamara, K.; Majzner, K.; Pacia, M.Z.; Kochan, K.; Kaczor, A.; Baranska, M. Raman spectroscopy of lipids: A review. J. Raman Spectrosc. 2015, 46, 4–20. [Google Scholar] [CrossRef]
- Boellner, S.; Becker, K.-F. Reverse Phase Protein Arrays—Quantitative Assessment of Multiple Biomarkers in Biopsies for Clinical Use. Microarrays 2015, 4, 98–114. [Google Scholar] [CrossRef] [Green Version]
- de Graaf, R.A.; Brown, P.B.; Mason, G.F.; Rothman, D.L.; Behar, K.L. Detection of 1,6-C-13(2) -glucose metabolism in rat brain by in vivo H-1 C-13 -NMR spectroscopy. Magn. Reson. Med. 2003, 49, 37–46. [Google Scholar] [CrossRef]
- Glunde, K.; Bhujwalla, Z.M.; Ronen, S.M. Choline metabolism in malignant transformation. Nat. Rev. Cancer 2011, 11, 835–848. [Google Scholar] [CrossRef] [PubMed] [Green Version]
- Boumezbeur, F.; Petersen, K.F.; Cline, G.W.; Mason, G.F.; Behar, K.L.; Shulman, G.I.; Rothman, D.L. The Contribution of Blood Lactate to Brain Energy Metabolism in Humans Measured by Dynamic C-13 Nuclear Magnetic Resonance Spectroscopy. J. Neurosci. 2010, 30, 13983–13991. [Google Scholar] [CrossRef] [PubMed]
- de Graaf, R.A.; Rothman, D.L.; Behar, K.L. State of the art direct C-13 and indirect H-1- C-13 NMR spectroscopy in vivo. A practical guide. NMR Biomed. 2011, 24, 958–972. [Google Scholar] [CrossRef]
- Cheshkov, S.; Dimitrov, I.E.; Jakkamsetti, V.; Good, L.; Kelly, D.; Rajasekaran, K.; DeBerardinis, R.J.; Pascual, J.M.; Sherry, A.D.; Malloy, C.R. Oxidation of U-C-13 glucose in the human brain at 7T under steady state conditions. Magn. Reson. Med. 2017, 78, 2065–2071. [Google Scholar] [CrossRef] [PubMed] [Green Version]
- Marin-Valencia, I.; Ali Hooshyar, M.; Pichumani, K.; Sherry, A.D.; Malloy, C.R. The ratio of acetate-to-glucose oxidation in astrocytes from a single 13C NMR spectrum of cerebral cortex. J. Neurochem. 2014, 132, 99–109. [Google Scholar] [CrossRef] [PubMed] [Green Version]
- Gadian, D.G. NMR and its applications to living systems, 2nd ed.; Oxford University Press: Oxford, UK, 1995; p. 283. [Google Scholar]
- Penet, M.-F.; Bhujwalla, Z.M.; Glunde, K. Magnetic Resonance Spectroscopy in Investigating the Cancer Metabolome in Preclinical Model Systems. In Methodologies for Metabolomics; Lutz, N., Sweedler, J.V., Weevers, R.A., Eds.; Cambridge University Press: Cambridge, UK, 2013; pp. 335–376. [Google Scholar]
- Nikolaou, P.; Goodson, B.M.; Chekmenev, E.Y. NMR Hyperpolarization Techniques for Biomedicine. Chem.-Eur. J. 2015, 21, 3156–3166. [Google Scholar] [CrossRef] [Green Version]
- Brindle, K.M. Imaging Metabolism with Hyperpolarized C-13-Labeled Cell Substrates. J. Am. Chem. Soc. 2015, 137, 6418–6427. [Google Scholar] [CrossRef]
- Ardenkjaer-Larsen, J.H.; Boebinger, G.S.; Comment, A.; Duckett, S.; Edison, A.S.; Engelke, F.; Griesinger, C.; Griffin, R.G.; Hilty, C.; Maeda, H.; et al. Facing and Overcoming Sensitivity Challenges in Biomolecular NMR Spectroscopy. Angew. Chem.-Int. Ed. 2015, 54, 9162–9185. [Google Scholar] [CrossRef]
- Lane, D.; Soong, R.; Bermel, W.; Ning, P.; Majumdar, R.D.; Tabatabaei-Anaraki, M.; Heumann, H.; Gundy, M.; Boenisch, H.; Mobarhan, Y.L.; et al. Selective Amino Acid-Only in Vivo NMR: A Powerful Tool to Follow Stress Processes. ACS Omega 2019, 4, 9017–9028. [Google Scholar] [CrossRef] [Green Version]
- Lane, D.; Skinner, T.E.; Gershenzon, N.I.; Bermel, W.; Soong, R.; Majumdar, R.D.; Mobarhan, Y.L.; Schmidt, S.; Heumann, H.; Monette, M.; et al. Assessing the potential of quantitative 2D HSQC NMR in C-13 enriched living organisms. J. Biomol. NMR 2019, 73, 31–42. [Google Scholar] [CrossRef]
- Lindeboom, L.; de Graaf, R.A.; Nabuurs, C.I.; van Ewijk, P.A.; Hesselink, M.K.C.; Wildberger, J.E.; Schrauwen, P.; Schrauwen-Hinderling, V.B. Quantum coherence spectroscopy to measure dietary fat retention in the liver. JCI Insight 2016, 1, e84671. [Google Scholar] [CrossRef] [PubMed] [Green Version]
- Huber, K.; Khamehgir-Silz, P.; Schramm, T.; Gorshkov, V.; Spengler, B.; Roempp, A. Approaching cellular resolution and reliable identification in mass spectrometry imaging of tryptic peptides. Anal. Bioanal. Chem. 2018, 410, 5825–5837. [Google Scholar] [CrossRef] [PubMed] [Green Version]
- Buchberger, A.R.; DeLaney, K.; Johnson, J.; Li, L. Mass Spectrometry Imaging: A Review of Emerging Advancements and Future Insights. Anal. Chem. 2018, 90, 240–265. [Google Scholar] [CrossRef] [PubMed]
- Feenstra, A.D.; Duenas, M.E.; Lee, Y.J. Five Micron High Resolution MALDI Mass Spectrometry Imaging with Simple, Interchangeable, Multi-Resolution Optical System. J. Am. Soc. Mass Spectrom. 2017, 28, 434–442. [Google Scholar] [CrossRef]
- Roempp, A.; Spengler, B. Mass spectrometry imaging with high resolution in mass and space. Histochem. Cell Biol. 2013, 139, 759–783. [Google Scholar] [CrossRef] [Green Version]
- Drake, R.R.; McDowell, C.; West, C.; David, F.; Powers, T.W.; Nowling, T.; Bruner, E.; Mehta, A.S.; Angel, P.M.; Marlow, L.A.; et al. Defining the human kidney N-glycome in normal and cancer tissues using MALDI imaging mass spectrometry. J. Mass Spectrom. 2020, 55. [Google Scholar] [CrossRef] [Green Version]
- Angel, P.M.; Bruner, E.; Bethard, J.; Clift, C.L.; Ball, L.; Drake, R.R.; Feghali-Bostwick, C. Extracellular matrix alterations in low-grade lung adenocarcinoma compared with normal lung tissue by imaging mass spectrometry. J. Mass Spectrom. 2020, 55, e4450. [Google Scholar] [CrossRef]
- Fan, T.W.-M.; Lane, A.N.; Higashi, R.M. Stable Isotope Resolved Metabolomics Studies in ex vivo Tissue Slices. Bio-Protocol 2016, 6, e1730. [Google Scholar] [CrossRef] [PubMed] [Green Version]
- Fan, T.W.-M.; Lorkiewicz, P.; Sellers, K.; Moseley, H.N.B.; Higashi, R.M.; Lane, A.N. Stable isotope-resolved metabolomics and applications to drug development. Pharmacol. Ther. 2012, 133, 366–391. [Google Scholar] [CrossRef] [Green Version]
- Fan, T.W.-M. Sample Preparation for Metabolomics Investigation. In The Handbook of Metabolomics: Pathway and Flux Analysis, Methods in Pharmacology and Toxicology; Fan, T.W.-M., Lane, A.N., Higashi, R.M., Eds.; Springer Science: New York, NY, USA, 2012; Volume 17, pp. 7–27. [Google Scholar]
- Mattingly, S.J.; Xu, T.; Nantz, M.H.; Higashi, R.M.; Fan, T.W.M. A carbonyl capture approach for profiling oxidized metabolites in cell extracts. Metabolomics 2012, 8, 989–996. [Google Scholar] [CrossRef] [Green Version]
- Lane, A.N.; Tan, J.; Wang, Y.; Yan, J.; Higashi, R.M.; Fan, T.W.-M. Probing the metabolic phenotype of breast cancer cells by multiple tracer Stable Isotope Resolved Metabolomics. Metab. Eng. 2017, 43, 125–136. [Google Scholar] [CrossRef] [PubMed] [Green Version]
- Lane, A.N.; Yan, J.; Fan, T.W.-M. 13C Tracer Studies of Metabolism in Mouse Tumor Xenografts. Bio-Protocol 2015, 5, e1650. [Google Scholar] [CrossRef] [PubMed] [Green Version]
- Lane, A.N.; Fan, T.W.-M. NMR-based Stable Isotope Resolved Metabolomics in systems biochemistry. Arch. Biochem. Biophys. 2017, 628, 123–131. [Google Scholar] [CrossRef] [PubMed]
- Le, A.; Lane, A.N.; Hamaker, M.; Bose, S.; Barbi, J.; Tsukamoto, T.; Rojas, C.J.; Slusher, B.S.; Zhang, H.; Zimmerman, L.J.; et al. Myc induction of hypoxic glutamine metabolism and a glucose-independent TCA cycle in human B lymphocytes. Cell Metab. 2012, 15, 110–121. [Google Scholar] [CrossRef] [PubMed] [Green Version]


| Scale | Heterogeneity | Examples | Refs. |
|---|---|---|---|
| Global | Cell types | Normal and transformed epithelia, fibroblasts, endothelia, and resident and infiltrating immune cells. | Figure 1; [14,15] |
| Regional | Cancer cellularity | < 10 - > 90% of total cells | [16,17] |
| Regional | vascularity | Restricted flow -> local hypoxia, nutrient deprivation, waste buildup; gradients in IF impacts on cell gene expression. | [18,19,20,21] |
| Regional/local | Disrupted ECM and tissue organization | Altered cell interactions: impacts on cell gene expression. | [21,22] |
| Regional/local | Cell–cell interactions | Direct cell contacts versus interaction via diffusible molecules: altered behavior of T cells, macrophage polarization (TAMs), and fibroblast activity (CAFs). | [23,24] |
| Global | Cell–cell interactions | Tissue polarity impacts cell function by position - cells or groups of cells have different metabolic activities according to position, and different cell types have different metabolic activities. The “intrinsic” metabolic phenotypes of cells are greatly influenced by interactions within heterogeneous tissues. | [25,26] |
| Regional/local | Cell distribution | Cell distribution is highly heterogeneous (clumps and voids—regional versus cellular heterogeneity). | Figure 1; [27,28] |
| Local | Cells | Cells within tumors may have different expression patterns as well as different genome alterations. Expression patterns may vary in part from environmental influences on epigenetics (chromatin structure). | [24,29,30] |
| Regional | Necrosis | Heterogeneous because of variable necrosis in different regions of the tumor | [31] |
| Organ | Tissue-dependent tumors; subtypes | Tumors of the same tissue origin are heterogeneous—subtypes (adeno versus squamous versus NET etc.) that are characterized by different functional properties. Some subtypes can interconvert (cf. lung adenosquamous phenotype). Cancer cells can also undergo EMT. Cells may de-differentiate or even trans differentiate. | [32,33,34,35,36,37,38] |
| Local | Cell structure | Cells are compartmented and heterogeneous. | [39] |
© 2020 by the authors. Licensee MDPI, Basel, Switzerland. This article is an open access article distributed under the terms and conditions of the Creative Commons Attribution (CC BY) license (http://creativecommons.org/licenses/by/4.0/).
Share and Cite
Fan, T.W.-M.; Higashi, R.M.; Chernayavskaya, Y.; Lane, A.N. Resolving Metabolic Heterogeneity in Experimental Models of the Tumor Microenvironment from a Stable Isotope Resolved Metabolomics Perspective. Metabolites 2020, 10, 249. https://doi.org/10.3390/metabo10060249
Fan TW-M, Higashi RM, Chernayavskaya Y, Lane AN. Resolving Metabolic Heterogeneity in Experimental Models of the Tumor Microenvironment from a Stable Isotope Resolved Metabolomics Perspective. Metabolites. 2020; 10(6):249. https://doi.org/10.3390/metabo10060249
Chicago/Turabian StyleFan, Teresa W. -M., Richard M. Higashi, Yelena Chernayavskaya, and Andrew N. Lane. 2020. "Resolving Metabolic Heterogeneity in Experimental Models of the Tumor Microenvironment from a Stable Isotope Resolved Metabolomics Perspective" Metabolites 10, no. 6: 249. https://doi.org/10.3390/metabo10060249