Distinct Microbiota Dysbiosis in Patients with Non-Erosive Reflux Disease and Esophageal Adenocarcinoma

 ,
,  ,
,
Abstract
:1. Introduction
2. Material and Methods
2.1. Study Design and Sampling
2.2. Esophageal Microbiome Analysis
2.3. Esophageal Proteome Analysis
3. Results
3.1. Characteristics of the GERD and EAC Mucosal Microbiota
3.2. Key OTUs Correlating with GERD Progression and EAC
3.3. Functional Alteration in GERD and EAC Host Mucosal Proteome
3.4. Effects of Proton Pump Inhibitor on Microbiota and Mucosal Proteome
4. Discussion
Supplementary Materials
Author Contributions
Funding
Acknowledgments
Conflicts of Interest
References
- El-Serag, H.B. Time trends of gastroesophageal reflux disease: A systematic review. Clin. Gastroenterol. Hepatol. 2007, 5, 17–26. [Google Scholar] [CrossRef]
- Tack, J.; Pandolfino, J.E. Pathophysiology of Gastroesophageal Reflux Disease. Gastroenterology 2018, 154, 277–288. [Google Scholar] [CrossRef]
- Fass, R. Non-erosive reflux disease (NERD) and erosive esophagitis—A spectrum of disease or special entities? Z Gastroenterol. 2007, 45, 1156–1163. [Google Scholar] [CrossRef]
- Devesa, S.S.; Blot, W.J.; Fraumeni, J.F., Jr. Changing patterns in the incidence of esophageal and gastric carcinoma in the United States. Cancer 1998, 83, 2049–2053. [Google Scholar] [CrossRef]
- Chang, J.T.; Katzka, D.A. Gastroesophageal reflux disease, Barrett esophagus, and esophageal adenocarcinoma. Arch. Intern. Med. 2004, 164, 1482–1488. [Google Scholar] [CrossRef] [Green Version]
- Ceranowicz, P.; Warzecha, Z.; Dembinski, A. Peptidyl hormones of endocrine cells origin in the gut--their discovery and physiological relevance. J. Physiol. Pharmacol. 2015, 66, 11–27. [Google Scholar]
- Yang, L.; Lu, X.; Nossa, C.W.; Francois, F.; Peek, R.M.; Pei, Z. Inflammation and intestinal metaplasia of the distal esophagus are associated with alterations in the microbiome. Gastroenterology 2009, 137, 588–597. [Google Scholar] [CrossRef] [Green Version]
- Blackett, K.L.; Siddhi, S.S.; Cleary, S.; Steed, H.; Miller, M.H.; Macfarlane, S.; Macfarlane, G.T.; Dillon, J.F. Oesophageal bacterial biofilm changes in gastro-oesophageal reflux disease, Barrett’s and oesophageal carcinoma: Association or causality? Aliment. Pharmacol. Ther. 2013, 37, 1084–1092. [Google Scholar] [CrossRef] [PubMed]
- Liu, N.; Ando, T.; Ishiguro, K.; Maeda, O.; Watanabe, O.; Funasaka, K.; Nakamura, M.; Miyahara, R.; Ohmiya, N.; Goto, H. Characterization of bacterial biota in the distal esophagus of Japanese patients with reflux esophagitis and Barrett’s esophagus. BMC Infect. Dis. 2013, 13, 130. [Google Scholar] [CrossRef] [Green Version]
- Martin, M. Cutadapt removes adapter sequences from high-throughput sequencing reads. EMBnet. J. 2011, 17, 10–12. [Google Scholar] [CrossRef]
- Caporaso, J.G.; Kuczynski, J.; Stombaugh, J.; Bittinger, K.; Bushman, F.D.; Costello, E.K.; Fierer, N.; Pena, A.G.; Goodrich, J.K.; Gordon, J.I.; et al. QIIME allows analysis of high-throughput community sequencing data. Nat. Methods 2010, 7, 335–336. [Google Scholar] [CrossRef] [Green Version]
- DeSantis, T.Z.; Hugenholtz, P.; Larsen, N.; Rojas, M.; Brodie, E.L.; Keller, K.; Huber, T.; Dalevi, D.; Hu, P.; Andersen, G.L. Greengenes, a chimera-checked 16S rRNA gene database and workbench compatible with ARB. Appl. Environ. Microbiol. 2006, 72, 5069–5072. [Google Scholar] [CrossRef] [Green Version]
- Anderson, M.J. A new method for non-parametric multivariate analysis of variance. Austral Ecol. 2001, 26, 32–46. [Google Scholar]
- Anderson, M.J. Distance-based tests for homogeneity of multivariate dispersions. Biometrics 2006, 62, 245–253. [Google Scholar] [CrossRef]
- Wang, Y.; Naumann, U.; Wright, S.T.; Warton, D.I. Mvabund—An R package for model-based analysis of multivariate abundance data. Methods Ecol. Evol. 2012, 3, 471–474. [Google Scholar] [CrossRef]
- Szklarczyk, D.; Gable, A.L.; Lyon, D.; Junge, A.; Wyder, S.; Huerta-Cepas, J.; Simonovic, M.; Doncheva, N.T.; Morris, J.H.; Bork, P.; et al. STRING v11: Protein-protein association networks with increased coverage, supporting functional discovery in genome-wide experimental datasets. Nucleic Acids Res. 2019, 47, D607–D613. [Google Scholar] [CrossRef] [PubMed] [Green Version]
- Lind, T.; Havelund, T.; Carlsson, R.; Anker-Hansen, O.; Glise, H.; Hernqvist, H.; Junghard, O.; Lauritsen, K.; Lundell, L.; Pedersen, S.A.; et al. Heartburn without oesophagitis: Efficacy of omeprazole therapy and features determining therapeutic response. Scand. J. Gastroenterol. 1997, 32, 974–979. [Google Scholar] [CrossRef]
- Fass, R.; Fennerty, M.B.; Vakil, N. Nonerosive reflux disease—Current concepts and dilemmas. Am. J. Gastroenterol. 2001, 96, 303–314. [Google Scholar] [CrossRef] [PubMed]
- Yamasaki, T.; Fass, R. Reflux Hypersensitivity: A New Functional Esophageal Disorder. J. Neurogastroenterol. Motil. 2017, 23, 495–503. [Google Scholar] [CrossRef] [Green Version]
- Calabrese, C.; Marzano, V.; Urbani, A.; Lazzarini, G.; Valerii, M.C.; Liguori, G.; Di Molfetta, S.; Rizzello, F.; Gionchetti, P.; Campieri, M.; et al. Distinct proteomic profiles characterise non-erosive from erosive reflux disease. Aliment. Pharmacol. Ther. 2011, 34, 982–993. [Google Scholar] [CrossRef]
- Crouzet, L.; Gaultier, E.; Del’Homme, C.; Cartier, C.; Delmas, E.; Dapoigny, M.; Fioramonti, J.; Bernalier-Donadille, A. The hypersensitivity to colonic distension of IBS patients can be transferred to rats through their fecal microbiota. Neurogastroenterol. Motil. 2013, 25, e272–e282. [Google Scholar] [CrossRef] [PubMed]
- Blachier, F.; Davila, A.M.; Mimoun, S.; Benetti, P.H.; Atanasiu, C.; Andriamihaja, M.; Benamouzig, R.; Bouillaud, F.; Tome, D. Luminal sulfide and large intestine mucosa: Friend or foe? Amino Acids 2010, 39, 335–347. [Google Scholar] [CrossRef] [PubMed]
- Fillon, S.A.; Harris, J.K.; Wagner, B.D.; Kelly, C.J.; Stevens, M.J.; Moore, W.; Fang, R.; Schroeder, S.; Masterson, J.C.; Robertson, C.E.; et al. Novel device to sample the esophageal microbiome—The esophageal string test. PLoS ONE 2012, 7, e42938. [Google Scholar] [CrossRef]
- Pei, Z.; Yang, L.; Peek, R.M.; Levine, S.M., Jr.; Pride, D.T.; Blaser, M.J. Bacterial biota in reflux esophagitis and Barrett’s esophagus. World J. Gastroenterol. 2005, 11, 7277–7283. [Google Scholar] [CrossRef]
- Snider, E.J.; Freedberg, D.E.; Abrams, J.A. Potential Role of the Microbiome in Barrett’s Esophagus and Esophageal Adenocarcinoma. Dig. Dis. Sci. 2016, 61, 2217–2225. [Google Scholar] [CrossRef] [Green Version]
- Eross, B.; Farkas, N.; Vincze, A.; Tinusz, B.; Szapary, L.; Garami, A.; Balasko, M.; Sarlos, P.; Czopf, L.; Alizadeh, H.; et al. Helicobacter pylori infection reduces the risk of Barrett’s esophagus: A meta-analysis and systematic review. Helicobacter 2018, 23, e12504. [Google Scholar] [CrossRef] [Green Version]
- Blaser, M.J. Helicobacter pylori and esophageal disease: Wake-up call? Gastroenterology 2010, 139, 1819–1822. [Google Scholar] [CrossRef] [Green Version]
- Warzecha, Z.; Dembinski, A.; Ceranowicz, P.; Dembinski, M.; Sendur, R.; Pawlik, W.W.; Konturek, S.J. Deleterious effect of Helicobacter pylori infection on the course of acute pancreatitis in rats. Pancreatology 2002, 2, 386–395. [Google Scholar] [CrossRef] [PubMed]
- Hsieh, L.Y. Understanding the Fibroblast-Extracellular Matrix Interaction Regarding Tissue Remodeling in EoE. Ph.D. Thesis, UC San Diego, San Diego, CA, USA, 2019. [Google Scholar]
- Zhao, J.; Chang, A.C.; Li, C.; Shedden, K.A.; Thomas, D.G.; Misek, D.E.; Manoharan, A.P.; Giordano, T.J.; Beer, D.G.; Lubman, D.M. Comparative proteomics analysis of Barrett metaplasia and esophageal adenocarcinoma using two-dimensional liquid mass mapping. Mol. Cell. Proteom. 2007, 6, 987–999. [Google Scholar] [CrossRef]
- Hannon, R.; Croxtall, J.D.; Getting, S.J.; Roviezzo, F.; Yona, S.; Paul-Clark, M.J.; Gavins, F.N.; Perretti, M.; Morris, J.F.; Buckingham, J.C.; et al. Aberrant inflammation and resistance to glucocorticoids in annexin 1-/-mouse. FASEB J. 2003, 17, 253–255. [Google Scholar] [CrossRef] [Green Version]
- Takaoka, R.T.C.; Sertorio, N.D.; Magalini, L.P.J.; Dos Santos, L.M.; Souza, H.R.; Iyomasa-Pilon, M.M.; Possebon, L.; Costa, S.S.; Girol, A.P. Expression profiles of Annexin A1, formylated peptide receptors and cyclooxigenase-2 in gastroesophageal inflammations and neoplasias. Pathol. Res. Pract. 2018, 214, 181–186. [Google Scholar] [CrossRef] [Green Version]
- Brabender, J.; Lord, R.V.; Wickramasinghe, K.; Metzger, R.; Schneider, P.M.; Park, J.M.; Holscher, A.H.; DeMeester, T.R.; Danenberg, K.D.; Danenberg, P.V. Glutathione S-transferase-pi expression is downregulated in patients with Barrett′s esophagus and esophageal adenocarcinoma. J. Gastrointest. Surg. 2002, 6, 359–367. [Google Scholar] [CrossRef]
- Jankowski, J.A.; Harrison, R.F.; Perry, I.; Balkwill, F.; Tselepis, C. Barrett’s metaplasia. Lancet 2000, 356, 2079–2085. [Google Scholar] [CrossRef]
- Stairs, D.B.; Nakagawa, H.; Klein-Szanto, A.; Mitchell, S.D.; Silberg, D.G.; Tobias, J.W.; Lynch, J.P.; Rustgi, A.K. Cdx1 and c-Myc foster the initiation of transdifferentiation of the normal esophageal squamous epithelium toward Barrett’s esophagus. PLoS ONE 2008, 3, e3534. [Google Scholar] [CrossRef] [Green Version]
- Jackson, M.A.; Goodrich, J.K.; Maxan, M.E.; Freedberg, D.E.; Abrams, J.A.; Poole, A.C.; Sutter, J.L.; Welter, D.; Ley, R.E.; Bell, J.T.; et al. Proton pump inhibitors alter the composition of the gut microbiota. Gut 2016, 65, 749–756. [Google Scholar] [CrossRef] [PubMed] [Green Version]
- Freedberg, D.E.; Toussaint, N.C.; Chen, S.P.; Ratner, A.J.; Whittier, S.; Wang, T.C.; Wang, H.H.; Abrams, J.A. Proton Pump Inhibitors Alter Specific Taxa in the Human Gastrointestinal Microbiome: A Crossover Trial. Gastroenterology 2015, 149, 883–885. [Google Scholar] [CrossRef] [PubMed] [Green Version]
- Rosen, R.; Amirault, J.; Liu, H.; Mitchell, P.; Hu, L.; Khatwa, U.; Onderdonk, A. Changes in gastric and lung microflora with acid suppression: Acid suppression and bacterial growth. JAMA Pediatrics 2014, 168, 932–937. [Google Scholar] [CrossRef] [PubMed] [Green Version]
- Amir, I.; Konikoff, F.M.; Oppenheim, M.; Gophna, U.; Half, E.E. Gastric microbiota is altered in oesophagitis and Barrett’s oesophagus and further modified by proton pump inhibitors. Environ. Microbiol. 2014, 16, 2905–2914. [Google Scholar] [CrossRef]
- Li, D.; Deconda, D.; Li, A.; Habr, F.; Cao, W. Effect of Proton Pump Inhibitor Therapy on NOX5, mPGES1 and iNOS expression in Barrett’s Esophagus. Sci. Rep. 2019, 9, 16242. [Google Scholar] [CrossRef] [Green Version]
- Dall’Olmo, L.; Fassan, M.; Dassie, E.; Scarpa, M.; Realdon, S.; Cavallin, F.; Cagol, M.; Battaglia, G.; Pizzi, M.; Guzzardo, V.; et al. Role of proton pump inhibitor on esophageal carcinogenesis and pancreatic acinar cell metaplasia development: An experimental in vivo study. PLoS ONE 2014, 9, e112862. [Google Scholar] [CrossRef]
- Hu, Q.; Sun, T.T.; Hong, J.; Fang, J.Y.; Xiong, H.; Meltzer, S.J. Proton Pump Inhibitors Do Not Reduce the Risk of Esophageal Adenocarcinoma in Patients with Barrett’s Esophagus: A Systematic Review and Meta-Analysis. PLoS ONE 2017, 12, e0169691. [Google Scholar] [CrossRef] [Green Version]
- Lau, W.F.; Wong, J.; Lam, K.H.; Ong, G.B. Oesophageal microbial flora in carcinoma of the oesophagus. ANZ J. Surg. 1981, 51, 52–55. [Google Scholar] [CrossRef]
- Finlay, I.G.; Wright, P.A.; Menzies, T.; McArdle, C.S. Microbial flora in carcinoma of oesophagus. Thorax 1982, 37, 181–184. [Google Scholar] [CrossRef] [Green Version]
- Elliott, D.R.F.; Walker, A.W.; O’Donovan, M.; Parkhill, J.; Fitzgerald, R.C. A non-endoscopic device to sample the oesophageal microbiota: A case-control study. Lancet Gastroenterol. Hepatol. 2017, 2, 32–42. [Google Scholar] [CrossRef] [Green Version]
- Dembinski, A.; Warzecha, Z.; Ceranowicz, P.; Dembinski, M.; Cieszkowski, J.; Gosiewski, T.; Bulanda, M.; Kusnierz-Cabala, B.; Galazka, K.; Konturek, P.C. Synergic Interaction of Rifaximin and Mutaflor (Escherichia coli Nissle 1917) in the Treatment of Acetic Acid-Induced Colitis in Rats. Gastroenterol. Res. Pract. 2016, 2016, 3126280. [Google Scholar] [CrossRef] [Green Version]
- Madsen, K.; Cornish, A.; Soper, P.; McKaigney, C.; Jijon, H.; Yachimec, C.; Doyle, J.; Jewell, L.; De Simone, C. Probiotic bacteria enhance murine and human intestinal epithelial barrier function. Gastroenterology 2001, 121, 580–591. [Google Scholar] [CrossRef] [Green Version]
- San-Millan, I.; Brooks, G.A. Reexamining cancer metabolism: Lactate production for carcinogenesis could be the purpose and explanation of the Warburg Effect. Carcinogenesis 2017, 38, 119–133. [Google Scholar] [CrossRef]
- Huhta, H.; Helminen, O.; Palomaki, S.; Kauppila, J.H.; Saarnio, J.; Lehenkari, P.P.; Karttunen, T.J. Intratumoral lactate metabolism in Barrett’s esophagus and adenocarcinoma. Oncotarget 2017, 8, 22894–22902. [Google Scholar] [CrossRef] [Green Version]
- Doherty, J.R.; Cleveland, J.L. Targeting lactate metabolism for cancer therapeutics. J. Clin. Investig. 2013, 123, 3685–3692. [Google Scholar] [CrossRef]
- Sonveaux, P.; Copetti, T.; De Saedeleer, C.J.; Vegran, F.; Verrax, J.; Kennedy, K.M.; Moon, E.J.; Dhup, S.; Danhier, P.; Frerart, F.; et al. Targeting the lactate transporter MCT1 in endothelial cells inhibits lactate-induced HIF-1 activation and tumor angiogenesis. PLoS ONE 2012, 7, e33418. [Google Scholar] [CrossRef]
- Vinasco, K.; Mitchell, H.M.; Kaakoush, N.O.; Castano-Rodriguez, N. Microbial carcinogenesis: Lactic acid bacteria in gastric cancer. Biochim. Biophys. Acta Rev. Cancer 2019, 1872, 188309. [Google Scholar] [CrossRef] [PubMed]
- Lertpiriyapong, K.; Whary, M.T.; Muthupalani, S.; Lofgren, J.L.; Gamazon, E.R.; Feng, Y.; Ge, Z.; Wang, T.C.; Fox, J.G. Gastric colonisation with a restricted commensal microbiota replicates the promotion of neoplastic lesions by diverse intestinal microbiota in the Helicobacter pylori INS-GAS mouse model of gastric carcinogenesis. Gut 2014, 63, 54–63. [Google Scholar] [CrossRef] [PubMed] [Green Version]
- Wu, G.D.; Chen, J.; Hoffmann, C.; Bittinger, K.; Chen, Y.Y.; Keilbaugh, S.A.; Bewtra, M.; Knights, D.; Walters, W.A.; Knight, R.; et al. Linking long-term dietary patterns with gut microbial enterotypes. Science 2011, 334, 105–108. [Google Scholar] [CrossRef] [Green Version]
- Zhao, X.; Liu, X.W.; Xie, N.; Wang, X.H.; Cui, Y.; Yang, J.W.; Chen, L.L.; Lu, F.G. Lactobacillus species shift in distal esophagus of high-fat-diet-fed rats. World J. Gastroenterol. 2011, 17, 3151–3157. [Google Scholar] [CrossRef]
- Xu, F.; Laguna, L.; Sarkar, A. Aging-related changes in quantity and quality of saliva: Where do we stand in our understanding? J. Texture Stud. 2019, 50, 27–35. [Google Scholar] [CrossRef] [Green Version]
- Konturek, S.J.; Dembinski, A.; Warzecha, Z.; Brzozowski, T.; Gregory, H. Role of epidermal growth factor in healing of chronic gastroduodenal ulcers in rats. Gastroenterology 1988, 94, 1300–1307. [Google Scholar] [CrossRef]
- Warzecha, Z.; Kownacki, P.; Ceranowicz, P.; Dembinski, M.; Cieszkowski, J.; Dembinski, A. Ghrelin accelerates the healing of oral ulcers in non-sialoadenectomized and sialoadenectomized rats. J. Physiol. Pharmacol. 2013, 64, 657–668. [Google Scholar] [PubMed]
- Chen, X.; Winckler, B.; Lu, M.; Cheng, H.; Yuan, Z.; Yang, Y.; Jin, L.; Ye, W. Oral Microbiota and Risk for Esophageal Squamous Cell Carcinoma in a High-Risk Area of China. PLoS ONE 2015, 10, e0143603. [Google Scholar] [CrossRef]
- Roesch-Ely, M.; Leipold, A.; Nees, M.; Holzinger, D.; Dietz, A.; Flechtenmacher, C.; Wolf, T.; Zapatka, M.; Bosch, F.X. Proteomic analysis of field cancerization in pharynx and oesophagus: A prospective pilot study. J. Pathol. 2010, 221, 462–470. [Google Scholar] [CrossRef]
- O’Neill, J.R.; Pak, H.S.; Pairo-Castineira, E.; Save, V.; Paterson-Brown, S.; Nenutil, R.; Vojtesek, B.; Overton, I.; Scherl, A.; Hupp, T.R. Quantitative Shotgun Proteomics Unveils Candidate Novel Esophageal Adenocarcinoma (EAC)-specific Proteins. Mol. Cell. Proteom. 2017, 16, 1138–1150. [Google Scholar] [CrossRef] [Green Version]
- Danesh, B.J.; Burke, M.; Newman, J.; Aylott, A.; Whitfield, P.; Cotton, P.B. Comparison of weight, depth, and diagnostic adequacy of specimens obtained with 16 different biopsy forceps designed for upper gastrointestinal endoscopy. Gut 1985, 26, 227–231. [Google Scholar] [CrossRef] [PubMed] [Green Version]


| Group | Control | NERD | RE | BE | EAC |
|---|---|---|---|---|---|
| Variables | |||||
| Subjects | 16 | 11 | 20 | 17 | 6 |
| Gender (male: female) | 2:14 | 3:9 | 6:14 | 12:5 | 6:0 |
| Median age (quartile 1–quartile 3) | 52 (36–64) | 63 (66–51) | 55 (43–65) | 58 (49–69) | 67 (62–70) |
| Reflux symptoms | 0 | 11 (100%) | 18 (90%) | 10 (59%) | 3 (50%) |
| Reflux-medication | |||||
| Proton pump inhibitor | 0 | 4 (36%) | 10 (50%) | 10 (59%) | 1 (17%) |
| Inflammation/presence of lymphocytes | 0 | 0 | 17 (85%) | 4 (24%) | 1 (17%) |
| Abnormal cell morphology | |||||
| Hyperplasia | 0 | 0 | 7 (35%) | 0 | 0 |
| Metaplasia | 0 | 0 | 0 | 16 (94%) | 0 |
| Dysplasia | 0 | 0 | 0 | 1 (6%) | |
| Adenocarcinoma | 0 | 0 | 0 | 0 | 6 (100%) |
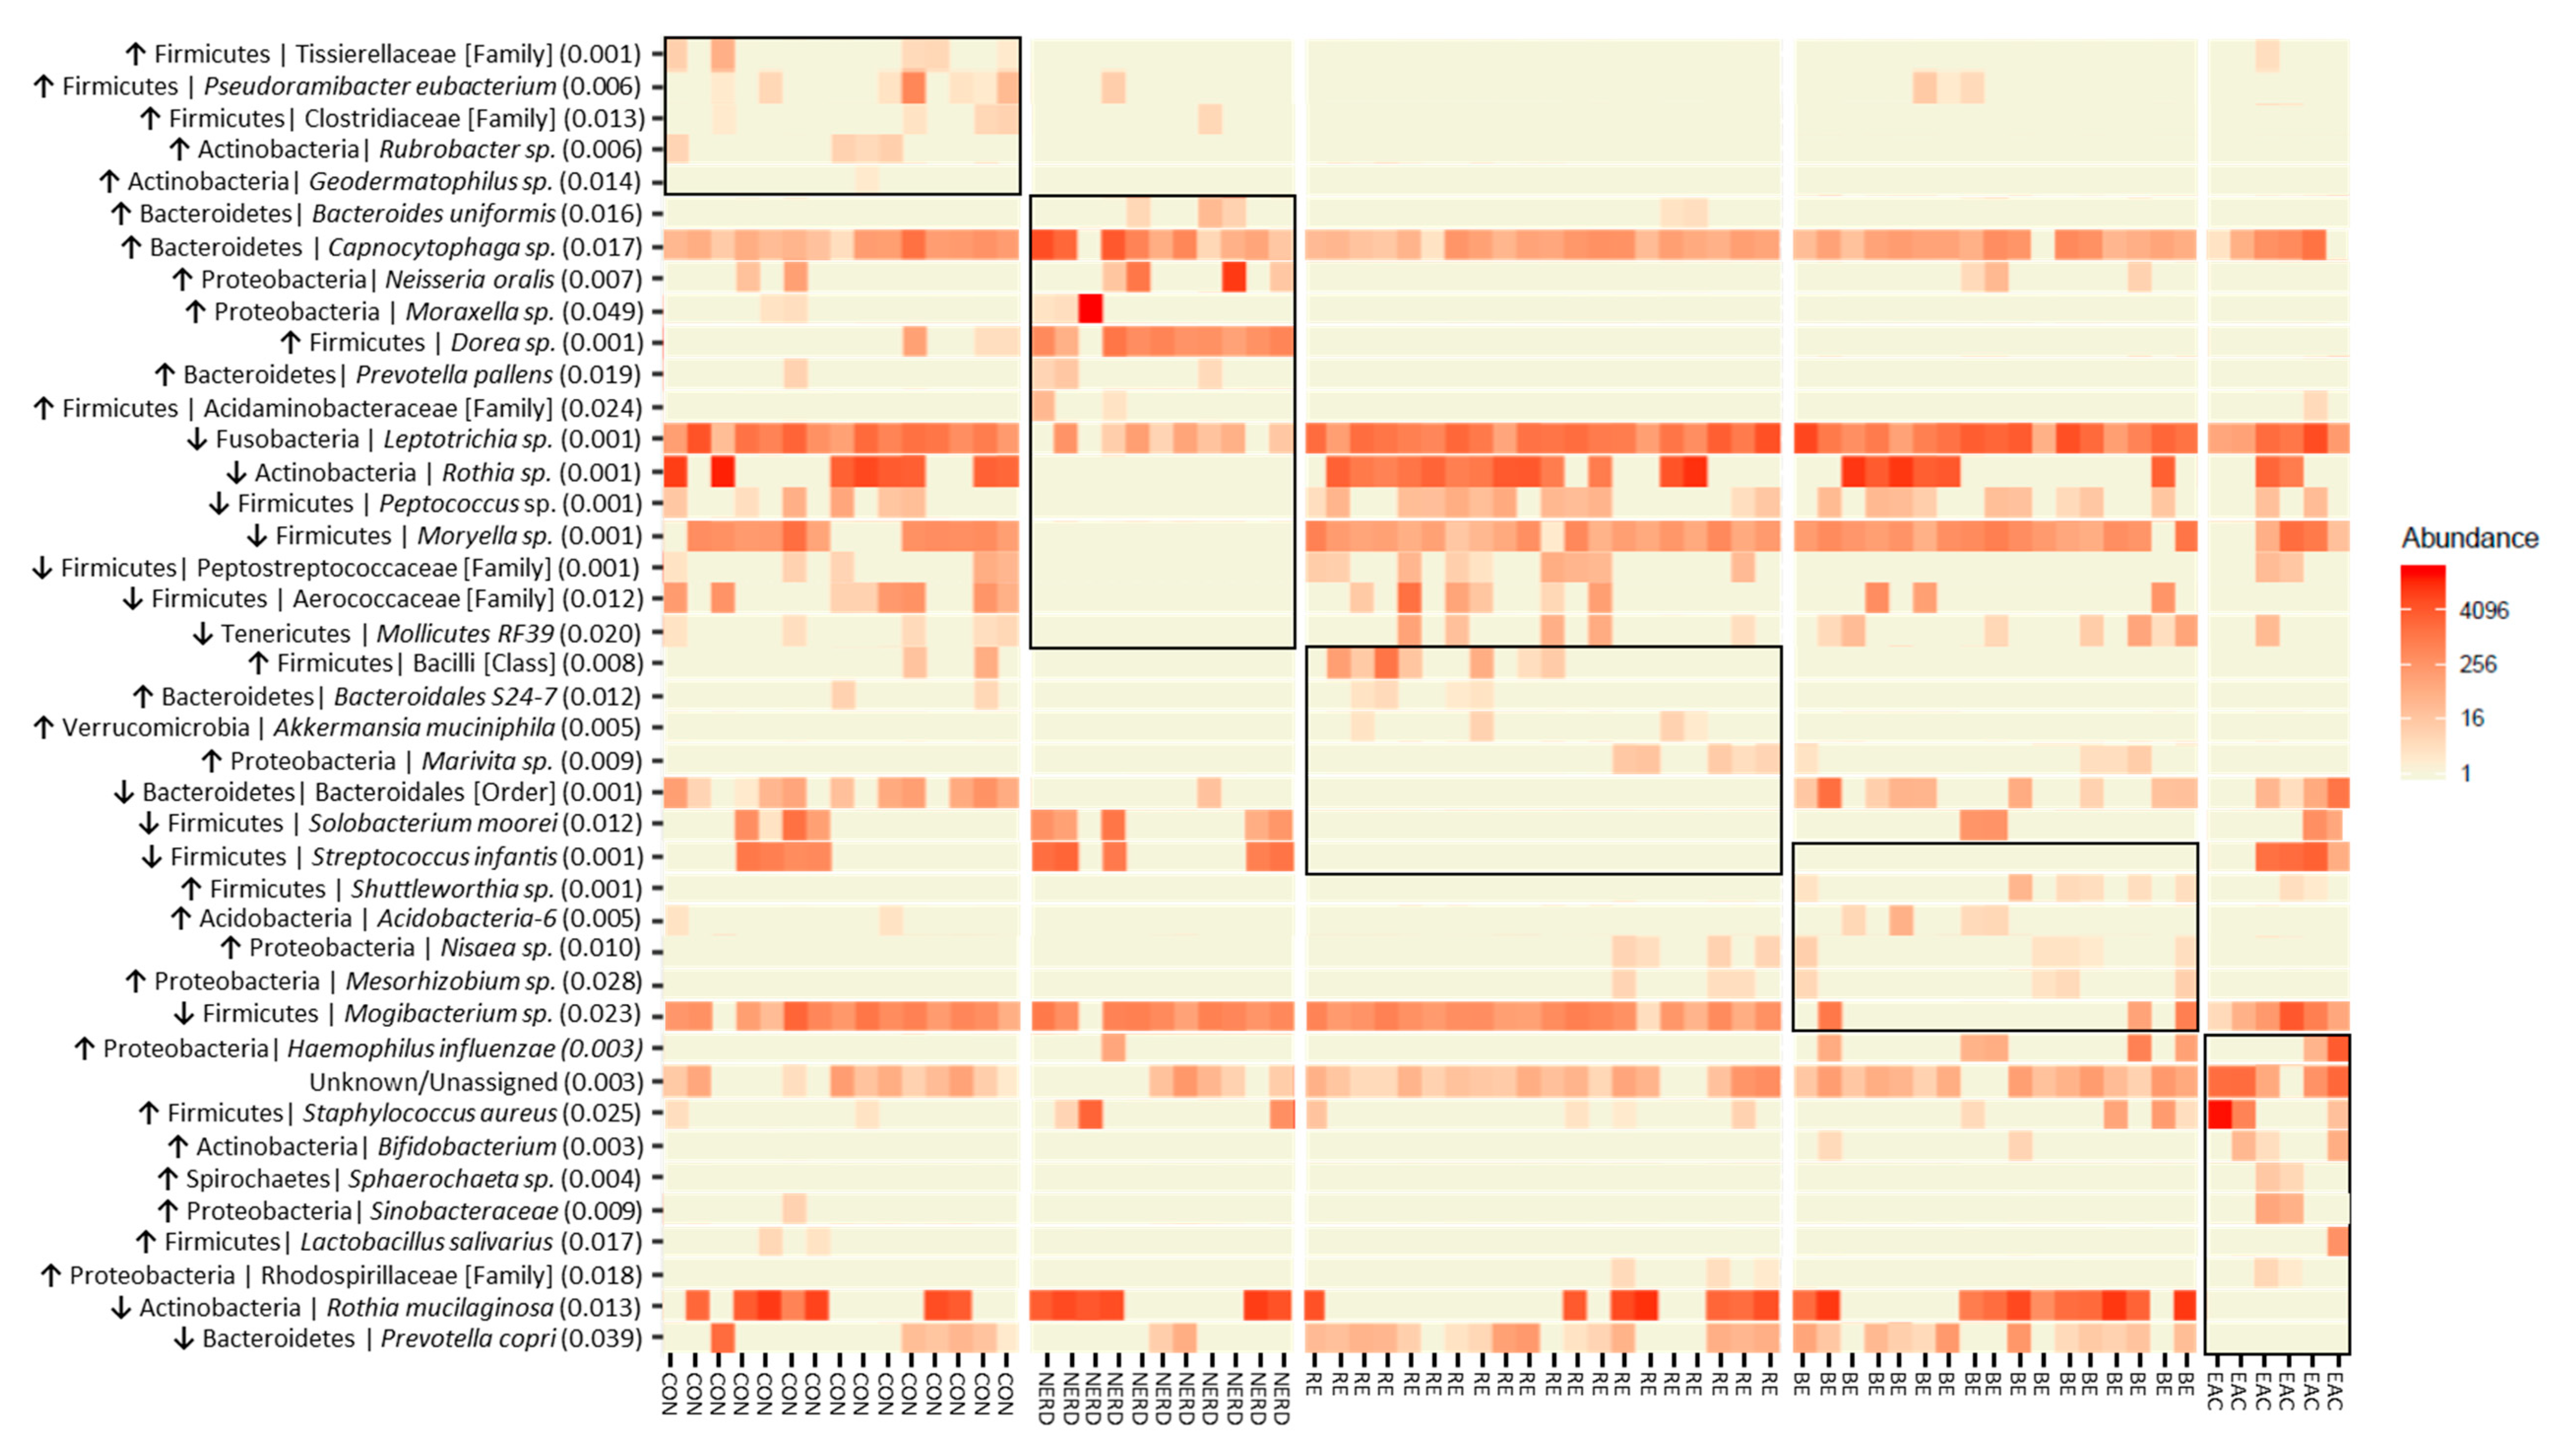
| OTUs | p-Value | Distinct Group/s | Significant Pairs (p-Value < 0.05) |
|---|---|---|---|
| Firmicutes | Tissierellaceae [Family] | 0.001 | Highest in Control | NERD–Control (0.027); RE–Control (0.002); BE–Control (0.011) |
| Firmicutes | Pseudoramibacter eubacterium | 0.006 | Highest in Control | RE–Control (0.001); RE–BE (0.031) |
| Firmicutes | Clostridiaceae [Family] | 0.013 | Highest in Control | RE–Control (0.005); BE–Control (0.012) |
| Actinobacteria | Rubrobacter | 0.006 | Highest in Control | NERD–Control (0.037); RE–Control (0.009); BE–Control (0.047) |
| Actinobacteria | Geodermatophilus | 0.014 | Highest in Control | RE–Control (0.022); BE–Control (0.044) |
| Bacteroidetes | Bacteroides uniformis | 0.016 | Highest in NERD | Control–NERD (0.026); BE–NERD (0.016) |
| Bacteroidetes | Capnocytophaga | 0.017 | Highest in NERD | RE–NERD (0.009); BE–NERD (0.023); BE–EAC (0.046) |
| Proteobacteria | Neisseria oralis | 0.007 | Highest in NERD | RE–NERD (0.004); EAC–NERD (0.008) |
| Proteobacteria | Moraxella | 0.049 | Highest in NERD | BE–NERD (0.025) |
| Firmicutes | Dorea | 0.001 | Highest in NERD | Control–NERD (0.001); RE–NERD (0.001); BE–NERD (0.001); EAC–NERD (0.001); RE–Control (0.016) |
| Bacteroidetes | Prevotella pallens | 0.019 | Highest in NERD | RE–NERD (0.017); BE–NERD (0.014) |
| Firmicutes | Acidaminobacteraceae [Family] | 0.024 | Highest in NERD | BE–NERD (0.047); RE–NERD (0.047) |
| Fusobacteria | Leptotrichia | 0.001 | Lowest in NERD | NERD–Control (0.001); NERD–RE (0.001); NERD–BE (0.001); NERD–EAC (0.005) |
| Actinobacteria | Rothia | 0.001 | Lowest in NERD | NERD–Control (0.002); NERD–RE (0.001); NERD–BE (0.007); NERD–EAC (0.029) |
| Firmicutes | Peptococcus | 0.001 | Lowest in NERD | NERD–Control (0.012); NERD–RE (0.001); NERD–BE (0.002); NERD–EAC (0.027) |
| Firmicutes | Moryella | 0.001 | Lowest in NERD | NERD–Control (0.001); NERD–RE (0.001); NERD–BE (0.001); NERD–EAC (0.001) |
| Firmicutes | Peptostreptococcaceae [Family] | 0.001 | Lowest in NERD | NERD–Control (0.009); NERD–RE (0.004); NERD–EAC (0.036); BE–RE (0.002); EAC–RE (0.022); Control–BE (0.003) |
| Firmicutes | Aerococcaceae [Family] | 0.012 | Lowest in NERD | NERD–Control (0.002); NERD–RE (0.022); EAC–Control (0.011) |
| Tenericutes | Mollicutes RF39 [Order] | 0.020 | Lowest in NERD | NERD–Control (0.012); NERD–RE (0.028); NERD–BE (0.008) |
| Firmicutes | Bacilli [Class] | 0.008 | Highest in RE | NERD–RE (0.013); BE–RE (0.002) |
| Bacteroidetes | Bacteroidales S24-7 | 0.012 | Highest in RE | NERD–RE (0.012); BE–RE (0.010); BE–Control (0.030) |
| Verrucomicrobia | Akkermansia muciniphila | 0.005 | Highest in RE | Control–RE (0.011); NERD–RE (0.022); BE–RE (0.011) |
| Proteobacteria | Marivita | 0.009 | Highest in RE | Control–RE (0.022); NERD–RE (0.026); Control–BE (0.028) |
| Bacteroidetes | Bacteroidales [Order] | 0.001 | Lowest in RE | NERD–Control (0.003); RE–Control (0.001); RE–BE (0.002); RE–EAC (0.001) |
| Firmicutes | Solobacterium moorei | 0.012 | Lowest in RE | RE–Control (0.010); RE–NERD (0.004); RE–EAC (0.013) |
| Firmicutes | Streptococcus infantis | 0.001 | Low in RE/BE | RE–Control (0.012); RE–NERD (0.004); RE–EAC (0.002); BE–Control (0.015); BE–NERD (0.001); BE–EAC (0.001) |
| Firmicutes | Shuttleworthia | 0.001 | Highest in BE | Control–BE (0.004); NERD–BE (0.017); RE–BE (0.002); EAC–BE (0.003); NERD–EAC (0.007); Control–EAC (0.004) |
| Acidobacteria | Acidobacteria-6 | 0.005 | Highest in BE | RE–BE (0.006); NERD–BE (0.035); RE–Control (0.015) |
| Proteobacteria | Nisaea | 0.010 | Highest in BE | Control–BE (0.009); NERD–BE (0.024); Control–RE (0.043) |
| Proteobacteria | Mesorhizobium | 0.028 | Highest in BE | Control–BE (0.022); NERD–BE (0.041) |
| Firmicutes | Mogibacterium | 0.023 | Lowest in BE | BE–Control (0.030); BE–NERD (0.014); BE–RE (0.012) |
| Proteobacteria | Haemophilus influenzae | 0.003 | Highest in EAC | Control–BE (0.013); RE–BE (0.004); BE–EAC (0.013); Control–EAC (0.015) |
| Unknown/Unassigned | 0.003 | Highest in EAC | Control–EAC (0.003); NERD–EAC (0.015); BE–EAC (0.002); RE–EAC (0.002) |
| Firmicutes | Staphylococcus aureus | 0.025 | Highest in EAC | Control–EAC (0.014); BE–EAC (0.010) |
| Actinobacteria | Bifidobacterium | 0.003 | Highest in EAC | Control–EAC (0.002); NERD–EAC (0.004); BE–EAC (0.001) |
| Spirochaetes | Sphaerochaeta | 0.004 | Highest in EAC | Control–EAC (0.025); NERD–EAC (0.033); BE–EAC (0.015); RE–EAC (0.020) |
| Proteobacteria | Sinobacteraceae | 0.009 | Highest in EAC | NERD–EAC (0.028); BE–EAC (0.014); RE–EAC (0.018) |
| Firmicutes | Lactobacillus salivarius | 0.017 | Highest in EAC | RE–EAC (0.038); BE–EAC (0.041) |
| Proteobacteria | Rhodospirillaceae [Family] | 0.018 | Highest in EAC | Control–EAC (0.018); NERD–EAC (0.037); RE–EAC (0.021) |
| Actinobacteria | Rothia mucilaginosa | 0.013 | Lowest EAC | EAC–Control; EAC–NERD (0.023); EAC–BE (0.032); EAC–RE (0.001) |
| Bacteroidetes | Prevotella copri | 0.039 | Lowest EAC | EAC–RE (0.003); EAC–BE (0.001); NERD–RE (0.030) |
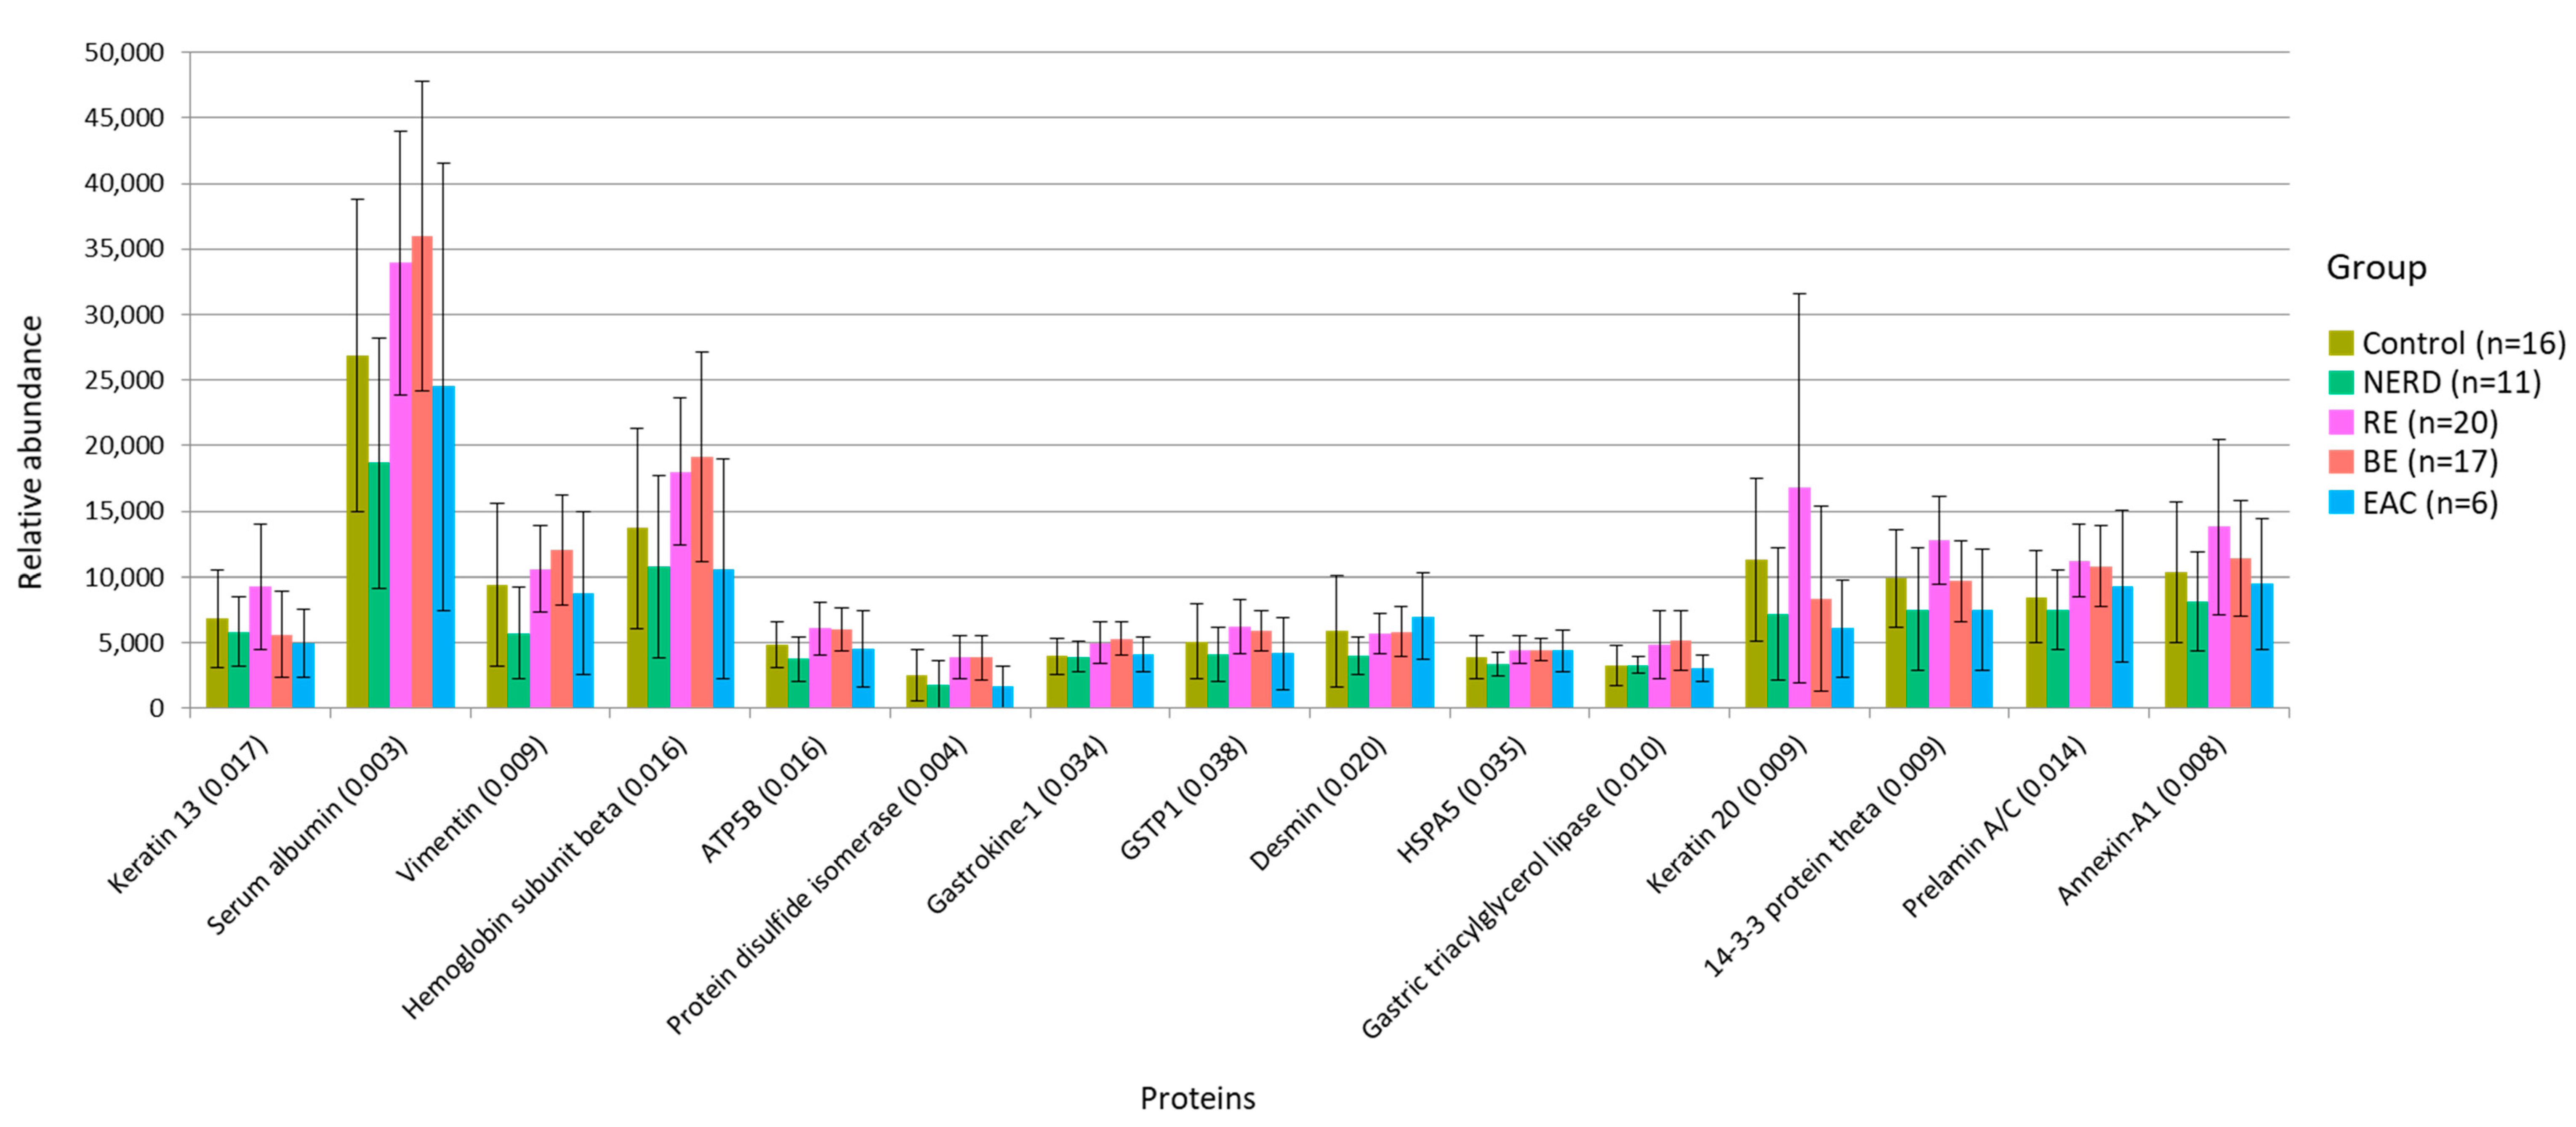
| Protein | p-Value | Distinct Group/s | Significant Pairs (p-Value < 0.05) |
|---|---|---|---|
| Keratin 13 | 0.017 | Highest in RE | BE–RE (0.002); EAC–RE (0.021); NERD–RE (0.039) |
| Serum albumin | 0.003 | Low in Control/NERD | NERD–RE (0.001); NERD–BE (<0.001); Control–BE (0.030) |
| Vimentin | 0.009 | Lowest in NERD | NERD–BE (<0.001); NERD–RE (0.007); Control–BE (0.013) |
| Hemoglobin subunit alpha | 0.016 | Low in NERD/EAC | NERD–RE (0.010); NERD–BE (0.010); EAC–BE (0.042) |
| ATP synthase subunit beta | 0.016 | Lowest in NERD | NERD–RE (0.003); NERD–BE (0.004) |
| Protein disulphide-isomerase | 0.004 | High in RE/BE | NERD–RE (0.006); NERD–BE (0.008); EAC–RE (0.011); EAC–BE (0.013); Control–BE (0.033); Control–RE (0.039) |
| Gastrokine-1 | 0.034 | Low in Control/NERD | Control–BE (0.007); NERD–RE (0.015) |
| Glutathione S-transferase p (GSTP1) | 0.038 | High in RE/BE | NERD–RE (0.014); CON–RE (0.031); NERD–BE (0.034) |
| Desmin | 0.020 | Lowest in NERD | NERD–BE (0.004); NERD–RE (0.005); NERD–EAC (0.007); Control–EAC (0.011) |
| Endoplasmic reticulum chaperone BiP (HSPA5) | 0.035 | Lowest in NERD | NERD–BE (0.007); NERD–RE (0.008) |
| Gastric triacylglycerol lipase | 0.010 | High in RE/BE | Control–BE (0.004); CON–RE (0.012); NERD–BE (0.026) |
| Keratin 20 | 0.009 | Highest in RE | BE–RE (0.008); NERD–RE (0.010); EAC–RE (0.017); BE–Control (0.047) |
| 14-3-3 protein theta | 0.009 | Highest in RE | NERD–RE (0.002); EAC–RE (0.009); BE–RE (0.014) |
| Prelamin-A/C | 0.014 | Low in Control/NERD | NERD–RE (0.004); NERD–BE (0.010); Control–RE (0.017) |
| Annexin A1 | 0.008 | Highest in RE | NERD–RE (0.009); Control–RE (0.010); EAC–RE (0.012) |
© 2020 by the authors. Licensee MDPI, Basel, Switzerland. This article is an open access article distributed under the terms and conditions of the Creative Commons Attribution (CC BY) license (http://creativecommons.org/licenses/by/4.0/).
Share and Cite
Zhou, J.; Shrestha, P.; Qiu, Z.; Harman, D.G.; Teoh, W.-C.; Al-Sohaily, S.; Liem, H.; Turner, I.; Ho, V. Distinct Microbiota Dysbiosis in Patients with Non-Erosive Reflux Disease and Esophageal Adenocarcinoma. J. Clin. Med. 2020, 9, 2162. https://doi.org/10.3390/jcm9072162
Zhou J, Shrestha P, Qiu Z, Harman DG, Teoh W-C, Al-Sohaily S, Liem H, Turner I, Ho V. Distinct Microbiota Dysbiosis in Patients with Non-Erosive Reflux Disease and Esophageal Adenocarcinoma. Journal of Clinical Medicine. 2020; 9(7):2162. https://doi.org/10.3390/jcm9072162
Chicago/Turabian StyleZhou, Jerry, Prapti Shrestha, Zhiguang Qiu, David G. Harman, Wun-Chung Teoh, Sam Al-Sohaily, Han Liem, Ian Turner, and Vincent Ho. 2020. "Distinct Microbiota Dysbiosis in Patients with Non-Erosive Reflux Disease and Esophageal Adenocarcinoma" Journal of Clinical Medicine 9, no. 7: 2162. https://doi.org/10.3390/jcm9072162