Landslide Susceptibility Mapping Using Machine Learning Algorithms and Remote Sensing Data in a Tropical Environment

 , ,
, ,  ,
,  , ,
, , 
 ,
,
Abstract
:1. Introduction
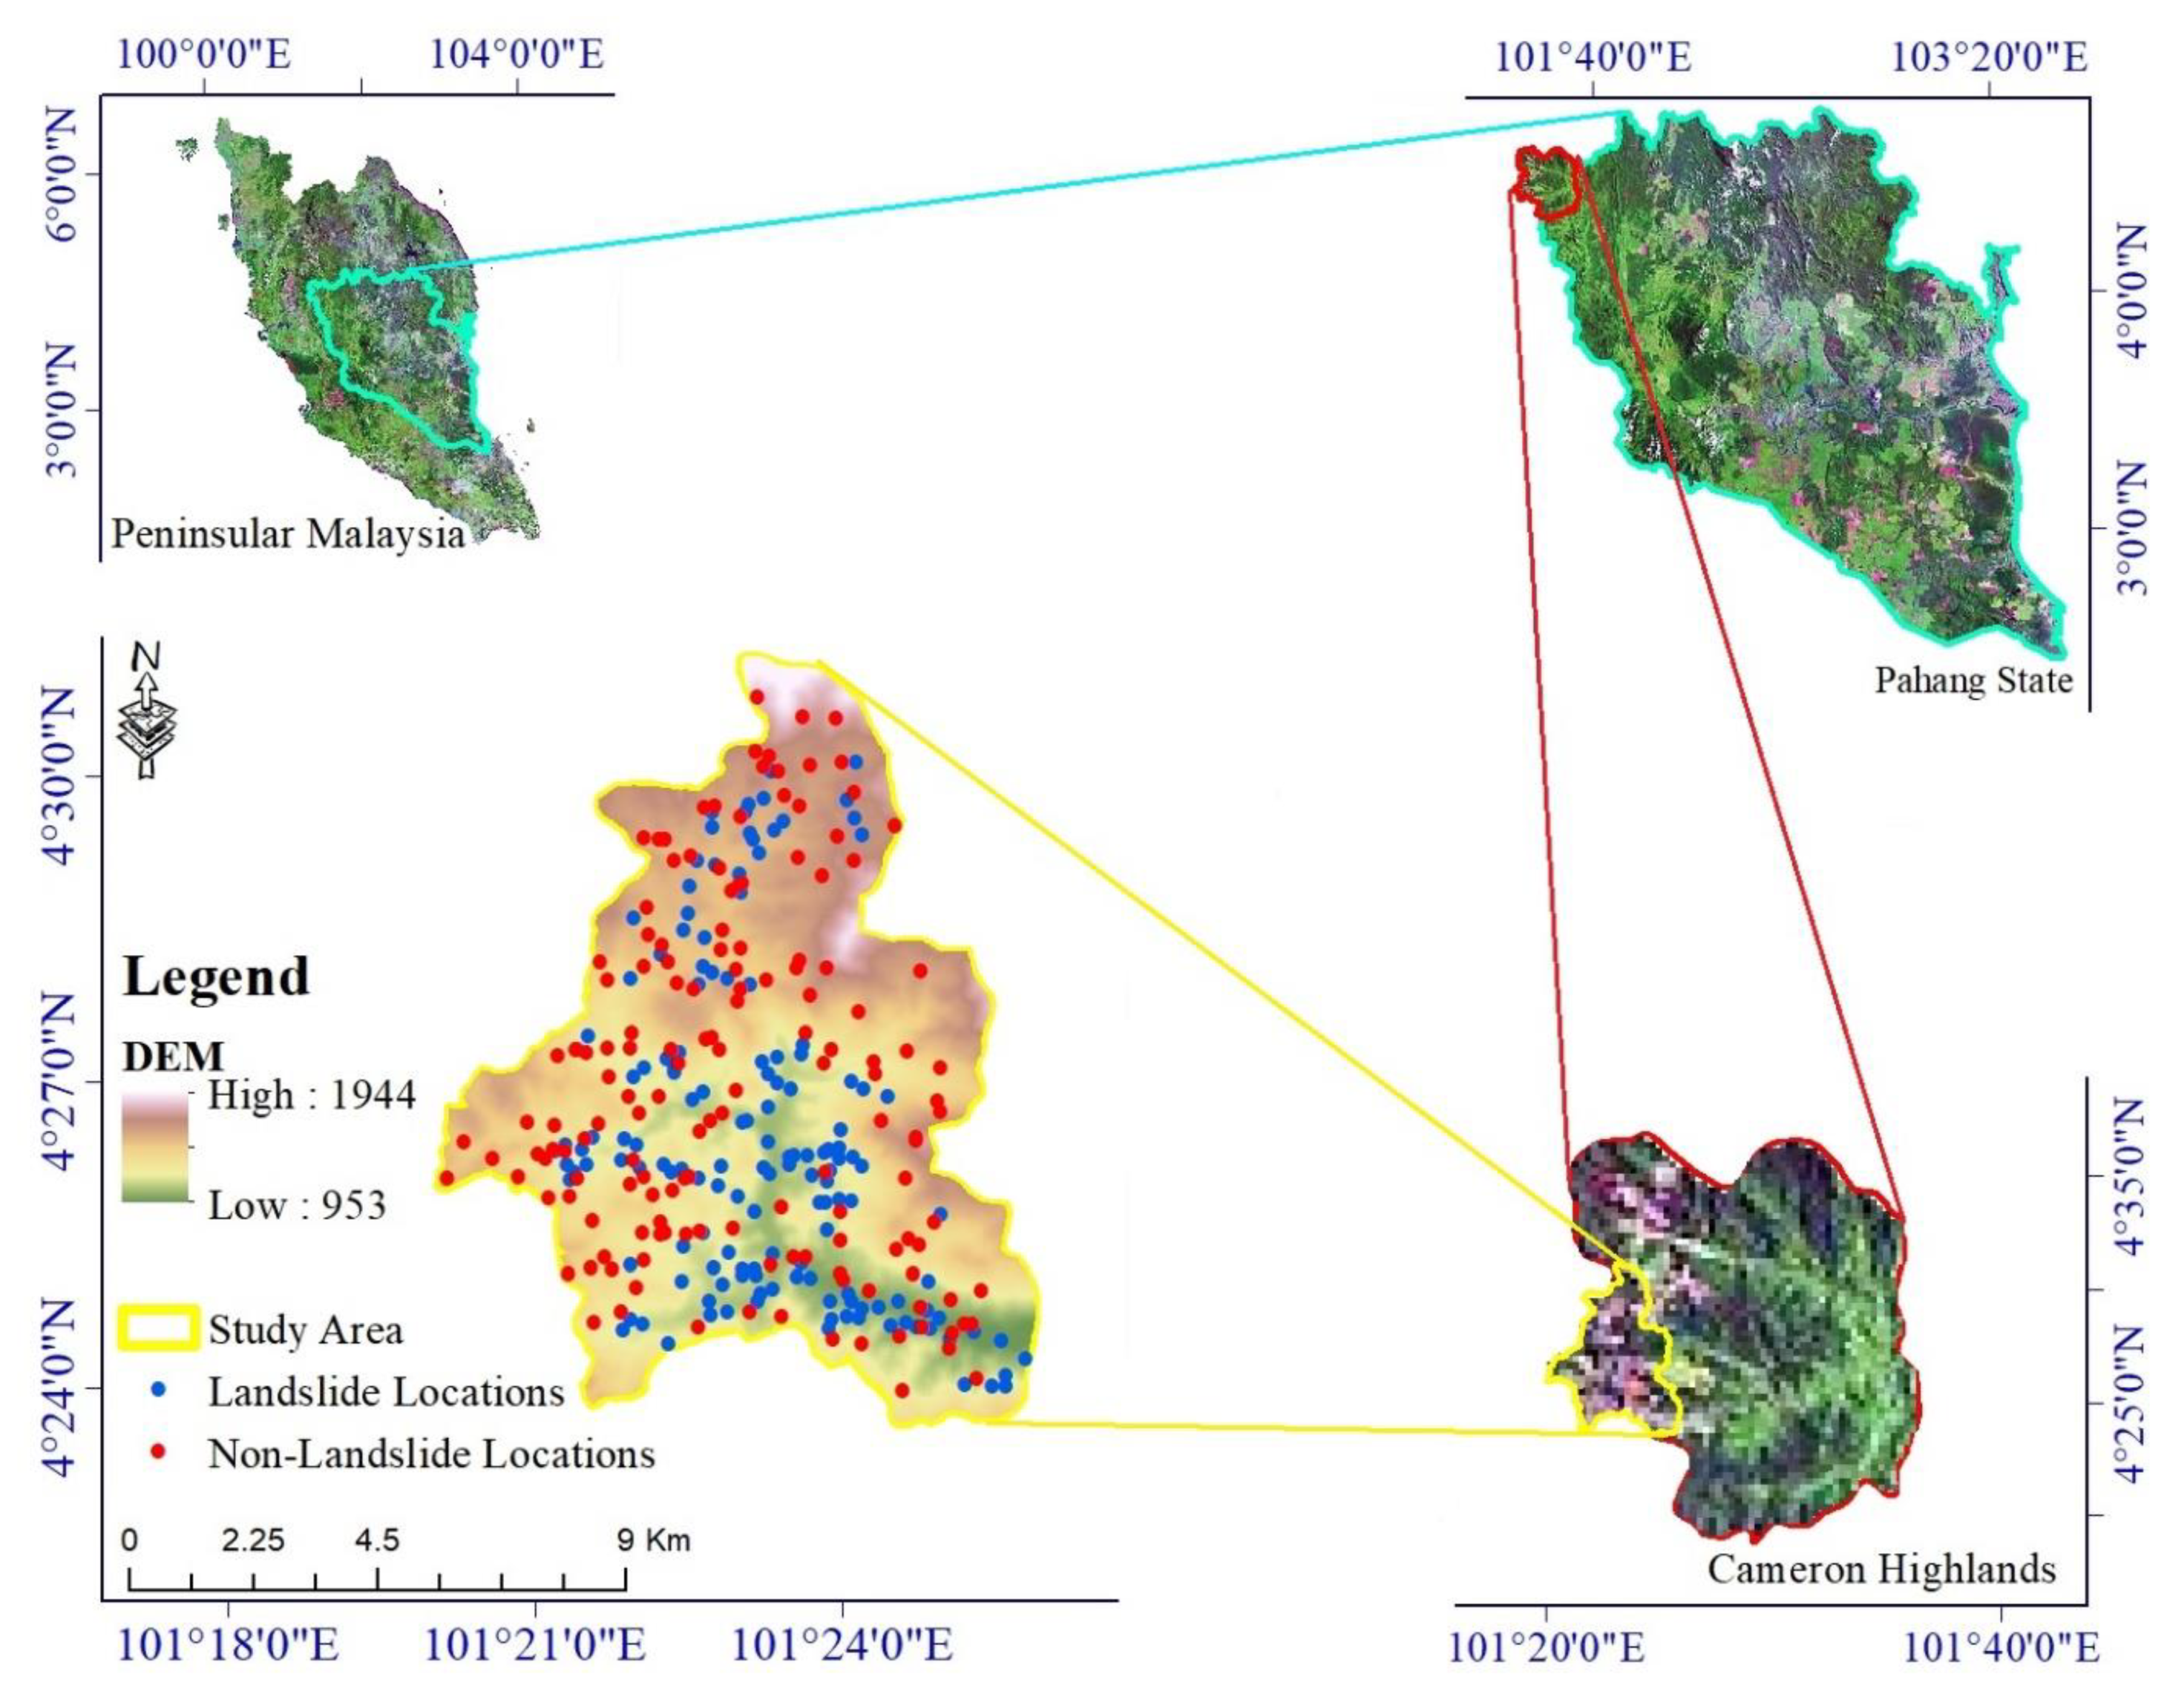
2. Study Area
3. Methodology
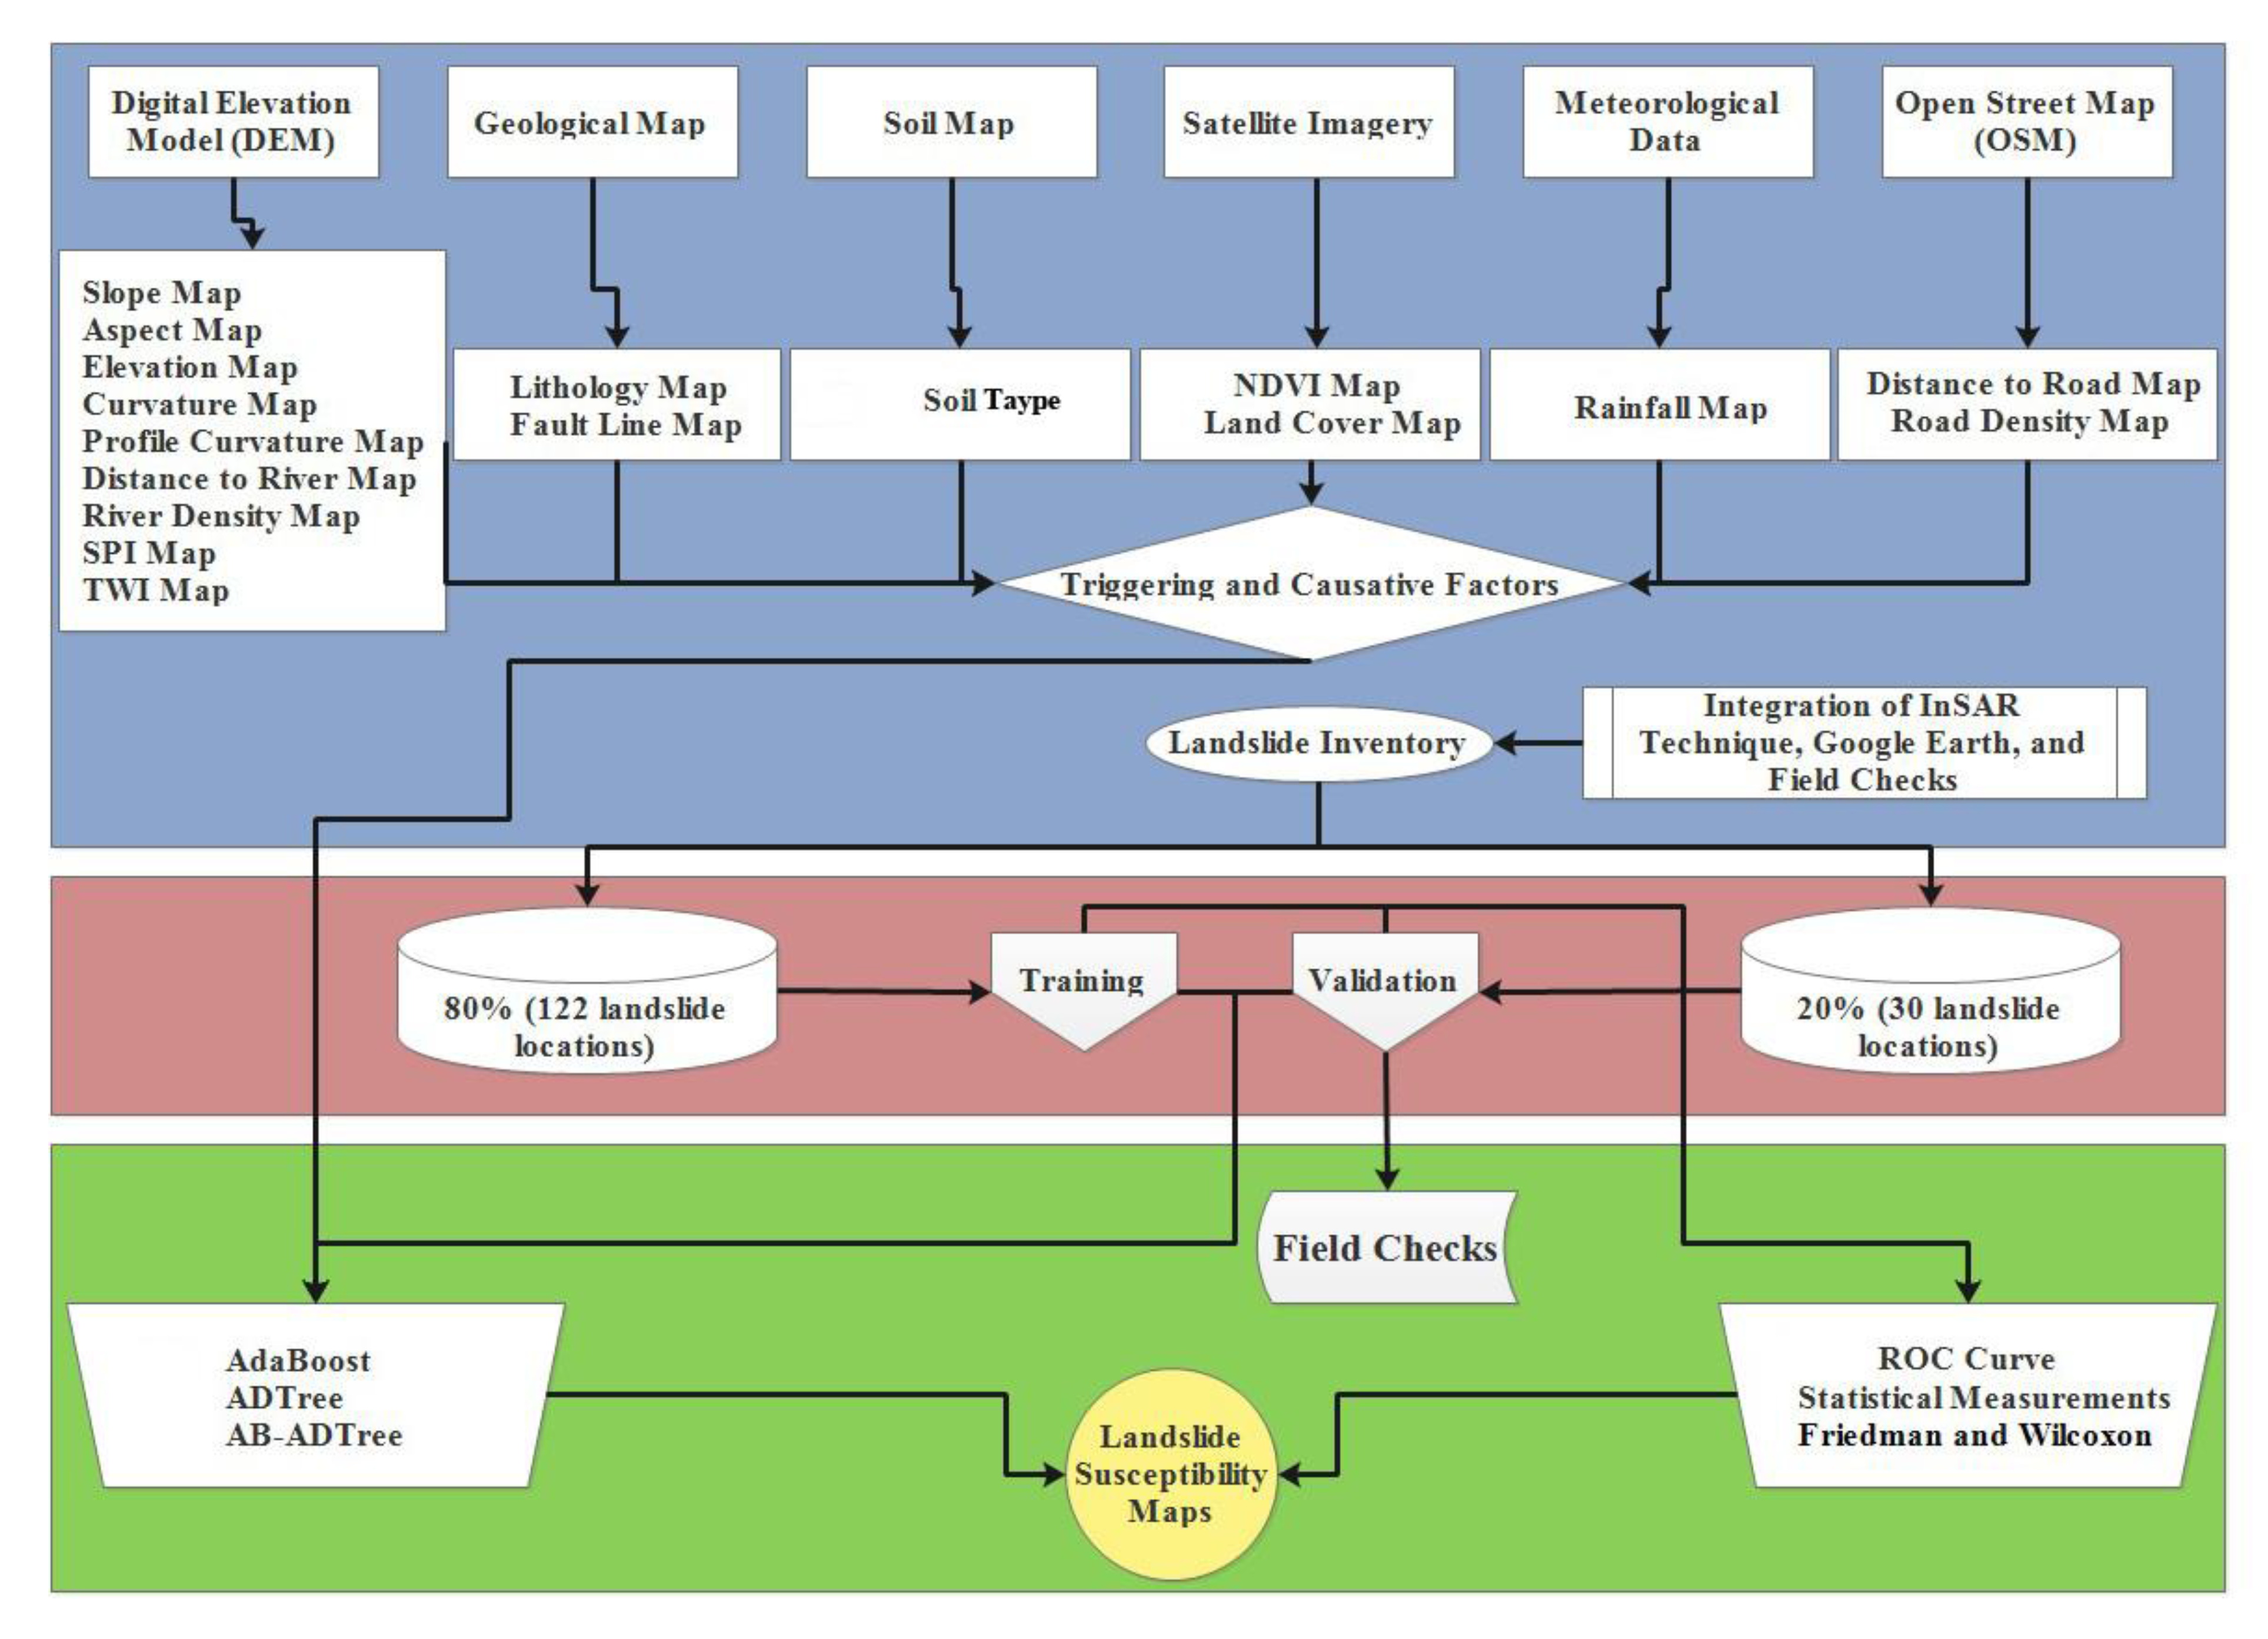
3.1. Data Collection
3.2. Methods Used
3.2.1. One Rule (One-R) Feature Selection Technique
3.2.2. Altering Decision Tree (ADTree)
3.2.3. AdaBoost (AB)
3.2.4. Ensemble AB-ADTree Model
3.3. Comparison and Evaluation Metrics
3.3.1. Statistical Metrics
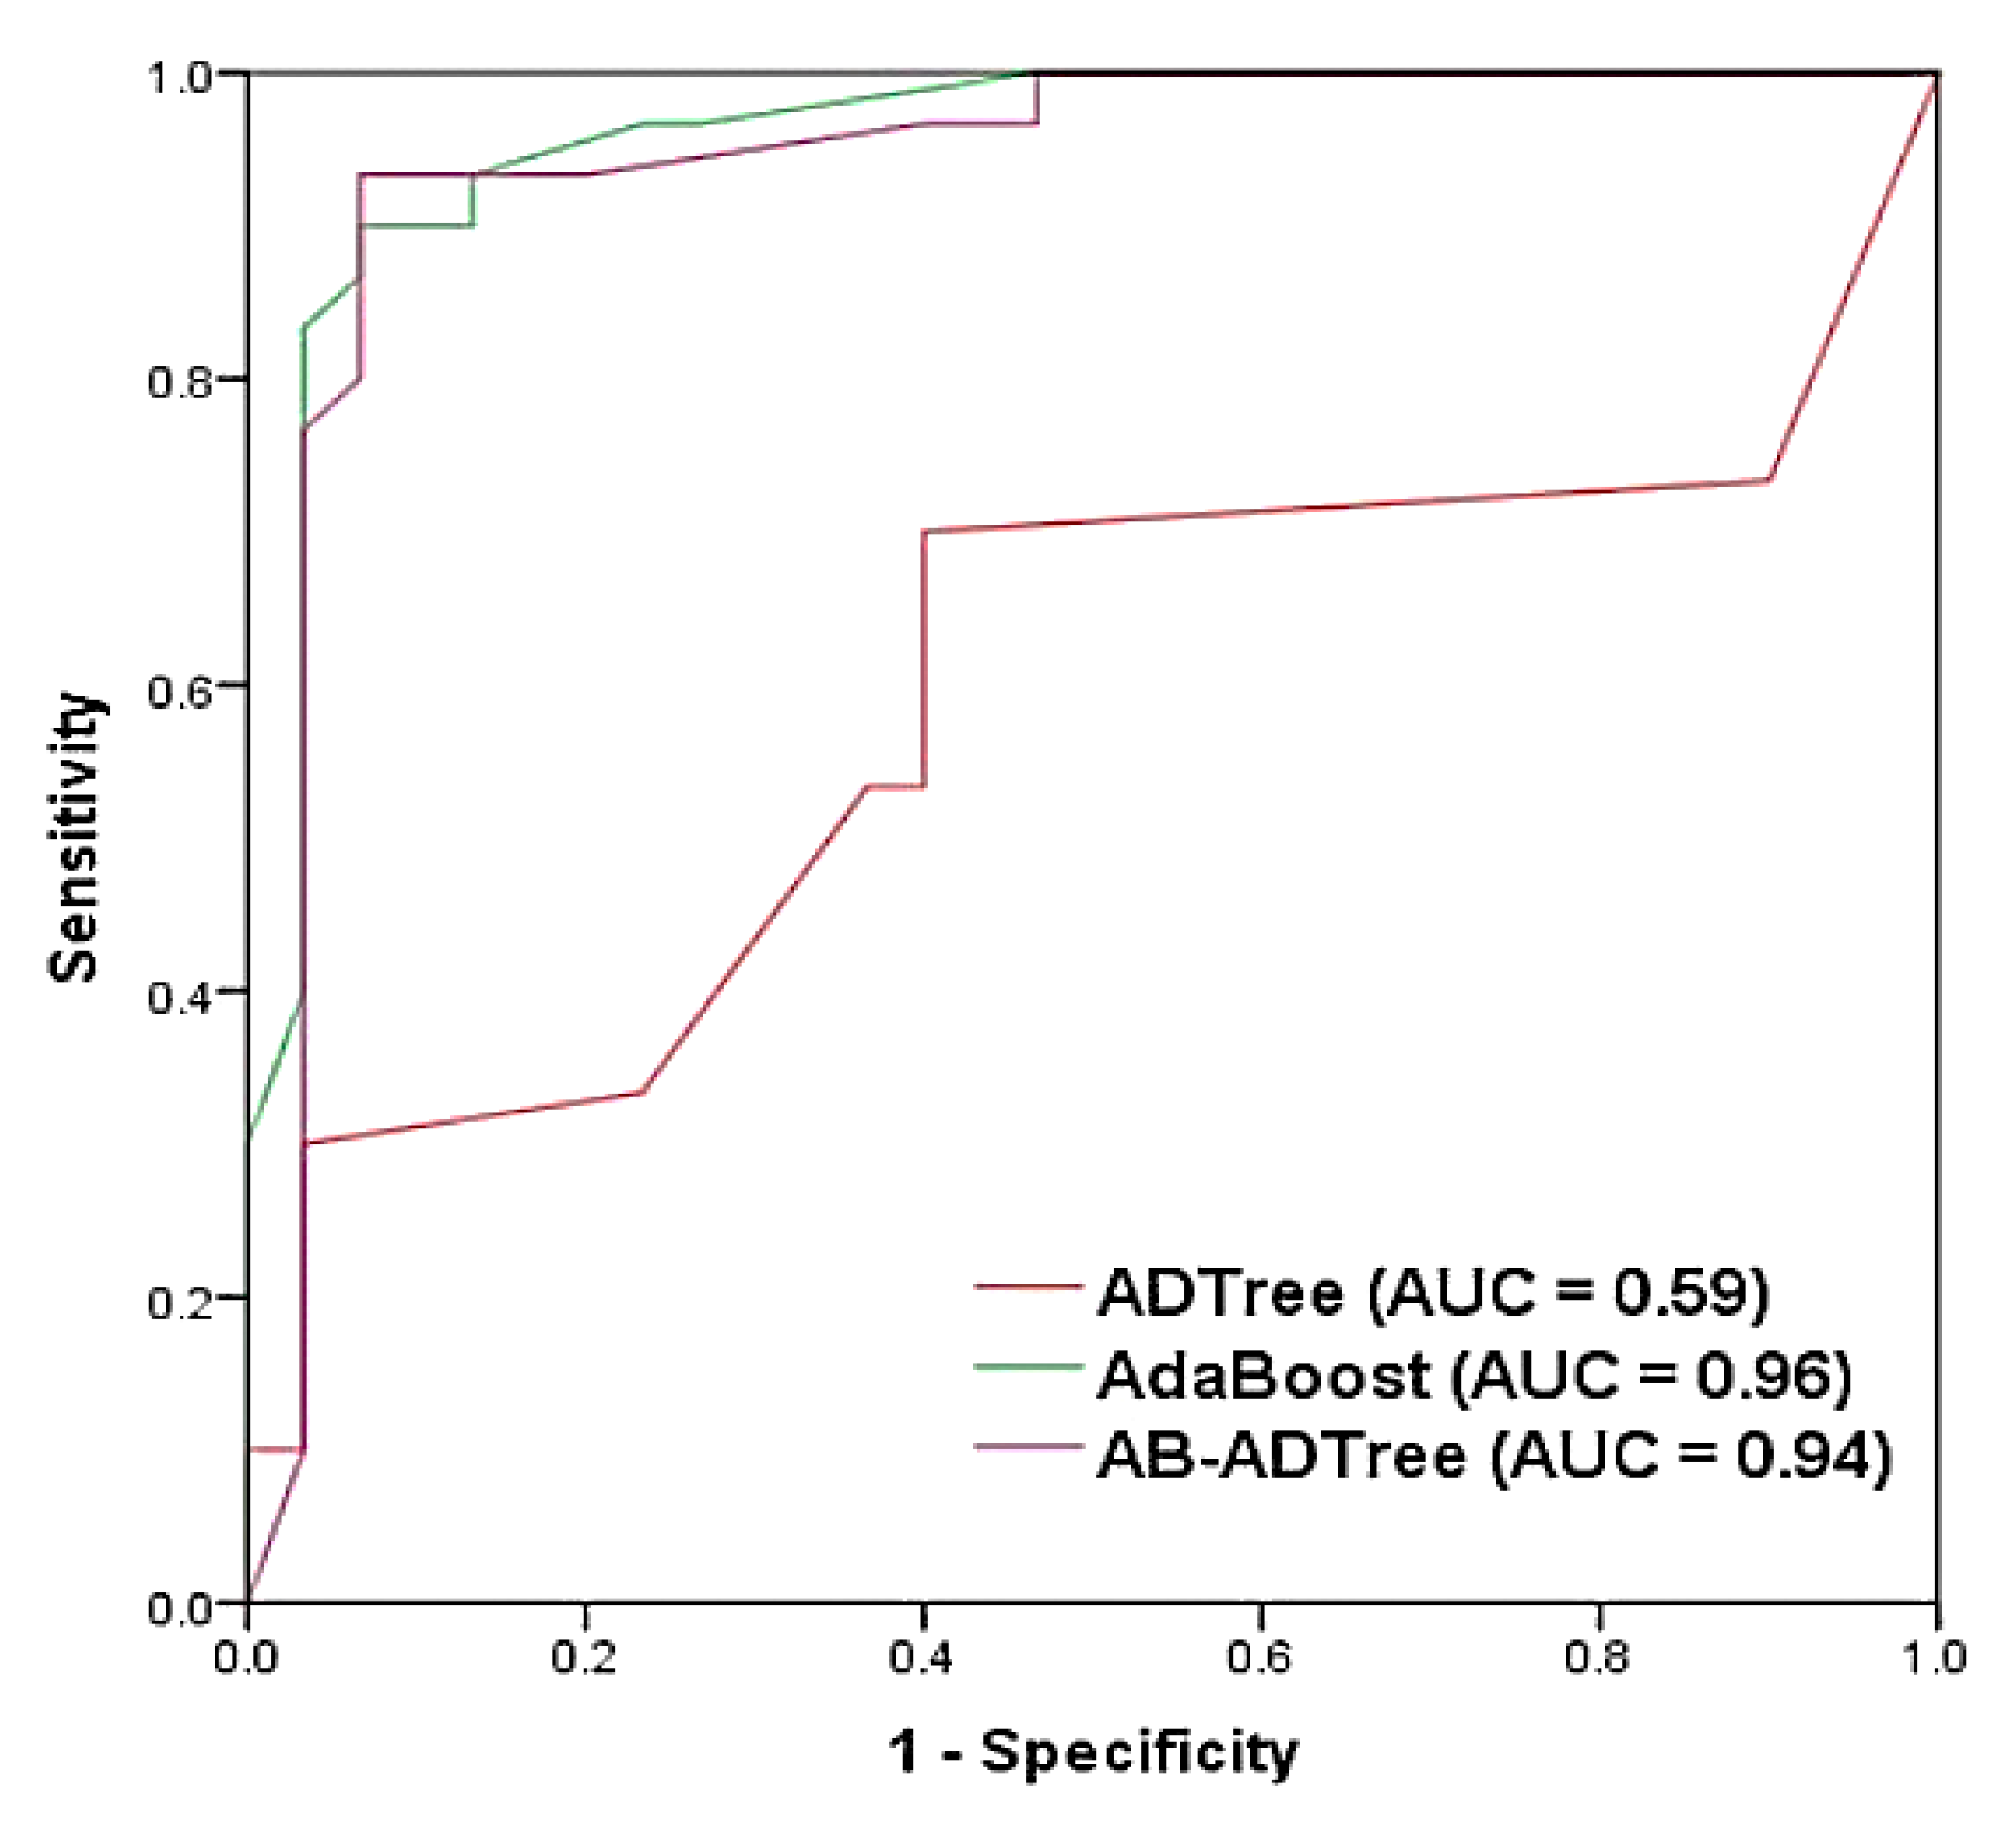
3.3.2. Receiver Operating Characteristics (ROC) Curve
3.3.3. Friedman and Wilcoxon Tests
4. Results
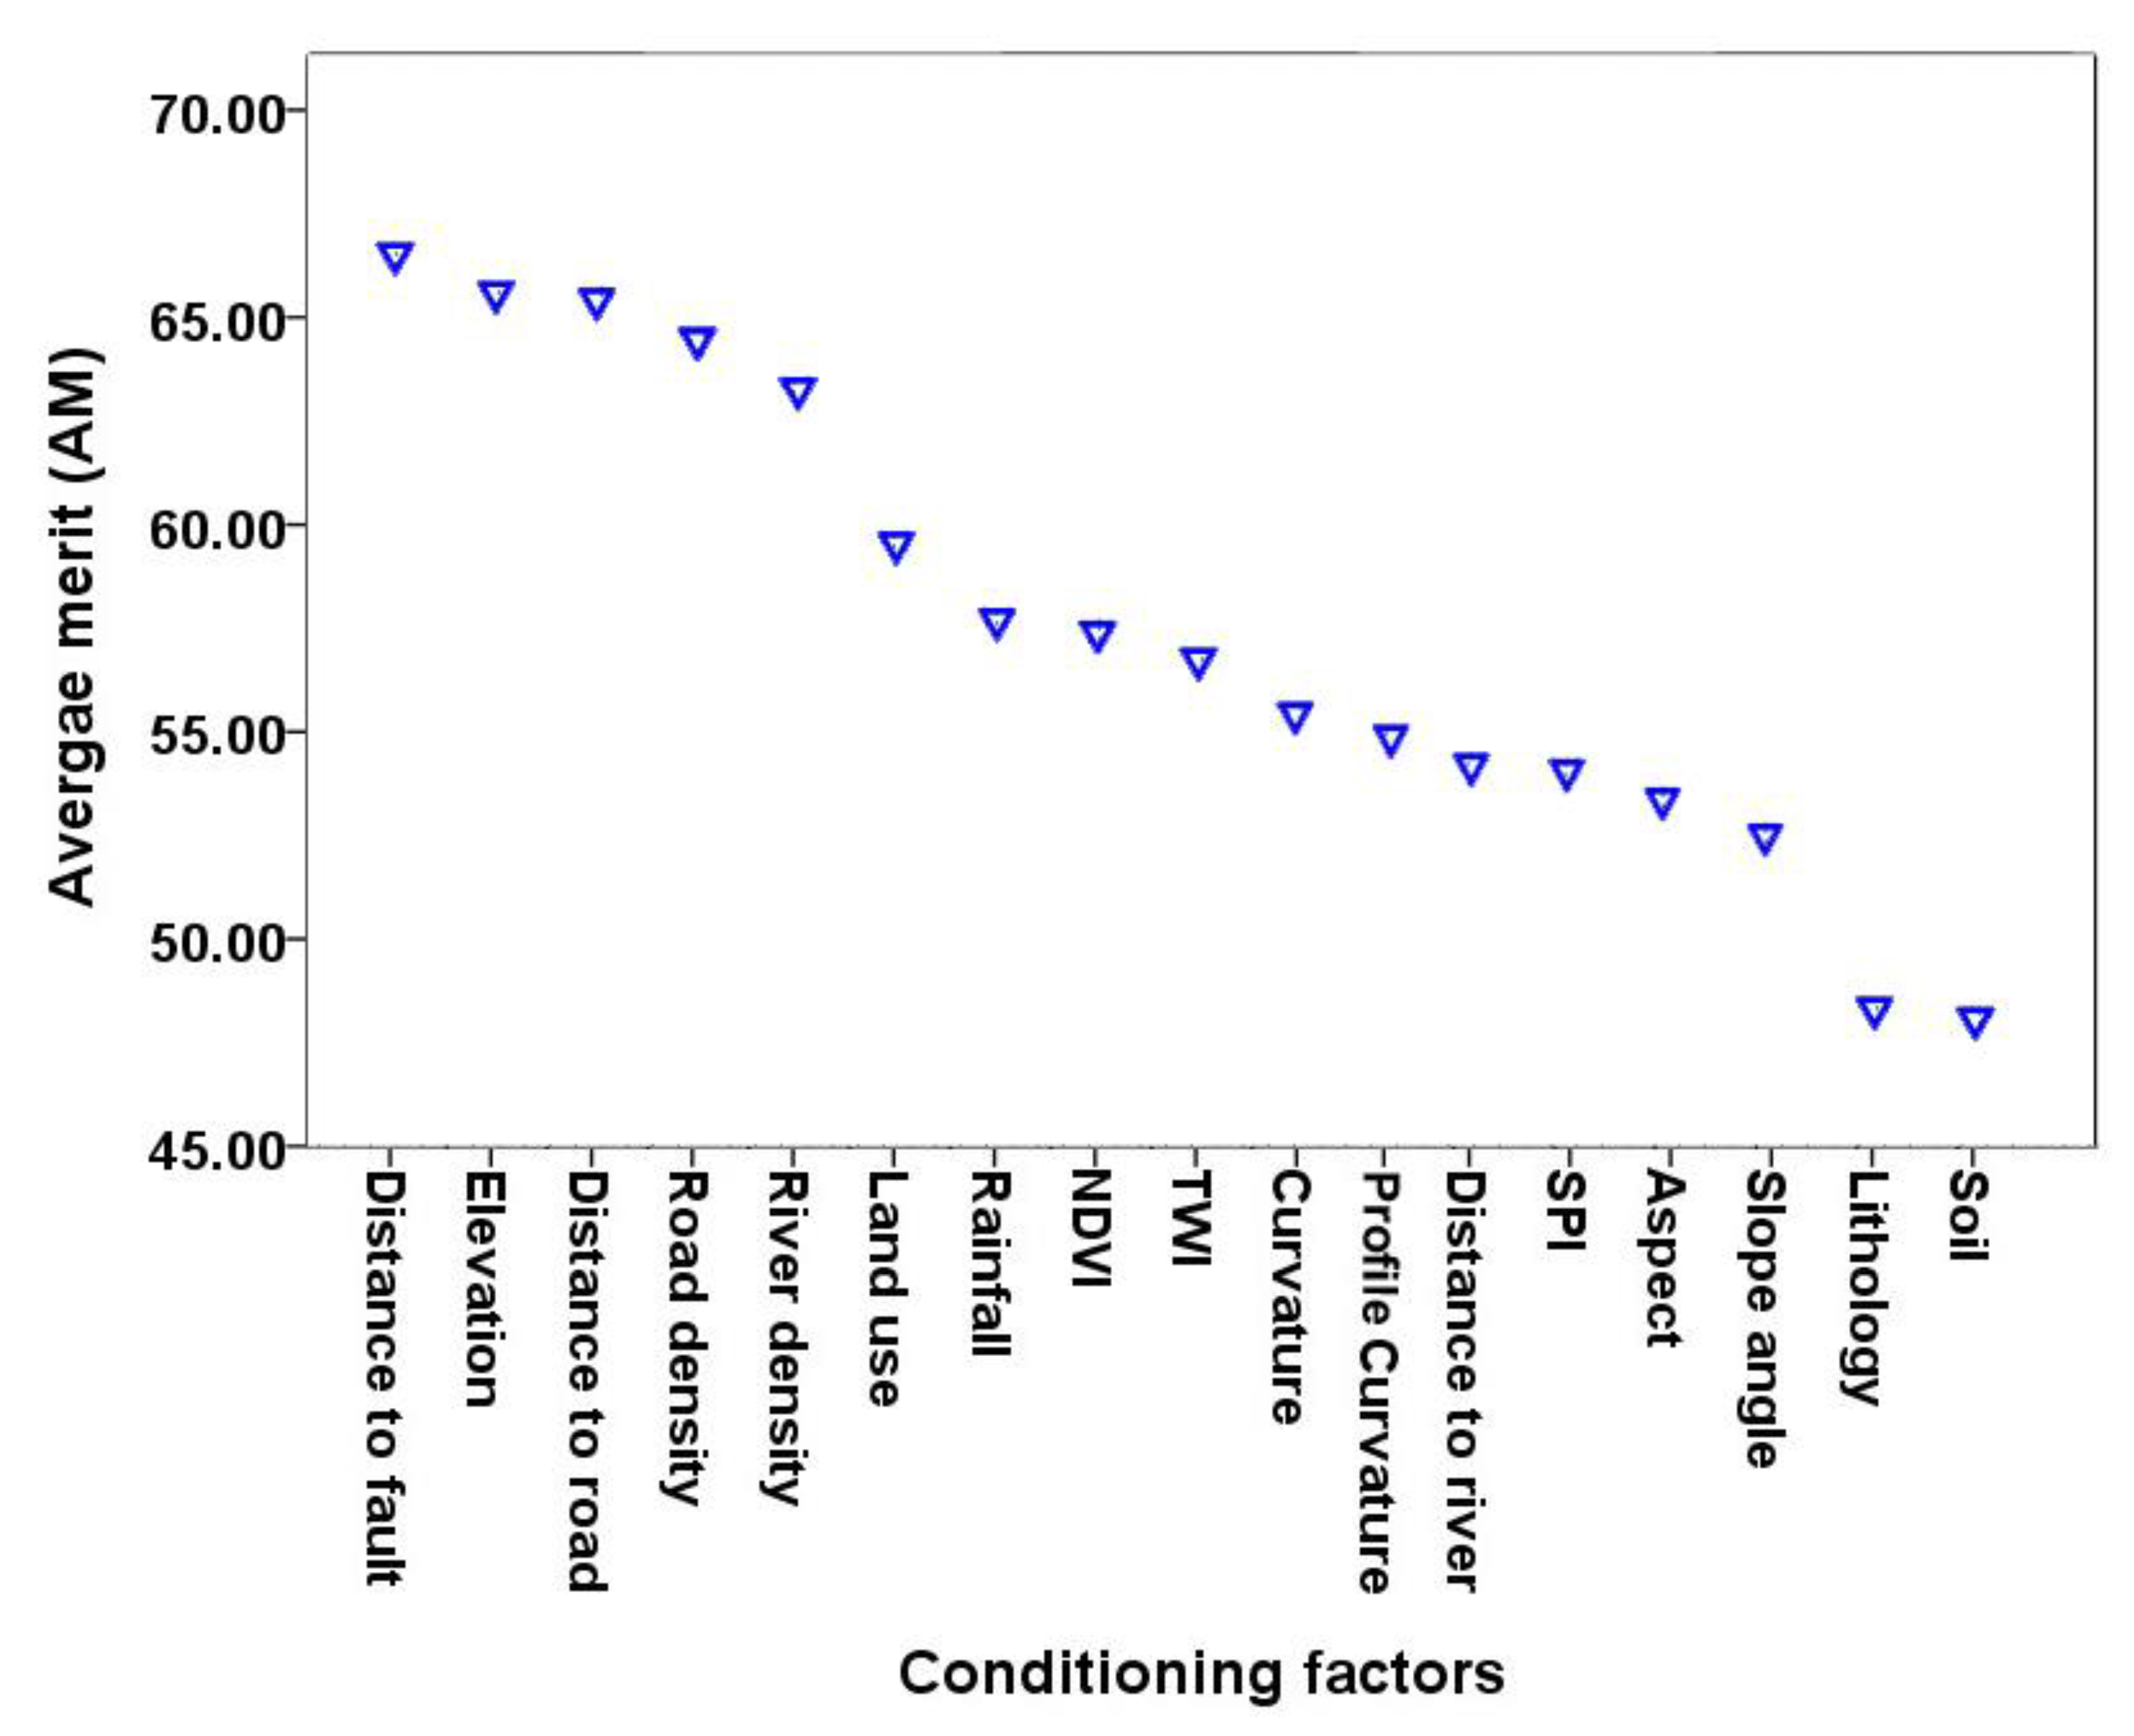
4.1. Factor Importance
4.2. Performance Analysis
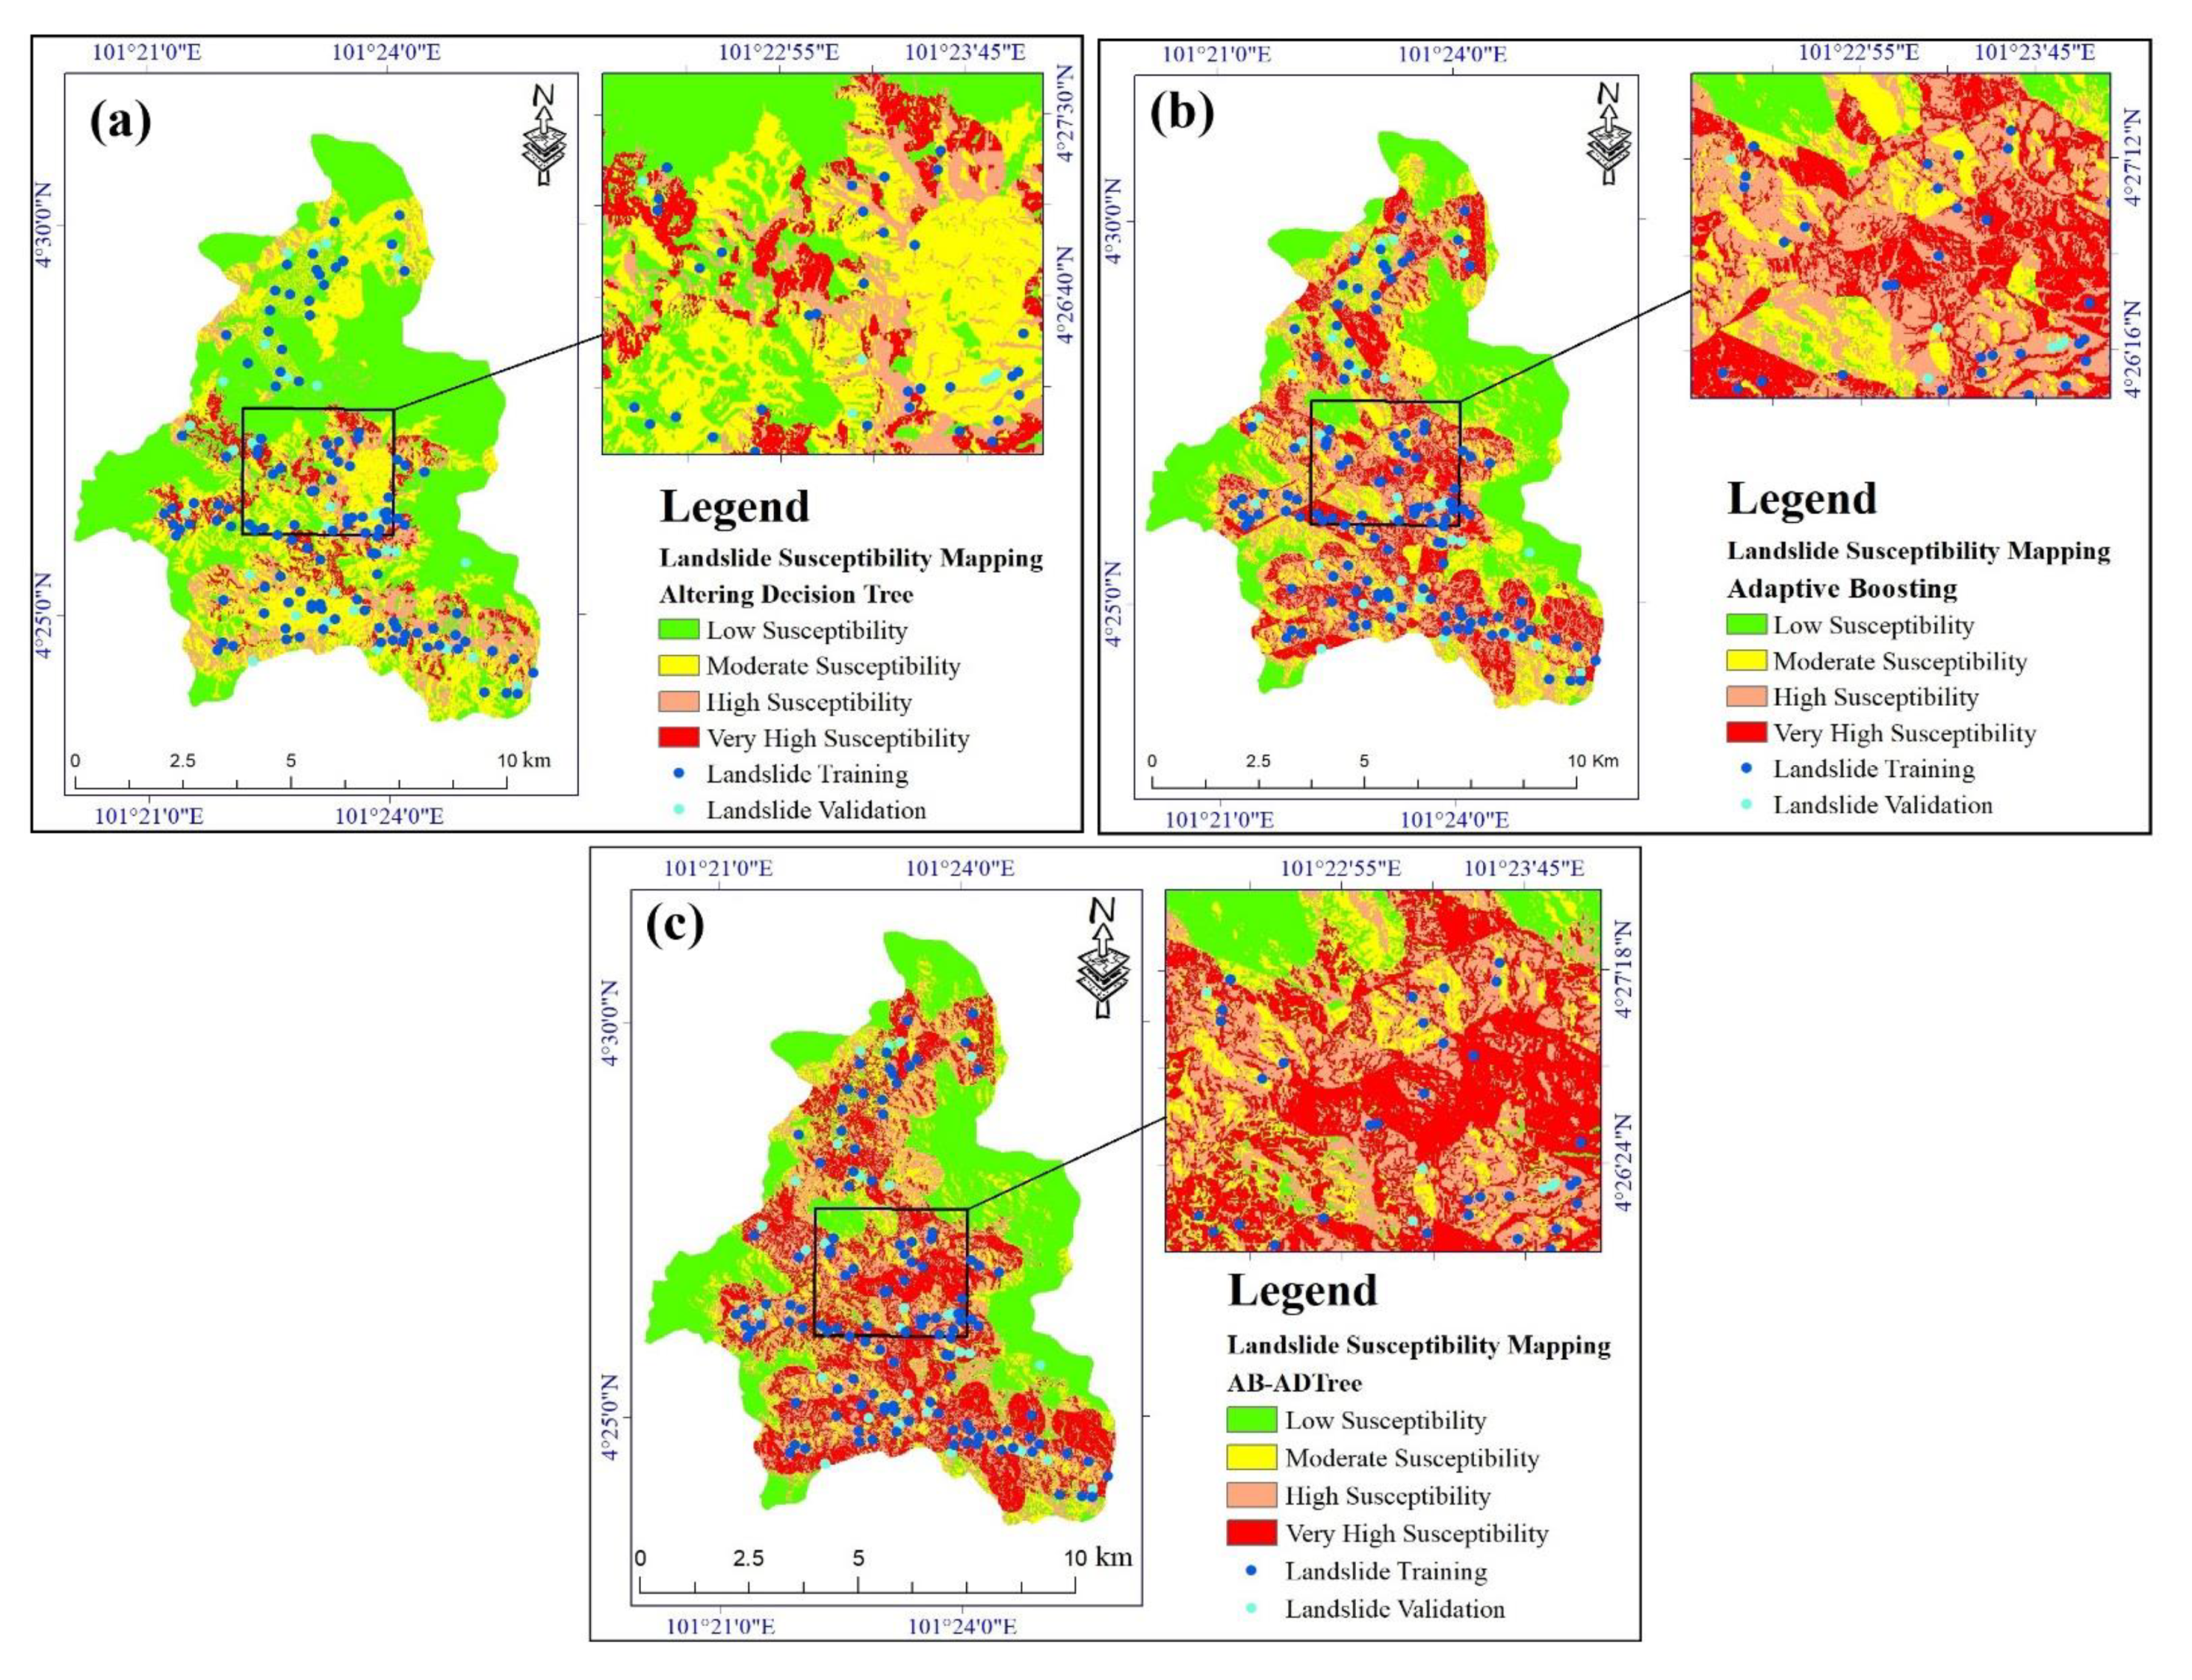
4.3. Landslide Susceptibility Maps
4.3.1. ADTree Landslide Susceptibility Map
4.3.2. AB landslide Susceptibility Map
4.3.3. AB-ADTree Landslide Susceptibility Map
4.3.4. Validation and Comparison of Landslide Susceptibility Maps
5. Discussion
6. Conclusions
Author Contributions
Funding
Conflicts of Interest
References
- Oh, H.-J.; Pradhan, B. Application of a neuro-fuzzy model to landslide-susceptibility mapping for shallow landslides in a tropical hilly area. Comput. Geosci. 2011, 37, 1264–1276. [Google Scholar] [CrossRef]
- Sabokbar, H.A.F.; Roodposhti, M.S.; Tazik, E. Landslide susceptibility mapping using geographically weighted principal component analysis. Geomorphology 2014, 226, 15–24. [Google Scholar] [CrossRef]
- Ciampalini, A.; Raspini, F.; Lagomarsino, D.; Catani, F.; Casagli, N. Landslide susceptibility map refinement using PSInSAR data. Remote. Sens. Environ. 2016, 184, 302–315. [Google Scholar] [CrossRef]
- Ahmed, B.; Dewan, A. Application of Bivariate and Multivariate Statistical Techniques in Landslide Susceptibility Modeling in Chittagong City Corporation, Bangladesh. Remote. Sens. 2017, 9, 304. [Google Scholar] [CrossRef] [Green Version]
- Taalab, K.; Cheng, T.; Zhang, Y. Mapping landslide susceptibility and types using Random Forest. Big Earth Data 2018, 2, 159–178. [Google Scholar] [CrossRef]
- Mohammadi, A.; Shahabi, H.; Bin-Ahmad, B. Integration of insar technique, google earth images and extensive field survey for landslide inventory in a part of Cameron Highlands, Pahang, Malaysia. Appl. Ecol. Environ. Res. 2018, 16, 8075–8091. [Google Scholar] [CrossRef]
- Chen, W.; Shahabi, H.; Shirzadi, A.; Hong, H.; Akgun, A.; Tian, Y.; Liu, J.; Zhu, A.X.; Li, S. Novel hybrid artificial intelligence approach of bivariate statistical-methods-based kernel logistic regression classifier for landslide susceptibility modeling. Bull. Eng. Geol. Environ. 2019, 78, 4397–4419. [Google Scholar] [CrossRef]
- Shahabi, H.; Hashim, M. Landslide susceptibility mapping using GIS-based statistical models and Remote sensing data in tropical environment. Sci. Rep. 2015, 5, 9899. [Google Scholar] [CrossRef] [Green Version]
- Bui, D.T.; Shahabi, H.; Shirzadi, A.; Chapi, K.; Alizadeh, M.; Chen, W.; Mohammadi, A.; Bin-Ahmad, B.; Panahi, M.; Hong, H.; et al. Landslide Detection and Susceptibility Mapping by AIRSAR Data Using Support Vector Machine and Index of Entropy Models in Cameron Highlands, Malaysia. Remote. Sens. 2018, 10, 1527. [Google Scholar] [CrossRef] [Green Version]
- He, Q.; Shahabi, H.; Shirzadi, A.; Li, S.; Chen, W.; Wang, N.; Chai, H.; Bian, H.; Ma, J.; Chen, Y.; et al. Landslide spatial modelling using novel bivariate statistical based Naïve Bayes, RBF Classifier, and RBF Network machine learning algorithms. Sci. Total Environ. 2019, 663, 1–15. [Google Scholar] [CrossRef]
- Hong, H.; Shahabi, H.; Shirzadi, A.; Chen, W.; Chapi, K.; Ahmad, B.B.; Roodposhti, M.S.; Hesar, A.Y.; Tian, Y.; Bui, D.T. Landslide susceptibility assessment at the Wuning area, China: A comparison between multi-criteria decision making, bivariate statistical and machine learning methods. Nat. Hazards 2019, 96, 173–212. [Google Scholar] [CrossRef]
- Shahabi, H.; Hashim, M.; Ahmad, B.B. Remote sensing and GIS-based landslide susceptibility mapping using frequency ratio, logistic regression, and fuzzy logic methods at the central Zab basin, Iran. Environ. Earth Sci. 2015, 73, 8647–8668. [Google Scholar] [CrossRef]
- Pradhan, B.; Lee, S. Regional landslide susceptibility analysis using back-propagation neural network model at Cameron Highland, Malaysia. Landslides 2009, 7, 13–30. [Google Scholar] [CrossRef]
- Komac, M. A landslide susceptibility model using the Analytical Hierarchy Process method and multivariate statistics in perialpine Slovenia. Geomorphology 2006, 74, 17–28. [Google Scholar] [CrossRef]
- Wachal, D.J.; Hudak, P.F. Mapping landslide susceptibility in Travis County, Texas, USA. GeoJournal 2000, 51, 245–253. [Google Scholar] [CrossRef]
- Yilmaz, I. Landslide susceptibility mapping using frequency ratio, logistic regression, artificial neural networks, and their comparison: A case study from Kat landslides (Tokat—Turkey). Comput. Geosci. 2009, 35, 1125–1138. [Google Scholar] [CrossRef]
- Zhao, X.; Chen, W. GIS-Based Evaluation of Landslide Susceptibility Models Using Certainty Factors and Functional Trees-Based Ensemble Techniques. Appl. Sci. 2019, 10, 16. [Google Scholar] [CrossRef] [Green Version]
- Jaafari, A.; Najafi, A.; Pourghasemi, H.R.; Rezaeian, J.; Sattarian, A. GIS-based frequency ratio and index of entropy models for landslide susceptibility assessment in the Caspian forest, northern Iran. Int. J. Environ. Sci. Technol. 2014, 11, 909–926. [Google Scholar] [CrossRef] [Green Version]
- Lee, C.F.; Li, J.; Xu, Z.W.; Dai, F.C. Assessment of landslide susceptibility on the natural terrain of Lantau Island, Hong Kong. Environ. Earth Sci. 2001, 40, 381–391. [Google Scholar] [CrossRef]
- Clerici, A.; Perego, S.; Tellini, C.; Vescovi, P. A procedure for landslide susceptibility zonation by the conditional analysis method. Geomorphology 2002, 48, 349–364. [Google Scholar] [CrossRef]
- Lee, S.; Ryu, J.-H.; Lee, M.-J.; Won, J.-S. Use of an artificial neural network for analysis of the susceptibility to landslides at Boun, Korea. Environ. Earth Sci. 2003, 44, 820–833. [Google Scholar] [CrossRef]
- Yao, X.; Tham, L.; Dai, F. Landslide susceptibility mapping based on Support Vector Machine: A case study on natural slopes of Hong Kong, China. Geomorphology 2008, 101, 572–582. [Google Scholar] [CrossRef]
- Jaafari, A.; Rezaeian, J.; Omrani, M.S. Spatial prediction of slope failures in support of forestry operations safety. Croat. J. Forest Eng. 2017, 38, 107–118. [Google Scholar]
- Wu, Y.; Ke, Y.; Chen, Z.; Liang, S.; Zhao, H.; Hong, H. Application of alternating decision tree with AdaBoost and bagging ensembles for landslide susceptibility mapping. Catena 2020, 187, 104396. [Google Scholar] [CrossRef]
- Chen, W.; Xie, X.; Wang, J.; Pradhan, B.; Hong, H.; Bui, D.T.; Duan, Z.; Ma, J. A comparative study of logistic model tree, random forest, and classification and regression tree models for spatial prediction of landslide susceptibility. Catena 2017, 151, 147–160. [Google Scholar] [CrossRef] [Green Version]
- Chen, W.; Xie, X.; Peng, J.; Shahabi, H.; Hong, H.; Bui, D.T.; Duan, Z.; Li, S.; Zhu, A.-X. GIS-based landslide susceptibility evaluation using a novel hybrid integration approach of bivariate statistical based random forest method. Catena 2018, 164, 135–149. [Google Scholar] [CrossRef]
- Wang, G.; Lei, X.; Chen, W.; Shahabi, H.; Shirzadi, A. Hybrid computational intelligence methods for landslide susceptibility mapping. Symmetry 2020, 12, 325. [Google Scholar] [CrossRef] [Green Version]
- Rahmati, O.; Falah, F.; Naghibi, S.A.; Biggs, T.; Soltani, M.; Deo, R.C.; Cerdà, A.; Mohammadi, F.; Bui, D.T. Land subsidence modelling using tree-based machine learning algorithms. Sci. Total Environ. 2019, 672, 239–252. [Google Scholar] [CrossRef] [PubMed]
- van Dao, D.; Le, T.-T.; Bayat, M.; Mafi-Gholami, D.; Qi, C.; Moayedi, H.; van Phong, T.; Ly, H.-B.; Le, T.-T.; Trinh, P.T.; et al. A spatially explicit deep learning neural network model for the prediction of landslide susceptibility. Catena 2020, 188, 104451. [Google Scholar] [CrossRef]
- Chen, W.; Hong, H.; Panahi, M.; Shahabi, H.; Wang, Y.; Shirzadi, A.; Pirasteh, S.; Alesheikh, A.A.; Khosravi, K.; Panahi, S.; et al. Spatial prediction of landslide susceptibility using gis-based data mining techniques of ANFIS with whale optimization algorithm (WOA) and grey wolf optimizer (GWO). Appl. Sci. 2019, 9, 3755. [Google Scholar] [CrossRef] [Green Version]
- Jaafari, A.; Panahi, M.; Pham, B.T.; Shahabi, H.; Bui, D.T.; Rezaie, F.; Lee, S. Meta optimization of an adaptive neuro-fuzzy inference system with grey wolf optimizer and biogeography-based optimization algorithms for spatial prediction of landslide susceptibility. Catena 2019, 175, 430–445. [Google Scholar] [CrossRef]
- Thai Pham, B.; Shirzadi, A.; Shahabi, H.; Omidvar, E.; Singh, S.K.; Sahana, M.; Talebpour Asl, D.; Bin Ahmad, B.; Kim Quoc, N.; Lee, S. Landslide susceptibility assessment by novel hybrid machine learning algorithms. Sustainability 2019, 11, 4386. [Google Scholar] [CrossRef] [Green Version]
- Nhu, V.-H.; Shirzadi, A.; Shahabi, H.; Chen, W.; Clague, J.J.; Geertsema, M.; Jaafari, A.; Avand, M.; Miraki, S.; Asl, D.T.; et al. Shallow Landslide Susceptibility Mapping by Random Forest Base Classifier and Its Ensembles in a Semi-Arid Region of Iran. Forests 2020, 11, 421. [Google Scholar] [CrossRef] [Green Version]
- Jaafari, A.; Termeh, S.V.R.; Bui, D.T. Genetic and firefly metaheuristic algorithms for an optimized neuro-fuzzy prediction modeling of wildfire probability. J. Environ. Manag. 2019, 243, 358–369. [Google Scholar] [CrossRef]
- Moayedi, H.; Mehrabi, M.; Kalantar, B.; Mu’Azu, M.A.; Rashid, A.S.A.; Foong, L.K.; Nguyen, H. Novel hybrids of adaptive neuro-fuzzy inference system (ANFIS) with several metaheuristic algorithms for spatial susceptibility assessment of seismic-induced landslide. Geomatics Nat. Hazards Risk 2019, 10, 1879–1911. [Google Scholar] [CrossRef] [Green Version]
- Moayedi, H.; Osouli, A.; Bui, D.T.; Foong, L.K.; Nguyen, H.; Kalantar, B. Two novel neural-evolutionary predictive techniques of dragonfly algorithm (DA) and biogeography-based optimization (BBO) for landslide susceptibility analysis. Geomatics Nat. Hazards Risk 2019, 10, 2429–2453. [Google Scholar] [CrossRef] [Green Version]
- Hong, H.; Pradhan, B.; Xu, C.; Bui, D.T. Spatial prediction of landslide hazard at the Yihuang area (China) using two-class kernel logistic regression, alternating decision tree and support vector machines. Catena 2015, 133, 266–281. [Google Scholar] [CrossRef]
- Pham, B.T.; Bui, D.T.; Prakash, I. Bagging based Support Vector Machines for spatial prediction of landslides. Environ. Earth Sci. 2018, 77, 146. [Google Scholar] [CrossRef]
- Dou, J.; Yunus, A.P.; Bui, D.T.; Merghadi, A.; Sahana, M.; Zhu, Z.; Chen, C.-W.; Han, Z.; Pham, B.T. Improved landslide assessment using support vector machine with bagging, boosting, and stacking ensemble machine learning framework in a mountainous watershed, Japan. Landslides 2019, 17, 641–658. [Google Scholar] [CrossRef]
- Shirzadi, A.; Bui, D.T.; Pham, B.T.; Solaimani, K.; Chapi, K.; Kavian, A.; Shahabi, H.; Revhaug, I. Shallow landslide susceptibility assessment using a novel hybrid intelligence approach. Environ. Earth Sci. 2017, 76. [Google Scholar] [CrossRef]
- Pham, B.T.; Shirzadi, A.; Bui, D.T.; Prakash, I.; Dholakia, M. A hybrid machine learning ensemble approach based on a Radial Basis Function neural network and Rotation Forest for landslide susceptibility modeling: A case study in the Himalayan area, India. Int. J. Sediment Res. 2018, 33, 157–170. [Google Scholar] [CrossRef]
- Nguyen, V.V.; Pham, B.T.; Vu, B.T.; Prakash, I.; Jha, S.; Shahabi, H.; Shirzadi, A.; Ba, D.N.; Kumar, R.; Chatterjee, J.M.; et al. Hybrid Machine Learning Approaches for Landslide Susceptibility Modeling. Forests 2019, 10, 157. [Google Scholar] [CrossRef] [Green Version]
- Abedini, M.; Ghasemian, B.; Shirzadi, A.; Shahabi, H.; Chapi, K.; Pham, B.T.; Bin Ahmad, B.; Bui, D.T. A novel hybrid approach of Bayesian Logistic Regression and its ensembles for landslide susceptibility assessment. Geocarto Int. 2018, 34, 1427–1457. [Google Scholar] [CrossRef]
- Khosravi, K.; Pham, B.T.; Adamowski, J.; Shahabi, H.; Pradhan, B.; Dou, J.; Ly, H.-B.; Gróf, G.; Loc, H.H.; Hong, H.; et al. A comparative assessment of flood susceptibility modeling using Multi-Criteria Decision-Making Analysis and Machine Learning Methods. J. Hydrol. 2019, 573, 311–323. [Google Scholar] [CrossRef]
- Shafizadeh-Moghadam, H.; Valavi, R.; Shahabi, H.; Chapi, K.; Shirzadi, A. Novel forecasting approaches using combination of machine learning and statistical models for flood susceptibility mapping. J. Environ. Manag. 2018, 217, 1–11. [Google Scholar] [CrossRef] [PubMed] [Green Version]
- Chen, W.; Li, Y.; Xue, W.; Shahabi, H.; Li, S.; Hong, H.; Wang, X.; Bian, H.; Zhang, S.; Pradhan, B.; et al. Modeling flood susceptibility using data-driven approaches of naïve Bayes tree, alternating decision tree, and random forest methods. Sci. Total Environ. 2019, 701, 134979. [Google Scholar] [CrossRef]
- Janizadeh, S.; Avand, M.; Jaafari, A.; Trinh, P.T.; Bayat, M.; Ahmadisharaf, E.; Prakash, I.; Pham, B.T.; Lee, S. Prediction Success of Machine Learning Methods for Flash Flood Susceptibility Mapping in the Tafresh Watershed, Iran. Sustainability 2019, 11, 5426. [Google Scholar] [CrossRef] [Green Version]
- Shahabi, H.; Shirzadi, A.; Ghaderi, K.; Omidavr, E.; Al-Ansari, N.; Clague, J.J.; Geertsema, M.; Khosravi, K.; Amini, A.; Bahrami, S.; et al. Flood Detection and Susceptibility Mapping Using Sentinel-1 Remote Sensing Data and a Machine Learning Approach: Hybrid Intelligence of Bagging Ensemble Based on K-Nearest Neighbor Classifier. Remote. Sens. 2020, 12, 266. [Google Scholar] [CrossRef] [Green Version]
- Jaafari, A.; Zenner, E.K.; Panahi, M.; Shahabi, H. Hybrid artificial intelligence models based on a neuro-fuzzy system and metaheuristic optimization algorithms for spatial prediction of wildfire probability. Agric. For. Meteorol. 2019, 266, 198–207. [Google Scholar] [CrossRef]
- Taheri, K.; Shahabi, H.; Chapi, K.; Shirzadi, A.; Gutiérrez, F.; Khosravi, K. Sinkhole susceptibility mapping: A comparison between Bayes-based machine learning algorithms. Land Degrad. Dev. 2019, 30, 730–745. [Google Scholar] [CrossRef]
- Rahmati, O.; Panahi, M.; Ghiasi, S.S.; Deo, R.C.; Tiefenbacher, J.P.; Pradhan, B.; Jahani, A.; Goshtasb, H.; Kornejady, A.; Shahabi, H.; et al. Hybridized neural fuzzy ensembles for dust source modeling and prediction. Atmos. Environ. 2020, 224, 117320. [Google Scholar] [CrossRef]
- Rahmati, O.; Panahi, M.; Kalantari, Z.; Soltani, E.; Falah, F.; Dayal, K.S.; Mohammadi, F.; Deo, R.C.; Tiefenbacher, J.; Bui, D.T. Capability and robustness of novel hybridized models used for drought hazard modeling in southeast Queensland, Australia. Sci. Total Environ. 2020, 718, 134656. [Google Scholar] [CrossRef] [PubMed]
- Azareh, A.; Rahmati, O.; Rafiei-Sardooi, E.; Sankey, J.B.; Lee, S.; Shahabi, H.; Bin Ahmad, B. Modelling gully-erosion susceptibility in a semi-arid region, Iran: Investigation of applicability of certainty factor and maximum entropy models. Sci. Total Environ. 2019, 655, 684–696. [Google Scholar] [CrossRef] [PubMed]
- Bui, D.T.; Shirzadi, A.; Chapi, K.; Shahabi, H.; Pradhan, B.; Pham, B.T.; Singh, V.P.; Ly, H.-B.; Khosravi, K.; Bin Ahmad, B.; et al. A Hybrid Computational Intelligence Approach to Groundwater Spring Potential Mapping. Water 2019, 11, 2013. [Google Scholar] [CrossRef] [Green Version]
- Nhu, V.-H.; Janizadeh, S.; Avand, M.; Chen, W.; Farzin, M.; Omidvar, E.; Shirzadi, A.; Shahabi, H.; Clague, J.J.; Jaafari, A.; et al. GIS-Based Gully Erosion Susceptibility Mapping: A Comparison of Computational Ensemble Data Mining Models. Appl. Sci. 2020, 10, 2039. [Google Scholar] [CrossRef] [Green Version]
- Bui, D.T.; Shahabi, H.; Shirzadi, A.; Chapi, K.; Pradhan, B.; Chen, W.; Khosravi, K.; Panahi, M.; Bin Ahmad, B.; Lee, S. Land Subsidence Susceptibility Mapping in South Korea Using Machine Learning Algorithms. Sensors 2018, 18, 2464. [Google Scholar] [CrossRef] [Green Version]
- Nasiri, V.; Darvishsefat, A.A.; Rafiee, R.; Shirvany, A.; Hemat, M.A. Land use change modeling through an integrated Multi-Layer Perceptron Neural Network and Markov Chain analysis (case study: Arasbaran region, Iran). J. For. Res. 2018, 30, 943–957. [Google Scholar] [CrossRef]
- Chen, W.; Zhao, X.; Tsangaratos, P.; Shahabi, H.; Ilia, I.; Xue, W.; Wang, X.; Bin Ahmad, B. Evaluating the usage of tree-based ensemble methods in groundwater spring potential mapping. J. Hydrol. 2020, 583, 124602. [Google Scholar] [CrossRef]
- Nhu, V.-H.; Rahmati, O.; Falah, F.; Shojaei, S.; Al-Ansari, N.; Shahabi, H.; Shirzadi, A.; Górski, K.; Nguyen, H.; Bin Ahmad, B. Mapping of Groundwater Spring Potential in Karst Aquifer System Using Novel Ensemble Bivariate and Multivariate Models. Water 2020, 12, 985. [Google Scholar] [CrossRef] [Green Version]
- Chen, W.; Pradhan, B.; Li, S.; Shahabi, H.; Rizeei, H.M.; Hou, E.; Wang, S. Novel Hybrid Integration Approach of Bagging-Based Fisher’s Linear Discriminant Function for Groundwater Potential Analysis. Nat. Resour. Res. 2019, 28, 1239–1258. [Google Scholar] [CrossRef] [Green Version]
- Nguyen, P.T.; Ha, D.H.; Jaafari, A.; Nguyen, H.D.; van Phong, T.; Al-Ansari, N.; Prakash, I.; van Le, H.; Pham, B.T. Groundwater Potential Mapping Combining Artificial Neural Network and Real AdaBoost Ensemble Technique: The DakNong Province Case-study, Vietnam. Int. J. Environ. Res. Public Heal. 2020, 17, 2473. [Google Scholar] [CrossRef] [PubMed] [Green Version]
- Nguyen, P.T.; Ha, D.H.; Avand, M.; Jaafari, A.; Nguyen, H.D.; Al-Ansari, N.; van Phong, T.; Sharma, R.; Kumar, R.; van Le, H.; et al. Soft Computing Ensemble Models Based on Logistic Regression for Groundwater Potential Mapping. Appl. Sci. 2020, 10, 2469. [Google Scholar] [CrossRef] [Green Version]
- Mohammadi, A.; Baharin, B.A.; Shahabi, H. Land cover mapping using a novel combination model of satellite imageries: Case study of a part of the Cameron Highlands, Pahang, Malaysia. Appl. Ecol. Environ. Res. 2019, 17, 1835–1848. [Google Scholar] [CrossRef]
- Jaafari, A.; Najafi, A.; Rezaeian, J.; Sattarian, A. Modeling erosion and sediment delivery from unpaved roads in the north mountainous forest of Iran. GEM Int. J. Geomath. 2014, 6, 343–356. [Google Scholar] [CrossRef]
- Miller, S.; Brewer, T.; Harris, N. Rainfall thresholding and susceptibility assessment of rainfall-induced landslides: Application to landslide management in St Thomas, Jamaica. Bull. Int. Assoc. Eng. Geol. 2009, 68, 539–550. [Google Scholar] [CrossRef]
- Maghsoudi, M.; Navidfar, A.; Mohammadi, A. The sand dunes migration patterns in Mesr Erg region using satellite imagery analysis and wind data. Nat. Environ. Chang. 2017, 3, 33–43. [Google Scholar]
- Brehaut, L.; Danby, R. Inconsistent relationships between annual tree ring-widths and satellite-measured NDVI in a mountainous subarctic environment. Ecol. Indic. 2018, 91, 698–711. [Google Scholar] [CrossRef]
- Pham, B.T.; Pradhan, B.; Bui, D.T.; Prakash, I.; Dholakia, M. A comparative study of different machine learning methods for landslide susceptibility assessment: A case study of Uttarakhand area (India). Environ. Model. Softw. 2016, 84, 240–250. [Google Scholar] [CrossRef]
- Mafi-Gholami, D.; Zenner, E.K.; Jaafari, A.; Bui, D.T. Spatially explicit predictions of changes in the extent of mangroves of Iran at the end of the 21st century. Estuarine Coast. Shelf Sci. 2020, 237, 106644. [Google Scholar] [CrossRef]
- Le, T.-T.; Zenner, E.K.; Jaafari, A. Mangrove regional feedback to sea level rise and drought intensity at the end of the 21st century. Ecol. Indic. 2020, 110, 105972. [Google Scholar] [CrossRef]
- Le, T.-T.; Zenner, E.K.; Jaafari, A.; Ward, R.D. Modeling multi-decadal mangrove leaf area index in response to drought along the semi-arid southern coasts of Iran. Sci. Total Environ. 2019, 656, 1326–1336. [Google Scholar] [CrossRef]
- Hong, H.; Liu, J.; Bui, D.T.; Pradhan, B.; Acharya, T.D.; Pham, B.T.; Zhu, A.-X.; Chen, W.; Bin Ahmad, B. Landslide susceptibility mapping using J48 Decision Tree with AdaBoost, Bagging and Rotation Forest ensembles in the Guangchang area (China). Catena 2018, 163, 399–413. [Google Scholar] [CrossRef]
- Liu, J.-K.; Shih, P.T. Topographic Correction of Wind-Driven Rainfall for Landslide Analysis in Central Taiwan with Validation from Aerial and Satellite Optical Images. Remote. Sens. 2013, 5, 2571–2589. [Google Scholar] [CrossRef] [Green Version]
- Jebur, M.N.; Pradhan, B.; Tehrany, M.S. Optimization of landslide conditioning factors using very high-resolution airborne laser scanning (LiDAR) data at catchment scale. Remote. Sens. Environ. 2014, 152, 150–165. [Google Scholar] [CrossRef]
- Shahabi, H.; Khezri, S.; Bin Ahmad, B.; Hashim, M. Landslide susceptibility mapping at central Zab basin, Iran: A comparison between analytical hierarchy process, frequency ratio and logistic regression models. Catena 2014, 115, 55–70. [Google Scholar] [CrossRef]
- Shahabi, H.; Salari, M.; Bin Ahmad, B.; Mohammadi, A. Soil Erosion Hazard Mapping in Central Zab Basin Using Epm Model in GIS Environment. Int. J. Geogr. Geol. 2016, 5, 224–235. [Google Scholar] [CrossRef]
- He, S.; Pan, P.; Dai, L.; Wang, H.; Liu, J. Application of kernel-based Fisher discriminant analysis to map landslide susceptibility in the Qinggan River delta, Three Gorges, China. Geomorphology 2012, 171, 30–41. [Google Scholar] [CrossRef]
- Hong, H.; Liu, J.; Zhu, A.-X.; Shahabi, H.; Pham, B.T.; Chen, W.; Pradhan, B.; Bui, D.T. A novel hybrid integration model using support vector machines and random subspace for weather-triggered landslide susceptibility assessment in the Wuning area (China). Environ. Earth Sci. 2017, 76. [Google Scholar] [CrossRef]
- Nguyen, P.T.; Tuyen, T.T.; Shirzadi, A.; Pham, B.T.; Shahabi, H.; Omidvar, E.; Amini, A.; Entezami, H.; Prakash, I.; van Phong, T.; et al. Development of a Novel Hybrid Intelligence Approach for Landslide Spatial Prediction. Appl. Sci. 2019, 9, 2824. [Google Scholar] [CrossRef] [Green Version]
- Shafizadeh-Moghadam, H.; Minaei, M.; Shahabi, H.; Hagenauer, J. Big data in Geohazard; Pattern mining and large-scale analysis of landslides in Iran. Earth Sci. Informatics 2018, 12, 1–17. [Google Scholar] [CrossRef]
- Shirzadi, A.; Shahabi, H.; Chapi, K.; Bui, D.T.; Pham, B.T.; Shahedi, K.; Bin Ahmad, B. A comparative study between popular statistical and machine learning methods for simulating volume of landslides. Catena 2017, 157, 213–226. [Google Scholar] [CrossRef]
- Bui, D.T.; Shirzadi, A.; Amini, A.; Shahabi, H.; Al-Ansari, N.; Hamidi, S.; Singh, S.K.; Thai Pham, B.; Ahmad, B.B.; Ghazvinei, P.T. A hybrid intelligence approach to enhance the prediction accuracy of local scour depth at complex bridge piers. Sustainability 2020, 12, 1063. [Google Scholar] [CrossRef] [Green Version]
- Pham, B.T.; Jaafari, A.; Prakash, I.; Singh, S.K.; Quoc, N.K.; Bui, D.T. Hybrid computational intelligence models for groundwater potential mapping. Catena 2019, 182, 104101. [Google Scholar] [CrossRef]
- Freund, Y.; Mason, L. The Alternating Decision Tree Learning Algorithm. Proceedings of the International Conference on Machine Learning. 1999. Available online: https://cseweb.ucsd.edu/~yfreund/papers/atrees.pdf (accessed on 3 July 2020).
- Jaafari, A.; Zenner, E.K.; Pham, B.T. Wildfire spatial pattern analysis in the Zagros Mountains, Iran: A comparative study of decision tree-based classifiers. Ecol. Inf. 2018, 43, 200–211. [Google Scholar] [CrossRef]
- Rokach, L. Ensemble-based classifiers. Artif. Intell. Rev. 2009, 33, 1–39. [Google Scholar] [CrossRef]
- Tien Bui, D.; Shahabi, H.; Omidvar, E.; Shirzadi, A.; Geertsema, M.; Clague, J.J.; Khosravi, K.; Pradhan, B.; Pham, B.T.; Chapi, K.; et al. Shallow landslide prediction using a novel hybrid functional machine learning algorithm. Remote. Sens. 2019, 11, 931. [Google Scholar] [CrossRef] [Green Version]
- Shirzadi, A.; Soliamani, K.; Habibnejhad, M.; Kavian, A.; Chapi, K.; Shahabi, H.; Chen, W.; Khosravi, K.; Pham, B.T.; Pradhan, B.; et al. Novel GIS Based Machine Learning Algorithms for Shallow Landslide Susceptibility Mapping. Sensors 2018, 18, 3777. [Google Scholar] [CrossRef]
- Bennett, N.D.; Croke, B.F.; Guariso, G.; Guillaume, J.H.A.; Hamilton, S.; Jakeman, A.J.; Libelli, S.M.; Newham, L.T.; Norton, J.P.; Perrin, C.; et al. Characterising performance of environmental models. Environ. Model. Softw. 2013, 40, 1–20. [Google Scholar] [CrossRef]
- Pham, B.T.; Bui, D.T.; Prakash, I.; Dholakia, M. Hybrid integration of Multilayer Perceptron Neural Networks and machine learning ensembles for landslide susceptibility assessment at Himalayan area (India) using GIS. Catena 2017, 149, 52–63. [Google Scholar] [CrossRef]
- Bayat, M.; Ghorbanpour, M.; Zare, R.; Jaafari, A.; Pham, B.T. Application of artificial neural networks for predicting tree survival and mortality in the Hyrcanian forest of Iran. Comput. Electron. Agric. 2019, 164. [Google Scholar] [CrossRef]
- Fawcett, T. An introduction to ROC analysis. Pattern Recognit. Lett. 2006, 27, 861–874. [Google Scholar] [CrossRef]
- Chen, W.; Panahi, M.; Tsangaratos, P.; Shahabi, H.; Ilia, I.; Panahi, S.; Li, S.; Jaafari, A.; Ahmad, B.B. Applying population-based evolutionary algorithms and a neuro-fuzzy system for modeling landslide susceptibility. Catena 2019, 172, 212–231. [Google Scholar] [CrossRef]
- Jaafari, A. LiDAR-supported prediction of slope failures using an integrated ensemble weights-of-evidence and analytical hierarchy process. Environ. Earth Sci. 2018, 77, 42. [Google Scholar] [CrossRef]
- Chen, W.; Zhang, S.; Li, R.; Shahabi, H. Performance evaluation of the GIS-based data mining techniques of best-first decision tree, random forest, and naïve Bayes tree for landslide susceptibility modeling. Sci. Total Environ. 2018, 644, 1006–1018. [Google Scholar] [CrossRef] [PubMed]
- Chen, W.; Zhao, X.; Shahabi, H.; Shirzadi, A.; Khosravi, K.; Chai, H.; Zhang, S.; Zhang, L.; Ma, J.; Chen, Y.; et al. Spatial prediction of landslide susceptibility by combining evidential belief function, logistic regression and logistic model tree. Geocarto Int. 2019, 34, 1177–1201. [Google Scholar] [CrossRef]
- Friedman, M. The use of ranks to avoid the assumption of normality implicit in the analysis of variance. J. Am. Stat. Assoc. 1937, 32, 675–701. [Google Scholar] [CrossRef]
- Wilcoxon, F. Individual Comparisons by Ranking Methods. In Springer Series in Statistics; Springer Science and Business Media LLC: Berlin/Heidelberg, Germany, 1992; pp. 196–202. [Google Scholar]
- Jaafari, A.; Le, T.-T.; Pham, B.T.; Bui, D.T.T. Wildfire Probability Mapping: Bivariate vs. Multivariate Statistics. Remote. Sens. 2019, 11, 618. [Google Scholar] [CrossRef] [Green Version]
- Donati, L.; Turrini, M. An objective method to rank the importance of the factors predisposing to landslides with the GIS methodology: Application to an area of the Apennines (Valnerina; Perugia, Italy). Eng. Geol. 2002, 63, 277–289. [Google Scholar] [CrossRef]
- Liu, J.G.; Mason, P.; Clerici, N.; Chen, S.; Davis, A.; Miao, F.; Deng, H.; Liang, L. Landslide hazard assessment in the Three Gorges area of the Yangtze river using ASTER imagery: Zigui–Badong. Geomorphology 2004, 61, 171–187. [Google Scholar] [CrossRef]
- Topal, T. GIS-based landslide susceptibility mapping for a problematic segment of the natural gas pipeline, Hendek (Turkey). Environ. Earth Sci. 2003, 44, 949–962. [Google Scholar] [CrossRef]
- Shirzadi, A.; Saro, L.; Joo, O.H.; Chapi, K. A GIS-based logistic regression model in rock-fall susceptibility mapping along a mountainous road: Salavat Abad case study, Kurdistan, Iran. Nat. Hazards 2012, 64, 1639–1656. [Google Scholar] [CrossRef] [Green Version]
- Chen, W.; Shirzadi, A.; Shahabi, H.; Bin Ahmad, B.; Zhang, S.; Hong, H.; Zhang, N. A novel hybrid artificial intelligence approach based on the rotation forest ensemble and naïve Bayes tree classifiers for a landslide susceptibility assessment in Langao County, China. Geomatics Nat. Hazards Risk 2017, 8, 1955–1977. [Google Scholar] [CrossRef] [Green Version]
- Pham, B.T.; Prakash, I.; Singh, S.K.; Shirzadi, A.; Shahabi, H.; Tran, T.-T.-T.; Bui, D.T. Landslide susceptibility modeling using Reduced Error Pruning Trees and different ensemble techniques: Hybrid machine learning approaches. Catena 2019, 175, 203–218. [Google Scholar] [CrossRef]
- Shirzadi, A.; Solaimani, K.; Roshan, M.H.; Kavian, A.; Chapi, K.; Shahabi, H.; Keesstra, S.; Bin Ahmad, B.; Bui, D.T. Uncertainties of prediction accuracy in shallow landslide modeling: Sample size and raster resolution. Catena 2019, 178, 172–188. [Google Scholar] [CrossRef]
- Nhu, V.-H.; Shirzadi, A.; Shahabi, H.; Singh, S.K.; Al-Ansari, N.; Clague, J.J.; Jaafari, A.; Ly, H.-B.; Miraki, S.; Dou, J.; et al. Shallow Landslide Susceptibility Mapping: A Comparison between Logistic Model Tree, Logistic Regression, Naïve Bayes Tree, Artificial Neural Network, and Support Vector Machine Algorithms. Int. J. Environ. Res. Public Heal. 2020, 17, 2749. [Google Scholar] [CrossRef] [PubMed]
- Bui, D.T.; Ho, T.C.; Revhaug, I.; Pradhan, B.; Nguyen, D.B. Landslide Susceptibility Mapping Along the National Road 32 of Vietnam Using GIS-Based J48 Decision Tree Classifier and Its Ensembles. In Lecture Notes in Geoinformation and Cartography; Springer Science and Business Media LLC: Berlin/Heidelberg, Germany, 2013; pp. 303–317. [Google Scholar]
- Tien Bui, D.; Shirzadi, A.; Shahabi, H.; Geertsema, M.; Omidvar, E.; Clague, J.J.; Thai Pham, B.; Dou, J.; Talebpour Asl, D.; Bin Ahmad, B.; et al. New ensemble models for shallow landslide susceptibility modeling in a semi-arid watershed. Forests 2019, 10, 743. [Google Scholar] [CrossRef] [Green Version]
- Bui, D.T.; Ho, T.-C.; Pradhan, B.; Pham, B.T.; Nhu, V.-H.; Revhaug, I. GIS-based modeling of rainfall-induced landslides using data mining-based functional trees classifier with AdaBoost, Bagging, and MultiBoost ensemble frameworks. Environ. Earth Sci. 2016, 75. [Google Scholar] [CrossRef]
- Pham, B.T.; Avand, M.; Janizadeh, S.; van Phong, T.; Al-Ansari, N.; Ho, L.S.; Das, S.; van Le, H.; Amini, A.; Bozchaloei, S.K.; et al. GIS Based Hybrid Computational Approaches for Flash Flood Susceptibility Assessment. Water 2020, 12, 683. [Google Scholar] [CrossRef] [Green Version]


| Conditioning Factor | Source | Scale | Classification Method |
|---|---|---|---|
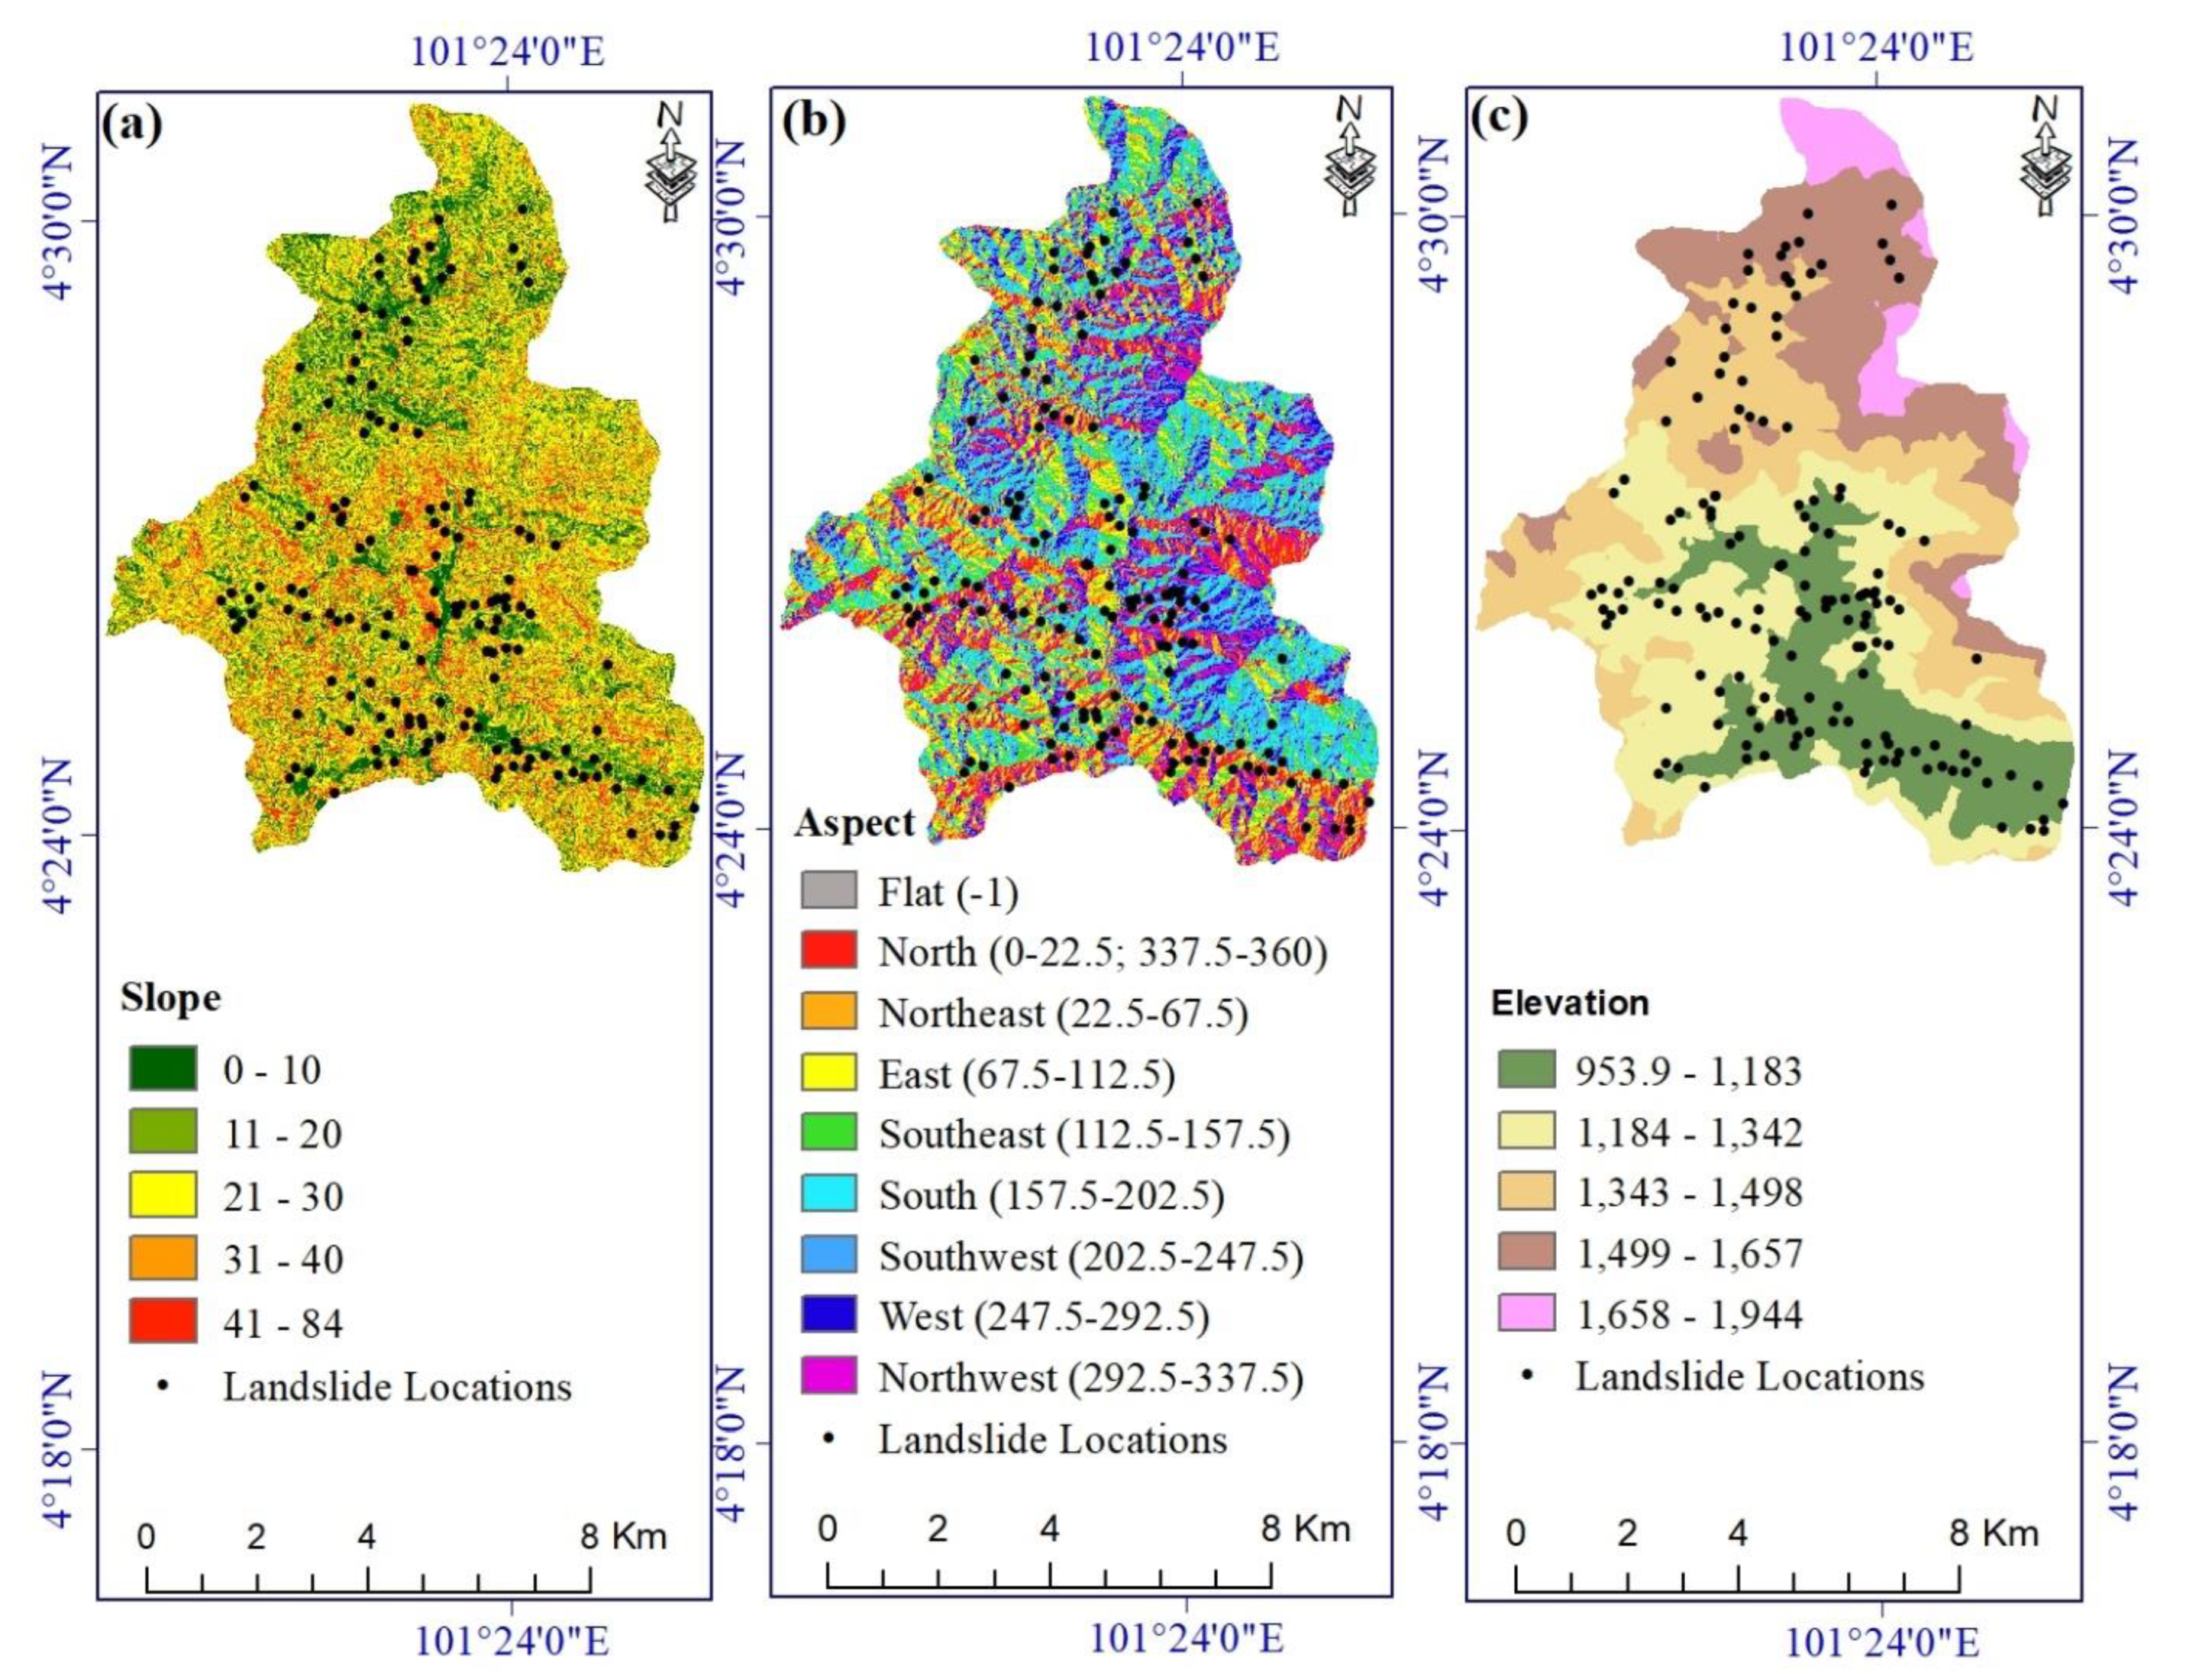
| Slope angle | DEM generated from Sentinel-1 satellite imagery | 10 × 10 m | Manual |
| Aspect | Manual | ||
| Elevation (m) | Equal interval | ||
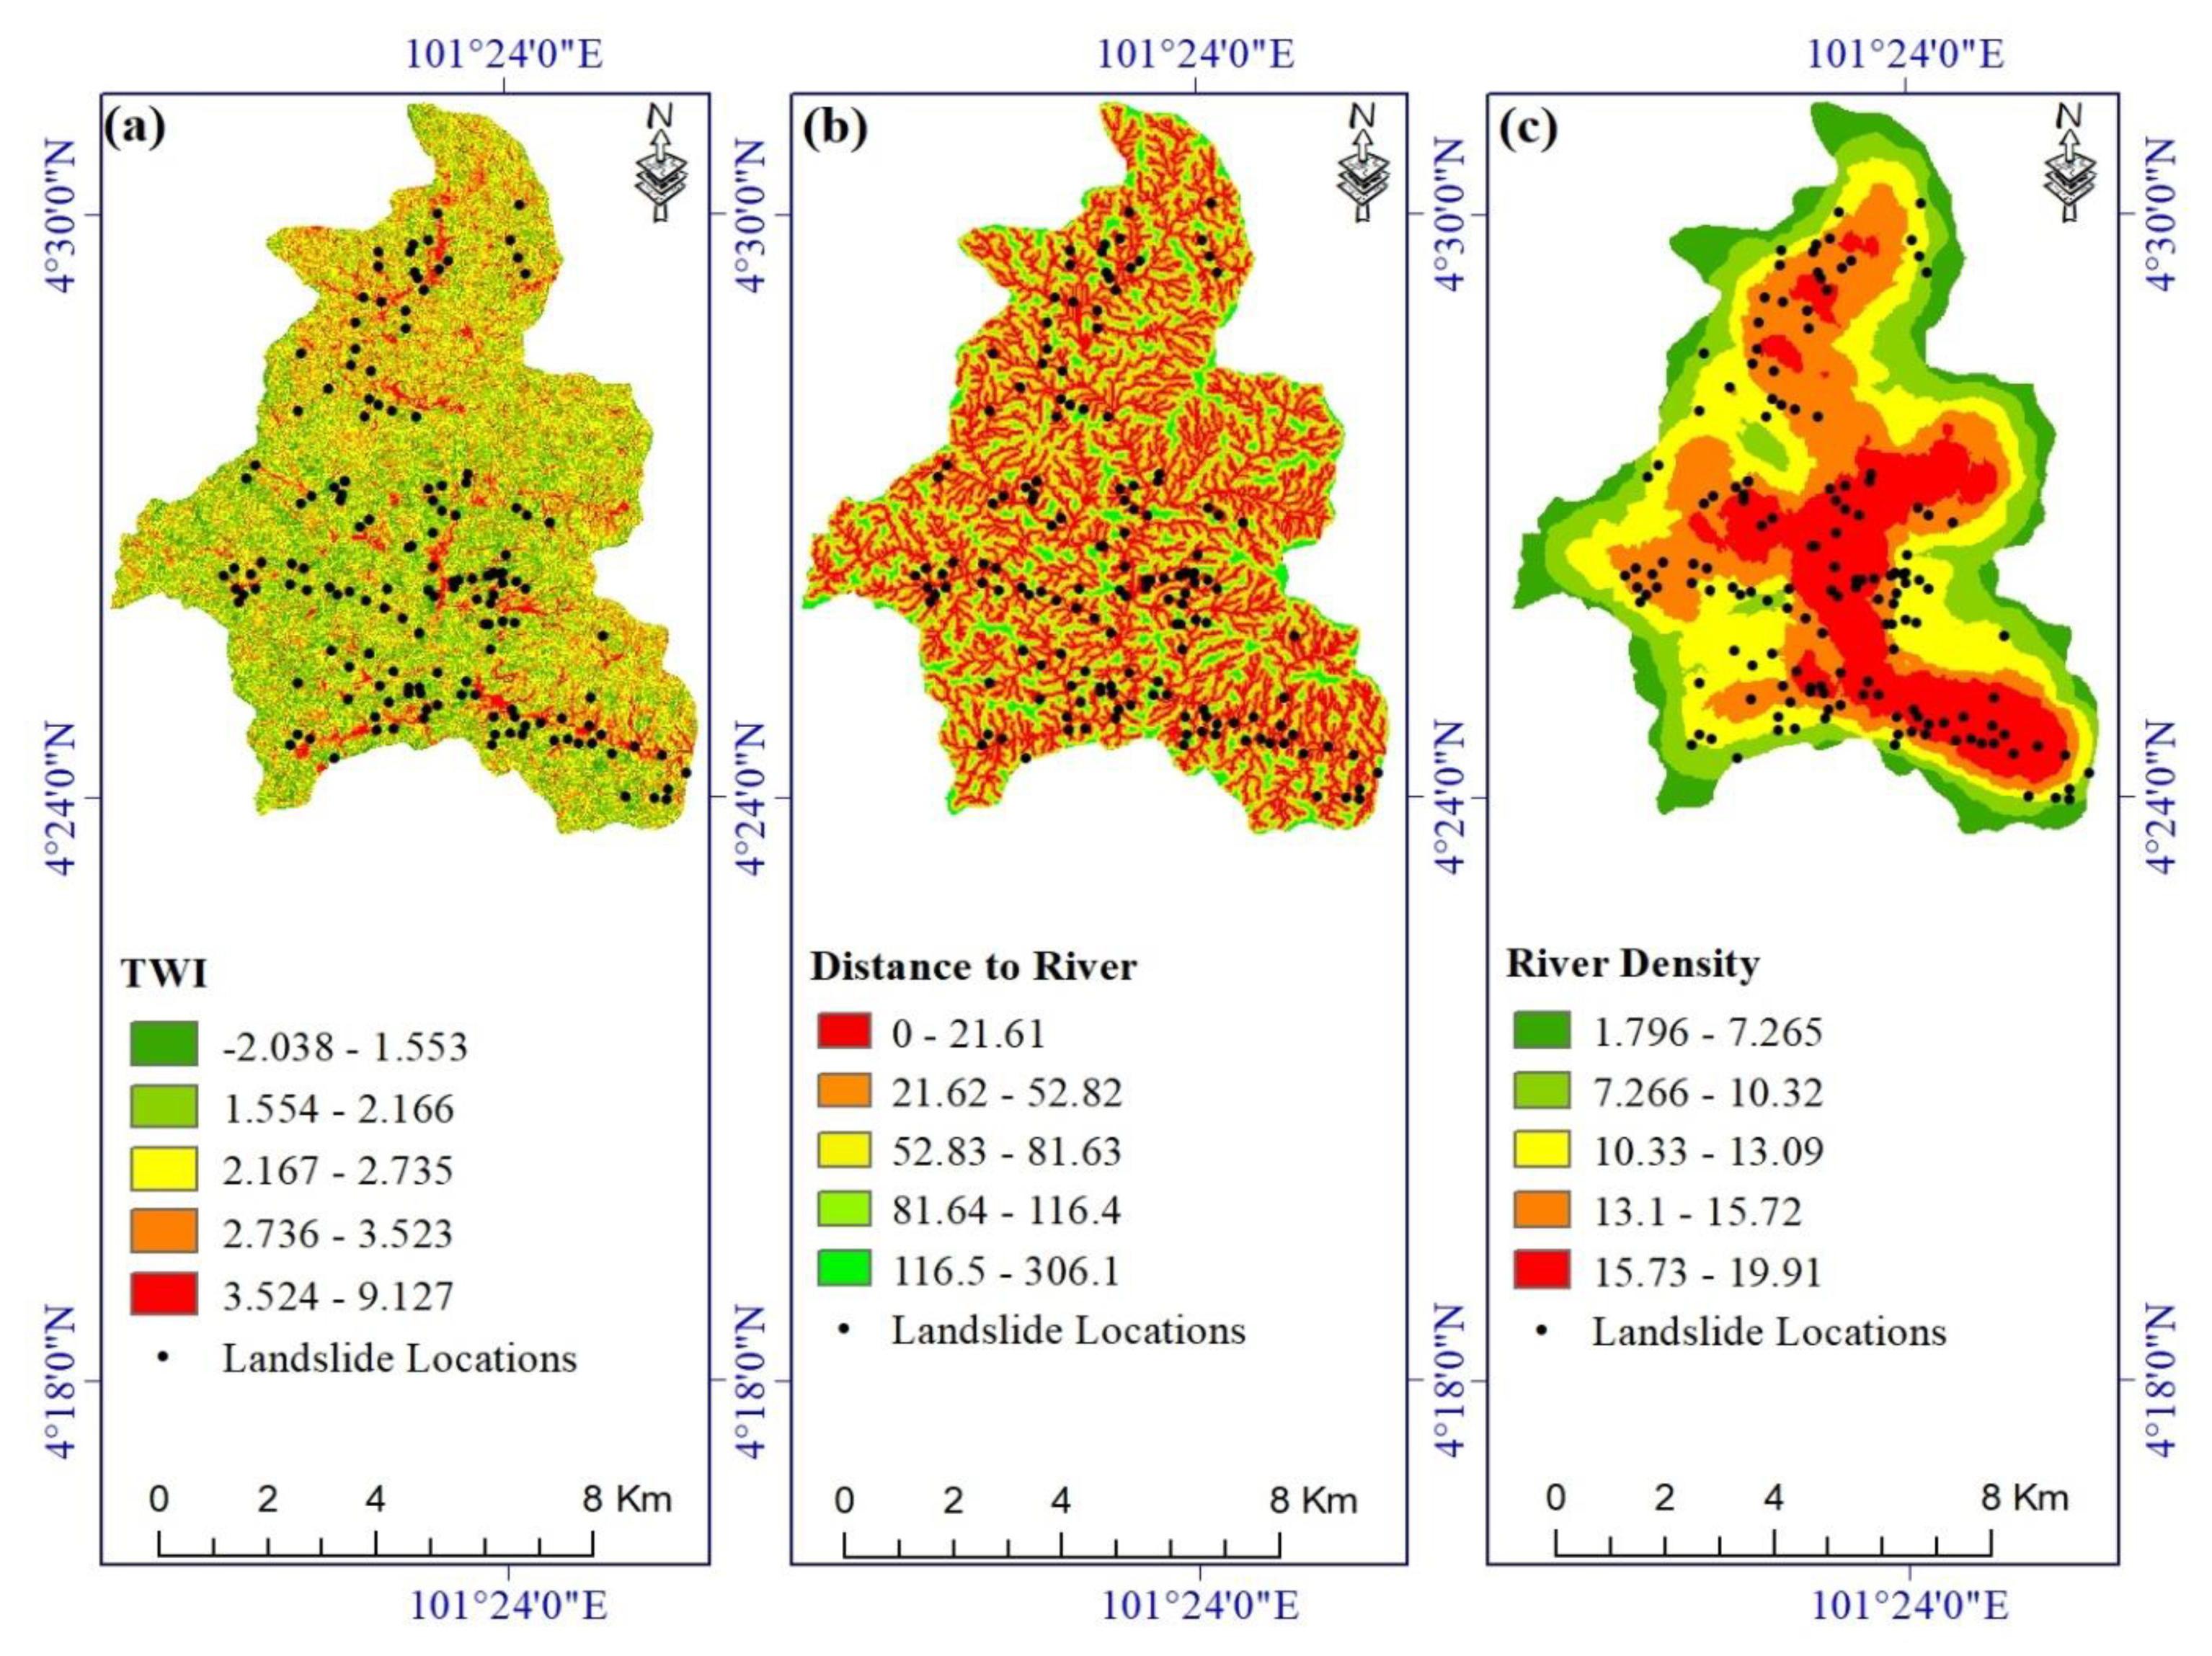
| Distance to river (m) | Manual | ||
| River density (km/km2) | Natural breaks | ||
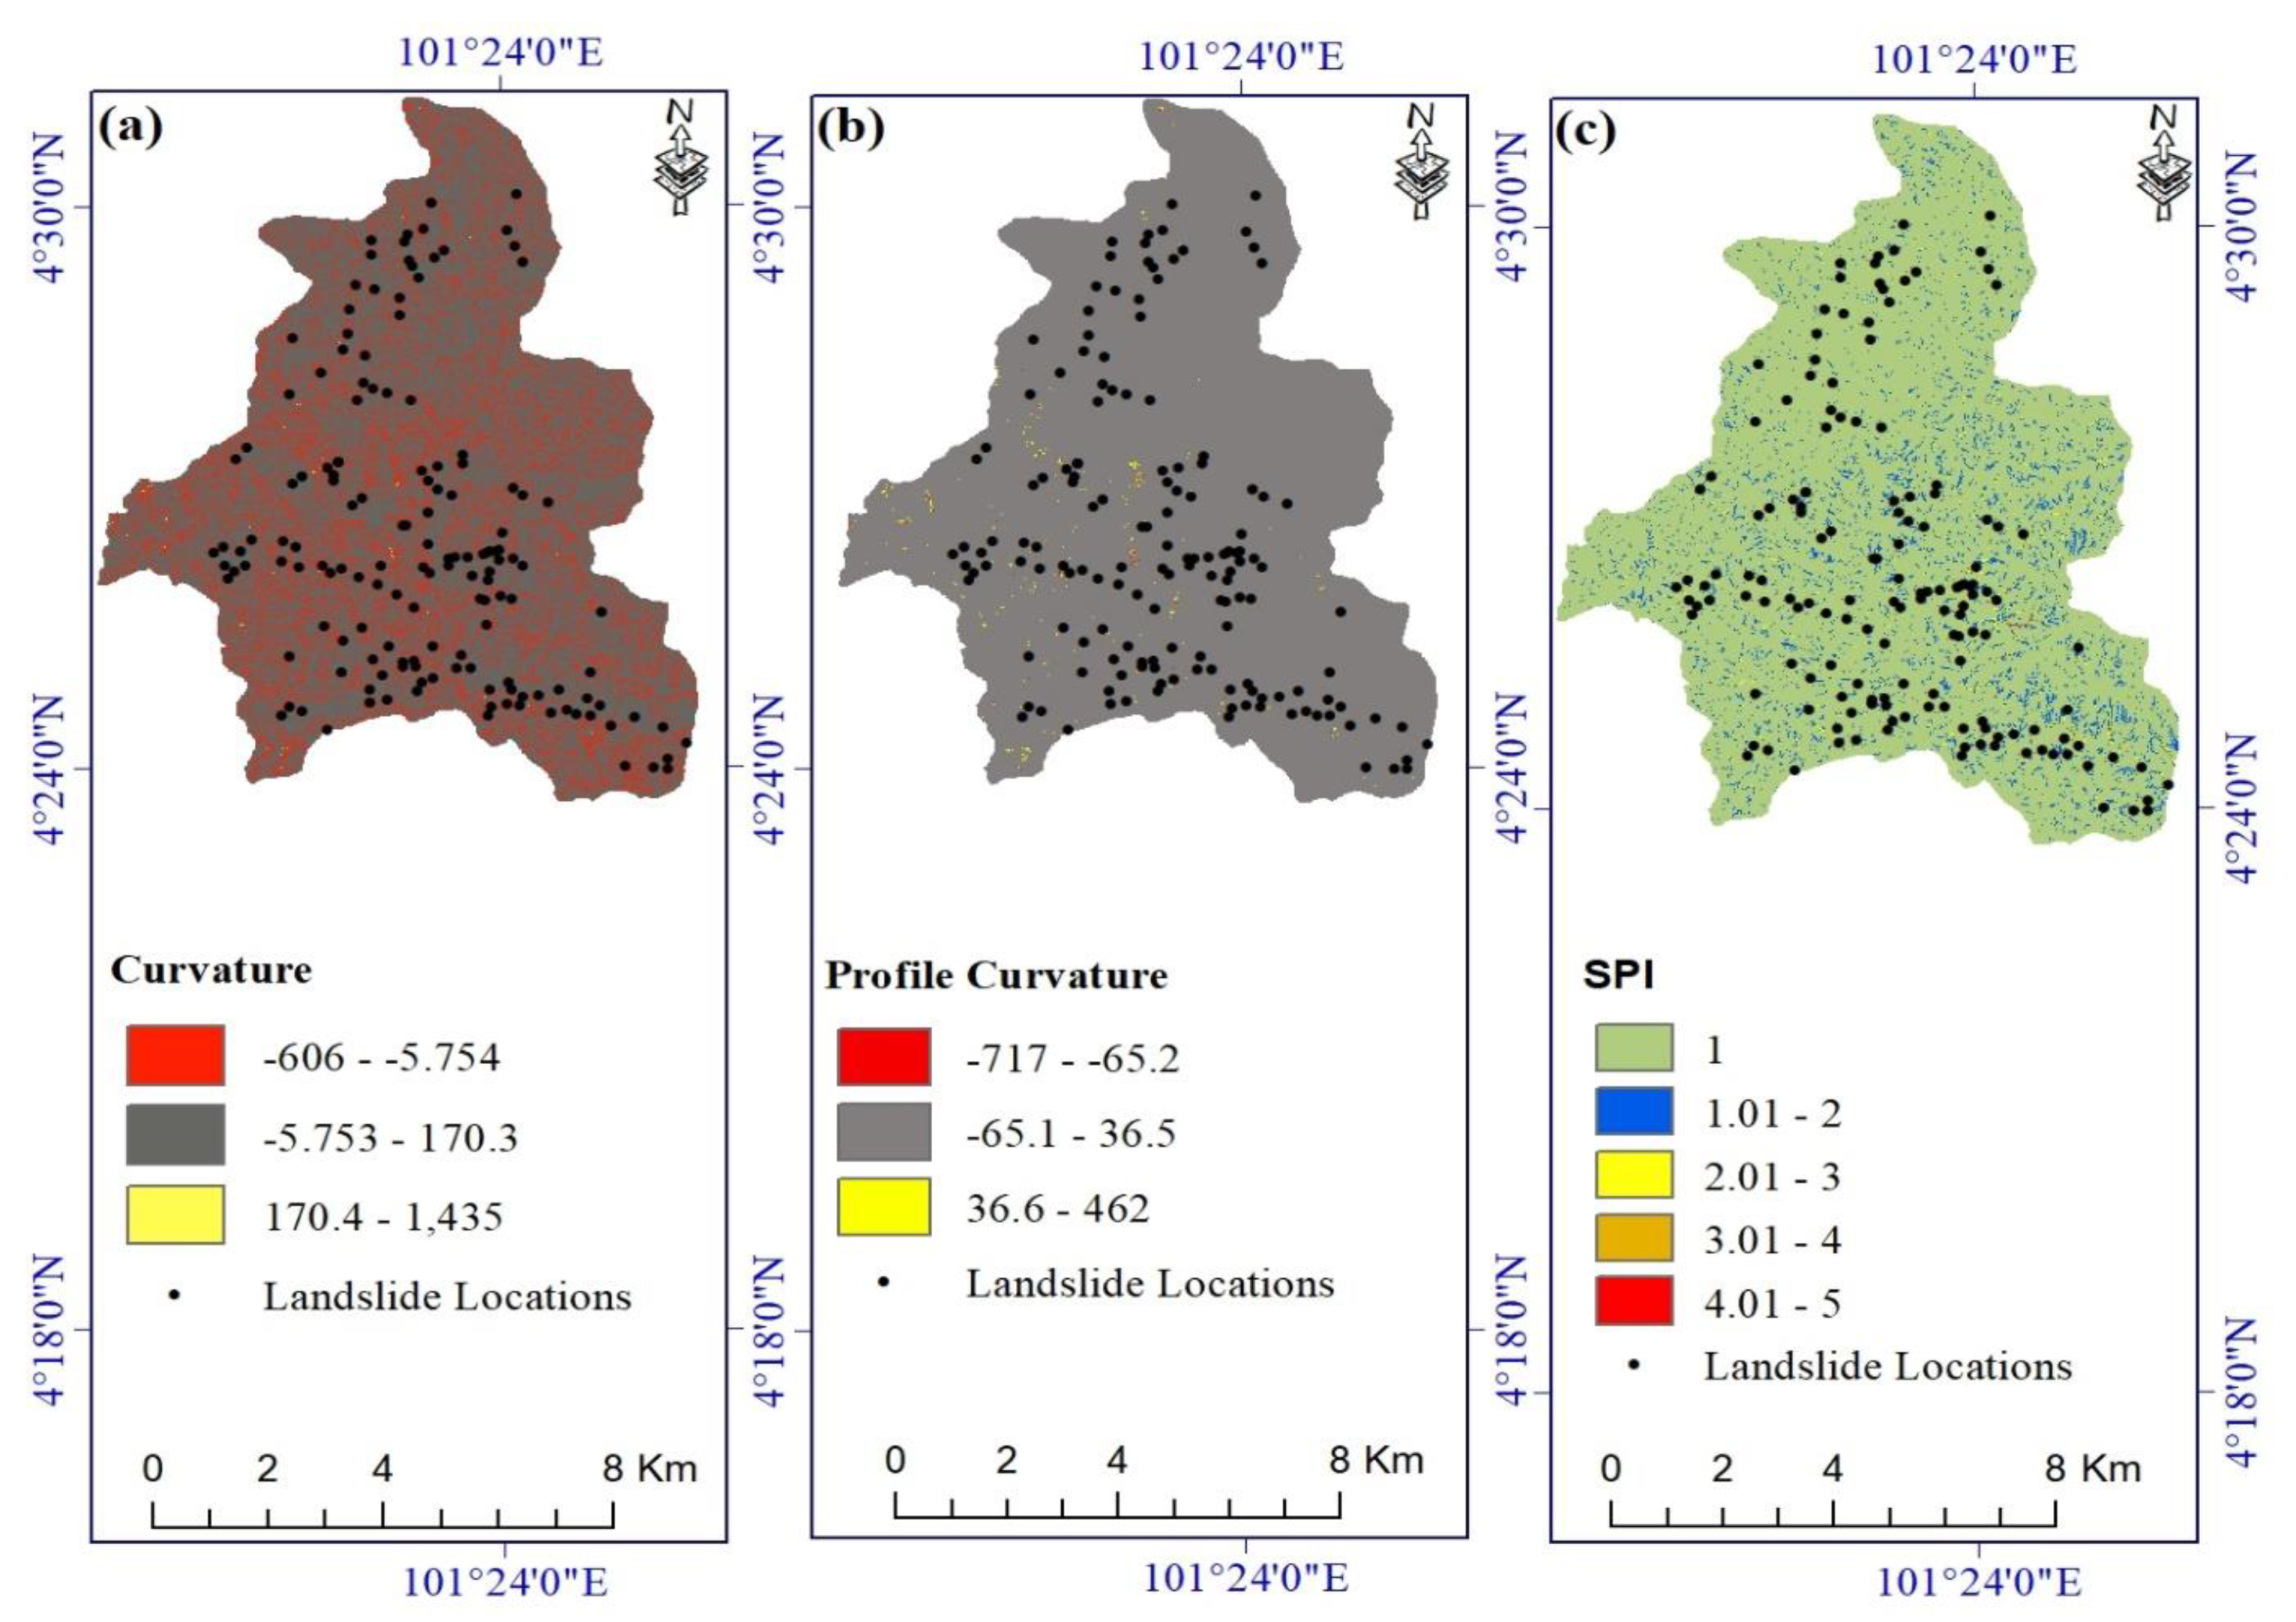
| Curvature | Manual | ||
| Profile curvature | Manual | ||
| SPI | Natural breaks | ||
| TWI | Natural breaks | ||
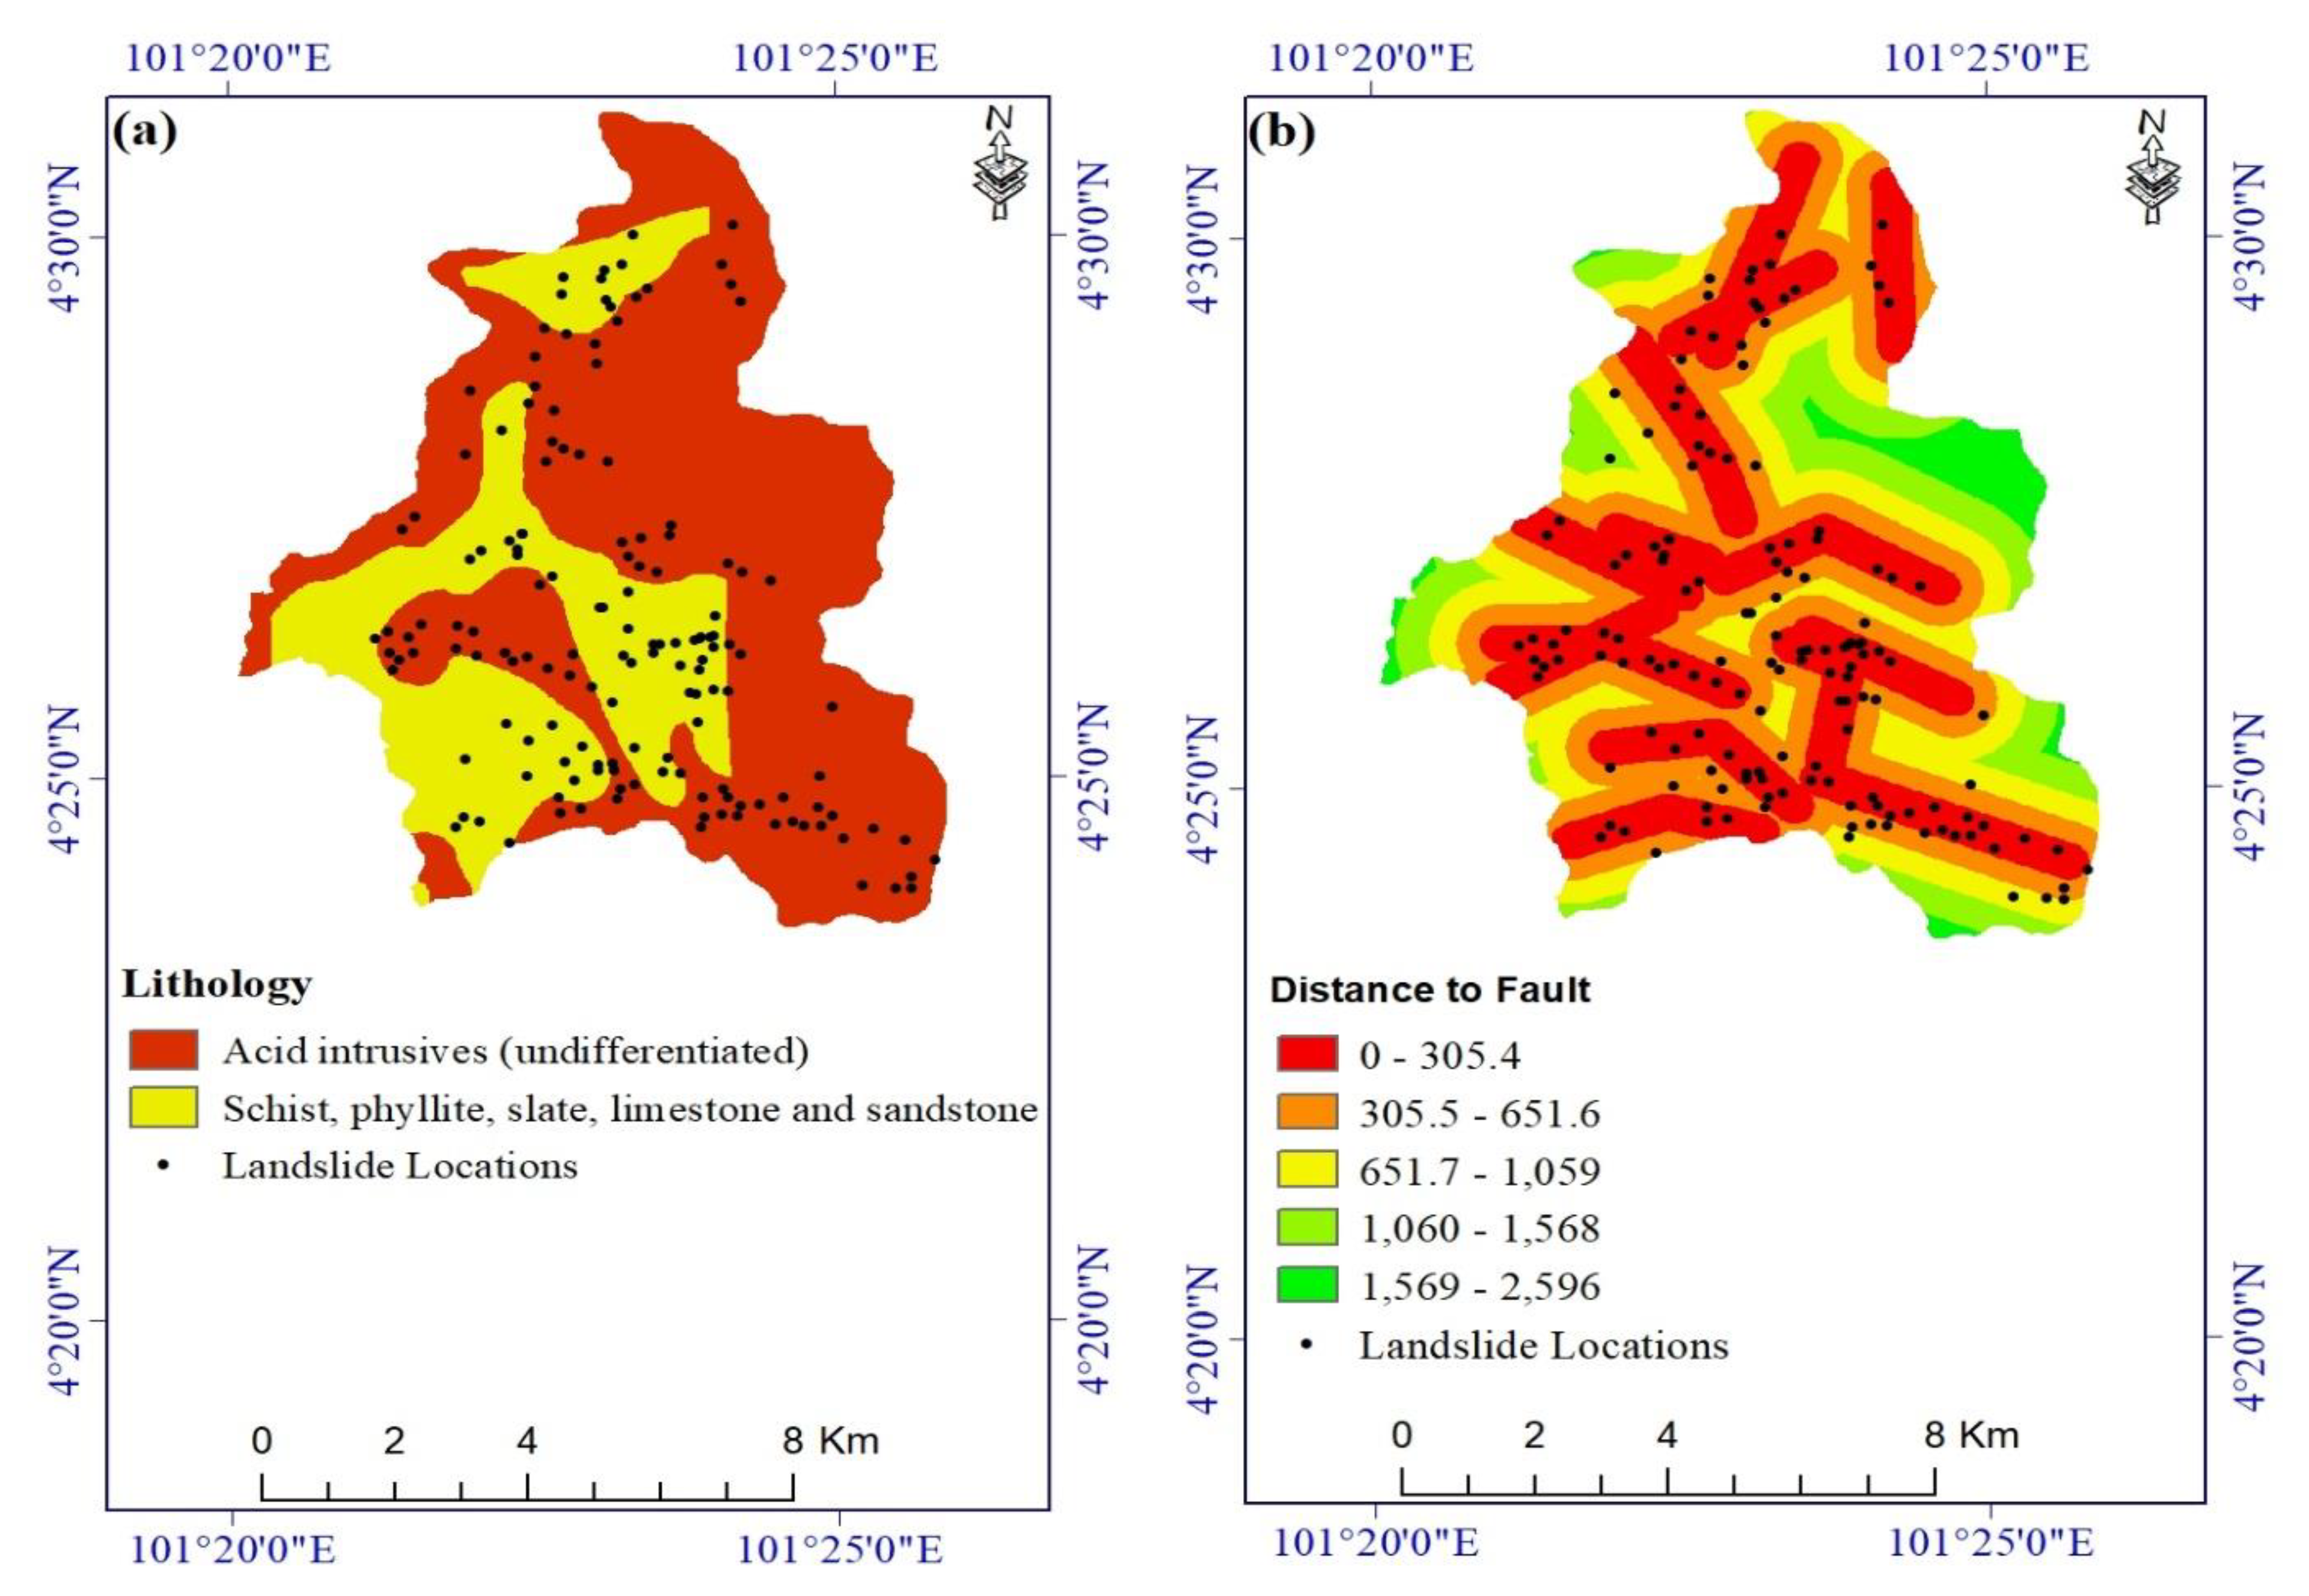
| Lithology | Mineral and Geoscience Department, Malaysia | 1:100,000 | Lithological units |
| Distance to fault (m) | Natural breaks | ||
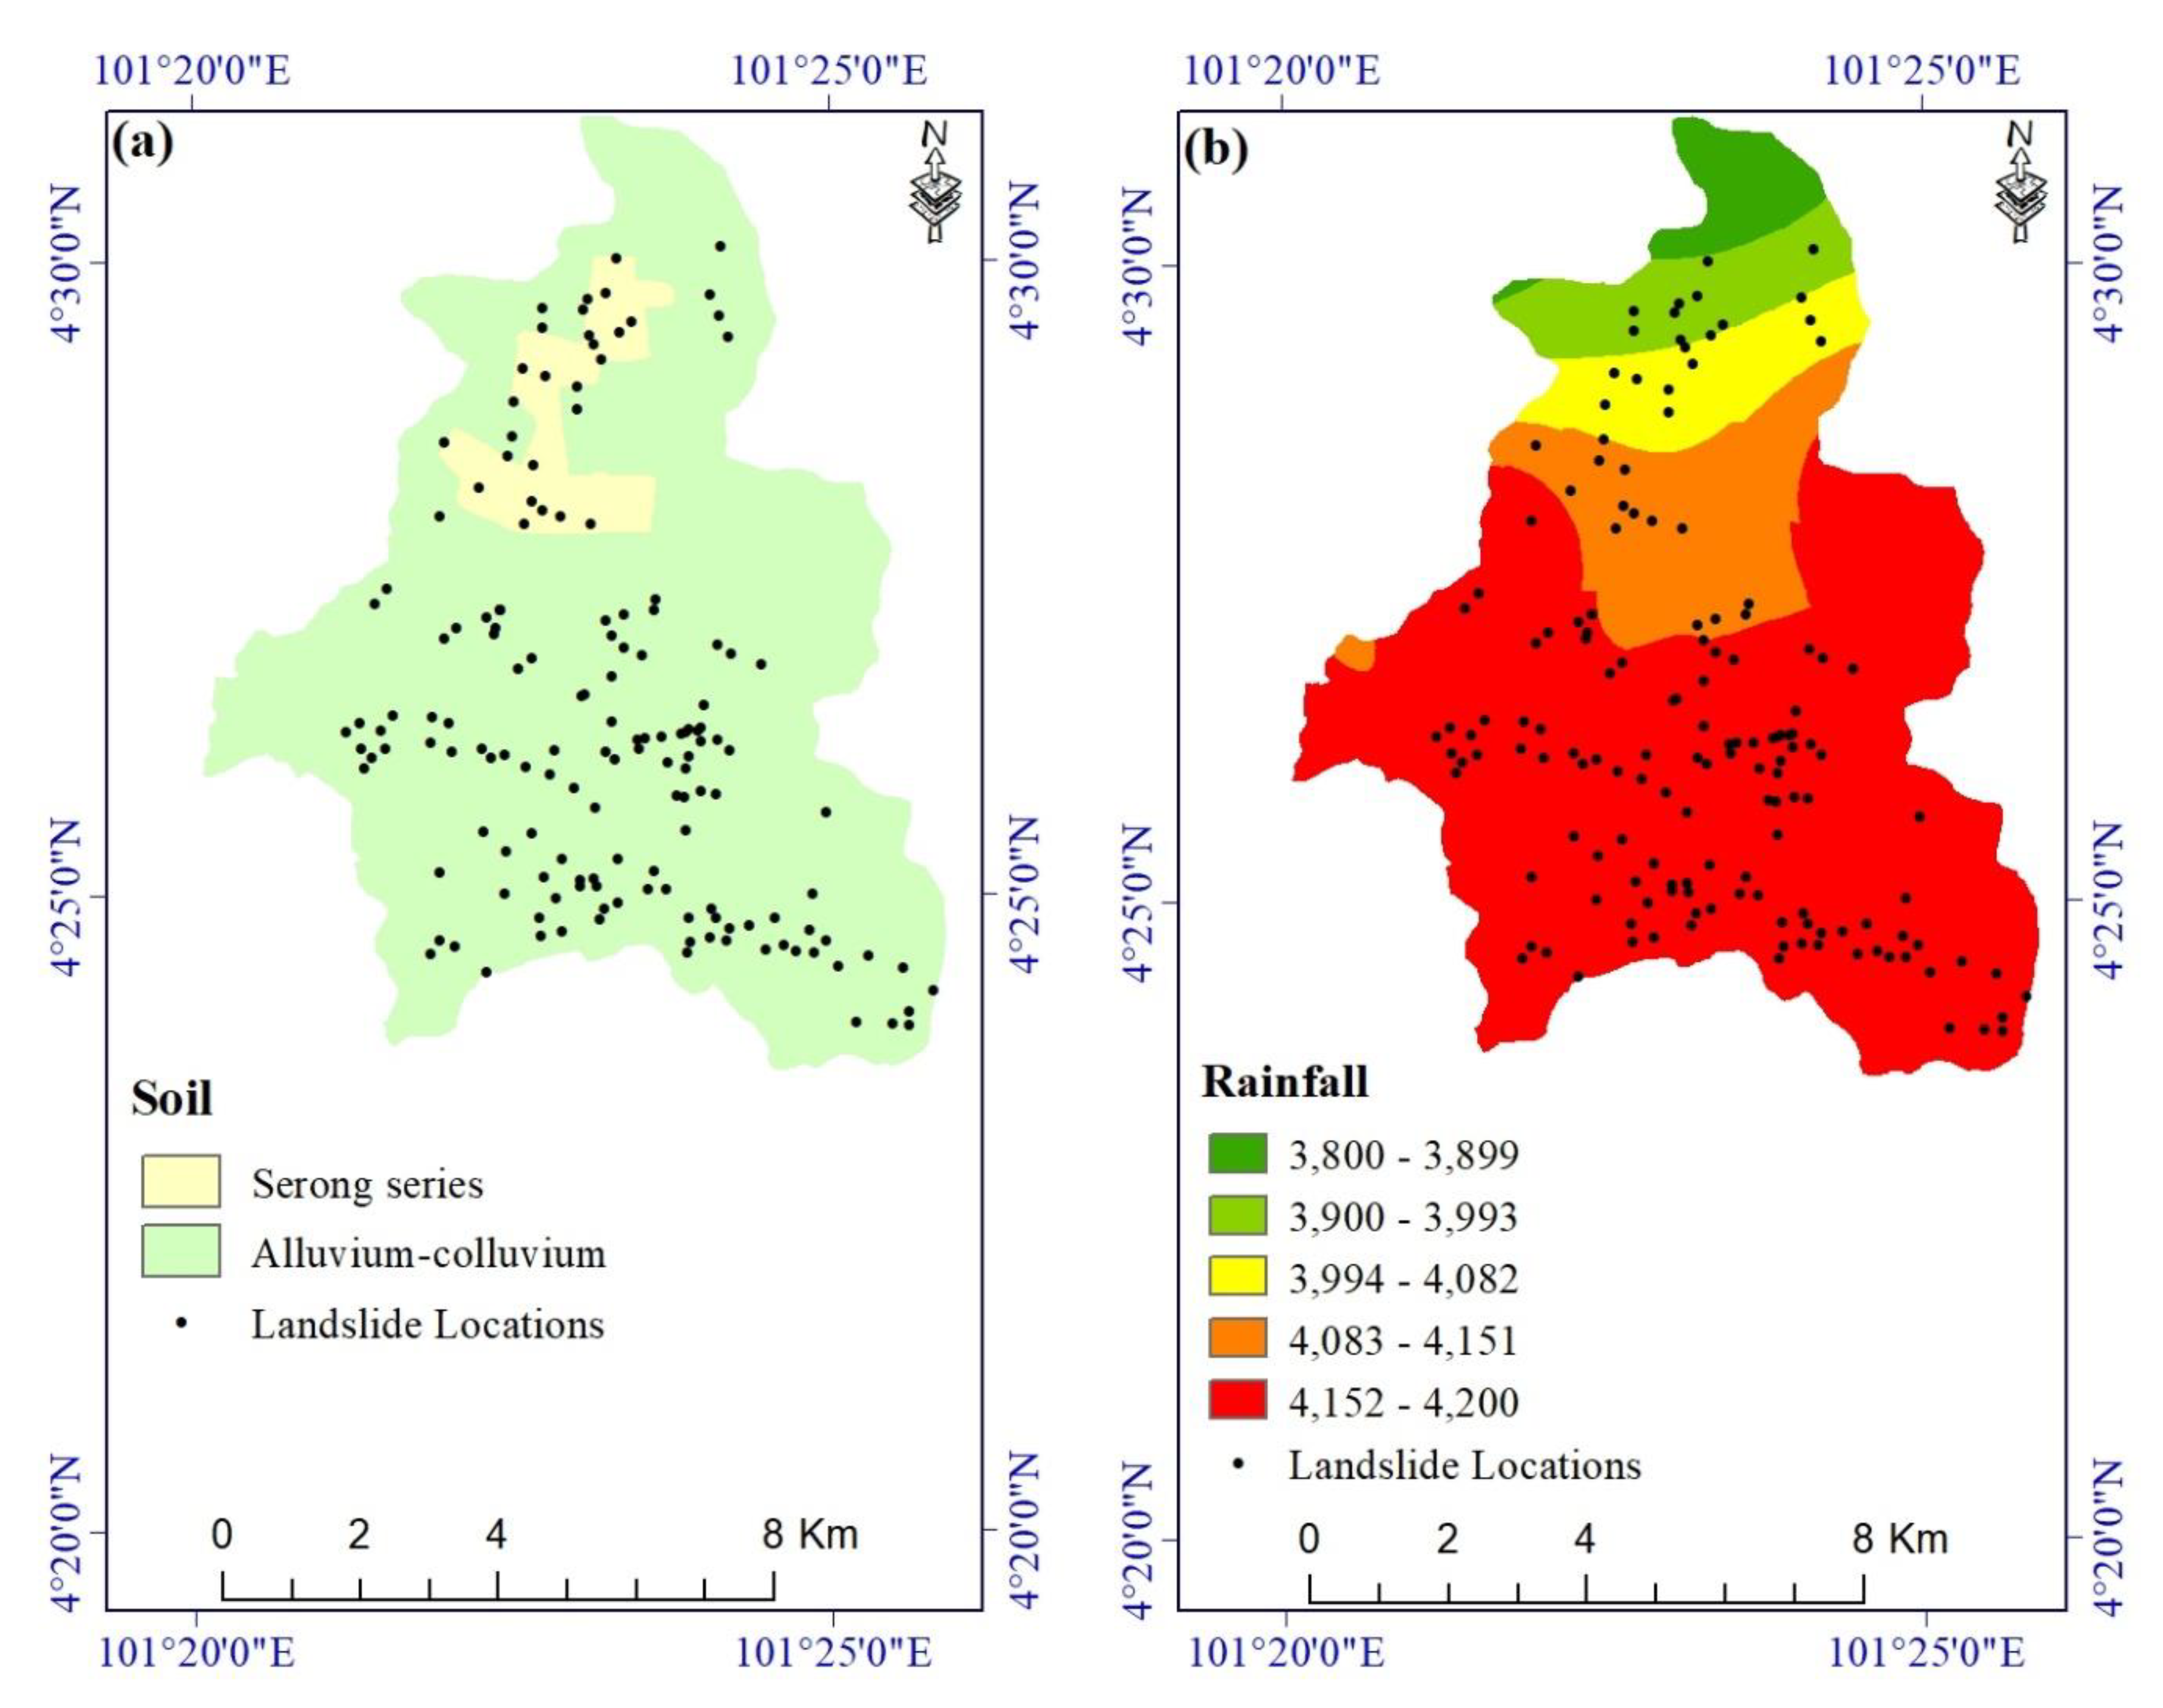
| Soil layer | Department of Agriculture, Malaysia | 1:100,000 | Natural breaks |
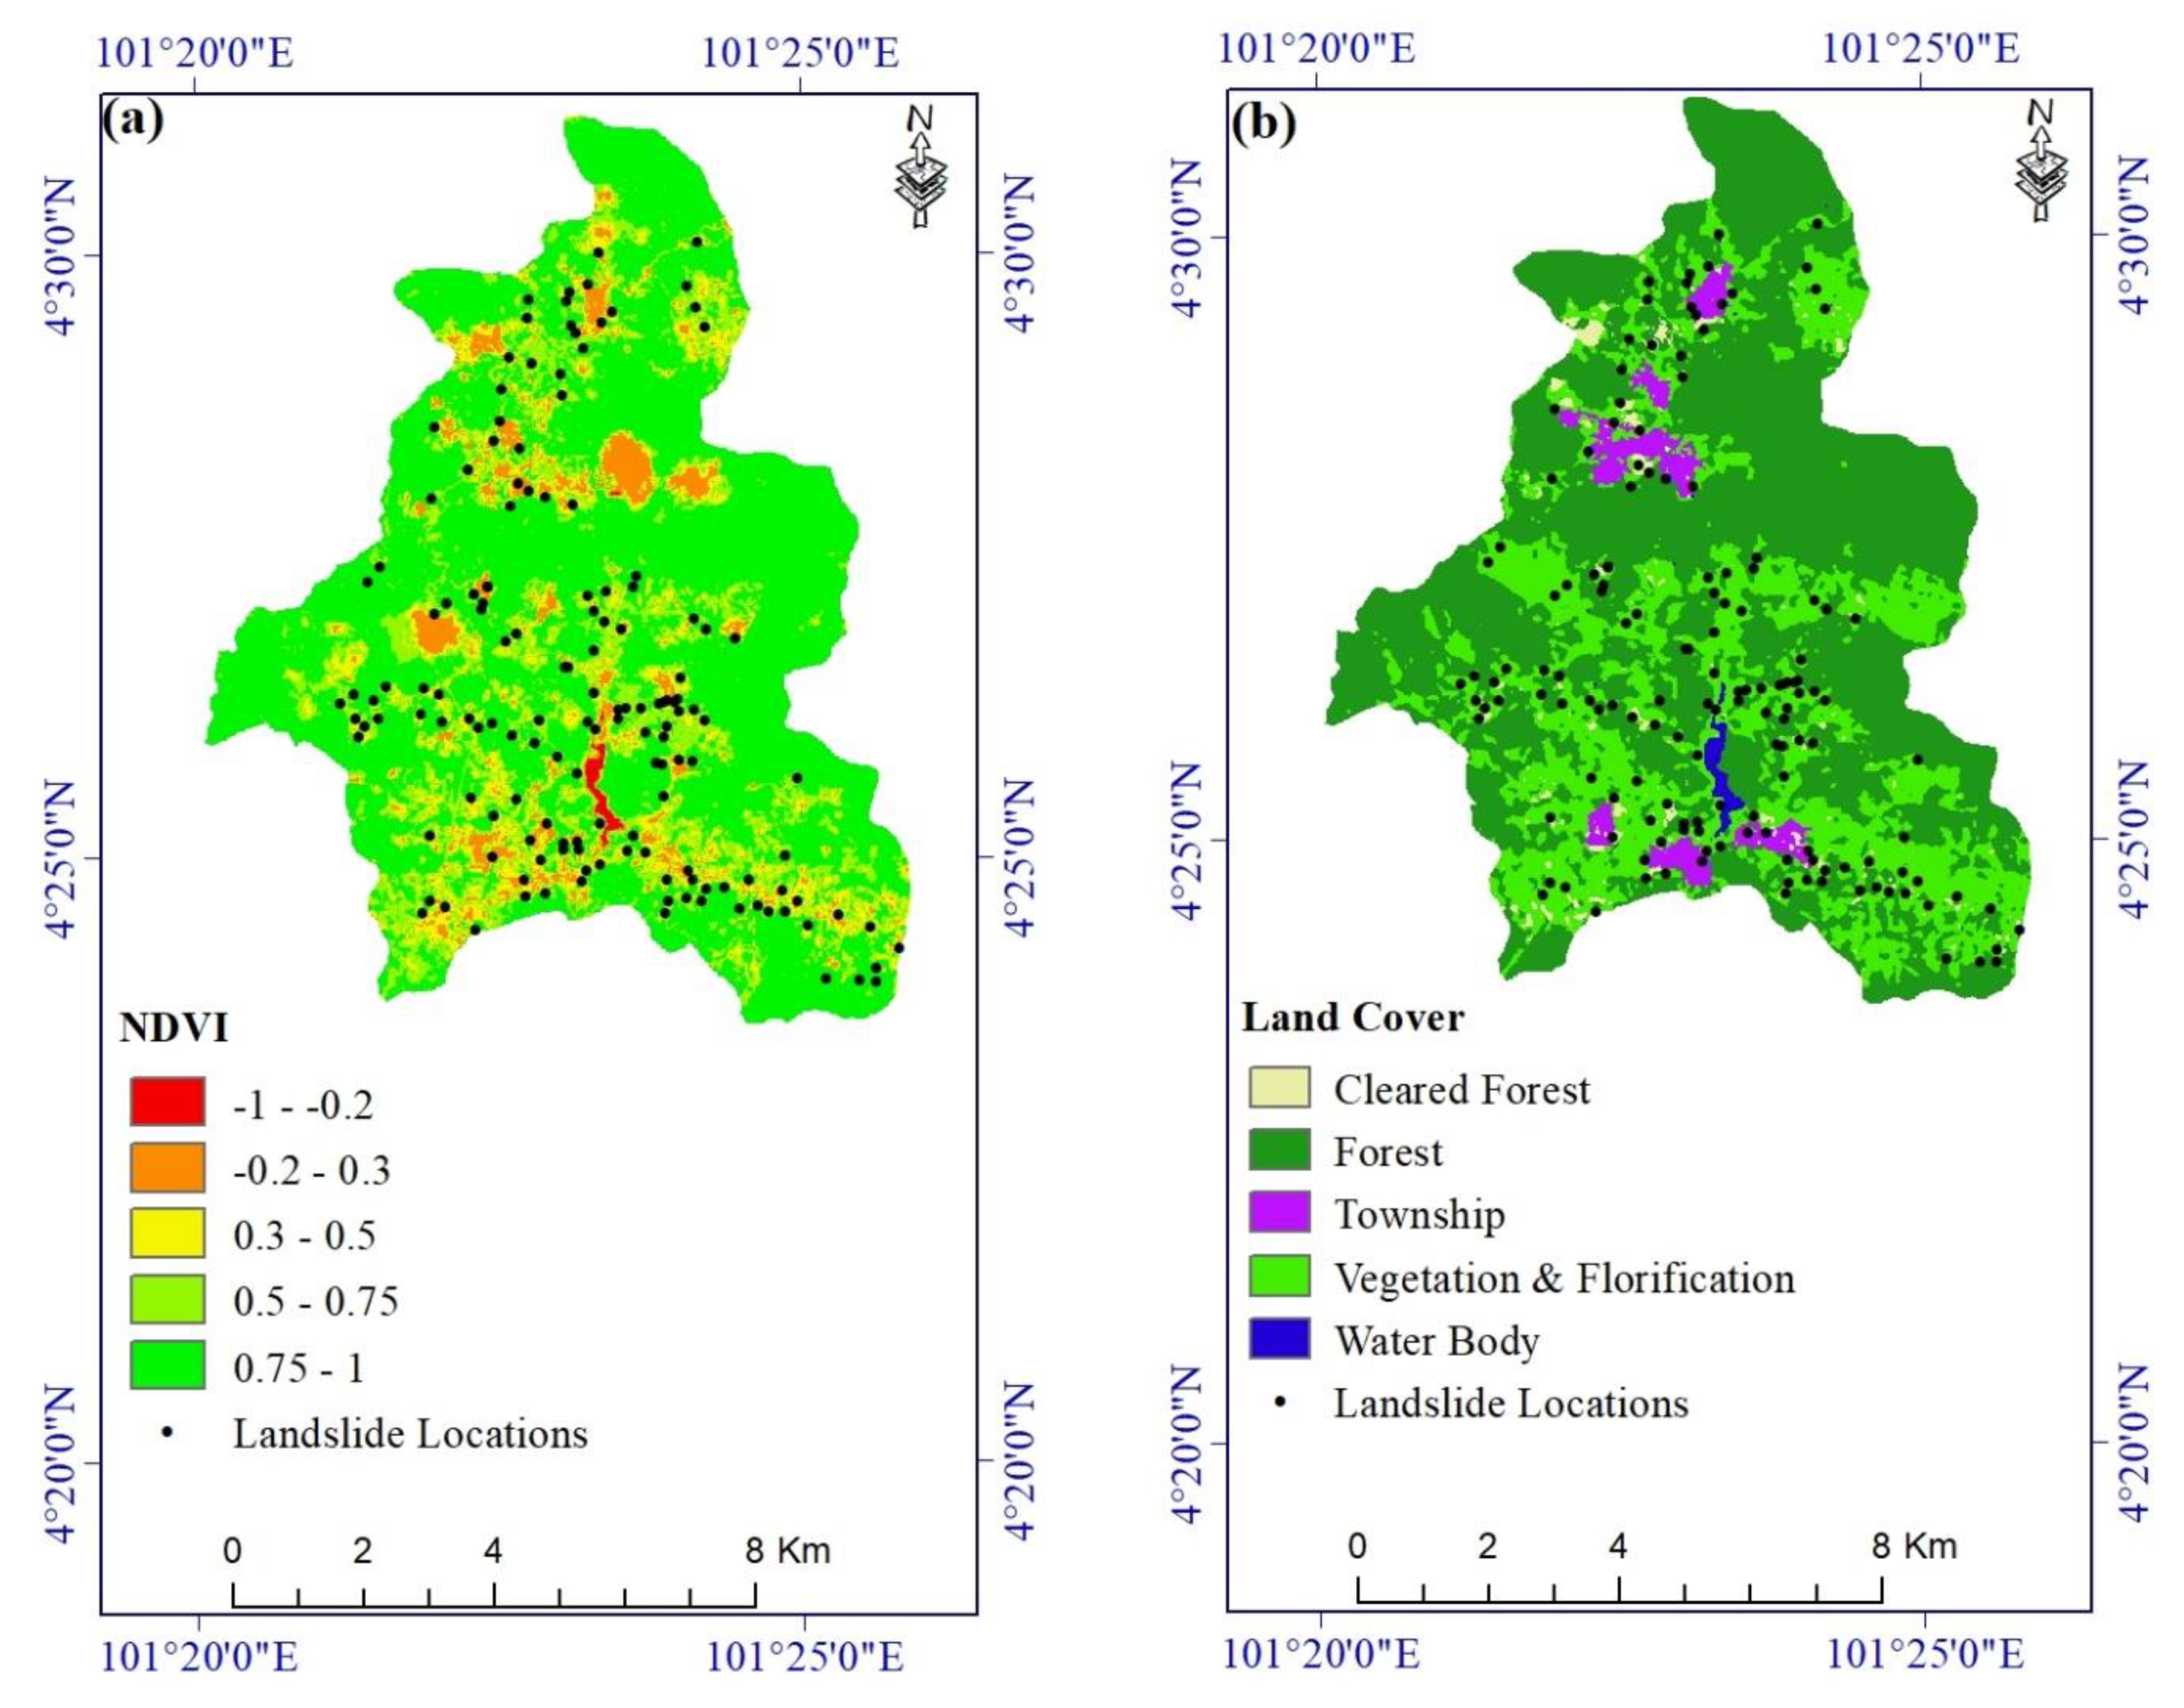
| NDVI | Sentinel-2 | 10 × 10 m | Natural breaks |
| Land cover | Sentinel-1 and Landsat-8 images | 10 × 10 m | Land cover unit |
| Rainfall (mm) | TRMM data | 10 × 10 m | Natural breaks |
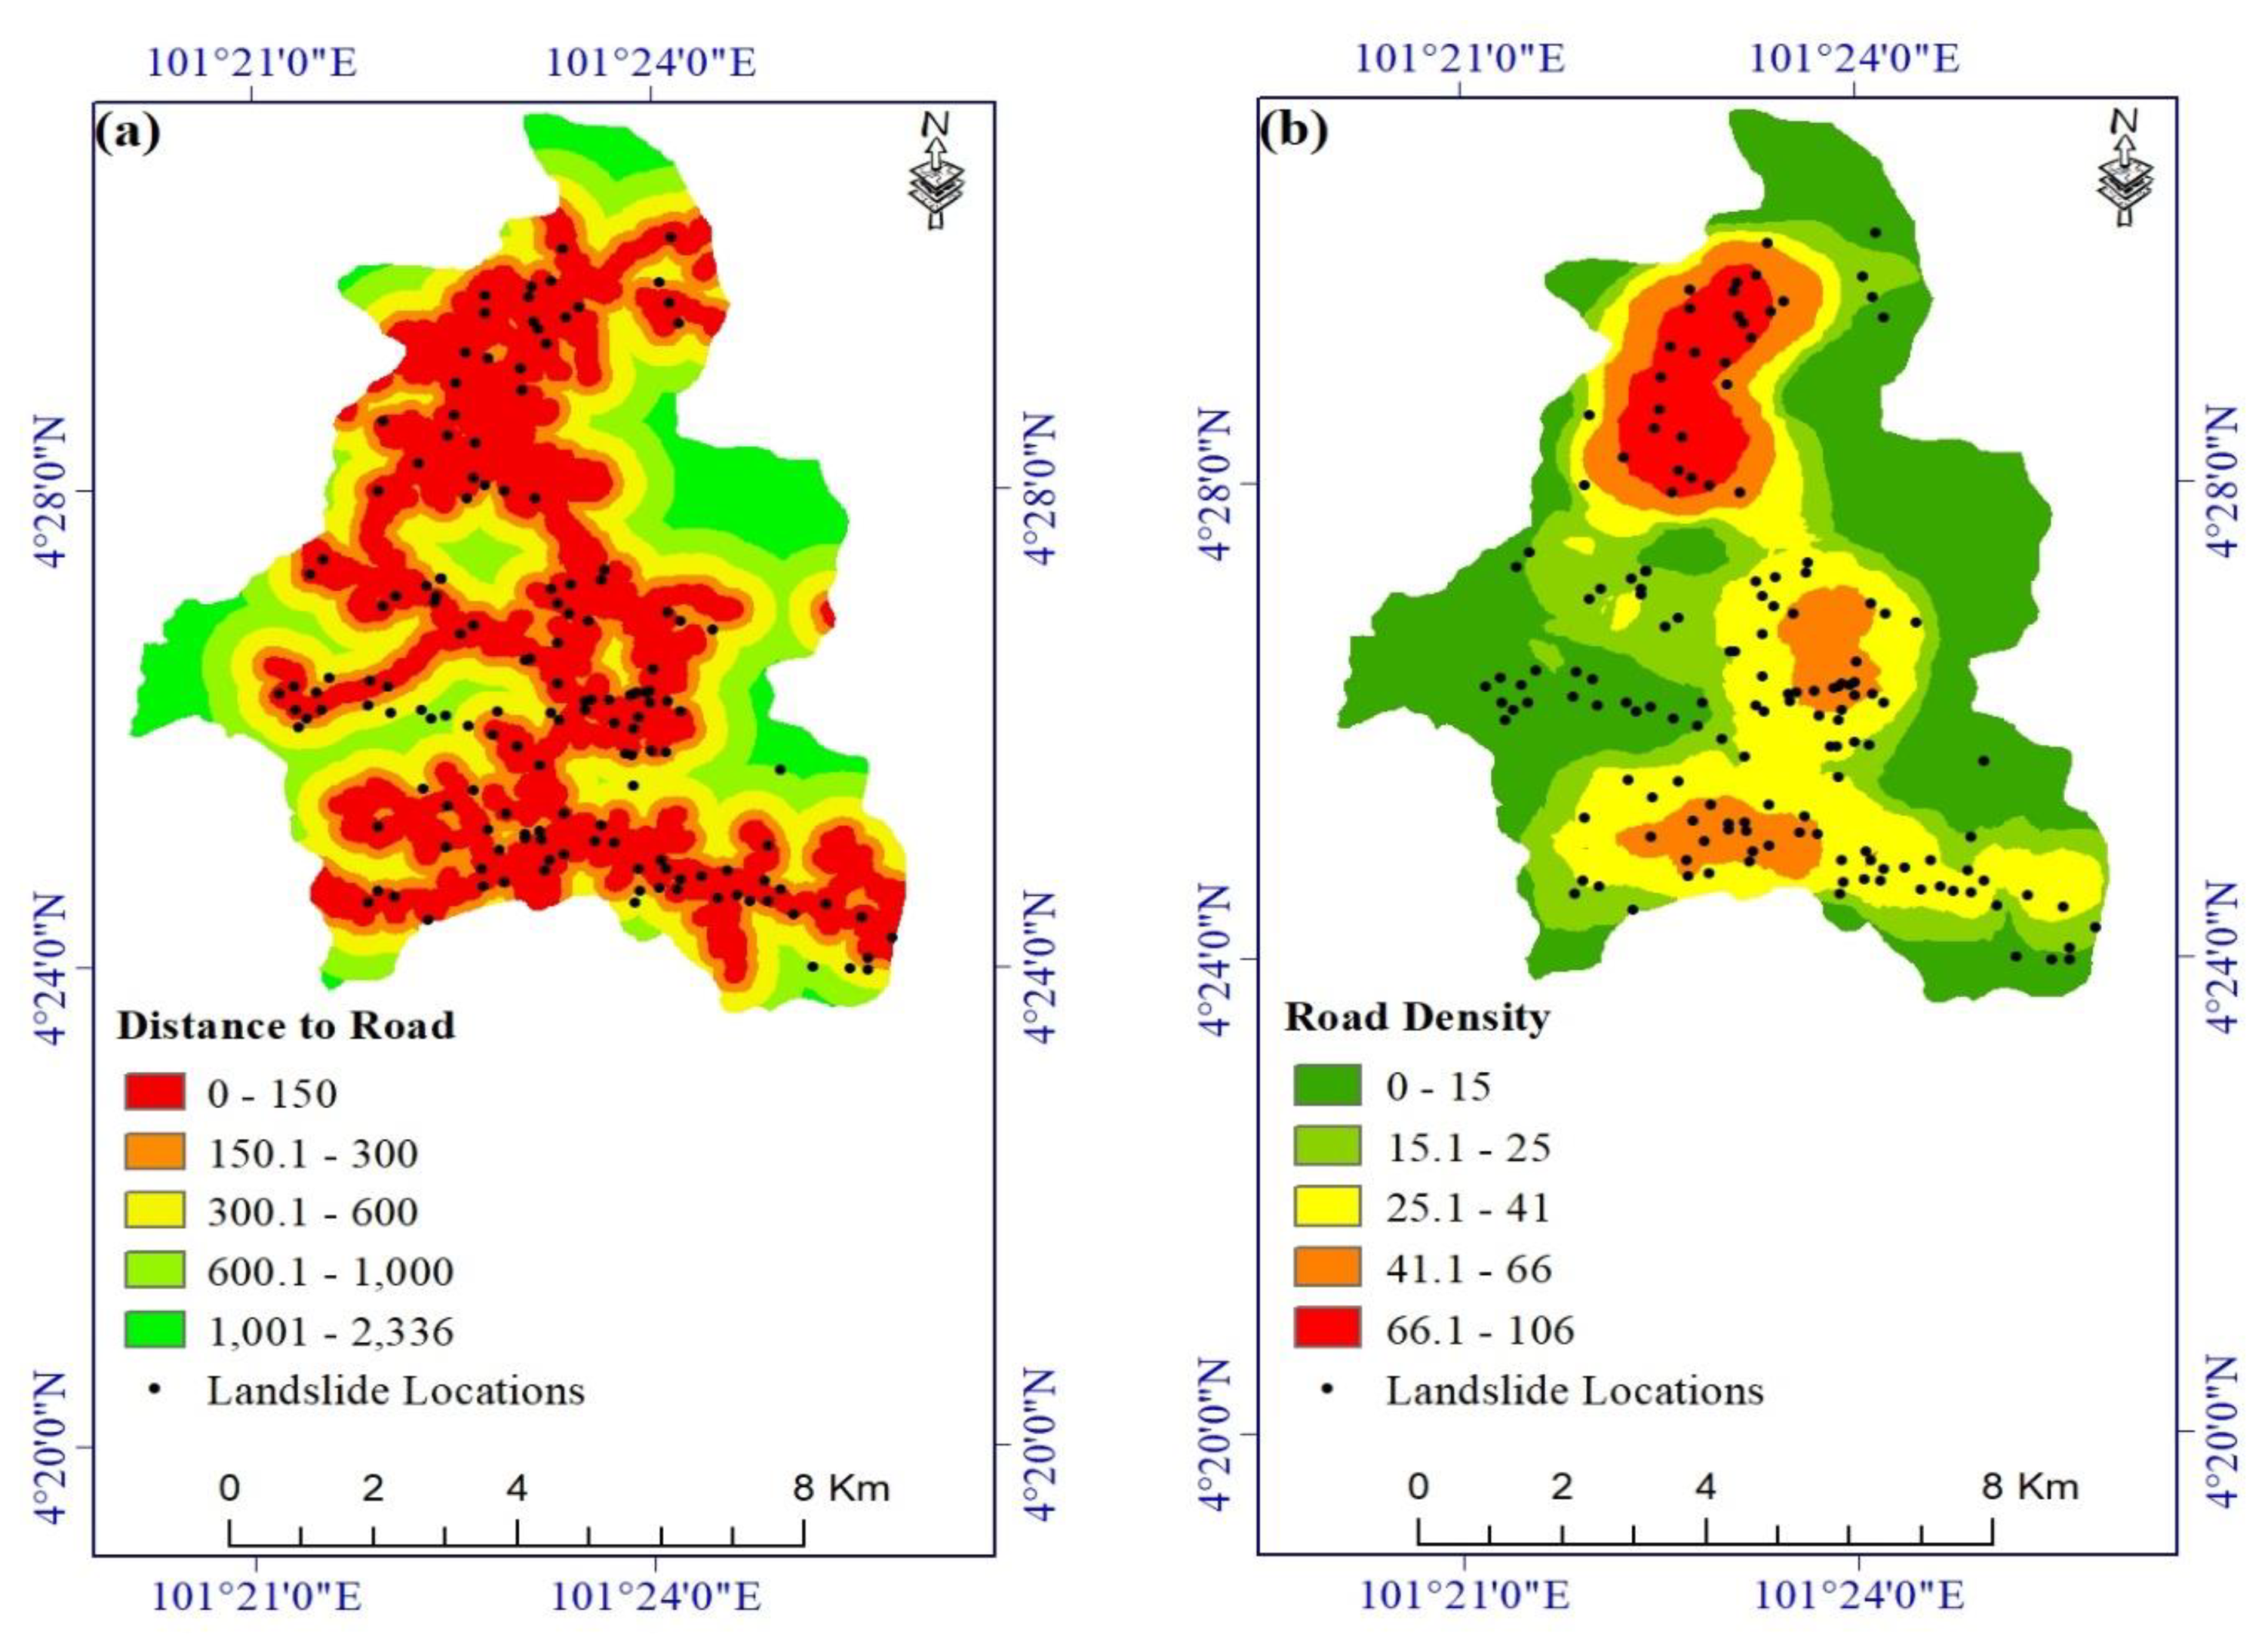
| Distance to road (m) | Open street map | Natural breaks | |
| Road density (km/km2) | Natural breaks |
| Predicted | ||||
|---|---|---|---|---|
| (landslide) | (non-landslide) | Sum | ||
| Observed | (landslide) | TP | FN | P |
| (non-landslide) | FP | TN | N | |
| Factors | ADTree | AB | AB-ADTree | |||
|---|---|---|---|---|---|---|
| T 🞶 | V 🞶 | T | V | T | V | |
| TP | 89 | 20 | 106 | 25 | 102 | 23 |
| TN | 99 | 24 | 103 | 26 | 100 | 24 |
| FP | 33 | 10 | 19 | 5 | 22 | 7 |
| FN | 23 | 6 | 16 | 4 | 20 | 6 |
| Sensitivity (%) | 79.5 | 76.9 | 86.9 | 86.2 | 83.6 | 79.3 |
| Specificity (%) | 75.0 | 70.6 | 84.4 | 83.9 | 82.0 | 77.4 |
| Accuracy (%) | 77.0 | 73.3 | 85.7 | 85.0 | 82.8 | 78.3 |
| RMSE | 0.443 | 0.366 | 0.301 | 0.212 | 0.315 | 0.289 |
| Models | Mean Ranks | Chi-Square | Significance |
|---|---|---|---|
| ADTree | 1.08 | 83.633 | 0.000 |
| AB | 2.72 | ||
| AB-ADTree | 2.20 |
| AB vs. ADTree | AB-ADTree vs. ADTree | AB-ADTree vs. AB | |
|---|---|---|---|
| z value | −6.737 | −6.472 | −2.084 |
| p value | 0.000 | 0.000 | 0.041 |
© 2020 by the authors. Licensee MDPI, Basel, Switzerland. This article is an open access article distributed under the terms and conditions of the Creative Commons Attribution (CC BY) license (http://creativecommons.org/licenses/by/4.0/).
Share and Cite
Nhu, V.-H.; Mohammadi, A.; Shahabi, H.; Ahmad, B.B.; Al-Ansari, N.; Shirzadi, A.; Clague, J.J.; Jaafari, A.; Chen, W.; Nguyen, H. Landslide Susceptibility Mapping Using Machine Learning Algorithms and Remote Sensing Data in a Tropical Environment. Int. J. Environ. Res. Public Health 2020, 17, 4933. https://doi.org/10.3390/ijerph17144933
Nhu V-H, Mohammadi A, Shahabi H, Ahmad BB, Al-Ansari N, Shirzadi A, Clague JJ, Jaafari A, Chen W, Nguyen H. Landslide Susceptibility Mapping Using Machine Learning Algorithms and Remote Sensing Data in a Tropical Environment. International Journal of Environmental Research and Public Health. 2020; 17(14):4933. https://doi.org/10.3390/ijerph17144933
Chicago/Turabian StyleNhu, Viet-Ha, Ayub Mohammadi, Himan Shahabi, Baharin Bin Ahmad, Nadhir Al-Ansari, Ataollah Shirzadi, John J. Clague, Abolfazl Jaafari, Wei Chen, and Hoang Nguyen. 2020. "Landslide Susceptibility Mapping Using Machine Learning Algorithms and Remote Sensing Data in a Tropical Environment" International Journal of Environmental Research and Public Health 17, no. 14: 4933. https://doi.org/10.3390/ijerph17144933