Machine Learning Based Analysis of Human Serum N-glycome Alterations to Follow up Lung Tumor Surgery

 ,
,  and
and 
Abstract
:Simple Summary
Abstract

1. Introduction
2. Materials and Methods
2.1. Chemicals and Reagents
2.2. Sample Preparation
2.3. Capillary Electrophoresis
2.4. Data Analysis
3. Results and Discussion
4. Conclusions
Author Contributions
Funding
Acknowledgments
Conflicts of Interest
References
- Wao, H.; Mhaskar, R.; Kumar, A.; Miladinovic, B.; Djulbegovic, B. Survival of patients with non-small cell lung cancer without treatment: A systematic review and meta-analysis. Syst. Rev. 2013, 2, 10. [Google Scholar] [CrossRef] [PubMed] [Green Version]
- Siegel, R.L.; Miller, K.D.; Jemal, A. Cancer statistics, 2019. CA Cancer J. Clin. 2019, 69, 7–34. [Google Scholar] [CrossRef] [PubMed] [Green Version]
- Bray, F.; Ferlay, J.; Soerjomataram, I.; Siegel, R.L.; Torre, L.A.; Jemal, A. Global cancer statistics 2018: GLOBOCAN estimates of incidence and mortality worldwide for 36 cancers in 185 countries. CA Cancer J. Clin. 2018, 68, 394–424. [Google Scholar] [CrossRef] [PubMed] [Green Version]
- Cryer, A.M.; Thorley, A.J. Nanotechnology in the diagnosis and treatment of lung cancer. Pharmacol. Ther. 2019, 198, 189–205. [Google Scholar] [CrossRef]
- El-Telbany, A.; Ma, P.C. Cancer Genes in Lung Cancer: Racial Disparities: Are There Any? Genes Cancer 2012, 3, 467–480. [Google Scholar] [CrossRef]
- Janković, M. Glycans as Biomarkers: Status and Perspectives. J. Med. Biochem. 2011, 30, 213–223. [Google Scholar] [CrossRef] [Green Version]
- Saldova, R.; Haakensen, V.D.; Rødland, E.; Walsh, I.; Stöckmann, H.; Engebraaten, O.; Børresen-Dale, A.-L.; Rudd, P.M. Serum N-glycome alterations in breast cancer during multimodal treatment and follow-up. Mol. Oncol. 2017, 11, 1361–1379. [Google Scholar] [CrossRef] [Green Version]
- Peixoto, A.; Relvas-Santos, M.; Azevedo, R.; Santos, L.L.; Ferreira, J.A. Protein Glycosylation and Tumor Microenvironment Alterations Driving Cancer Hallmarks. Front. Oncol. 2019, 9, 380. [Google Scholar] [CrossRef] [Green Version]
- Mészáros, B.; Járvás, G.; Farkas, A.; Szigeti, M.; Kovács, Z.; Kun, R.; Szabó, M.; Csánky, E.; Guttman, A. Comparative analysis of the human serum N-glycome in lung cancer, COPD and their comorbidity using capillary electrophoresis. J. Chromatogr. B 2020, 1137, 121913. [Google Scholar] [CrossRef]
- Royle, L.; Campbell, M.P.; Radcliffe, C.M.; White, D.M.; Harvey, D.J.; Abrahams, J.L.; Kim, Y.-G.; Henry, G.W.; Shadick, N.A.; Weinblatt, M.E.; et al. HPLC-based analysis of serum N-glycans on a 96-well plate platform with dedicated database software. Anal. Biochem. 2008, 376, 1–12. [Google Scholar] [CrossRef]
- Guttman, A. High-resolution carbohydrate profiling by capillary gel electrophoresis. Nat. Cell Biol. 1996, 380, 461–462. [Google Scholar] [CrossRef] [PubMed]
- Cummings, R.D.; Etzler, M.E. Antibodies and Lectins in Glycan Analysis; Cold Spring Harbor Laboratory Press: Woodbury, NY, USA, 2009. Available online: http://www.ncbi.nlm.nih.gov/pubmed/20301245 (accessed on 7 September 2020).
- Dang, K.; Zhang, W.; Jiang, S.; Lin, X.; Qian, A. Application of Lectin Microarrays for Biomarker Discovery. ChemistryOpen 2020, 9, 285–300. [Google Scholar] [CrossRef] [PubMed]
- Gimeno, A.; Reichardt, N.-C.; Cañada, F.J.; Perkams, L.; Unverzagt, C.; Jiménez-Barbero, J.; Ardá, A. NMR and Molecular Recognition of N-Glycans: Remote Modifications of the Saccharide Chain Modulate Binding Features. ACS Chem. Biol. 2017, 12, 1104–1112. [Google Scholar] [CrossRef] [PubMed]
- Lu, G.; Crihfield, C.L.; Gattu, S.; Veltri, L.M.; Holland, L. Capillary Electrophoresis Separations of Glycans. Chem. Rev. 2018, 118, 7867–7885. [Google Scholar] [CrossRef] [Green Version]
- Kim, L.; Tsao, M.-S. Tumour tissue sampling for lung cancer management in the era of personalised therapy: What is good enough for molecular testing? Eur. Respir. J. 2014, 44, 1011–1022. [Google Scholar] [CrossRef]
- Clerc, F.; Reiding, K.R.; Jansen, B.C.; Kammeijer, G.S.M.; Bondt, A.; Wuhrer, M. Human plasma protein N-glycosylation. Glycoconj. J. 2016, 33, 309–343. [Google Scholar] [CrossRef] [Green Version]
- Matsumoto, T.; Hatakeyama, S.; Yoneyama, T.; Tobisawa, Y.; Ishibashi, Y.; Yamamoto, H.; Yoneyama, T.; Hashimoto, Y.; Ito, H.; Nishimura, S.-I.; et al. Serum N-glycan profiling is a potential biomarker for castration-resistant prostate cancer. Sci. Rep. 2019, 9, 1–8. [Google Scholar] [CrossRef]
- Gebri, E.; Kovács, Z.; Mészáros, B.; Tóth, F.; Simon, A.; Jankovics, H.; Vonderviszt, F.; Kiss, A.; Guttman, A.; Hortobágyi, T. N-Glycosylation Alteration of Serum and Salivary Immunoglobulin A Is a Possible Biomarker in Oral Mucositis. J. Clin. Med. 2020, 9, 1747. [Google Scholar] [CrossRef]
- Donczo, B.; Guttman, A. Biomedical analysis of formalin-fixed, paraffin-embedded tissue samples: The Holy Grail for molecular diagnostics. J. Pharm. Biomed. Anal. 2018, 155, 125–134. [Google Scholar] [CrossRef] [Green Version]
- Lattová, E.; Skřičková, J.; Hausnerová, J.; Frola, L.; Křen, L.; Ihnatová, I.; Zdráhal, Z.; Bryant, J.; Popovič, M. N-Glycan profiling of lung adenocarcinoma in patients at different stages of disease. Mod. Pathol. 2020, 33, 1146–1156. [Google Scholar] [CrossRef]
- Ruhaak, L.R.; Taylor, S.L.; Stroble, C.; Nguyen, U.T.; Parker, E.A.; Song, T.; Lebrilla, C.B.; Rom, W.N.; Pass, H.; Kim, K.; et al. Differential N-Glycosylation Patterns in Lung Adenocarcinoma Tissue. J. Proteome Res. 2015, 14, 4538–4549. [Google Scholar] [CrossRef] [PubMed]
- Liang, Y.; Han, P.; Wang, T.; Ren, H.; Gao, L.; Shi, P.; Zhang, S.; Yang, A.; Li, Z.; Chen, M. Stage-associated differences in the serum N- and O-glycan profiles of patients with non-small cell lung cancer. Clin. Proteom. 2019, 16, 20. [Google Scholar] [CrossRef] [PubMed]
- Aralık, Y.; Metastazı, E.; Farklı, O.; Tipteki, H. Serum Total Sialic Acid Levels in Lung Cancer Patients of Different Histological Types with and No Extrapulmonary Metastases. Turk. J. Biochem. 2004, 29, 262–267. [Google Scholar]
- Ruhaak, L.R.; Stroble, C.; Dai, J.; Barnett, M.; Taguchi, A.; Goodman, G.E.; Miyamoto, S.; Gandara, D.; Feng, Z.; Lebrilla, C.B.; et al. Serum Glycans as Risk Markers for Non–Small Cell Lung Cancer. Cancer Prev. Res. 2016, 9, 317–323. [Google Scholar] [CrossRef] [PubMed] [Green Version]
- Nicora, G.; Vitali, F.; Dagliati, A.; Geifman, N.; Bellazzi, R. Integrated Multi-Omics Analyses in Oncology: A Review of Machine Learning Methods and Tools. Front. Oncol. 2020, 10, 1030. [Google Scholar] [CrossRef] [PubMed]
- Shen, R.; Olshen, A.B.; Ladanyi, M. Integrative clustering of multiple genomic data types using a joint latent variable model with application to breast and lung cancer subtype analysis. Bioinformatics 2009, 25, 2906–2912. [Google Scholar] [CrossRef]
- List, M.; Hauschild, A.-C.; Tan, Q.; A Kruse, T.; Mollenhauer, J.; Baumbach, J.; Batra, R. Classification of breast cancer subtypes by combining gene expression and DNA methylation data. J. Integr. Bioinform. 2014, 11, 1–14. [Google Scholar] [CrossRef]
- Gligorijević, V.; Malod-Dognin, N.; Pržulj, N. Patient-specific data fusion for cancer stratification and personalised treatment. Pac. Symp. Biocomput. 2016, 21, 321–332. [Google Scholar] [CrossRef] [Green Version]
- Leclercq, M.; Vittrant, B.; Martin-Magniette, M.L.; Boyer, M.P.S.; Perin, O.; Bergeron, A.; Fradet, Y.; Droit, A. Large-Scale Automatic Feature Selection for Biomarker Discovery in High-Dimensional OMICs Data. Front. Genet. 2019, 10, 452. [Google Scholar] [CrossRef]
- Walsh, I.; O’Flaherty, R.M.; Rudd, P.M. Bioinformatics applications to aid high-throughput glycan profiling. Perspect. Sci. 2017, 11, 31–39. [Google Scholar] [CrossRef]
- Shipman, J.T.; Nguyen, H.T.; Desaire, H. So You Discovered a Potential Glycan-Based Biomarker; Now What? We Developed a High-Throughput Method for Quantitative Clinical Glycan Biomarker Validation. ACS Omega 2020, 5, 6270–6276. [Google Scholar] [CrossRef] [PubMed] [Green Version]
- Hua, D.; Patabandige, M.W.; Go, E.P.; Desaire, H. The Aristotle Classifier: Using the Whole Glycomic Profile to Indicate a Disease State. Anal. Chem. 2019, 91, 11070–11077. [Google Scholar] [CrossRef]
- Malhotra, J.; Malvezzi, M.; Negri, E.; La Vecchia, C.; Boffetta, P. Risk factors for lung cancer worldwide. Eur. Respir. J. 2016, 48, 889–902. [Google Scholar] [CrossRef] [PubMed] [Green Version]
- Harvey, D.J.; Merry, A.H.; Royle, L.; Campbell, M.P.; Rudd, P.M. Symbol nomenclature for representing glycan structures: Extension to cover different carbohydrate types. Proteomics 2011, 11, 4291–4295. [Google Scholar] [CrossRef] [PubMed]


| Patient # | Age | Sex | Ethnicity | Histology | Stadium |
|---|---|---|---|---|---|
| 1 | 78 | male | Caucasian | squamous cell carcinoma | I/b |
| 2 | 70 | male | Caucasian | small-cell neuroendocrine carcinoma | I/a |
| 3 | 61 | female | Caucasian | adenocarcinoma | II/b |
| 4 | 79 | female | Caucasian | adenocarcinoma | I/b |
| 5 | 52 | male | Caucasian | adenocarcinoma | III/b |
| 6 | 63 | male | Caucasian | squamous cell carcinoma | II/b |
| 7 | 68 | female | Caucasian | adenocarcinoma | I/a |
| 8 | 53 | male | Caucasian | adenocarcinoma | I/a |
| 9 | 58 | female | Caucasian | adenocarcinoma | I/a |
| 10 | 75 | male | Caucasian | adenocarcinoma | III/a |
| 11 | 66 | female | Caucasian | adenocarcinoma | I/a |
| 12 | 61 | male | Caucasian | anaplasticus-cell carcinoma | II/b |
| 13 | 63 | female | Caucasian | adenocarcinoma | I/a |
| 14 | 70 | male | Caucasian | adenocarcinoma | I/a |
| 15 | 68 | male | Caucasian | squamous cell carcinoma | II/a |
| 16 | 75 | male | Caucasian | adenocarcinoma | I/a |
| 17 | 77 | male | Caucasian | adenocarcinoma | I/a |
| Age average: 66.8, Age median: 68, Age range: 52–79 | |||||
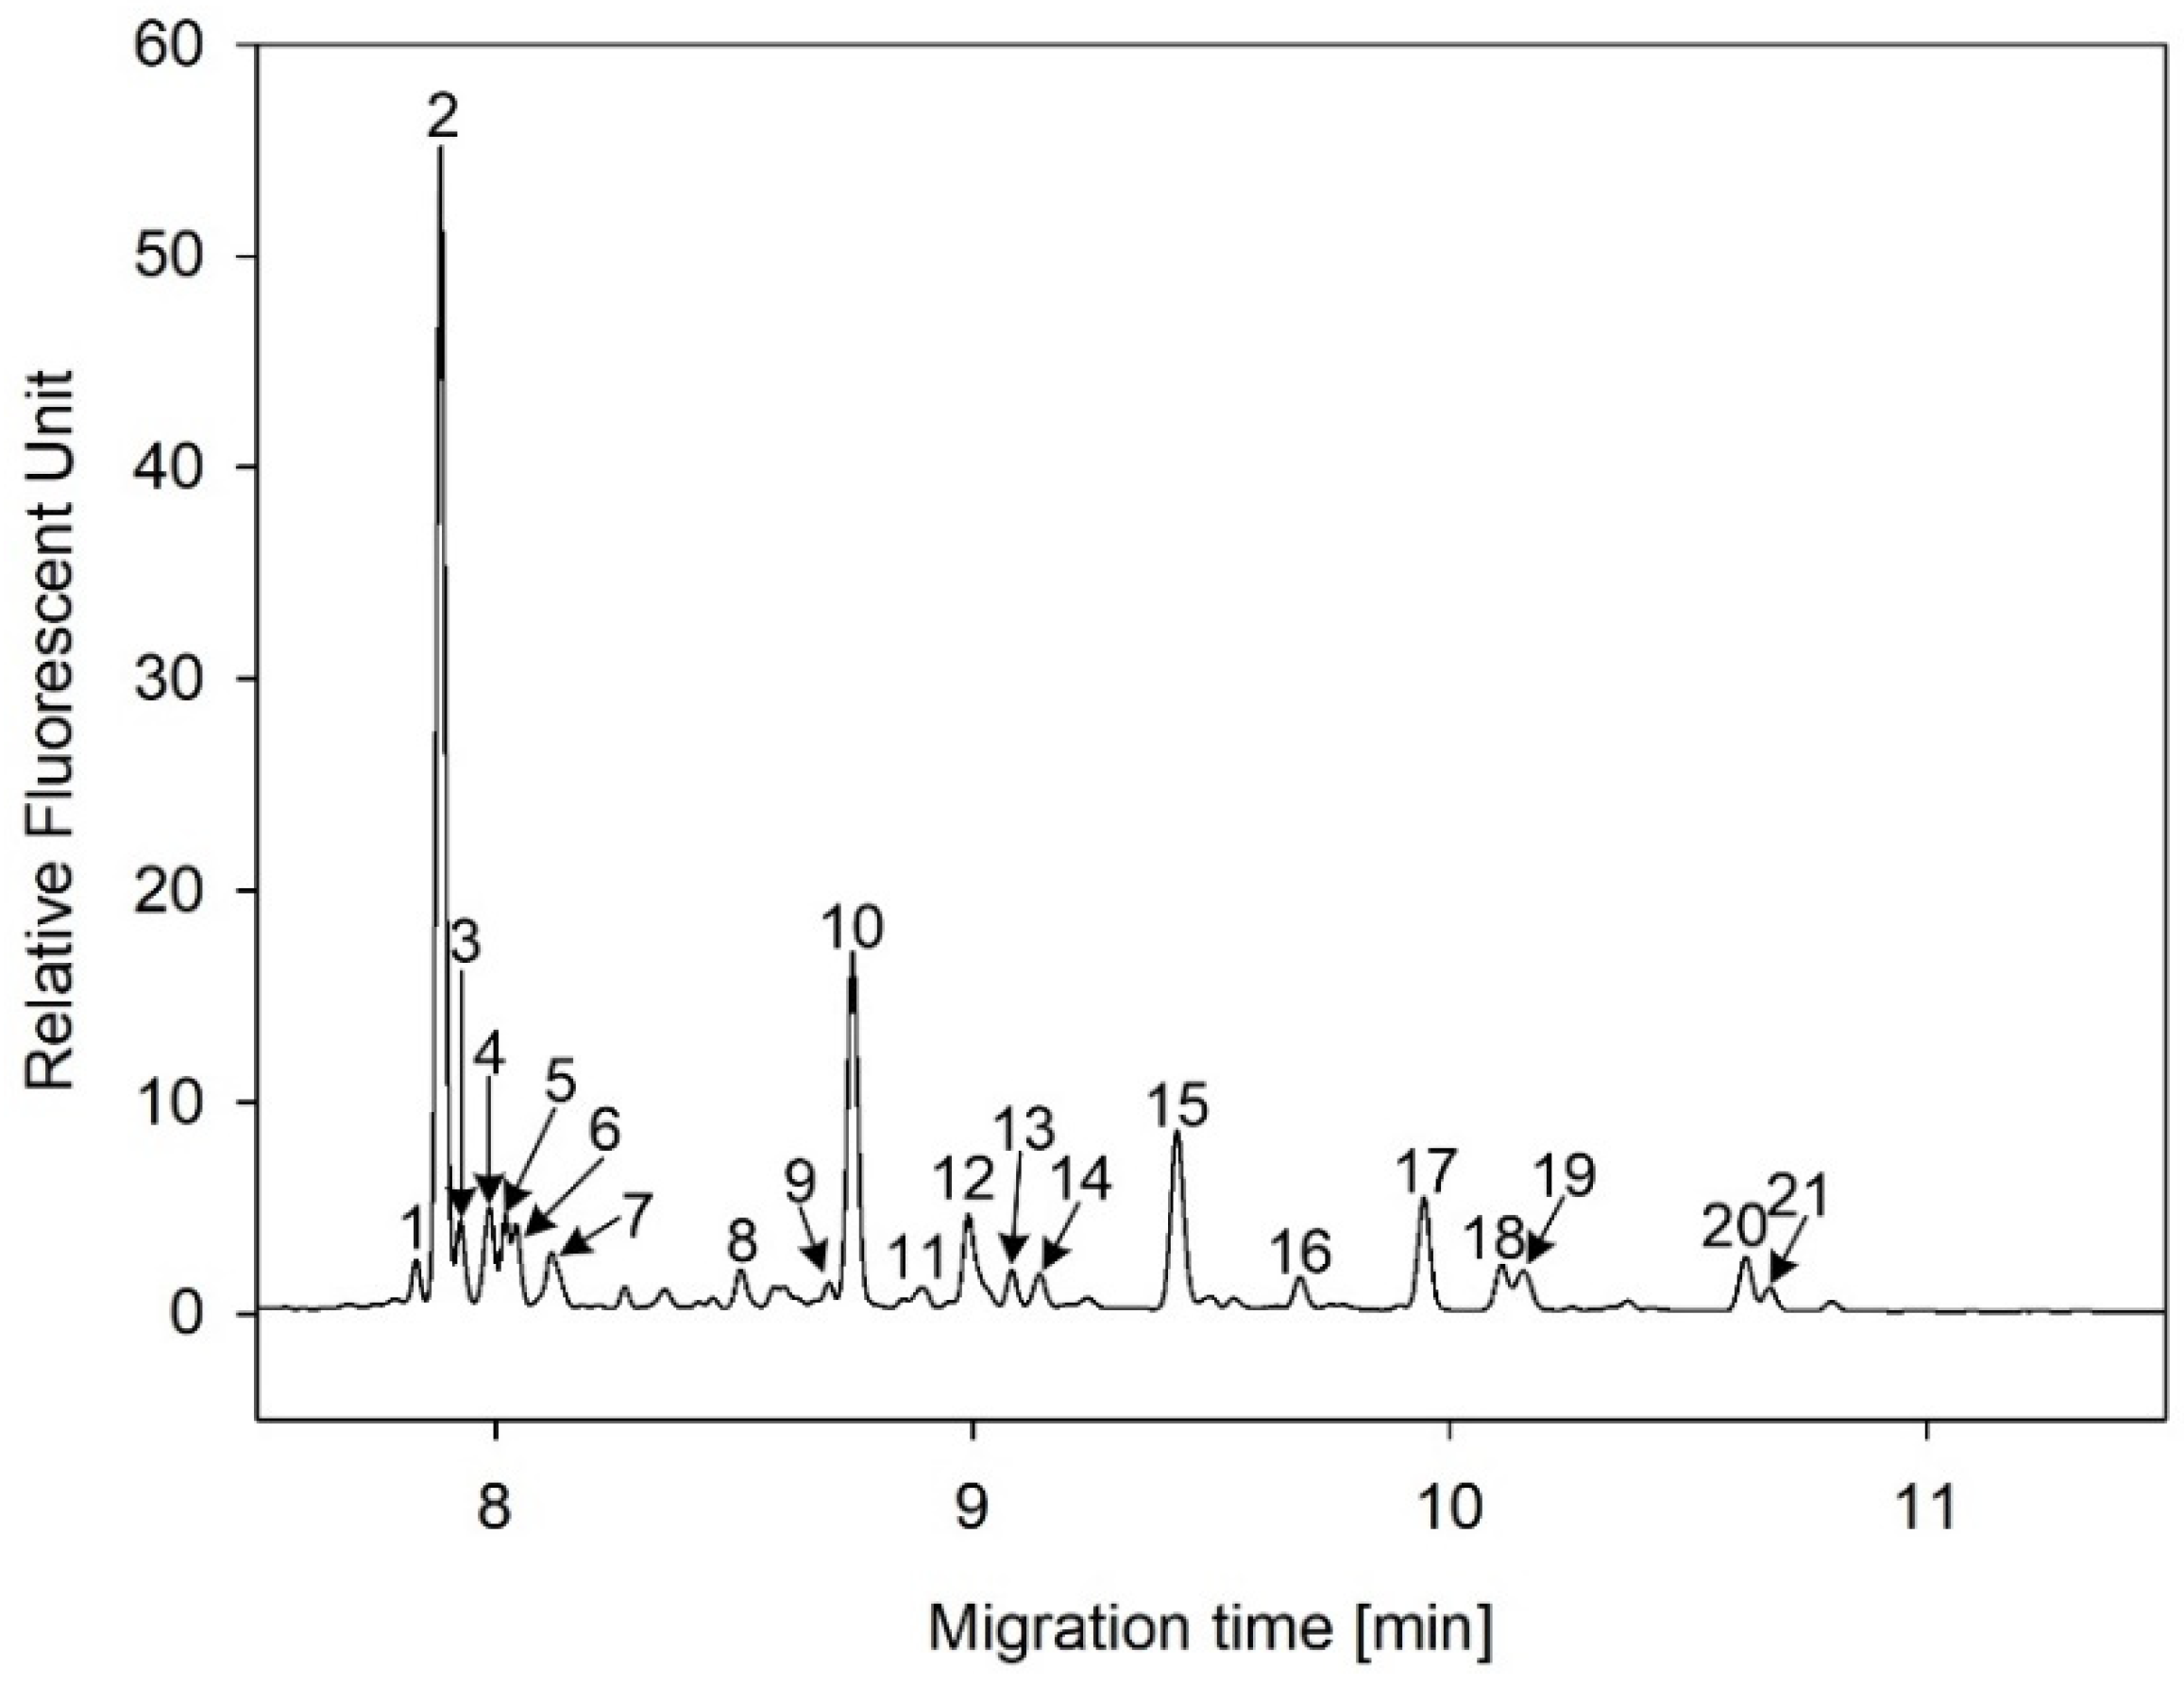
| Peak Notation | Structures | Glycan Structures |
|---|---|---|
| 1 | FA4BG4S(3)4 |  |
| 2 | A2G2S(6)2 | 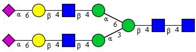 |
| 3 | FA3G3S(6)3 | 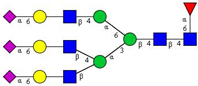 |
| 4 | A2G2S(3)2 |  |
| 5 | A2BG2S2 |  |
| 6 | FA2G2S2 |  |
| 7 | FA2BG2S2, FA3G3S(3)3 |  |
| 8 | FA2[6]G1S1 |  |
| 9 | A3G3S(3)2 |  |
| 10 | A2G2S(6)1 |  |
| 11 | A2BG2S1 | 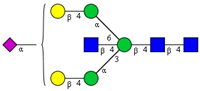 |
| 12 | FA2G2S1 | 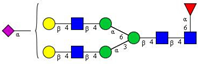 |
| 13 | FA2BG2S1,M5 |  |
| 14 | A4G4S(6)2 | 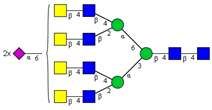 |
| 15 | FA2, M6 | 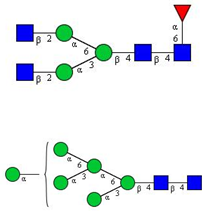 |
| 16 | FA2B |  |
| 17 | FA2[6]G1, M7 |  |
| 18 | FA2[3]G1 |  |
| 19 | FA2B [6]G1, M8 |  |
| 20 | FA2G2 |  |
| 21 | M9 |  |
| Clinical Parameters | Results | Accuracy |
|---|---|---|
| Positive outcome of the surgery | ΔA2G2S(6)2 ≥ −38.1 and ΔFA2G2S2 < 13.58 | 0.69 |
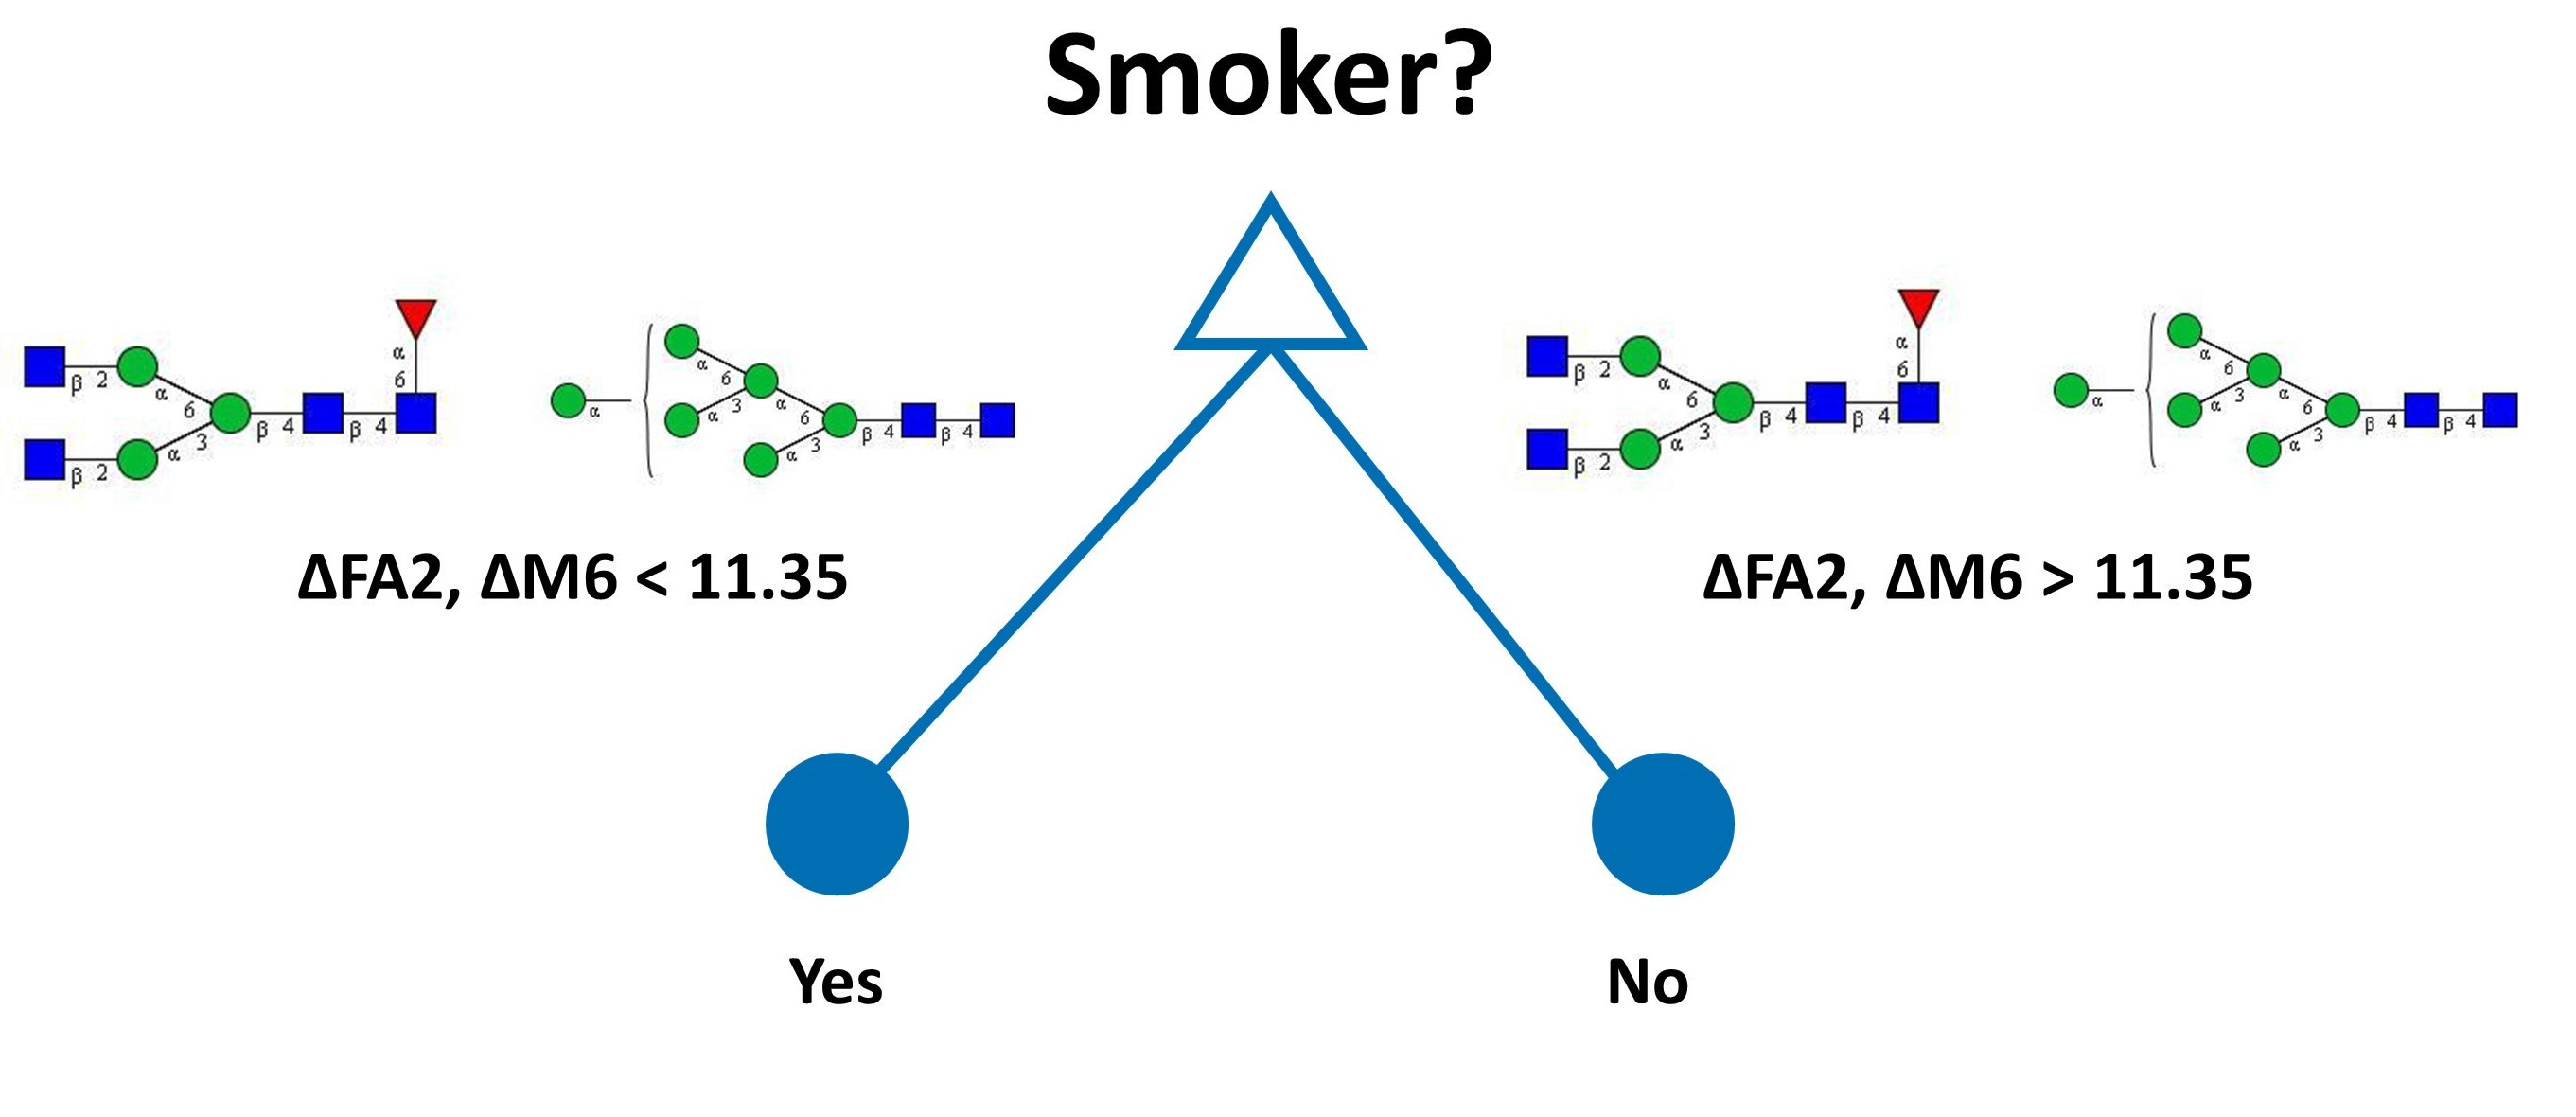
| Smoker | ΔFA2, M6 < 11.35 | 0.75 |
| Have atherosclerosis | ΔA2BG2S2 ≥ −19.10 and ΔA2G2S(6)2 < 6.06 | 0.63 |
| Have other disease | ΔM9 ≥ 35 | 0.75 |
| Positive outcome of the surgery and smoker | ΔA2G2S(6)2 ≥ 9.34 or ΔA2G2S(6)2 < 9.34 and ΔFA3G3S(6)3 ≥ 3.96 | 0.63 |
| Positive outcome of the surgery and non-smoker | ΔFA2, M6 ≥ 16.14 | 0.88 |
| Negative outcome of the surgery and smoker | ΔFA2BG2S1 ≥ 19.26 | 0.81 |
| Negative outcome of the surgery and non-smoker | ΔA2G2S(3)2 < −28.26 or ΔA2G2S(3)2 ≥ −28.26 and ΔFA2[3]G1 < −18.79 | 0.69 |
| Negative outcome of the surgery and have COPD | ΔFA3G3S(6)3 < −34.01 or ΔFA3G3S(6)3 ≥ −34.01 and ΔFA2BG2S1 ≥ 19.26 | 0.69 |
| Positive outcome of the surgery and have atherosclerosis | ΔA2BG2S1 ≥ 18.37 | 0.75 |
| Positive outcome of the surgery and not have atherosclerosis | ΔA2BG2S2 < −19.10 or ΔA2BG2S2 ≥ −19.10 and ΔA2G2S(6)2 ≥ 9.34 | 0.63 |
| Negative outcome of the surgery and not have atherosclerosis | ΔFA2BG2S2, FA3G3S(3)3 ≥ 35.24 | 0.88 |
| Have COPD and atherosclerosis | ΔFA4BG4[3,3,3,3]S4 ≥ 18.51 or ΔFA4BG4[3,3,3,3]S4 < 18.51 and ΔFA2G2 < −28.15 | 0.63 |
| Have COPD and not have atherosclerosis | ΔFA2G2S1 ≥ 10.97 | 0.81 |
| Positive outcome of the surgery and have COPD | ΔFA2G2S2 ≥ 31.67 | 0.69 |
| Non-smoker and not have atherosclerosis | ΔM9 ≥ 17.80 | 0.81 |
| Clinical Parameters | Results | Accuracy |
|---|---|---|
| Positive outcome of the surgery | Δ total afucosylated ≥ −21% | 0.69 |
| Have diabetes | Δ total terminal galactosylated ≥ 81.53% | 0.81 |
| Have other disease | Δ total terminal galactosylated ≥ 81.53% or Δ total terminal galactosylated < 81.53% and Δ total sialylated ≥ 9.065% | 0.69 |
| Positive outcome of the surgery and smoker | Δ neutral < −9.26% | 0.63 |
| Positive outcome of the surgery and non-smoker | Δ total sialylated < −1.05% | 0.81 |
| Negative outcome of the surgery and non-smoker | Δ total afucosylated < −21% | 0.7 |
| Negative outcome of the surgery and no COPD | Δ total afucosylated < −21% | 0.69 |
| Negative outcome of the surgery and atherosclerosis | Δ total afucosylated < −21% | 0.75 |
| Have COPD and atherosclerosis | Δ total sialylated ≥ 7.4% or Δ total sialylated < 7.4% and −5.56% ≤ Δ total afucosylated < −2.21% | 0.63 |
| Not have COPD but diabetes | Δ total afucosylated < −21% | 0.75 |
| Not have COPD and diabetes | Δ total afucosylated ≥ 4.57% or Δ total afucosylated < 1.4% | 0.63 |
| Negative outcome of the surgery and have diabetes | Δ total afucosylated < −21% | 0.75 |
| Not have diabetes but atherosclerosis | Δ total sialylated ≥ 7.41% | 0.75 |
| Not have atherosclerosis but diabetes | Δ total afucosylated < −21% | 0.81 |
| Smoker and have diabetes | Δ total afucosylated < −21% | 0.81 |
| Non-smoker and not have diabetes | Δ total afucosylated ≥ −21 | 0.63 |
| Smoker and not have COPD | Δ total afucosylated < −21 | 0.69 |
| Non-smoker and have atherosclerosis | Δ total sialylated ≥ 7.4% or Δ total sialylated < 7.4% and −5.56% ≤ Δ total afucosylated <−2.21% | 0.63 |
| Smoker and not have atherosclerosis | Δ total afucosylated < −21% | 0.69 |
| Formalization of the Relationship | R2 | # |
|---|---|---|
| 0.99 | Equation (1) | |
| 0.95 | Equation (2) | |
| 0.81 | Equation (3) | |
| 0.77 | Equation (4) | |
| 0.99 | Equation (5) | |
| 0.96 | Equation (6) |
Publisher’s Note: MDPI stays neutral with regard to jurisdictional claims in published maps and institutional affiliations. |
© 2020 by the authors. Licensee MDPI, Basel, Switzerland. This article is an open access article distributed under the terms and conditions of the Creative Commons Attribution (CC BY) license (http://creativecommons.org/licenses/by/4.0/).
Share and Cite
Mészáros, B.; Járvás, G.; Kun, R.; Szabó, M.; Csánky, E.; Abonyi, J.; Guttman, A. Machine Learning Based Analysis of Human Serum N-glycome Alterations to Follow up Lung Tumor Surgery. Cancers 2020, 12, 3700. https://doi.org/10.3390/cancers12123700
Mészáros B, Járvás G, Kun R, Szabó M, Csánky E, Abonyi J, Guttman A. Machine Learning Based Analysis of Human Serum N-glycome Alterations to Follow up Lung Tumor Surgery. Cancers. 2020; 12(12):3700. https://doi.org/10.3390/cancers12123700
Chicago/Turabian StyleMészáros, Brigitta, Gábor Járvás, Renáta Kun, Miklós Szabó, Eszter Csánky, János Abonyi, and András Guttman. 2020. "Machine Learning Based Analysis of Human Serum N-glycome Alterations to Follow up Lung Tumor Surgery" Cancers 12, no. 12: 3700. https://doi.org/10.3390/cancers12123700