Article

Unraveling Molecular Pathways Altered in MeCP2-Related Syndromes, in the Search for New Potential Avenues for Therapy

by
Alba-Aina Castells
1,2,3,
Rafel Balada
1,3,
Alba Tristán-Noguero
2,
Mar O’Callaghan
2,
Elisenda Cortès-Saladelafont
2,
Ainhoa Pascual-Alonso
2,
Àngels Garcia-Cazorla
2,
Judith Armstrong
2 and
Soledad Alcántara
1,3,*
1
Neural Development Lab, Departament de Patologia i Terapèutica Experimental, Institut de Neurociències, Universitat de Barcelona, l’Hospitalet de Llobregat, 08907 Barcelona, Spain
2
Departments of Neurology, Biochemistry and Genetics, Institut Pediàtric de Recerca, CIBERER and ISCIII, Hospital San Joan de Déu, Esplugues de Llobregat, 08950 Barcelona, Spain
3
IDIBELL, l’Hospitalet de Llobregat, 08908 Barcelona, Spain
*
Author to whom correspondence should be addressed.
Biomedicines 2021, 9(2), 148; https://doi.org/10.3390/biomedicines9020148
Submission received: 22 December 2020 / Revised: 25 January 2021 / Accepted: 30 January 2021 / Published: 3 February 2021
(This article belongs to the Section Neurobiology and Clinical Neuroscience)

Abstract

:
Methyl-CpG-binding protein 2 (MeCP2) is an X-linked epigenetic modulator whose dosage is critical for neural development and function. Loss-of-function mutations in MECP2 cause Rett Syndrome (RTT, OMIM #312750) while duplications in the Xq28 locus containing MECP2 and Interleukin-1 receptor-associated kinase 1 (IRAK1) cause MECP2 duplication syndrome (MDS, OMIM #300260). Both are rare neurodevelopmental disorders that share clinical symptoms, including intellectual disability, loss of speech, hand stereotypies, vasomotor deficits and seizures. The main objective of this exploratory study is to identify novel signaling pathways and potential quantitative biomarkers that could aid early diagnosis and/or the monitoring of disease progression in clinical trials. We analyzed by RT-PCR gene expression in whole blood and microRNA (miRNA) expression in plasma, in a cohort of 20 females with Rett syndrome, 2 males with MECP2 duplication syndrome and 28 healthy controls, and correlated RNA expression with disease and clinical parameters. We have identified a set of potential biomarker panels for RTT diagnostic and disease stratification of patients with microcephaly and vasomotor deficits. Our study sets the basis for larger studies leading to the identification of specific miRNA signatures for early RTT detection, stratification, disease progression and segregation from other neurodevelopmental disorders. Nevertheless, these data will require verification and validation in further studies with larger sample size including a whole range of ages.

1. Introduction

Methyl-CpG-binding protein 2 (MeCP2) is a calcium-dependent DNA-binding protein involved in chromatin organization [1,2], transcriptional regulation [3,4] and control of protein translation via microRNA (miRNA)-mediated mechanisms [5]. MECP2 gene is X-linked and its dosage is critical for neural development and function, as both defect and excess of MeCP2 function have severe neurological consequences. Rett syndrome (RTT, OMIM #312750) is mainly caused by loss-of-function mutations in MECP2, and MECP2 duplication syndrome (MDS, OMIM #300260) is associated with duplications in the Xq28 locus, with a minimal region of duplication containing MECP2 and the adjacent gene Interleukin-1 receptor-associated kinase 1 (IRAK1) [6]. Both are rare neurodevelopmental disorders and altered MeCP2 function has been involved in other forms of autism and intellectual disability [7].
RTT affects predominantly females, due to the early lethality in hemizygous males and to the almost exclusive de novo mutations in the paternal germline [8]. Because of X-chromosome inactivation (XCI), most RTT patients are somatic mosaics in MeCP2 deficiency, causing a broad spectrum of severity [9]. On the contrary, MDS mostly affects males, and due to skewed XCI, most carrier females remain asymptomatic or develop a wide range of behavioral and psychiatric symptoms [10]. Both MECP2-related disorders are dynamic, progress over several stages and share some clinical characteristics and symptoms, including severe intellectual disability, loss of speech, hand stereotypies, vasomotor deficits and seizures [11].
RTT courses with apparently normal development during the first 6–18 months of life, with subsequent arrest and a rapid regression of acquired skills; however, subtle motor and behavioral defects, hypotonia and feeding problems often appear during early infancy [12,13,14,15,16]. Epilepsy is a remarkable symptom and might appear at any moment during lifetime, as well as neurobehavioral and autonomic breathing abnormalities [17,18,19]. During adolescence, most RTT girls develop scoliosis, early onset osteoporosis and lose mobility, reaching a severely debilitated physical condition in adult age [20]. MDS courses with infantile hypotonia and recurrent infections, and patients frequently develop epilepsy, spasticity and scoliosis [21,22]. Diagnosis is based on clinical symptoms and due to the mild and non-specific nature of the initial signs, definitive diagnosis is often delayed for years [23,24]. Genetic variations in modifier genes are getting increased attention as they may hold relevance to explain RTT and MDS disorders. In this sense, 69 new genes have been recently identified as causative of RTT-related disorders [7].
As an epigenetic regulator, MeCP2 functions include control of energy and cholesterol metabolism, neural development, synaptic excitatory/inhibitory balance, calcium homeostasis, inflammatory response and immunity [7,25,26,27,28]. Recent preclinical data also pointed to glycogen synthase kinase 3b (GSK3B) and nuclear factor kappa b subunit 1 (NFKB1) signaling, metabolism and inflammation as new promising targets in RTT [29,30]. Clinical trials have mainly focused on RTT patients [31], as the first MDS patients were reported in 2005. To date, only a few trials revealed significant improvements, and one of the reported drawbacks was that clinical severity scores were not optimal outcome measures [32]. Thus, the identification of unbiased quantitative biomarkers that correlate with clinical and/or quality of life data could add great value to the current measures, not only for the follow-up of disease progression in clinical trials but also for aiding early disease diagnosis.
Levels of RNA, including mRNA and miRNA in blood cells and biological fluids are considered as potential biomarkers. Circulating miRNAs in biological fluids can be ideal biomarker candidates, as they reflect the pathogenic state of the system and are highly stable [33,34]. For example, miRNA dysfunction has been involved in neuropsychiatric disorders like schizophrenia and autism spectrum disorders [35,36].
In the search for novel signaling pathways involved in MECP2-related syndromes and potential quantitative biomarkers, we selected an exploratory cohort of 20 RTT females with a known mutation in MECP2, 2 males with MDS and 28 healthy controls.
Based on preliminary studies in our labs, we identified a set of candidate genes and related miRNAs that can modulate their protein translation and/or signaling pathways. The selection criteria were genes and miRNAs that interact or are regulated by Brain-Derived Neurotrophic Factor (BDNF) and/or MeCP2 (MECP2 E1/E2, IRAK1, DNMT1, PTEN, LIN28A, miR-16-5p, miR-132-3p, miR-212-3p, miR-137-3p, miR-483-5p) or are dysregulated in RTT mice models or human studies (CACNA2D2, THBS1, THBS3, miR-138-5p, miR-146a-5p, miR-125b-5p, Let-7a-5p, Let-7a-3p, miR-24-3p). We measured in whole blood gene mRNA levels and in plasma, the levels of BDNF protein and circulating miRNAs [25,30,36,37,38,39,40,41,42]. The specificity and sensitivity of selected candidate biomarkers were determined, and expression data correlated with clinical parameters.

2. Materials and Methods

2.1. Patients and Controls

Patients were recruited for the study at Sant Joan de Déu Hospital in Barcelona. The study comprised 20 female patients diagnosed with typical RTT with a known mutation in MECP2, two male patients diagnosed with MDS and one asymptomatic MECP2 duplication carrier female, all of them aged between 1 and 33 years. Clinical characteristics of the patients are summarized in Table 1. The control group was composed of 28 healthy females, ranging from 6 to 45 years with no history of learning difficulties or psychiatric and behavioral problems, who underwent blood analysis in the context of minor surgical interventions. Blood samples were collected after overnight fasting in anticoagulation (EDTA) tube.
Clinical severity in RTT was assessed using a severity profile score described by Monrós et al. [23] that includes age at onset of the first sign, microcephaly, sitting alone, ambulation, language, respiratory function, epilepsy, hand use and the onset of stereotypies. Higher scores indicate greater severity. Additional clinical symptoms were kyphoscoliosis, growth failure, peripheral vasomotor deficits and bowel control.
Research Ethics Committee of Sant Joan de Déu Hospital approved the study and informed consent was subscribed by patients and controls (when >18 years old) or by their parents (when <18 years old) prior to the collection of data and samples. All methods were performed in accordance with the relevant guidelines and regulations.

2.2. mRNA Expression Assays in Whole Blood

RNA from 500 µL of whole blood was extracted using miRCURY™ RNA Isolation Kit—Cell & Plant (300110, Exiqon, Vedbaek, Denmark) following supplier instructions. RNA concentration and purity were analyzed using IMPLEN NanoPhotometer® P-Class (Implen, Munich, Germany). RNA samples (0.5–1 µg) were reverse transcribed to cDNA (High Capacity cDNA Reverse Transcription Kit, 4368814, Applied Biosystems, Foster City, CA) and Real-Time PCR was performed using TaqMan PCR Assays (4331182, Applied Biosystems) with TaqMan Universal PCR Master Mix (4324018, Applied Biosystems) in the 7900HT Real-Time PCR System (Applied Biosystems). GUSB and GAPDH were used as endogenous controls. Table S1 summarizes the mRNA assays analyzed. Data analysis was performed with Expression Suite Software (Life Technologies) and data expressed as Relative Quantification (RQ) normalized with respect to GUSB.

2.3. miRNA Expression Assays in Plasma

Whole blood was centrifuged at 2000 rpm for 10 min and the plasma obtained was frozen at −80 °C until use. Free hemoglobin concentration was analyzed by spectrophotometric analysis with IMPLEN NanoPhotometer® P-Class (Implen) before miRNA extraction. Absorbance was measured at 414 and 375 nm and the ratio between the absorbance peaks, suggestive of the presence of free hemoglobin, was used for the quantitative determination of hemolysis [43]. Samples with a ratio greater than 2 were considered hemolyzed and were discarded from further analysis. miRNA from 200 µL of plasma was extracted using miRCURY™ RNA Isolation Kits–Biofluids (300112, Exiqon) following supplier instructions. Undiluted miRNA was specifically retrotranscribed to cDNA with TaqMan® MicroRNA Reverse Transcription Kit (4366596, Applied Biosystems) and miRNA primers (4427975, Applied Biosystems). Real-Time PCR was performed as previously explained. Table S1 summarizes the miRNA assays analyzed. There is no universally accepted normalization for miRNAs in plasma. Thus, to avoid this problem we used a ratio-based normalization previously described in Deng et al. [44]. Briefly, the differences in the CTs of two miRNAs are the log (base 2) ratio value of these miRNAs.
Δ CT = log 2   ( miRNA 1 / miRNA 2 )   =   log 2 ( 2 CT   miRNA 1 / 2 CT   miRNA 2 )
Δ CT =   log 2 ( 2 CT   miRNA 2 CT   miRNA 1 )
Δ CT =   CT   miRNA 2 CT   miRNA 1  
The calculation of the difference between the two groups was with the following equations:
Ratio x   vs   y = mean   Δ CT x   ( miRNA 1 / miRNA 2 )     mean   Δ CT y   ( miRNA 1 / miRNA 2 )
Fold   change = 2 Ratio
Based on the equation of miRNA ratios, a fold change >1 implies an upregulation of miRNA ratio in group x with respect to group y. Conversely, a fold change <1 implies a downregulation of the miRNA ratio in group x with respect to group y.

2.4. Methodologic Considerations

Sample exclusion criteria were threshold cycles (Cts) higher than 35, replicates with a standard deviation greater than 0.25 and Cts of endogenous controls not consistent. mRNA data were calibrated to three control samples that were considered technically perfect.

2.5. Brain-Derived Neurotrophic Factor (BDNF) Protein Detection

BDNF was measured in duplicates in plasma samples using RayBio® Human BDNF ELISA Kit following supplier instructions.

2.6. Fibroblasts Primary Cultures

We are indebted to the “Biobanc de l’Hospital Infantil Sant Joan de Déu per a la Investigació” integrated in the Spanish Biobank Network of ISCIII for the sample and the data procurement.
Cellular miRNAs from fibroblasts cultures were extracted using miRNeasy Mini Kit (217004, Qiagen, Düsseldorf, Germany) following supplier instructions. Retrotranscription and Real-Time PCR were performed as previously explained, and data expressed as relative quantification were normalized with respect to the small-nucleolar RNA RNU48.

2.7. Statistical Analysis

Data were analyzed with SPSS program (IBM SPSS Statistics 24.0). We used non-parametric Mann–Whitney U test to establish differences between conditions and Kruskal–Wallis test to correlate with clinical variables, as most of the samples did not follow the normal distribution (Shapiro–Wilk normality test) and the sample size was insufficient to presume normality within the data. To find a correlation between numeric variables we used a bivariate correlation test. When performing multiple comparisons, significant values were adjusted by Bonferroni correction. Statistical significance was set at p-values * p < 0.05, ** p < 0.01 and *** p < 0.001.
The accuracy of candidate biomarkers to discriminate between patients and controls or between symptoms was evaluated by plotting receiver operating characteristic (ROC) curves and measuring the area under a ROC curve (AUC) and by using the Youden index (J = Sensitivity + Specificity—1). AUC values of 0.9–1 are considered excellent, 0.8–0.9 good, 0.7–0.8 fair and <0.7 worthless. J = 0 indicates the same proportion of positive results for groups with and without the disease. J = 1 indicates that there are no false positives or false negatives. Combination of biomarkers was evaluated by logistic regression.

3. Results

3.1. Patients

Only RTT patients diagnosed as typical RTT with known mutations in the MECP2 gene entered the study, ranging from 5 to 33 years old at the time of blood extraction. Out of the 20 patients, 10 had missense mutations and 10 had deletions and nonsense mutations resulting in a truncated protein. Two young male MDS patients, to serve as reference of increased MeCP2 function, and one asymptomatic female carrier of MECP2 duplication were also included in the study. XCI was determined for RTT patients. Clinical severity scores are included in Table 1. In our cohort, there was no correlation between severity score and XCI (ρ = −0.408, p = 0.132), data consistent with previous publications [45].

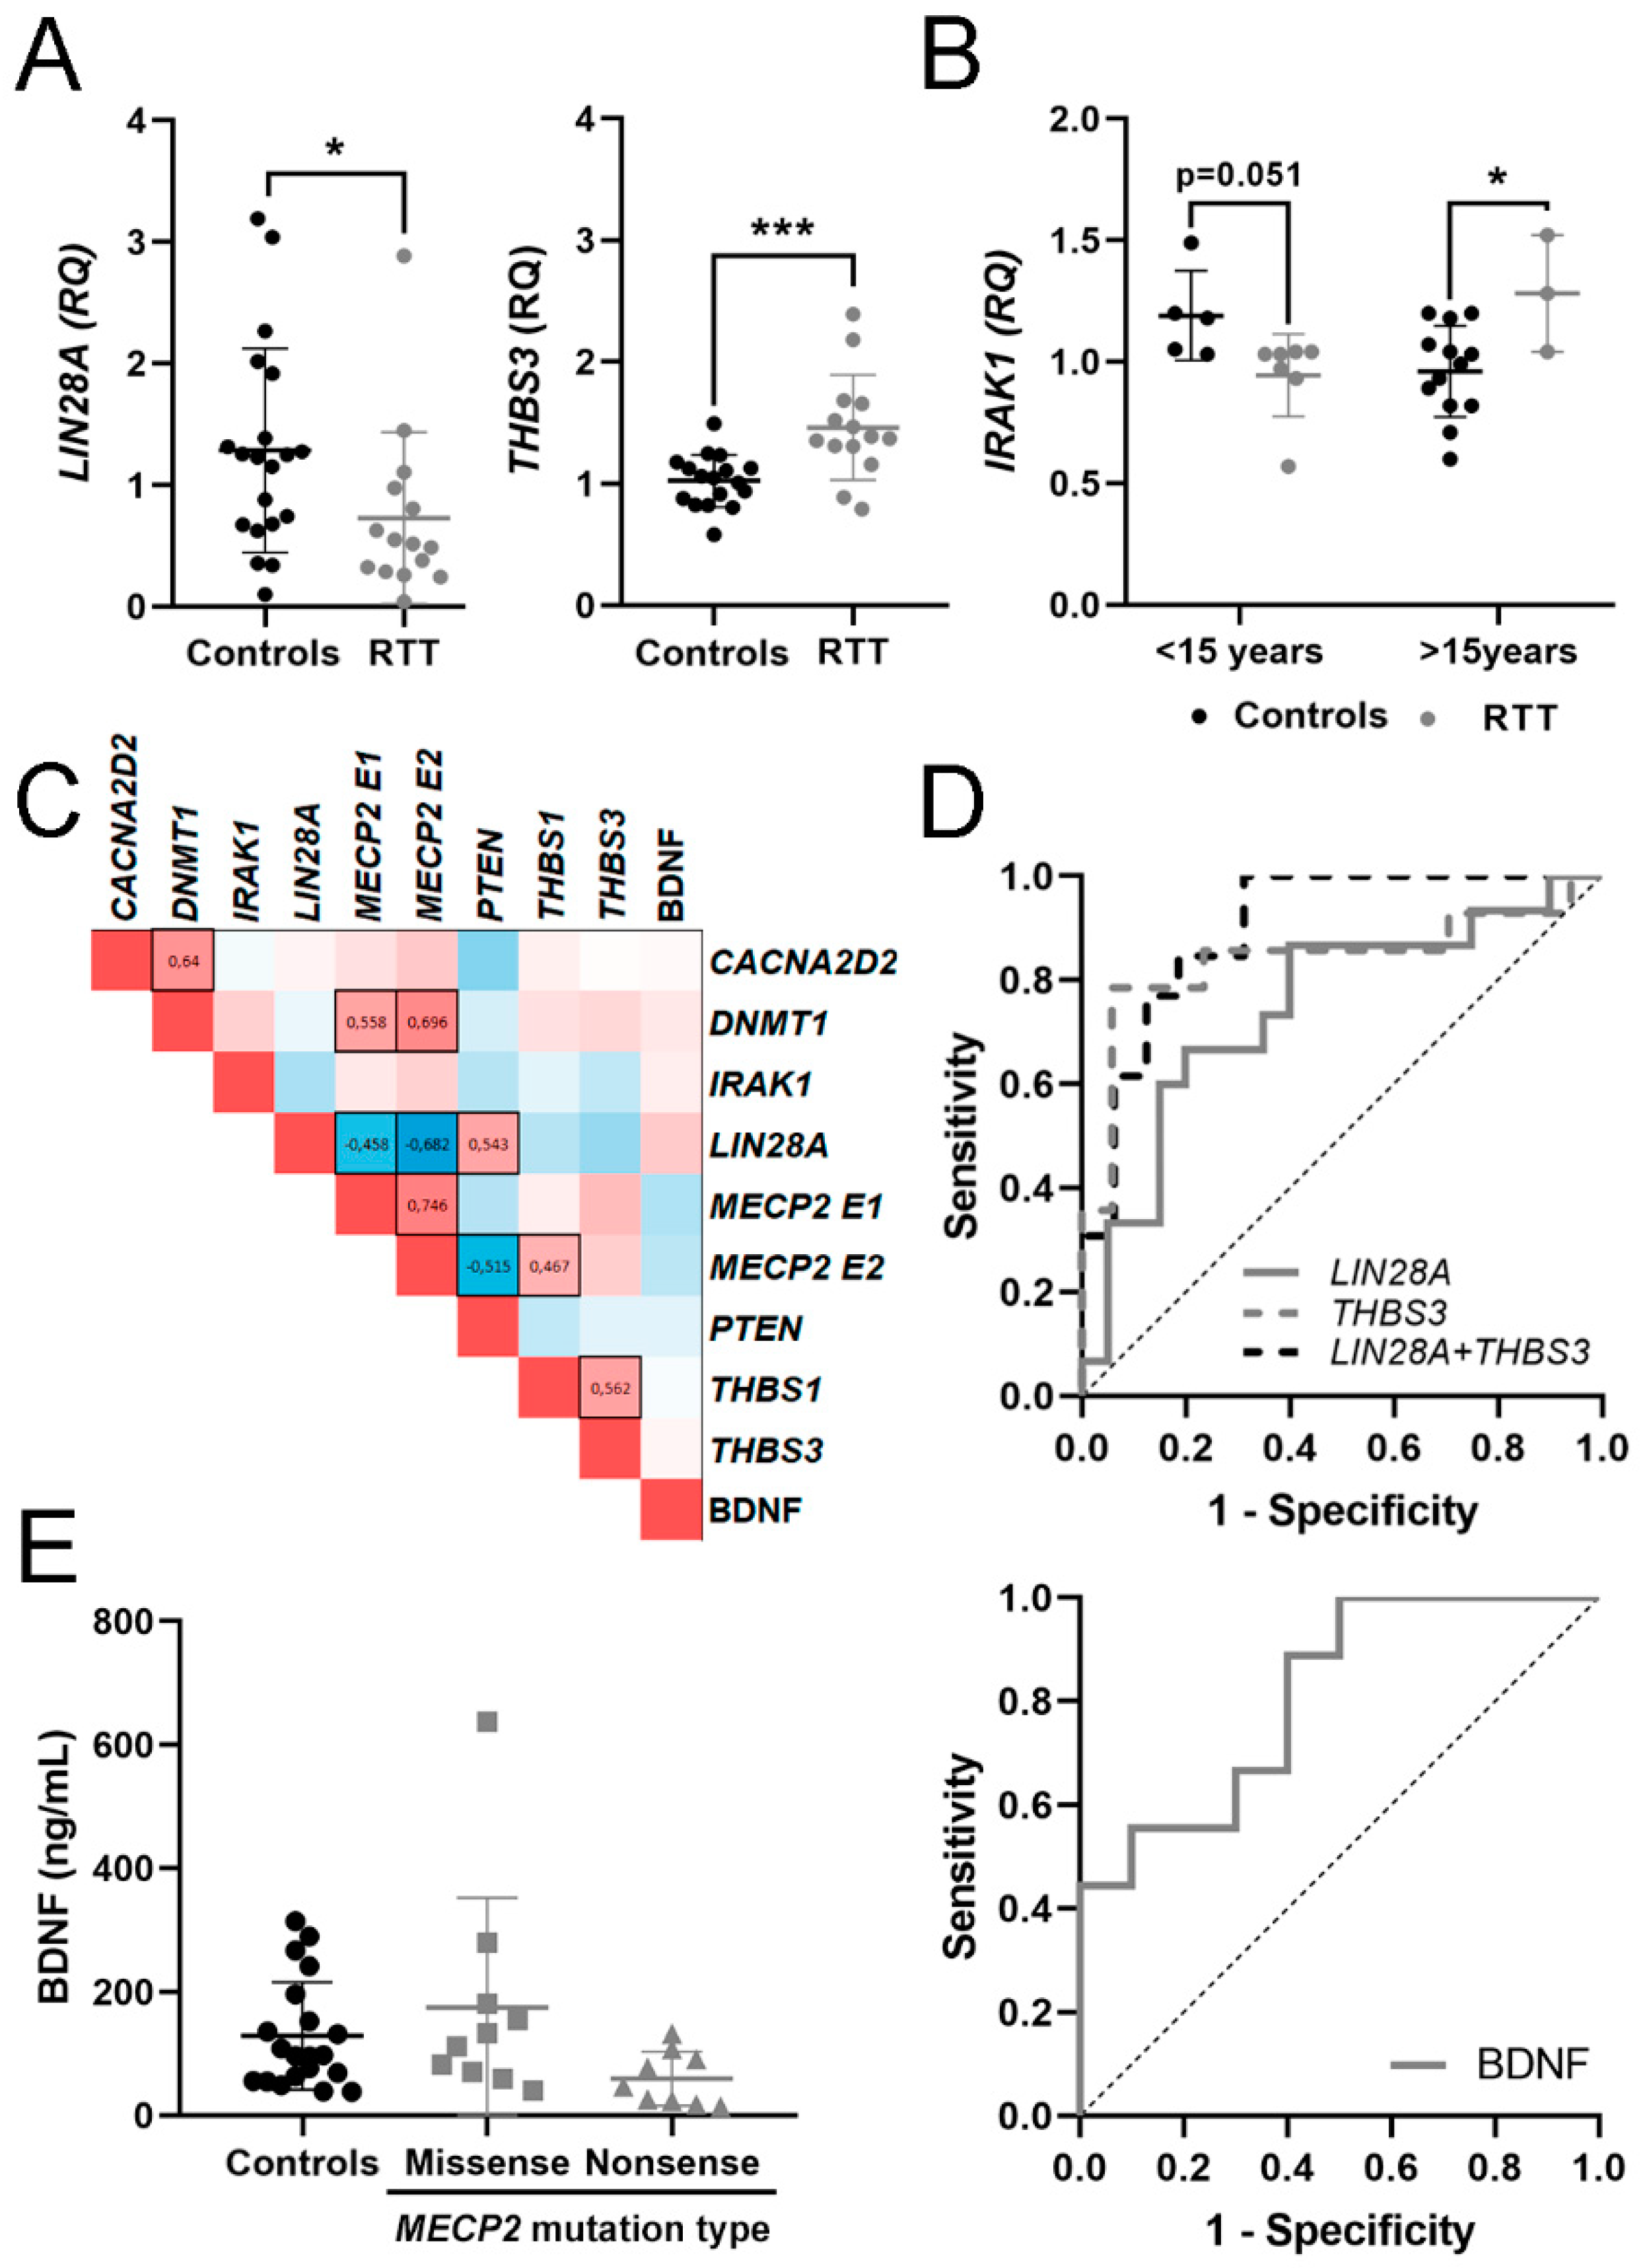
3.2. Expression of mRNA in Blood and BDNF Protein in Plasma

In this study, we only used samples that passed the exclusion criteria standards described in the methods section. We analyzed mRNA expression in total blood of 21 female controls (6 to 45 years) and 16 female RTT (5 to 33 years). We also included 2 male MDS patients (1, 4 years), and 1 adult MECP2 duplication carrier asymptomatic female. Table 2 summarizes average expression of BDNF and potential mRNA biomarkers.
As expected, MECP2 E1 and E2 isoforms and IRAK1 mRNA levels in blood were significantly higher in MDS patients than in control individuals (p = 0.026, p = 0.023 and p = 0.012, respectively), as both genes are duplicated in MDS. In these patients, we found no other changes in the mRNAs analyzed. Less expected was that mRNA levels of MECP2 E1 and E2 isoforms were also elevated in RTT samples (p = 0.023 and p = 0.007, respectively). MECP2 expression did not correlate with the type of mutation, which might indicate a compensatory increase in transcription rate in response to reduced or dysfunctional MeCP2 protein. Thus, despite similar MECP2 mRNA increment in RTT and MDS, it results in a reduction in the functional MeCP2 protein in RTT and an increase in functional protein in MDS.
In RTT samples, mRNA expression of THBS3 was significantly higher (p = 0.001), while LIN28A was significantly lower (p = 0.014) than in the control group (Table 2, Figure 1A). The expression of THBS1, CACNA2D2, DNMT1 and PTEN mRNA showed no significant differences between groups. BDNF protein levels in plasma were highly variable with no significant differences between groups.
As clinical manifestations in RTT and MDS evolved with time, we calculated Spearman coefficient to assess age-related changes in potential mRNA biomarkers or BDNF protein (Table S2). The few MDS samples included in this study also precluded this type of analysis. We found a positive correlation with age for MECP2 E2 in control samples but not within RTT samples. We did not find significant correlations with age in the other genes analyzed. To unravel nonlinear age-dependent changes, we divided RTT and control samples into two groups, <15 and >15 years old, and compared gene expression within each age group. Again, we found no significant age-dependence. However, IRAK1 mRNA expression in RTT patients <15 years old was lower at the limit of significance (p = 0.051) than in the corresponding controls, while in RTT patients >15 years old it was higher (p = 0.028) than in the corresponding controls (Figure 1B), suggesting nonlinear changes in IRAK1 expression with age. Except for IRAK1, we discarded age as a variable in the subsequent analysis.
To identify relationships between the expression levels of mRNAs and BDNF, we performed a correlation analysis by determination of the Spearman coefficient of pairwise comparisons for each candidate biomarker (Figure 1C). Spearman coefficient (ρ) of 1 or -1 represents perfect positive or negative correlation, respectively.
As predictable, there was a significant positive correlation between the expression of MECP2 E1 and MECP2 E2. Both isoforms also correlated positively with its well-known interactor DNMT1, and negatively with LIN28A. MECP2 E2 isoform also correlated positively with THBS1 and negatively with PTEN, highlighting the specific functions previously described for each MECP2 isoform [46]. CACNA2D2 expression positively correlated with DNMT1 and with THBS1, while THBS1 and THBS3 positively correlated between them. Finally, BDNF levels did not correlate with the mRNAs analyzed.

3.3. Evaluation of mRNA in Blood and BDNF Protein in Plasma as Potential Molecular Biomarkers for RTT

To evaluate the potential biomarker effectiveness, we applied ROC analysis and calculated the AUC and J, under nonparametric assumption, for each candidate. We also calculated the AUC and J for each possible biomarker combination that individually reached statistical significance (Table 3). As RTT patients are mosaic for mutated and wild type MECP2, we removed MECP2 E1 and E2 isoforms from this analysis. The few MDS patients included in this study precluded this type of analysis.
For discerning RTT patients from controls, biomarker performance was good for THBS3 mRNA (AUC = 0.840) and fair for LIN28A mRNA (AUC= 0.747), slightly changing when combined (Figure 1D), suggesting that altered THBS3 and LIN28A signaling might be a hallmark of RTT patients.
Patients had clinical evaluation, but healthy control subjects did not. Therefore, to identify potential biomarkers for individual clinical symptoms we compared RTT patients with or without a particular symptom and calculated their AUC and J coefficients. No mRNA biomarkers correlated with the onset of first symptom, sitting ability, ambulation, epilepsy, microcephaly, growth failure, kyphoscoliosis, onset of stereotypies and hand use, bowel control, language, vasomotor deficits or severity score (Tables S3 and S4).
Within RTT patients, BDNF protein content in plasma was lower in nonsense-type mutations that produce a truncated protein, with a good biomarker accuracy (AUC = 0.811). However, due to the low BDNF protein reduction, the significance between groups disappeared when compared with controls (Figure 1E).

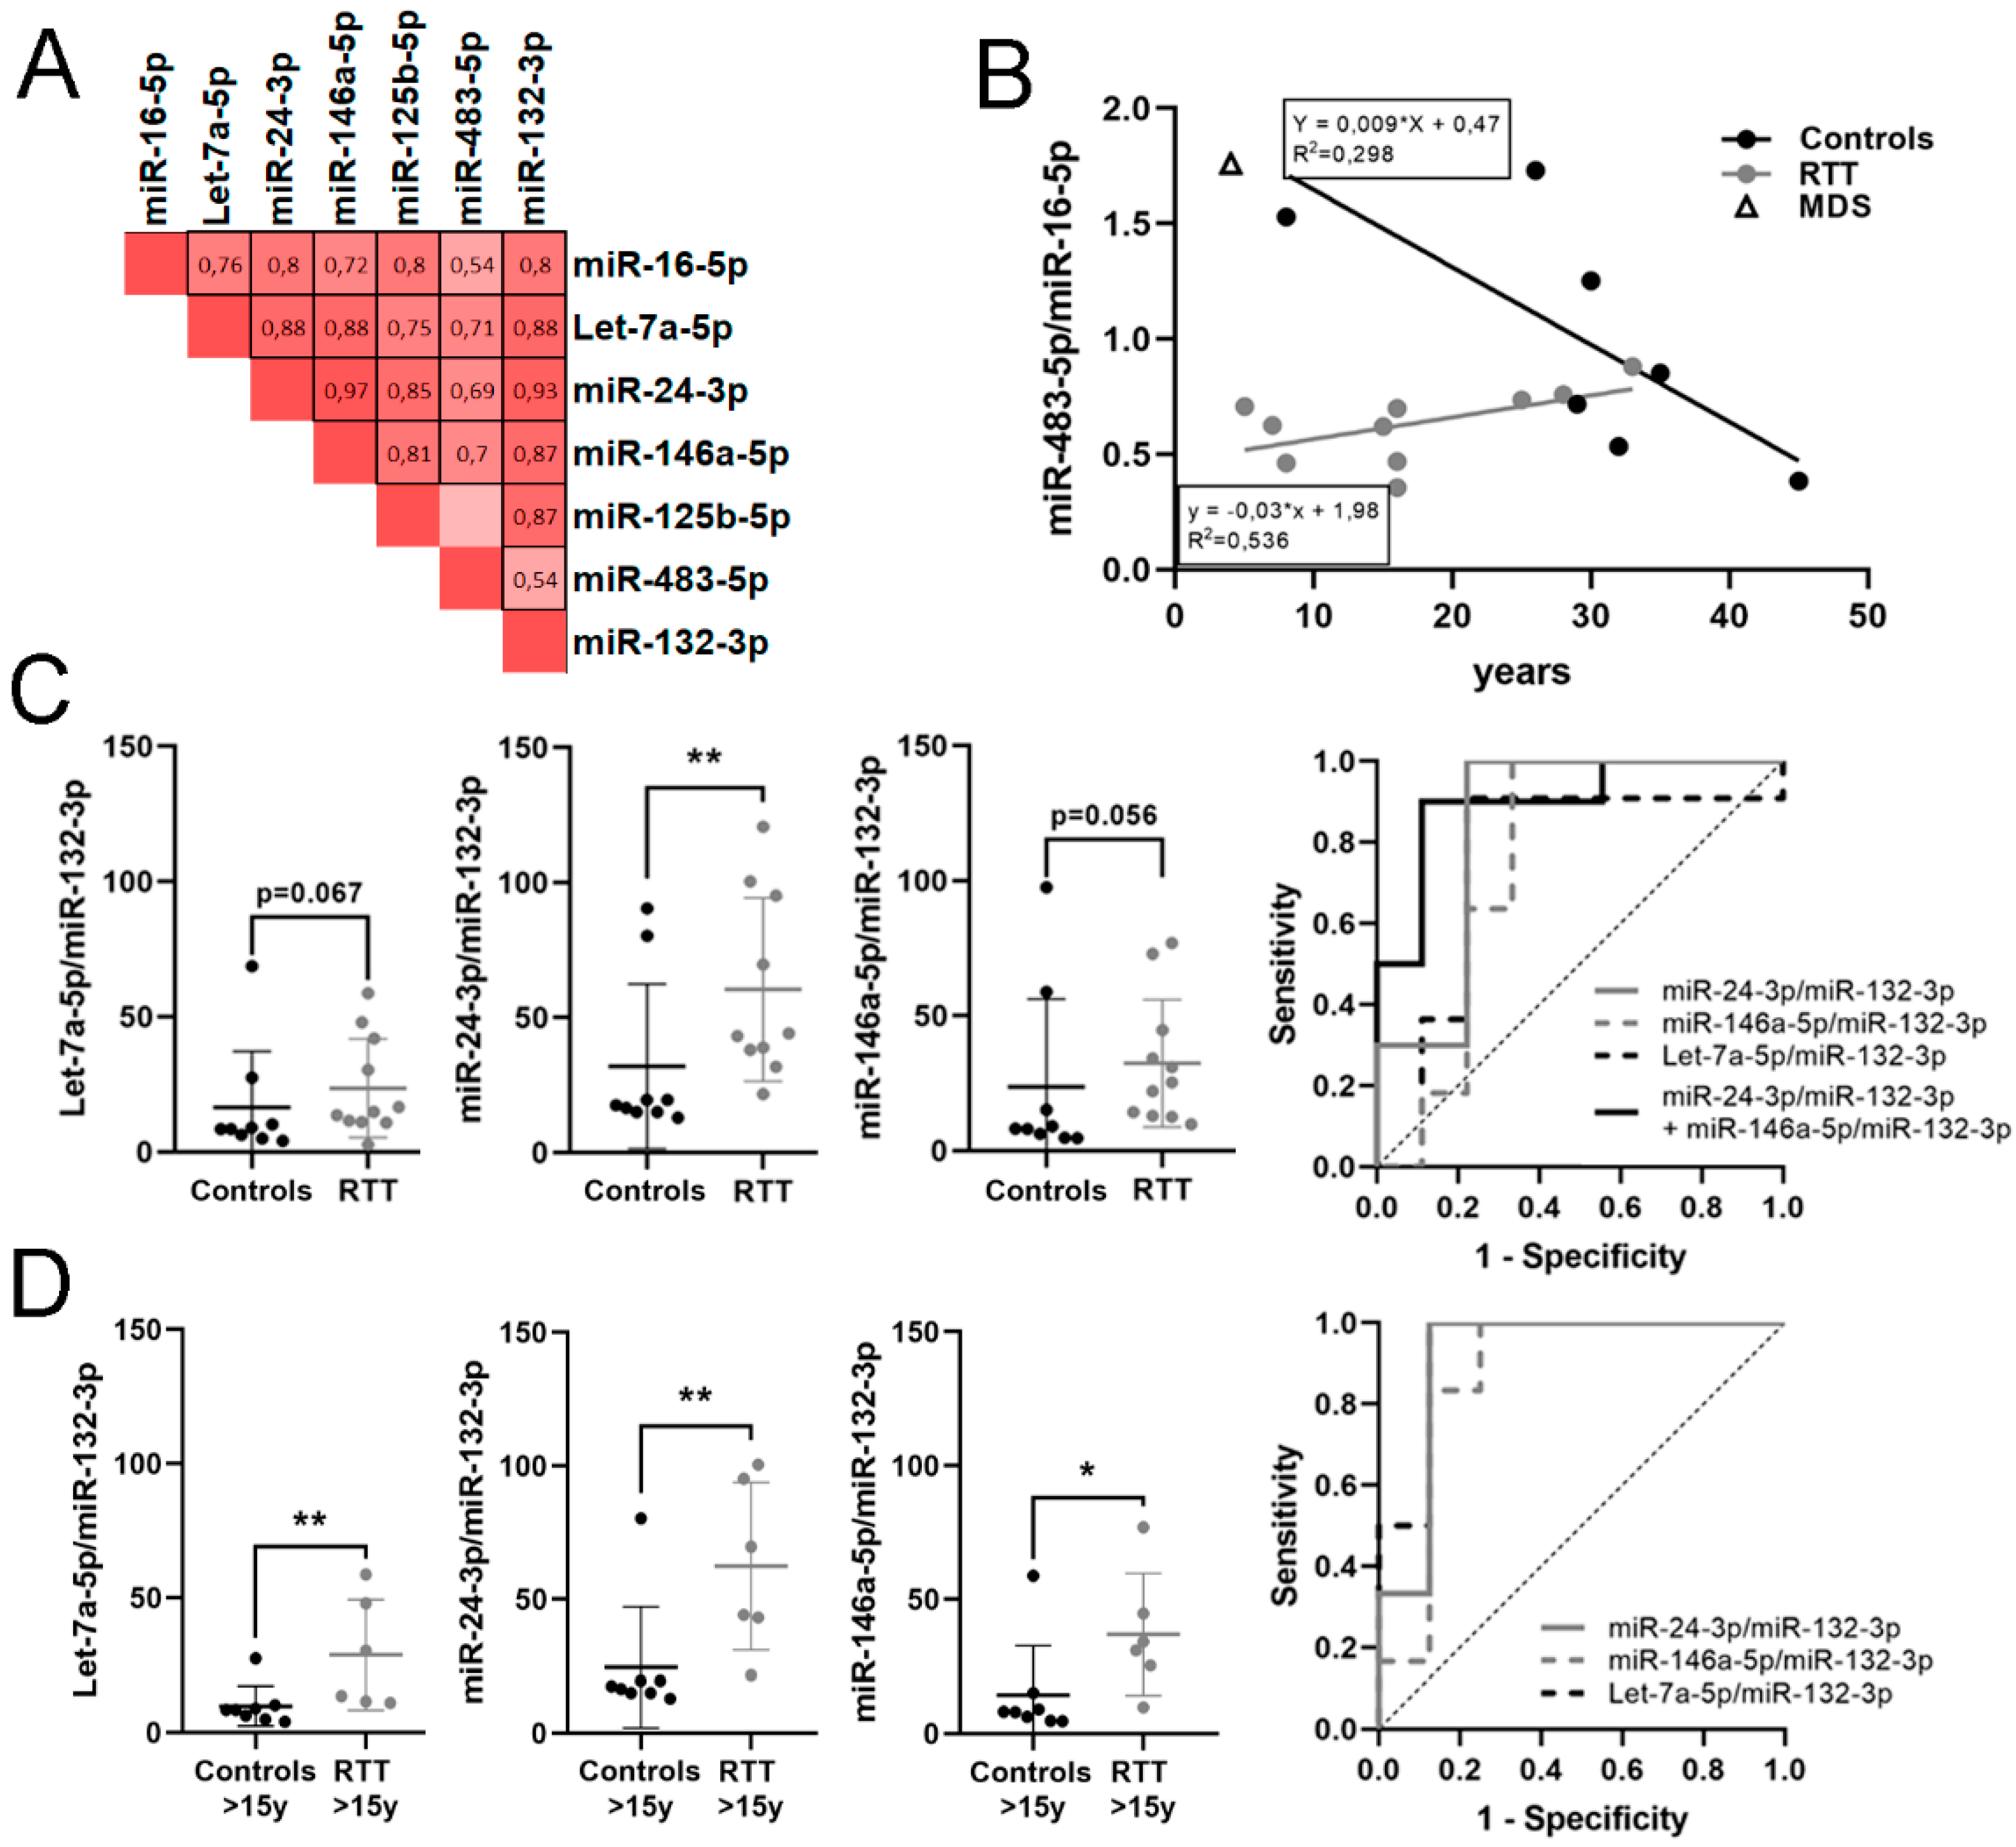
3.4. Identification of a Potential miRNA Biomarker Signature for RTT in Plasma

For miRNA detection, we used a fixed volume of plasma (200 μL) and only included samples without hemolysis, as explained in the methods section. Therefore, miRNA was determined in plasma samples of 11 controls, 14 RTT, 1 MDS and 1 MECP2 duplication carrier. Out of the 11 miRNAs analyzed, four did not amplify enough to pass the control standards (miR-137-3p, Let-7a-3p, miR-212-3p and miR-138-5p). From the remaining seven miRNAs (mirR-16-5p, miR-132-3p, miR-146a-5p, miR-125b-5p, miR-483-5p, Let-7a-5p, miR-24-3p), all but miR-483-5p and miR-132-3p were more expressed in RTT than in control samples (Table S5).
We then performed Spearman correlation between levels of candidate miRNA. Nearly all positively correlated with each other, except miR-125-5p and miR-483-5p (Figure 2A). Next, we applied the ratio-based normalization previously described [44]. The only MDS sample that passed hemolysis control precluded further analysis.
When correlating miRNA ratios with age (Table S2) we found that only miR-483-5p/miR-16-5p significantly increased with age in RTT patients (ρ = 0.602, p = 0.05). On the contrary, the same ratio in controls showed a negative correlation with age at the limit of significance (ρ= −0.635, p = 0.091), data consistent with previous descriptions of decreasing miR-483-5p expression with age [38]. Thus, we plotted miR-483-5p/miR-16-5p pair against age for RTT patients and controls (Figure 2B). In infant age, miR-483-5p/miR-16-5p ratio was high in controls, decreasing in adulthood, while it was very low in infant RTT patients, slowly increasing with age to reach the controls’ adult range. The regression lines have significant differences in slope (p = 0.0048) and y-intercept (p = 0.007) indicating an early reduction in miR-483-5p/miR-16-5p ratio in RTT infants, which is corrected with time. The only MDS patient (4 years old) had the miR-483-5p/miR-16-5p ratio in the range of its age-matched control (5 years old), pointing to the specificity of this reduction in RTT.
Considering samples of all ages together, the ratio miR-24-3p/miR-132-3p was significantly higher in RTT group with respect to controls; miR-146a-5p/miR-132-3p and Let-7a-5p/miR-132-3p were also higher in RTT at the limit of statistical significance (Table 4). miR-24-3p/miR-132-3p ratio had good biomarker performance for RTT (AUC = 0.844), increasing up to very good (AUC = 0.9) when combined with miR-146a-5p/miR-132-3p ratio (Figure 2C).
Next, we analyzed miRNA ratios in the group of age >15 years old, as only one control sample <15 years old passed the hemolysis test. Again, miR-24-3p/miR-132-3p, miR-146a-5p/miR-132-3p and Let-7a-5p/miR-132-3p ratios were significantly higher in RTT with respect to the control group (p = 0.005, p = 0.008 and p = 0.02, respectively) with very good biomarker performance (AUC = 0.917, 0.875 and 0.938, respectively). No combination of ratios improved biomarker performance (Table 4, Figure 2D). The rest of the ratios showed no relevant changes.
These results suggest mild age-dependent changes in miRNA expression and that miR-24-3p, miR-146a-5p and let-7a-5p relative to miR-132-3p might be potential candidates to include in a quantitative biomarker panel for RTT identification in plasma samples.

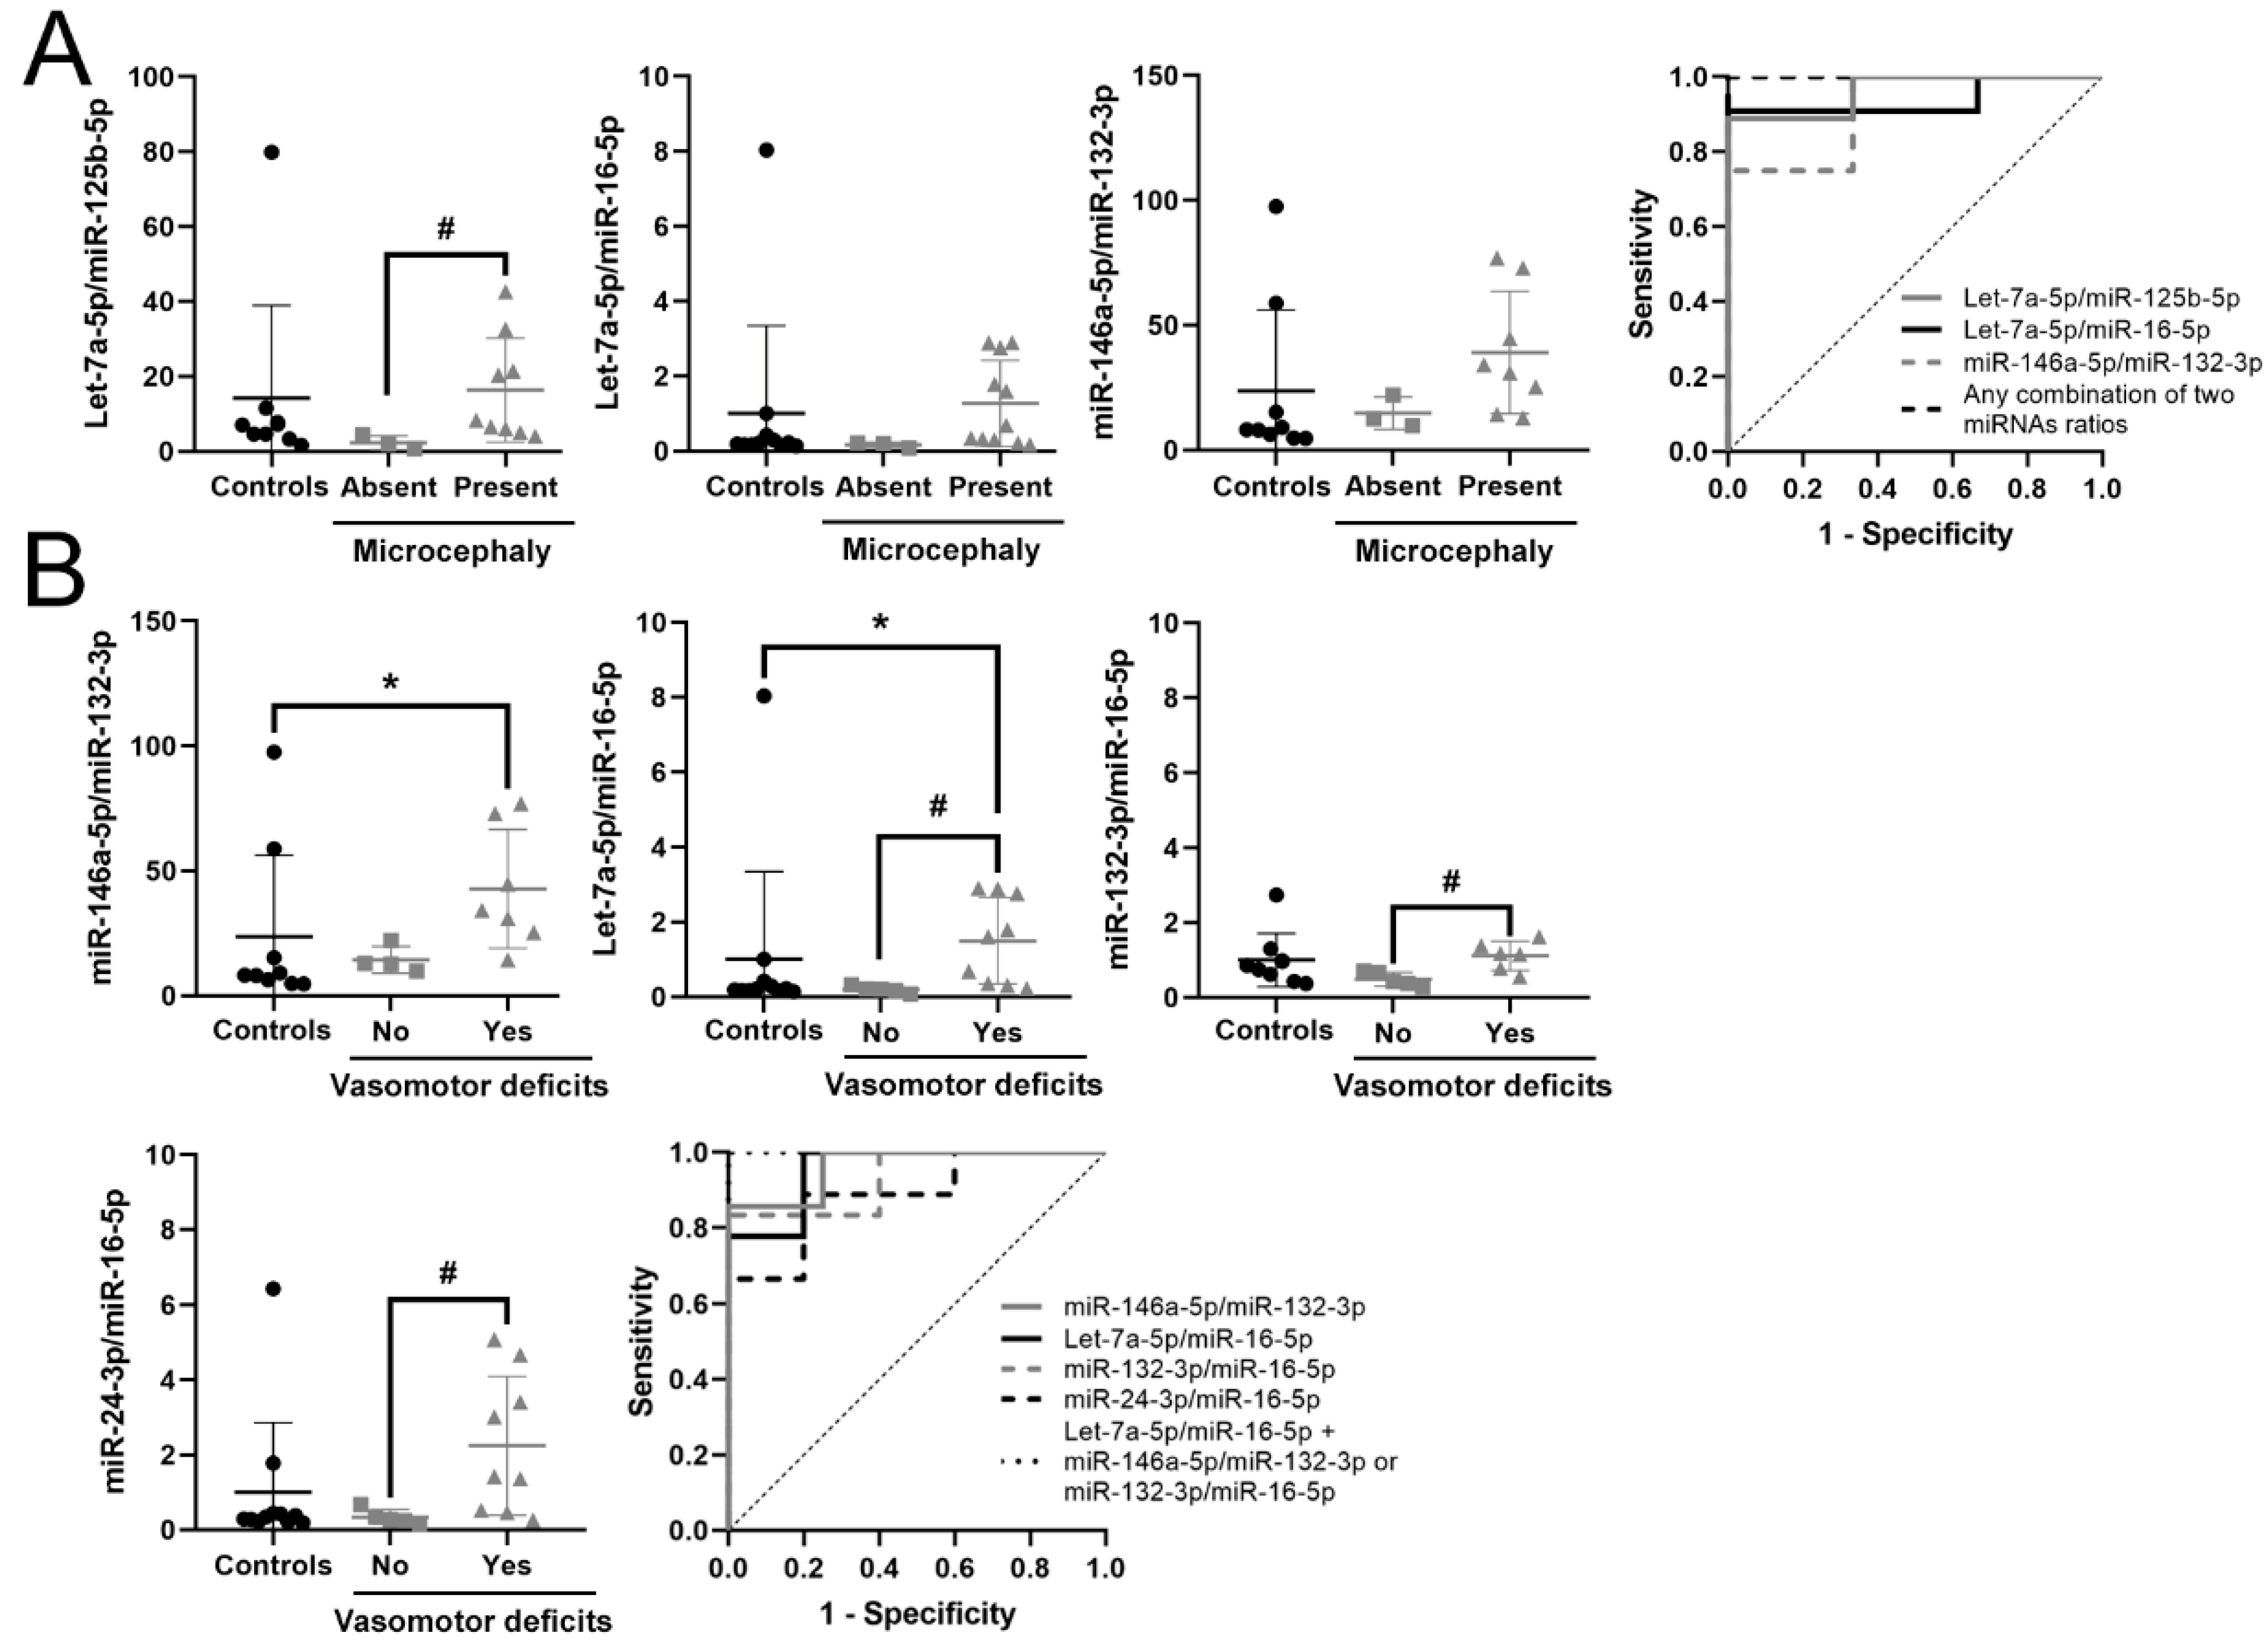
3.5. Identification of a Potential Biomarker Signature for Clinical Parameters in RTT

As described above, to identify potential biomarkers for individual clinical symptoms we compared RTT patients with or without a particular symptom and calculated their AUC and J coefficients (Tables S3 and S4). We did not find correlation between potential biomarkers and severity score, and out of all clinical parameters analyzed (shown in Table 1), we only identified clinical relevant and statistically significant potential biomarkers for microcephaly and vasomotor disorders (Table 5).
Acquired microcephaly within RTT patients was detected with very good accuracy by three miRNA ratios, Let-7a-5p/miR-125b-5p (AUC = 0.963), Let-7a-5p/miR-16-5p (AUC = 0.924) and miR-146a-5p/miR-132-3p (AUC = 0.917), reaching perfect accuracy when combining any two of them (AUC = 1). Nevertheless, only Let-7a-5p/miR-125b-5p was significantly higher in patients with microcephaly with respect to patients with normal head growth (p = 0.035) (Figure 3A).
Finally, RTT patients with vasomotor deficits showed alterations in six miRNA ratios in plasma, three of them (miR-146a-5p/miR-132-3p, Let-7a-5p/ miR-16-5p and miR-132-3p /miR-16-5p) with very good biomarker accuracy (Table 5). Combination of Let-7a-5p/miR-16-5p with either miR-146a-5p/miR-132-3p, miR-132-3p/miR-16-5p or Let-7a-5p/miR-125b-5p reached maximum efficiency (AUC = 1). The combination of Let-7a-5p/miR-16-5p with Let-7a-5p/miR-125b-5p or miR-146a-5p/miR-132-3p is the same as that which identifies patients with microcephaly, while the combination Let-7a-5p/miR-16-5p with miR-132-3p/miR-16-5p specifically discriminates patients with vasomotor deficits. These data reflect that all patients with vasomotor deficits also have microcephaly, but not all patients with microcephaly have vasomotor deficits. Patients with vasomotor deficits had Let-7a-5p/miR-16-5p significantly higher than controls and patients without deficits (p = 0.04 and p = 0.029, respectively). Moreover, in patients with vasomotor deficits, miR-146a-5p/miR-132-3p was higher than in controls (p = 0.042), while miR-24-3p/miR-16-5p and miR-132-3p/miR-16-5p were higher than in patients without deficits (p = 0.041 and p = 0.031, respectively) (Figure 3B).
In summary, we propose that the combination of increased circulating Let-7a-5p/miR-16-5p and Let-7a-5p/miR-125b-5p or miR-146a-5p/miR-132-3p accurately identifies RTT patients with microcephaly, while the combination of increased circulating Let-7a-5p/miR-16-5p and miR-132-3p/miR-16-5p specifically discriminates RTT patients with vasomotor deficits.

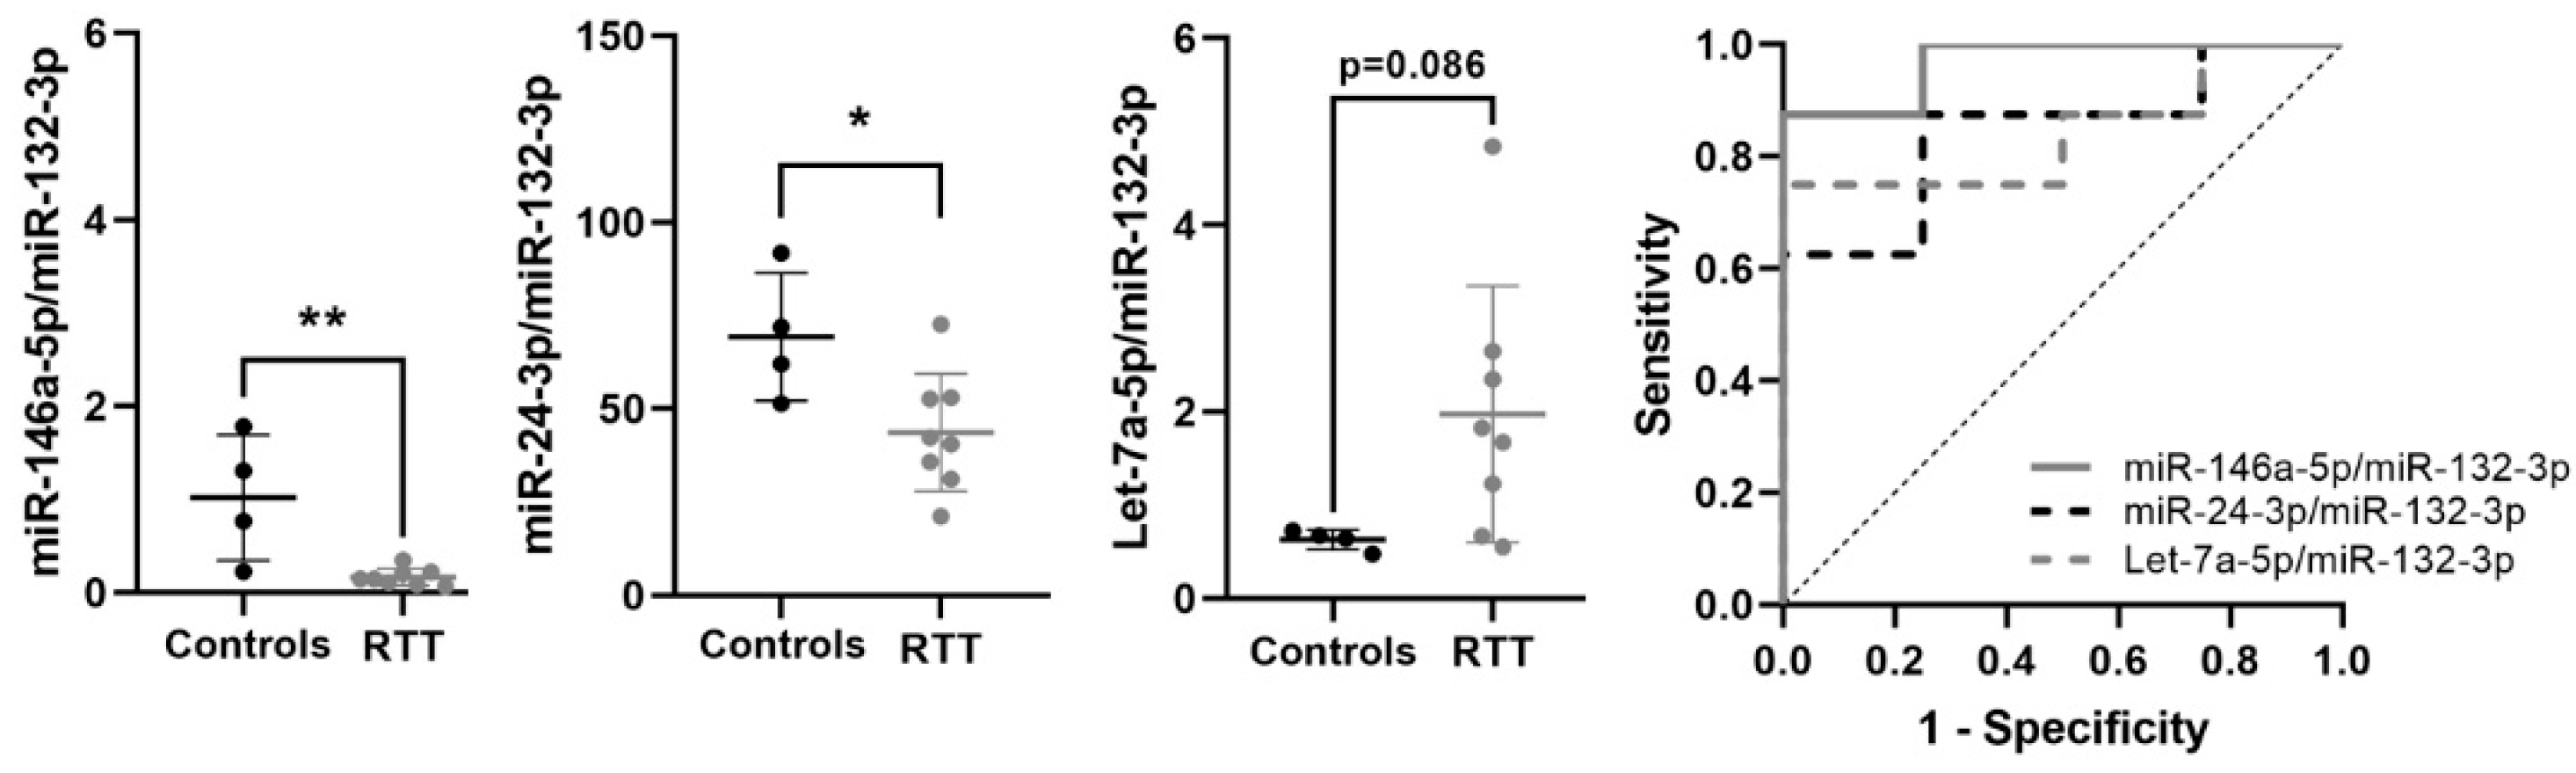
3.6. Expression of Potential Biomarkers in RTT Fibroblasts Primary Cultures

To validate that the candidate miRNA biomarkers for RTT identified in plasma (Let-7a-5p/miR-132-3p, miR-24-3p/miR-132-3p and miR-146a-5p/miR-132-3p) are altered in RTT patients, we analyzed their expression in an independent cohort of fibroblasts primary cultures from RTT patients (n = 8), and age and sex matched controls (n = 4). First, we normalized cellular miRNAs using RNU48, a small-nucleolar RNA commonly used for microRNA normalization. After normalization, miR-146a-5p was significantly reduced in RTT fibroblasts (p = 0.008; Table S6) and Let-7a-5p was increased at the limit of significance (p = 0.075). Next, to avoid normalization bias we performed ratio-based normalization as with circulating miRNAs in plasma. Ratios of miR-146a-5p/miR-132-3p and miR-24-3p/miR-132-3p were significantly lower in RTT fibroblasts than in controls (p = 0.003 and p = 0.027, respectively), opposite to the significant increase observed in RTT plasma. Although not reaching statistical significance, Let-7a-5p/miR-132-3p increased in RTT fibroblasts (p = 0.086), as in plasma.
All three ratios showed very good/good biomarker accuracy: miR-146a-5p/miR-132-3p (AUC = 0.969), Let-7a-5p/miR-132-3p (AUC = 0.844) and miR-24-3p/miR-132-3p (AUC = 0.844). Taken all together, these data indicate that these three miRNA ratios are consistently but tissue-specific dysregulated in RTT, and support their biomarker potential (Table 6, Figure 4).
We also analyzed the mRNA expression of LIN28A and THBS3 in fibroblasts, and we found no differences between RTT and controls (Table S6). The lack of differences between conditions might be due to the reduced number of samples (4 RTT and 4 controls) or to tissue-specific regulation in blood and fibroblasts.

4. Discussion

The search for quantitative biomarkers is instrumental in complex heterogenic rare diseases, like RTT or MDS, especially those biomarkers that could be informative at early stages or used to monitor disease progression and the effect of treatments in clinical trials, as clinical severity scores are not optimal outcome measures [32,47,48]. In particular, the identification of reliable biomarkers for RTT early screening can contribute to a prompt genetic diagnostic, as the main age at RTT diagnosis is 24 months due to the apparently normal development that precedes the onset of overt symptoms [49].
RNA blood-based biomarkers are easy to measure repeatedly from patients of all ages and health conditions [50,51] although there are several challenges. The first one is the lack of direct connection between blood and brain, especially in diseases without brain–blood–barrier disruption, like RTT-related syndromes [52]. As the use of nervous tissue is highly restricted in living patients, other biological fluids (cerebrospinal fluid, saliva or urine) and skin fibroblasts could help to validate the relevance of the potential RNA biomarkers. Nevertheless, one must consider that a particular biomarker could be differentially dysregulated in distinct tissues.
Changes in mRNA expression do not always reflect similar changes in protein function, although they can be indicative of a misbalanced situation. miRNAs post-transcriptionally regulate mRNAs by binding to partially complementary sites, causing translational suppression and/or degradation [53]. Moreover, a single miRNA can regulate the expression of an entire set of proteins. Despite the lack of standardized internal controls, miRNAs are attractive biomarker candidates, as they can reflect the pathogenic state of the system and are highly stable [33,34]. Circulating microRNAs are involved in neural development and plasticity [54,55], and are altered in neuropsychiatric disorders like schizophrenia, autism spectrum disorders [35,36] or recently in RTT [47].
In addition to the above-described limitations, the main drawback of this exploratory study is inherent to the reduced sample size, as RTT and MDS are rare disorders. Moreover, the strict exclusion criteria applied to ensure the robustness of the results forced the rejection of plasma samples with hemolysis, which further reduced the sample size in the miRNA study. Hemolysis was higher in samples from controls <15 years, preventing statistical analysis using this age group.
Previous studies have described nonlinear changes from infancy to adulthood in some of the studied RNAs. For example, miR-483-5p expression in mononuclear leucocytes was constant from infancy to childhood, decreasing thereafter during adulthood. On the contrary, miR-24 and Let-7a increased from children to young adults, decreasing thereafter during ageing [56]. In our study, we only found a statistical correlation with age in the miR-483-5p/miR-16-5p ratio and in MECP2 E2, agreeing with previously published results [38]. Nevertheless, due to the reduced sample size, we cannot rule out additional changes associated with age in other RNAs.
Due to the lack of reference controls, studies of miRNAs required additional methodological considerations. We found that the levels of miR-16-5p, Let-7a-5p, miR-24-3p, miR-146a-5p and miR-125b-5p in a fixed plasma volume were significantly higher in RTT samples than in controls. These data sustain impaired protein translation in RTT, and agree with recent studies in the cerebellum of pre-symptomatic Mecp2-/y mice showing increased levels of miR-125b-5p, Let-7a-5p, miR-146a-5p and miR-24-3p and reduced levels of LIN28A [36,57]. As described in the methods section, we calculated miRNA ratios to avoid normalization bias.
Even with all these limitations, here we have identified a set of circulating miRNA in plasma, candidates for biomarker panels with clinical potential for RTT screening and stratification (Table 7). We also provided a preliminary validation of three miRNA pairs, as RTT biomarkers using an independent cohort of skin fibroblasts. Two of the three miRNA ratios (miR-146a-5p/miR-132-3p and miR-24-3p/miR-132-3p) were dysregulated in both tissues, but in opposite directions. This phenomenon has been previously described in other studies [58,59], and may be due to different expression between circulating and cellular miRNAs [60] or due to the distinct role of these miRNAs in different tissues. Nevertheless, their clinical relevance will require further verification and validation in studies with larger cohorts including samples of a whole range of ages.
The differentially expressed RNAs identified in this work in blood, plasma and fibroblasts from RTT patients are mainly involved in growth, metabolism, extracellular matrix and inflammation. Figure 5 summarizes the main signaling pathways involved.
BDNF is a member of the neurotrophin family expressed in an activity-dependent manner and involved in the control of neuronal survival, development, synaptic function and plasticity [61,62,63,64]. BDNF is the most extensively studied target of MeCP2 and its expression is highly dysregulated in RTT [65]. The link between MeCP2 and BDNF is complex and may involve a set of common signaling pathways. Although in this study BDNF protein dosage was not significantly altered in RTT patients, we report alterations in various MeCP2 and BDNF effectors including LIN28A [40] and several miRNAs (i.e., miR-24, miR-125b, miR-132 [66] and miR-16 [67]) that may underlie some of the pathogenic symptoms in RTT syndrome.
The LIN28/Let-7 loop is a primal regulator of glucose metabolism, proliferation, growth, stem cells differentiation, inflammation and miRNA-selective translation [40,68,69,70]. LIN28A/B are RNA-binding proteins that post-transcriptionally regulate developmental genes and block the processing of Let-7 family of microRNAs, facilitating their degradation [71,72,73]. Let-7 miRNAs inhibit translation of an important subset of pro-growth proteins and accordingly, Let-7 expression during embryonic development is virtually absent, increasing over development up to the 50% of miRNAs in mature neurons [74,75,76,77]. At the same time, LIN28A expression is repressed by Let-7, creating a loop of regulation [78]. We showed here a dysregulation in this loop, with reduced LIN28A and increased Let-7a expression.
LIN28A also regulates Insulin-like growth factor 2 (IGF2)-mTOR signaling, controlling neural progenitor proliferation and brain development [79]. LIN28A induces IGF2 expression [80] while Let-7a-5p, miR-125b-5p and miR-16-5p downregulate IGF2 by targeting several components of IGF2 signaling [68,81,82]. IGF2 is a developmentally regulated and maternally imprinted gene that contains embedded within it the miR-483-5p [38]. The miR-483-5p itself upregulates IGF2 transcription from fetal promoters and enhances tissue growth [83]. Specifically in humans, miR-483-5p regulates the translation of MeCP2 [38]. Recently, reduced levels of LIN28A in the cerebellum of Mecp2-/y are associated with Let-7f-mediated reduction of Insulin-Like Growth Factor 1 (IGF1) protein synthesis [57]. IGF1 is the indicated treatment for growth failure and, based on data obtained from male Mecp2-/y mice, several phase II clinical trials of IGF1 analogs are being tested for RTT. These studies have reported improvements in cognition and social abilities, although chronic treatment could have detrimental effects, like metabolic syndrome and epilepsy, depending on the dosage [84,85,86,87].
Nevertheless, the low LIN28A and miR-483-5p/miR-16-5p ratio expression in young RTT patients suggests an early blockage of IGF2 signaling at different regulatory points. Thus, miR-483-5p/miR-16-5p is a potential candidate biomarker for an early screening panel of diseases associated with growth delay, including RTT. Moreover, within RTT patients, higher Let-7a-5p/miR-125b-5p and Let-7a-5p/miR-16-5p ratios combination segregates those with microcephaly, a prominent feature in the disease [88,89]. To determine if this early dysregulation is specific for RTT or is a general trait for growth restriction, further studies should compare cohorts of young RTT patients with cohorts of children coursing with growth restriction, developmental delay and age and sex-matched controls.
Moreover, opposed to what was observed in our RTT cohort, reduced Let-7a-5p and increased miR-483-5p were described in peripheral blood of a cohort of Chinese patients with autism spectrum disorders (ASD) [90], pointing to similar signaling pathways misbalanced into opposite directions.
Aside from growth and glucose metabolism, most genes and miRNAs altered in this study point toward inflammation as a process implicated in RTT pathogenesis [91,92]. NF-κB signaling is upregulated in MeCP2-/y mice and its inhibition ameliorated RTT phenotype; thus, this pathway is postulated as a very promising drug target [30,93]. IRAK1 is a signaling kinase of the NF-κB pathway, also upregulated in MeCP2-/y mice. IRAK1 gene is adjacent to MECP2 and both are duplicated in all patients affected by MDS [6,94]. In whole blood, IRAK1 expression showed age-dependent changes in RTT, from lower in young patients than in controls, to higher in older patients than in controls. Moreover, miR-146a-5p was upregulated. miR-146a-5p is a key piece of a negative regulatory loop of NF-κB pathway, as its expression is induced by NF-κB and downregulates both IRAK1 and TRAF6, two adapter molecules of this pathway [95]. Another regulatory mechanism involves miR-24-3p inhibition of IRAK-M expression [96]. IRAK-M suppresses IRAK1/4 signaling and negatively regulates inflammation and immune response in macrophages and monocytes [97,98,99]. In addition, recent works implicate miR-16-5p, miR-24-3p and miR-146a-5p in the regulation of MAPK downstream BDNF, IGF2 and WNT signaling in depression [100].
THBS1-5 genes codify for thrombospondins (TSP1-5), a family of extracellular matrix proteins with a whole range of tissue-specific functions depending on their interaction with different membrane receptors [101]. TSP-1 expression is downregulated in several diseases associated with mental retardation, such as Down syndrome [102] or Fragile X syndrome [103]. Restoration of TSP-1 levels in glia modulated spine number and morphology; thus, TSP-1 is postulated as a target for the treatment of these conditions. Defects in spine density, morphology and dendritic arborization are also present in post-mortem RTT brains and mice models [104,105,106]. Although in THBS1 mRNA did not change significantly in our study, we cannot exclude altered THBS1 protein translation as it is a target of Let-7a-5p [82,107], and Let-7a-5p/miR-132-3p ratio is elevated in RTT patients. TSP-3 functions in the brain are largely unknown; nevertheless, we have recently found a positive correlation between high THBS3 mRNA in blood and deficits in executive function, attention, behavioral and mood disorders in patients with inborn errors of amino acid metabolism [108]. As TSPs are highly expressed in glial cells, our data support the current view that glial cells can be central in RTT phenotype, and thus, can be targets for potential treatments [109].
Finally, vasomotor deficits are also prevalent in RTT patients as they grow old. Altered miR-146a-5p/miR-132-3p and Let-7a-5p/miR-16-5p are the most relevant ratios to identify patients with vasomotor deficits from those without these deficits and controls. Concordantly, alterations in all these miRNAs have been described in angiogenesis-related diseases [110,111,112]. Our data point to increased circulating miR-146a-5p/miR-132-3p ratio as a hallmark of RTT that can identify patients from controls with very good accuracy, while it also serves to stratify RTT severity, being able to discriminate those patients with microcephaly or vasomotor deficits. On the contrary, increased Let-7a-5p/miR-16-5p and miR-132-3p/miR-16-5p ratios combination specifically identifies vasomotor deficits, and thus, it could be included in a panel for detection of vasomotor deficits in non-RTT pathologies.

5. Conclusions

Our exploratory study identifies potential miRNA biomarkers with clinical relevance, and sets the basis for larger studies leading to the identification of specific miRNA signatures suitable for early RTT screening and/or as quantitative outcome measures in clinical trials. We also described several dysregulated miRNA pairs appropriate for tracking disease progression. Those miRNA pairs are key for differentiation, growth and inflammation, some of the prominent features of RTT, and could serve as targets for potential treatments. However, their clinical relevance will require further verification and validation in studies with larger cohorts including samples of a whole range of ages.

Supplementary Materials

The following are available online at https://www.mdpi.com/2227-9059/9/2/148/s1, Table S1: List of probes used in this study, Table S2: Spearman correlation of genes and miRNAs ratios with age, Table S3: mRNA and miRNA ratios performance as RTT stratification biomarkers, Table S4: Spearman correlation of genes and miRNAs ratios with severity score, Table S5: Expression of miRNAs in plasma samples, Table S6: Expression of RNAs in fibroblasts samples.

Author Contributions

S.A. conceived and supervised the study. A.-A.C., R.B., A.T.-N. and A.P.-A. performed the experiments and collected the data. A.-A.C. analyzed the results. M.O., E.C.-S. and J.A. provided samples and clinical data of the patients. A.-A.C. wrote and S.A. and À.G.-C. critically revised the manuscript. All authors reviewed the article for intellectual content and approved the manuscript. All authors have read and agreed to the published version of the manuscript.

Funding

This work was supported by the parents association “Miradas que hablan-Sindrome de Duplicación MECP2”, through Fundació Sant Joan de Déu (PFNR0085), and by grants from the Spanish Ministry of Health (Instituto de Salud Carlos III/FEDER, PI15/01159 y PI20/00389).

Institutional Review Board Statement

Research Ethics Committee of Sant Joan de Déu Hospital approved the study and informed consent was subscribed by patients and controls (when >18 years old) or by their parents (when <18 years old) prior to the collection of data. All methods were performed in accordance with the relevant guidelines and regulations.

Informed Consent Statement

Informed consent was obtained from all subjects involved in the study.

Data Availability Statement

All data generated during this study are included in this published article and its supplementary information files.

Acknowledgments

We thank all patients and their families for their collaboration and support in this study. We are indebted to the “Biobanc de l’Hospital Infantil Sant Joan de Déu per a la Investigació” integrated in the Spanish Biobank Network of Instituto de Salud Carlos III (ISCIII) for sample and data procurement.

Conflicts of Interest

The authors declare no conflict of interest.

References

  1. Georgel, P.T.; Horowitz-Scherer, R.A.; Adkins, N.; Woodcock, C.L.; Wade, P.A.; Hansen, J.C. Chromatin compaction by human MeCP2. Assembly of novel secondary chromatin structures in the absence of DNA methylation. J. Biol. Chem. 2003, 278, 32181–32188. [Google Scholar] [CrossRef] [PubMed] [Green Version]
  2. Martinez de Paz, A.; Ausio, J. MeCP2, A Modulator of Neuronal Chromatin Organization Involved in Rett Syndrome. Adv. Exp. Med. Biol. 2017, 978, 3–21. [Google Scholar] [CrossRef] [PubMed]
  3. Nan, X.; Campoy, F.J.; Bird, A. MeCP2 is a transcriptional repressor with abundant binding sites in genomic chromatin. Cell 1997, 88, 471–481. [Google Scholar] [CrossRef] [Green Version]
  4. Yasui, D.H.; Peddada, S.; Bieda, M.C.; Vallero, R.O.; Hogart, A.; Nagarajan, R.P.; Thatcher, K.N.; Farnham, P.J.; Lasalle, J.M. Integrated epigenomic analyses of neuronal MeCP2 reveal a role for long-range interaction with active genes. Proc. Natl. Acad. Sci. USA 2007, 104, 19416–19421. [Google Scholar] [CrossRef] [PubMed] [Green Version]
  5. Szulwach, K.E.; Li, X.; Smrt, R.D.; Li, Y.; Luo, Y.; Lin, L.; Santistevan, N.J.; Li, W.; Zhao, X.; Jin, P. Cross talk between microRNA and epigenetic regulation in adult neurogenesis. J. Cell Biol. 2010, 189, 127–141. [Google Scholar] [CrossRef] [PubMed] [Green Version]
  6. Lugtenberg, D.; Kleefstra, T.; Oudakker, A.R.; Nillesen, W.M.; Yntema, H.G.; Tzschach, A.; Raynaud, M.; Rating, D.; Journel, H.; Chelly, J.; et al. Structural variation in Xq28: MECP2 duplications in 1% of patients with unexplained XLMR and in 2% of male patients with severe encephalopathy. Eur. J. Hum. Genet. EJHG 2009, 17, 444–453. [Google Scholar] [CrossRef] [PubMed] [Green Version]
  7. Ehrhart, F.; Sangani, N.B.; Curfs, L.M.G. Current developments in the genetics of Rett and Rett-like syndrome. Curr. Opin. Psychiatry 2018, 31, 103–108. [Google Scholar] [CrossRef] [PubMed]
  8. Trappe, R.; Laccone, F.; Cobilanschi, J.; Meins, M.; Huppke, P.; Hanefeld, F.; Engel, W. MECP2 mutations in sporadic cases of Rett syndrome are almost exclusively of paternal origin. Am. J. Hum. Genet. 2001, 68, 1093–1101. [Google Scholar] [CrossRef] [Green Version]
  9. Amir, R.E.; Van den Veyver, I.B.; Schultz, R.; Malicki, D.M.; Tran, C.Q.; Dahle, E.J.; Philippi, A.; Timar, L.; Percy, A.K.; Motil, K.J.; et al. Influence of mutation type and X chromosome inactivation on Rett syndrome phenotypes. Ann. Neurol. 2000, 47, 670–679. [Google Scholar] [CrossRef]
  10. Van Esch, H.; Bauters, M.; Ignatius, J.; Jansen, M.; Raynaud, M.; Hollanders, K.; Lugtenberg, D.; Bienvenu, T.; Jensen, L.R.; Gecz, J.; et al. Duplication of the MECP2 region is a frequent cause of severe mental retardation and progressive neurological symptoms in males. Am. J. Hum. Genet. 2005, 77, 442–453. [Google Scholar] [CrossRef] [Green Version]
  11. Stallworth, J.L.; Dy, M.E.; Buchanan, C.B.; Chen, C.F.; Scott, A.E.; Glaze, D.G.; Lane, J.B.; Lieberman, D.N.; Oberman, L.M.; Skinner, S.A.; et al. Hand stereotypies: Lessons from the Rett Syndrome Natural History Study. Neurology 2019, 92, e2594–e2603. [Google Scholar] [CrossRef] [PubMed]
  12. Feldman, D.; Banerjee, A.; Sur, M. Developmental Dynamics of Rett Syndrome. Neural Plast. 2016, 2016, 6154080. [Google Scholar] [CrossRef] [PubMed] [Green Version]
  13. Jian, L.; Nagarajan, L.; de Klerk, N.; Ravine, D.; Bower, C.; Anderson, A.; Williamson, S.; Christodoulou, J.; Leonard, H. Predictors of seizure onset in Rett syndrome. J. Pediatrics 2006, 149, 542–547. [Google Scholar] [CrossRef] [PubMed]
  14. Mount, R.H.; Hastings, R.P.; Reilly, S.; Cass, H.; Charman, T. Behavioural and emotional features in Rett syndrome. Disabil. Rehabil. 2001, 23, 129–138. [Google Scholar] [PubMed]
  15. Nomura, Y. Early behavior characteristics and sleep disturbance in Rett syndrome. Brain Dev. 2005, 27 (Suppl. 1), S35–S42. [Google Scholar] [CrossRef]
  16. Kyle, S.M.; Vashi, N.; Justice, M.J. Rett syndrome: A neurological disorder with metabolic components. Open Biol. 2018, 8. [Google Scholar] [CrossRef] [Green Version]
  17. Buchanan, C.B.; Stallworth, J.L.; Scott, A.E.; Glaze, D.G.; Lane, J.B.; Skinner, S.A.; Tierney, A.E.; Percy, A.K.; Neul, J.L.; Kaufmann, W.E. Behavioral profiles in Rett syndrome: Data from the natural history study. Brain Dev. 2019, 41, 123–134. [Google Scholar] [CrossRef]
  18. Tarquinio, D.C.; Hou, W.; Berg, A.; Kaufmann, W.E.; Lane, J.B.; Skinner, S.A.; Motil, K.J.; Neul, J.L.; Percy, A.K.; Glaze, D.G. Longitudinal course of epilepsy in Rett syndrome and related disorders. Brain 2017, 140, 306–318. [Google Scholar] [CrossRef]
  19. Mackay, J.; Downs, J.; Wong, K.; Heyworth, J.; Epstein, A.; Leonard, H. Autonomic breathing abnormalities in Rett syndrome: Caregiver perspectives in an international database study. J. Neurodev. Disord. 2017, 9, 15. [Google Scholar] [CrossRef]
  20. Witt Engerstrom, I. Age-related occurrence of signs and symptoms in the Rett syndrome. Brain Dev. 1992, 14, S11–S20. [Google Scholar]
  21. Ramocki, M.B.; Tavyev, Y.J.; Peters, S.U. The MECP2 duplication syndrome. Am. J. Med. Genet. Part A 2010, 152A, 1079–1088. [Google Scholar] [CrossRef] [PubMed] [Green Version]
  22. Miguet, M.; Faivre, L.; Amiel, J.; Nizon, M.; Touraine, R.; Prieur, F.; Pasquier, L.; Lefebvre, M.; Thevenon, J.; Dubourg, C.; et al. Further delineation of the MECP2 duplication syndrome phenotype in 59 French male patients, with a particular focus on morphological and neurological features. J. Med. Genet. 2018, 55, 359–371. [Google Scholar] [CrossRef] [PubMed] [Green Version]
  23. Monros, E.; Armstrong, J.; Aibar, E.; Poo, P.; Canos, I.; Pineda, M. Rett syndrome in Spain: Mutation analysis and clinical correlations. Brain Dev. 2001, 23 (Suppl 1), S251–S253. [Google Scholar] [CrossRef]
  24. Neul, J.L.; Kaufmann, W.E.; Glaze, D.G.; Christodoulou, J.; Clarke, A.J.; Bahi-Buisson, N.; Leonard, H.; Bailey, M.E.; Schanen, N.C.; Zappella, M.; et al. Rett syndrome: Revised diagnostic criteria and nomenclature. Ann. Neurol. 2010, 68, 944–950. [Google Scholar] [CrossRef] [PubMed] [Green Version]
  25. Colak, D.; Al-Dhalaan, H.; Nester, M.; Albakheet, A.; Al-Younes, B.; Al-Hassnan, Z.; Al-Dosari, M.; Chedrawi, A.; Al-Owain, M.; Abudheim, N.; et al. Genomic and transcriptomic analyses distinguish classic Rett and Rett-like syndrome and reveals shared altered pathways. Genomics 2011, 97, 19–28. [Google Scholar] [CrossRef] [PubMed] [Green Version]
  26. De Felice, C.; Leoncini, S.; Signorini, C.; Cortelazzo, A.; Rovero, P.; Durand, T.; Ciccoli, L.; Papini, A.M.; Hayek, J. Rett syndrome: An autoimmune disease? Autoimmun. Rev. 2016, 15, 411–416. [Google Scholar] [CrossRef] [PubMed]
  27. Shulyakova, N.; Andreazza, A.C.; Mills, L.R.; Eubanks, J.H. Mitochondrial Dysfunction in the Pathogenesis of Rett Syndrome: Implications for Mitochondria-Targeted Therapies. Front. Cell Neurosci. 2017, 11, 58. [Google Scholar] [CrossRef] [Green Version]
  28. Ip, J.P.K.; Mellios, N.; Sur, M. Rett syndrome: Insights into genetic, molecular and circuit mechanisms. Nat. Rev. Neurosci. 2018, 19, 368–382. [Google Scholar] [CrossRef]
  29. Jorge-Torres, O.C.; Szczesna, K.; Roa, L.; Casal, C.; Gonzalez-Somermeyer, L.; Soler, M.; Velasco, C.D.; Martinez-San Segundo, P.; Petazzi, P.; Saez, M.A.; et al. Inhibition of Gsk3b Reduces Nfkb1 Signaling and Rescues Synaptic Activity to Improve the Rett Syndrome Phenotype in Mecp2-Knockout Mice. Cell Rep. 2018, 23, 1665–1677. [Google Scholar] [CrossRef] [Green Version]
  30. Kishi, N.; MacDonald, J.L.; Ye, J.; Molyneaux, B.J.; Azim, E.; Macklis, J.D. Reduction of aberrant NF-kappaB signalling ameliorates Rett syndrome phenotypes in Mecp2-null mice. Nat. Commun. 2016, 7, 10520. [Google Scholar] [CrossRef] [Green Version]
  31. Leonard, H.; Cobb, S.; Downs, J. Clinical and biological progress over 50 years in Rett syndrome. Nat. Rev. Neurol. 2017, 13, 37–51. [Google Scholar] [CrossRef] [PubMed] [Green Version]
  32. Hou, W.; Bhattacharya, U.; Pradana, W.A.; Tarquinio, D.C. Assessment of a Clinical Trial Metric for Rett Syndrome: Critical Analysis of the Rett Syndrome Behavioural Questionnaire. Pediatric Neurol. 2020, 107, 48–56. [Google Scholar] [CrossRef] [PubMed]
  33. Cortez, M.A.; Calin, G.A. MicroRNA identification in plasma and serum: A new tool to diagnose and monitor diseases. Expert Opin. Biol. Ther. 2009, 9, 703–711. [Google Scholar] [CrossRef] [PubMed]
  34. Terrinoni, A.; Calabrese, C.; Basso, D.; Aita, A.; Caporali, S.; Plebani, M.; Bernardini, S. The circulating miRNAs as diagnostic and prognostic markers. Clin. Chem. Lab. Med. 2019, 57, 932–953. [Google Scholar] [CrossRef] [Green Version]
  35. Beveridge, N.J.; Cairns, M.J. MicroRNA dysregulation in schizophrenia. Neurobiol. Dis. 2012, 46, 263–271. [Google Scholar] [CrossRef] [Green Version]
  36. Wu, H.; Tao, J.; Chen, P.J.; Shahab, A.; Ge, W.; Hart, R.P.; Ruan, X.; Ruan, Y.; Sun, Y.E. Genome-wide analysis reveals methyl-CpG-binding protein 2-dependent regulation of microRNAs in a mouse model of Rett syndrome. Proc. Natl. Acad. Sci. USA 2010, 107, 18161–18166. [Google Scholar] [CrossRef] [Green Version]
  37. Bai, M.; Zhu, X.; Zhang, Y.; Zhang, S.; Zhang, L.; Xue, L.; Yi, J.; Yao, S.; Zhang, X. Abnormal hippocampal BDNF and miR-16 expression is associated with depression-like behaviors induced by stress during early life. PLoS ONE 2012, 7, e46921. [Google Scholar] [CrossRef]
  38. Han, K.; Gennarino, V.A.; Lee, Y.; Pang, K.; Hashimoto-Torii, K.; Choufani, S.; Raju, C.S.; Oldham, M.C.; Weksberg, R.; Rakic, P.; et al. Human-specific regulation of MeCP2 levels in fetal brains by microRNA miR-483-5p. Genes Dev. 2013, 27, 485–490. [Google Scholar] [CrossRef] [Green Version]
  39. Vo, N.; Klein, M.E.; Varlamova, O.; Keller, D.M.; Yamamoto, T.; Goodman, R.H.; Impey, S. A cAMP-response element binding protein-induced microRNA regulates neuronal morphogenesis. Proc. Natl. Acad. Sci. USA 2005, 102, 16426–16431. [Google Scholar] [CrossRef] [Green Version]
  40. Huang, Y.W.; Ruiz, C.R.; Eyler, E.C.; Lin, K.; Meffert, M.K. Dual regulation of miRNA biogenesis generates target specificity in neurotrophin-induced protein synthesis. Cell 2012, 148, 933–946. [Google Scholar] [CrossRef] [Green Version]
  41. Lyu, J.W.; Yuan, B.; Cheng, T.L.; Qiu, Z.L.; Zhou, W.H. Reciprocal regulation of autism-related genes MeCP2 and PTEN via microRNAs. Sci. Rep. 2016, 6, 20392. [Google Scholar] [CrossRef] [PubMed] [Green Version]
  42. GEO—Gene expression Omnibus. Available online: https://www.ncbi.nlm.nih.gov/geo/query/acc.cgi?acc=GSE6955 (accessed on 17 December 2020).
  43. Zanutto, S.; Pizzamiglio, S.; Ghilotti, M.; Bertan, C.; Ravagnani, F.; Perrone, F.; Leo, E.; Pilotti, S.; Verderio, P.; Gariboldi, M.; et al. Circulating miR-378 in plasma: A reliable, haemolysis-independent biomarker for colorectal cancer. Br. J. Cancer 2014, 110, 1001–1007. [Google Scholar] [CrossRef] [PubMed]
  44. Deng, Y.; Zhu, Y.; Wang, H.; Khadka, V.S.; Hu, L.; Ai, J.; Dou, Y.; Li, Y.; Dai, S.; Mason, C.E.; et al. Ratio-Based Method To Identify True Biomarkers by Normalizing Circulating ncRNA Sequencing and Quantitative PCR Data. Anal. Chem. 2019, 91, 6746–6753. [Google Scholar] [CrossRef] [PubMed]
  45. Xiol, C.; Vidal, S.; Pascual-Alonso, A.; Blasco, L.; Brandi, N.; Pacheco, P.; Gerotina, E.; O’Callaghan, M.; Pineda, M.; Armstrong, J.; et al. X chromosome inactivation does not necessarily determine the severity of the phenotype in Rett syndrome patients. Sci. Rep. 2019, 9, 11983. [Google Scholar] [CrossRef]
  46. Orlic-Milacic, M.; Kaufman, L.; Mikhailov, A.; Cheung, A.Y.; Mahmood, H.; Ellis, J.; Gianakopoulos, P.J.; Minassian, B.A.; Vincent, J.B. Over-expression of either MECP2_e1 or MECP2_e2 in neuronally differentiated cells results in different patterns of gene expression. PLoS ONE 2014, 9, e91742. [Google Scholar] [CrossRef]
  47. Sheinerman, K.; Djukic, A.; Tsivinsky, V.G.; Umansky, S.R. Brain-enriched microRNAs circulating in plasma as novel biomarkers for Rett syndrome. PLoS ONE 2019, 14, e0218623. [Google Scholar] [CrossRef] [Green Version]
  48. Kaufmann, W.E.; Jarrar, M.H.; Wang, J.S.; Lee, Y.J.; Reddy, S.; Bibat, G.; Naidu, S. Histone modifications in Rett syndrome lymphocytes: A preliminary evaluation. Brain Dev. 2005, 27, 331–339. [Google Scholar] [CrossRef]
  49. Cosentino, L.; Vigli, D.; Franchi, F.; Laviola, G.; De Filippis, B. Rett syndrome before regression: A time window of overlooked opportunities for diagnosis and intervention. Neurosci. Biobehav. Rev. 2019, 107, 115–135. [Google Scholar] [CrossRef]
  50. Glinge, C.; Clauss, S.; Boddum, K.; Jabbari, R.; Jabbari, J.; Risgaard, B.; Tomsits, P.; Hildebrand, B.; Kaab, S.; Wakili, R.; et al. Stability of Circulating Blood-Based MicroRNAs—Pre-Analytic Methodological Considerations. PLoS ONE 2017, 12, e0167969. [Google Scholar] [CrossRef]
  51. He, K.; Guo, C.; He, L.; Shi, Y. MiRNAs of peripheral blood as the biomarker of schizophrenia. Hereditas 2018, 155, 9. [Google Scholar] [CrossRef]
  52. Chahine, L.M.; Stern, M.B.; Chen-Plotkin, A. Blood-based biomarkers for Parkinson’s disease. Parkinsonism Relat. Disord. 2014, 20 (Suppl. 1), S99–S103. [Google Scholar] [CrossRef] [Green Version]
  53. Lee, R.C.; Feinbaum, R.L.; Ambros, V. The C. elegans heterochronic gene lin-4 encodes small RNAs with antisense complementarity to lin-14. Cell 1993, 75, 843–854. [Google Scholar] [CrossRef]
  54. Schratt, G.M.; Tuebing, F.; Nigh, E.A.; Kane, C.G.; Sabatini, M.E.; Kiebler, M.; Greenberg, M.E. A brain-specific microRNA regulates dendritic spine development. Nature 2006, 439, 283–289. [Google Scholar] [CrossRef] [PubMed]
  55. Bonev, B.; Pisco, A.; Papalopulu, N. MicroRNA-9 reveals regional diversity of neural progenitors along the anterior-posterior axis. Dev. Cell 2011, 20, 19–32. [Google Scholar] [CrossRef] [PubMed]
  56. Lai, C.Y.; Wu, Y.T.; Yu, S.L.; Yu, Y.H.; Lee, S.Y.; Liu, C.M.; Hsieh, W.S.; Hwu, H.G.; Chen, P.C.; Jeng, S.F.; et al. Modulated expression of human peripheral blood microRNAs from infancy to adulthood and its role in aging. Aging Cell 2014, 13, 679–689. [Google Scholar] [CrossRef] [PubMed]
  57. Mellios, N.; Woodson, J.; Garcia, R.I.; Crawford, B.; Sharma, J.; Sheridan, S.D.; Haggarty, S.J.; Sur, M. beta2-Adrenergic receptor agonist ameliorates phenotypes and corrects microRNA-mediated IGF1 deficits in a mouse model of Rett syndrome. Proc. Natl. Acad. Sci. USA 2014, 111, 9947–9952. [Google Scholar] [CrossRef] [PubMed] [Green Version]
  58. Paco, S.; Casserras, T.; Rodriguez, M.A.; Jou, C.; Puigdelloses, M.; Ortez, C.I.; Diaz-Manera, J.; Gallardo, E.; Colomer, J.; Nascimento, A.; et al. Transcriptome Analysis of Ullrich Congenital Muscular Dystrophy Fibroblasts Reveals a Disease Extracellular Matrix Signature and Key Molecular Regulators. PLoS ONE 2015, 10, e0145107. [Google Scholar] [CrossRef] [Green Version]
  59. An, T.; Fan, T.; Zhang, X.Q.; Liu, Y.F.; Huang, J.; Liang, C.; Lv, B.H.; Wang, Y.Q.; Zhao, X.G.; Liu, J.X.; et al. Comparison of Alterations in miRNA Expression in Matched Tissue and Blood Samples during Spinal Cord Glioma Progression. Sci. Rep. 2019, 9, 9169. [Google Scholar] [CrossRef] [Green Version]
  60. Shah, R.; Tanriverdi, K.; Levy, D.; Larson, M.; Gerstein, M.; Mick, E.; Rozowsky, J.; Kitchen, R.; Murthy, V.; Mikalev, E.; et al. Discordant Expression of Circulating microRNA from Cellular and Extracellular Sources. PLoS ONE 2016, 11, e0153691. [Google Scholar] [CrossRef] [Green Version]
  61. Lewin, G.R.; Barde, Y.A. Physiology of the neurotrophins. Annu. Rev. Neurosci. 1996, 19, 289–317. [Google Scholar] [CrossRef]
  62. Huang, E.J.; Reichardt, L.F. Neurotrophins: Roles in neuronal development and function. Annu. Rev. Neurosci. 2001, 24, 677–736. [Google Scholar] [CrossRef] [PubMed] [Green Version]
  63. Bibel, M.; Barde, Y.A. Neurotrophins: Key regulators of cell fate and cell shape in the vertebrate nervous system. Genes Dev. 2000, 14, 2919–2937. [Google Scholar] [CrossRef] [PubMed] [Green Version]
  64. Kaplan, D.R.; Miller, F.D. Neurotrophin signal transduction in the nervous system. Curr. Opin. Neurobiol. 2000, 10, 381–391. [Google Scholar] [CrossRef]
  65. Li, W.; Pozzo-Miller, L. BDNF deregulation in Rett syndrome. Neuropharmacology 2014, 76 Pt C, 737–746. [Google Scholar] [CrossRef] [Green Version]
  66. Fu, Y.; Hou, B.; Weng, C.; Liu, W.; Dai, J.; Zhao, C.; Yin, Z.Q. Functional ectopic neuritogenesis by retinal rod bipolar cells is regulated by miR-125b-5p during retinal remodeling in RCS rats. Sci. Rep. 2017, 7, 1011. [Google Scholar] [CrossRef] [PubMed] [Green Version]
  67. Burak, K.; Lamoureux, L.; Boese, A.; Majer, A.; Saba, R.; Niu, Y.; Frost, K.; Booth, S.A. MicroRNA-16 targets mRNA involved in neurite extension and branching in hippocampal neurons during presymptomatic prion disease. Neurobiol. Dis. 2018, 112, 1–13. [Google Scholar] [CrossRef]
  68. Zhu, H.; Shyh-Chang, N.; Segre, A.V.; Shinoda, G.; Shah, S.P.; Einhorn, W.S.; Takeuchi, A.; Engreitz, J.M.; Hagan, J.P.; Kharas, M.G.; et al. The Lin28/let-7 axis regulates glucose metabolism. Cell 2011, 147, 81–94. [Google Scholar] [CrossRef] [Green Version]
  69. Iliopoulos, D.; Hirsch, H.A.; Struhl, K. An epigenetic switch involving NF-kappaB, Lin28, Let-7 MicroRNA, and IL6 links inflammation to cell transformation. Cell 2009, 139, 693–706. [Google Scholar] [CrossRef] [Green Version]
  70. Shyh-Chang, N.; Daley, G.Q. Lin28: Primal regulator of growth and metabolism in stem cells. Cell Stem Cell 2013, 12, 395–406. [Google Scholar] [CrossRef] [Green Version]
  71. Heo, I.; Joo, C.; Cho, J.; Ha, M.; Han, J.; Kim, V.N. Lin28 mediates the terminal uridylation of let-7 precursor MicroRNA. Mol. Cell 2008, 32, 276–284. [Google Scholar] [CrossRef]
  72. Heo, I.; Joo, C.; Kim, Y.K.; Ha, M.; Yoon, M.J.; Cho, J.; Yeom, K.H.; Han, J.; Kim, V.N. TUT4 in concert with Lin28 suppresses microRNA biogenesis through pre-microRNA uridylation. Cell 2009, 138, 696–708. [Google Scholar] [CrossRef] [PubMed] [Green Version]
  73. Nam, Y.; Chen, C.; Gregory, R.I.; Chou, J.J.; Sliz, P. Molecular basis for interaction of let-7 microRNAs with Lin28. Cell 2011, 147, 1080–1091. [Google Scholar] [CrossRef] [PubMed] [Green Version]
  74. Juhila, J.; Sipila, T.; Icay, K.; Nicorici, D.; Ellonen, P.; Kallio, A.; Korpelainen, E.; Greco, D.; Hovatta, I. MicroRNA expression profiling reveals miRNA families regulating specific biological pathways in mouse frontal cortex and hippocampus. PLoS ONE 2011, 6, e21495. [Google Scholar] [CrossRef] [PubMed]
  75. Shinohara, Y.; Yahagi, K.; Kawano, M.; Nishiyori, H.; Kawazu, C.; Suzuki, N.; Manabe, R.; Hirase, H. miRNA profiling of bilateral rat hippocampal CA3 by deep sequencing. Biochem. Biophys. Res. Commun. 2011, 409, 293–298. [Google Scholar] [CrossRef] [PubMed]
  76. Moss, E.G.; Lee, R.C.; Ambros, V. The cold shock domain protein LIN-28 controls developmental timing in C. elegans and is regulated by the lin-4 RNA. Cell 1997, 88, 637–646. [Google Scholar] [CrossRef] [Green Version]
  77. Olde Loohuis, N.F.; Kos, A.; Martens, G.J.; Van Bokhoven, H.; Nadif Kasri, N.; Aschrafi, A. MicroRNA networks direct neuronal development and plasticity. Cell. Mol. Life Sci. CMLS 2012, 69, 89–102. [Google Scholar] [CrossRef] [PubMed] [Green Version]
  78. Newman, M.A.; Thomson, J.M.; Hammond, S.M. Lin-28 interaction with the Let-7 precursor loop mediates regulated microRNA processing. RNA 2008, 14, 1539–1549. [Google Scholar] [CrossRef] [Green Version]
  79. Yang, M.; Yang, S.L.; Herrlinger, S.; Liang, C.; Dzieciatkowska, M.; Hansen, K.C.; Desai, R.; Nagy, A.; Niswander, L.; Moss, E.G.; et al. Lin28 promotes the proliferative capacity of neural progenitor cells in brain development. Development 2015, 142, 1616–1627. [Google Scholar] [CrossRef] [Green Version]
  80. Polesskaya, A.; Cuvellier, S.; Naguibneva, I.; Duquet, A.; Moss, E.G.; Harel-Bellan, A. Lin-28 binds IGF-2 mRNA and participates in skeletal myogenesis by increasing translation efficiency. Genes Dev. 2007, 21, 1125–1138. [Google Scholar] [CrossRef] [Green Version]
  81. Shenoy, A.; Danial, M.; Blelloch, R.H. Let-7 and miR-125 cooperate to prime progenitors for astrogliogenesis. EMBO J. 2015, 34, 1180–1194. [Google Scholar] [CrossRef] [Green Version]
  82. miRTarBase. Available online: http://miRTarBAse.cuhk.edu.cn (accessed on 17 December 2020).
  83. Liu, M.; Roth, A.; Yu, M.; Morris, R.; Bersani, F.; Rivera, M.N.; Lu, J.; Shioda, T.; Vasudevan, S.; Ramaswamy, S.; et al. The IGF2 intronic miR-483 selectively enhances transcription from IGF2 fetal promoters and enhances tumorigenesis. Genes Dev. 2013, 27, 2543–2548. [Google Scholar] [CrossRef] [PubMed] [Green Version]
  84. Vahdatpour, C.; Dyer, A.H.; Tropea, D. Insulin-Like Growth Factor 1 and Related Compounds in the Treatment of Childhood-Onset Neurodevelopmental Disorders. Front. Neurosci. 2016, 10, 450. [Google Scholar] [CrossRef] [PubMed] [Green Version]
  85. Khwaja, O.S.; Ho, E.; Barnes, K.V.; O’Leary, H.M.; Pereira, L.M.; Finkelstein, Y.; Nelson, C.A., 3rd; Vogel-Farley, V.; DeGregorio, G.; Holm, I.A.; et al. Safety, pharmacokinetics, and preliminary assessment of efficacy of mecasermin (recombinant human IGF-1) for the treatment of Rett syndrome. Proc. Natl. Acad. Sci. USA 2014, 111, 4596–4601. [Google Scholar] [CrossRef] [PubMed] [Green Version]
  86. Riikonen, R. Treatment of autistic spectrum disorder with insulin-like growth factors. Eur. J. Paediatr. Neurol. EJPN Off. J. Eur. Paediatr. Neurol. Soc. 2016, 20, 816–823. [Google Scholar] [CrossRef] [PubMed]
  87. Pitcher, M.R.; Ward, C.S.; Arvide, E.M.; Chapleau, C.A.; Pozzo-Miller, L.; Hoeflich, A.; Sivaramakrishnan, M.; Saenger, S.; Metzger, F.; Neul, J.L. Insulinotropic treatments exacerbate metabolic syndrome in mice lacking MeCP2 function. Hum. Mol. Genet. 2013, 22, 2626–2633. [Google Scholar] [CrossRef] [PubMed] [Green Version]
  88. Hagberg, B. Clinical manifestations and stages of Rett syndrome. Ment. Retard. Dev. Disabil. Res. Rev. 2002, 8, 61–65. [Google Scholar] [CrossRef] [PubMed]
  89. Tarquinio, D.C.; Motil, K.J.; Hou, W.; Lee, H.S.; Glaze, D.G.; Skinner, S.A.; Neul, J.L.; Annese, F.; McNair, L.; Barrish, J.O.; et al. Growth failure and outcome in Rett syndrome: Specific growth references. Neurology. 2012, 79, 1653–1661. [Google Scholar] [CrossRef] [PubMed] [Green Version]
  90. Huang, F.; Long, Z.; Chen, Z.; Li, J.; Hu, Z.; Qiu, R.; Zhuang, W.; Tang, B.; Xia, K.; Jiang, H. Investigation of Gene Regulatory Networks Associated with Autism Spectrum Disorder Based on MiRNA Expression in China. PLoS ONE 2015, 10, e0129052. [Google Scholar] [CrossRef] [PubMed] [Green Version]
  91. Cortelazzo, A.; De Felice, C.; De Filippis, B.; Ricceri, L.; Laviola, G.; Leoncini, S.; Signorini, C.; Pescaglini, M.; Guerranti, R.; Timperio, A.M.; et al. Persistent Unresolved Inflammation in the Mecp2-308 Female Mutated Mouse Model of Rett Syndrome. Mediat. Inflamm. 2017, 2017, 9467819. [Google Scholar] [CrossRef] [Green Version]
  92. Cortelazzo, A.; De Felice, C.; Guerranti, R.; Signorini, C.; Leoncini, S.; Pecorelli, A.; Zollo, G.; Landi, C.; Valacchi, G.; Ciccoli, L.; et al. Subclinical inflammatory status in Rett syndrome. Mediat. Inflamm. 2014, 2014, 480980. [Google Scholar] [CrossRef]
  93. O’Driscoll, C.M.; Lima, M.P.; Kaufmann, W.E.; Bressler, J.P. Methyl CpG binding protein 2 deficiency enhances expression of inflammatory cytokines by sustaining NF-kappaB signaling in myeloid derived cells. J. Neuroimmunol. 2015, 283, 23–29. [Google Scholar] [CrossRef] [PubMed]
  94. Pascual-Alonso, A.; Blasco, L.; Vidal, S.; Gean, E.; Rubio, P.; O’Callaghan, M.; Martinez-Monseny, A.F.; Castells, A.A.; Xiol, C.; Catala, V.; et al. Molecular characterization of Spanish patients with MECP2 duplication syndrome. Clin. Genet. 2020, 97, 610–620. [Google Scholar] [CrossRef] [PubMed]
  95. Ma, X.; Becker Buscaglia, L.E.; Barker, J.R.; Li, Y. MicroRNAs in NF-kappaB signaling. J. Mol. Cell Biol. 2011, 3, 159–166. [Google Scholar] [CrossRef] [PubMed]
  96. Geng, S.; Chen, K.; Yuan, R.; Peng, L.; Maitra, U.; Diao, N.; Chen, C.; Zhang, Y.; Hu, Y.; Qi, C.F.; et al. The persistence of low-grade inflammatory monocytes contributes to aggravated atherosclerosis. Nat. Commun. 2016, 7, 13436. [Google Scholar] [CrossRef] [PubMed]
  97. Kobayashi, K.; Hernandez, L.D.; Galan, J.E.; Janeway, C.A., Jr.; Medzhitov, R.; Flavell, R.A. IRAK-M is a negative regulator of Toll-like receptor signaling. Cell 2002, 110, 191–202. [Google Scholar] [CrossRef] [Green Version]
  98. Kim, S.W.; Ramasamy, K.; Bouamar, H.; Lin, A.P.; Jiang, D.; Aguiar, R.C. MicroRNAs miR-125a and miR-125b constitutively activate the NF-kappaB pathway by targeting the tumor necrosis factor alpha-induced protein 3 (TNFAIP3, A20). Proc. Natl. Acad. Sci. USA 2012, 109, 7865–7870. [Google Scholar] [CrossRef] [Green Version]
  99. Tian, T.; Zhou, Y.; Feng, X.; Ye, S.; Wang, H.; Wu, W.; Tan, W.; Yu, C.; Hu, J.; Zheng, R.; et al. MicroRNA-16 is putatively involved in the NF-kappaB pathway regulation in ulcerative colitis through adenosine A2a receptor (A2aAR) mRNA targeting. Sci. Rep. 2016, 6, 30824. [Google Scholar] [CrossRef]
  100. Lopez, J.P.; Fiori, L.M.; Cruceanu, C.; Lin, R.; Labonte, B.; Cates, H.M.; Heller, E.A.; Vialou, V.; Ku, S.M.; Gerald, C.; et al. MicroRNAs 146a/b-5 and 425-3p and 24-3p are markers of antidepressant response and regulate MAPK/Wnt-system genes. Nat. Commun. 2017, 8, 15497. [Google Scholar] [CrossRef] [Green Version]
  101. Adams, J.C.; Lawler, J. The thrombospondins. Cold Spring Harb. Perspect. Biol. 2011, 3, a009712. [Google Scholar] [CrossRef]
  102. Garcia, O.; Torres, M.; Helguera, P.; Coskun, P.; Busciglio, J. A role for thrombospondin-1 deficits in astrocyte-mediated spine and synaptic pathology in Down’s syndrome. PLoS ONE 2010, 5, e14200. [Google Scholar] [CrossRef] [Green Version]
  103. Cheng, C.; Lau, S.K.; Doering, L.C. Astrocyte-secreted thrombospondin-1 modulates synapse and spine defects in the fragile X mouse model. Mol. Brain 2016, 9, 74. [Google Scholar] [CrossRef] [PubMed] [Green Version]
  104. Bauman, M.L.; Kemper, T.L.; Arin, D.M. Microscopic observations of the brain in Rett syndrome. Neuropediatrics 1995, 26, 105–108. [Google Scholar] [CrossRef] [PubMed]
  105. Belichenko, N.P.; Belichenko, P.V.; Mobley, W.C. Evidence for both neuronal cell autonomous and nonautonomous effects of methyl-CpG-binding protein 2 in the cerebral cortex of female mice with Mecp2 mutation. Neurobiol. Dis. 2009, 34, 71–77. [Google Scholar] [CrossRef] [PubMed]
  106. Belichenko, P.V.; Wright, E.E.; Belichenko, N.P.; Masliah, E.; Li, H.H.; Mobley, W.C.; Francke, U. Widespread changes in dendritic and axonal morphology in Mecp2-mutant mouse models of Rett syndrome: Evidence for disruption of neuronal networks. J. Comp. Neurol. 2009, 514, 240–258. [Google Scholar] [CrossRef]
  107. Dogar, A.M.; Semplicio, G.; Guennewig, B.; Hall, J. Multiple microRNAs derived from chemically synthesized precursors regulate thrombospondin 1 expression. Nucleic Acid. Ther. 2014, 24, 149–159. [Google Scholar] [CrossRef] [PubMed] [Green Version]
  108. Castells, A.A.; Gueraldi, D.; Balada, R.; Tristan-Noguero, A.; Cortes-Saladelafont, E.; Ramos, F.; Meavilla, S.; De Los Santos, M.; Garcia-Volpe, C.; Colome, R.; et al. Discovery of Biomarker Panels for Neural Dysfunction in Inborn Errors of Amino Acid Metabolism. Sci. Rep. 2019, 9, 9128. [Google Scholar] [CrossRef]
  109. Lioy, D.T.; Garg, S.K.; Monaghan, C.E.; Raber, J.; Foust, K.D.; Kaspar, B.K.; Hirrlinger, P.G.; Kirchhoff, F.; Bissonnette, J.M.; Ballas, N.; et al. A role for glia in the progression of Rett’s syndrome. Nature 2011, 475, 497–500. [Google Scholar] [CrossRef]
  110. Wang, S.; Zhou, H.; Wu, D.; Ni, H.; Chen, Z.; Chen, C.; Xiang, Y.; Dai, K.; Chen, X.; Li, X. MicroRNA let-7a regulates angiogenesis by targeting TGFBR3 mRNA. J. Cell Mol. Med. 2019, 23, 556–567. [Google Scholar] [CrossRef] [Green Version]
  111. Sun, L.L.; Li, W.D.; Lei, F.R.; Li, X.Q. The regulatory role of microRNAs in angiogenesis-related diseases. J. Cell Mol. Med. 2018, 22, 4568–4587. [Google Scholar] [CrossRef] [Green Version]
  112. Che, F.; Du, H.; Zhang, W.; Cheng, Z.; Tong, Y. MicroRNA-132 modifies angiogenesis in patients with ischemic cerebrovascular disease by suppressing the NFkappaB and VEGF pathway. Mol. Med. Rep. 2018, 17, 2724–2730. [Google Scholar] [CrossRef] [Green Version]
Figure 1. Potential mRNA biomarkers for Rett Syndrome (RTT) detection. (A) Graphs showing changes in mRNA expression of LIN28A and THBS3 between controls and RTT patients. (B) Changes in IRAK1 expression between controls and RTT patients in two age groups (<15 years, >15 years). (C) Heat map of Spearman correlation between gene expressions in whole blood; 1 is positive correlation, 0 no correlation and −1 is negative correlation. Statistically significant correlations (p < 0.05) are black boxed. (D) Receiver operating characteristic (ROC) curves for the candidate genes and their combinations assessing biomarker performance for RTT. (E) Graph showing changes in Brain-Derived Neurotrophic Factor (BDNF) protein dosage regarding methyl-CpG-binding protein 2 (MECP2) mutation type and ROC curve assessing biomarker performance. * p < 0.05, *** p < 0.001 significant differences Mann–Whitney U test.
Biomedicines 09 00148 g001
Figure 2. Potential microRNA (miRNA) biomarkers for RTT detection. (A) Heat map of Spearman correlation between miRNA expressions in plasma; 1 is positive correlation, 0 no correlation and −1 is negative correlation. Statistically significant correlations (p < 0.05) are black boxed. (B) Graph showing changes in miR-483-5p/miR-16-5p expression with age. (C) Graphs showing changes in expression of Let-7a-5p/miR-132-3p, miR-24-3p/miR-132-3p and miR-146a-5p/miR-132-3p between controls and RTT patients, and ROC curves assessing biomarker performance. (D) Graphs showing changes in expression of Let-7a-5p/miR-132-3p, miR-24-3p/miR-132-3p and miR-146a-5p/miR-132-3p between controls and RTT patients over 15 years old and ROC curves assessing biomarker performance. miRNA ratio data presented as 2Δct. * p < 0.05, ** p < 0.01 significant differences Mann–Whitney U test.
Biomedicines 09 00148 g002
Figure 3. Potential biomarkers for RTT stratification. (A) Graphs and ROC curves of Let-7a-5p/miR-125b-5p, Let-7a-5p/miR-16-5p, miR-146a-5p/miR-132-3p and their combination for detecting microcephaly. (B) Graphs and ROC curve of miR-146a-5p/miR-132-3p, Let-7a-5p/miR-16-5p, miR-132-3p/miR-16-5p, miR-24-3p/miR-16-5p and their combination for detecting vasomotor deficits. miRNA ratio data presented as 2Δct. * p < 0.05 significant difference with respect to controls; # p < 0.05 significant differences with respect to RTT patients without the symptom, Kruskal–Wallis test with the Bonferroni correction.
Biomedicines 09 00148 g003
Figure 4. Validation of selected miRNA biomarkers in fibroblasts primary cultures. Graphs showing changes in miR-146a-5p/miR-132-3p, miR-24-3p/miR-132-3p and Let-7a-5p/miR-132-3p between control and RTT fibroblasts, and ROC curves showing biomarker performance. miRNA ratio data presented as 2Δct. * p < 0.05, ** p < 0.01 significant difference with respect to controls.
Biomedicines 09 00148 g004
Figure 5. Diagram of the proposed principal signaling pathways involved in RTT. Continuous line for direct effect and dotted line for multistep signaling.
Biomedicines 09 00148 g005
Table 1. Clinical and genetic characteristics of the patients.
PatientAge (y)SexMeCP2 Mutation/DuplicationICXAge First Sign in MonthsMicrocephalySitting AloneAmbulationLanguageEpilepsy (y)Respiratory FunctionHands UseOnset of Stereotypies (m)Score (y)Kyphoscoliosis (y)Growth FailurePeripheral Vasomotor Deficits (y)Bowel Control (y)
119Fc.916C>T (p.R306C) (MS)63:3712–24YesYesAcquired < 18 monthsLostControlled (8)HyperventilationPartially conserved18–368 (18.5)NoYesYes (6)Yes (9,33)
232Fdeletion exon 1&2 (NS)73:270–12YesSeat & lostNeverNeverControlled (0.42)ApneaLost>3613 (23.9)Yes (10)NoYes (6)No
37Fc.473C>T (p.T158M) (MS)64:3612–24YesYesAcquired < 30 monthsLostControlled (7)HyperventilationLost>368 (13.7)Yes (5,75)YesYes (7)No
416Fc.473C>T (p.T158M) (MS)67:330–12YesYesAcquired < 18 monthsLostControlledHyperventilationLost18–368 (2.2)NoYesYes (6)No
523Fc.473C>T (p.T158M) (MS)77:230–12YesYesLostNeverRefractory (2)HyperventilationLost<1814 (6.3)Yes (6)-Yes (3,5)No
633Fc.916C>T (p.R306C) (MS)79:210–12YesYesAcquired > 30 monthsNeverControlled (8)Hyperventilation + apneaLost>3610 (23.7)Yes (9)YesYes (9)No
728Fc.763C>T (p.R255X) (NS)73:270–12YesYesLostLostRefractory (7)HyperventilationLost18–3614 (19.5)Yes (12)YesYes (10)No
825Fc.880C>T (p.R294X) (NS)59:4112–24YesYesAcquired < 30 monthsLostControlled (6)HyperventilationLost18–3611 (22.1)Yes (9)YesNoNo
910Fc.473C>T (p.T158M) (MS)65:350–12YesSeat & lostLostNeverControlled (5)HyperventilationNever<1811(9.1)NoNoYes (5)No
1014Fdeletion exon 3&4 (NS)62:380–12NoYesAcquired < 18 monthsLostControlled (4.5)HyperventilationLost18–367 (13)NoNoNoYes (5)
1111Fc.808C>T (p.R270X) (NS)88:120–12YesYesAcquired < 18 monthsConservedControlled (3,25)HyperventilationPartially conserved>367(3.5)No-NoNo
1215Fc.961_1188delins220 (p.K321G fs X6) (NS)68:32>24NoYesAcquired <18 monthsLostNoNo dysfunctionPartially conserved>365 (14.7)Yes (14)NoNoYes (5,75)
1316Fc.916C>T (p.R306C) (MS)78:22>24NoYesAcquired < 18 monthsConservedNoNo dysfunctionLost>363 (4.7)No-NoNo
1413Fc.1189G>T (p.Q397X) (NS)68:3212–24NoYesAcquired < 18 monthsLostNoNo dysfunctionLost18–365 (5.2)NoNoNoNo
1516Fc.276_281del4 (p.P93fs) (N)81:1912–24YesYesLostLostControlled (3)HyperventilationLost18–368 (15.1)NoNoYes (6)No
165Fc.473C>T (p.T158M) (MS)70:300–12YesYesLostLostRefractory (3)HyperventilationLost<1812 (4.6)Yes (2)NoYes (4)Yes (4)
175Fc.808C>T (p.R270X) (NS)52:480–12YesYesNeverLostControlled (2)HyperventilationLost18–3615 (4.5)No-NoNo
188Fc.916C>T (p.R306C) (MS)66:340–12NoYesAcquired < 30 monthsConservedControlled (6)HyperventilationLost18–3610 (6.8)NoNoNoNo
198Fc.502C>T (p.R168X) (NS)54:460–12YesYesAcquired <18 monthsConservedControlled (5)No dysfunctionLost18–368 (7.2)NoNoYes (5)Yes (7)
208Fc.316C>T (p.R106W) (MS)59:410–12YesYesNeverNeverRefractory (3)HyperventilationLost<1815 (6.8)Yes (5)NoYes (4,5)No
211MDuplication chrX: 149116213–154929279-0–12NoNo-NeverYes (1)--<18-No--No
224MDuplication chrX: 153101077–153565901-0–12NoYesAcquired <18 monthsNeverYes (6)-Partially conserved<18-No---
23>30FDuplication chrX: 153101077–153565901-Asymptomatic-------------
(F) Female; (M) male; (MS) missense; (NS) nonsense; ICX: X chromosome inactivation; (y) years at onset or at score evaluation; (m) months; Score according to Monros et al., [23].
Table 2. Expression of mRNA in peripheral blood and BDNF protein in plasma.
Controls (n = 21)RTT (n= 16)MDS (n = 2)MDC (n = 1)
mRNA (RQ)
CACNA2D21.07 ± 0.36 [0.88–1.25]1.20 ± 0.62 [0.84–1.56]0.85 ± 0.551.37
DNMT11.03 ± 0.24 [0.91–1.15]1.11 ± 0.32 [0.94–1.28]1.17 ± 0.201.12
IRAK11.02 ± 0.21 [0.92–1.13]1.04 ± 0.24 [0.87–1.22]2.52 ± 0.25 *0.97
LIN28A1.28 ± 0.84 [0.89–1.68]0.73 ± 0.70 [0.34–1.12] *0.75 ± 0.021.33
MECP2 E11.04 ± 0.29 [0.89–1.20]1.78 ± 0.91 [1.02–2.54] *1.85 ± 0.38 *0.94
MECP2 E21.03 ± 0.26 [0.90–1.17]1.58 ± 0.87 [0.96–2.21] **1.71 ± 0.51 *1.01
PTEN1.04 ± 0.31 [0.87–1.22]0.91 ± 0.50 [0.55–1.27]0.84 ± 0.140.92
THBS11.22 ± 0.88 [0.76–1.67]1.67 ± 1.54 [0.81–2.52]1.22 ± 0.811.39
THBS31.02 ± 0.21 [0.91–1.13]1.46 ± 0.43 [1.21–1.71] ***0.87 ± 0.08-
Protein (ng/mL)
BDNF128.68 ± 87.25 [87.85–169-51]80.55 ± 50.55 [52.11–188.55]--
Results shown as mean ± standard deviation, [inferior-superior] 95% confidence interval. Statistically significant differences highlighted in bold. * p < 0.05, ** p < 0.01, *** p < 0.001 indicate significant differences with respect to the control group (Mann–Whitney U Test). RQ: relative quantification; MDC: MECP2 duplication carrier.
Table 3. BDNF and mRNA performance as RTT biomarkers.
AUCDEp Value95% CIJTrendn
RTT vs. Controls
THBS30.8400.0830.0010.678–10.72714 vs. 17
LIN28A0.7470.0870.0140.576–0.9170.46715 vs. 20
LIN28A + THBS30.8990.0570.00030.787–10.687 13 vs. 16
MECP2 mutation type (MS vs. NS)
BDNF0.8110.0990.0220.617–10.50010 vs. 9
AUC: area under the curve; DE: deviation error; CI: confidence interval; J: Youden index; NS: nonsense; MS: missense.
Table 4. Plasma miRNA ratios and performance as RTT biomarkers.
RatioFCp-ValueAUCp-Value95% CIJTrendn
RTT vs. Controls
miR-24-3p/miR-132-3p1.1432.2090.010.8440.0110.64–10.77810 vs. 9
miR-146a-5p/miR-132-3p1.0462.0650.0560.7580.0530.505–10.66711 vs. 9
Let-7a-5p/miR-132-3p0.741.6700.0670.7470.0630.495–10.68711 vs. 9
miR-24-3p/miR-132-3p + miR-146a-5p/miR-132-3p 0.90.0030.954–11 10 vs. 9
RTT vs. Controls >15 years
Let-7a-5p/miR-132-3p1.4712.7720.020.9380.0070.804–10.8756 vs. 8
miR-24-3p/miR-132-3p1.4532.7370.0050.9170.010.751–10.8756 vs. 8
miR-146a-5p/miR-132-3p1.6853.2140.0080.8750.020.671–10.756 vs. 8
FC: Fold Change; AUC: area under the curve; CI: confidence interval; J: Youden index.
Table 5. Plasma miRNA ratios and performance as RTT stratification biomarkers.
RatioFCp-ValueAUCp-Value95% CIJTrendn
Microcephaly (Yes vs. No)
Let-7a-5p/miR-125b-5p2.6936.4660.0250.9630.0210.857–10.8899 vs. 3
Let-7a-5p/miR-16-5p2.3975.2660.0220.9240.0290.779–10.81811 vs. 3
miR-146a-5p/miR-132-3p1.222.330.0030.9170.0410.731–10.7508 vs. 3
Any combination of two miRNA ratios 10.013–0.021–11
Vasomotor deficits (Yes vs. No)
miR-146a-5p/miR-132-3p1.4382.7090.0020.9640.0140.859–10.8577 vs. 4
Let-7a-5p/ miR-16-5p2.5015.6590.0040.9440.0080.827–10.7789 vs. 5
miR-132-3p /miR-16-5p1.1872.2780.0170.9330.0180.78–10.8336 vs. 5
miR-24-3p /miR-16-5p2.2444.7360.0190.8890.0200.713–10.6899 vs. 5
Let-7a-5p/miR-125b-5p2.2324.6960.040.8570.0420.638–10.7147 vs. 5
miR-16-5p/ miR-146a-5p-2.2660.2080.0420.8440.0390.623–10.7789 vs. 5
Let-7a-5p/ miR-16-5p + miR-146a-5p/miR-132-3p or miR-132-3p /miR-16-5p or Let-7a-5p/miR-125b-5p 10.004–0.0081–11
FC: Fold Change; AUC: area under the curve; CI: confidence interval; J: Youden index.
Table 6. Validation of potential miRNA biomarkers for RTT in fibroblasts primary cultures.
RatioFCp-ValueAUCp-Value95% CIJTrendn
RTT vs. Controls
miR-146a-5p/miR-132-3p−2.4610.1820.0040.9690.0110.876–10.8758 vs. 4
miR-24-3p/miR-132-3p−0.7190.6080.0270.8440.06170.612–10.6258 vs. 4
Let-7a-5p/miR-132-3p1.3882.6360.0860.8440.0620.617–10.758 vs. 4
FC: Fold Change; AUC: area under the curve; CI: confidence interval; J: Youden index.
Table 7. Summary of potential circulating miRNA biomarkers for RTT screening and stratification.
Trend
RTT
miR-24-3p/miR-132-3p + miR-146a-5p/miR-132-3p
Microcephaly
Let-7a-5p/miR-125b-5p + Let-7a-5p/miR-16-5p
Let-7a-5p/ miR-16-5p + miR-146a-5p/miR-132-3p
Let-7a-5p/miR-125b-5p + miR-146a-5p/miR-132-3p
Vasomotor deficits
Let-7a-5p/miR-16-5p + miR-132-3p/miR-16-5p
Publisher’s Note: MDPI stays neutral with regard to jurisdictional claims in published maps and institutional affiliations.

