Detecting Ethnic Spatial Distribution of Business People Using Machine Learning


1
Department of Informatics, The Graduate University for Advanced Studies, SOKENDAI, Tokyo 101-8430, Japan
2
Information and Society Research Division, National Institute of Informatics, Tokyo 101-8430, Japan
*
Authors to whom correspondence should be addressed.
Information 2020, 11(4), 197; https://doi.org/10.3390/info11040197
Submission received: 28 February 2020
/
Revised: 31 March 2020
/
Accepted: 4 April 2020
/
Published: 7 April 2020
(This article belongs to the Special Issue Application of Big Data for Computational Social Science (ABCSS2019 @ WI 2019))
Abstract
:The development of transportation and technology has spread human movements more quickly and widely. As a result, our societies are becoming more complex, composed of people of more diverse races, cultures, religions, and languages. In this study, we focus on the origins of ethnicity while analyzing the background of social members. To track the origin of the ethnicities of which a society is composed, we established a surname-nationality prediction model by learning from a Recurrent Neural Network (RNN) with data recorded by business peoples’ surnames and nationalities to predict nationality with high accuracy through surnames. This study is meaningful because it approaches the social scientific problems of ethnic composition within society through massive data and machine learning: the informatics approach.
1. Introduction
Research on ethnicity and race has been conducted and utilized in various fields, including in studies related to disease [1,2], learning achievement [3,4], and social crime [5,6]. Ethnicity is one characteristic of society that has a deep connection with various environmental and social problems. If the diversity of people continues to increase as population movements are activated, like in modern societies, efforts must be made to understand social phenomena through human attributes.
Nevertheless, concerns argue that ethnic and racial issues lead to discrimination. Thus, in such multi-ethnic countries as France, everyone with French nationality is defined as French. Although the United States is a leading multi-ethnic country, and despite its voluminous statistical data, there is no detailed classification of ethnicity other than aggregated statistics. In general, investigating the distribution of people is difficult through statistical surveys.
However, with increased computing power, studies are classifying races, ethnicities, and nationalities from name data using machine learning and statistical models. Name data contain a variety of information about individuals. First names often provide such information as gender and historical trends, cultural backgrounds, and nationality. Surnames provide information on the roots of the family system and the origin of ethnicity. Name data, which have a unique structure with ethnicity, historical, and national backgrounds, enable us to obtain and analyze various social information that cannot be found in statistical investigations.
Research that classifies nationality and ethnicity using name data has been carried out in biomedical study [7,8], sociology [9,10,11], demographics [12,13,14], and marketing [15,16]. However, an extensive type of name structure exists, and a limitation where only the names on lists can be classified by the simple method [17] that uses name and ethnic list data without changing them.
There are many approaches to classify ethnicity by name. Hidden Markov models and decision tree have categorized ethnic groups by name [18], using n-grams [14], by the Bayesian approach [19], with a support vector machine-based classification of gender [20], and a machine learning method [21]. Other studies analyzed the origin of surnames in French social groups using the Naïve Bayes method [22].
Based on the results of related studies on the classification of the name-origins of ethnicity, we applied the most efficient method. In other words, this study lacks a methodological discussion on the classification of the surname origin of ethnicity. In fact, in studies of the classification of the name-origin of ethnicity, various statistical methods have been studied. A typical method is n-gram. Comparing n-gram [23] with neural network methods, the predictions of neural networks are slightly higher, although room for debate exists whether that difference is significant. This paper adopts a method that estimates nationality from surnames by constructing a language model with a Recurrent Neural Network (RNN).
Recent studies that use surname data to classify nationalities, races, and ethnicities heavily focus on technical research that improves the predictive ability in the field of informatics. This study classifies the origin of ethnicity from surname data based on the research of classification prediction models in informatics. We built a classifier and applied it to the social science field to analyze how ethnic linkage is being affected in economic fields. In other words, this study provides a convergence of information science technology and a large-scale dataset for social science applications.
This study solves various problems in social science. Since some countries have complex ethnic and cultural compositions, conducting statistical surveys remains challenging, such as the African continent, the ethnic composition can be estimated solely from surname data. These estimates can be useful in other areas as well. The United States, a leading multiracial country, is divided into six broad races in its census data [24]. In France, French citizens are automatically defined as French citizens. Its unwillingness to divide the nation based on racial and ethnic composition stems from concerns over social discrimination, etc. However, in some cases, many groups are divided in society by ethnicity, language, religion, culture, etc. (i.e., racial segregation, ethnic conflict). Our study, which focused on the composition of the people to solve problems, offers an efficient solution.
We used a large-scale surname dataset of labeled nationalities as a training dataset. RNN method is used for building a classifier. First, we built a surname-origin of ethnicity classifier for 77 countries. We tested the predicted precision using Olympic athlete’s data, and human-labeled data. Next, we analyzed the spatial distribution of ethnic linkage using our method. We predicted the distribution of ethnicity of each country with surnames using our classifier, especially African and European countries. We calculated the similarities of each countries’ distribution of ethnicity using Jensen–Shannon Divergence (JSD). After that, we extracted the communities of ethnicity with the JSD value. Finally, we identified which regions show similar ethnic distributions through extracted communities.
The flow of this paper is as follows. Chapter 2 describes how the name-origin of our ethnicity classification model was built using a large-scale name dataset and machine learning. In chapter 3, we show result of the classification test. The ethnic influences in economic networks are analyzed through spatial visualization. Chapters 4 and 5 discuss the scalability of our study and its results.
2. Materials and Methods
2.1. Large-Scale Surname Data
Using machine learning, we made a large-scale surname dataset to create a classifier for the surname origins of ethnicity.
The ORBIS dataset provided by Bureau van Dijk’s in 2016 was used as learning data for machine learning. It offers information on around 300 million companies across the globe as well as public and private company data. The data include 35 million names and nationalities of company executives and individual shareholders in 203 countries.
For example, the ORBIS dataset basically contains such data as the company name, its ID, the number of executives, their names, IDs, job titles, beginning/retirement dates, salaries, dates and places of birth, nationality, and so on. From this data list, we separately extracted only the names, dates and places of birth, nationality, executives’ personal IDs, and company IDs. We use surname and nationality-labeling data. This subset was divided by 8 to 2 and set as training and test datasets.
2.2. Using RNN
In this chapter, we explain machine learning from a mechanical point of view to illustrate how surname-nationality data are described using the prepared dataset.
A neural network mimics how a cranial nerve generates a network by learning. In RNN, data, which can be learned with continuity like a time series by multi-layer and cyclic structure, can be used for text and speech recognition. In this paper, a surname’s text is decomposed into characters and learning is performed by RNN. If a specific surname is input in a fully trained RNN, it returns the probability that that surname appears with that surname by nationality. The advantage of this method is that it can calculate the appearance probability even for surnames that are not in the learned dataset.
In RNN, the learning efficiency changes depending on the learning rate, the number of layers, and the function setting that was used. The classifier learned by adding a Long Short-Term Memory (LSTM) [25] layer to the RNN. LSTM solves the vanishing gradient problem where the RNN’s learning ability is degraded by the increase in the distance of the information. In this research, the learning ability was improved by stacking LSTM layers.
RNN trained the nationalities and surnames of the 37,081,935 people in the top 77 countries. The loss value in learning is cross entropy (1), where:
In cross entropy formula (1), y and ŷ are the true nationality distribution obtained from the teacher data and the nationality distribution estimated from the classifier. N is the number of nationalities: 77. We used the PyTorch 1.4 library [26]. We set the learning rate to 0.0005 and learning numbers to 2 million iterations. The total training time is 627m, without GPU.
A nationality classifier based on surnames by RNN that finished learning returns log-likelihood calculated from the generation probability of input surnames in each nationality. For example, if Japanese surnames are input, the log-likelihood shows the highest value in Japan (nationality). On the other hand, if a British surname is input, the log-likelihood shows high values in Australia, New Zealand, and the United Kingdom. Since Australia and New Zealand have British origins in their language, culture, and ethnicity, distinguishing British from Australian is difficult with this RNN. To improve the classifier’s precision, the log-likelihood values are divided by the number of entries (people) in each country and normalized. In this way, the same surname (Smith) is more likely to be the predicted result from the United Kingdom than New Zealand.
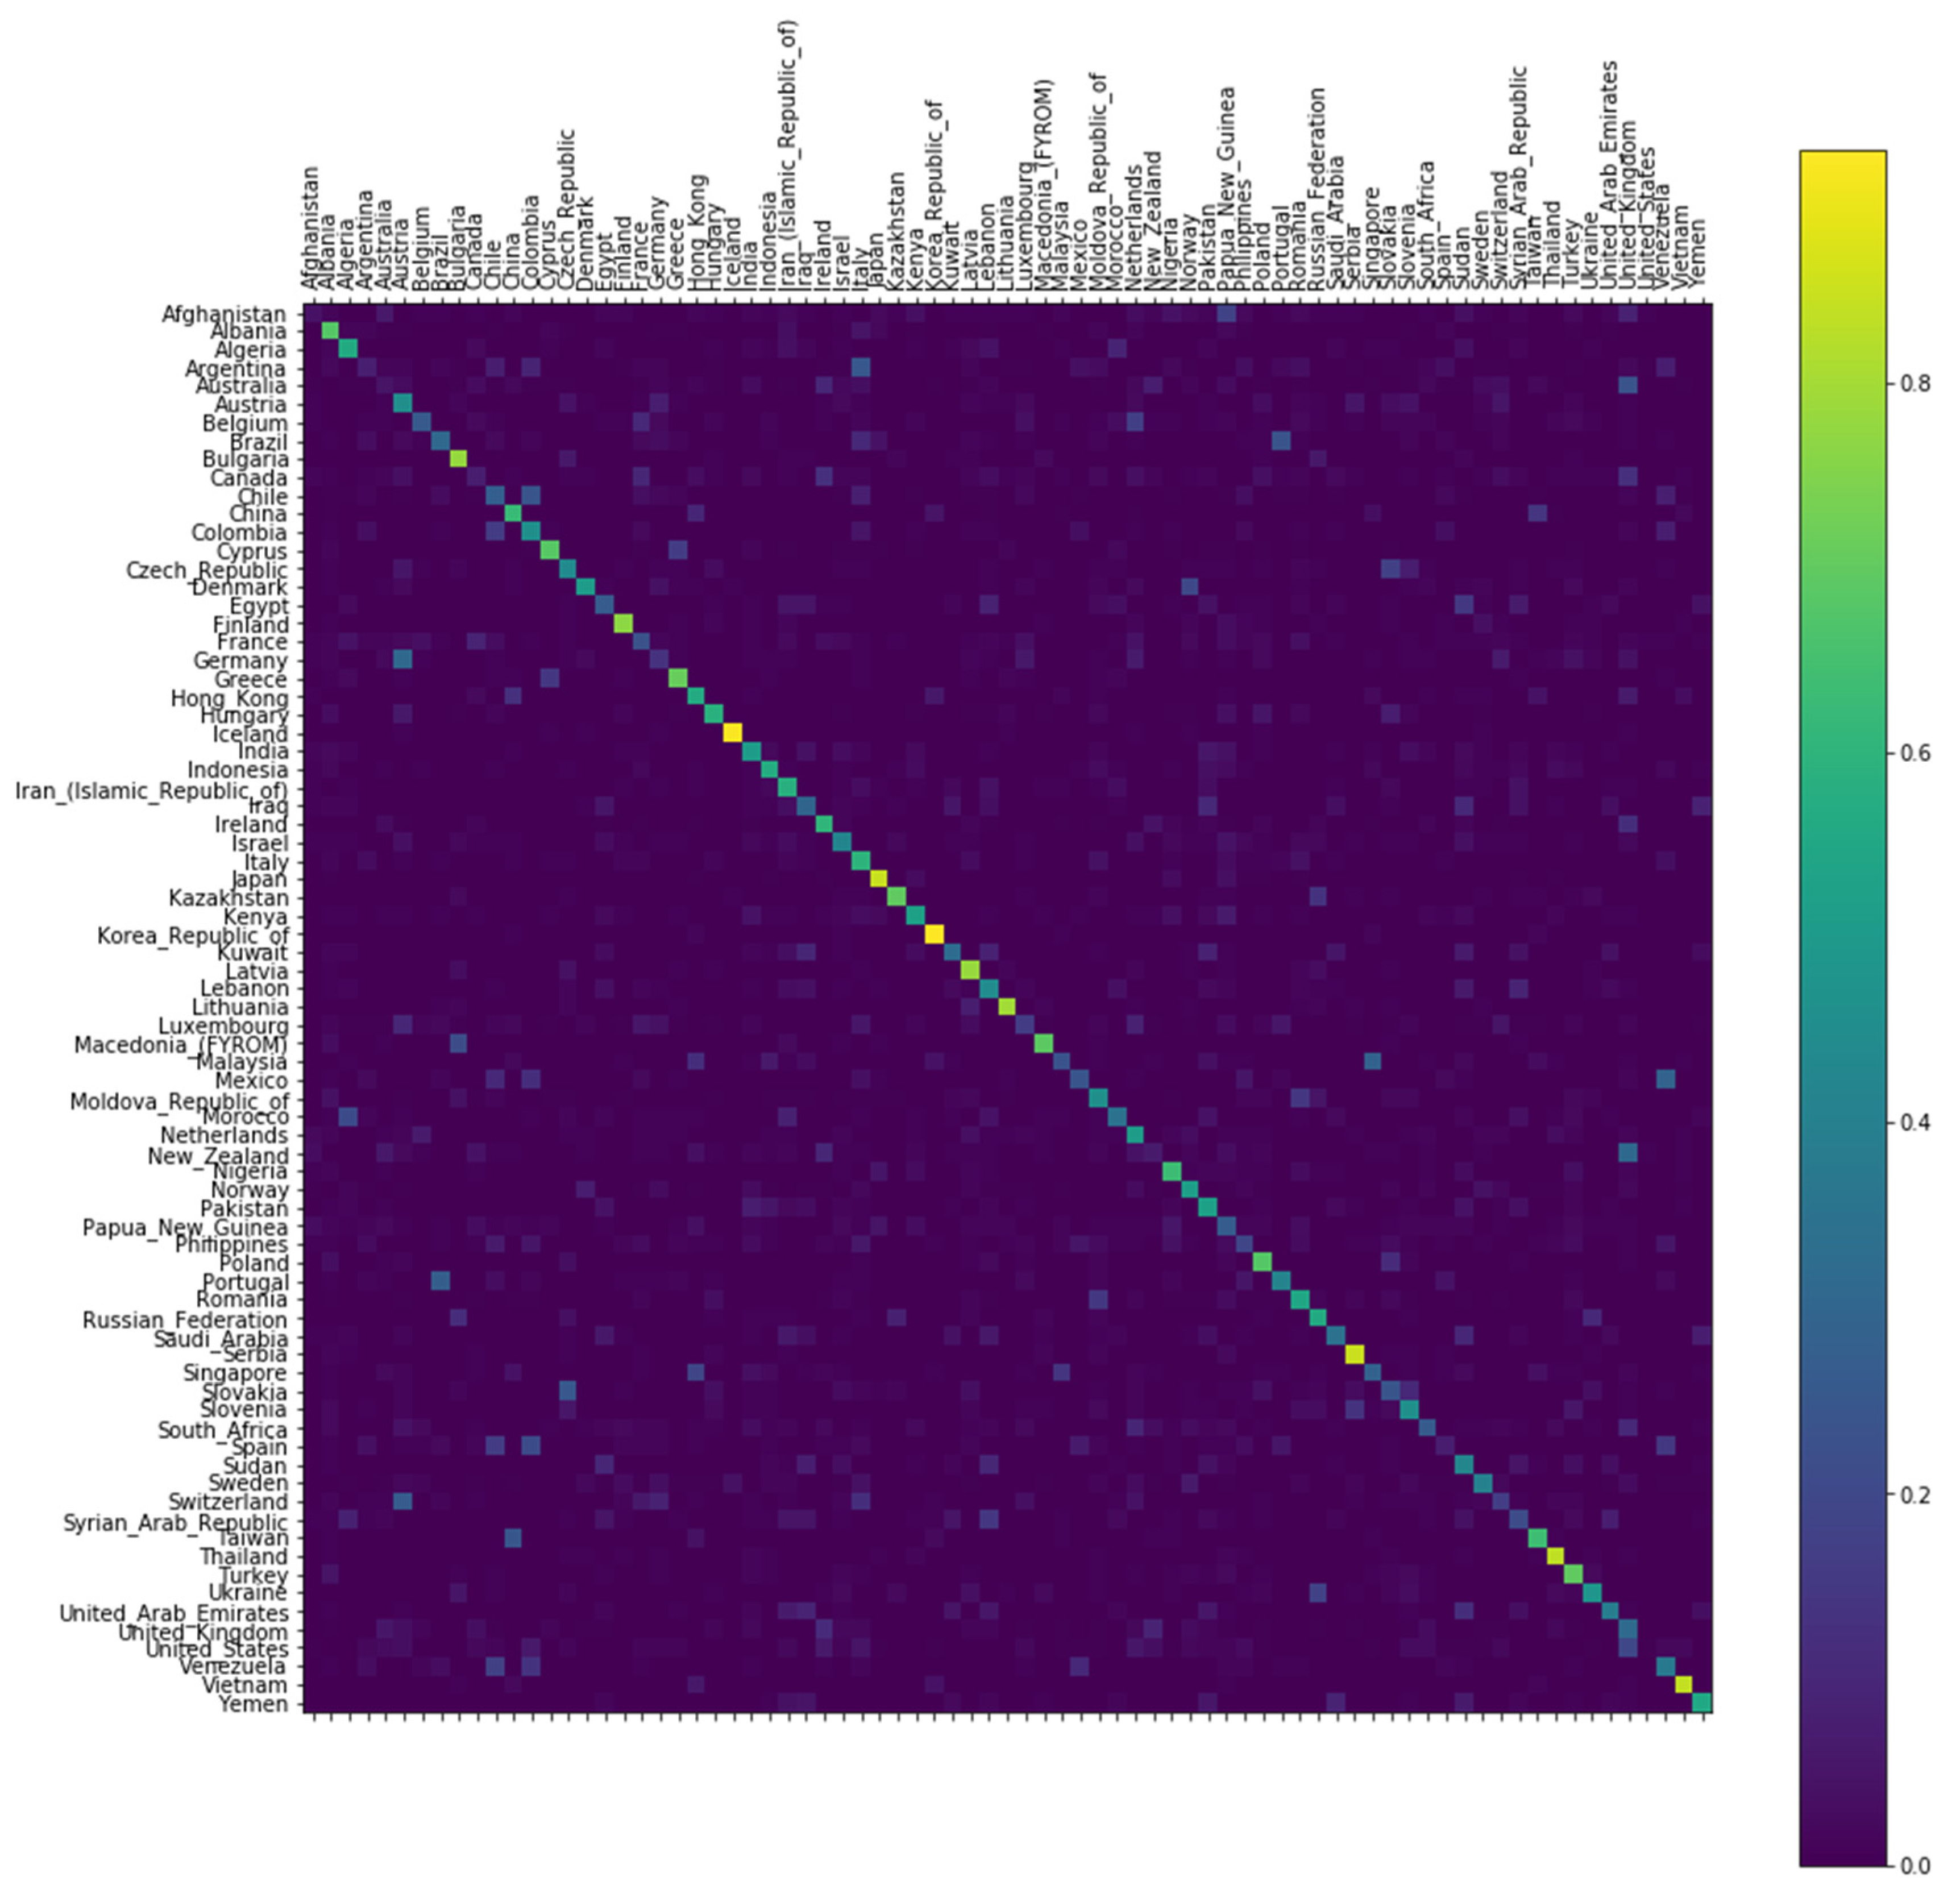
The accuracy of the classifier constructed by learning by RNN and the normalization of the log-likelihood are verified using a randomly selected test dataset. Figure 1 shows a confusion matrix obtained by inputting the surnames of 77 countries as a test dataset. The brighter the color is, the higher is the predicted accuracy of the test dataset. In other words, Bulgaria, Iceland, Japan, and Thailand are countries with a high percentage of matches to predicted and actual nationalities. Canada, Brazil, the United States, and the United Kingdom, on the other hand, showed meager matching rates. The higher the predicted accuracy of the test dataset is, the more unique the characteristics of the surname composition are: countries with a high proportion of surnames in a single structure. On the other hand, countries with a low forecast accuracy have high rates of multi-structured surnames. This idea is also highly relevant to a country’s ethnic composition that will be explained later.
Table 1 shows the output of the top three normalized log-likelihood values for three input surnames. Smith is the most likely to be generated in the United Kingdom; it is also likely to be generated in Australia and New Zealand. The surname Mori is clearly much more likely to be generated in Japan than in other countries. This tendency appears in surnames associated with single-ethnic countries (monoethnicity) such as Japanese surnames.
Table 2 shows the prediction precision of each country. The high-ranking nationalities with high correct answer rates were Iceland (91.1%), Korea (89.2%), and Vietnam (88.1%), and the low-ranking nationalities were New Zealand (0.8%), Argentina (1.4%), and Canada (1.6%). The correct answer rate is higher as the nation’s ethnic composition is simplified.
Classifiers are generally constructed by neural networks that learn general features and ignore irregular ones to raise the estimation precision. Rather than speculating about rare surnames (i.e., Anderson in Thailand), it is more efficient to accurately match nationality to common surnames. In other words, the nationality estimated by the classifier indicates which nationality’s character is most reflected, and returns the nationality that is the surname’s origin. For example, if the surname of a Chinese immigrant of American nationality is input, the normalized log-likelihood shows that its maximum value is in China (its origin). Using this classifier’s features, we estimate the distribution of ethnic groups (origin) in each country. The result, the nationality from which the classifier comes, is called the origin of the ethnicity from now on.
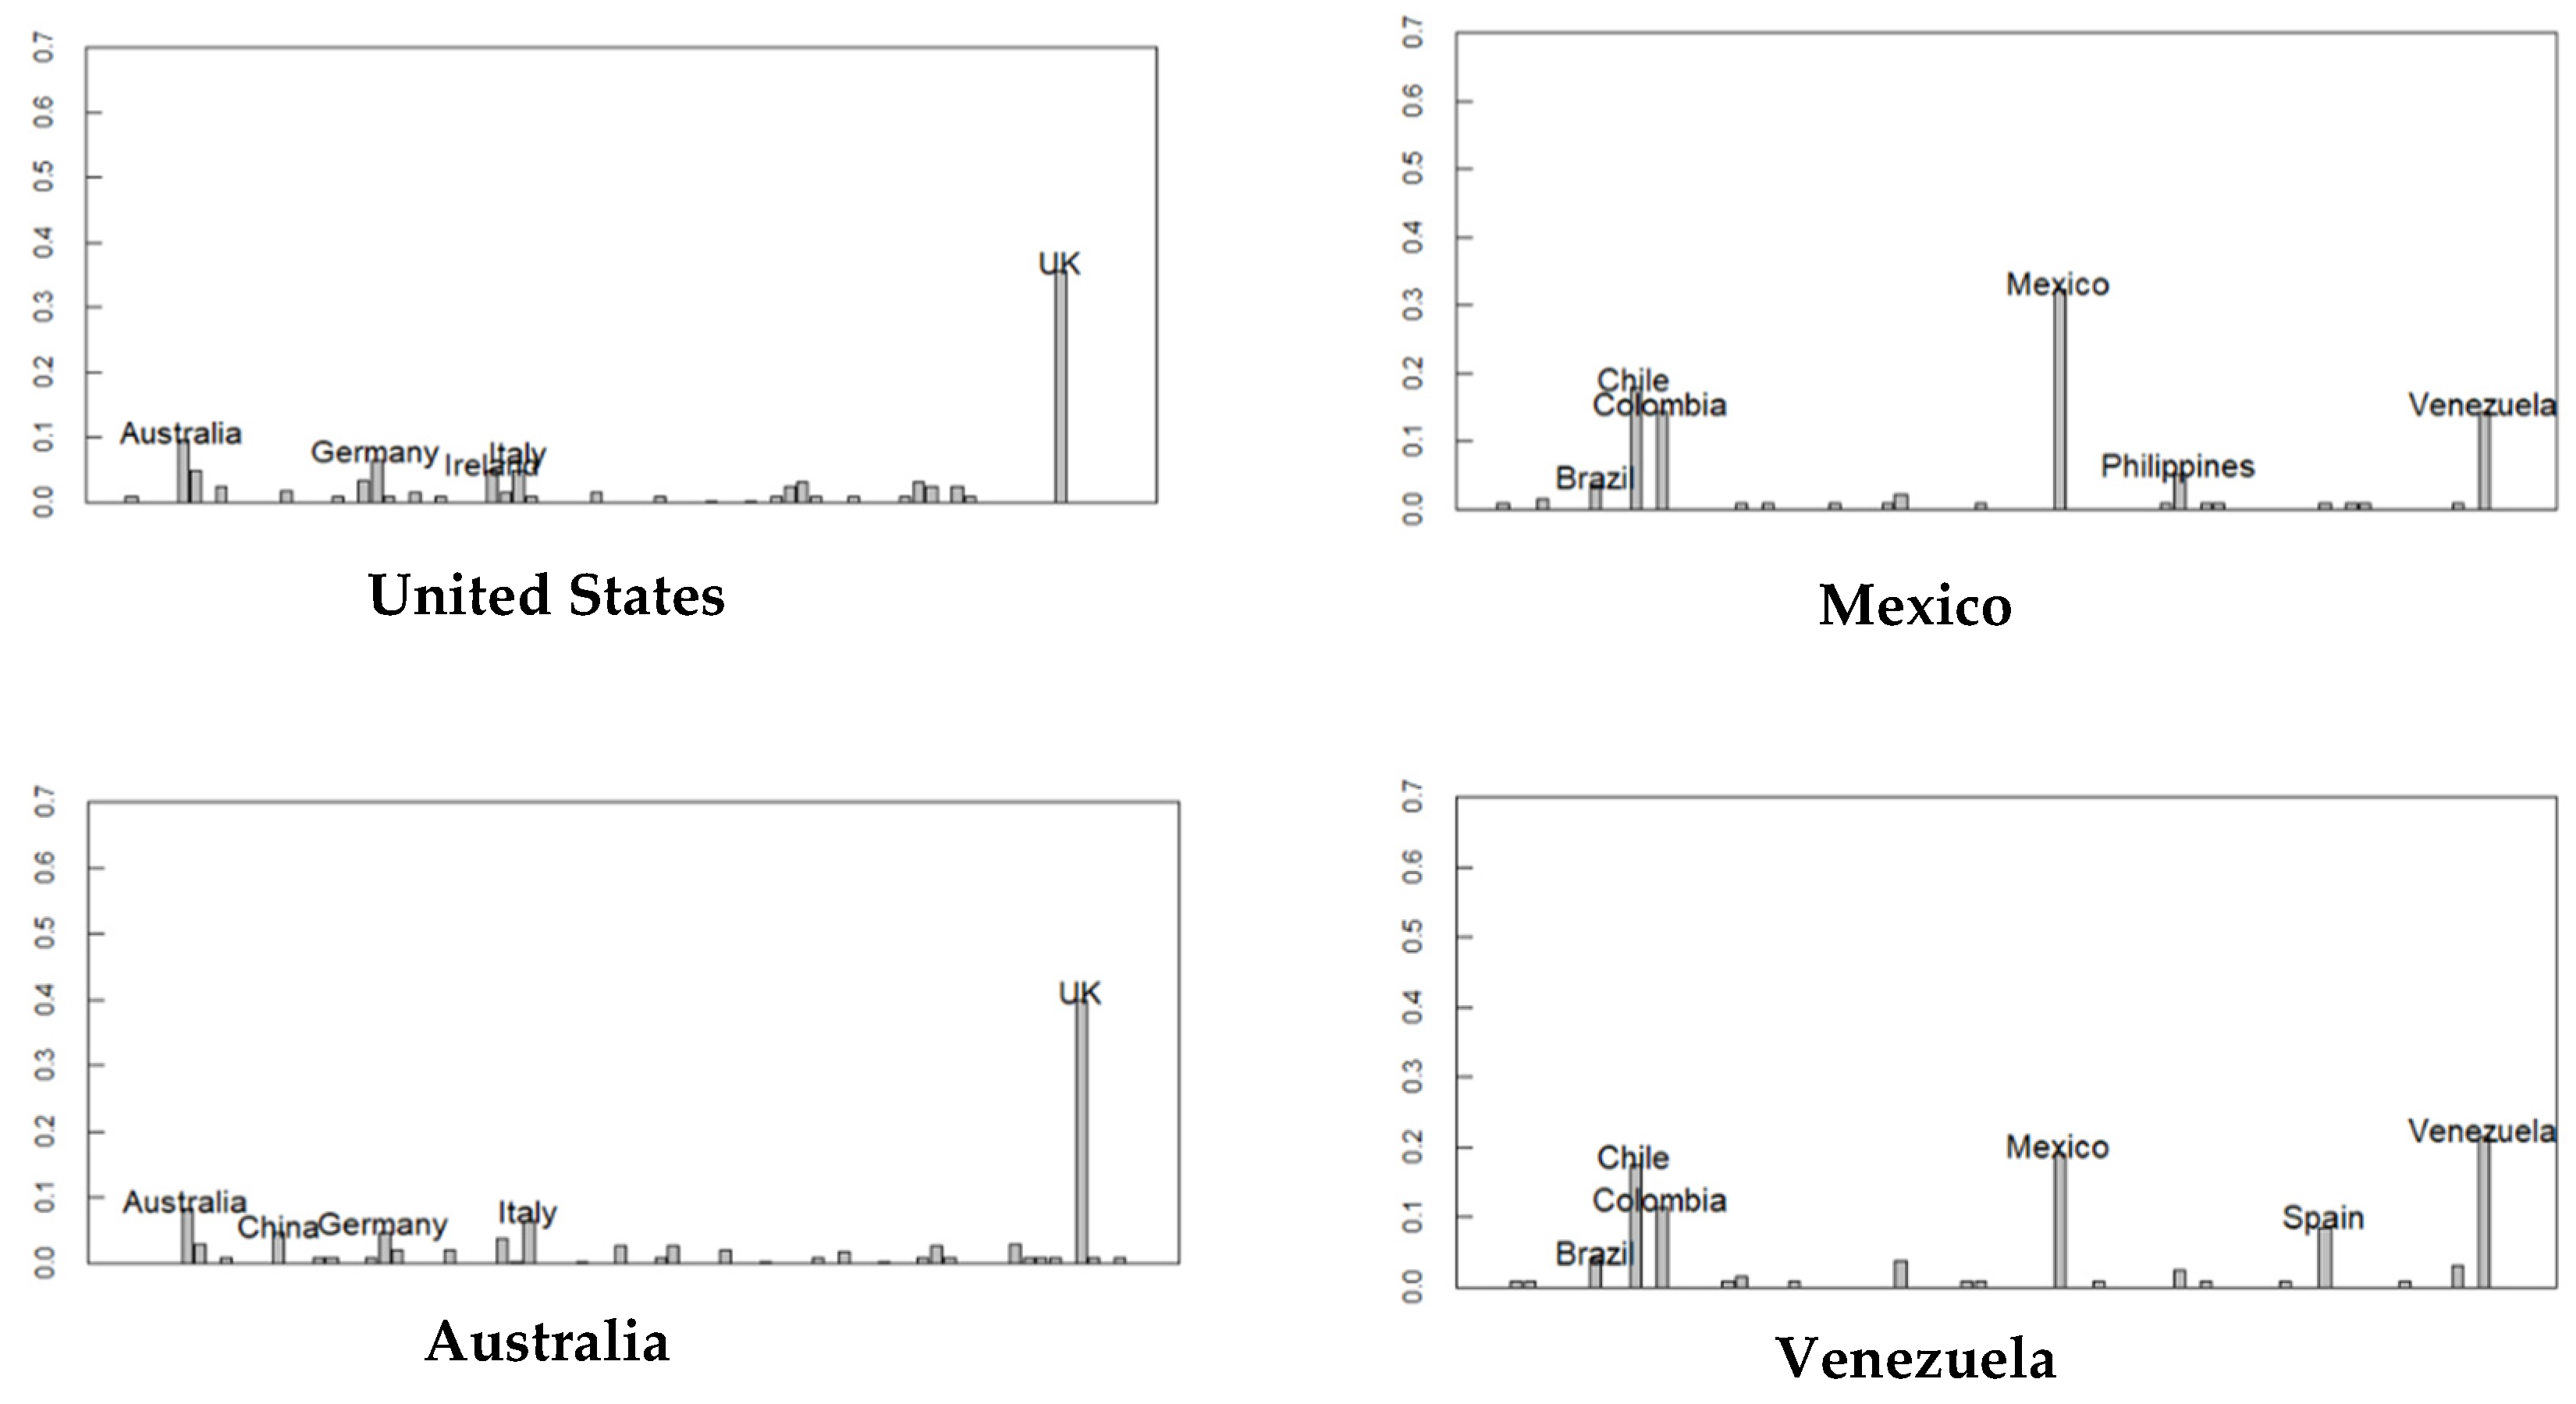
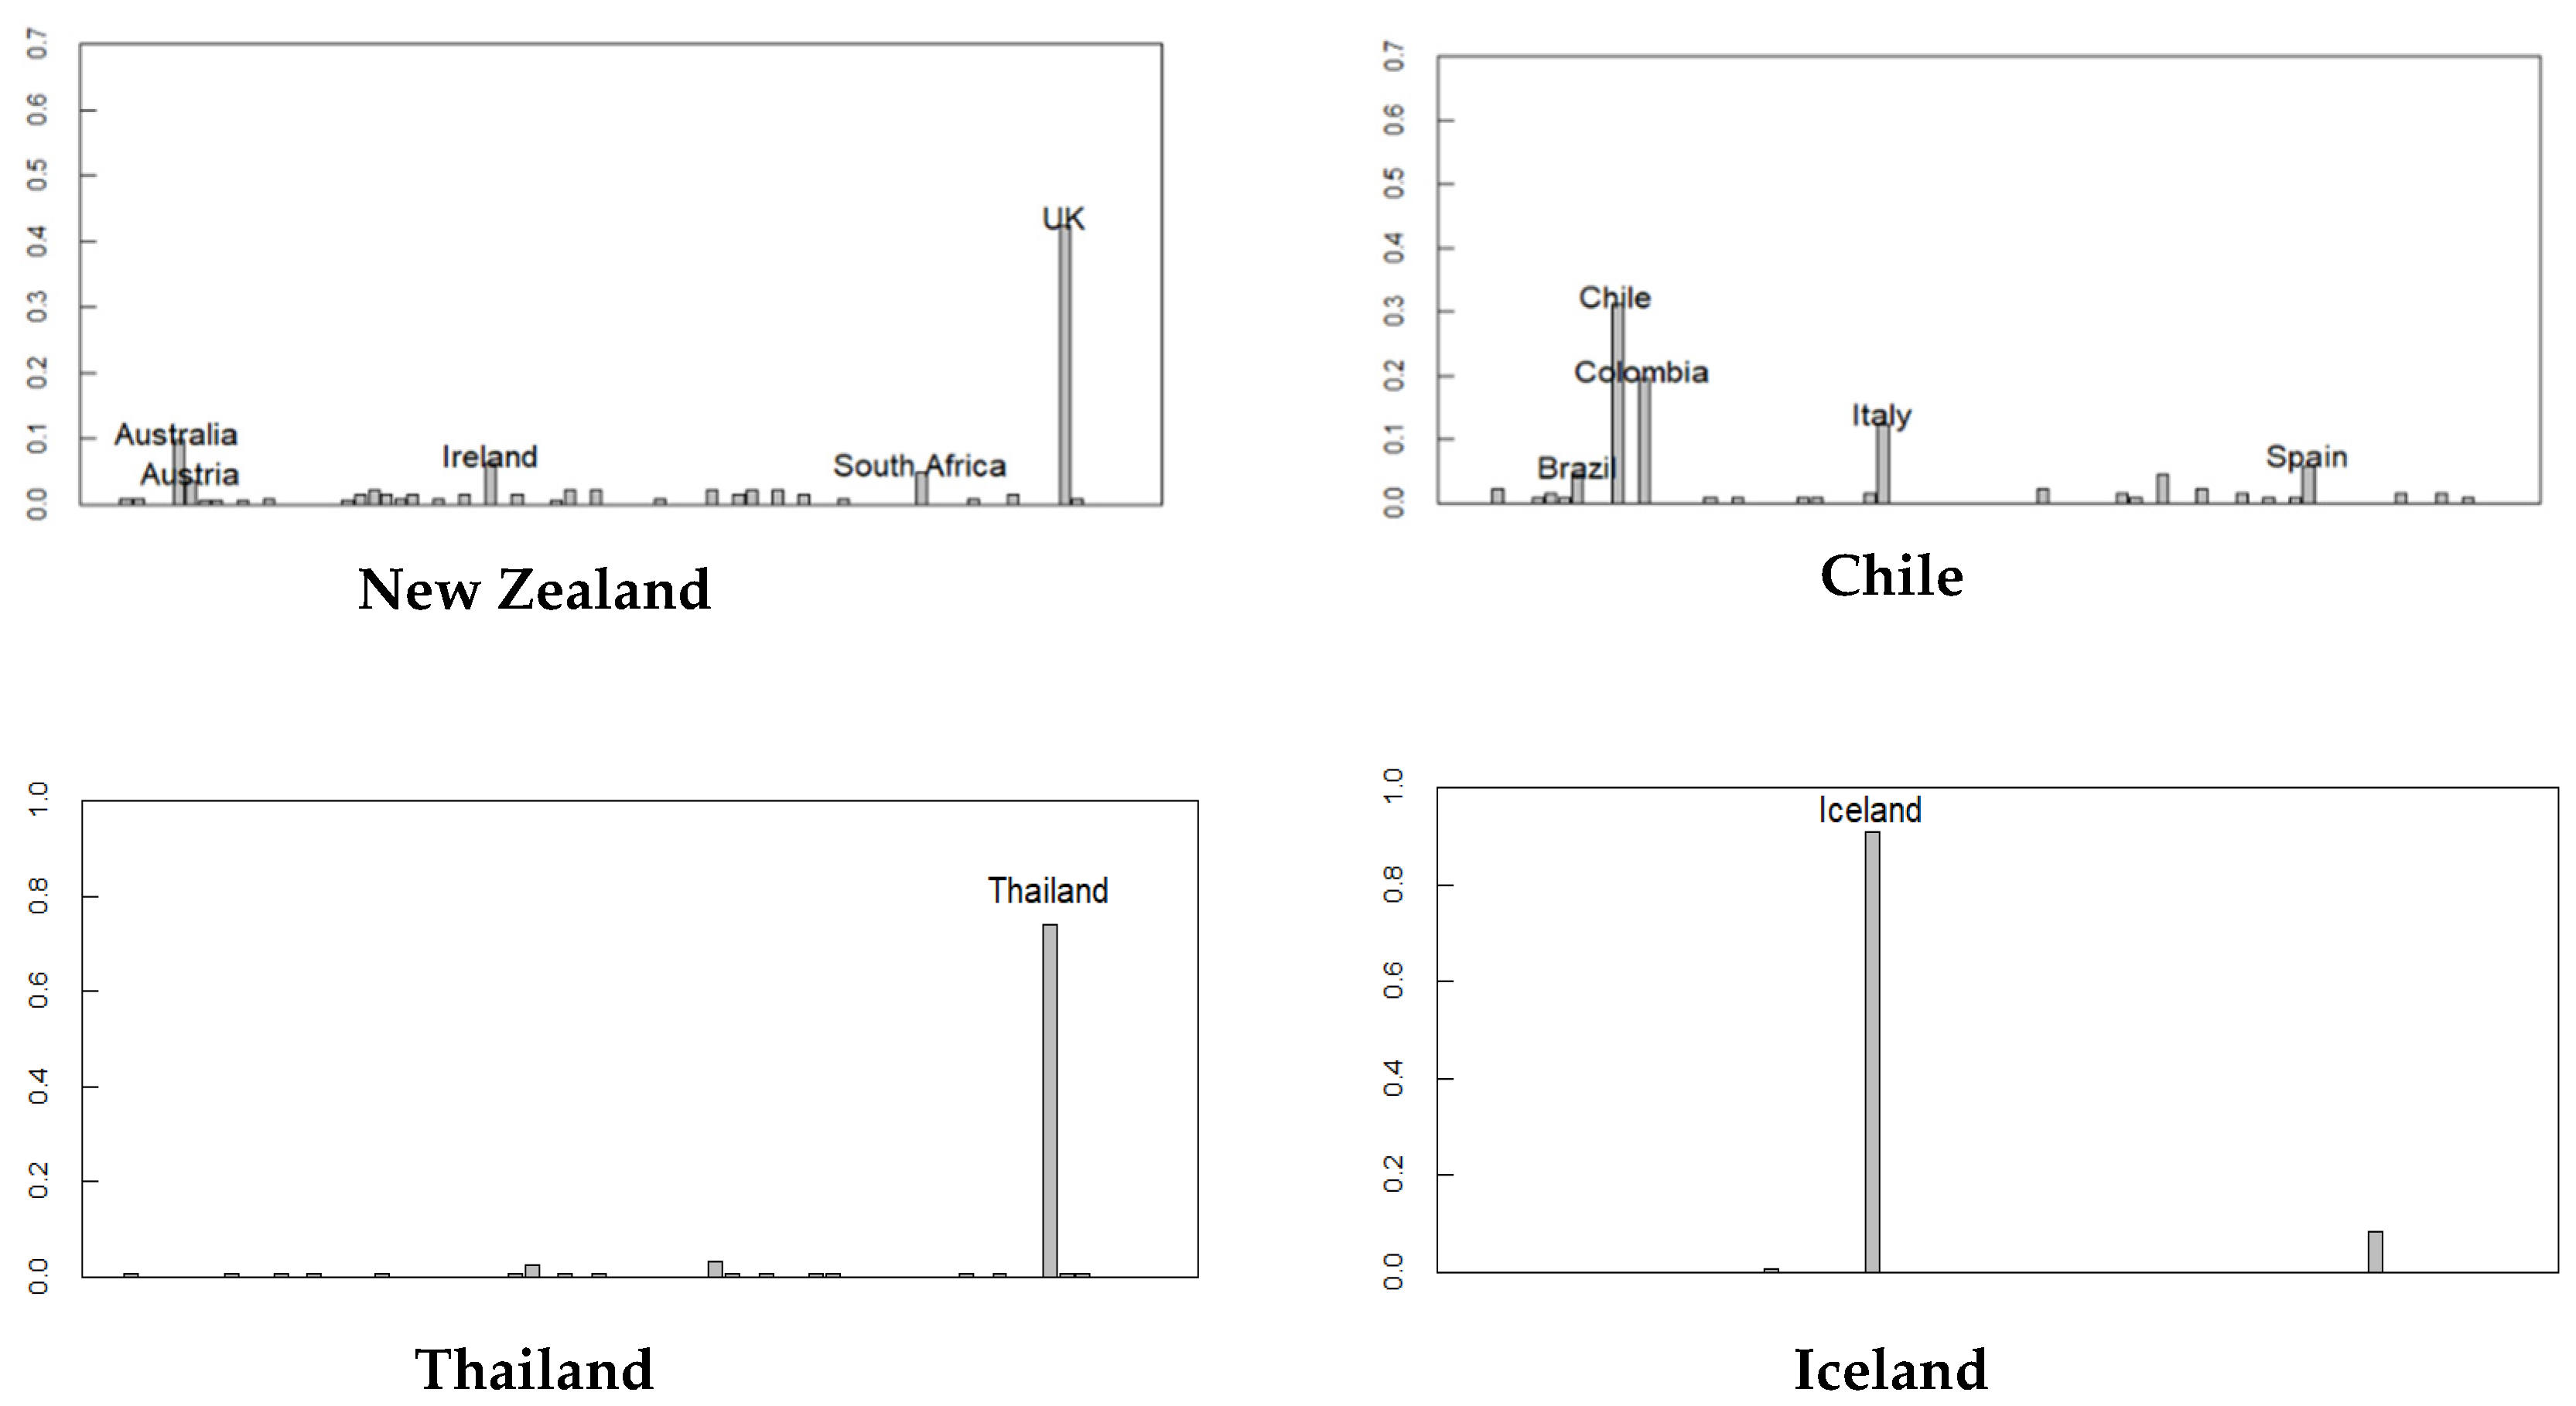
Figure 2 shows the countries where the distribution of the predicted origin of the ethnicity is particularly scattered. In the United States, which has many immigrants, the countries of the origins of many people are Britain, Australia, Germany, Italy, or Ireland. The same tendency is observed in Australia and New Zealand, which also have many immigrants from the UK. Geographically, Mexico is closer to the United States, but its ethnic composition is nearer to Venezuela than the United States. Chile is slightly different from Venezuela and Mexico; it shows a high ethnicity of Italian descent.
2.3. Method for Abstracting Ethnic Linkages
Using each country’s ethnic distribution, countries with similar ethnic compositions can be extracted. We can trace the connectivity of nations among countries by measuring the similarity among the ethnic distributions obtained through the classification system and extracting the communities using similarity figures.
Jensen–Shannon Divergence (JSD) uses Kullback–Leibler Divergence (KLD) to calculate the distance among distributions. KLD (2) calculates the information loss rate between the probability distribution and its approximate probability distribution. KLDs have asymmetry and are unsuitable for calculating distances. Thus, the mean of the two probability distributions and the mean of the KLD between each distribution make symmetrical figures (3), and the obtained JSD can be used as the distance between the two probability distributions. In this way, the JSD of the ethnic probability distribution of the two countries is obtained to determine the similarities of ethnic composition:
Next, using the similarity of ethnic distribution plots obtained through JSD, we extract the communities of countries or cities with similar ethnic compositions. Various algorithms can detect network communities using the map equation [27].
Map equation, which is based on modularity maximization, extracts communities by considering patterns of network structure. Based on entropy measurements, finding the partitions in a network that can reduce the movement of random walker becomes the algorithm’s core.
3. Results
3.1. Prediction of Nationality
We built a classifier for comparing the performances of related studies. Concerning name and nationality data, few open datasets are available due to privacy issues. The data most commonly used to build name-nationality or name-ethnic (racial) classifiers in informatics are the names and nationality data found in Wikipedia as well as such data of Olympic participants. Typically, these two forms of data are collected by crawling sites. However, we used these data in our study because the names, nationalities, sports, and grades of Olympic participants were published in Kaggle [28].
The data contained 120 years of Olympic athlete data from 1896 to 2016. Out of 271,226 entities from 230 countries, 117,059 unique entities from 77 countries were extracted. The data from these Olympic participants were used as test data to identify the performance of the classifiers built in this study. Since the prediction accuracy varies from country to country, the table shows the accuracy of the top 5 and the bottom 5 forecast results in each country. The average predicted precision of the 77 countries is 0.66, which is higher than a previous study [29] that tested with data from identical Olympic athletes. From a related study [29], 52.6% of the top 1 accuracy was predicted in 44 countries by surname-nationality prediction.
This related study [29] used machine learning with an STML layer to an RNN, as in our study. But the difference in the quality of the learning data probably reduced the precision. For the Olympic participant data, we predicted that the volume of the data will be heavily skewed by country and that many athletes have changed their nationalities, lowering the performance. On the other hand, compared to the number of Olympic participants, using highly reliable learning data allowed for better performance than the related study.
3.2. Classification by Ethnicity
Since our classifier was built through a dataset of surnames and nationalities, its classification is based on nationality. Nationality classification groups contain more noisy data than ethnic groups. However, we argue that the overall characteristics of the group are based on language and culture and can be similarly classified as surname data that reflect it. To support this argument, we compared data classified by ethnic groups by human judgment with those classified by our classifier.
We used the Amazon Mechanical Turk to do this. We requested that each country’s registered workers classify the selected sample data for each country in it. Sample data were randomly extracted from the ORBIS dataset to build the classifier. The questions were concise. The workers in each region viewed a list of surnames and selected all the statements from which the area originated. For example, workers in Italy saw surnames from the Orbis dataset registered as Italian and selected all the surnames from the list that they believed were of Italian origin (Figure 3). We put options in the surname list to filter out a worker’s classification results by reliability. Several of the surnames in the list precisely originated in that region (based on Wikipedia data), and any work that did not select these surnames was correctly filtered out. We only selected reliable results through the worker’s working time. Only those surnames chosen by more than 90% of the workers in a region were classified as correct. (hereinafter referred to as: Mturk dataset) There are six regions, United Kingdom, France, Germany, Italy, India, and Spain, where workers were fully involved and sufficient data are available for analysis through data cleaning. We compared the classifier results we deployed using the same sample data classified by the workers.
The classification results of the Mturk dataset by our classifier are shown in Table 3. The accuracy of the average top 1 is 67%. Since the classified labels by people contain too much noise, we compared how similar the classifiers are to human results in addition to their accuracy. In Figure 4, the x-axis shows each surname of the sample. The y-axis (left) represents the rate of correct answers. The black line indicates the distribution of the correct percentage of each name classified by a person. This indicates how difficult it is for each surname to be correctly classified.
For a comparison, we used the log-likelihood values from the classifier and calculated the difference of log-likelihood values between the top 3 and the top 1 in the classifier results. The more significant the difference, the easier classification is; the lower the difference, the more difficult classification is. To reduce the noise of this calculation, we used a sliding window whose average size was ten. The red line represents the predicted difficulty of the classifier. The values on the y-axis (right) show that our classifier can codify the ethnic origin through surnames to a similar level of human judgement. These comparative analysis results support that the classification classifier results can also be interpreted as the origin of ethnicity.
3.3. Prediction of Ethnic Distribution within a Country
Consider the meaningful distribution of ethnicity, which reflects the definition of a classifier. For this purpose, we used the surnames and the racial data released by the U.S. Census. The dataset includes the 151,671 most common names in the United States and the proportion of races that use them. The races shared by the census are divided into non-Hispanic whites, Hispanic, Black or African American, Asian, American Indian or Alaska Native, and Native Hawaiian or Other Pacific Islander. In this study, we used a proportion of four races (non-Hispanic whites, Hispanic, Black or African American, Asian). Since the classifiers were not divided into race as the census data, they were grouped into four racial groups by selecting the countries covered by the classifiers that were not biased in terms of the amount of data.
The results predicted by the classifier with the name-racial data of the 2000 census are identical to Table 4. The distribution of the racial demographics provided by the census data and the resulting distribution from the classifiers in this study are similar. In other words, the distribution to the predicted nationality (origin of the ethnicity) is very similar to the real population. This shows that the distribution of the origin of the ethnicity obtained through the classifier is significant and accurate.
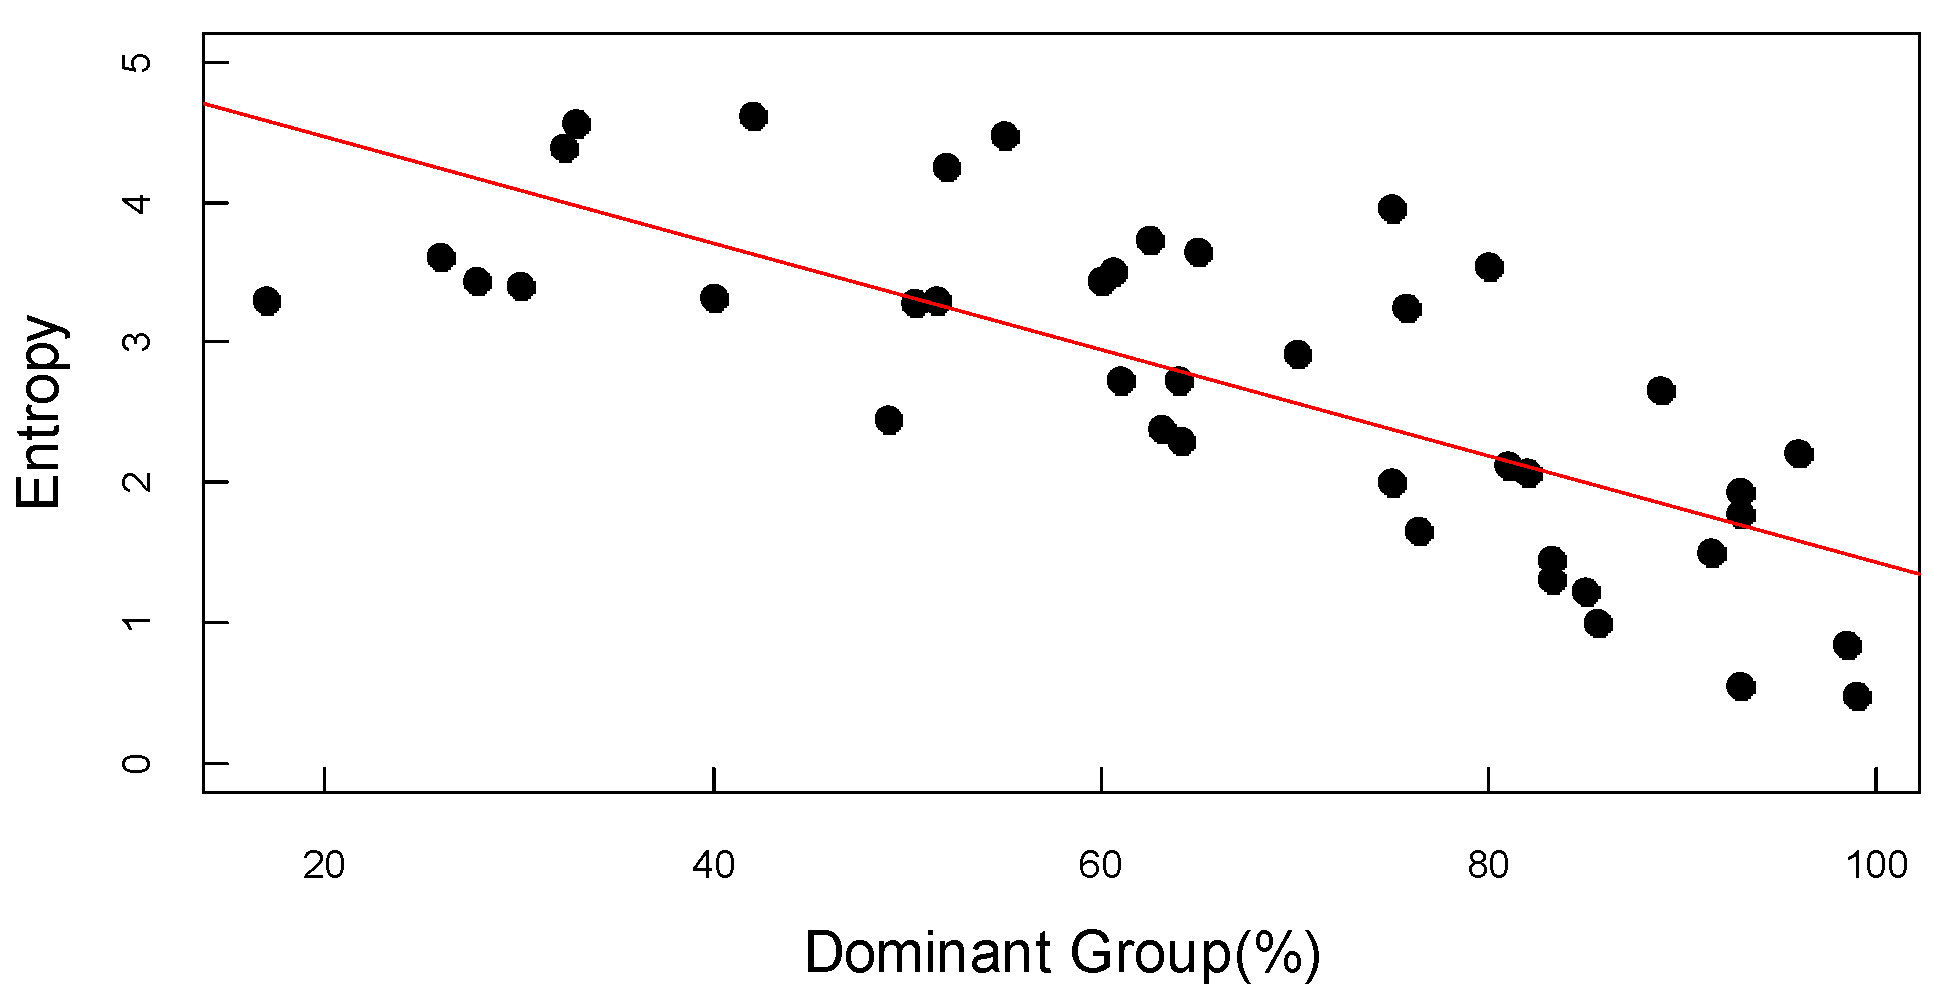
Japan is an overwhelmingly single-ethnic nation, 98.5% of its population is Japanese. In Kenya, a multi-ethnic nation, the largest ethnic group (Kikuyu) accounts for only 17%. Ethnic diversity can be measured by estimated ethnic distribution from the relationship between the entropy (4) of the ethnic distribution of each country and the proportion of the largest ethnic group in each country [30,31,32]. Figure 5 and Table 5 show the relationship: the higher the entropy, the greater the ethnic diversity (multi-ethnic nation). As such, the analysis of ethnic distribution entropy through surname data can predict a country’s ethnic diversity.
3.4. Spatial Distribution Analysis of African Continent
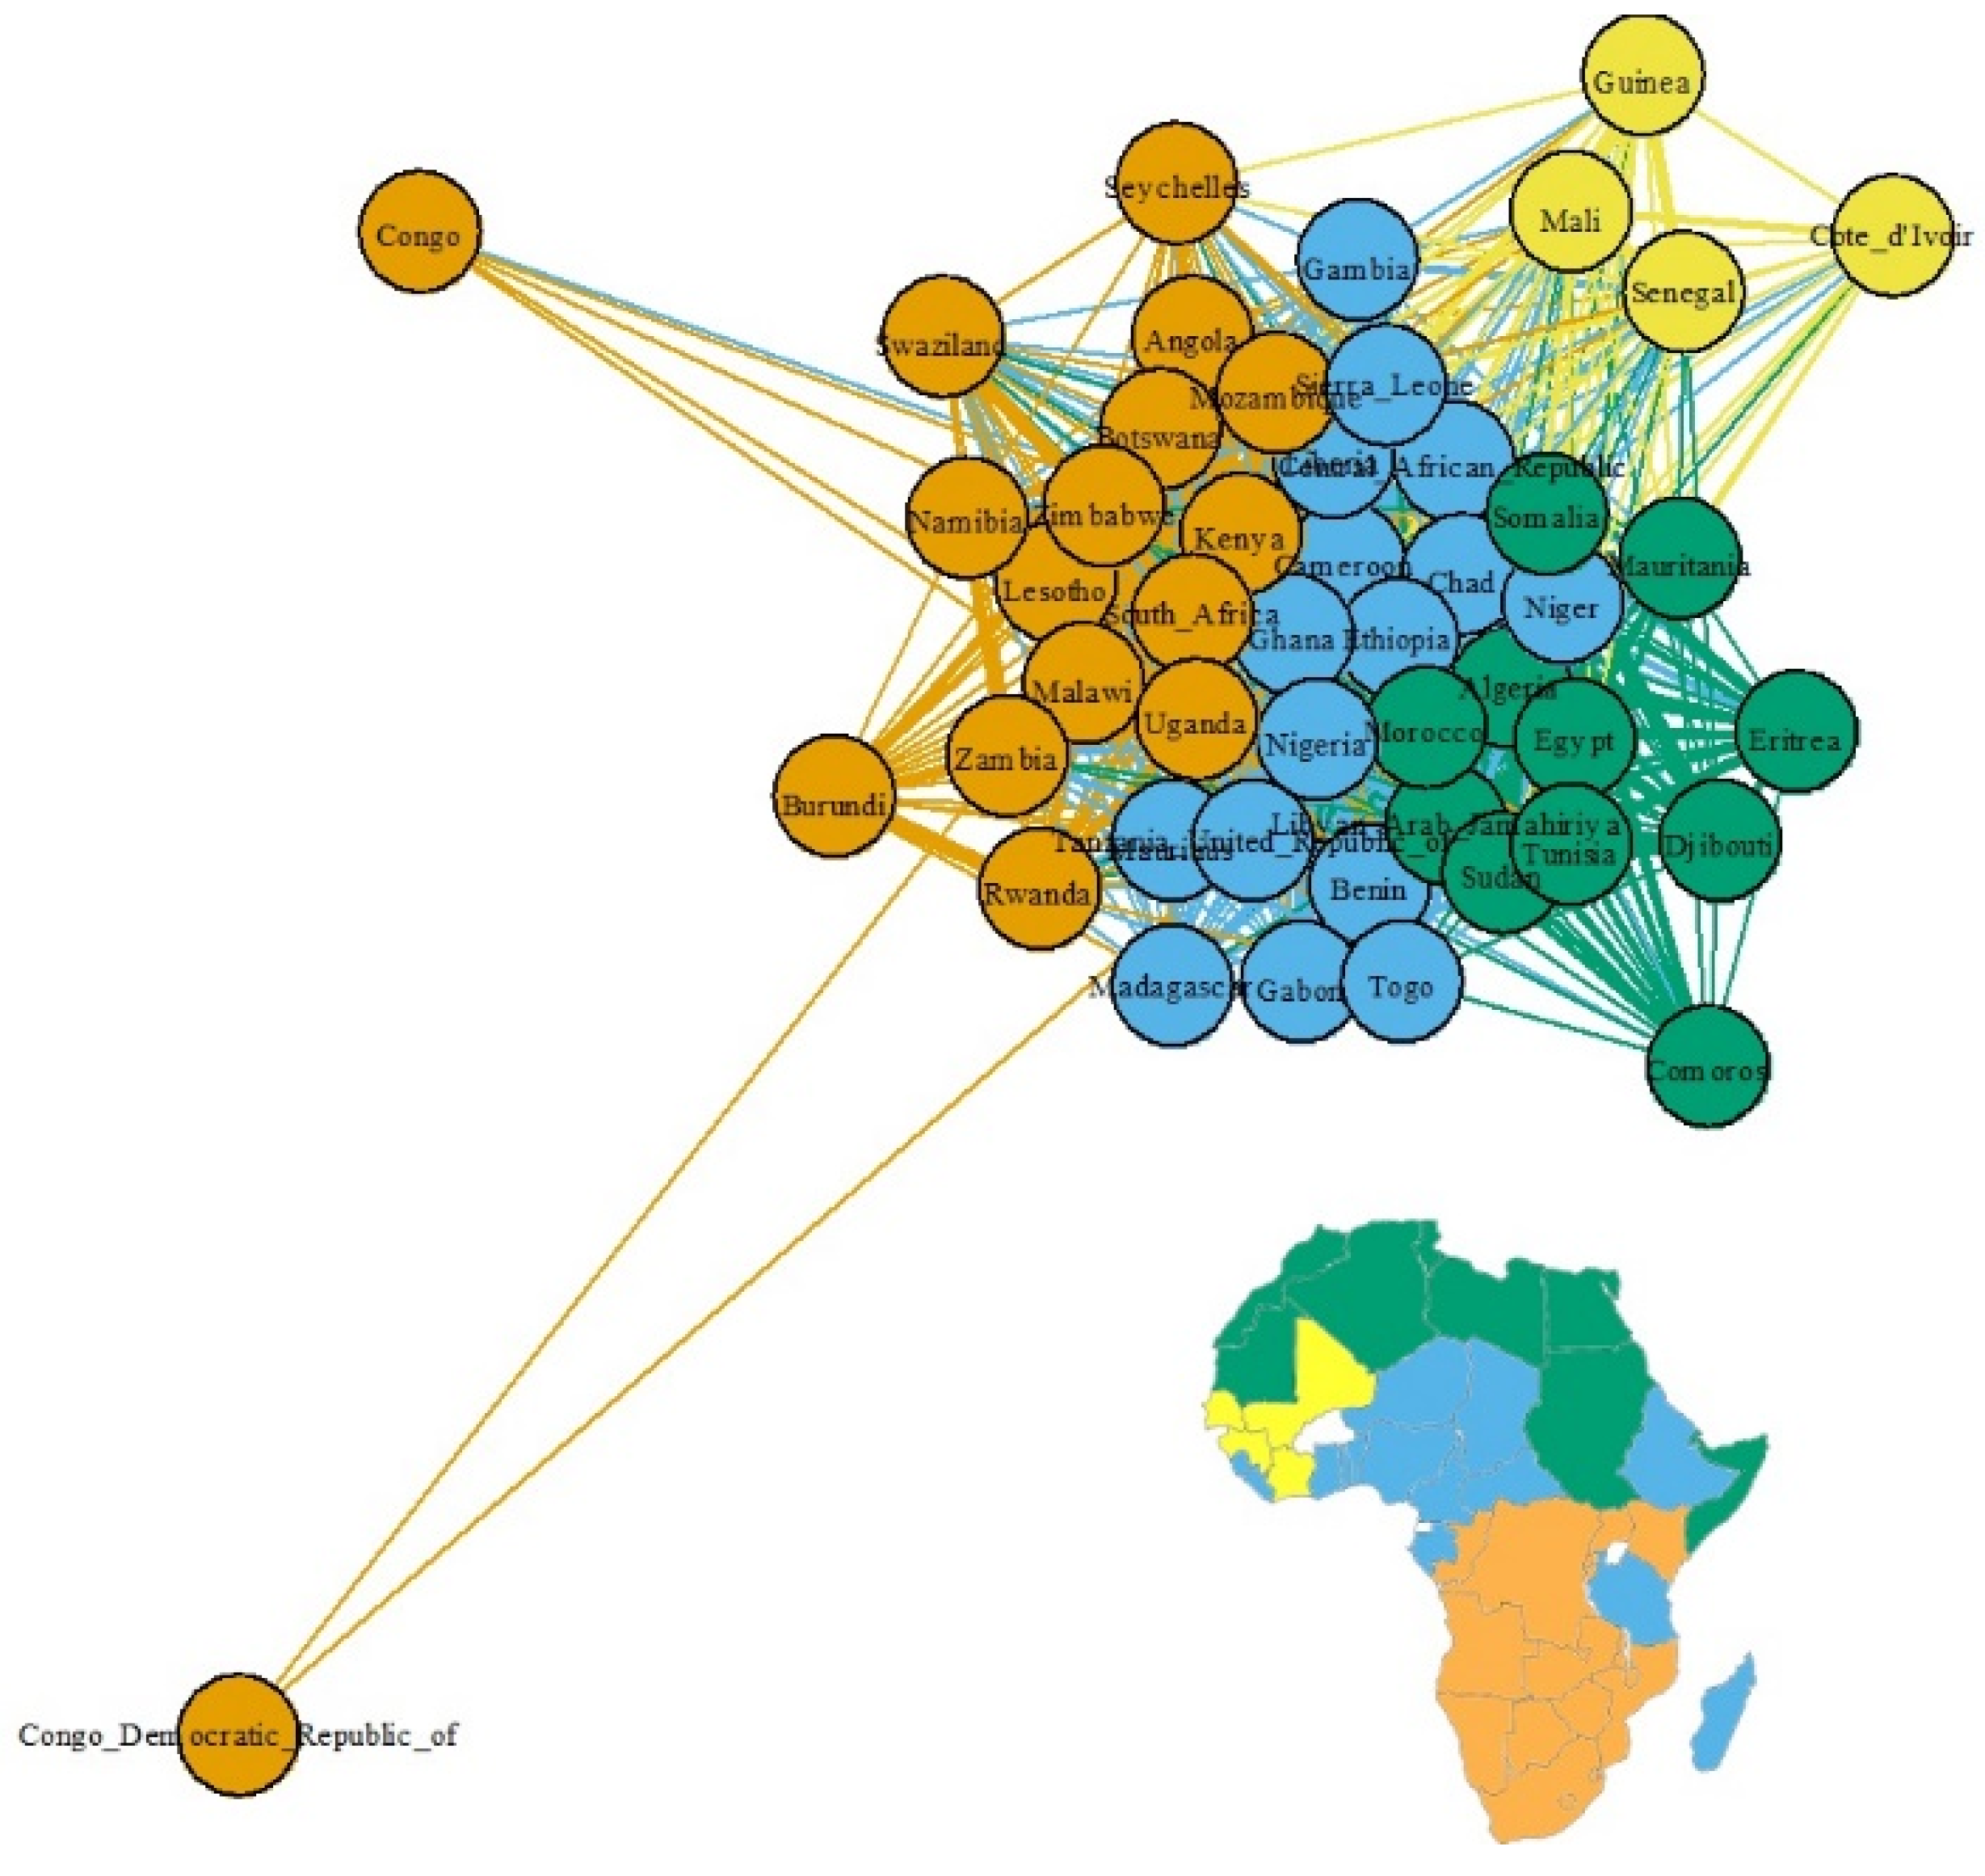
Although the African continent is a diverse blend of peoples, languages, and religions, many countries lack accurate demographic data. Our classifier trains surname and nationality data of 48 countries of the African continent by RNN and estimates their ethnic composition by normalizing the log-likelihood. (Figure 6) Then by comparing the estimated ethnic distribution of each country, ethnic similarities among the countries can be visualized. By extracting the communities, we can clarify the spatial distribution of ethnic groups across African countries.
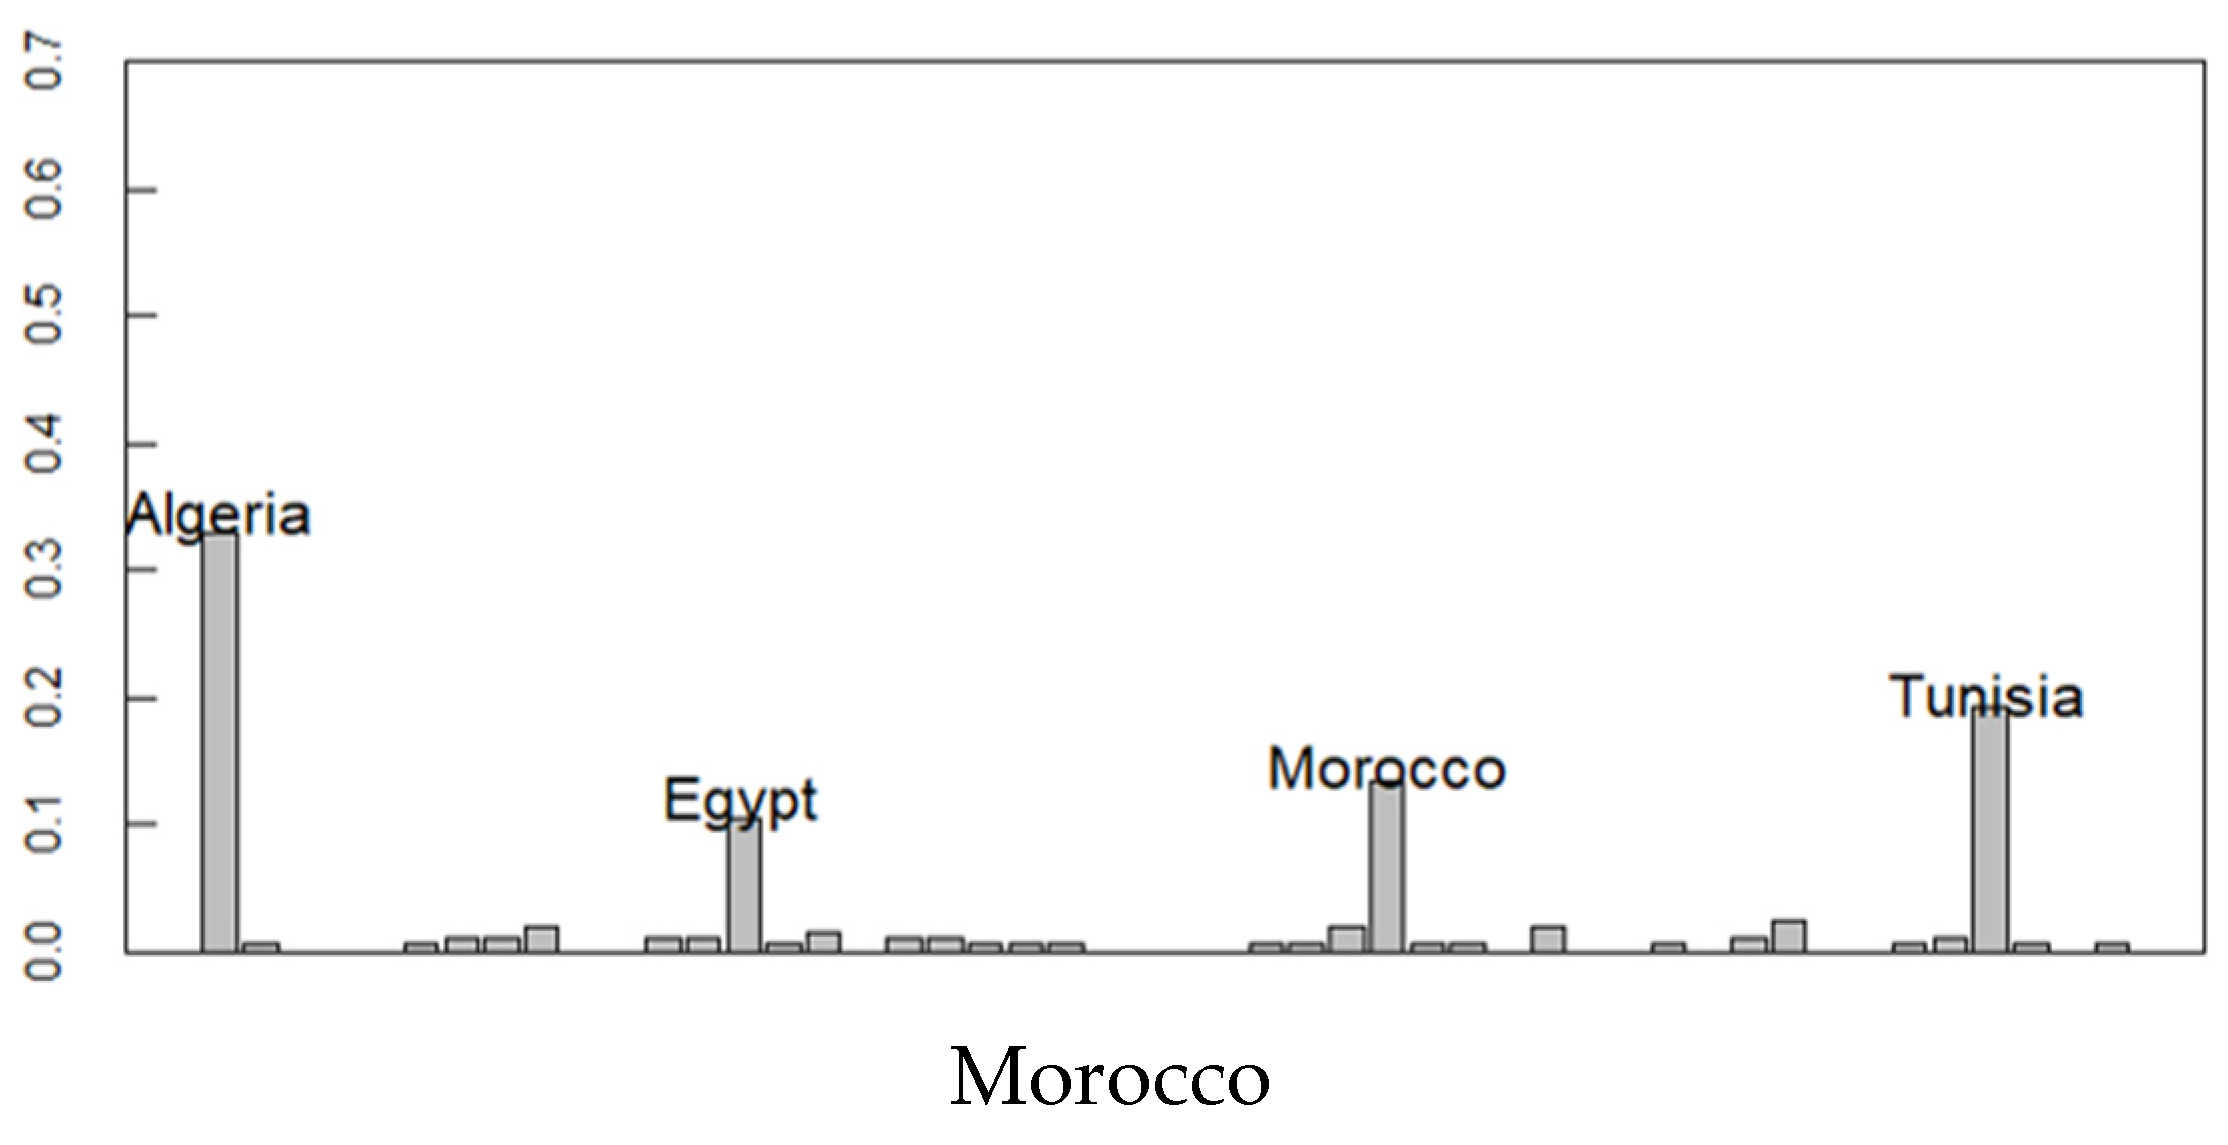
Figure 7 shows the estimated ethnic distribution of Morocco and Cameroon with high ethnic diversity and the Central African Republic with relatively low ethnic diversity. Morocco geographically resembles the Algerian, Tunisian, and Egyptian ethnic groups. Cameroon, located in the middle of Africa, has the origin of the ethnicity of geographically close countries. In the Central African Republic, neighboring countries (origin) such as Gabon, Benin, and Chad ethnic groups are also observed. These results not only represent migration from neighboring countries but also the historical context where African borders were established by European colonial powers.
Next, we quantify the ethnic connections among countries by measuring their similarities with the probability distribution of ethnicities by Jensen–Shannon Divergence (JSD). Figure 8 is a network in which each country is a node, and the JSD is a link and link thickness between nodes. Here we deleted links with values of 0.09 or less. The countries with similar ethnic composition are clustered together.
Map equation [27] detects clusters in a network to capture the spatial connections of ethnicity among countries. The four clusters that we detected were color-coded and mapped to the Africa map of Figure 8. Gray represents countries that were excluded from analysis due to insufficient data. Geographically close countries are grouped as a cluster.
3.5. Spatial Distribution Analysis of Europe
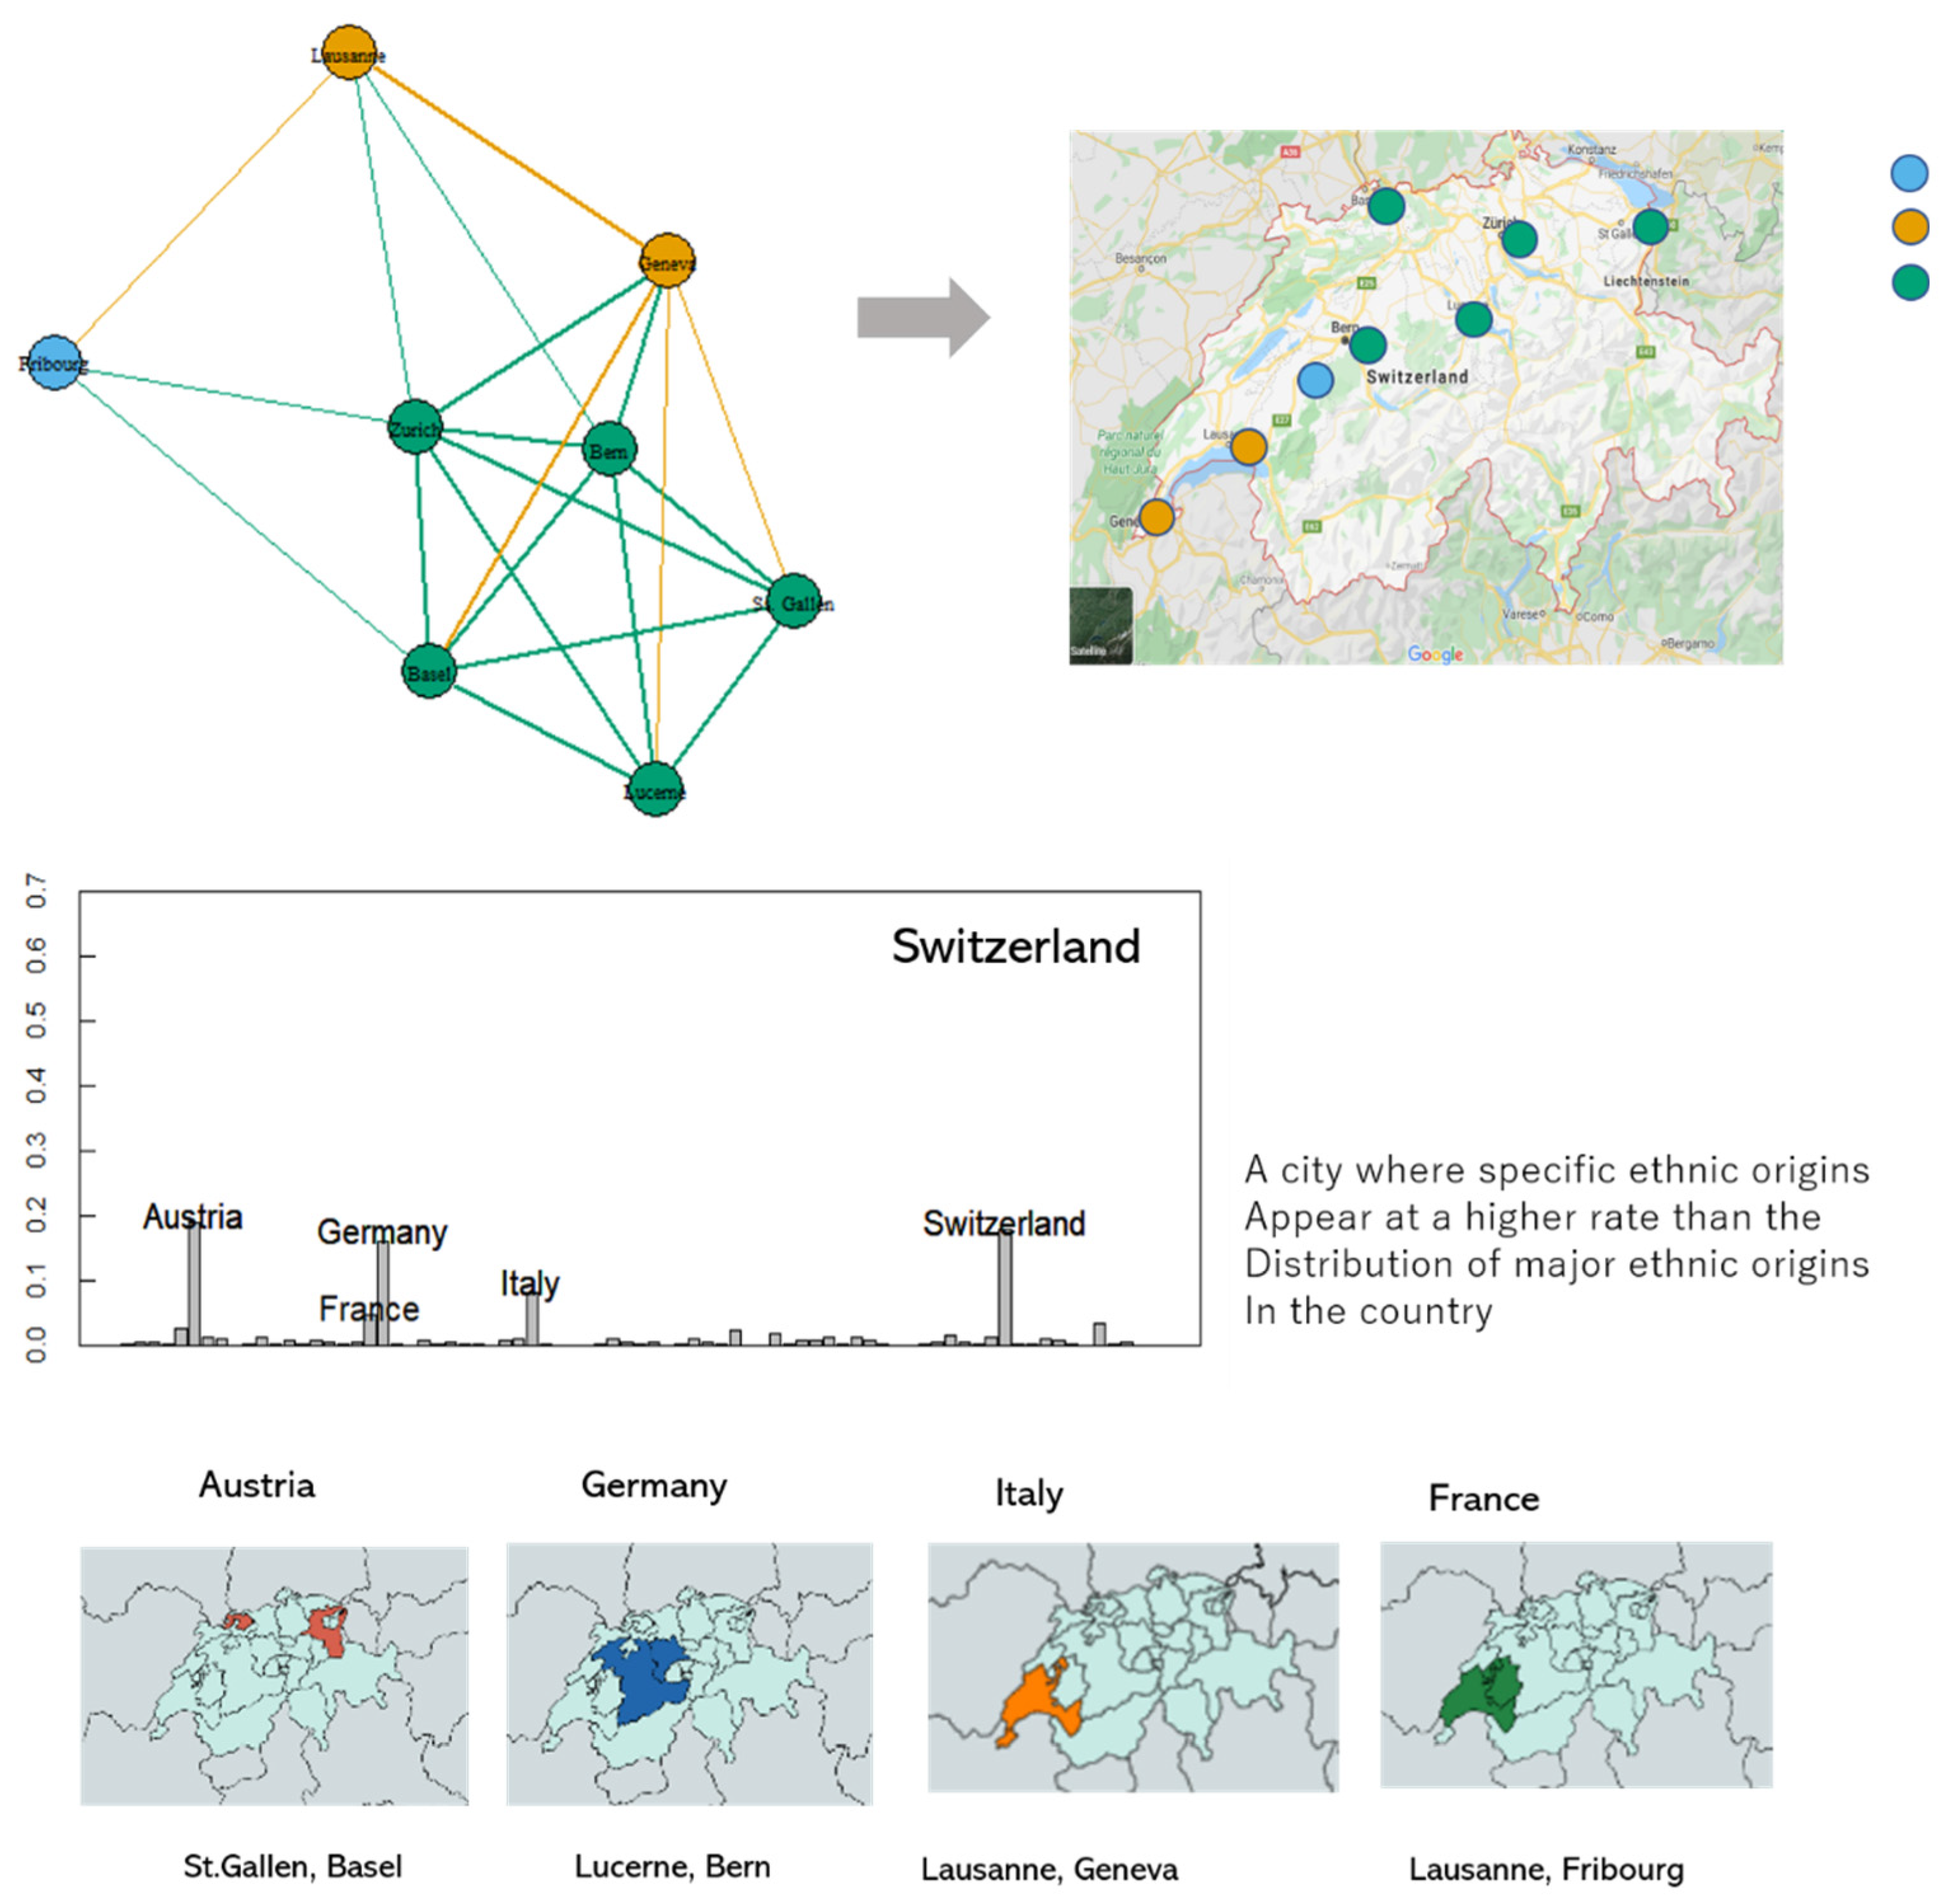
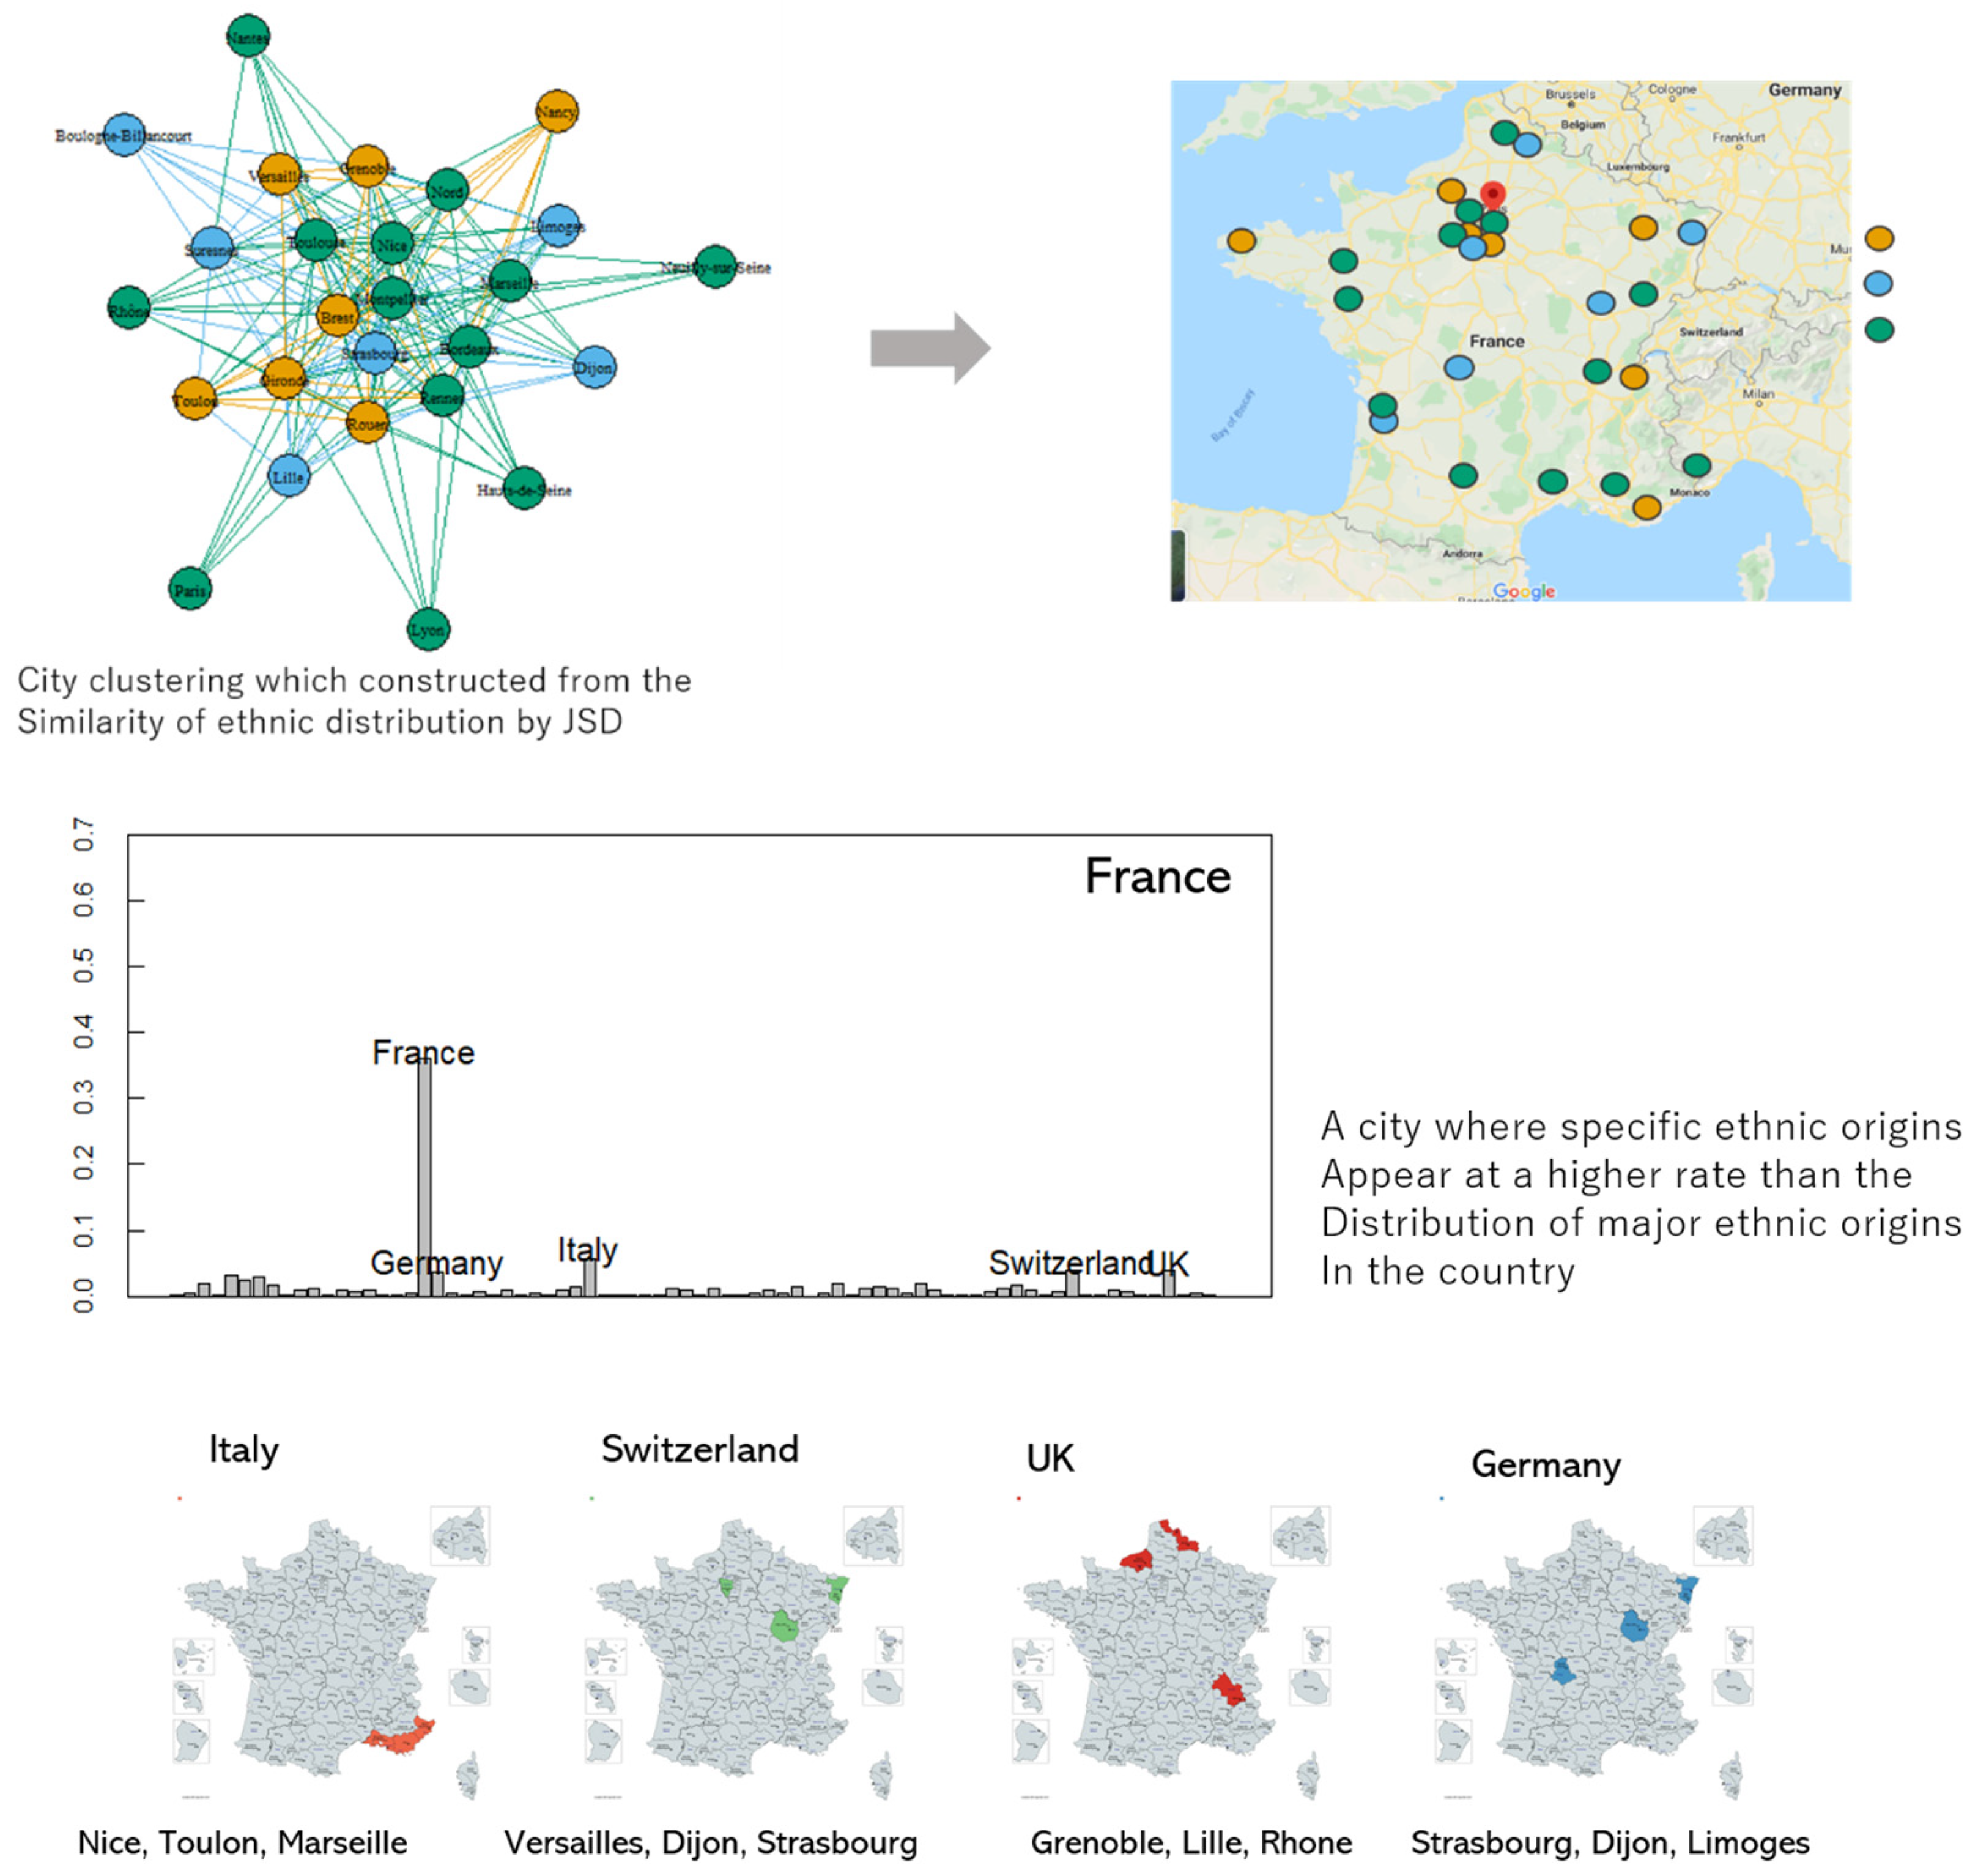
In Europe, many countries share borders, especially with France and Switzerland. In these two countries, although significantly less regional data of business people was available than for the Americas, we were still able to analyze the ethnic distribution of the cities.
In France (Figure 9), the ethnic distributions of such neighboring countries as Spain, Italy, Germany, Switzerland, and the UK are closely related to spatial proximity. We can also estimate in which direction their impact spread. British ethnicity started in such nearby areas as Grenoble and Lille and influenced the Rhone area. Immigrants of Germanic ethnicity also tended to traverse space. The gradual movement of people occurred from Strasbourg (adjacent to Germany) to Limoges. The cities near Italy and Switzerland show a high distribution of ethnic groups with their countries as the origin.
Based on these characteristics, the spatial distribution of the people in France’s economic network is divided mainly into three regions: German and Swiss ethnicities, British and Italian ethnicities, and French ethnicity. Germany and Switzerland are closely related in language and can be extracted as one community.
As in France, the influence of neighboring countries is profound in Switzerland (Figure 10). In particular, the German language culture is liberally distributed in Lucerne and St. Gallen. For Lausanne, since the neighboring Italian and French ethnicities are densely distributed, the ethnic distribution of Switzerland’s economic network is primarily divided into three specific districts: where the distribution of Austrian and German ethnicity is predominant, where Italian and French ethnicity is mixed, and where the French ethnicity is strongly influenced. In Switzerland, however, only a few representative cities can be analyzed because of insufficient individual data.
4. Discussion
4.1. Segregation of Racial and Ethnic Groups in Society
The populations of our modern societies can migrate more conveniently due to transportation and technology developments. As a result, even countries that were formally comprised of a single race are being transformed into societies where various races are being integrated.
Unfortunately, not all societies are balanced and welcome outsiders to join as complete members. In some cases, races or ethnicities form their own groups because they are isolated. Racial segregation is an actuality. Since this phenomenon causes problems in society, it is essential to observe how a race or ethnicity in a society forms a community and integrates. Using our study’s method, such surname data as telephone books can be analyzed at low cost and time investment to observe how race (ethnicity) is placed in society. Our results will help governments take measures to solve such social problems as racial segregation.
4.2. Extensions to Methodology
We tried to train through RNN by separating the surname data into one alphabetic character. However, for more efficient learning, we will also consider creating a classifier by combining it with n-gram. Also, the study targeted only surnames. It needs to be reviewed to see if the combination of surname and first name can increase the precision of prediction. For the first name, unlike surname, the trend of ages, gender, and cultural factors are reflected, so experimentation with the classifier considering them is necessary.
This study can be applied to various fields (biomedical research, demographical research, etc.) based on extensive surname data. Although this study was based on the names of people working in the economic sector, we expect that statistical adjustments applicable to the entire population will allow for a wide range of applications.
4.3. Relationship between Information and Ethnic Networks
A related study on the influence of Chinese ethnicity in the economic field [23] focused on ethnic Chinese and studied the impact of ethnic groups in global economic and trade activities. This work found that the language and cultural aspects commonly used by one nation are deeply related to information. When the difficulties of current activities arise, people seek information for solutions, which can activate ethnic networks with strong linguistic and cultural characteristics. Previous research was confined to a single ethnicity. However, based on our study, research on the relevance of information is possible to a more extended ethnic network.
4.4. Future Economic Environment and National Network
This study addressed ethnic networks based on current economic and trade environments. Our research can be expanded to predict the impact of ethnic networks on future economic environments. Among the changes that will take place in our societies in the future, virtual currency might play an essential role in economies.
Virtual currencies have two main characteristics: decentralization and anonymity. That is, there are no central management agencies, such as financial authorities, and no features that identify the users. Information becomes more critical in virtual currency markets. Because the current virtual currencies have close to zero fundamentals for measuring value, price formation is created by the flow of information, excluding ICO (Initial Coin Offering) issued on a gold basis by the central bank, etc. Given the high relevance of information and ethnic networks, the impact of ethnic networks in virtual currency markets is likely to be significant. We can expand our study to allow the exchange of information in internet communities in each language of the virtual currency and the impact of ethnic networks in virtual currency markets. In other words, studies are possible on how ethnic networks in language-based internet communities affect the pricing and transactions of virtual currencies.
5. Conclusions
This study classified the origins of ethnicity that can be inferred by surnames and analyzed how ethnic linkages are formed in economic networks and how they affect them.
First, as training data for machine learning, we used surname and nationality data of executives in the economic field of ORBIS provided by Bureau van Dijk. These data have large-scale surnames and nationality data of up to 35 million entities. Unlike related studies of name-national and name-ethnic classifications, our work is the first in this research field to construct a classifier using a huge amount of reliable name data.
We used the RNN method to build a surname origin, ethnicity classifier by learning such large-scale data. Although classification models (through text data) can use a variety of statistical methods, we used the RNN method because it was the most efficient of previous studies.
We built a surname origin, ethnicity classifier for 77 countries that had sufficient data among the learning data. We compared the predicted precision of this classifier with relevant studies using the name-nationality data of Olympic athletes. To determine how well the classification results categorized the ethnicities, we compared the manually classified data by residents in the region. We also compared and analyzed the data from the U.S. Census to confirm that the ethnic distribution obtained through our classifier was closely related to the population composition of the particular countries.
Next, we analyzed the spatial distribution of ethnic linkage using the data of the origin (home country) of the people who work in the economic field. Data from Africa and Europe were used. We built a name-origin of an ethnicity classifier for 48 African countries by RNN, which analyzed ethnic networks within the African continent. Similarities were calculated using the JSD method by the origin of the ethnicity distribution in each country to extract the communities in the countries with a similar origin of ethnicity configurations. This identification showed that the ethnic network of the African continent had a very similar form to its distribution of religion, language, and race. This suggests that ethnic networks are strictly related to language and cultural networks. Data from France, and Switzerland were analyzed in the same way as those from Africa. Similarities were calculated with the urban-specific ethnic distribution obtained from the classifier, and a community of cities showing ethnic similarities was extracted using the calculated similarities. Through this analysis, the spatial influence of the ethnic linkages within the economic network was highlighted.
This study is the first to detect a vast network of ethnic linkages within a social group, especially in economics. We expect that expanded research on the impact of ethnicity is possible in such fields as social groups, information networks, international trading, and virtual currency markets.
Author Contributions
Formal analysis, J.J.; Project administration, T.M.; Supervision, T.M.; Writing—original draft, J.J. All authors have read and agreed to the published version of the manuscript.
Funding
This study was supported by JSPS KAKENHI Grant Numbers 17KT0034 and 19K22852.
Acknowledgments
The authors thank Prof. Taiji Furusawa and Prof. Yoichi Sugita with whom much of this work was discussed.
Conflicts of Interest
The authors declare no conflict of interest.
References
- Farrer, L.A.; Cupples, L.A.; Haines, J.L.; Hyman, B.; Kukull, W.A.; Mayeux, R.; Myers, R.H.; Pericak-Vance, M.A.; Risch, N.; Van Duijn, C.M. Effects of Age, Sex, and Ethnicity on the Association Between Apolipoprotein E Genotype and Alzheimer Disease: A Meta-analysis. JAMA 2003, 278, 1349–1356. [Google Scholar] [CrossRef]
- Stacey, J.; De Andrade, M.; Miller, V.M. Genetics of cardiovascular disease: Importance of sex and ethnicity. Atherosclerosis 2015, 241, 219–228. [Google Scholar]
- Gillborn, D. Race, Ethnicity and Education: Teaching and Learning in Multi-Ethnic Schools; Routledge: London, UK, 1990. [Google Scholar]
- Bhopal, K. Gender, ethnicity and career progression in UK higher education: a case study analysis. Res. Pap. Educ. 2019, 1–16. [Google Scholar] [CrossRef]
- McGowen, R. The many colors of crime: Inequalities of race, ethnicity, and crime in America; NYU Press: New York, NY, USA, 2006. [Google Scholar]
- Rojas-Gaona, C.E.; Hong, J.S.; Peguero, A.A. The significance of race/ethnicity in adolescent violence: A decade of review 2005–2015. J. Crim. Justice 2016, 46, 137–147. [Google Scholar] [CrossRef]
- Burchard, E.G.; Ziv, E.; Coyle, N.; Gomez, S.L.; Tang, H.; Karter, A.J.; Mountain, J.L.; Pérez-Stable, E.J.; Sheppard, D.; Risch, N. The importance of race and ethnic background in biomedical research and clinical practice. New Engl. J. Med. 2003, 348, 1170–1175. [Google Scholar] [CrossRef] [PubMed] [Green Version]
- Nanchahal, K.; Mangtani, P.; Alston, M.; dos Santos Silva, I. Development and validation of a computerized South Asian Names and Group Recognition Algorithm (SANGRA) for use in British health-related studies. J. Public Health 2001, 23, 278–285. [Google Scholar] [CrossRef] [PubMed] [Green Version]
- Barr, D.A. Health Disparities in the United States: Social Class, Race, Ethnicity, and Health, 2nd ed.; Johns Hopkins University Press: Baltimore, MA, USA, 2014. [Google Scholar]
- Quesada, J.; Hart, L.K.; Bourgois, P. Structural vulnerability and health: Latino migrant laborers in the United States. Med. Anthropol. 2011, 30, 339–362. [Google Scholar] [CrossRef] [PubMed] [Green Version]
- Lauderdale, D.S.; Kestenbaum, B. Asian American ethnic identification by surname. Popul. Res. Policy Rev. 2000, 19, 283–300. [Google Scholar] [CrossRef]
- Mateos, P. A review of name-based ethnicity classification methods and their potential in population studies. Popul. Space Place 2007, 13, 243–263. [Google Scholar] [CrossRef]
- Schnell, R.; Gramlich, T.; Bachteler, T.; Reiher, J.; Trappmann, M.; Smid, M.; Becher, I. A new Name-Based Sampling Method for Migrants using n-grams. Method Data Anal. 2013, 7, 1. [Google Scholar] [CrossRef]
- Appiah, O. Ethnic identification on adolescents evaluations of advertisements. J. Advert. Res. 2001, 41, 7–22. [Google Scholar] [CrossRef]
- Richard, W. Using names to segment customers by cultural, ethnic or religious origin. J. Direct Data Digit. Mark. Pract. 2007, 8, 226–242. [Google Scholar]
- Coldman, A.J.; Braun, T.; Gallagher, R.P. The classification of ethnic status using name information. J. Epidemiol. Community Health 1988, 42, 390–395. [Google Scholar]
- Ambekar, A.; Ward, C.; Mohammed, J.; Male, S.; Skiena, S. Name-ethnicity classification from open sources. In Proceedings of the 15th ACM SIGKDD international conference on Knowledge Discovery and Data Mining, Paris, France, 28 June–1 July 2009; pp. 49–58. [Google Scholar]
- Chang, J.; Rosenn, I.; Backstrom, L.; Marlow, C. Ethnicity on social networks. In Proceedings of the 4th Int’l AAAI Conference on Weblogs and Social Media, Washington, DC, USA, 23–26 May 2010; pp. 18–25. [Google Scholar]
- Liu, W.; Ruths, D. What’s in a name? using first names as features for gender inference in twitter. In Proceedings of the AAAI spring symposium, Stanford, CA, USA, 25–27 March 2019. [Google Scholar]
- Pennacchiotti, M. Popescu, Ana-Maria A machine learning approach to twitter user classification. In Proceedings of the Fifth International AAAI Conference on Weblogs and Social Media, Catalonia, Spain, 17–21 July 2011; pp. 281–288. [Google Scholar]
- Mazières, A.; Roth, C. Large-scale diversity estimation through surname origin inference. Bull. Sociol. Methodol. 2018, 139, 59–73. [Google Scholar] [CrossRef]
- Overview and Benchmark of Traditional and Deep Learning Models in Text Classification. Available online: https://ahmedbesbes.com/overview-and-benchmark-of-traditional-and-deep-learning-models-in-text-classification.html (accessed on 28 February 2020).
- Race–Census Bureau. Available online: https://www.census.gov/topics/population/race/about.html (accessed on 28 February 2020).
- Hochreiter, S.; Schmidhuber, J. Long short-term memory. Neural Comput. 1997, 9, 1735–1780. [Google Scholar] [CrossRef] [PubMed]
- PyTorch. Available online: https://pytorch.org/ (accessed on 28 February 2020).
- Rosvall, M.; Axelsson, D.; Bergstrom, C.T. The map equation. Eur. Phys. J. Special Topics 2009, 178, 13–23. [Google Scholar] [CrossRef]
- 120 Years of Olympic History: Athletes and Results. Available online: https://www.kaggle.com/heesoo37/120-years-of-olympic-history-athletes-and-results (accessed on 28 February 2020).
- Lee, J.; Kim, H.; Ko, M.; Choi, D.; Choi, J.; Kang, J. Name Nationality Classification with Recurrent Neural Networks. In Proceedings of the IJCAI, Melbourne, Australia, 19–25 August 2017; pp. 2081–2087. [Google Scholar]
- Wikipedia.org. Available online: https://www.wikipedia.org/ (accessed on 28 February 2020).
- World Population Review. Available online: http://worldpopulationreview.com/ (accessed on 28 February 2020).
- CIA Factbook-The World Factbook. Available online: https://www.cia.gov/library/publications/the-world-factbook/ (accessed on 28 February 2020).
- Google Map. Available online: https://maps.google.com/ (accessed on 28 February 2020).
- MapChart: Create Custom Map. Available online: https://mapchart.net/ (accessed on 28 February 2020).
Figure 1.
Confusion matrix of 77 nations; The brighter the color is, the higher is the predicted accuracy of the test dataset.
Figure 1.
Confusion matrix of 77 nations; The brighter the color is, the higher is the predicted accuracy of the test dataset.

Figure 2.
Distribution of ethnicity in each country; (x-axis) countries; (y-axis) probability.


Figure 3.
Request form of Mturk.
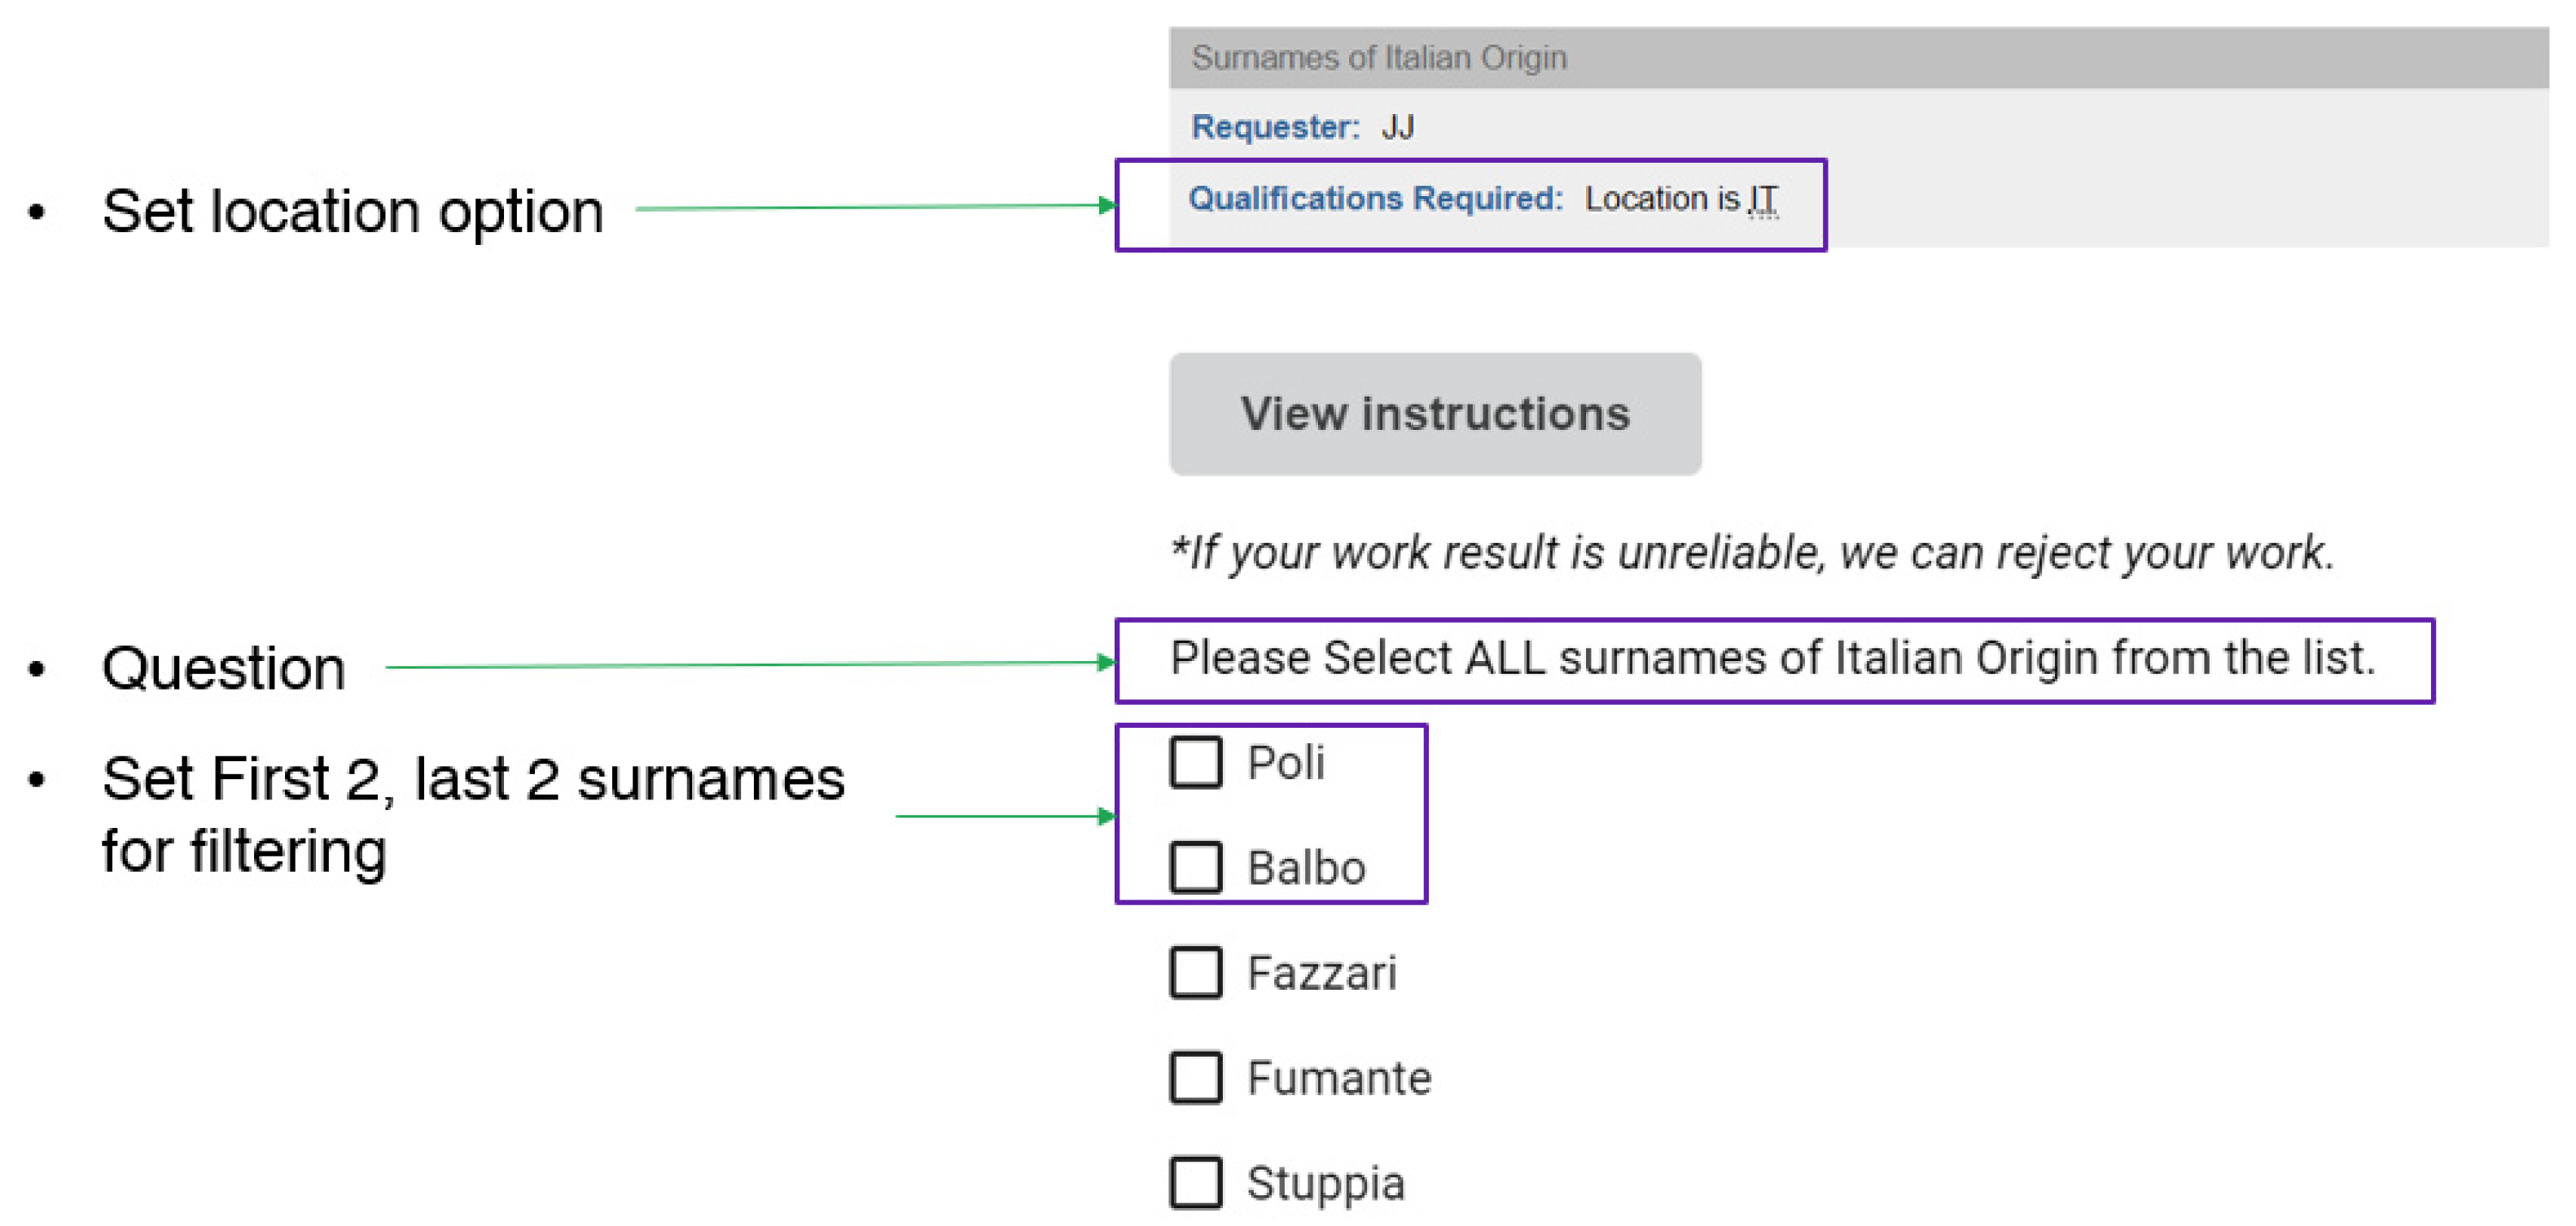
Figure 4.
Relation between human and classifier results. (x-axis) index of surnames; black line represents the rate of correct answers by humans (y-axis of the left), the red line represents predicted difficulty of the classifier (y-axis of right).
Figure 4.
Relation between human and classifier results. (x-axis) index of surnames; black line represents the rate of correct answers by humans (y-axis of the left), the red line represents predicted difficulty of the classifier (y-axis of right).
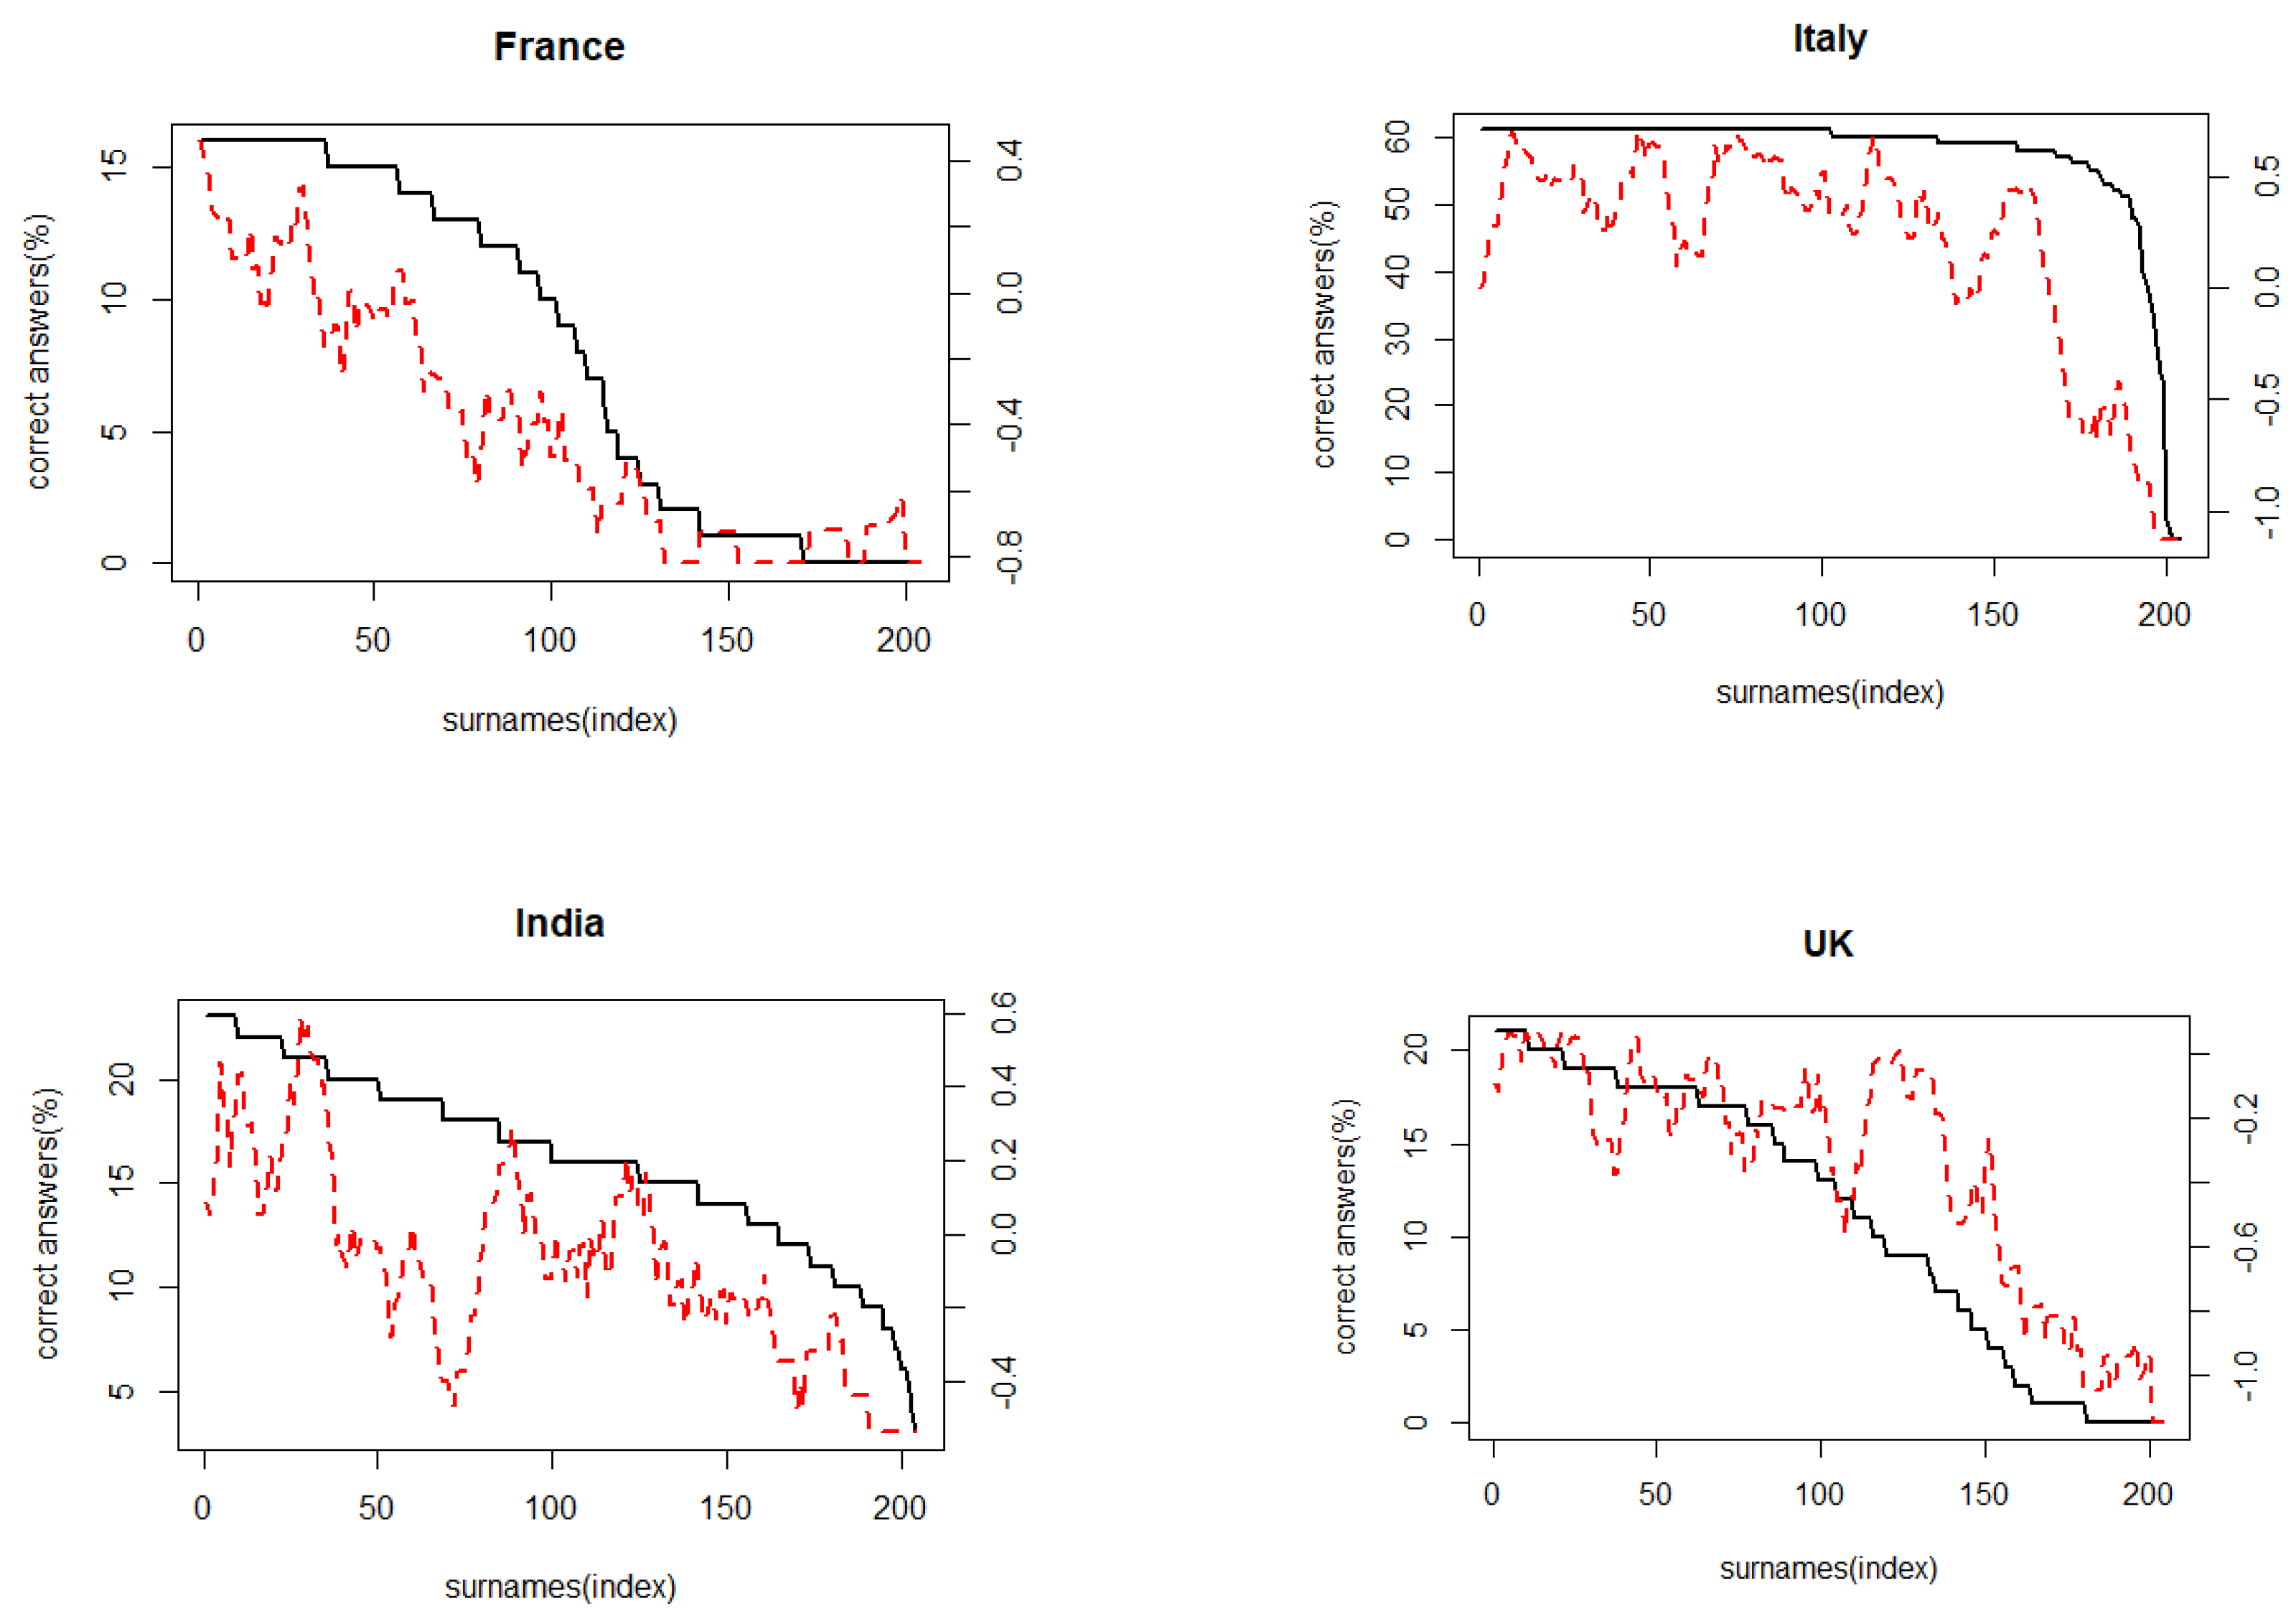

Figure 5.
Relationship of entropy and dominant group.

Figure 6.
Confusion matrix of African continent; The brighter the color is, the higher is the predicted accuracy of the test dataset.
Figure 6.
Confusion matrix of African continent; The brighter the color is, the higher is the predicted accuracy of the test dataset.
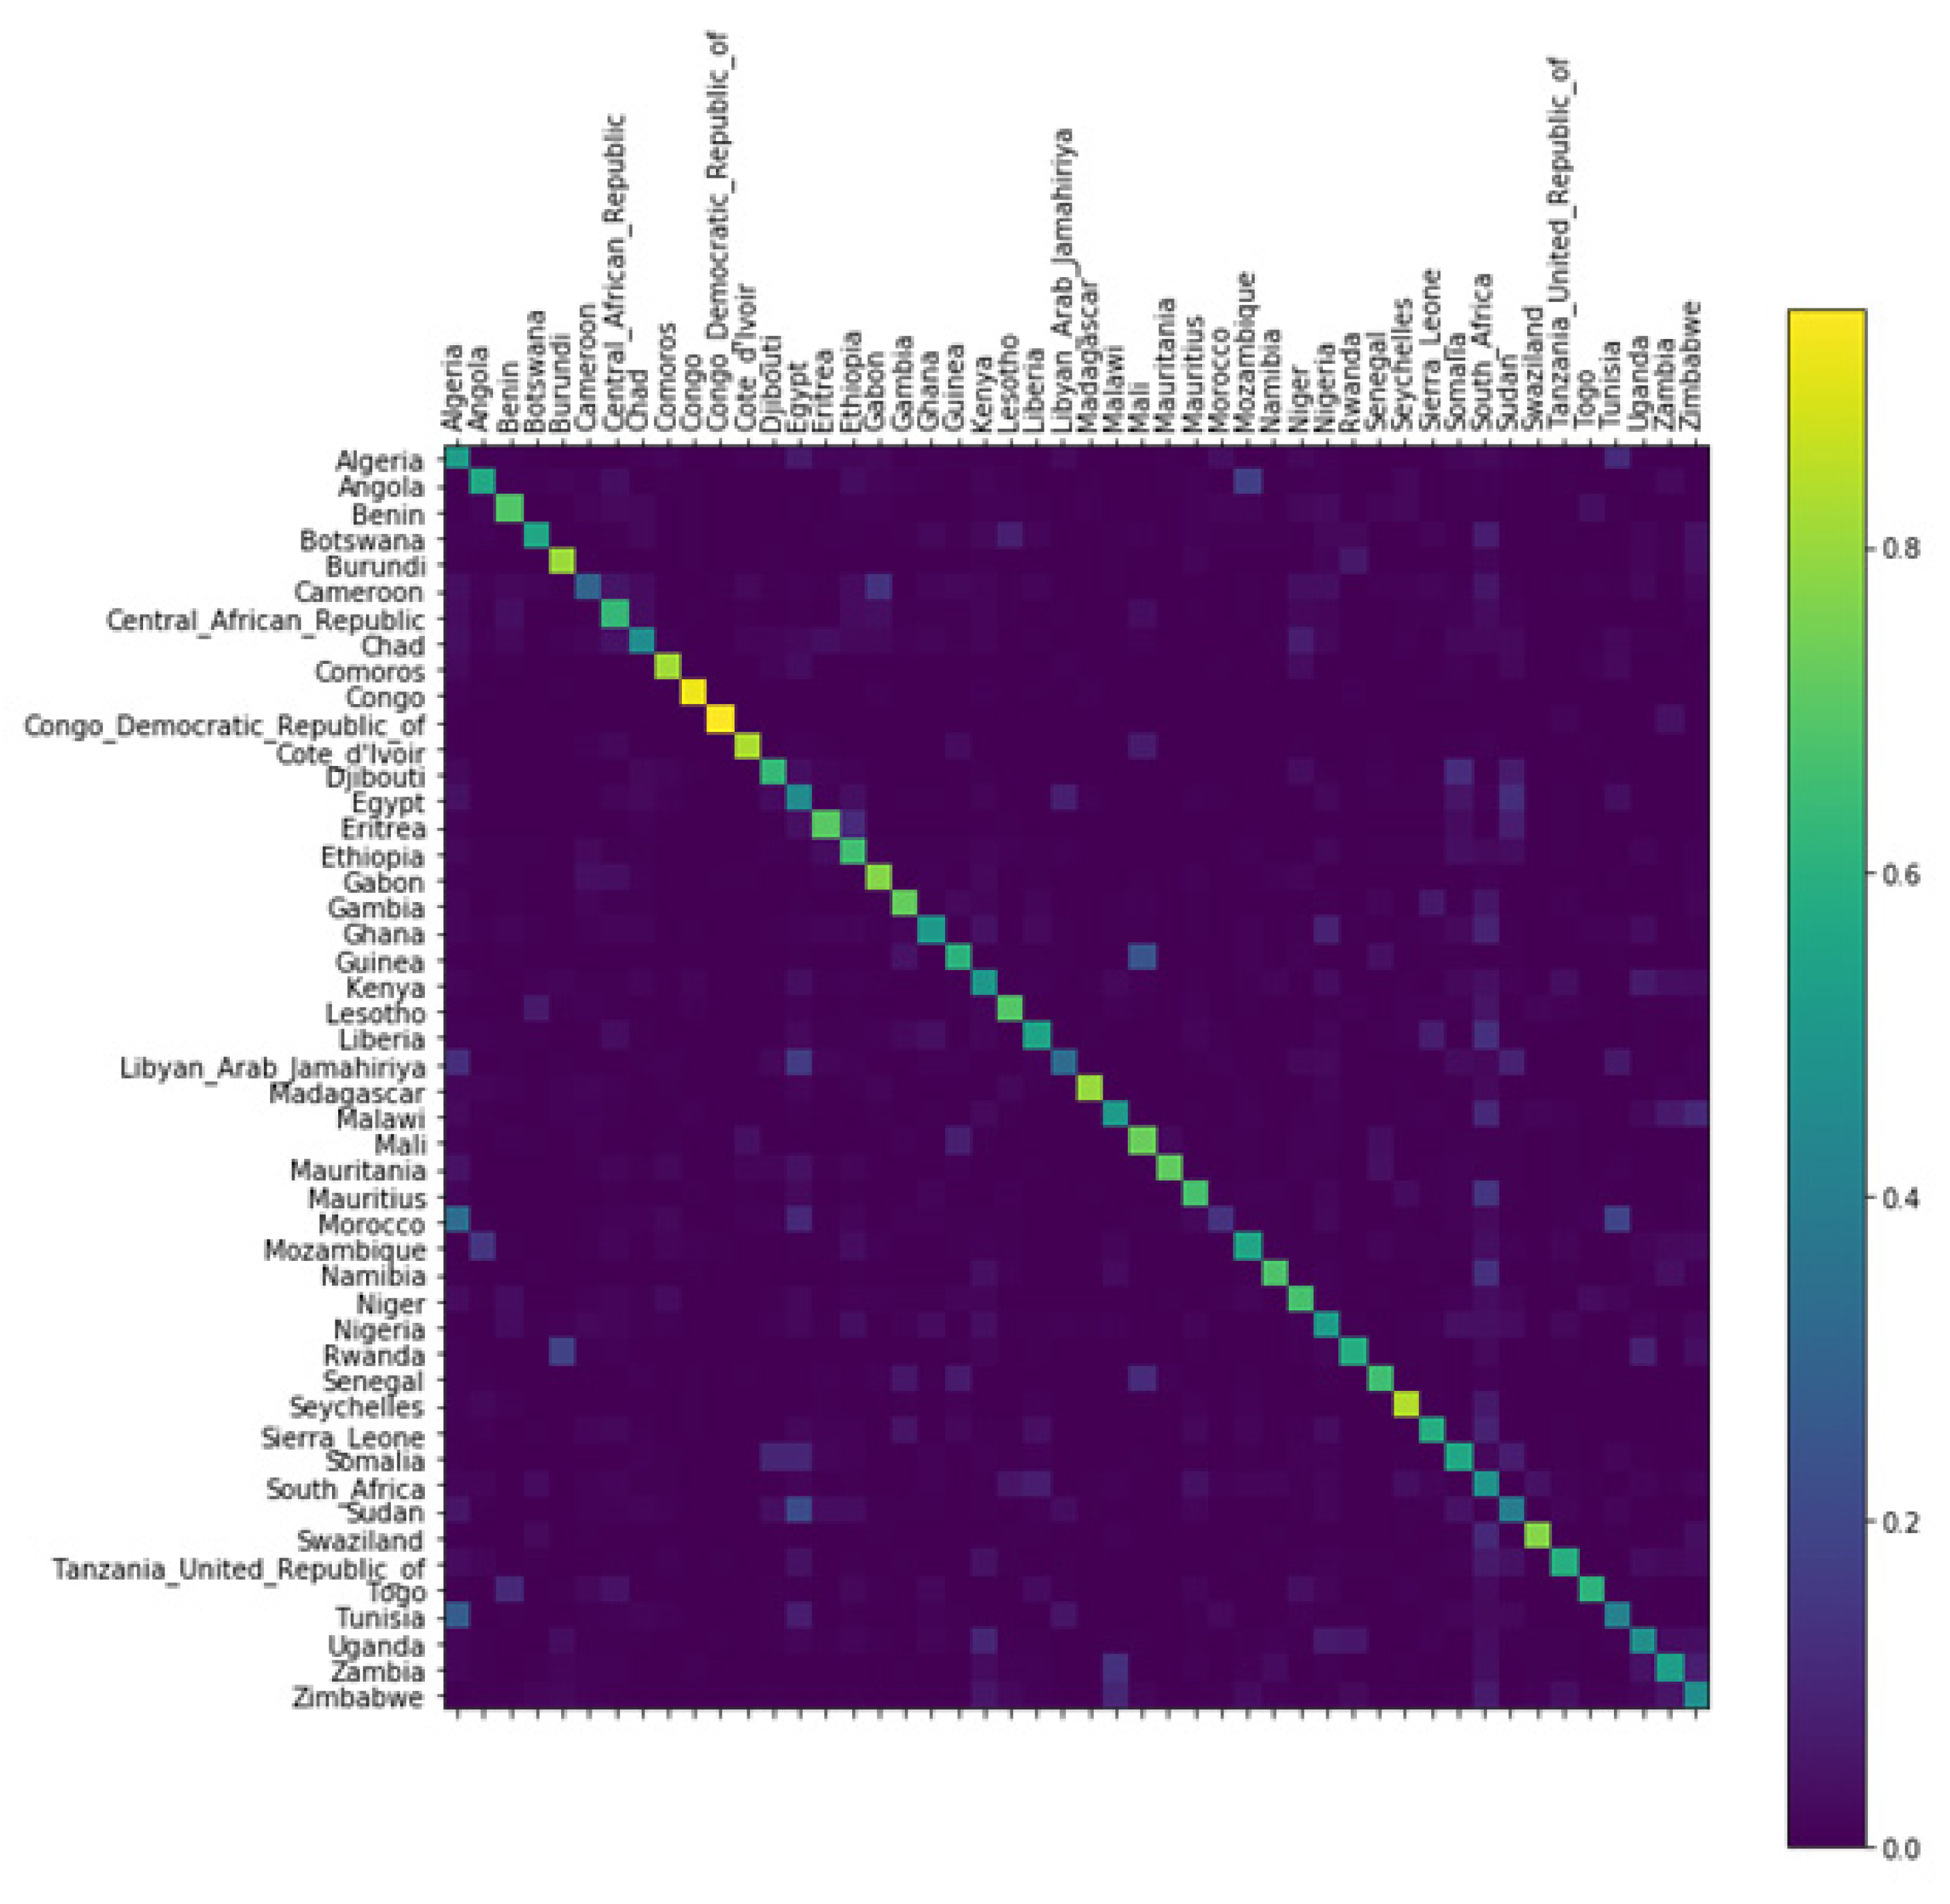
Figure 7.
Example of ethnic distribution in Africa; (x-axis) countries; (y-axis) probability.

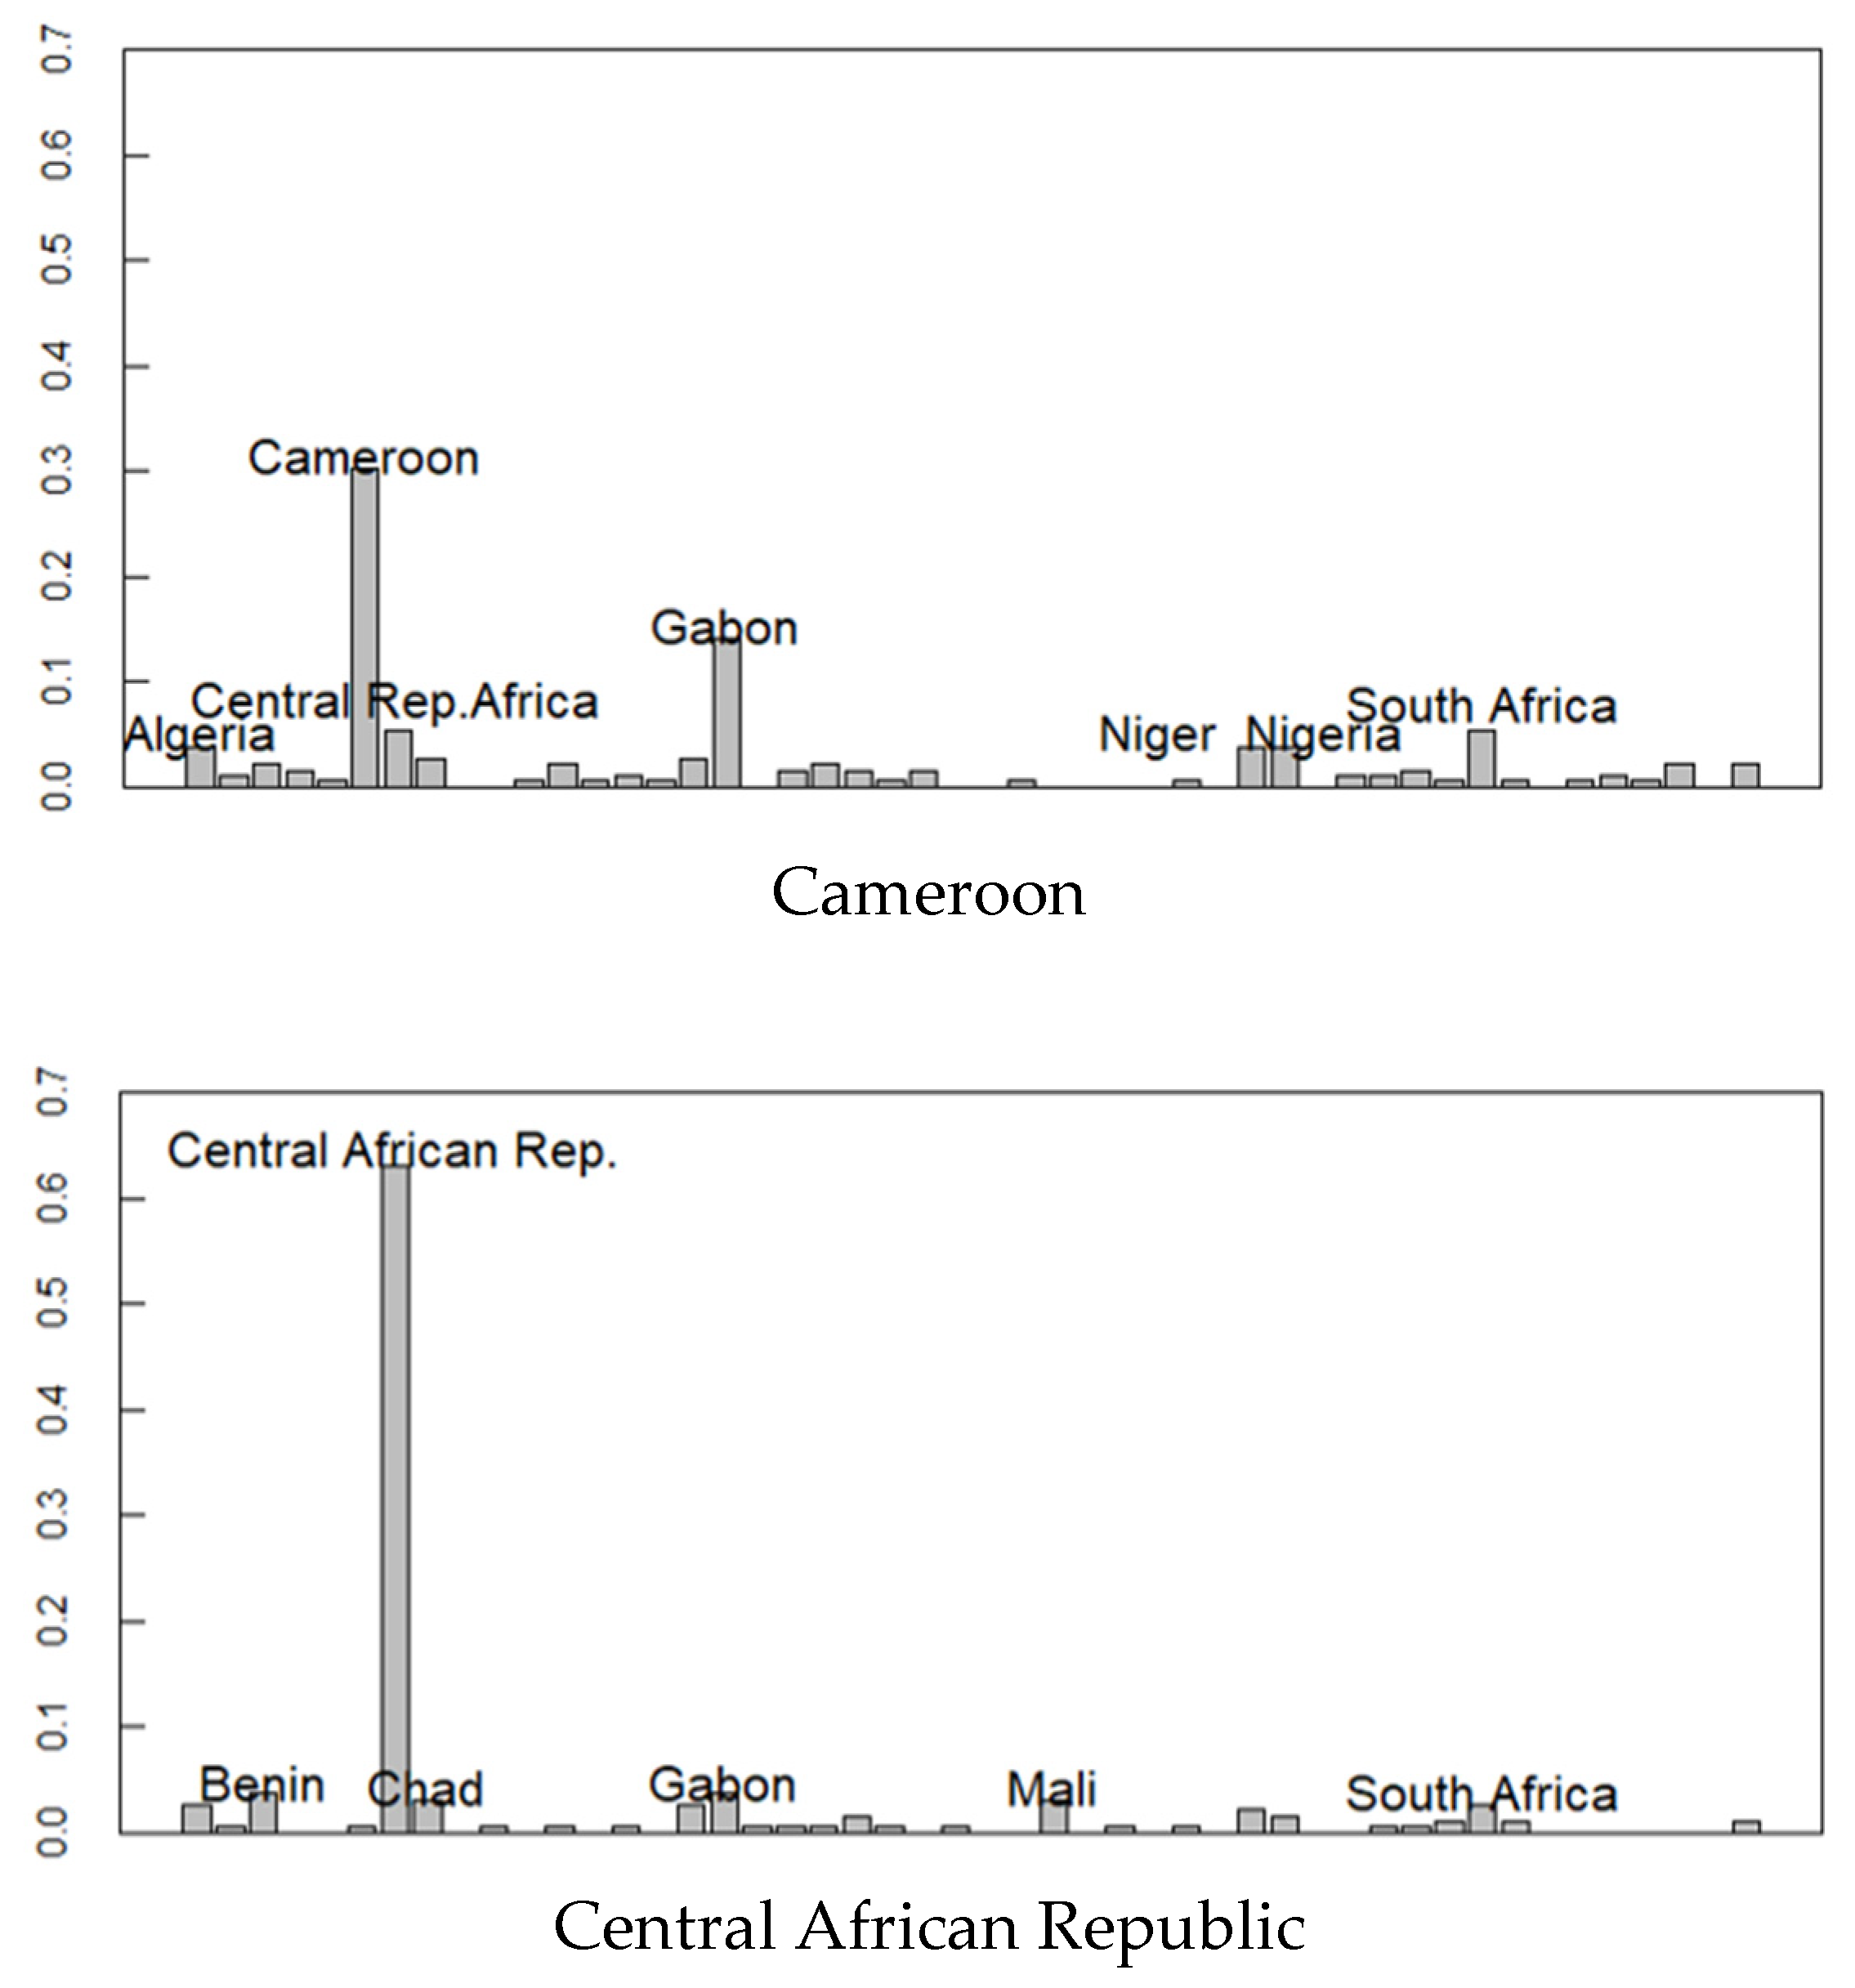
Figure 8.
Network clustered by similarity of ethnic composition.


Table 1.
Prediction results.
| Input | Output (Top 3) (Log-Likelihood) Predicted Nationality |
|---|---|
| Smith | (−0.264) United Kingdom (−0.320) Australia (−0.401) New Zealand |
| Obama | (−0.246) Kenya (−0.424) Nigeria (−0.470) Japan |
| Mori | (−0.042) Japan (−0.614) Papua New Guinea (−0.656) Italy |
Table 2.
Prediction precision of each country.
| Rank | Country | Precision |
|---|---|---|
| 1 | Iceland | 0.95 |
| 2 | Japan | 0.91 |
| 3 | Bulgaria | 0.86 |
| 4 | Greece | 0.85 |
| 5 | Thailand | 0.83 |
| … | ||
| 73 | United States | 0.52 |
| 74 | New Zealand | 0.51 |
| 75 | Australia | 0.51 |
| 76 | Canada | 0.50 |
| 77 | Afghanistan | 0.50 |
| AVG. | 0.66 |
Table 3.
Prediction results with Mturk dataset.
| Region | Balanced Accuracy |
|---|---|
| UK | 0.61 |
| Germany | 0.68 |
| Italy | 0.70 |
| India | 0.57 |
| France | 0.73 |
| Spain | 0.71 |
Table 4.
Racial distribution of each ethnic group in U.S.
| Ethnic Groups | Population (%) | Prediction (%) | Business (%) | Watch List (%) | Physicians (%) | |
|---|---|---|---|---|---|---|
| 1 | Non-Hispanic whites | 69.13 | 68.8 | 69.9 | 75.7 | 61.5 |
| 2 | Hispanics | 12.5 | 11.3 | 6.9 | 8.2 | 11.0 |
| 3 | African Americans | 12.0 | 13.1 | 12.3 | 10.2 | 13.9 |
| 4 | Asian Americans | 3.6 | 6.6 | 10.8 | 5.7 | 13.5 |
Table 5.
Entropy and dominant group of each country.
| Rank | Country | Dominant Ethnic Group | % | Entropy |
|---|---|---|---|---|
| 1 | Rep. of Korea | Korean | 99 | 0.48573 |
| 2 | Iceland | Icelandic | 93 | 0.561222 |
| 3 | Japan | Japanese | 98.5 | 0.853479 |
| 4 | Vietnam | Vietnamese | 85.7 | 1.0056 |
| 5 | Bulgaria | Bulgarian | 85 | 1.223591 |
| … | ||||
| 38 | Belgium | Flemish | 52 | 4.254518 |
| 39 | Canada | Canadian | 32.3 | 4.38808 |
| 40 | Luxembourg | Luxembourgers | 55 | 4.486005 |
| 41 | Philippines | Visayan | 32.9 | 4.563974 |
| 42 | Afghanistan | Pashtun | 42.1 | 4.621831 |
© 2020 by the authors. Licensee MDPI, Basel, Switzerland. This article is an open access article distributed under the terms and conditions of the Creative Commons Attribution (CC BY) license (http://creativecommons.org/licenses/by/4.0/).
Share and Cite
MDPI and ACS Style
Jun, J.; Mizuno, T. Detecting Ethnic Spatial Distribution of Business People Using Machine Learning. Information 2020, 11, 197. https://doi.org/10.3390/info11040197
AMA Style
Jun J, Mizuno T. Detecting Ethnic Spatial Distribution of Business People Using Machine Learning. Information. 2020; 11(4):197. https://doi.org/10.3390/info11040197
Chicago/Turabian StyleJun, Joomi, and Takayuki Mizuno. 2020. "Detecting Ethnic Spatial Distribution of Business People Using Machine Learning" Information 11, no. 4: 197. https://doi.org/10.3390/info11040197
Note that from the first issue of 2016, this journal uses article numbers instead of page numbers. See further details here.