Abstract
This study investigates the long-term trends and variability of heatwaves in Greece, analyzing their frequency, duration, and intensity from 1960 to 2022 using high-quality meteorological data from the Hellenic National Meteorological Service. The research utilizes robust statistical methods, including Theil–Sen regression and the Mann–Kendall trend test, to assess long-term trends across different timescales. The findings reveal a significant increase in heatwave frequency and intensity, particularly in recent decades, with notable seasonal differences. While summer remains the most affected period, an upward trend in spring and autumn heatwaves suggests an extension of the heatwave season. The intensity of heatwaves has also increased, indicating a growing risk to vulnerable populations and critical infrastructure.
Keywords:
climate; heatwaves; extreme events; Theil–Sen; Mann–Kendall; long-term trends; climate change 1. Introduction
Long-term trends in temperature, precipitation and frequency of extreme events verify the impact of climate change. Additional changes on warmer and/or more frequent hot days and nights over most land areas is likely to occur in the early 21st century and are virtually certain in the late 21st century []. Moreover, it is virtually certain that hot extremes have become more frequent and intense across the majority of land areas since the 1950s in contrast to cold extremes exhibiting the opposite behavior []. Projections indicate that compound heatwave and drought events will become more frequent, including the occurrence of concurrent events across multiple regions []. In the future, more frequent, persistent, and intense heatwaves are expected in all inhabited regions, with mid-latitudes and some regions trends amplified by soil drying [].
In the region of Greece, during the June–September warm period between 1958 and 2012, Greece experienced an average of approximately 20 days per year with unusually high temperatures []. Long-term analyses of heatwave events in Athens has revealed an rising annual average in both the number of individual Heatwave Events (HEs) and the total number of heatwave days between 1960 and 2019 []. Additional research on Greece indicates that HEs typically last between 3.7 days and 7.5 days []. A similar study indicated that the number of HEs has increased to one per summer and with heatwave days ranging between 3.5 and 7.7 days per summer since 2010 [].
Existing studies are constrained by the weather station data availability, which is often sparse and may lack the required spatial resolution to correctly capture regional variations. Furthermore, identifying long-term trends and patterns requires extensive time series data, which are frequently unavailable. In addition, natural variability and extreme events must be taken into account. Studies that do employ extended time series typically suffer from restricted spatial coverage. This often leads characterizing HEs for a single region and failing to consider Greece’s diverse geography.
In contrast, the present study examines the spatiotemporal evolution of heatwaves in Greece by utilizing a long-term, homogenized, high-quality dataset (1960–2022) with sufficient spatial coverage across the country. It concentrates exclusively on the identification of HEs using verified definitions from the existing literature and introduces both spatial and intensity classifications of these events.
2. Data and Methods
Greece is situated in the southeastern part of Europe, between 34° and 42° N latitude and 19° to 28° E longitude. The complex topography leads the classification of Greece’s climate into 11 categories under the Köppen–Geiger system []. Most of Greece falls under the Mediterranean Csa and Csb categories, characterized by mild, rainy winters and warm, dry summers with abundant sunshine. Temperatures range from 5 to 10 °C near the coast to 0–5 °C inland during the coldest months, and reach 29–35 °C during the warmest period (late July to early August). The study utilized long-term homogenized daily maximum temperature (TX) data from a network of 67 weather stations operated by the Hellenic National Meteorological Service (HNMS) between 1960 and 2022. The study area was divided into seven distinct climatic regions based on the Köppen climate classification system and the high degree of correlation observed in the stations’ daily temperature data []. These regions, as shown in Figure 1, include (A) northern Greece, (B) western Macedonia, Epirus, western Central Greece, Peloponnese, (C) western Greece, (D) mainland-central Greece, the (E) north and central Aegean, the (F) east Aegean and Dodecanese, and (G) Crete and the southern Aegean.
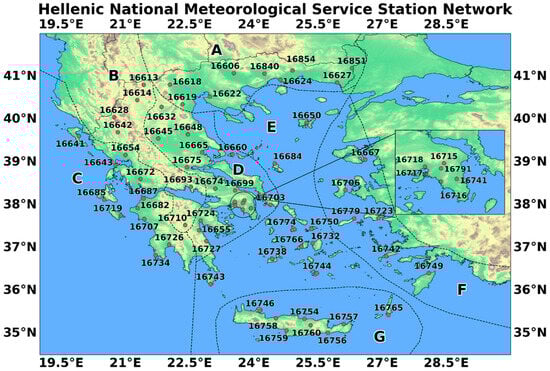
Figure 1.
HNMS weather station network and climate regions.
According to the World Meteorological Organization (WMO), a heatwave is defined as a prolonged period of significantly above-average temperatures, frequently defined referencing a relative temperature threshold, lasting from two days to several months []. In this study, we define a heatwave day as any day when the TX exceeds the climatological daily TX percentile-based threshold. A heatwave event is characterized as a period of at least three consecutive heatwave days. The analysis is conducted for each weather station and calendar day separately. The climatological TX percentile values are computed with respect to the 1961–1990 climate reference period. To mitigate the impact of artificial discontinuities at the beginning and end of the period used for the percentile calculations, the thresholds are determined by applying the bootstrap resampling procedure []. Additionally, we define five Intensity Categories (ICs), based on the daily TX percentiles from least to most intense: C1, C2, C3, C4, and C5 for 75th, 80th, 85th, 90th, and 95th percentiles respectively.
The study utilized statistical methods to analyze HE characteristics on seasonal and annual timescales, by calculating three key indices, commonly found in the existing literature, which quantify the frequency, duration, intensity, and spatial coverage of HEs, aspresented in Table 1 [].

Table 1.
HE frequency, duration, and severity climatological indices definitions.
The study utilizes the Theil–Sen (TS) estimator to assess long-term trends in heatwave frequency, duration, and intensity [,]. This estimator is preferred over ordinary least squares regression due to its robustness against outliers, non-normal distributions, and heteroscedasticity in climatic data. Furthermore, the Mann–Kendall (MK) test is employed to detect monotonic trends in heatwave indices, with the Hamed and Rao modified version used to account for serial correlation and enhance statistical robustness [,,]. A 5% significance level is adopted to determine statistically significant trends.
3. Results
The analysis of the statistically significant trends across all stations demonstrates a predominance of positive over negative trends for all climatological indices, as shown in Figure 2 and confirmed by the MK trend test. Specifically for the HF index, 79.10% of stations for C5 and over 80% stations for the other ICs exhibited positive trends while no negative trends were found. Similarly, the HD index shows positive trends for 68.66%, 67.16%, 46.27%, 17.91%, and 11.94% of stations from C1 to C5, respectively, and no negative trends overall. The HS index presents a similar pattern, with a decreasing rate of positive trends from 56.72% for C1 to 29.85% for C5. However, a small percentage of stations—1.49% for C1, 1.49% for C2, and 2.99% for C3—present negative trends.
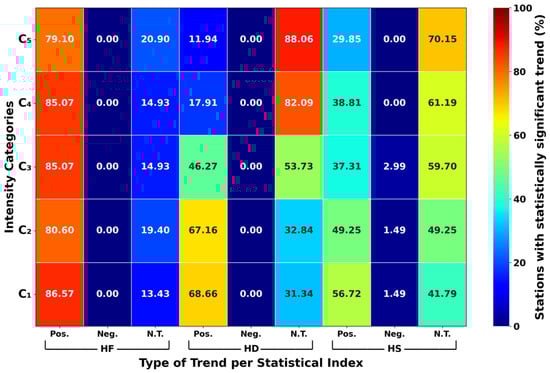
Figure 2.
Percentage of stations with a statistically significant trend per IC for each climatological index. “Pos.” refers to a statistically significant positive trend, “Neg.” to a statistically significant negative trend, and “N.T.” to a non-statistically significant trend.
The seasonal analysis reveals distinct trends across the three indices, as presented in Figure S1. In winter, only a small proportion of stations show positive trends. Spring suggests a clear positive trend in the HF index, ranging from 71.6% to 13.4%. HD and HS have relatively low positive trend percentages, with no negative trends. The highest positive trends occur in summer, with HF reaching 94.0% for C1 and 35.8% for C5. HD and HS also exhibit positive trends, though lower in magnitude. A small percentage of stations show negative trends in HD and HS. Autumn shows limited positive trends, with HD having the highest at 70.2% for C1. Overall, negative trends are rare across all indices and seasons.
The inter-analysis, as illustrated in Figure 3, Figures S2 and S3, of the MK test results indicates HF positive trends across Greece, with the most significant trends occurring in regions A, D, and C. Region D exhibits the smallest increases and region F shows the highest. Seasonal patterns reveal that winter and spring have experienced the most widespread increases, while autumn has seen only scattered positive trends, with one station on Samos showing a negative trend. Overall, the data suggests a general increase in heatwave frequency and intensity across Greece in recent decades.
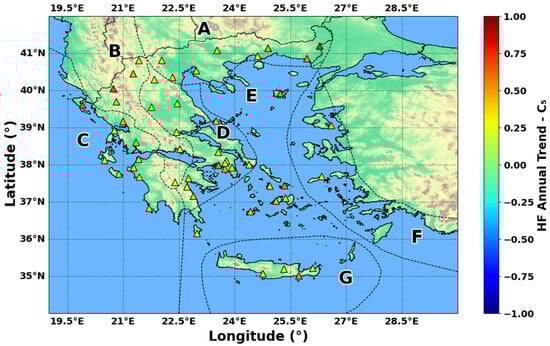
Figure 3.
Statistically significant trend values of the HF index for C5, based on the MK test and TS regression.
Examining the annual changes in HD, the categories C1 to C3 show widespread statistically significant positive trends, except for a single station in region F for C2. However, the more intense categories, C4 and C5, exhibit positive trends are primarily located in region C. Seasonally, fewer than 10 stations show statistically significant trends in winter, with most ranging from 0.0 to 0.2 days per year. In spring, positive HD trends for C1–C4 mostly present positive trends in regions D and G, while C5 is mainly in regions C and A. In summer, positive trends are widespread for C1–C3, but more localized for C4 (region C and northern region B) and the most intense ICs. During autumn, the lower ICs show widespread positive trends across Greece, while C4 and C5 have more localized positive trends in region C and northern region B.
The inter-annual analysis of HS trends shows mostly positive trends across Greece, with the exception of region F and the northern part of region D. The trends range from 0.0 to 0.2 K per year for HS in regions C1 and C2. Category C3 and C4 exhibit similar spatial patterns but with fewer stations. C5 has limited stations with significant trends. No statistically significant negative trends were found. Seasonally, winter has the strongest positive trends, up to 0.50 K per year for C1, primarily in regions B, C, and D. In spring, all ICs show only positive trends, primarily in regions B (for C1 and C5) and D (for the remaining ICs), with trends ranging from 0.007 to 0.048 K per year. In summer, both positive and negative trends exist, ranging from −0.061 K per year (C5, region B) to 0.0137 K per year (C5, region G). Autumn has mostly positive trends, with values from 0.007 to 0.133 K per year in regions A and B.
4. Conclusions
The study revealed that Heatwave Events (HEs) across Greece exhibited positive trends in frequency, duration, and severity from 1960 to 2022. In contrast to most other studies in Greece, which typically use a single station or fewer than ten stations for their analysis, our study utilizes data from 67 weather stations across the country. This broader dataset allows for improved identification and classification of HEs. Specifically, Heatwave Frequency (HF) showed the highest percentage of positive trends, reaching approximately 80% for all ICs. Additionally, Heatwave Duration (HD) and Heatwave Severity (HS) exhibited positive trends in the inter-annual analysis, albeit with lower percentages compared to HF. The percentage of stations showing positive trends decreased as the intensity of Intensity Categories (ICs) increased. Conversely, negative trends in HS were observed in a small number of stations. The strongest trends were observed in spring and summer, with minimal changes in the other seasons. Spatial analysis revealed widespread positive HF trends in northern and western Greece, while HD and HS trends were generally positive but more limited for higher intensities. Lower-intensity HE exhibited more widespread positive trends, whereas higher-intensity HE trends were more localized in northern and western regions. This study provides valuable insights and crucial information into the climatology of HE in Greece. It contributes to the expanding evidence base on climate change impacts, particularly regarding HE, underscoring the necessity for relevant policies, disaster preparedness, and mitigation strategies to address the growing frequency and intensity of HE especially during the summer months.
Supplementary Materials
The following supporting information can be downloaded at: https://www.mdpi.com/article/10.3390/eesp2025035079/s1, Figure S1: Percentage of stations with a statistically significant trend per IC for HF per season. “Pos.” refers to a statistically significant positive trend, “Neg.” to a statistically significant negative trend, and “N.T.” to a non-statistically significant trend; Figure S2: Percentage of stations with statistically significant trend according to IC for the HD index and C5, based on the MK test and TS regression; Figure S3: Percentage of stations with statistically significant trend according to IC for the HS index and C5, based on the MK test and TS regression.
Author Contributions
Conceptualization, P.I. and A.A.A.; methodology, P.I. and A.A.A.; formal analysis, P.I.; data curation, A.M. and V.A.; writing—original draft preparation, P.I.; writing—review and editing, P.I. and A.A.A.; visualization, P.I.; supervision, A.A.A. All authors have read and agreed to the published version of the manuscript.
Funding
This research received no external funding.
Institutional Review Board Statement
Not applicable.
Informed Consent Statement
Not applicable.
Data Availability Statement
The data that support the findings of this study are not publicly available due to third-party restrictions.
Acknowledgments
The authors have reviewed and edited the output and take full responsibility for the content of this publication.
Conflicts of Interest
The authors declare no conflicts of interest.
Abbreviations
The following abbreviations are used in this manuscript:
| HE | Heatwave Event |
| TX | Maximum Temperature |
| HNMS | Hellenic National Meteorological Service |
| WMO | World Meteorological Organization |
| IC | Intensity Category |
| HF | Heatwave Frequency |
| HD | Heatwave Duration |
| HS | Heatwave Severity |
| TS | Theil–Sen |
| MK | Mann–Kendall |
References
- Stocker, T.F.; Qin, D.; Plattner, G.-K.; Tignor, M.; Allen, S.K.; Boschung, J.; Nauels, A.; Xia, Y.; Bex, V.; Midgley, P.M. IPCC, 2013: Climate Change 2013: The Physical Science Basis. Contribution of Working Group I to the Fifth Assessment Report of the Intergovernmental Panel on Climate Change; Cambridge University Press, Intergovernmental Panel on Climate Change: Cambridge, UK; New York, NY, USA, 2013; p. 1535. [Google Scholar]
- Masson-Delmotte, V.; Zhai, P.; Pirani, A.; Connrs, S.L.; Péan, C.; Berger, S.; Caud, N.; Chen, Y.; Goldfarb, L.; Gomis, M.I.; et al. IPCC, 2021: Climate Change 2021: The Physical Science Basis. Contribution of Working Group I to the Sixth Assessment Report of the Intergovernmental Panel on Climate Change; Cambridge University Press, Intergovernmental Panel on Climate Change: Cambridge, UK; New York, NY, USA, 2021; p. 2391. [Google Scholar]
- Core Writing Team; Lee, H.; Romero, J. IPCC, 2023: Climate Change 2023: Synthesis Report. Contribution of Working Groups I, II and III to the Sixth Assessment Report of the Intergovernmental Panel on Climate Change; Intergovernmental Panel on Climate Change: Geneva, Switzerland, 2023; p. 184. [Google Scholar] [CrossRef]
- Domeisen, D.I.V.; Eltahir, E.A.B.; Fischer, E.M.; Knutti, R.; Perkins-Kirkpatrick, S.E.; Schär, C.; Seneviratne, S.I.; Weisheimer, A.; Wernli, H. Prediction and Projection of Heatwaves. Nat. Rev. Earth Environ. 2022, 4, 36–50. [Google Scholar] [CrossRef]
- Tolika, K. Assessing Heat Waves over Greece Using the Excess Heat Factor (EHF). Climate 2019, 7, 9. [Google Scholar] [CrossRef]
- Founda, D.; Katavoutas, G.; Pierros, F.; Mihalopoulos, N. The Extreme Heat Wave of Summer 2021 in Athens (Greece): Cumulative Heat and Exposure to Heat Stress. Sustainability 2022, 14, 7766. [Google Scholar] [CrossRef]
- Galanaki, E.; Giannaros, C.; Kotroni, V.; Lagouvardos, K.; Papavasileiou, G. Spatio-Temporal Analysis of Heatwaves Characteristics in Greece from 1950 to 2020. Climate 2022, 11, 5. [Google Scholar] [CrossRef]
- Kotroni, V.; Bezes, A.; Dafis, S.; Founda, D.; Galanaki, E.; Giannaros, C.; Giannaros, T.; Karagiannidis, A.; Koletsis, I.; Kyros, G.; et al. Long-Term Statistical Analysis of Severe Weather and Climate Events in Greece. Atmosphere 2025, 16, 105. [Google Scholar] [CrossRef]
- Beck, H.E.; McVicar, T.R.; Vergopolan, N.; Berg, A.; Lutsko, N.J.; Dufour, A.; Zeng, Z.; Jiang, X.; van Dijk, A.I.J.M.; Miralles, D.G. High-Resolution (1 Km) Köppen-Geiger Maps for 1901–2099 Based on Constrained CMIP6 Projections. Sci. Data 2023, 10, 724. [Google Scholar] [CrossRef] [PubMed]
- Mamara, A.; Argiriou, A.A.; Anadranistakis, M. Homogenization of Mean Monthly Temperature Time Series of Greece. Int. J. Climatol. 2012, 33, 2649–2666. [Google Scholar] [CrossRef]
- Zhang, X.; Hegerl, G.; Zwiers, F.W.; Kenyon, J. Avoiding Inhomogeneity in Percentile-Based Indices of Temperature Extremes. J. Clim. 2005, 18, 1641–1651. [Google Scholar] [CrossRef]
- He, Y.; Fang, J.; Xu, W.; Shi, P. Substantial Increase of Compound Droughts and Heatwaves in Wheat Growing Seasons Worldwide. Int. J. Climatol. 2021, 42, 5038–5054. [Google Scholar] [CrossRef]
- Theil, H. A Rank-Invariant Method of Linear and Polynomial Regression Analysis. Ned. Akad. Wet. 1950, 53, 386–392. [Google Scholar]
- Sen, P.K. Estimates of the Regression Coefficient Based on Kendall’s Tau. J. Am. Stat. Assoc. 1968, 63, 1379–1389. [Google Scholar] [CrossRef]
- Mann, H.B. Nonparametric Tests Against Trend. Econometrica 1945, 13, 245–259. [Google Scholar] [CrossRef]
- Kendall, M.G. Rank Correlation Methods, 4th ed.; Charles Griffin: London, UK, 1975. [Google Scholar]
- Hamed, K.H.; Ramachandra Rao, A. A Modified Mann-Kendall Trend Test for Autocorrelated Data. J. Hydrol. 1998, 204, 182–196. [Google Scholar] [CrossRef]
Disclaimer/Publisher’s Note: The statements, opinions and data contained in all publications are solely those of the individual author(s) and contributor(s) and not of MDPI and/or the editor(s). MDPI and/or the editor(s) disclaim responsibility for any injury to people or property resulting from any ideas, methods, instructions or products referred to in the content. |
© 2025 by the authors. Licensee MDPI, Basel, Switzerland. This article is an open access article distributed under the terms and conditions of the Creative Commons Attribution (CC BY) license (https://creativecommons.org/licenses/by/4.0/).