
Northern Hemisphere Flow Regime Transitions, Blocking, and the Onset of Spring in the Central USA during Late Winter 2019 and 2021


Abstract
:1. Introduction
2. Materials and Methods
2.1. Data
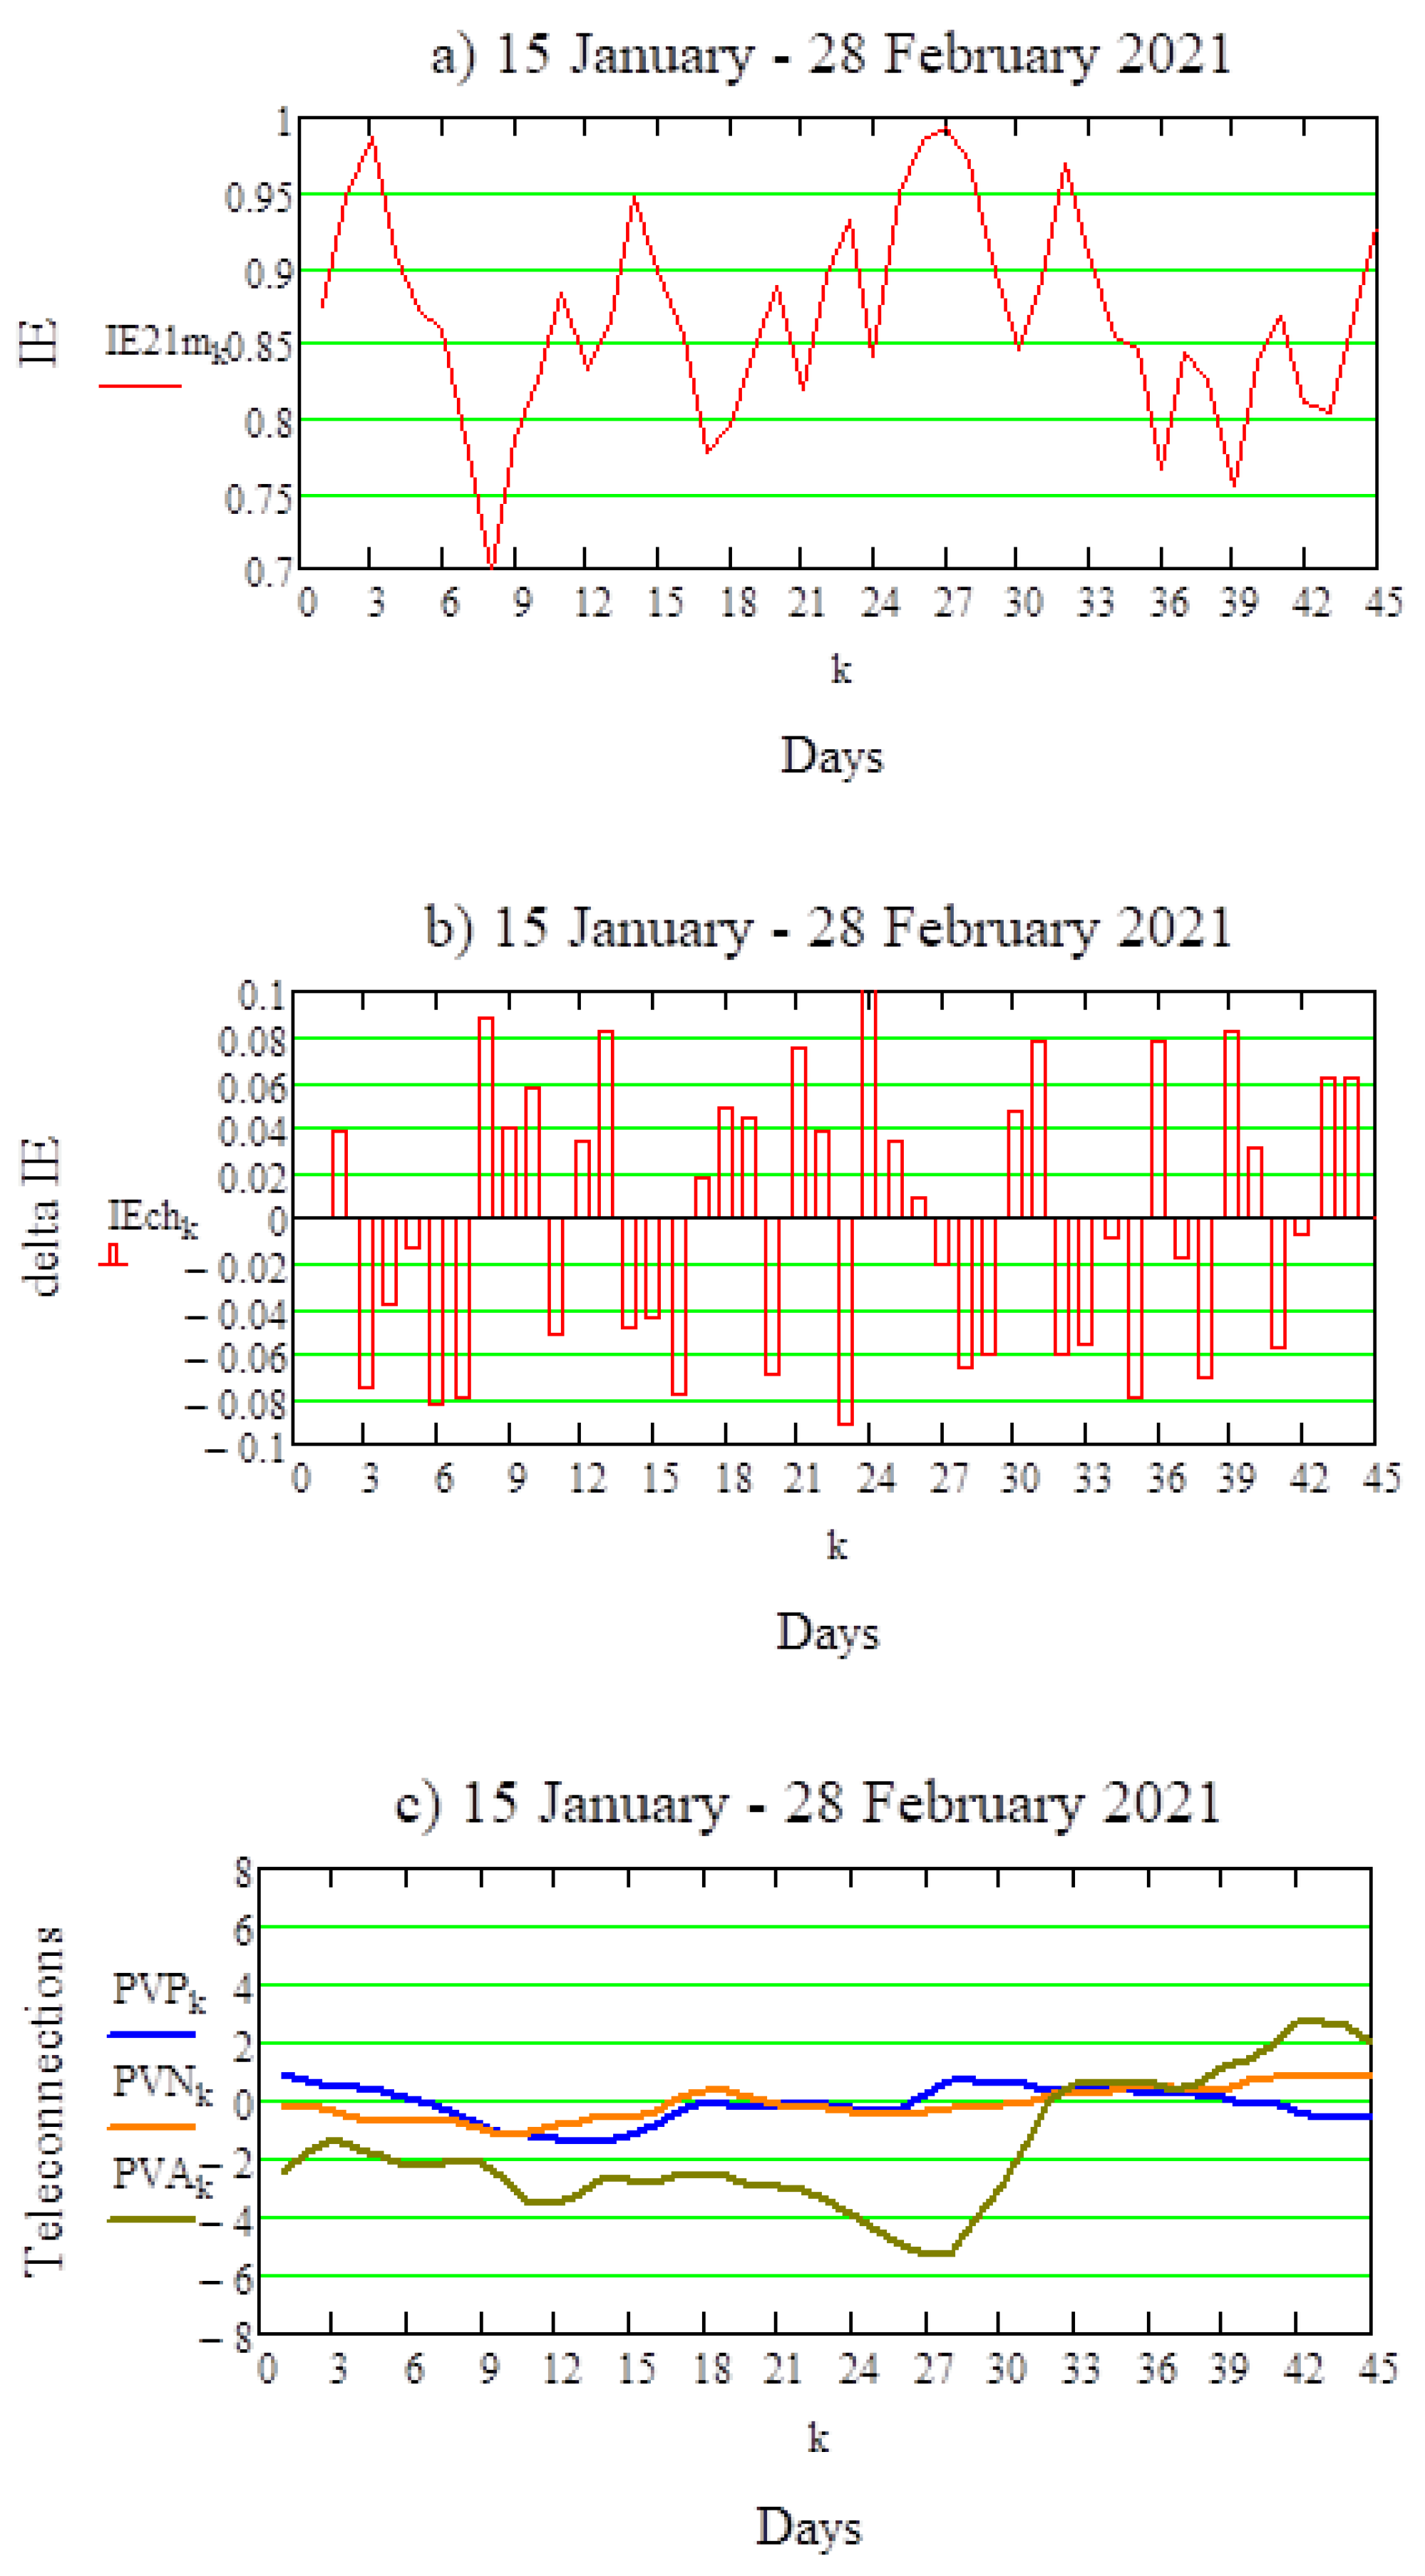
2.2. Methods
3. Results
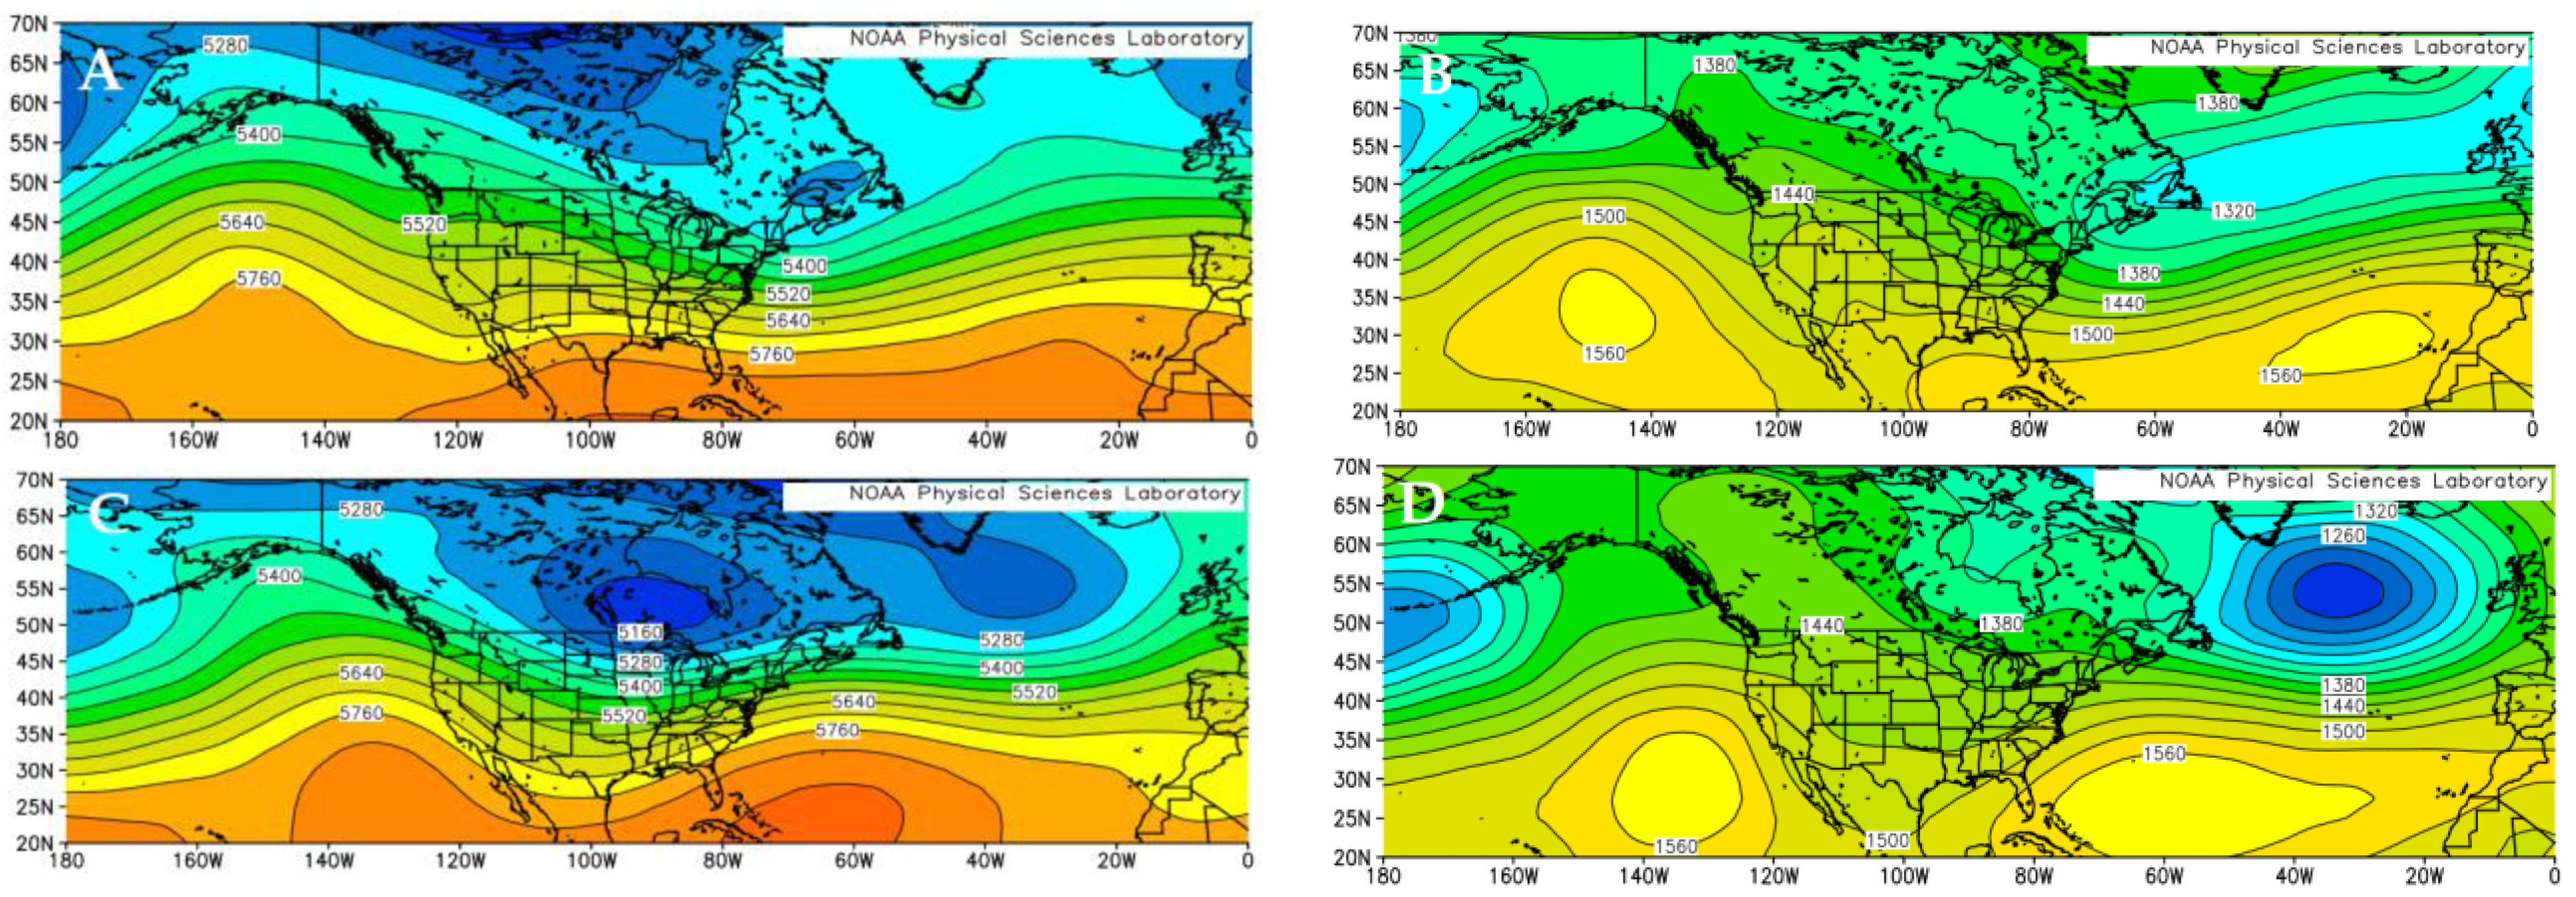
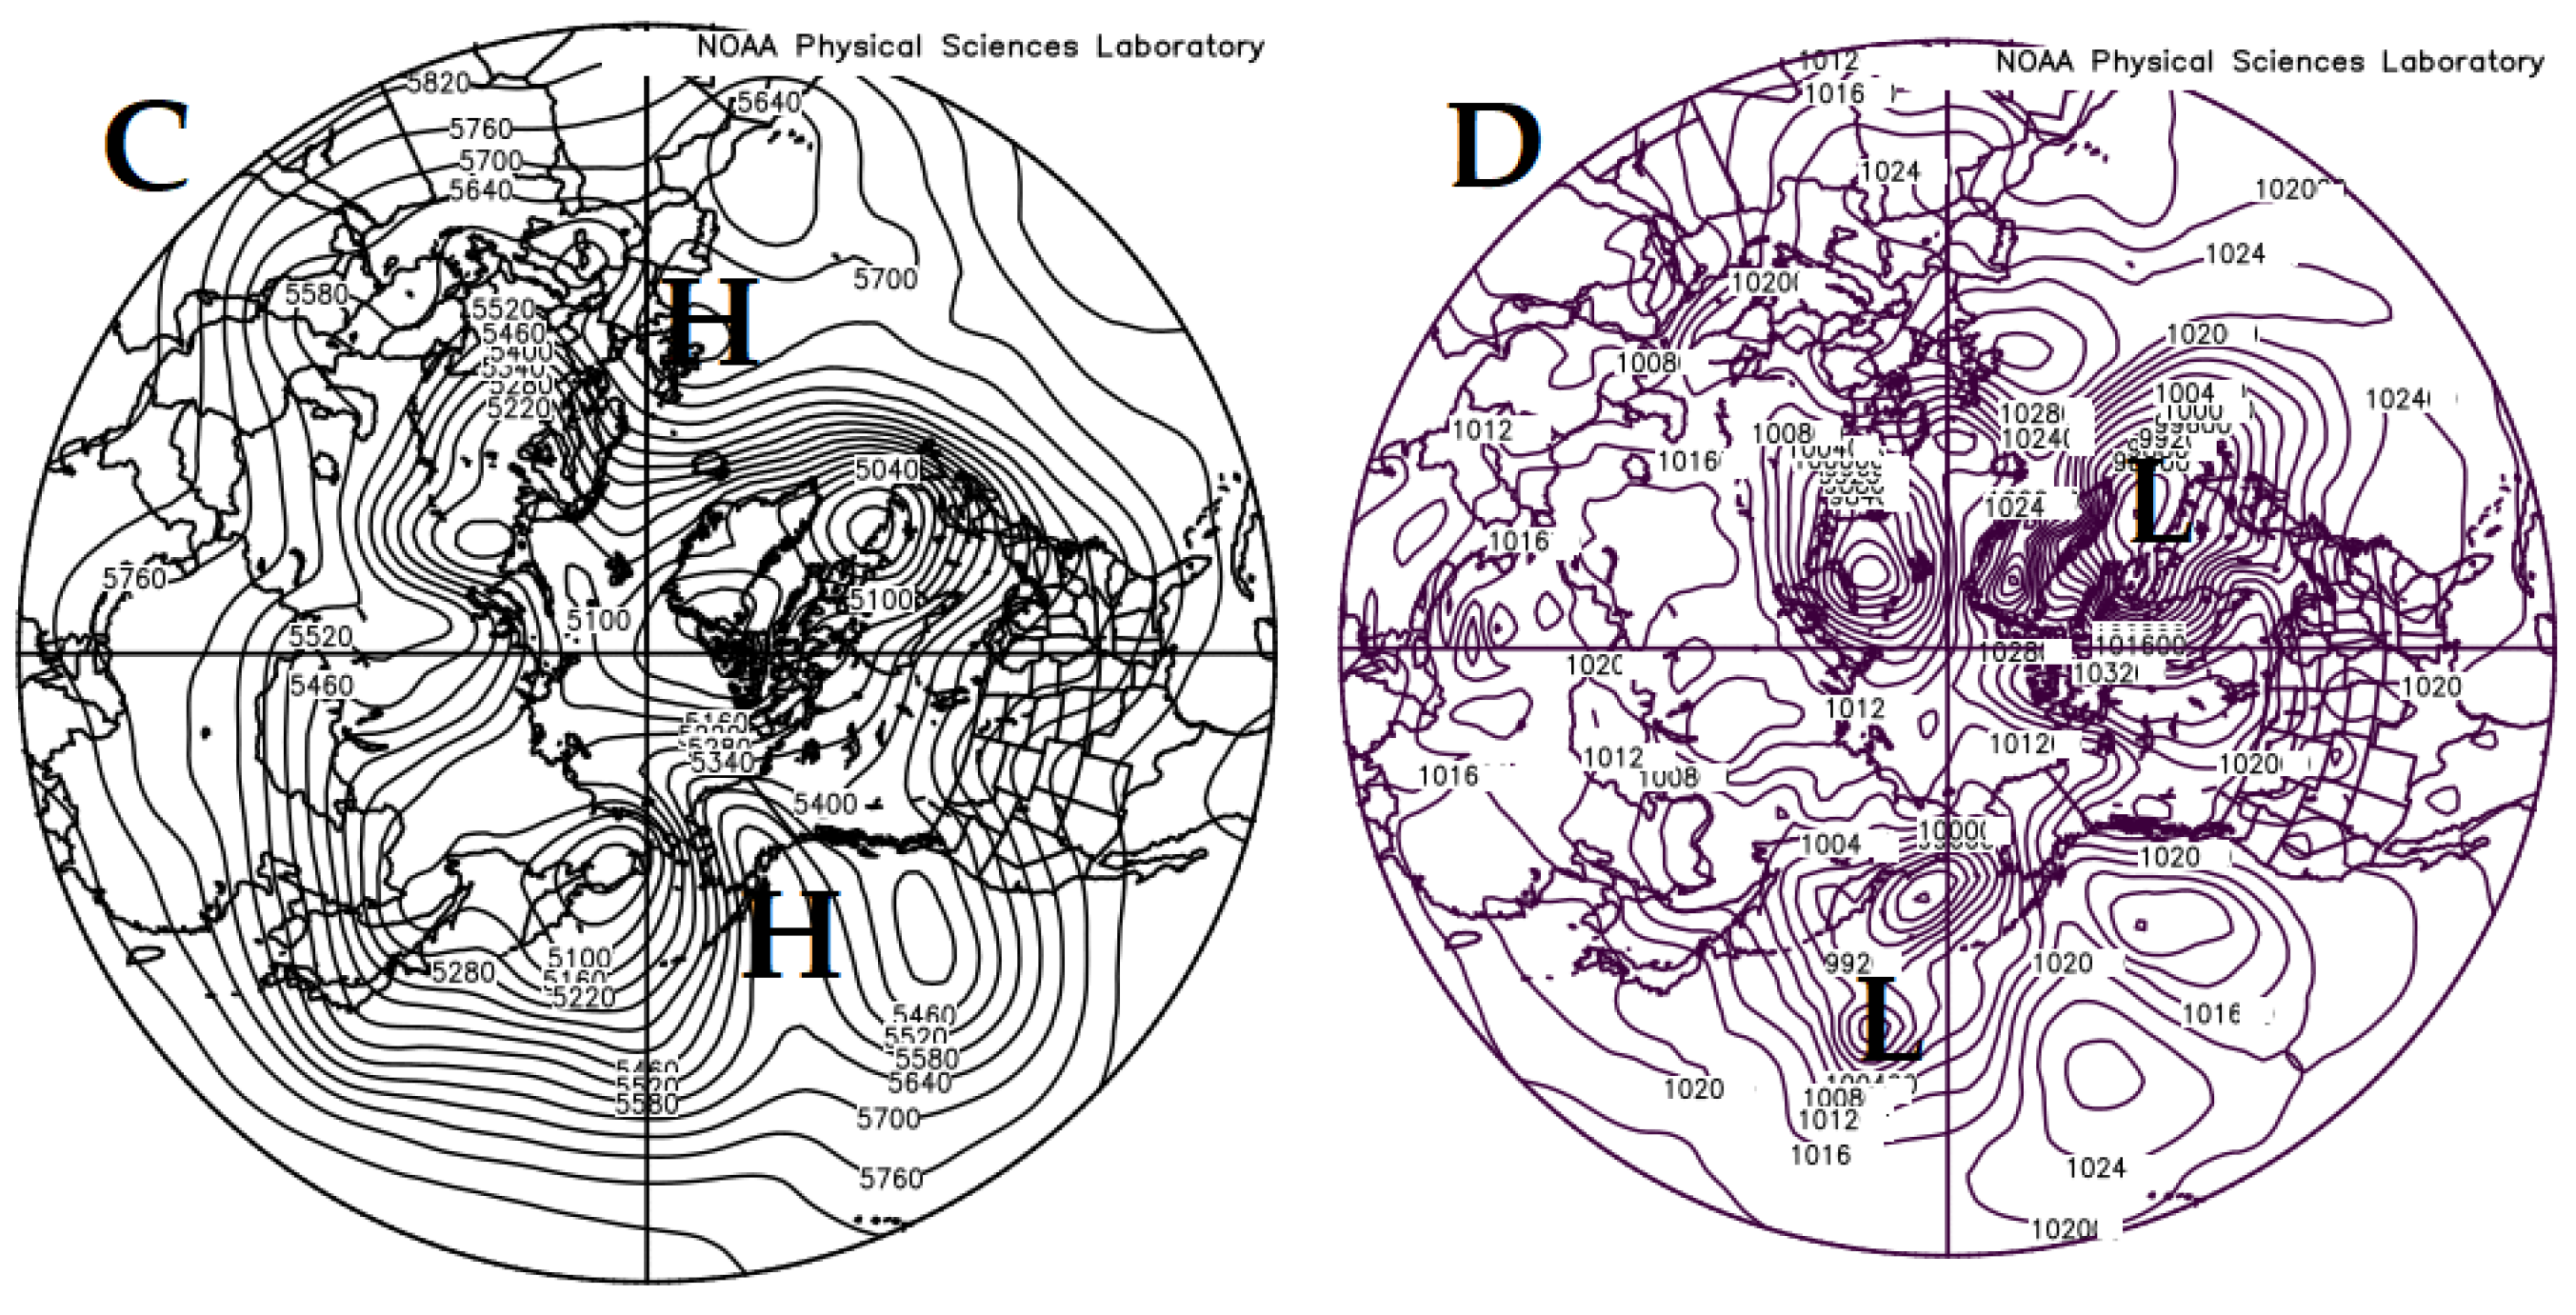
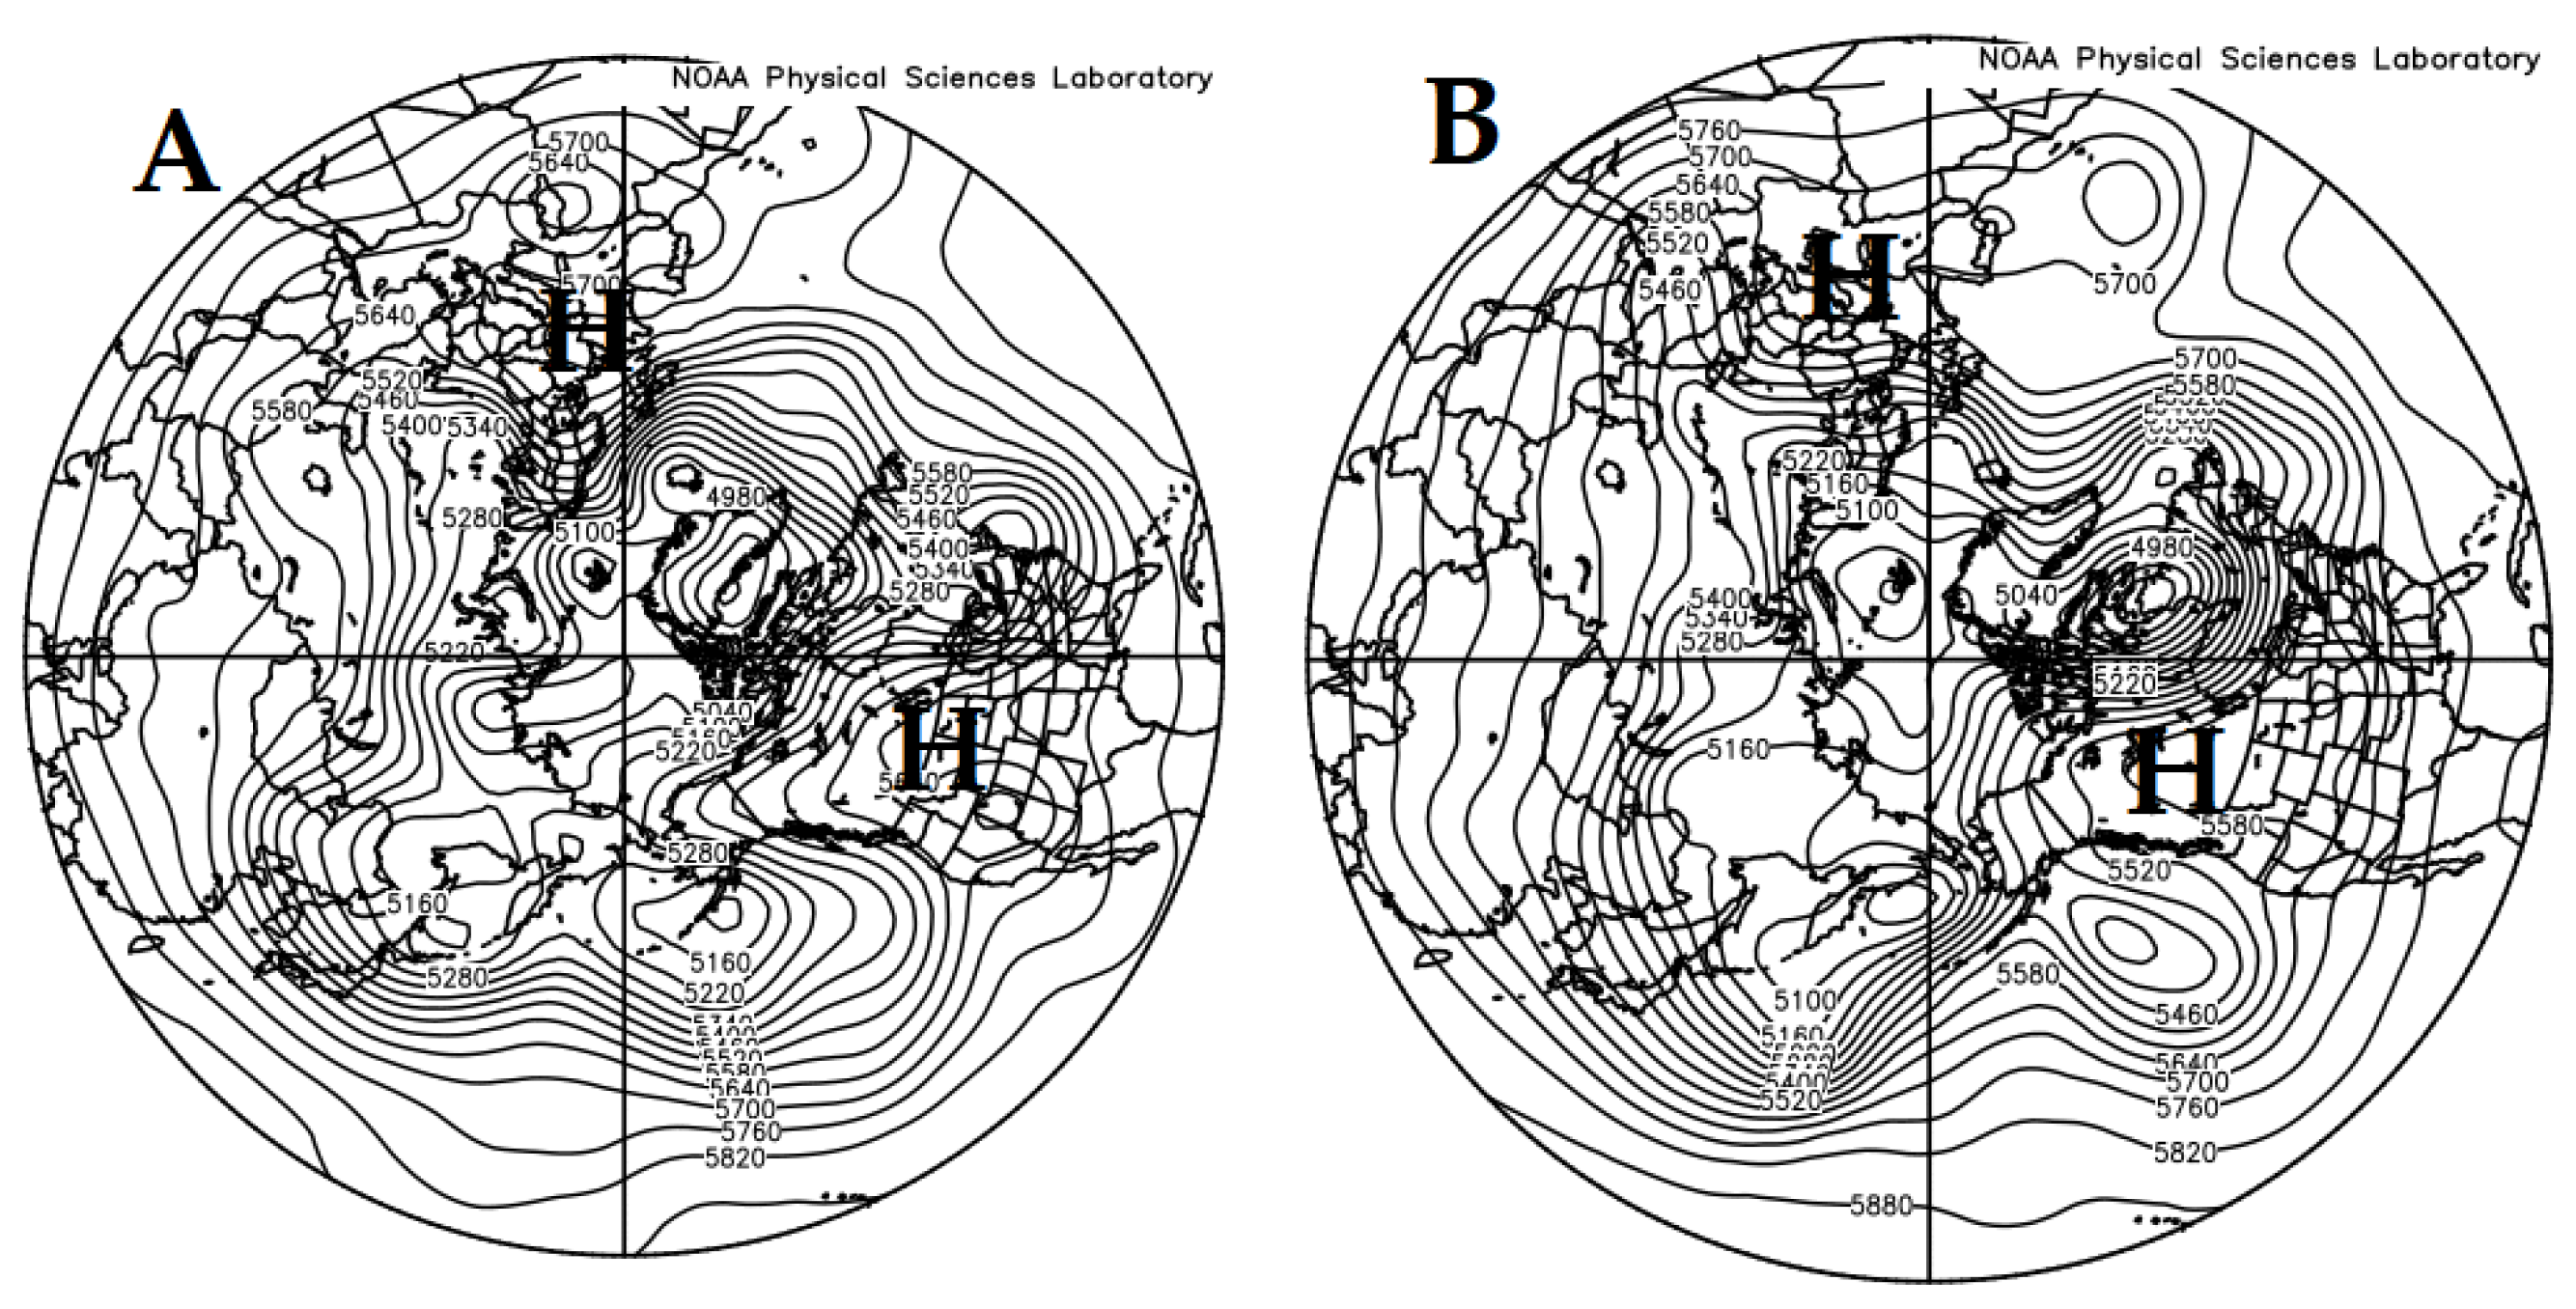
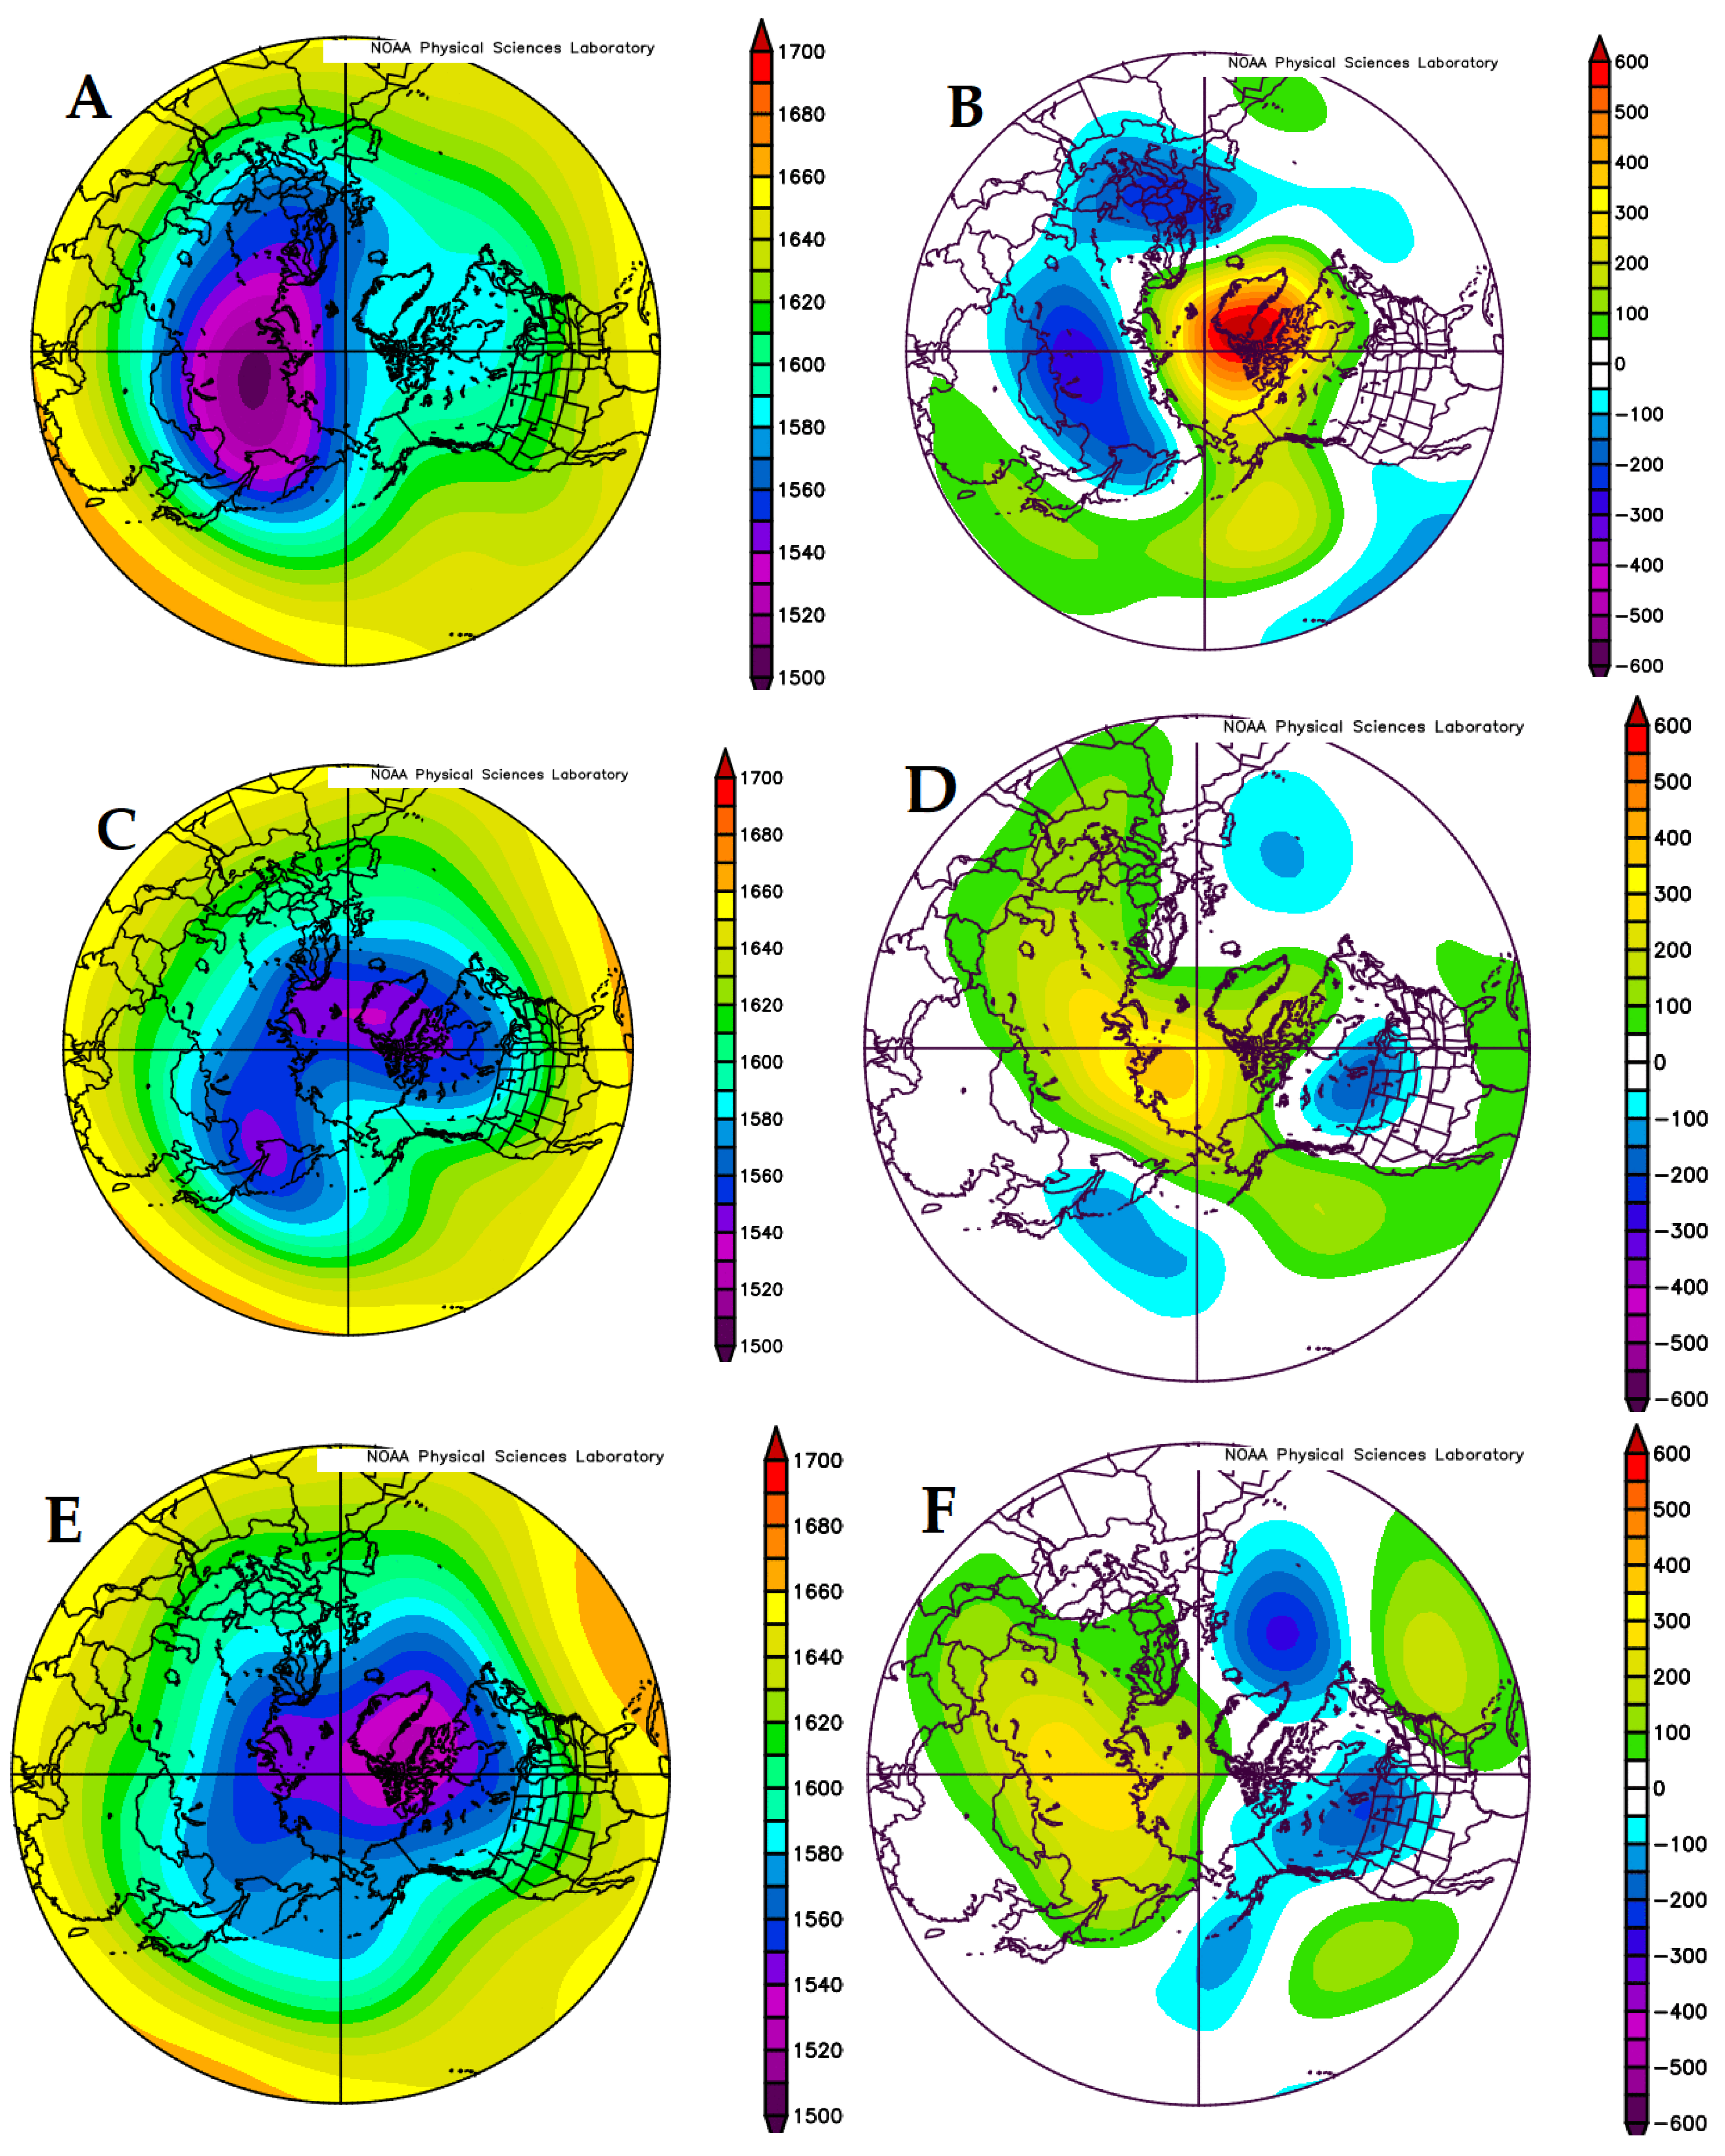
3.1. Large-Scale Flows and Teleconnections
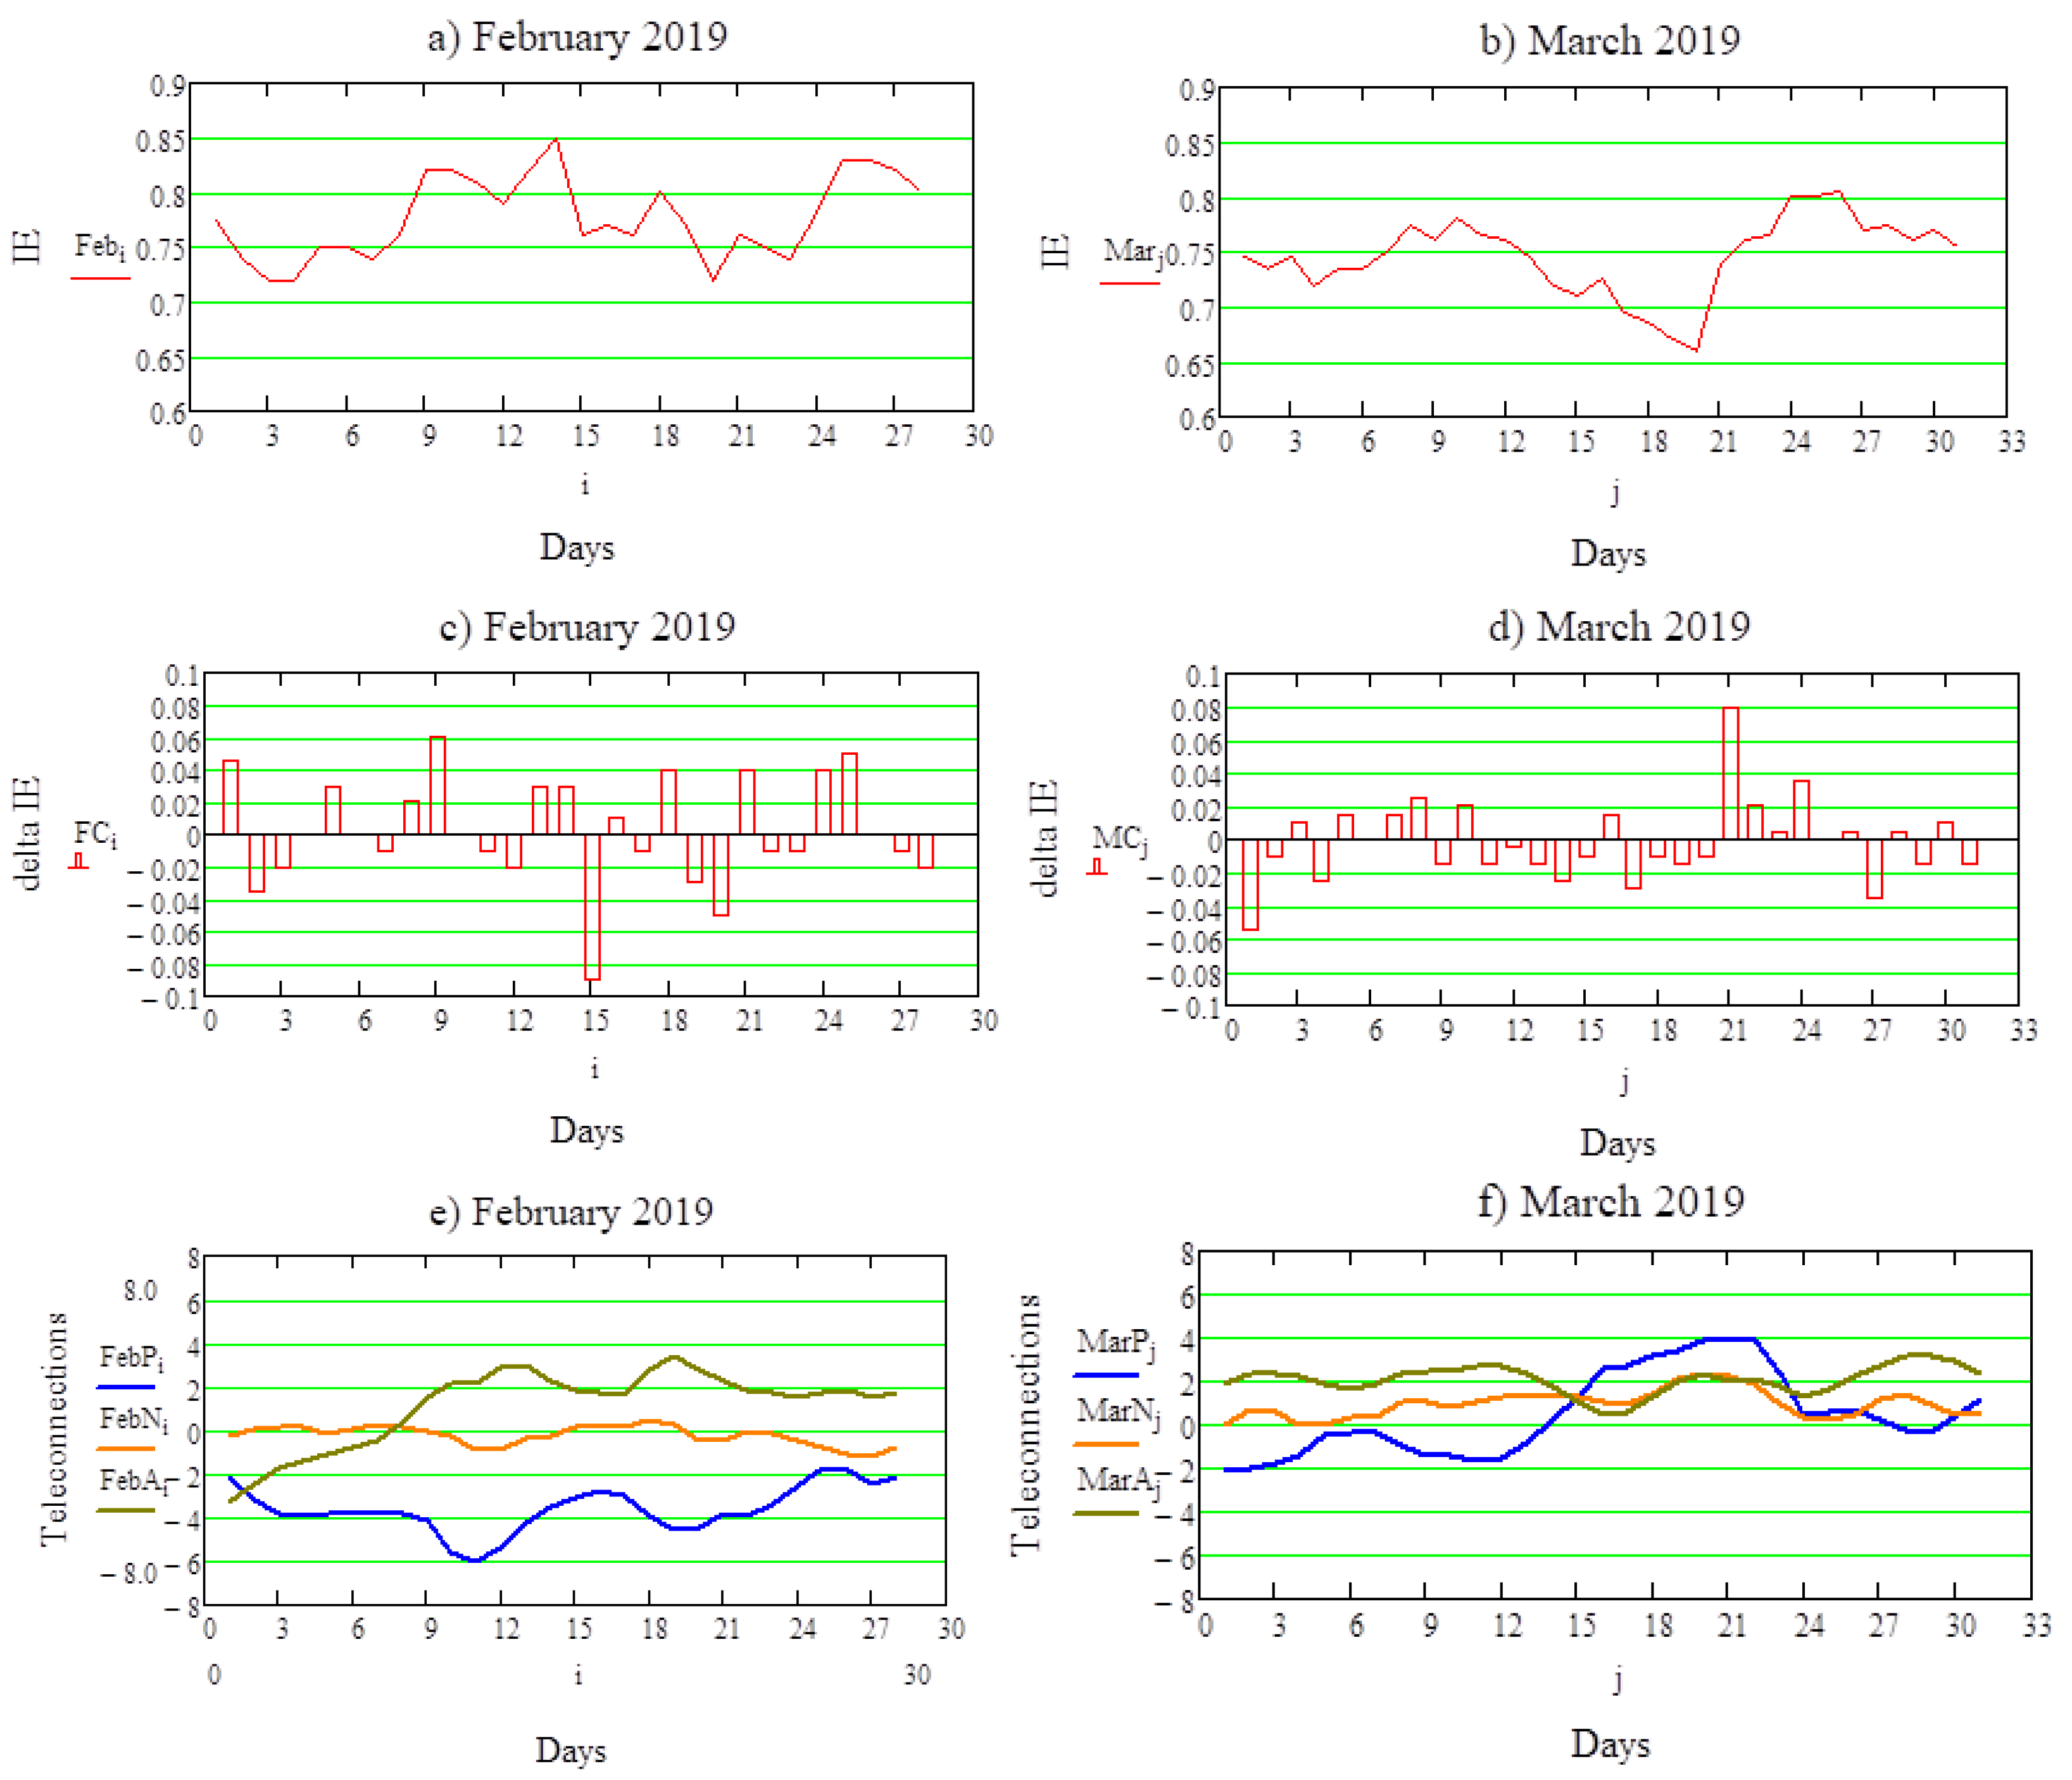
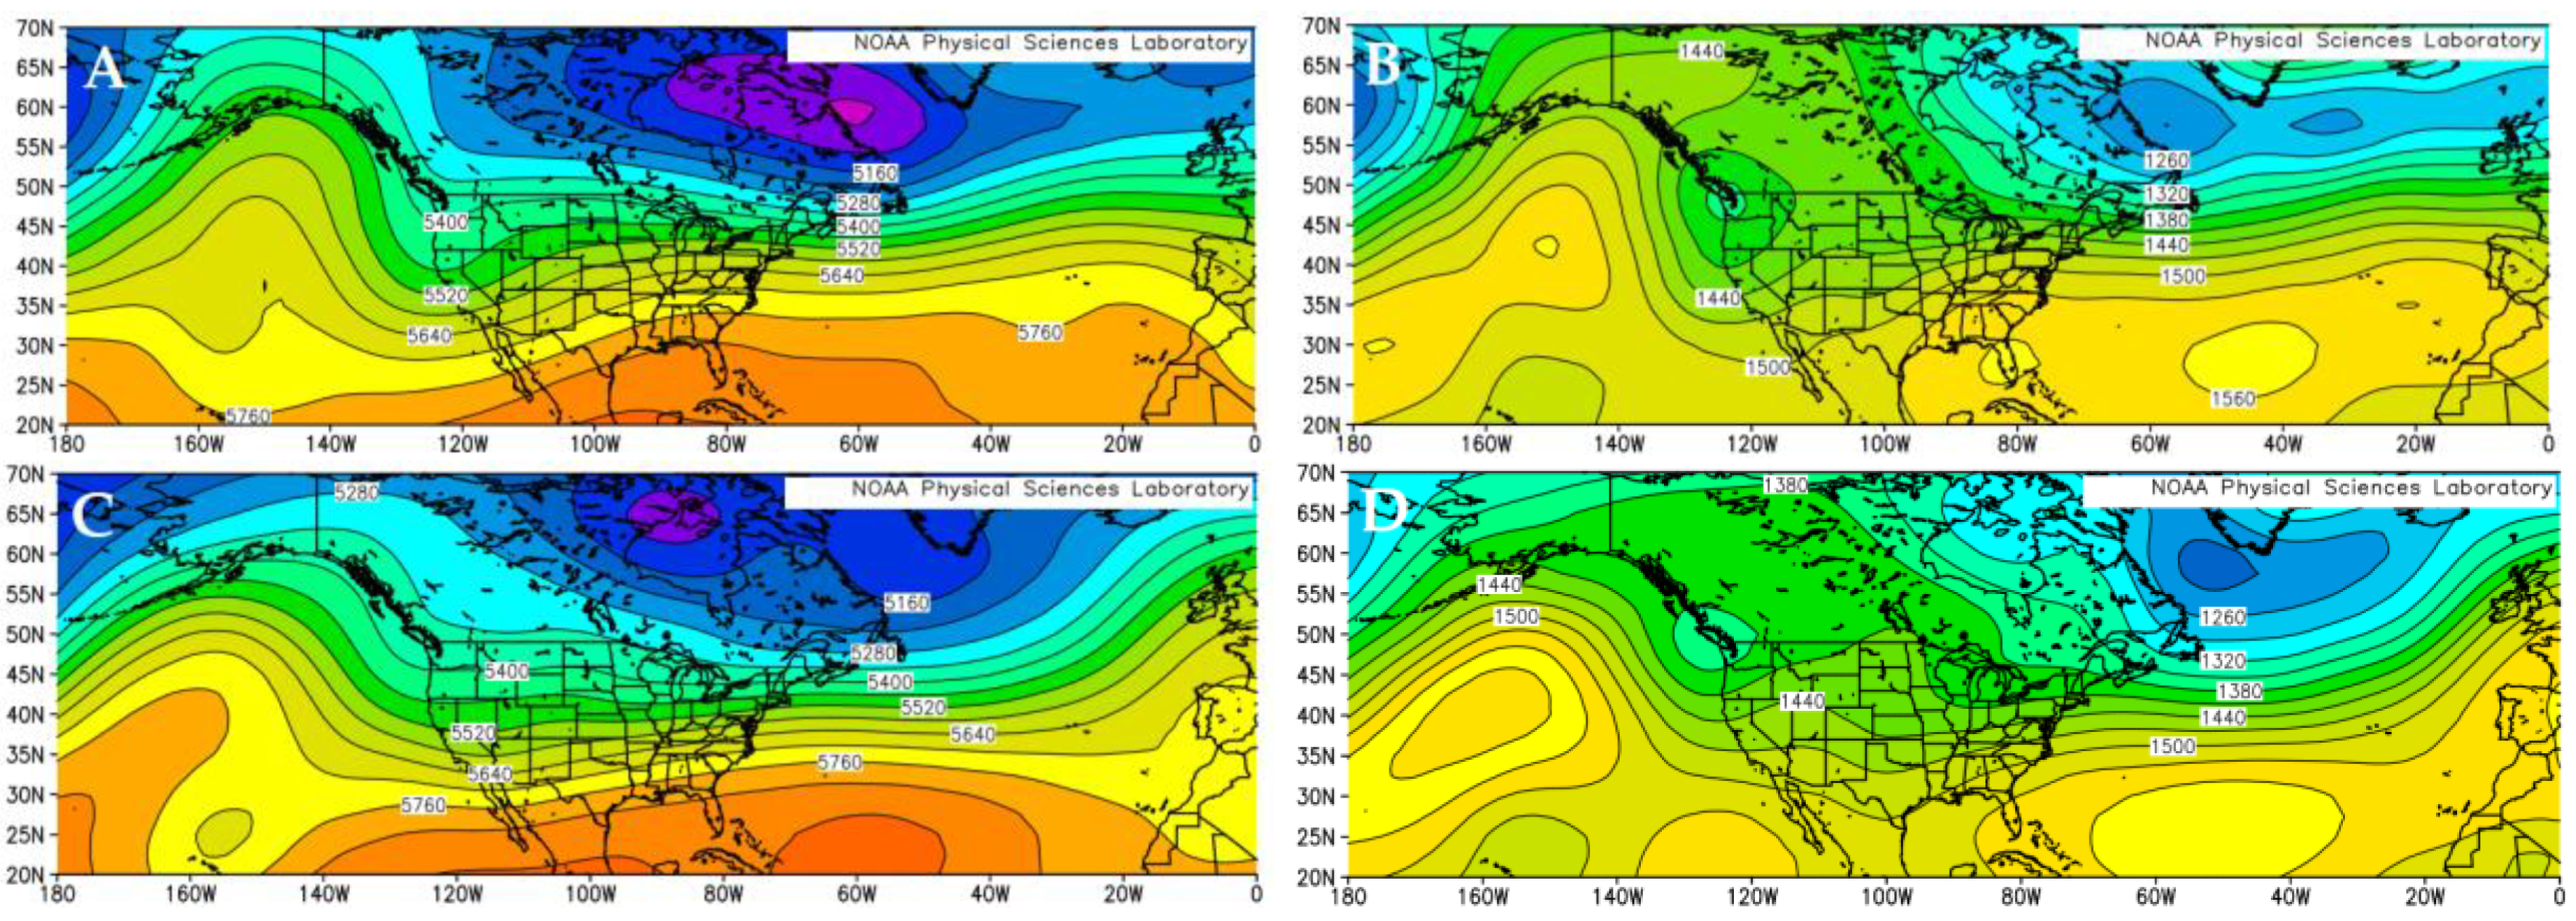
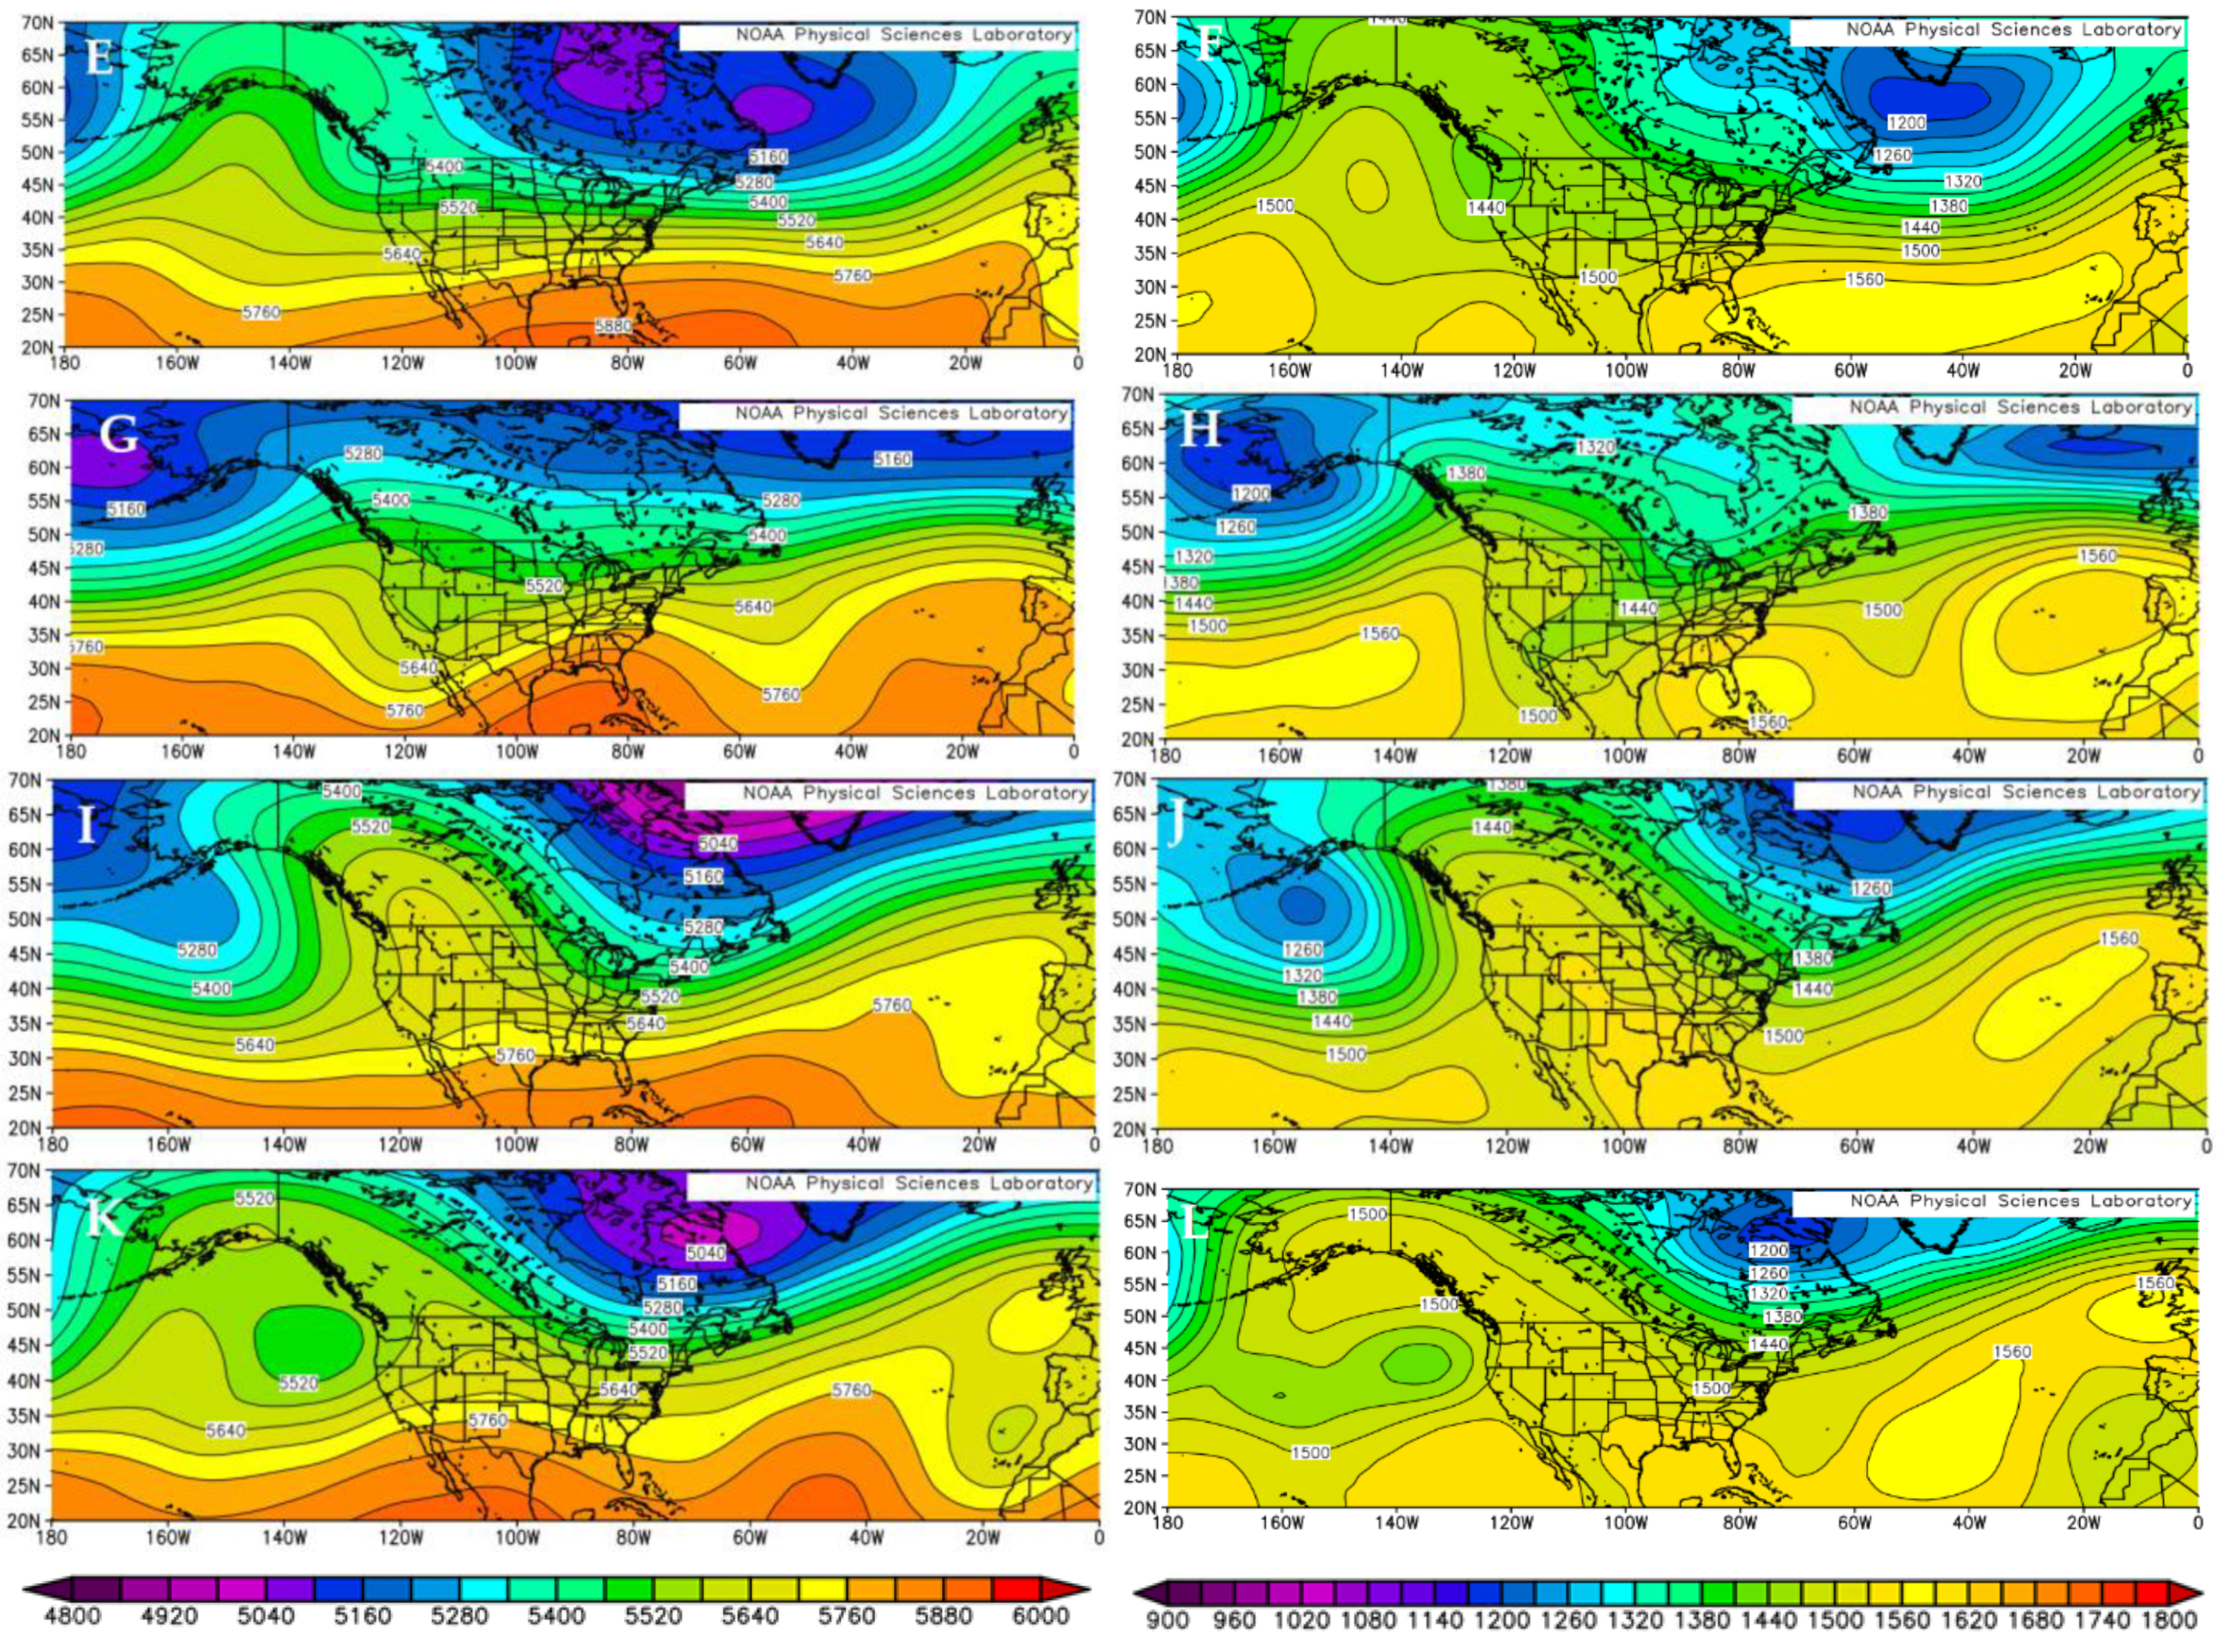
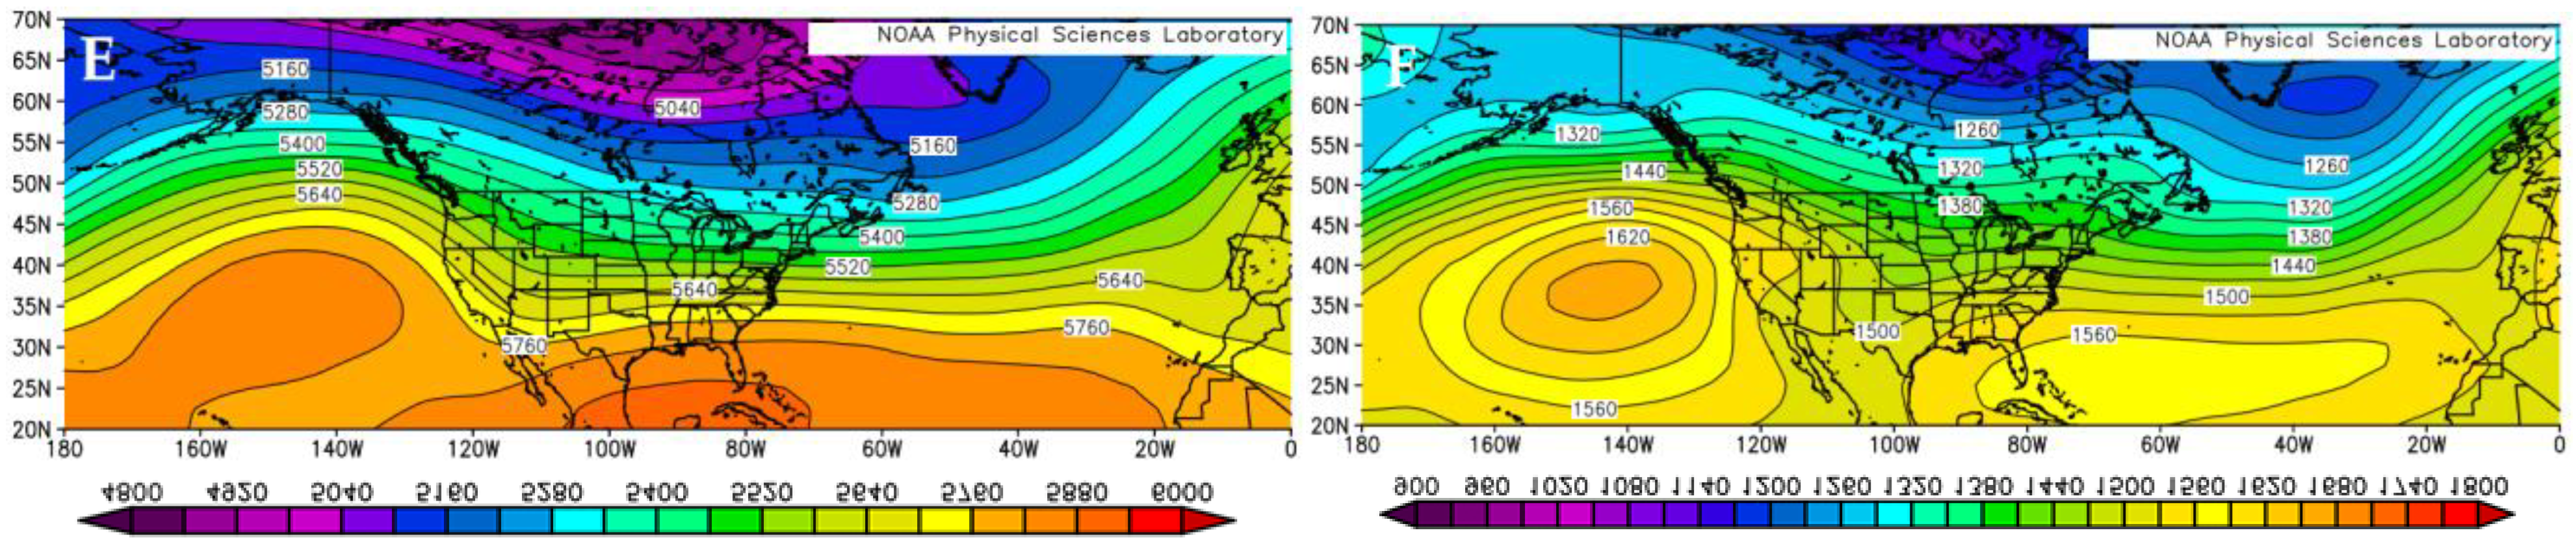
3.1.1. February and March 2019 Case
3.1.2. February 2021 Case
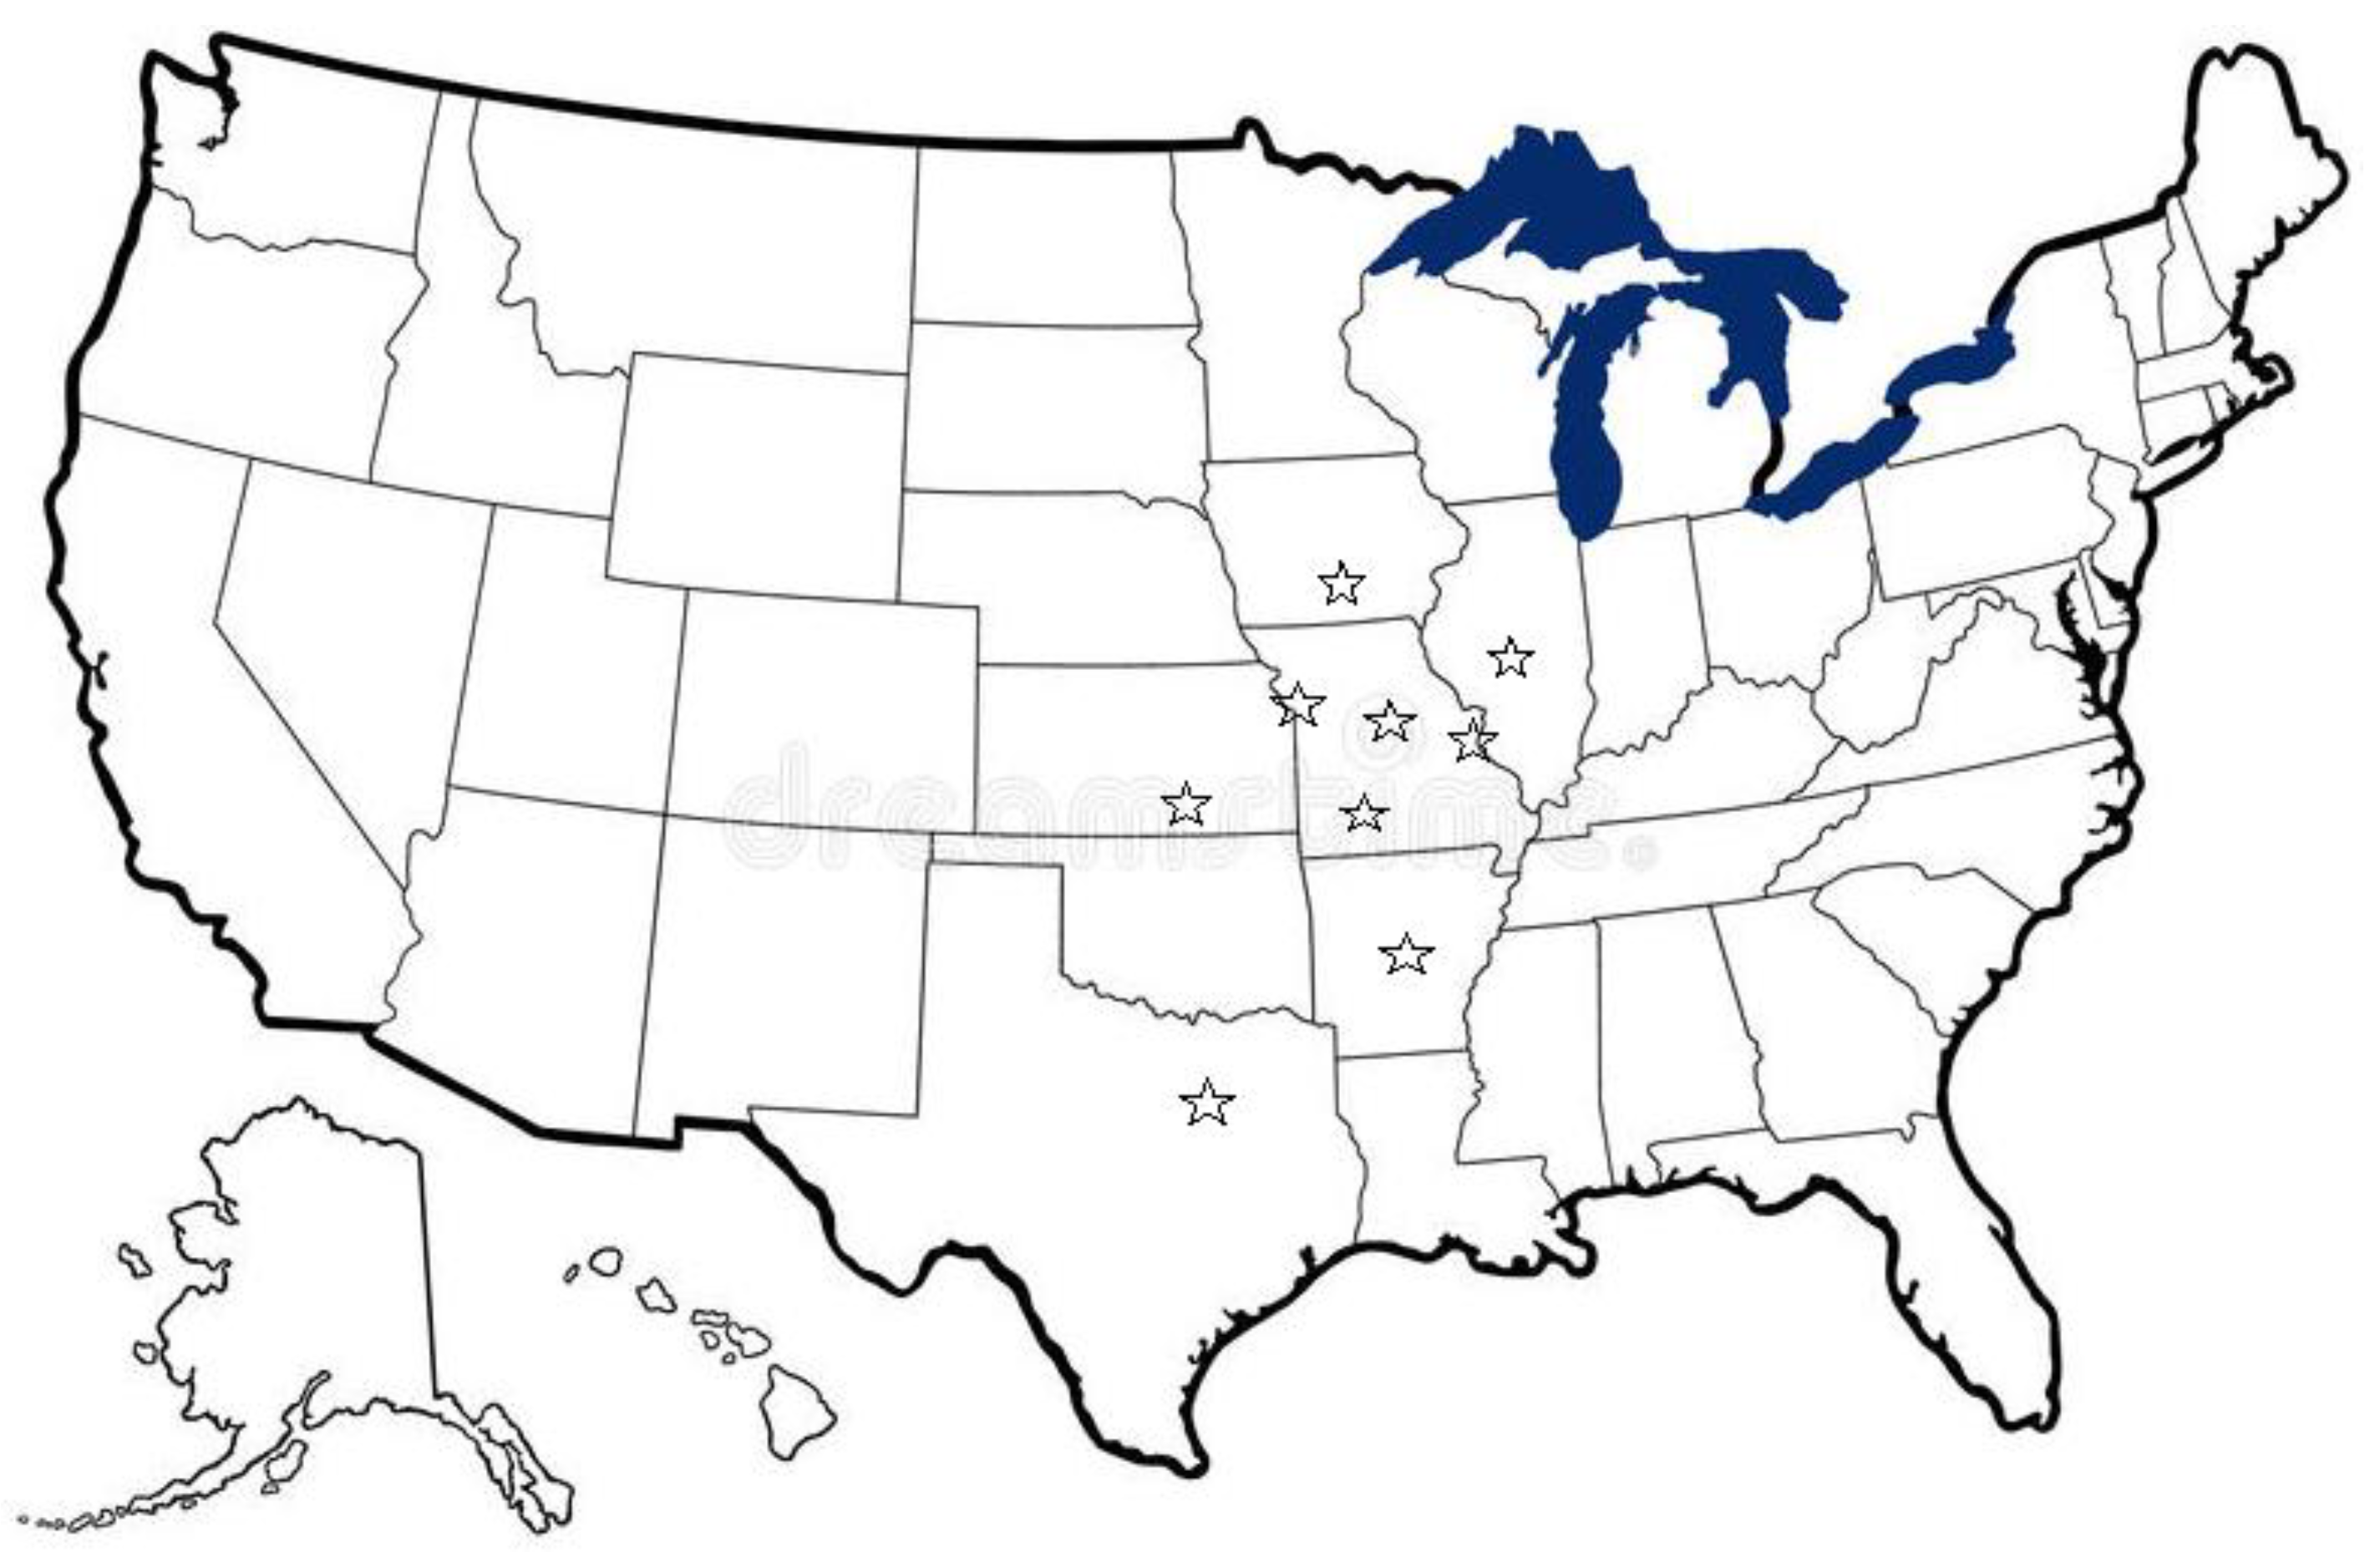
3.2. Regional Weather in the Central USA
3.3. Discussion
4. Conclusions
Author Contributions
Funding
Institutional Review Board Statement
Informed Consent Statement
Data Availability Statement
Acknowledgments
Conflicts of Interest
References
- Quiroz, R.S. The climate of the 1983-84 winter. A season of strong blocking and severe cold in North America. Mon.Weather Rev. 1984, 112, 1894–1912. [Google Scholar] [CrossRef] [Green Version]
- Whan, K.; Zwiers, F.; Sillmann, J. The Influence of Atmospheric Blocking on Extreme Winter Minimum Temperatures in North America. J. Clim. 2016, 29, 4361–4381. [Google Scholar] [CrossRef] [Green Version]
- Nunes, M.J.; Lupo, A.R.; Lebedeva, M.; Chendev, Y.G.; Solovyov, A.B. The Occurrence of Extreme Monthly Temperatures and Precipitation in Two Global Regions. Pap. Appl. Geogr. 2017, 3, 143–156. [Google Scholar] [CrossRef] [Green Version]
- Renken, J.; Herman, J.J.; Bradshaw, T.R.; Market, P.S.; Lupo, A.R. The Utility of the Bering Sea and East Asia Rules in Long-Range Forecasting. Adv. Meteorol. 2017, 2017, 1–14. [Google Scholar] [CrossRef]
- National Climatic Data Center. Available online: https://www.ncdc.noaa.gov/temp-and-precip/us-maps/1/202102#us-maps-select (accessed on 3 December 2021).
- National Weather Service specifically for 2021 case office at Wichita, KS. Available online: https://www.weather.gov/ict/historicCold (accessed on 3 December 2021).
- The Perryman Group. Available online: https://www.perrymangroup.com/media/uploads/brief/perryman-preliminary-estimates-of-economic-costs-of-the-february-2021-texas-winter-storm-02-25-21.pdf (accessed on 3 December 2021).
- Yao, Y.; Luo, D.; Dai, A.; Simmonds, I. Increased quasi stationarity and persistence of Ural blocking and Eurasian extreme cold events in response to Arctic warming. Part I: Insight from observational analyses. J. Clim. 2017, 30, 3549–3568. [Google Scholar] [CrossRef]
- Luo, D.; Xiao, Y.; Yao, Y.; Dai, A.; Simmonds, I.; Franzke, C.L. Impact of Ural blocking on winter warm Arctic–cold Eurasian anomalies. Part I: Blocking-induced amplification. J. Clim. 2016, 29, 3925–3947. [Google Scholar] [CrossRef]
- Sousa, P.M.; Trigo, R.; Barriopedro, D.; Soares, P.; dos Santos, J.C.A. European temperature responses to blocking and ridge regional patterns. Clim. Dyn. 2017, 50, 457–477. [Google Scholar] [CrossRef]
- Sillmann, J.; Croci-Maspoli, M.; Kallache, M.; Katz, R.W. Extreme cold winter temperatures in Europe under the influence of North Atlantic atmospheric blocking. J. Clim. 2011, 24, 5899–5913. [Google Scholar] [CrossRef]
- Ratnam, J.V.; Behera, S.K.; Annamalai, H.; Ratna, S.B.; Rajeevan, M.; Yamagata, T. ENSO’s far reaching connection to Indian cold waves. Nat. Sci. Rep. 2016, 6, 37657. [Google Scholar] [CrossRef] [Green Version]
- Efe, B.; Lupo, A.R.; Deniz, A. Extreme Temperatures linked to the Atmospheric Blocking Events in Turkey between 1977–2016. Nat. Hazards 2019, 104, 1879–1898. [Google Scholar] [CrossRef]
- Quiroz, R.S. The association of stratospheric warmings with tropospheric blocking. J. Geophys. Res. 1986, 91, 5277–5285. [Google Scholar] [CrossRef]
- Martius, O.; Polvani, L.M.; Davies, H.C. Blocking precursors to stratospheric sudden warming events. Geophys. Res. Lett. 2009, 36, 14. [Google Scholar] [CrossRef] [Green Version]
- Colucci, S.J.; Kelleher, M.E. Diagnostic comparison of tropospheric blocking events with and without sudden stratospheric warming. J. Atmos. Sci. 2015, 72, 2227–2240. [Google Scholar] [CrossRef]
- Attard, H.E.; Lang, A.L. Troposphere–Stratosphere Coupling Following Tropospheric Blocking and Extratropical Cyclones. Mon. Wea. Rev. 2019, 147, 1781–1804. [Google Scholar] [CrossRef]
- Klaus, E.M.; Market, P.S.; Lupo, A.R.; Bodner, M.J.; Kastman, J.S. Projecting Northern Hemisphere Flow Regime Transition Using Integrated Enstrophy. Atmosphere 2020, 11, 915. [Google Scholar] [CrossRef]
- Jensen, A.D.; Lupo, A.R.; Mokhov, I.I.; Akperov, M.G.; Reynolds, D.D. Integrated regional enstrophy and block intensity as a measure of Kolmogorov Entropy. Atmosphere 2017, 8, 237. [Google Scholar] [CrossRef] [Green Version]
- Jensen, A.D.; Lupo, A.R.; Mokhov, I.I.; Akperov, M.G.; Sun, F. The dynamic character of Northern Hemisphere flow regimes in a near term climate change projection. Atmosphere 2018, 9, 27. [Google Scholar] [CrossRef] [Green Version]
- European Centre for Medium-Range Weather Forecast. Annual Report 2017. European Centre for Medium-Range Weather Forecast; European Centre for Medium-Range Weather Forecast: Reading, UK, 2018; pp. 1–40. [Google Scholar]
- Krishnamurthy, V. Predictability of Weather and Climate. Earth Space Sci. 2019, 6, 1043–1056. [Google Scholar] [CrossRef] [Green Version]
- Newberry, R.G.; Lupo, A.R.; Jensen, A.D.; Rodgriges–Zalipynis, R.A. An analysis of the spring-to-summer transition in the West Central Plains for application to long range forecasting. Weather Clim. Sci. 2016, 6, 373–393. [Google Scholar] [CrossRef] [Green Version]
- Hansen, A.R. Observational Characteristics of Atmospheric Planetary Waves with Bimodal Amplitude Distributions. Adv. Geophys. 1986, 29, 101–134. [Google Scholar]
- Ratley, C.W.; Lupo, A.R.; Baxter, M.A. Determining the spring to summer transition in the Missouri Ozarks using synoptic scale atmospheric data. Trans. Mo. Acad. Sci. 2002, 36, 69–76. [Google Scholar]
- Kononova, N.K.; Lupo, A.R. Investigation of the variability of circulation regimes and dangerous weather phenomena in Russia in the 21st century. IOP Science Conf Ser. Earth Environ. Sci. 2020, 606, 012023. [Google Scholar]
- Konrad, C.E.; Colucci, S.J. Synoptic climatology of 500-mb circulation changes during explosive cyclogenesis. Mon. Weather Rev. 1988, 116, 1431–1443. [Google Scholar] [CrossRef] [Green Version]
- Tsou, C.H.; Smith, P.J. The role of synoptic/planetary-scale interactions during the development of a blocking anticyclone. Tellus 1990, 42A, 174–193. [Google Scholar] [CrossRef]
- Tracton, M.S. Predictability and its relationship to scale interaction processes in blocking. Mon. Weather Rev. 1990, 118, 1666–1695. [Google Scholar] [CrossRef] [Green Version]
- Tibaldi, S.; Molteni, F. On the operational predictability of blocking. Tellus 1990, 42, 343–365. [Google Scholar] [CrossRef] [Green Version]
- Reynolds, D.D.; Lupo, A.R.; Jensen, A.D.; Market, P.S. The predictability of Northern Hemispheric blocking using an ensemble mean forecast system. Open Atmos. Sci. J. 2019, 13, 3–17. [Google Scholar] [CrossRef]
- Woollings, T.; Barriopedro Cepero, D.; Methven, J.; Son, S.-W.; Martius, O.; Harvey, B.; Sillmann, J.; Lupo, A.R.; Seneviratne, S. Blocking and its response to climate change. Curr. Clim. Chang. Rep. 2018. [Google Scholar] [CrossRef] [Green Version]
- Lupo, A.R. Atmospheric Blocking Events: A Review. Ann. N. Y. Acad. Sci. 2021, 1504, 5–24. [Google Scholar] [CrossRef]
- Hoskins, B. A potential vorticity view of synoptic development. Meteorol. Appl. 1997, 4, 325–334. [Google Scholar] [CrossRef]
- Haines, K.; Holland, A.J. Vacillation cycles and blocking in a channel. Q. J. R. Meteorol. Soc. 1998, 124, 873–897. [Google Scholar] [CrossRef]
- Colucci, S.J.; Baumhefner, D.P. Numerical prediction of the onset of blocking: A case study with forecast ensembles. Mon. Weather Rev. 1998, 126, 773–784. [Google Scholar] [CrossRef]
- Luo, D. Planetary-scale baroclinic envelope Rossby solitons in a two-layer model and their interaction with synoptic-scale eddies. Dyn. Atmos. Ocean. 2000, 32, 27–74. [Google Scholar] [CrossRef]
- Lupo, A.R.; Mokhov, I.I.; Dostoglou, S.; Kunz, A.R.; Burkhardt, J.P. The impact of the planetary scale on the decay of blocking and the use of phase diagrams and enstrophy as a diagnostic. Izv. Atms -Oc. 2007, 43, 45–51. [Google Scholar] [CrossRef]
- Hussain, A.; Lupo, A.R. Scale and stability analysis of blocking events from 2002–2004: A case study of an unusually persistent blocking event leading to a heat wave in the Gulf of Alaska during August 2004. Adv. Meteorol. 2010, 2010, 610263. [Google Scholar]
- Lupo, A.R.; Bosart, L.F. An analysis of a relatively rare case of continental blocking. Q. J. R. Meteorol. Soc. 1999, 125, 107–138. [Google Scholar] [CrossRef]
- Lupo, A.R. A diagnosis of two blocking events that occurred simultaneously over the mid-latitude Northern Hemisphere. Mon. Weather Rev. 1997, 125, 1801–1823. [Google Scholar] [CrossRef] [Green Version]
- Burkhardt, J.P.; Lupo, A.R. The planetary and synoptic-scale interactions in a Southeast Pacific blocking episode using PV diagnostics. J. Atmos. Sci. 2005, 62, 1901–1916. [Google Scholar] [CrossRef] [Green Version]
- Jensen, A.D. The non-equilibrium thermodynamics of blocking. Atmos. Chem. Phys. Discuss. 2016. [Google Scholar] [CrossRef] [Green Version]
- NCEP/NCAR Reanalyses Project. Available online: http://www.esrl.noaa.gov/psd/data/reanalysis/reanalysis.shtml (accessed on 6 May 2019).
- University of Missouri Blocking Archive. 2021. Available online: http://weather.missouri.edu/gcc/ (accessed on 3 December 2021).
- Climate Diagnostic Bulletin. Available online: https://www.cpc.ncep.noaa.gov/products/CDB/CDB_Archive._pdf/pdf_CDB_archive.shtml (accessed on 13 May 2019).
- Climate Prediction Center: Weather and Climate Linkages. Available online: https://www.cpc.ncep.noaa.gov/products/precip/CWlink/daily_ao_index/teleconnections.shtml (accessed on 12 May 2020).
- Balkissoon, S.S.; Bongard, J.T.; Cain, T.; Candela, D.M.; Clay, C.; Efe, B.; Ji, Q.; Klaus, E.M.; Korner, A.P.; Mitchell, K.; et al. 2020: Hurricane Florence Makes Landfall in the Southeast USA: Sensitive Dependence on Initial Conditions, Parameterizations, and Integrated Enstrophy. Atmos. Clim. Sci. 2020, 10, 101–124. [Google Scholar]
- Lupo, A.R.; Jensen, A.D.; Mokhov, I.I.; Timazhev, A.V.; Eichler, T.; Efe, B. Changes in global blocking character during the most recent decades. Atmosphere 2019, 10, 92. [Google Scholar] [CrossRef] [Green Version]
- Lupo, A.R.; Kononova, N.K.; Semenova, I.G.; Lebedeva, M.G. A comparison of the characteristics of drought during the late 20th and early 21st centuries over Eastern Europe, Western Russia and Central North America. Atmosphere 2021, 12, 33. [Google Scholar] [CrossRef]
- Lupo, A.R.; Kelsey, E.P.; McCoy, E.A.; Halcomb, C.E.; Aldrich, E.; Allen, S.N.; Akyuz, A.; Skellenger, S.; Beiger, D.G.; Wise, E.; et al. The presentation of temperature information in television broadcasts: What is normal? Natl. Weather Dig. 2003, 27, 53–58. [Google Scholar]
- Lupo, A.R.; Mokhov, I.I.; Akperov, A.G.; Chernokulsky, A.V.; Hussain, A. A dynamic analysis of the role of the planetary and synoptic scale in the summer of 2010 blocking episodes over the European part of Russia. Adv. Meteorol. 2012, 2012, 584257. [Google Scholar] [CrossRef] [Green Version]
- Matsueda, M. Blocking predictability in operational medium-range ensemble forecasts. SOLA 2009, 5, 113–116. [Google Scholar] [CrossRef] [Green Version]
- Matsueda, M. Predictability of Euro-Russian blocking in summer of 2010. Geophys. Res. Lett. 2011, 38. [Google Scholar] [CrossRef]
- Missouri Climate Center. 2021. Available online: http://climate.missouri.edu/ (accessed on 12 May 2021).
- Sitnov, S.A.; Mokhov, I.I.; Lupo, A.R. Evolution of the water vapor plume over Eastern Europe during summer 2010 atmospheric blocking. Adv. Meteorol. 2014, 2014, 253953. [Google Scholar] [CrossRef]
- Sitnov, S.; Mokhov, I.I.; Lupo, A.R. Ozone and water vapor anomalies during atmospheric blocking events over European Russia in Spring and Summer 2010. Atmos. Environ. 2017, 164, 180–194. [Google Scholar] [CrossRef]


| Time Period | AO | NAO | PNA |
|---|---|---|---|
| 1–9 February 2019 | 0.51 | 0.02 | −0.16 |
| 9–14 February 2019 | 0.20 | −0.03 | 0.23 |
| 14–18 February 2019 | 0.08 | 0.13 | −0.06 |
| 18–25 February 2019 | −0.24 | −0.13 | 0.33 |
| 25 February–7 March 2019 | 0.02 | 0.16 | 0.19 |
| 7–24 March 2019 | −0.05 | 0.04 | 0.31 |
| 24–31 March 2019 | 0.20 | 0.05 | −0.00 |
| 1–17 January 2021 | 0.12 | 0.04 | −0.02 |
| 17–29 January 2021 | −0.14 | −0.01 | −0.18 |
| 29 January–10 February 2021 | −0.21 | −0.02 | 0.06 |
| 10–16 February 2021 | 1.09 | 0.10 | −0.01 |
| 16–28 February 2021 | 0.20 | 0.05 | −0.09 |
| Region | Duration | Onset/Termination | BI | Onset Location |
|---|---|---|---|---|
| PAC | 6 | 0000 11 February/0000 17 February 2019 | 3.80 | 40/−170 |
| ATL | 6 | 0000 14 February/0000 20 February 2019 | 3.09 | 45/0 |
| ATL | 9 | 0000 20 February/0000 1 March 2019 | 5.16 | 45/0 |
| PAC | 15 | 0000 23 February/0000 10 March 2019 | 5.02 | 55/−160 |
| PAC | 9 | 0000 16 March/0000 25 March 2019 | 4.50 | 40/−120 |
| ATL | 7 | 0000 18 March/0000 25 March 2019 | 3.33 | 40/−30 |
| ATL | 6.5 | 1200 24 March/0000 31 March 2019 | 3.90 | 50/−20 |
| PAC | 9 | 0000 26 March/0000 4 April 2019 | 4.46 | 55/−150 |
| ATL | 7 | 1200 17 January/1200 24 January 2021 | 4.15 | 52.5/−50 |
| PAC | 6 | 0000 22 January/0000 28 January 2021 | 3.32 | 35/−150 |
| CON | 6 | 0000 25 January/0000 31 January 2021 | 4.12 | 45/50 |
| PAC | 12 | 0000 3 February/0000 15 February 2021 | 4.5 | 35/−140 |
| ATL | 12 | 1200 10 February/1200 22 February 2021 | 4.12 | 60/−10 |
| ATL | 15 | 0000 20 February/0000 7 March 2021 | 3.85 | 40/10 |
| Period | Dates | Rationale |
|---|---|---|
| 1 | 1–10 February 2019 | covers the period before the 9 February IE maximum and the onset of mid-February blocking |
| 2 | 11–19 February 2019 | time between two IE maxima, encompasses the first period of Atlantic and Pacific region blocking |
| 3 | 20 February–9 March 2019 | start and end are close to IE maxima, covers a period of simultaneous blocking |
| 4 | 10–15 March 2019 | brief period of no blocking |
| 5 | 16–24 March 2019 | encompasses a second period of simultaneous blocking both terminating concurrent with an IE maximum |
| 6 | 25–31 March 2019 | finishes the month of March, begins another period of blocking |
| 7 | 17 January–5 February 2021 | time before the major cold air outbreak |
| 8 | 6–19 February 2021 | encompasses period of the cold air outbreak and two associated blocking events |
| 8A | 6–12 February 2021 | part before onset of the Atlantic block, near the time of the 10 February IE maximum |
| 8B | 13–19 February 2021 | part following onset of the Atlantic block and 16 February IE maximum |
| 9 | 20–28 February 2021 | time following the post cold air outbreak |
| Period | COU | EAX | STL | SGF | DFW |
|---|---|---|---|---|---|
| 1 | +1.0/28.4/T | −0.2/6.3/1.3 | +0.8/59.4/T | +3.1/32.7/0.3 | +3.9/12.2/0 |
| 2 | −2.5/18.1/8.9 | −4.1/29.5/19.3 | −1.8/21.6/3.6 | −1.7/33.8/1.0 | −1.3/17.8/0 |
| 3 | −4.6/39.9/5.6 | −6.7/34.8/8.6 | −4.1/48.3/8.6 | −3.3/34.3/2.0 | −3.7/12.2/0 |
| 4 | +1.5/30.7/0 | +1.0/17.8/0 | +1.4/27.2/0 | +0.4/34.8/0 | +0.3/41.4/0 |
| 5 | +1.0/1.3/0 | +1.3/6.4/0 | −0.3/16.0/T | +0.4/6.9/0 | +0.6/10.2/0 |
| 6 | +0.5/52.6/T | −1.2/43.4/T | −0.2/61.7/0 | +0.8/19.8/T | +0.2/2.5/0 |
| 7 | +1.9/62.2/10.2 | +2.8/56.9/4.6 | +1.0/80.0/7.6 | +1.9/69.1/5.8 | +2.1/18.0/0 |
| 8 | −13.3/16.2/20.6 | −13.8/9.7/18.5 | −12.4/20.3/22.4 | −12.4/16.3/22.1 | −11.4/9.7/12.7 |
| 8A | −11.3/5.6/6.1 | −12.3/1.3/3.6 | −9.8/5.3/3.8 | −8.3/1.3/1.3 | −6.0/0.3/0 |
| 8B | −15.2/10.7/14.5 | −15.1/8.4/15.0 | −14.5/15.0/18.5 | −16.0/15.0/20.8 | −16.5/9.4/12.7 |
| 9 | +2.0/6.4/0.0 | +2.2/0.8/0 | +2.3/15.7/0 | +1.0/10.7/0 | +2.0/46.7/0 |
| Period | DSM | ILX | LIT | ICT |
|---|---|---|---|---|
| 1 | −1.8/11.4/11.7 | +0.1/30.0/4.3 | +4.3/36.1/T | 0.0/1.0/T |
| 2 | −6.0/24.4/38.6 | −1.9/20.8/1.0 | −1.0/81.0/T | −2.2/7.9/5.3 |
| 3 | −8.3/40.6/18.8 | −3.9/55.1/8.6 | −2.4/81.5/T | −5.6/15.0/7.4 |
| 4 | +0.2/30.7/T | +1.7/20.1/T | +1.5/35.8/0 | +0.1/45.5/0 |
| 5 | +0.3/7.1/0 | −0.6/17.0/T | −1.0/11.9/0 | +2.2/7.9/0 |
| 6 | −0.1/7.1/0 | −1.0/59.7/T | −0.6/1.5/0 | +0.1/3.8/T |
| 7 | +0.3/26.9/44.5 | +1.1/64.5/4.3 | +2.0/32.8/0 | +2.4/58.7/T |
| 8 | −13.9/8.1/17.5 | −12.7/22.6/34.5 | −9.4/49.3/51.6 | −14.0/7.1/14.5 |
| 8A | −13.6/6.3/12.9 | −10.3/8.6/11.4 | −4.5/12.7/0.3 | −11.6/1.5/4.3 |
| 8B | −14.2/1.8/4.6 | −15.2/14.0/23.1 | −14.4/36.6/51.3 | −16.5/5.6/10.2 |
| 9 | +1.4/6.1/5.6 | +2.0/10.9/0 | +0.2/78.0/0 | +0.9/0.5/0 |
Publisher’s Note: MDPI stays neutral with regard to jurisdictional claims in published maps and institutional affiliations. |
© 2022 by the authors. Licensee MDPI, Basel, Switzerland. This article is an open access article distributed under the terms and conditions of the Creative Commons Attribution (CC BY) license (https://creativecommons.org/licenses/by/4.0/).
Share and Cite
Est, M.A.; Mount, S.; Steward, C.A.; Lupo, A.R. Northern Hemisphere Flow Regime Transitions, Blocking, and the Onset of Spring in the Central USA during Late Winter 2019 and 2021. Meteorology 2022, 1, 45-63. https://doi.org/10.3390/meteorology1010005
Est MA, Mount S, Steward CA, Lupo AR. Northern Hemisphere Flow Regime Transitions, Blocking, and the Onset of Spring in the Central USA during Late Winter 2019 and 2021. Meteorology. 2022; 1(1):45-63. https://doi.org/10.3390/meteorology1010005
Chicago/Turabian StyleEst, Madeline A., Samuel Mount, Christopher A. Steward, and Anthony R. Lupo. 2022. "Northern Hemisphere Flow Regime Transitions, Blocking, and the Onset of Spring in the Central USA during Late Winter 2019 and 2021" Meteorology 1, no. 1: 45-63. https://doi.org/10.3390/meteorology1010005