Simple Summary
It is well-established that, in Taurine cattle, genetic factors can be exploited to enhance milk fat quality, particularly with regard to human health, through modifications in its fatty acid profile. However, in Zebu cattle, which play a central role in tropical livestock systems, knowledge in this area is still limited. In this study, milk samples from two Zebu breeds, Gir and Guzerá, were analyzed. Samples were collected from 299 Gir cows and 266 Guzerá cows across 22 farms from different Brazilian regions. Different types of fatty acids in the milk were measured, and the extent to which these traits are influenced by genetics was assessed. The results indicated that many of these milk fat traits are moderately to strongly influenced by genetics. This finding suggests that target selection of breeding animals could represent an approach to improve the nutritional profile of milk fat in Zebu cows.
Abstract
Studies in taurine breeds have shown that genetic selection can improve the fatty acid (FA) profile of bovine milk, but studies are scarce considering Zebu animals. In this study, genetic parameters for FA concentrations and unsaturation indexes in the milk fat of Zebu cows were estimated, with emphasis on Gir and Guzerá breeds. Milk samples from 299 Gir and 266 Guzerá cows belonging to 22 herds distributed throughout Brazil were analyzed using gas chromatography. Fourteen individual FAs, 11 FA groups, four nutritional indexes, and five unsaturation indexes were evaluated. Tri-trait Bayesian models were applied, including 305-day milk and fat yields as “anchor” traits. Systematic effects such as contemporary group, age at calving, diet, sampling age class, and days in milk were considered. Palmitic acid was the most abundant FA, followed by oleic, stearic, and myristic acids. Heritability estimates ranged from moderate to high: 0.28–0.66 in Gir cows, and 0.25–0.74 in Guzerá cows, for individual FAs and FA groups. Unsaturation indexes also showed moderate to high heritability. Genetic correlations were generally strong, with long-chain FAs negatively correlated with short- and medium-chain FAs. The results suggest that genetic selection can be applied to improve the nutritional profile of milk fat in Zebu cattle.
1. Introduction
Ruminant milk fat is the most complex lipid in the human diet. It contains several bioactive fatty acids (FAs) with potential benefits on human health, with some not found in significant amounts in other food sources [1,2]. Due to the high saturated fat content in milk, some health professionals have recommended reducing its consumption [3], and the media has published articles against its use in human nutrition, which has damaged the image of milk among consumers worldwide. However, several FAs have beneficial effects on health, including anti-cancer, anti-atherogenic, and immunomodulatory activities [4,5]. Among these, the most well-known are butyric acid (C4:0); odd- and branched-chain FAs (OBCFAs), rumenic acid (cis-9, trans-11 conjugated linoleic acid [CLA]) and its precursor vaccenic acid (trans-11 C18:1), oleic acid (cis-9 C18:1), and omega-3 FAs [2,6].
In addition to their nutritional relevance, milk FA profiles have recently gained attention as potential indicators of enteric methane emissions, since milk fat synthesis is influenced by the same ruminal fermentation pathways involved in methanogenesis [7]. This approach offers a promising, non-invasive tool for estimating greenhouse gas emissions in dairy systems.
The nutritional quality of milk fat can be assessed using indexes based on concentrations of specific FAs. The atherogenic (AI) and thrombogenic (TI) indices are among the most commonly used indices. There is a consensus in the literature that lower AI and TI values indicate a lower concentration of undesirable FAs and a higher concentration of bioactive FAs that are beneficial to human health [8,9].
Several studies have estimated genetic parameters for the bovine milk FA profile [10,11,12,13], most of them in taurine breeds. Their results generally indicate that short-chain FAs (SCFAs) and medium-chain FAs (MCFAs) are under greater genetic control than long-chain FAs (LCFAs). LCFAs originate from the diet, ruminal biohydrogenation, and mobilization from adipose tissue, while SCFAs and MCFAs are mainly synthesized de novo in the mammary gland [14].
Higher heritability estimates are expected for saturated FAs (SFAs) than for unsaturated FAs (UFAs) because most SFAs originate from de novo synthesis in the mammary gland [15]. Information on relevant traits in Zebu (Bos indicus) breeds, such as Gir and Guzerá, remains limited, despite their importance for dairy production in countries like Brazil, where most dairy cattle have a Zebu genetic composition [3,16,17].
These breeds evolved in different tropical environments in India, becoming widely adapted to harsh or extreme climate conditions, feeding on low-quality forage and resisting infestation by some parasites, which resulted in their widespread introduction in Brazil during the 20th century [16,18]. The dual-purpose characteristic of these breeds, beef and milk production, represents an important breeding objective for the Brazilian small-scale commercial producers based on crossbreeding [19], as evidenced by the selection efforts within the Gir and Guzerá improvement programs [17,20,21].
Since Zebu breeds represent a valuable national genetic resource, studying the genetic variability of the milk FA profile, mainly FAs with nutraceutical potential, is crucial for defining selection criteria to improve both milk production and milk fat quality focused on human health. This study aimed to estimate the genetic parameters of the FA profile and unsaturation indexes from milk fat of Zebu cows, specifically of the Gir and Guzerá breeds, using a Bayesian approach.
2. Materials and Methods
2.1. Phenotypic and Pedigree Data
This study used records on milk production traits from the databases of the National Programs for the Improvement of Gir and Guzerá Dairy Cattle, coordinated by Embrapa Gado de Leite in close partnership with the Brazilian Association of Gir Dairy Cattle Breeders and the Brazilian Center for the Genetic Improvement of Guzerá.
The Gir herds were distributed in Southeastern Brazil, while the Guzerá herds were distributed in both Southeastern and Northeastern Brazil tropical regions, namely in the states of Minas Gerais, São Paulo, Espírito Santo, Rio Grande do Norte, and Paraíba. Herds of both breeds were raised in pasture-based production systems, supplemented mainly with corn silage during the dry period. Lactating cows were supplemented throughout the lactation period and offered concentrate feed during each milking, usually twice a day.
The dataset was composed of the first lactation records of 15,620 Gir cows, measured from 1997 to 2016, and 7569 Guzerá cows, measured from 1983 to 2022. Monthly production data were accumulated and truncated at 305 days. The pedigree data comprised 34,248 Gir animals (13,365 dams and 2221 sires) distributed over nine generations, and 21,954 Guzerá animals (10,773 dams and 2203 sires) distributed over 14 generations. Two databases were established, one for the Gir breed and one for the Guzerá breed, and these data were evaluated separately.
2.2. Milk Sampling
The FA profile data were obtained from the database of the project “Influence of polymorphisms in the stearoyl-CoA desaturase (SCD) enzyme gene on the nutritional quality of milk fat from Gir and Guzerá cows” (FAPEMIG: CVZ APQ 02003-15), coordinated by Embrapa Gado de Leite.
Milk samples were first collected in 2012 during a small-scale pilot study involving Gir and Guzerá herds. Sampling efforts were subsequently expanded in 2016 to include additional Guzerá herds, and further extended in 2017 and 2018 to encompass both the Gir and Guzerá breeds.
Individual and unique milk samples were taken from 299 Gir cows and 266 Guzerá cows in 11 herds of each breed during the period around peak lactation (67 ± 34.89 and 73 ± 38.54 days in average, respectively), when the expression of genes involved in lipid metabolism and phenotypic expression is expected to be highest [22,23]. Each 15 mL milk sample comprised ⅔ of the milk from the A.M. (morning) milking and ⅓ from the P.M. (afternoon) milking, representing individual daily production close to the testing day. The samples were collected in Falcon tubes containing no preservative, and were immediately frozen and kept at −20 °C until analysis.
The mean age (±standard deviation) of the cows with phenotypes for FA profile, 305-day milk yield (MY305), and 305-day fat yield (FY305) varied according to breed. For the Gir breed, the mean age was 38.49 ± 3.9 months for cows used in the MY305 and FY305 analyses and 63.19 ± 27.41 months for those with fatty acid profile information. For the Guzerá breed, the corresponding mean ages were 41.65 ± 3.4 months and 68.67 ± 28.16 months, respectively.
2.2.1. Milk Lipid Extraction and Fatty Acids Analysis
Milk samples stored in 15-mL Falcon tubes were thawed at room temperature, and a 1-mL aliquot was used for lipid extraction according to AOAC Official Method 0.05 [24]. After solvent evaporation at 40 °C under an oxygen-free nitrogen stream, the extracted milk lipids were dissolved in hexane and methyl acetate and subsequently transesterified to fatty acid methyl esters (FAMEs) using freshly prepared methanolic sodium methoxide, as described by [25].
FAMEs were separated and quantified using a gas chromatograph (model 7820A; Agilent Technologies Inc., Santa Clara, CA, USA) equipped with a flame-ionization detector and a CP-Sil 88 fused-silica capillary column (100 m × 0.25 mm × 0.20 μm film thickness; Varian Inc., Palo Alto, CA, USA). Chromatographic conditions were identical to those described by [26].
FAMEs were identified by comparing retention times with those of reference standards (Sigma-Aldrich®, St. Louis, MO, USA; Larodan AB, Stockholm, Sweden; Luta-CLA® 60, BASF, Ludwigshafen, Germany). Minor trans/cis-18:1 isomers and trans-9, cis-11 conjugated linoleic acid (CLA) were identified based on their reported elution order under identical analytical conditions [26].
Milk fatty acid (FA) composition was expressed as the weight percentage of total FA using theoretical response factors [27]. Stearoyl-CoA desaturase (SCD1) indices (also referred to as desaturation indices, DI) were calculated for four FA pairs—cis-9 14:1/14:0, cis-9 16:1/16:0, cis-9 18:1/18:0, and cis-9, trans-11 CLA/trans-11 18:1—by expressing each product as the ratio of product to the sum of product and precursor [28]. An overall SCD1 index was also calculated based on all selected product–precursor pairs. The concentrations of FAs in milk samples were described in g/100 g of total FA.
2.2.2. Fatty Acids Traits
This study examined 14 individual FAs and 11 FA groups, four nutritional quality indices, and five unsaturation indices [29,30,31]. Tables S1 and S2 describe the FAs in each FA group and the formulas used to calculate the indices. The unsaturation indices were calculated for the four main stearoyl-CoA desaturase 1 (SCD1) product/substrate pairs (cis-9 C14:1/C14:0, cis-9 C16:1/C16:0, cis-9C18:1/C18:0, and cis-9 trans-11 CLA/trans-11 C18:1), and the total unsaturation index (TUI) was calculated, as described by Schennink et al. [32].
2.3. Statistical Analysis
Information on cows’ age at calving, cows’ age at FA profile sampling, herd, diet, contemporary group (CG), days in milk (DIM), MY305 and FY305, FA profile, and indices were considered in the analysis model.
For the FA profile analyses, the birth order at sampling and diet were grouped into classes (Table 1 and Table 2). For age at sampling (AS), three classes were defined for both breeds. For diet, six categories were defined for the Gir breed and four for the Guzerá breed. During categorization, the diets were initially divided into three large groups (tropical pasture, corn silage, and mixed [tropical pasture and corn silage]), and then these groups were subdivided according to the type of concentrate provided: with lipid concentrate (soy, protected fat or whole cottonseed were included in this class) or without lipid concentrate (barley was used). A greater diversity of diets was observed in Gir herds. In the FA analyses, CGs were formed by concatenating herd, year, and sampling period (dry and rainy).

Table 1.
Number of animals (N) of the Gir cows sampled for the fatty acid profile study, according to the age class and diet category.
Table 2.
Number of animals (N) by age class and category of diet fed to the Guzerá cows sampled for the fatty acid profile study.
Basic descriptive statistics (means, standard deviations, and coefficients of variation) were computed using the R software [33] to characterize the studied traits.
In the MY305 and FY305 analyses, only data from the first lactation were retained, and CGs were formed by concatenating herd, year, and calving period (dry: April to September; rainy: October to March). The classification of the year into periods rather than seasons was performed for two reasons: first, to include as much data as possible; and second, because the climate conditions throughout these periods in the locations where the herds are kept are very similar, enabling accurate grouping of calvings. Cows with an FA profile but missing information (unknown dam and sire, birth date, and/or calving date) were eliminated from the database. Only CGs with more than three cows, consisting of daughters of at least two different sires, were retained. Values outside ±3 standard deviations for each trait were considered outliers and excluded from the CG.
Finally, for each breed, the phenotypic dataset included a different number of records, which were distributed into different numbers of contemporary groups (Table 3).
Table 3.
Number of contemporary groups (CG) by breed and milk trait in dairy cows.
Variance Components and Genetic Parameters Estimation
For the heritability for FA profile, the (co)variance components were estimated via Bayesian inference in tri-trait analyses, using MY305 and FY305 as genetic anchor traits. These traits were used as an anchor to ensure a better link between the data, since there was little information available on fatty acids. To access the genetic correlations, two-trait analyses were carried out. Pairwise analyses were conducted, comparing each FA with every other FA. Multi-trait analysis was not possible because the number of measurements was insufficient for convergence.
The systematic effects considered in the models for MY305 and FY305 analyses were CG and age at calving (linear covariate). The systematic effects for the FA profile were AS class, diet category, CG, and DIM (linear covariate).
The general model used to estimate the genetic parameters was as follows:
where y is the vector of phenotypes for each trait (MY305, FY305, or FA), X is the incidence matrix related to systematic effects, β is the vector of systematic effects, Z is the incidence matrix of genetic-additive random effects, a is the vector of genetic-additive random effects, and ε is the vector of residual random effects. A uniform (noninformative) prior distribution was assumed for the systematic effects. Multivariate Gaussian (MVN) distributions and inverted Wishart (IW) and inverted chi-square () prior to distributions were assumed for all the estimated parameters as follows:
where is the additive genetic (co)variance matrix between traits 1, 2, and 3, i.e.,
is the residual (co)variance matrix between the traits 1, 2, and 3, i.e.,
And A is the numerator relationship matrix; , , , and are the hyperparameter values of the variances; and , , , and are prior “degrees of belief” corresponding to the hyperparameter values of the variances.
The models were implemented in a Bayesian approach using a Markov chain Monte Carlo methodology with Gibbs sampling using the GIBBSF90+ program [34]. A chain size of 2,000,000 iterations was generated, considering a burn-in of 500,000 iterations and a thinning of 50, for all traits. Then, 30,000 samples were used to obtain the marginal posterior distribution of the variance components and genetic parameters. The convergence criteria of the Gibbs chains were monitored by graphical inspection and the Geweke test [35].
3. Results
Table 4, Table 5, Table 6 and Table 7 present the descriptive statistics for each trait among the Gir and Guzerá cows. For Gir cows, large coefficients of variation (CVs) were observed for most of the FA profile traits. In contrast, Guzerá cows had slightly lower CVs for FA traits. Regardless of the breed, palmitic acid (C16:0) was the most abundant FA in milk fat, followed by oleic (cis-9 C18:1), stearic (C18:0), and myristic (C14:0) acids. Concentrations were higher for MCFAs than for LCFAs and SCFAs, and for SFAs than for UFAs. The proportion was higher for monounsaturated FAs (MUFAs) than for polyunsaturated FAs (PUFAs). The other individual FAs and FA groups were found at concentrations < 4 g/100 g total FA. The nutritional quality of milk fat and unsaturation indices were similar for both breeds (Table 4 and Table 7).
Table 4.
Number of animals (N), mean, standard deviations (SD), coefficients of variation (CV), minimum and maximum values for the milk yield (MY305), fat yield (FY305), and individual fatty acids (g/100 g of total fatty acids) from the milk fat of Gir cows.
Table 5.
Number of animals (N), mean, standard deviations (SD), coefficients of variation (CV), minimum and maximum values for the fatty acid groups, nutritional quality indexes, and unsaturation indexes (g/100 g of total fatty acids) from the milk fat of Gir cows.
Table 6.
Number of animals (N), mean, standard deviations (SD), coefficients of variation (CV), minimum and maximum values for milk yield (PL305), fat yield (PG305), and individual fatty acids (g/100 g total fatty acids) from the milk fat of Guzerá cows.
Table 7.
Number of animals (N), mean, standard deviations (SD), coefficients of variation (CV), minimum and maximum values for the fatty acid groups, nutritional quality indexes, and unsaturation indexes (g/100 g of total fatty acids) of milk fat from Guzerá cows.
Only the 10 most studied individual FAs associated with human health, FA groups (SCFA, MCFA, LCFA, SFA, UFA, MUFA, PUFA, odd- and linear-chain FA [OLCFA], branched-chain FAs, ω-6 cis, and ω-3 cis), ω-6/ω-3 ratio, and unsaturation indices were used to estimate variance components and heritability. Genetic correlations were estimated only among individual FAs, MY305, and FY305.
The number of chains analyzed was sufficient to stabilize all analyses for both breeds. Table 8, Table 9, Table 10, Table 11, Table 12 and Table 13 present the posterior estimates of the variance components and heritability of the milk FA profile in Gir and Guzerá cows. Regardless of the breed, the credibility intervals (CIs) were wide. The posterior means of the estimates were 0.17 and 0.29 for the MY305 heritability coefficients and 0.06 and 0.21 for the FY305 heritability coefficients in the Gir and Guzerá breeds, respectively. In the Gir data, the posterior means of the heritability estimates ranged from 0.28 to 0.63 for individual FAs, from 0.32 to 0.66 for FA groups, and from 0.38 to 0.57 for the unsaturation indices. In the Guzerá data, the heritability estimates ranged from 0.25 to 0.74 for the individual FAs, from 0.26 to 0.65 for the FA groups, and from 0.50 to 0.68 for the unsaturation indices.
Table 8.
Posterior means and respective standard deviation (PSD), credibility interval (CI, 95%) of estimates of additive genetic variance (), residual variance (), and heritability (h2) for milk yield (MY305), fat yield (FY305), and individual fatty acids in milk from Gir cows, from tri-trait analysis with MY305 and FY305.
Table 9.
Posterior means and respective standard deviation (PSD), credibility interval (CI, 95%) of estimates of additive genetic variance (), residual variance (), and heritability (h2) of the fatty acid groups in milk fat from Gir cows, from tri-trait analysis with MY305 and FY305.
Table 10.
Posterior means and respective standard deviation (PSD), credibility interval (CI, 95%) of estimates of additive genetic variance (), residual variance (), and heritability (h2) of the indexes of nutritional quality and unsaturation of milk fat in Gir cows, from tri-trait analysis with MY305 and FY305.
Table 11.
Posterior means and respective standard deviation (PSD), credibility interval (CI, 95%) of estimates of additive genetic variance (), residual variance (), and heritability (h2) for milk yield (MY305), fat yield (FY305), and individual fatty acids in milk from Guzerá cows, from tri-trait analysis with MY305 and FY305.
Table 12.
Posterior means and respective standard deviation (PSD), credibility interval (CI, 95%) of estimates of additive genetic variance (), residual variance (), and heritability (h2) of the fatty acid groups in milk fat from Guzerá cows, from tri-trait analysis with MY305 and FY305.
Table 13.
Posterior means and respective standard deviation (PSD), credibility interval (CI, 95%) of estimates of additive genetic variance (), residual variance (), and heritability (h2) of the indexes of nutritional quality and unsaturation of milk fat in Guzerá cows, from tri-trait analysis with MY305 and FY305.
The posterior means of the genetic correlation coefficients are shown in Figure 1 for the Gir breed and Figure 2 for the Guzerá breed. Large posterior standard deviations were observed for the genetic correlation estimates. For the genetic correlations, when zero was within the CIs, the estimates did not differ from zero. The correlations ranged from moderate to high regardless of direction.
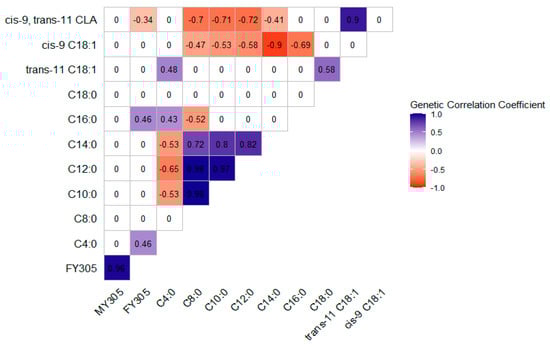
Figure 1.
Posterior means of the estimates of the genetic correlation coefficients among milk yield (MY305), fat yield (FY305), and individual fatty acids of Gir cows’ milk, from two-trait analyses.
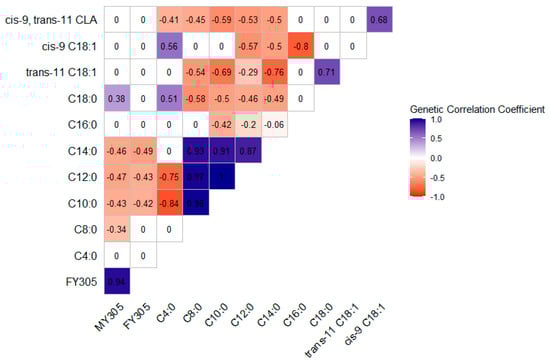
Figure 2.
Posterior means of the estimates of the genetic correlation coefficients between milk yield (MY305), fat yield (FY305), and individual fatty acids of Guzerá cows’ milk, from two-trait analyses.
For the Gir breed, while MY305 showed no genetic correlations with individual FAs, FY305 showed a moderate positive genetic correlation with C4:0 and C16:0 FAs and a moderate negative correlation with cis-9, trans-11 CLA. The genetic correlations among the individual FAs ranged from −0.90 to 0.98. C4:0 showed a negative and moderate correlation with C10:0, C12:0, and C14:0, and a positive correlation with C16:0 and trans-11 C18:1. Cis-9 C18:1 showed a moderate to high and negative correlation with SCFAs and MCFAs (C8:0 to C16:0). Cis-9, trans-11 CLA showed a positive and high genetic correlation with its precursor trans-11 C18:1 and a moderate to high negative correlation with C8:0 to C14:0.
For the Guzerá breed, MY305 showed moderate genetic correlations with individual FAs, which were negative for C8:0 to C14:0 and positive for C18:0. FY305 showed a moderate and negative genetic correlation with C10:0, C12:0, and C14:0. Regarding individual FAs, C18:0 showed a moderate positive correlation with C4:0, and a negative correlation with C8:0 to C14:0. Trans-11 C18:1 showed a low to high correlation with C8:0 to C14:0. Cis-9 C18:1 showed a moderate positive correlation with C4:0, and a moderate to high negative correlation with C12:0 to C16:0. Cis-9, trans-11 CLA showed a moderate negative genetic correlation with C4:0 to C14:0, and a positive correlation with cis-9 C18:1.
In both breeds, C8:0 to C14:0 showed high and moderate positive genetic correlations with C18:0 and trans-11 C18:1. Otherwise, the pattern of genetic correlations between C16:0 and the other FAs differed between breeds. Regardless of the breed, when the correlations were non-zero, LCFAs generally correlated negatively with SCFAs and MCFAs.
4. Discussion
4.1. Descriptive Statistics
To our knowledge, no studies have examined the genetic parameters of milk FA composition in Zebu cattle (Bos indicus). Therefore, this study can be considered the first to undertake quantitative genetic analyses of FA profiles in Zebu cattle. Some studies have demonstrated the ability of Zebu cattle to produce milk with a higher fat content, with levels even above those found in some taurine breeds (Bos taurus) [36,37], which could also occur with the FA levels in Zebu milk fat [38]. In general, the milk FA profiles of Gir and Guzerá cows were similar to those described for Bos indicus and Bos taurus breeds in studies that expressed the FA profile in g/100 g of fat [3,37,39,40]. Understanding the genetic behavior of fatty acids in milk is an important first step in the search for a fatty acid profile that benefits human health. However, there is no consensus in the literature regarding the optimal combination of fatty acids that make up the milk profile.
Regardless of the breed, FAs considered bioactive, such as cis-9, trans-11 CLA (Gir = 0.77 ± 0.30 g/100 g of total FA; Guzerá = 0.92 ± 0.40 g/100 g of total FA), trans-11 C18:1 (Gir = 1.45 ± 0.60 g/100 g of total FA; Guzerá = 1.83 ± 0.90 g/100 g of total FA), and the ω-3 class (Gir = 0.45 ± 0.10 g/100 g of total FA; Guzerá = 0.49 ± 0.11 g/100 g of total FA) showed slightly higher concentrations than those observed in the Brown Swiss breed (cis-9, trans-11 CLA = 0.65 g/100 g of total FA; trans-11 C18:1 = 1.20 g/100 g of total FA) [39] and the synthetic Girolando breed (cis-9, trans-11 CLA = 0.75; trans-11 C18:1 = 1.34; ω-3 = 0.16) [40]. While the concentrations found for these FAs in our study were <2 g/100 g of total FA, these contents can have a significant biological impact on human health [14].
The average concentrations of C18:0 and cis-9 C18:1 FA observed in our study were slightly higher than those observed by Silva et al. [40] when evaluating the milk FA profile of Girolando cows at 90 ± 15 DIM. Many factors could explain the observed differences, including lactation stage, breed, and, most importantly, the diet. The higher concentrations of C18:0 and cis-9 C18:1 in Zebu milk fat may be attributed to milk sampling around the peak of lactation, when the maximum gene expression is expected and, thus, the maximum phenotypic expression. Moreover, during this period, cows may also experience a negative energy balance [37], which would increase body fat mobilization, incorporating more C18:0 and cis-9 C18:1 into the milk fat, since they are the main FAs stored in adipose tissue [12,41]. Another possible explanation is related to the diet provided to both the Gir and Guzerá cows, since 50.62% (n = 286) received a diet based on tropical pasture, of which 42.10% (n = 129) also received a lipid concentrate. This finding is consistent with studies that showed that cows grazing pasture supplemented with lipid sources produce milk with higher LCFA and UFA concentrations, increasing the biological and nutritional value of the milk [42,43,44].
Jointly considering the results of scientific reviews by Arnould and Soyeurt [45] and Samková et al. [38] and a meta-analysis by Hossein-Zadeh [46], it can be considered that there is no consensus on the fact that heritability estimates of FAs are higher when expressed in g/100 g of milk than other concentration units. However, while the concentrations were expressed in g/100 g of total FA, the heritabilities estimated in our study were higher than those obtained by Bobbo et al. [13], who expressed the FA profile in g/100 g of milk.
Comparing the results on milk FA across different studies is difficult due to differences in interspecific diversity, database structure, sample size, experiments design and precision, laboratory analysis methods (gas chromatography or mid-infrared spectroscopy), concentration units (g/100 g of fat, g/100 dL or 100 g of milk, or g/100 g of total FA), and statistical models [46,47,48], which lead to wide variation in the reported heritability estimates.
4.2. Genetic Parameters
Our study observed a wider CI, potentially reflecting the database structure, as there was a limited number of cows with milk FA profiles for both breeds (Gir = 299, Guzerá = 266). Studies that used more profiles reported narrower CIs [49]. However, we emphasize that although the number of animals phenotyped for FA is limited, this study is a pioneering step toward improving milk quality in the breeds studied and in Zebu cattle in general.
Regarding the individual milk FAs, the posterior means of the heritability estimates are similar in our study to those obtained by Palombo et al. [50] for taurine breeds, except for C12:0, which was higher for the Guzerá breed. When analyzing data from Holstein × Jersey crossbred cows, Lopez-Villalobos et al. [48] found heritability estimates similar to those obtained in our study with the Guzerá breed for C16:0; cis-9, trans-11 CLA; PUFA; and LCFA, and the Gir breed for C8:0, C10:0, and C12:0.
SCFAs and MCFAs synthesized de novo in the mammary gland present higher heritability estimates than LCFAs, as these are mainly derived from the diet, biohydrogenation in the rumen, and mobilization from adipose tissue [51]. However, in our study, the posterior heritability estimates were similar for these groups in the two breeds. The heritability estimates found for LCFAs indicate the existence of genetic variability underlying the process of incorporating these FAs into the milk [51].
SFAs were expected to show greater heritability than UFAs [48]. Biologically, this difference can be explained by the fact that most FAs synthesized de novo in the mammary gland are SFAs [15]. In our study, contrary to what was found by Lopez-Villalobos et al. [48], UFAs showed similar heritability estimates to SFAs. One possible explanation for these unexpected results could be that the individual milk samples were taken at a fixed moment during lactation (around the peak), while the other studies collected several samples during the entire or partial period of lactation [52]. The period around the peak of lactation was chosen for sampling the milk FA profile because it is assumed that the phenotypic expression of these traits would be greatest during this period [22,23].
OBCFAs in milk fat primarily originate from the cell wall of rumen bacteria [53,54,55]. Hence, they are expected to be under less genetic control, leading to lower heritability [56]. Evaluating taurine breeds, Palombo et al. [50] found heritability estimates similar to those obtained in our study for OLCFAs and OBCFAs in the Guzerá breed and lower than those found in the Gir breed for OLCFAs and the ω-6 cis group.
Our study also examined the unsaturation indices of the four main SCD1 product/substrate FA pairs (C14:0/cis-9 C14:1, C16:0/cis-9 C16:1, C18:0/cis-9 C18:1, and trans-11 C18:1/cis-9, trans-11 CLA) and the TUI encompassing all these pairs. Since these pairs were studied to assess SCD1 activity in the mammary gland, the C14:1 index was expected to show greater heritability than the other unsaturation indices because, unlike the FAs included in those indices, C14:0 is almost entirely synthesized de novo in the mammary gland and, thus, all cis-9 C14:1 is produced by SCD1 [39,57]. However, in our study, the heritability estimates obtained for the unsaturation indices were similar, regardless of the breed. In both breeds, the heritabilities for the TUI were like those obtained by Schennink et al. [32] and Bilal et al. [57]. Moderate to high heritabilities for the unsaturation indices suggest that they can be altered through genetic selection (h2: low, <0.1; moderate, 0.1–0.3; high, >0.3).
Most of the individual FAs, FA groups, or indices evaluated in our study generally showed moderate to high heritability estimates, indicating that direct genetic selection can effectively alter the milk FA composition to obtain milk with a better nutritional profile for human health. The genetic correlation between milk fat FAs refers to the degree to which the same gene pool influences the presence and proportions of the different FAs. Figure 1 and Figure 2 show that the correlations behaved differently in the two breeds, which can be explained by differences in their evolutionary histories and artificial selection intensities.
The correlations between MY305 and C8:0, C10:0, C12:0, and C14:0 content (in g/100 g of total FA) were negative for the Guzerá breed (Figure 2). Bastin et al. [51] and Bobbo et al. [13] observed a similar pattern in taurine breeds, although they expressed FA concentrations in g/dL and g/100 g of milk and took measurements throughout the lactation period. These results reinforce the antagonistic action of proteins involved in synthesizing certain FAs in fat milk, especially SCFAs, which are substrates for the others.
In the Gir breed, although weak, FY305 correlated positively with C16:0 (Figure 1). Thus, these traits share the positive effects of the same gene pool, and selection for increasing MY305 would improve the C16:0 milk fat concentration. As C16:0 is associated with adverse effects on cardiovascular risk indicators, increasing its concentration in milk fat would be undesirable [8].
Soyeurt et al. [10] stated that since genetic correlations reflect the physiological processes involved in synthesizing FAs in milk fat, they can be interpreted from a biological perspective. Due to the different origins of FAs in milk fat, the genetic correlations generally showed different directions when preformed FAs (originating from diet, ruminal biohydrogenation, and mobilization of body reserves) were correlated to those synthesized de novo in the mammary gland (Figure 1 and Figure 2). An example is the C8:0, which showed a positive correlation with the other de novo synthesized FAs (C10:0, C12:0, and C14:0) in both breeds, and a negative correlation with cis-9 C18:1 and cis-9, trans-11 CLA in the Gir breed, and with trans-11 C18:1 and cis-9, trans-11 CLA in the Guzerá breed, both of which come partly from the bloodstream. These results suggest that selection can be based on only one FA representative of the de novo synthesized or preformed FA group. Therefore, selection for a lower concentration of a single FA could increase the concentration of certain FAs in milk fat, improving the nutritional composition of the milk fat.
In both breeds (Figure 1 and Figure 2), C4:0 was negatively correlated with SCFAs and MCFAs (C10:0, C12:0). In the Gir breed, C4:0 and C14:0 were negatively correlated, whereas no significant correlation was observed between these fatty acids in the Guzerá breed. C4:0 was positively correlated with LCFAs (C18:0 and cis-9 C18:1, for the Guzerá breed, and trans-11 C18:1, for the Gir breed). This pattern can be explained by not all C4:0 being synthesized de novo in the mammary gland, with some incorporated from the bloodstream. As a result, when there is a higher concentration of FAs, it can suppress the expression of key proteins involved in de novo synthesis, such as acetyl-CoA carboxylase alpha (ACACα) and fatty acid synthase (FASN), which are central to this metabolic process. Consequently, the concentrations of C4:0 in milk fat will be higher because this FA has not been used as a substrate in de novo FA synthesis [23,58].
According to Mu et al. [59], ruminant milk fat synthesis is complex and dynamic, as it involves many key enzymes, proteins, and regulatory factors. The final product of the de novo synthesis cycle is C16:0. However, during the finishing process, intermediate SCFAs and MCFAs are formed and included in the milk fat [60], potentially explaining the high genetic correlations observed between C8:0 and C14:0 in the Gir (r = 0.72) and Guzerá (r = 0.93) breeds. Hence, most proteins influencing C8:0 production also influence C14:0 production because they are part of the same metabolic pathway [60].
The genetic correlation between cis-9, trans-11 CLA and trans-11 C18:1 was strong and positive in the Gir breed (0.90; Figure 1). Prado et al. [61] reported that most (86.8% ± 2.8%) of the cis-9, trans-11 CLA in milk is produced predominantly from its precursor trans-11 C18:1 in the mammary gland through desaturation mediated by SCD1, explaining our results. In the Guzerá breed, cis-9, trans-11 CLA showed a moderate and positive genetic correlation with cis-9 C18:1 (0.68; Figure 2). This correlation reflects, in part, the common origin of these two FAs, which are synthesized in the mammary gland by converting cis-9 C18:0 into C18:1, and trans-11 C18:1 into cis-9, trans-11 CLA by the action of SCD1 [61].
4.3. Future Prospects
Future studies should expand the number of phenotyped animals to obtain more accurate estimates of genetic parameters, heritabilities, and genetic correlations, among milk FA. Integrating genomic information with phenotypic and nutritional data could help to identify candidate genes and metabolic pathways involved in milk-fat synthesis and desaturation. Moreover, understanding genotype–environment interactions and, particularly, the influence of diet and management systems, will be essential to design breeding programs that simultaneously improve milk yield, composition, greenhouse gas emissions, and nutritional quality for human health. Two questions remain: How much could changes in the bovine milk fatty acid profile interfere with its physical and chemical properties? What is the best bovine milk fatty acid profile for human health?
5. Conclusions
The moderate to high heritability estimates observed in our study indicate that the milk FA profile of Gir and Guzerá cows can be improved through selective breeding, with potential beneficial effects on human health. The genetic correlations between the FAs were moderate to high, depending on whether or not they had a common origin, were de novo synthesized, or preformed. Since the genetic correlations of MY305 and FY305 with individual FAs in the Gir breed were generally not different from zero, direct selection for MY305 or FY305 is unlikely to affect the milk fat FA profile in these populations, except for rumenic, butyric, and palmitic acids. In the Guzerá breed, the estimated genetic correlations indicate that an increase in milk or fat production can negatively affect the composition of SCFAs and MCFAs.
Supplementary Materials
The following supporting information can be downloaded at: https://www.mdpi.com/article/10.3390/ruminants5040059/s1, Table S1: Groups of fatty acids calculated from the milk FA profile of Gir and Guzerá cow; Table S2: Fatty acids and formulas used to calculate the fatty acid profile indexes of the milk fat from Gir and Guzerá cows.
Author Contributions
The experimental design was developed by M.A.S.d.G., M.G.C.D.P., M.R.S.C. and F.C.F.L. Sample collection and data generation were carried out by M.G.C.D.P., P.S.L., M.R.S.C., M.A.S.d.G., F.A.T.B., F.C.F.L. and A.E.V.F. Data analysis was performed by A.F.d.R., P.S.L., R.V., E.R.C., M.G.C.D.P., P.A.d.S.F. and M.R.S.C. All authors participated in the discussion of the results. The first draft of the manuscript was written by A.F.d.R. and revised by P.S.L. and M.G.C.D.P. After that, all authors commented on the last version of the manuscript. All authors have read and agreed to the published version of the manuscript.
Funding
This study was financed by Fundação de Amparo à Pesquisa do Estado de Minas Gerais (FAPEMIG)—Project CVZ APQ 02003-15 and received a PhD Grant from the Coordenação de Aperfeiçoamento de Pessoal de Nível Superior (CAPES)—PROEX 32002017011P9, and a scholarship from the Conselho Nacional de Desenvolvimento Científico e Tecnológico (CNPq)—Grant no. 150156/2022-7.
Institutional Review Board Statement
The Animal Care and Ethics Committee at Embrapa Gado de Leite approved on 11 March 2016 all animal procedures of this project under protocol number CEUA No. 11/2015, in compliance with the guidelines and recommendations of the “National Council for the Control of Animal Experimentation”.
Informed Consent Statement
Not applicable.
Data Availability Statement
The datasets generated and/or analyzed during the current study are not publicly available as they are part of ongoing research and some of them belong to the breeders’ associations, but they can be obtained from the corresponding author upon reasonable request.
Acknowledgments
The authors are grateful to the technician Hernani Guilherme Barbosa Filho, who analyzed the milk fatty acid composition at the Laboratory of Chromatography of Embrapa Dairy Cattle. We also acknowledge CBMG2 and ABCGIL for data cession. We are thankful for the financial support provided by FAPEMIG, CAPES, and CNPq.
Conflicts of Interest
The authors claim that there are no conflicts of interest.
Abbreviations
The following abbreviations are used in this manuscript:
| AS | Age at sampling |
| AI | Atherogenic index |
| C10:0 | Capric acid |
| C12:0 | Lauric acid |
| C14:0 | Myristic acid |
| C16:0 | Palmitic acid |
| C18:0 | Stearic acid |
| C18:2 ω-6 | Linoleic acid (omega-6) |
| C18:3 ω-3 | A-linolenic acid (omega-3) |
| C18:3 ω-6 | Γ-linolenic acid (omega-6) |
| C20:5 ω-3 | Eicosapentaenoic acid (omega-3) |
| C4:0 | Butyric acid |
| C8:0 | Caprylic acid |
| CG | Contemporary group |
| CI | Credibility interval |
| cis-9 C18:1 | Oleic acid |
| CLA cis-9, trans-11 | Rumenic acid |
| CV | Coefficients of variation |
| DIM | Days in milk |
| FA | Fatty acids |
| FY305 | 305-day fat yield |
| h/H | Relationship between hypocholesterolemic and hypercholesterolemic fatty acids |
| Index C14:1 | Unsaturation index C14:1 |
| Index C16:1 | Unsaturation index C16:1 |
| Index C18:1 | Unsaturation index C18:1 |
| Index CLA | Unsaturation index CLA |
| LCFA | Long-chain fatty acids |
| MCFA | Medium-chain fatty acids |
| MUFA | Monounsaturated fatty acids |
| MY305 | 305-day milk yield |
| OBCFA | Odd- and branched-chain fatty acids |
| OLCFA | Odd- and linear-chain fatty acids |
| PSD | Posterior standard deviation |
| PUFA | Polyunsaturated fatty acids |
| SCFA | Short-chain fatty acids |
| SD | Standard deviations |
| SFA | Saturated fatty acids |
| TI | Thrombogenic index |
| trans-11 C18:1 | Trans-vaccenic acid |
| TUI | Total unsaturation index |
| UFA | Unsaturated fatty acids |
| ω-3 cis | Cis-configured omega-3 fatty acids |
| ω-6 cis | Cis-configured omega-6 fatty acids |
| ω6/ω3 | Relationship between omega-6 and omega-3 fatty acids |
References
- Lopes, F.C.F.; Silva, B.C.M.; Almeida, M.M.; Martins, P.C.; Piccinini, G.A.; Krug, E.E.B. Lácteos naturalmente enriquecidos com ácidos graxos benéficos à saúde. In Sustentabilidade Ambiental, Social e Econômica da Cadeia Produtiva do Leite: Desafios e Perspectivas; Martins, P.C., Piccinini, G.A., Krug, E.E.B., Eds.; Embrapa: Brasília, Brazil, 2015; pp. 237–309. [Google Scholar]
- Gómez-Cortés, P.; Juárez, M.; Fuente, A. Milk fatty acids and potential health benefits: An updated vision. Trend Food Sci. Technol. 2018, 81, 1–9. [Google Scholar] [CrossRef]
- Matosinho, C.G.R.; Fonseca, P.A.S.; Peixoto, M.G.C.D.; Rosse, I.C.; Lopes, F.C.F.; Zózimo, T.; Vercesi Filho, A.E.; Bruneli, F.A.T.; Carvalho, M.R.S.; Gama, M.A.S. Phenotypic variation in milk fatty acid composition and its association with stearoyil-CoA desaturase 1(SCD1) gene polymorphisms in Gir cows. J. Anim. Breed. Genet. 2023, 40, 532–548. [Google Scholar] [CrossRef]
- Abdoul-Aziz, S.K.A.; Zhang, Y.E.; Wang, J. Milk odd and branched chain fatty acids in dairy cows: A review on dietary factors and its consequences on human health. Animals 2021, 11, 3210. [Google Scholar] [CrossRef]
- Coniglio, S.; Shumskaya, M.; Vassiliou, E. Unsaturated fatty acids and their immunomodulatory properties. Biology 2023, 12, 279. [Google Scholar] [CrossRef]
- Kratz, M.; Baars, T.; Guyenet, S. The relationship between high-fat dairy consumption and obesity, cardiovascular, and metabolic disease. Eur. J. Nutr. 2013, 52, 1–24. [Google Scholar] [CrossRef] [PubMed]
- Youngmark, E.C.; Kraft, J. Milk fatty acids as potential biomarkers of enteric methane emissions in Dairy Cattle: A review. Animals 2025, 15, 2212. [Google Scholar] [CrossRef] [PubMed]
- Hanuš, O.; Samková, E.; Křížová, L.; Hasoňová, L.; Kala, R. Role of Fatty Acids in Milk Fat and the Influence of Selected Factors on Their Variability—A Review. Molecules 2018, 23, 1636. [Google Scholar] [CrossRef] [PubMed]
- Duque, A.C.A.; Oliveira, J.S.; Morenz, M.J.F.; Gama, M.A.S.; Borges, A.L.C.C.; Silva, R.R.; Lopes, F.C.F. Perfil de ácidos graxos do leite de vacas Holandês x Gir alimentadas com silagem de milho e concentrado contendo ou não glicerina bruta. Arq. Bras. Med. Vet. Zootec. 2020, 72, 243–252. [Google Scholar] [CrossRef]
- Soyeurt, H.A.; Gilson, A.; Vanderick, S.; Mayeres, P.; Bertozzi, C.; Gengler, N. Estimation of heritability and genetic correlations for the major fatty acids in bovine milk. J. Dairy Sci. 2007, 90, 4435–4442. [Google Scholar] [CrossRef]
- Stoop, W.M.; Schennink, A.; Visker, M.H.P.W. Genome-wide scan for bovine milk-fat composition. I. Quantitative trait loci for short- and medium-chain fatty acids. J. Dairy Sci. 2009, 92, 4664–4675. [Google Scholar] [CrossRef]
- Narayana, S.G.; Schenkel, F.S.; Fleming, A.; Koeck, A.; Malchiodi, F.; Jamrozik, J.; Johnston, J.; Sargolzaei, M.; Miglior, F. Genetic analysis of groups of mid-infrared predicted fatty acids in milk. J. Dairy Sci. 2017, 100, 4731–4744. [Google Scholar] [CrossRef] [PubMed]
- Bobbo, T.; Penasa, M.; Cassandro, M. Genetic parameters of bovine milk fatty acid profile, yield, composition, total and differential somatic cell count. Animals 2021, 10, 2406. [Google Scholar] [CrossRef]
- Bouwman, A.C.; Bovenhuis, H.; Visker, M.H.P.W.; Arendonk, J.A.M.V. Genome-wide association of milk fatty acids in Dutch dairy cattle. BCM Genet. 2011, 12, 43. [Google Scholar] [CrossRef]
- Chilliard, Y.; Ferlay, A.; Mansbridge, R.; Doreau, M. Ruminant milk fat plasticity: Nutritional control of saturated, polyunsaturated, trans and conjugated fatty acids. Ann. Zootech. 2000, 49, 181–205. [Google Scholar] [CrossRef]
- Peixoto, M.G.C.D.; Carvalho, M.R.S.; Egito, A.A.; Steinberg, R.S.; Bruneli, F.A.T.; Machado, M.A.; Santos, F.C.; Rosse, I.C.; Fonseca, P.A.S. Genetic diversity and population genetic structure of a Guzerá (Bos indicus) meta-population. Animals 2021, 11, 1125. [Google Scholar] [CrossRef]
- Carvalho, N.S.; Daltro, D.S.; Machado, J.D.; Camargo, E.V.; Cobuci, J.A. Genetic parameters and genetic trends for production traits in dairy Gir cattle. Ciênc. Rural 2023, 53, e20210541. [Google Scholar] [CrossRef]
- Santana, M.L., Jr.; Pereira, R.J.; Bignardi, A.B.; El Faro, L.; Tonhati, H.; Albuquerque, L.G. History, Structure, and genetic diversity of Brazilian Gir cattle. Livest. Sci. 2014, 163, 26–33. [Google Scholar] [CrossRef]
- Madalena, F.E.; Peixoto, M.G.C.D.; Gibson, J. Dairy cattle genetics and its applications in Brazil. Livest. Res. Rural Develop. 2012, 24, 6. [Google Scholar]
- Peixoto, M.G.C.D.; Carrara, E.R.; Lopes, P.S.; Bruneli, F.A.T.; Penna, V.M. The contribution of a MOET nucleus scheme for the improvement of Guzerá (Bos indicus) cattle for milk traits in Brazil. Front. Gent. 2022, 28, 982858. [Google Scholar] [CrossRef]
- Carrara, E.R.; Peixoto, M.G.C.D.; Veroneze, R.; Silva, F.F.; Ramos, P.V.B.; Bruneli, F.A.T.; Zadra, L.E.F.; Ventura, H.T.; Josahkian, L.A.; Lopes, P.S. Genetic study of quantitative traits supports the use of Guzerá as dual-purpose cattle. Anim. Biosci. 2022, 35, 955–963. [Google Scholar] [CrossRef]
- Bionaz, M.; Loor, J. Identification of reference genes for quantitative real-time PCR in the bovine mammary gland during the lactation cycle. Physiol. Genomics 2007, 3, 312–319. [Google Scholar] [CrossRef]
- Bionaz, M.; Loor, J. Gene networks driving bovine milk fat synthesis during the lactation cycle. BCM Genom. 2008, 9, 366. [Google Scholar] [CrossRef] [PubMed]
- AOAC International. Official Methods of Analysis of the AOAC International, 19th ed.; AOAC International: Rockville, MD, USA, 2012. [Google Scholar]
- Baldin, M.; Gama, M.A.S.; Dresch, R.; Harvatine, K.J.; Oliveira, D.E. A rumen unprotected conjugated linoleic acid supplement inhibits milk fat synthesis and improves energy balance in lactating goats. J. Anim. Sci. 2013, 91, 3305–3314. [Google Scholar] [CrossRef] [PubMed]
- Cruz-Hernandez, C.; Kramer, J.K.G.; Kennelly, J.J.; Glimm, D.R.; Sorensen, B.M.; Okine, E.K.; Goonewardene, L.A.; Weselake, R.J. Evaluating the conjugated linoleic acid and Trans 18:1 isomers in milk fat of dairy cows fed increasing amounts of sunflower oil and a constant level of fish oil. J. Dairy Sci. 2007, 90, 3786–3801. [Google Scholar] [CrossRef] [PubMed]
- Wolff, R.L.; Bayard, C.C.; Fabien, R.J. Evaluation of sequential methods for the determination of butterfat fatty acid composition with emphasis on trans-18:1 acids. Application to the study of seasonal variations in French butters. J. Am. Oil Chem. Soc. 1995, 72, 1471–1483. [Google Scholar] [CrossRef]
- Kelsey, J.A.; Corl, B.A.; Collier, R.J.; Bauman, D.E. The effect of breed, parity, and stage of lactation on conjugated linoleic acid (CLA) in milk fat from dairy cows. J. Dairy Sci. 2003, 86, 2588–2597. [Google Scholar] [CrossRef]
- Krag, K.; Poulsen, N.A.; Larsen, M.K.; Larsen, L.B.; Janss, L.L.; Buitenhuins, B. Genetic parameters for milk fatty acids in Danish Holstein cattle based on SNP markers using a Bayesian approach. BCM Genet. 2013, 14, 79. [Google Scholar] [CrossRef]
- Santos-Silva, J.; Mendes, I.A.; Bessa, R.J.B. The effect of genotype, feeding system and slaughter weight on the quality of light lambs—1. Growth, carcass composition and meat quality. Livest. Prod. Sci. 2002, 76, 17–25. [Google Scholar] [CrossRef]
- Ulbricht, T.; Southgate, D. Coronary heart disease: Seven dietary factors. Lancet 1991, 338, 985–992. [Google Scholar] [CrossRef]
- Schennink, A.; Heck, J.M.L.; Bovenhuis, H.; Visker, M.H.P.W.; Van Valenberg, H.J.F.; Van Arendonk, J.A.M. Milk fatty acid unsaturation: Genetic parameters and effects of Stearoyl-CoA Desaturase (SCD) and Acyl CoA: Diacylglycerol Acyltransferase 1 (DGAT1). J. Dairy Sci. 2008, 91, 2135–2143. [Google Scholar] [CrossRef]
- The R Core Team. R: A Language and Environment for Statistical Computing; R Foundation for Statistical Computing: Vienna, Austria, 2024. [Google Scholar]
- Misztal, I.; Tsuruta, S.; Lourenco, D.; Masuda, Y.; Aguilar, I.; Legarra, A.; Vitezica, Z. Manual for BLUPF90 Family of Programs; University of Georgia: Athens, GA, USA, 2014. [Google Scholar]
- Geweke, J. Evaluating the Accuracy of Sampling-Based Approaches to the Calculation of Posterior Moments; Staff Report; Federal Reserve Bank of Minneapolis, Research Department: Minneapolis, MN, USA, 1991; p. 148. [Google Scholar] [CrossRef]
- Sharma, R.; Ahlawat, S.; Aggarwal, R.A.K.; Dua, A.; Sharma, V.; Tantia, M.S. Comparative milk metabolite profiling or exploring superiority of indigenous Indian cow milk over exotic and crossbred counterparts. J. Food. Sci. Technol. 2018, 55, 4232–4243. [Google Scholar] [CrossRef]
- Acosta-Balcazar, I.C.; Quiroz-Valiente, J.; Granados-Zurita, L.; Aranda-Ibáñez, E.M.; Henández-Nataren, E.; Rincón-Ramírez, J.A.; Granados-Rivera, L.D. Effect of genotype, lactation and climatic factors on fatty acid profile of bovine milk. Czech. J. Anim. Sci. 2022, 67, 167–175. [Google Scholar] [CrossRef]
- Samková, E.; Spicka, J.; Pesek, M.; Pelikánová, T.; Hanus, O. Animal factors affecting fatty acid composition of cow milk fat: A review. S. Afr. J. Anim. Sci. 2012, 42, 83–100. [Google Scholar]
- Pegolo, S.; Cecchinato, A.; Casellas, J.; Conte, G.; Mele, M.; Schiavon, S.; Bittante, G. Genetic and environmental relationships of detailed milk fatty acids profile determined by gas chromatography in Brown Swiss cows. J. Dairy Sci. 2016, 99, 1315–1330. [Google Scholar] [CrossRef]
- Silva, C.S.; Gama, M.A.S.; Silva, E.A.M.; Ribeiro, E.F.; Souza, F.G.; Monteiro, C.C.F.; Mora-Luna, R.E.; Oliveira, J.C.V.; Santos, D.C.; Ferreira, M.A. Nutritional quality of milk fat from cows fed full-fat corn germ in diets containing cactus opuntia and sugarcane bagasse as forage sources. Animals 2023, 13, 568. [Google Scholar] [CrossRef]
- Rodríguez-Bermúdez, R.F.; Fouz, R.; Rico, M.; Camilo, F.; Souza, T.K.; Miranda, M.; Diéguez, F.J. Factors affecting fatty acids composition of Holstein cow’s milk. Animals 2023, 13, 574. [Google Scholar] [CrossRef]
- Corazzin, M.; Romanzin, A.; Sepulcri, A.; Pinosa, M.; Piasentier, E.; Bovolenta, S. Fatty acid profiles of cow’s milk and cheese as affected by mountain pasture type and concentrate supplementation. Animals 2019, 9, 68. [Google Scholar] [CrossRef] [PubMed]
- Samková, E.; Čítek, J.; Brzáková, M.; Hanuš, O.; Večerek, L.; Jozová, E.; Hoštičková, I.; Trávníček, J.; Hasoňová, L.; Rost, M.; et al. Associations among farm, breed, lactation stage and parity, gene polymorphisms and the fatty acid profile of milk from Holstein, Simmental and their Crosses. Animals 2021, 11, 3284. [Google Scholar] [CrossRef]
- Plata-Pérez, G.; Angeles-Hernandez, J.C.; Morales-Almaráz, E.; Razo-Rodrígues, O.E.D.; López-Gonzalez, F.; Peláez-Acero, A.; Campos-Montiel, R.G.; Vargas-Bello-Pérez, E.; Vieyra-Alberto, R. Oilseed supplementation improves milk composition and fatty acid profile o cow milk: A meta-analysis and meta-regression. Animals 2022, 12, 1642. [Google Scholar] [CrossRef]
- Arnould, V.M.R.; Soyeurt, H. Genetic variability of milk fatty acids. J. Appl. Genet. 2009, 50, 29–39. [Google Scholar] [CrossRef]
- Hossein-Zadeh, N.G. A meta-analysis of heritability estimates for milk fatty acids and their genetic relationship with milk production traits in dairy cows using a random-effects model. Livest. Sci. 2021, 244, 104388. [Google Scholar] [CrossRef]
- Fleming, A.; Schenkel, F.S.; Malchiodi, F.; Ali, R.A.; Mallard, B.; Sargolzaei, M.; Jamrozik, J.; Johnston, J.; Miglior, F. Genetic correlations of mid-infrared-predicted milk fatty acid groups with milk production traits. J. Dairy Sci. 2018, 101, 4295–4306. [Google Scholar] [CrossRef]
- Lopez-Villalobos, N.; Spelman, R.J.; Melis, J.; Davis, S.R.; Berry, S.D.; Lehnert, K.; Sneddon, N.W.; Holroyd, S.E.; MacGibbon, A.K.; Snell, R.G. Genetic correlations of milk fatty acid contents predicted from milk mid-infrared spectra in New Zealand dairy cattle. J. Dairy Sci. 2020, 103, 7238–7248. [Google Scholar] [CrossRef]
- Cecchinato, A.; Macciotta, N.P.P.; Mele, M.; Tagliapietra, F.; Schiavon, S.; Bittante, G.; Pegolo, S. Genetic and genomic analyses of latent variables related to the milk fatty acid profile, milk composition, and udder health in dairy cattle. J. Dairy Sci. 2019, 102, 5254–5265. [Google Scholar] [CrossRef]
- Palombo, V.; Milanesi, M.; Sgorlon, S.; Capomaccio, S.; Mele, M.; Nicolazzi, E.; Ajmone-Marsan, P.; Pilla, F.; Stefanon, B.; D’Andrea, M. Genome-wide association study of milk fatty acid composition in Italian Simmental and Italian Holstein cows using single nucleotide polymorphism arrays. J. Dairy Sci. 2018, 101, 11004–11019. [Google Scholar] [CrossRef]
- Bastin, C.; Gengler, N.; Soyeurt, H. Phenotypic and genetic variability of production traits and milk fatty acid contents across days in milk for Walloon Holstein first-parity cows. J. Dairy Sci. 2011, 94, 4152–4163. [Google Scholar] [CrossRef]
- Hein, L.; Sorensen, L.P.; Kargo, M.; Buitenhuis, A.J. Genetic analysis of predicted fatty acid profiles of milk from Danish Holstein and Danish Jersey cattle populations. J. Dairy Sci. 2018, 101, 2148–2157. [Google Scholar] [CrossRef]
- Ponnampalam, E.N.; Sinclair, A.J.; Hosking, B.J.; Egan, A.R. Effects of dietary lipid type on muscle fatty acid composition, carcass leanness, and meat toughness in lambs. J. Anim. Sci. 2002, 80, 628–636. [Google Scholar] [CrossRef] [PubMed]
- Carta, S.; Correddu, F.; Battacone, G.; Pulina, G.; Nudda, A. Comparison of milk odd- and branched-chain fatty acids among human, dairy species and artificial substitutes. Foods 2022, 11, 4118. [Google Scholar] [CrossRef] [PubMed]
- Ponnampalam, E.N.; Priyashantha, H.; Vidanarachchi, J.K.; Kiani, A.; Holman, B.W.B. Effects of nutritional factors on fat content, fatty acid composition, and sensorial properties of meat and milk from domesticated ruminants: An Overview. Animals 2024, 14, 840. [Google Scholar] [CrossRef] [PubMed]
- Dias, K.M.; Gama, M.A.S.; Schmitt, D.; Sbrissia, A. Milk fatty acid composition of unsupplemented dairy cows grazing on a tropical pasture. R. Bras. Zootec. 2019, 48, e20190088. [Google Scholar] [CrossRef]
- Bilal, G.; Cue, R.I.; Mustafa, A.F.; Hayes, J.F. Short communication: Estimates of heritabilities and genetic correlations among milk fatty acid unsaturation indexes in Canadian Holsteins. J. Dairy Sci. 2012, 95, 7367–7371. [Google Scholar] [CrossRef]
- Dan, N.; Zhang, H.; Ao, C.; Erdene, K. Transcriptional regulation of milk lipid synthesis by exogenous C16:0 and C18 fatty acids in bovine mammary epithelial cells. Can. J. Anim. Sci. 2018, 98, 260–270. [Google Scholar] [CrossRef]
- Mu, T.; Hu, H.; Ma, Y.; Zhang, J.; Gu, Y. Regulation of key genes for milk fat synthesis in ruminants. Front. Nutr. 2021, 8, 765147. [Google Scholar] [CrossRef] [PubMed]
- Knutsen, T.M.; Olsen, H.G.; Tafintseva, V.; Svendsen, M.; Kohler, A.; Kent, M.P.; Lien, S. Unravelling genetic variation underlying de novo-synthesis of bovine milk fatty acids. Sci. Rep. 2018, 8, 2179. [Google Scholar] [CrossRef]
- Prado, L.A.; Schmidely, P.; Nozière, P.; Ferlay, A. Milk saturated fatty acids, odd- and branched-chain fatty acids, and isomers of C18:1, C18:2, and C18:3n-3 according to their duodenal flows in dairy cows: A meta-analysis approach. J. Dairy Sci. 2019, 102, 3053–3070. [Google Scholar] [CrossRef]
Disclaimer/Publisher’s Note: The statements, opinions and data contained in all publications are solely those of the individual author(s) and contributor(s) and not of MDPI and/or the editor(s). MDPI and/or the editor(s) disclaim responsibility for any injury to people or property resulting from any ideas, methods, instructions or products referred to in the content. |
© 2025 by the authors. Licensee MDPI, Basel, Switzerland. This article is an open access article distributed under the terms and conditions of the Creative Commons Attribution (CC BY) license (https://creativecommons.org/licenses/by/4.0/).