


Simple Summary
The metabolites and fatty acids in colostrum reflect metabolic changes in the dams of ruminant animals, which can be mediated by many factors, including feed composition, environmental temperature, and disease status. This study aimed to demonstrate the effect of temperature changes on colostrum composition in Black Bengal goats raised in a subtropical region. The colostrum samples were collected under hot and cold environmental conditions, and the metabolomic and fatty acid profiles were analyzed across two parities of dams. All dams were fed identical diets throughout the year. The results showed seasonal changes in colostrum metabolites and fatty acids, which suggests a shift from carbohydrate to lipid utilization during cold exposure. Understanding the metabolic shift as shown by colostrum composition changes during environmental temperature adaptation will be helpful for future farm management and health monitoring.
Abstract
Environmental temperature-induced metabolic changes in dams can be reflected by alterations in metabolomic and fatty acid profiles in colostrum. The colostrum from 13 Black Bengal (BB) dams was collected on the day of parturition at two consecutive parities during the hot conditions (HCs) of summer or rainy seasons and the cold conditions (CCs) of winter. The metabolomic and fatty acid profiles were analyzed using nuclear magnetic resonance (NMR) and gas chromatography–mass spectrometry, respectively. The results showed significantly higher sarcosine, tyrosine, citrate, succinate, galactose, acetylglucosamine, carnitine, choline, glycerophosphocholine, and trimethylamine N-oxide during CCs than HCs; potential discriminant metabolites according to VIP scores were sarcosine, succinate, and choline. Colostrum from CCs had significantly lower levels of saturated fatty acids (SFAs), including butyric acid (C4:0), myristic acid (C14:0), and pentadecanoic acid (C15:0), but higher omega-9 monounsaturated fatty acids (MUFAs), especially oleic acid (C18:1n9c), elaidic acid (C18:1n9t), and eicosenoic acid (C20:1n9), than in HC. Linoleic acid (C18:2n6c) and the omega 6/omega 3 PUFA ratio were higher during CCs than HCs. It is concluded that a metabolic shift for nutrient utilization occurs, from glucose during HCs toward fat during CCs, which may not be due to the diet but rather neurohumoral alterations occurring during temperature adaptation.
1. Introduction
The metabolomic and lipidomic profiles in the blood can reflect metabolic status and nutrient utilization, which are altered by many factors such as disease status, farm management, environmental temperature, and diet composition. They were recently investigated in mammary secretions because such observation is non-invasive and can be performed anytime during daily milk collection. Metabolites in milk were previously reported to determine the quality and purity of the dairy product [1,2], and health status factors such as subclinical ketosis [3], subclinical mastitis [4], and lameness [5], including under heat stress [6,7].
Hot temperature exposure can be defined as acute or chronic. Acute heat exposure can cause heat stress with abrupt changes in temperature/humidity beyond the body’s ability to adapt, leading to metabolic and neurohumoral alterations that affect health and productivity. However, during chronic heat exposure, especially across the season, the body adapts to fulfill its metabolic needs.
A high environmental temperature can alter fat, carbohydrate, and protein metabolism as well as neuroendocrine function [8], leading to alterations in both blood and milk metabolites and fatty acid profiles, as demonstrated in dairy cows under heat stress [9,10]. Moreover, metabolomic and fatty acid profiles differ across species and vary through the season [11], potentially due to factors including environmental temperature, feeding management, and diet composition. The lowest values of protein, fat, total solids, and solid-not-fat in milk were observed during the summer, with the greatest in the winter [12]. The total saturated fatty acid (SFA) content was higher, while the total monounsaturated fatty acid (MUFA), polyunsaturated fatty acid (PUFA), and conjugated linoleic acid (CLA) contents were lower in summer compared to winter in dairy cows [13,14].
Variations in colostrum composition reflect the metabolic status and nutrient utilization of the dam during the pre-partum period and are related to the growth performance of kids [15,16]. Most of the metabolites in the colostrum, except lactose, were affected by litter size and parity number, and they were higher than in the milk [17]. Seasonal changes in colostrum metabolomic profiles were reported in dairy cows; autumn-derived colostrum exhibited two-fold increases in 22 metabolites, including phospholipid, organic acid, bioactive peptides, and nucleotides [18]. The colostrum quality of Holstein cows from cooler months was also superior in terms of IgG concentrations [19], while fatty acids and cholesterol were reported to be high during summer in buffalo [20]. This was suggested to be related to distinct diets or environmental stress across seasons, while genetic factors and parity number had minimal effects.
Black Bengal (BB), a meat-type goat with a small to medium size, has gained increasing attention in Thailand due to its economic and genetic potential. BB goats were raised at the Chaipattana Foundation’s Black Bengal Goat Domestication Project Farm, Chiang Rai province, in the northeastern part of Thailand. The goal was to improve the genetics and conserve purebred BB goats. In this farm, the dietary type and amounts of both concentrate and roughage were consistent year-round, while the ambient temperature in the winter is cooler than that in the summer and rainy seasons. However, limited information is available regarding seasonal variation in colostrum metabolomic and lipidomic profiles in Black Bengal goats, particularly under subtropical conditions. Therefore, the objective of this study was to investigate the metabolomic and fatty acid profiles in the colostrum of BB goats in two different time periods: in the hot conditions (HCs) of the summer and rainy seasons, and cold conditions (CCs) of winter.
2. Materials and Methods
The present study was conducted according to the Animal Care and Use Protocol approved by the Animal Care and Use Committee, Faculty of Veterinary Science, Chulalongkorn University, Protocol number: 2231025 (12 July 2022–11 July 2023).
2.1. Experimental Animals
The goats were raised at the Chaipattana Foundation’s Bengal Goat Domestication Project’s Farm, located in Chiang Rai province, northern Thailand, at 20°18′42.4″ N 99°49′06.5″ E. Approximately 2–3 female goats were housed per pen (3 × 4 m). The goats were fed approximately 2% of body weight per day of the concentrate (91.2% DM), which contained 17.2% crude protein, 2.9% fat, 12.6% crude fiber, 14.3% ash, 34.1% NDF, and 16.4% ADF (DM basis). The roughage included Napier grass (16.2% DM, 15.0% crude protein, 1.9% fat, 30.8% crude fiber, 11.3% ash, 61.2% NDF and 39.3% ADF) and Pangola hay (92.8% DM, 3.5% crude protein, 1.2% fat, 30.6% crude fiber, 5.4 ash, 66.2% NDF and 37.6% ADF); nutrient compositions expressed on a DM basis are provided for 3 kg/goat/day with a ratio of 2:1. All goats were fed twice a day at 7:00 and 18:00 h. The water was provided ad libitum. Goats were allowed to walk on the field for approximately 4 h from 12:00 to 16:00 daily, except in the rainy season, when they were kept in the pen. The field surface was covered with soil with scanty grass and local weeds, cut close to the ground, such that the goats were rarely able to graze, but rather could walk in the field. The health of the goats was frequently monitored, and they were vaccinated for foot and mouth disease twice a year in May and November. Complete blood counts were performed for health monitoring, and the plasma titers of caprine arthritis encephalitis and brucellosis were routinely checked to ensure negative results once a year in May. The ectoparasite and endoparasite were eradicated periodically using spraying and medication, respectively. All goats were bred naturally, and the late pregnant dams were moved to stay in individual pens before parturition. After delivery, the kids remained with their dams and had unrestricted access to colostrum and milk.
The summer, rainy, and winter seasons were classified based on national announcements from the Thai Meteorological Department and the Ministry of Digital Economy and Society. The study was divided according to season during colostrum collection into two periods: hot conditions (HC) during the summer and rainy season from 2 March to 28 October 2022, and cold conditions (CCs) during the winter season from 29 October 2022 to 4 March 2023. The daily averages of the full-day hourly maximal/minimal temperature, gap, dry bulb temperature (Tdb), and relative humidity (RH) during the HC and CC periods and on the day of colostrum collection were obtained from the official provincial meteorological stations (Agromet Chiang Rai) (19°52′15.6″ N 99°46′58.8″ E), which is approximately 50 km from the herd. The temperature humidity index (THI) was calculated as THI = ((1.8 × Tdb °C) + 32) − [(0.55 − (0.005 × RH)) × ((1.8 × Tdb °C) − 26.8)] [21].
2.2. Colostrum Collection
Approximately 50 mL of colostrum was collected from thirteen Black Bengal dams within 0–12 h after parturition during two periods. Some metabolomic profiles taken during HCs were shared from a previous study [17]. The first colostrum sample was collected on parturition day during HC, and it was recollected from the same dams for the next parity during CCs. All dams in the present study had the same litter size in both parties to control for metabolite variability. All samples were kept in polypropylene plastic tubes and stored at −20 °C. They were later transported on dry ice to the laboratory for analysis within 2 months after colostrum collection.
2.3. Macronutrient Analysis
The colostrum was thawed and filtered using gauze. Each colostrum sample was incubated at 40 °C for 20 min, and the chemical composition (fat, protein, lactose, solid not fat (SNF) and total solids (TS)) was analyzed using the MilkoScan FT2 analyzer (Foss MilkoScan, Hillerøed, Denmark), which was calibrated using bovine-specific standards and validated against reference methods (Kjeldahl for protein, Gerber for fat).
2.4. Non-Volatile Polar Metabolite Profile Analysis by 1H-NMR
The stored frozen colostrum was thawed once at room temperature (25 °C for 20 min) and maintained on ice during analysis. Its non-volatile polar metabolite composition was characterized using a non-targeted proton nuclear magnetic resonance (1H-NMR)-based metabolomics approach applied in our previous work [17]. Lipid separation was performed by centrifugation (Centrifuge Z36HK, Hermle Labortechnik, Wehingen, Germany) at 3000× g for 15 min at 4 °C. Residual lipids were subsequently removed by mixing the samples with dichloromethane (RCI Labscan Ltd., Bangkok, Thailand) at a ratio of 2:1 (v/v), followed by centrifugation at 4100× g for 15 min at 4 °C. The supernatant was collected and subjected to ultracentrifugation (Optima™ L100-XP, Beckman Coulter, Inc., Brea, CA, USA) at 74,200× g for 60 min at 4 °C to remove protein fractions. The clarified aqueous fraction of colostrum was then ultrafiltered using a Pall Na-nosep® centrifugal device with a 3 kDa molecular weight cutoff (Pall Life Sciences, Ann Arbor, MI, USA) in a microcentrifuge (Universal 320R, Andreas Hettich, Tuttlingen, Germany) at 13,800× g for 20 min at 25 °C. The filtrate was subsequently mixed (1:1, v/v) with phosphate buffer (pH 6.0) containing 300 mM KH2PO4 (Merck, Darmstadt, Germany), 10% (w/w) D2O (Cambridge Isotope Laboratories, Tewksbury, MA, USA), and 1 mM 3-(trimethylsilyl)propionic-2,2,3,3-d4 acid sodium salt (TSP; Merck, Darmstadt, Germany) as an internal standard. Finally, 600 μL of the mixture was transferred to a 5 mm NMR tube and analyzed using a Bruker Avance III HD 500 MHz NMR spectrometer (Bruker, Rheinstetten, Germany). The temperature was set to 300 K (26.8 °C). The acquisition was operated at a time domain (TD) of 65536, an acquisition time (AQ) requirement of 3.198 s, a number of scans (NS) of 256, and a relaxation time (D1) set to 4 s. The Bruker pulse sequence (noesygppr1d) was applied to suppress the residual water signal. The 1H-NMR spectra were phase- and baseline-corrected, pre-processed, and segmented (binned) with a 0.02 ppm interval. Metabolites were identified by comparison with the Chenomx NMR Suite 8.6 library (Chenomx Inc., Edmonton, Alberta, Canada), Milk Composition Database (www.mcdb.ca, accessed on 17 November 2025), Livestock Metabolome database (www.lmdb.ca, accessed on 17 November 2025), and the literature. Only metabolites showing a ≥90% matching score in the Chenomx profiling were accounted for in the study. The integrated signal intensity, normalized to TSP, of each metabolite is expressed in arbitrary units.
2.5. Fatty Acid Profile Analysis by GC/MS
The colostrum’s fatty acid composition was characterized using gas chromatography–mass spectrometry of fatty acid methyl esters (GC-MS-FAME), following the method applied in our previous work [22]. One gram of sample was transferred into a screw-cap Pyrex culture tube, followed by the addition of 1 mL of an internal standard solution (0.5 mg C13:0/mL in methanol), 0.7 mL of 10 N KOH (Sigma-Aldrich, Steinheim, Germany), and 5.3 mL of methanol (Merck, Darmstadt, Germany). The mixture was incubated in a water bath at 55 °C for 1.5 h, with vigorous shaking at 20 min intervals to facilitate hydrolysis. After cooling to room temperature (ca. 30 °C), 0.6 mL of 24 N H2SO4 (Sigma-Aldrich, Steinheim, Germany) was added, and the samples were further incubated under the same conditions for an additional 1.5 h with periodic shaking. Following fatty acid methyl ester (FAME) formation, the samples were cooled to room temperature, mixed with 3 mL of hexane (Sigma-Aldrich, Steinheim, Germany), and vortexed for 5 min. The hexane phase was separated by centrifugation at 3000× g for 5 min, collected, and transferred into GC vials. The vials were sealed and stored at −20 °C until analysis. The FAME fraction was analyzed using capillary gas chromatography equipped with an SP-2560 column (100 m × 0.25 mm × 0.20 µm; Supelco, Bellefonte, PA, USA). The oven temperature was initially held at 140 °C for 5 min, then increased at a rate of 4 °C/min to 260 °C and maintained for 20 min. Helium was used as the carrier gas at a constant flow rate of 0.5 mL/min, with a column head pressure of 280 kPa. Both injector and detector temperatures were set at 260 °C, and the split ratio was 100:1. Individual fatty acids were identified by comparing the retention times and mass spectra with those of a reference FAME standard mixture (Supelco 37-Component FAME Mix, Sigma-Aldrich, Steinheim, Germany). Quantification was achieved through automated peak integration and calibration curves generated by linear regression, with the results expressed as mg/100 g (wet basis) of the sample.
2.6. Statistical Analysis
The statistical analysis was performed using SigmaPlot version 15.0 (Grafiti LLC, Palo Alto, CA, USA). Data are presented as mean ± standard error of mean (SEM). The normality of the data was tested using the Shapiro–Wilk test. The data for the daily average environmental temperature and humidity for the whole summer (n = 8) and rainy seasons (n = 5) were compared with those for the winter season (n = 13) using unpaired t-tests for normally distributed data, while the Mann–Whitney Rank Sum test was used for non-normally distributed data. The environmental conditions on the day of sample collection in individual goats, the chemical compositions, and the metabolomic and fatty acid profiles in the HC season and CCs were compared using Student’s paired t-test or the Wilcoxon signed-rank test, depending on the data distribution. Fatty acids that were >50% below the limit of detection were removed from consideration. 1H-NMR-derived non-volatile polar metabolite and GC-derived fatty acid data were normalized by median-centering, log2-transformed, and auto-scaled before being subjected to multivariate analysis in MetaboAnalyst 6.0 (www.metaboanalyst.ca). Partial least squares-discriminant analysis (PLS-DA) was performed to identify the overall distinction between the colostrum profiles from the HC and CC seasons. The model’s performance was evaluated based on the leave-one-out cross-validation (LOOCV) method and expressed as % accuracy, R2 (explained variance), and Q2 (predictive ability). Finally, metabolite and fatty acid components with variable importance in projection (VIP) scores higher than 1.0 and significant p-values were considered to be responsible for the discrimination [2]. Pearson’s correlation analysis was conducted among HCs, CCs, and transformed biochemical variables. The results were expressed as correlation coefficients and visualized using correlation pattern plots. The most significantly altered metabolic pathways associated with the discriminant metabolites and fatty acids were identified using MetaboAnalyst 6.0 pathway impact analysis against the KEGG metabolic pathway database for the Capra hircus species. p-values less than 0.05 were considered statistically significant, while 0.10 > p > 0.05 was considered a trend.
3. Results
3.1. Dam’s Characteristics
Thirteen colostrum samples were collected from the same dams that delivered kids with the same litter size twice, during HCs and CCs. Eight dams were delivered during the summer (2 March 2022 to 13 May 2022), while five dams were delivered during the rainy season (14 May 2022 to 28 October 2022). All dams had a second delivery during the winter season (29 October 2022 to 4 March 2023). The average age of the dams was 29.7 ± 3.1 months and 37.0 ± 3.1 months during HCs and CCs, respectively. There were no differences in weight measured during parturition (23.8 ± 1.5 and 22.9 ± 1.1 kg) and on day 7 after parturition (21.1 ± 1.4 and 21.8 ± 1.1 kg) during HCs and CCs, respectively. The average parity number of the dams under HCs was 2.69 ± 0.43, with four dams being primiparous, while four and five dams had parity of 2–3 and >3, respectively. The litter size of the dams was 1.85 ± 0.19. The dams delivered two, seven, and four triplets, duplets, and singlets, respectively.
3.2. Temperature and Humidity During HCs and CCs
The average Tdb, RH and THI for the summer plus rainy seasons (2 March–28 October 2022) were 26.6 ± 0.1 °C, 80.9 ± 0.4% and 76.7 ± 0.1, respectively, which were significantly higher than those in the winter (29 October 2022–4 March 2023) (22.1 ± 0.2 °C, p < 0.001; 76.3 ± 0.4%, p < 0.001 and 69.7 ± 0.3, p < 0.001, respectively).
The temperatures recorded on the day of colostrum collection in HCs were significantly higher than those in CCs, including the highest (p < 0.001), lowest (p < 0.001), gap (p < 0.01), and dry bulb (p < 0.001) temperatures (Table 1). The THI was also higher during the hot season than the cold season (p < 0.001), while the percent humidity was not different.
Table 1.
Ambient temperature and humidity during hot conditions (HC) and cold conditions (CC).
3.3. Macronutrient Compositions of Colostrum
There were no differences in the macronutrients (fat, protein, lactose), TS, or SNF in the colostrum obtained for hot and cold conditions (Table 2).
Table 2.
Macronutrient compositions in colostrum of Black Bengal goats obtained during hot conditions (HC) and cold conditions (CC).
3.4. Non-Volatile Polar Metabolite Profiles of Colostrum
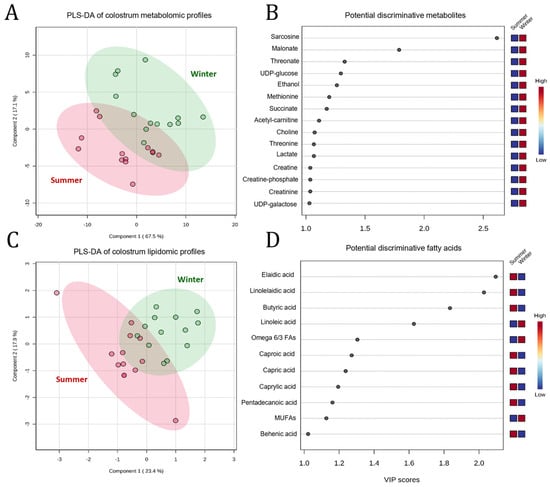
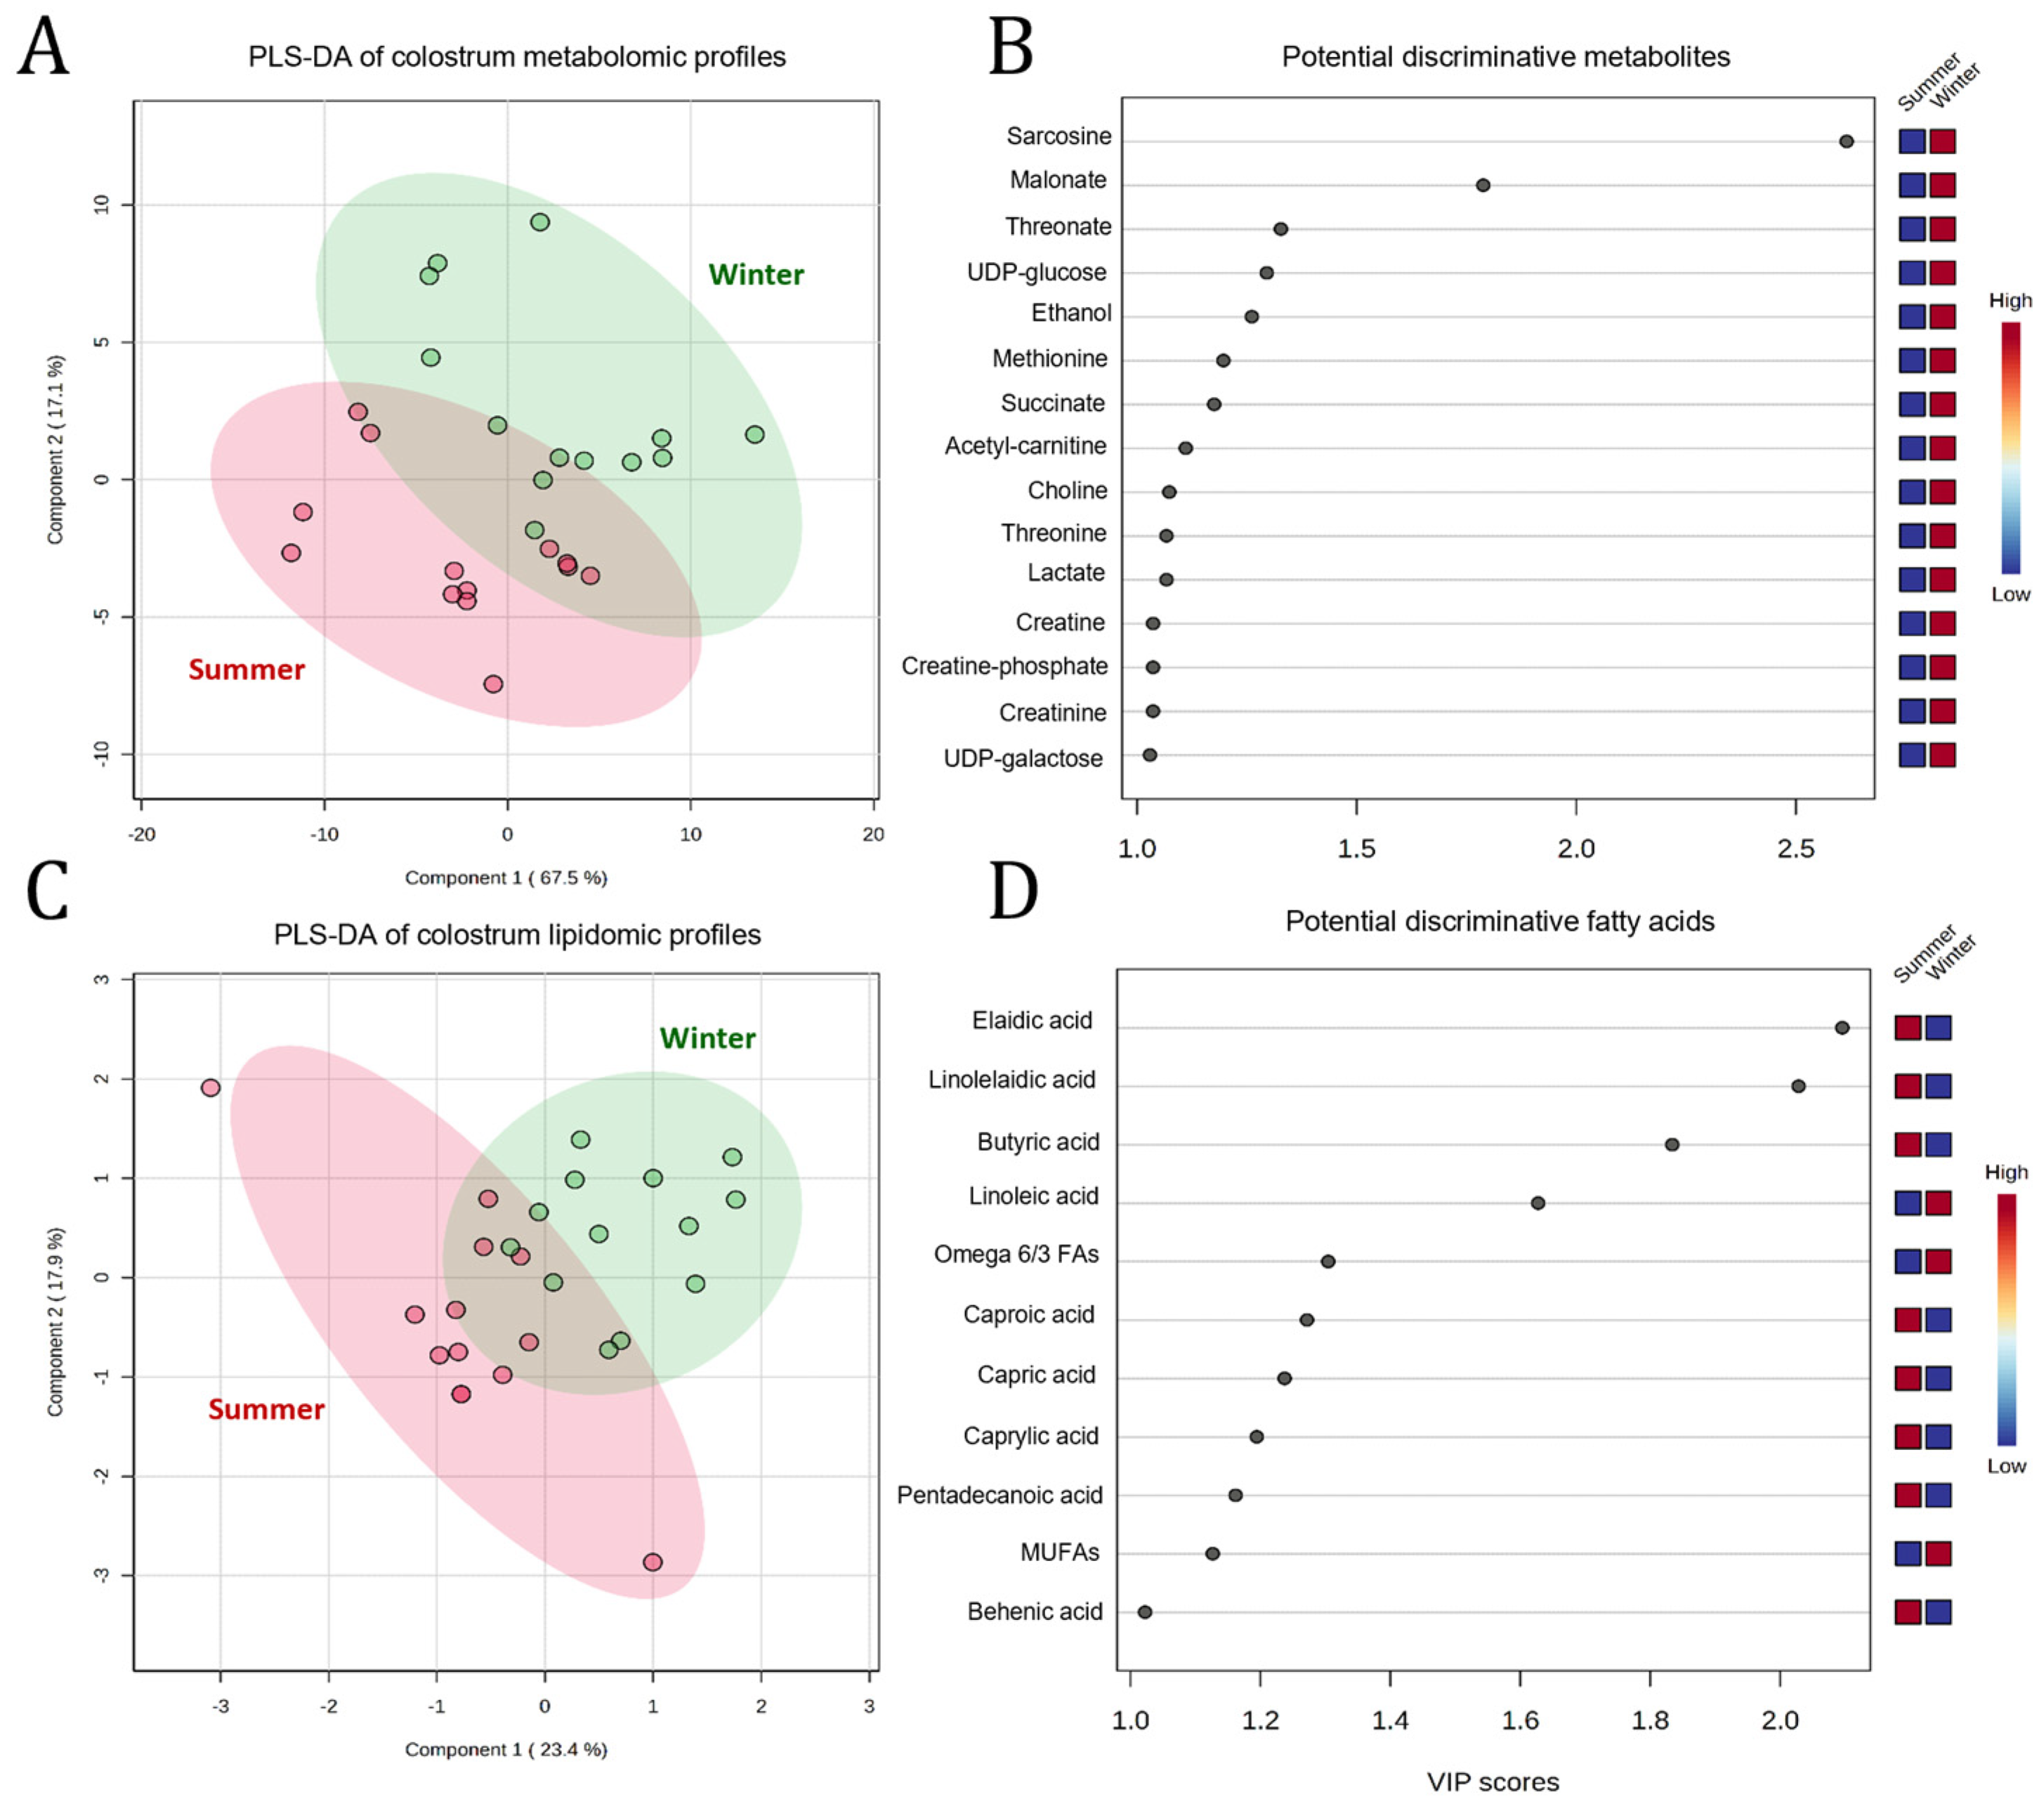
A total of 51 non-volatile polar metabolites were obtained using 1H-NMR spectroscopy, including amino acids (e.g., tyrosine, sarcosine), carbohydrates (e.g., glucose, galactose), alcohols (e.g., glycerol), organic acids (e.g., citrate, lactate), vitamins, and lipid derivatives (e.g., carnitine, choline) in the goat colostrum samples in this study. To compare the overall metabolite profile patterns among samples, a PLS-DA score plot was constructed with a prediction accuracy of 96.15%, R2 = 0.835, and Q2 = 0.684 (Figure 1A). It was apparent that the samples collected under HCs and CCs were clearly separated along component 1. Based on the VIP scores, several metabolites potentially responsible for this discrimination could be suggested (Figure 1B). The results indicated that most of the discriminative metabolites were present at higher relative abundances in the colostrum samples collected during CCs. The statistically significant levels of discriminative metabolites are summarized in Table 3. The results demonstrated significant differences in the concentrations of sarcosine, tyrosine, citrate, succinate, galactose, N-acetylglucosamine, carnitine, choline, glycerophosphocholine, and trimethylamine N-oxide (p < 0.05), while those of glucose, lactose, mannitol, UDP-N-acetylglucosamine, phosphocholine, and uridine showed a tendency (0.05 < p < 0.10) toward variation between HC and CC samples. Considering both statistical significance and VIP scores, sarcosine, succinate, and choline were identified as the key discriminant metabolites contributing to the separation between HC and CC samples.
Figure 1.
PLS-DA score plot (panel (A,C)) and VIP scores (panel (B,D)) reveal the discrimination patterns of metabolite (panel (A,B)) and fatty acid (panel (C,D)) profiles in colostrum samples collected from Black Bengal goats in hot (●) and cold (●) climate conditions. Squares in the VIP score panel express normalized metabolite and fatty acid contents with respect to the color range. Red indicates a higher content of the corresponding compound. For more explanation of the colors in this figure, the reader is referred to the web version of this article and the relative quantification of metabolites and fatty acids in Table 3 and Table 4.
Table 3.
Candidate metabolite changes between hot conditions (HC) and cold conditions (CC).
3.5. Fatty Acid Profiles of Colostrum
A total of 25 fatty acids, including saturated fatty acids (SFAs) (e.g., C4:0 and C22:0), monounsaturated fatty acids (MUFAs) (e.g., C18:1n9c, C20:1n9), omega-3 polyunsaturated fatty acids (PUFAs) (e.g., C18:3n3), and omega-6 polyunsaturated fatty acids (e.g., C18:2n6c) were identified in the goat colostrum samples. To visualize the overall pattern of distinction among the fatty acid profiles, a PLS-DA score plot was constructed with a prediction accuracy of 84.61%, R2 = 0.705, and Q2 = 0.668 (Figure 1C). Consistent with the metabolite profiling results, samples collected under HCs and CCs can be clearly distinguished along component 1. Based on the VIP scores, a list of fatty acids potentially responsible for the discrimination could be suggested (Figure 1D). The results revealed that most of the discriminative fatty acids exhibited higher relative abundances in the colostrum samples collected under HCs, whereas linoleic acid (C18:2n6c), the sum of ω-6/ω-three fatty acids, and the total MUFA content were higher in the samples obtained under CCs. Taken together with the statistically significant levels presented in Table 4, variations in the concentrations of elaidic acid (C18:1n9t), butyric acid (C4:0), linoleic acid (C18:2n6c), pentadecanoic acid (C15:0), the sum of ω-6/ω-3 fatty acids, and the total MUFA were identified as the key discriminants (p < 0.05) contributing to the separation between HC and CC samples.
Table 4.
Fatty acid profiles of colostrum in dams collected during hot conditions (HC) and cold conditions (CC).
3.6. Correlation of Metabolite and Fatty Acid Contents with Different Climate Conditions
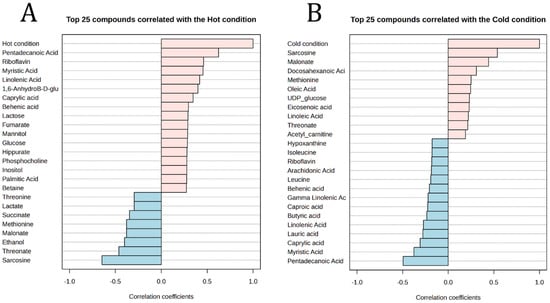
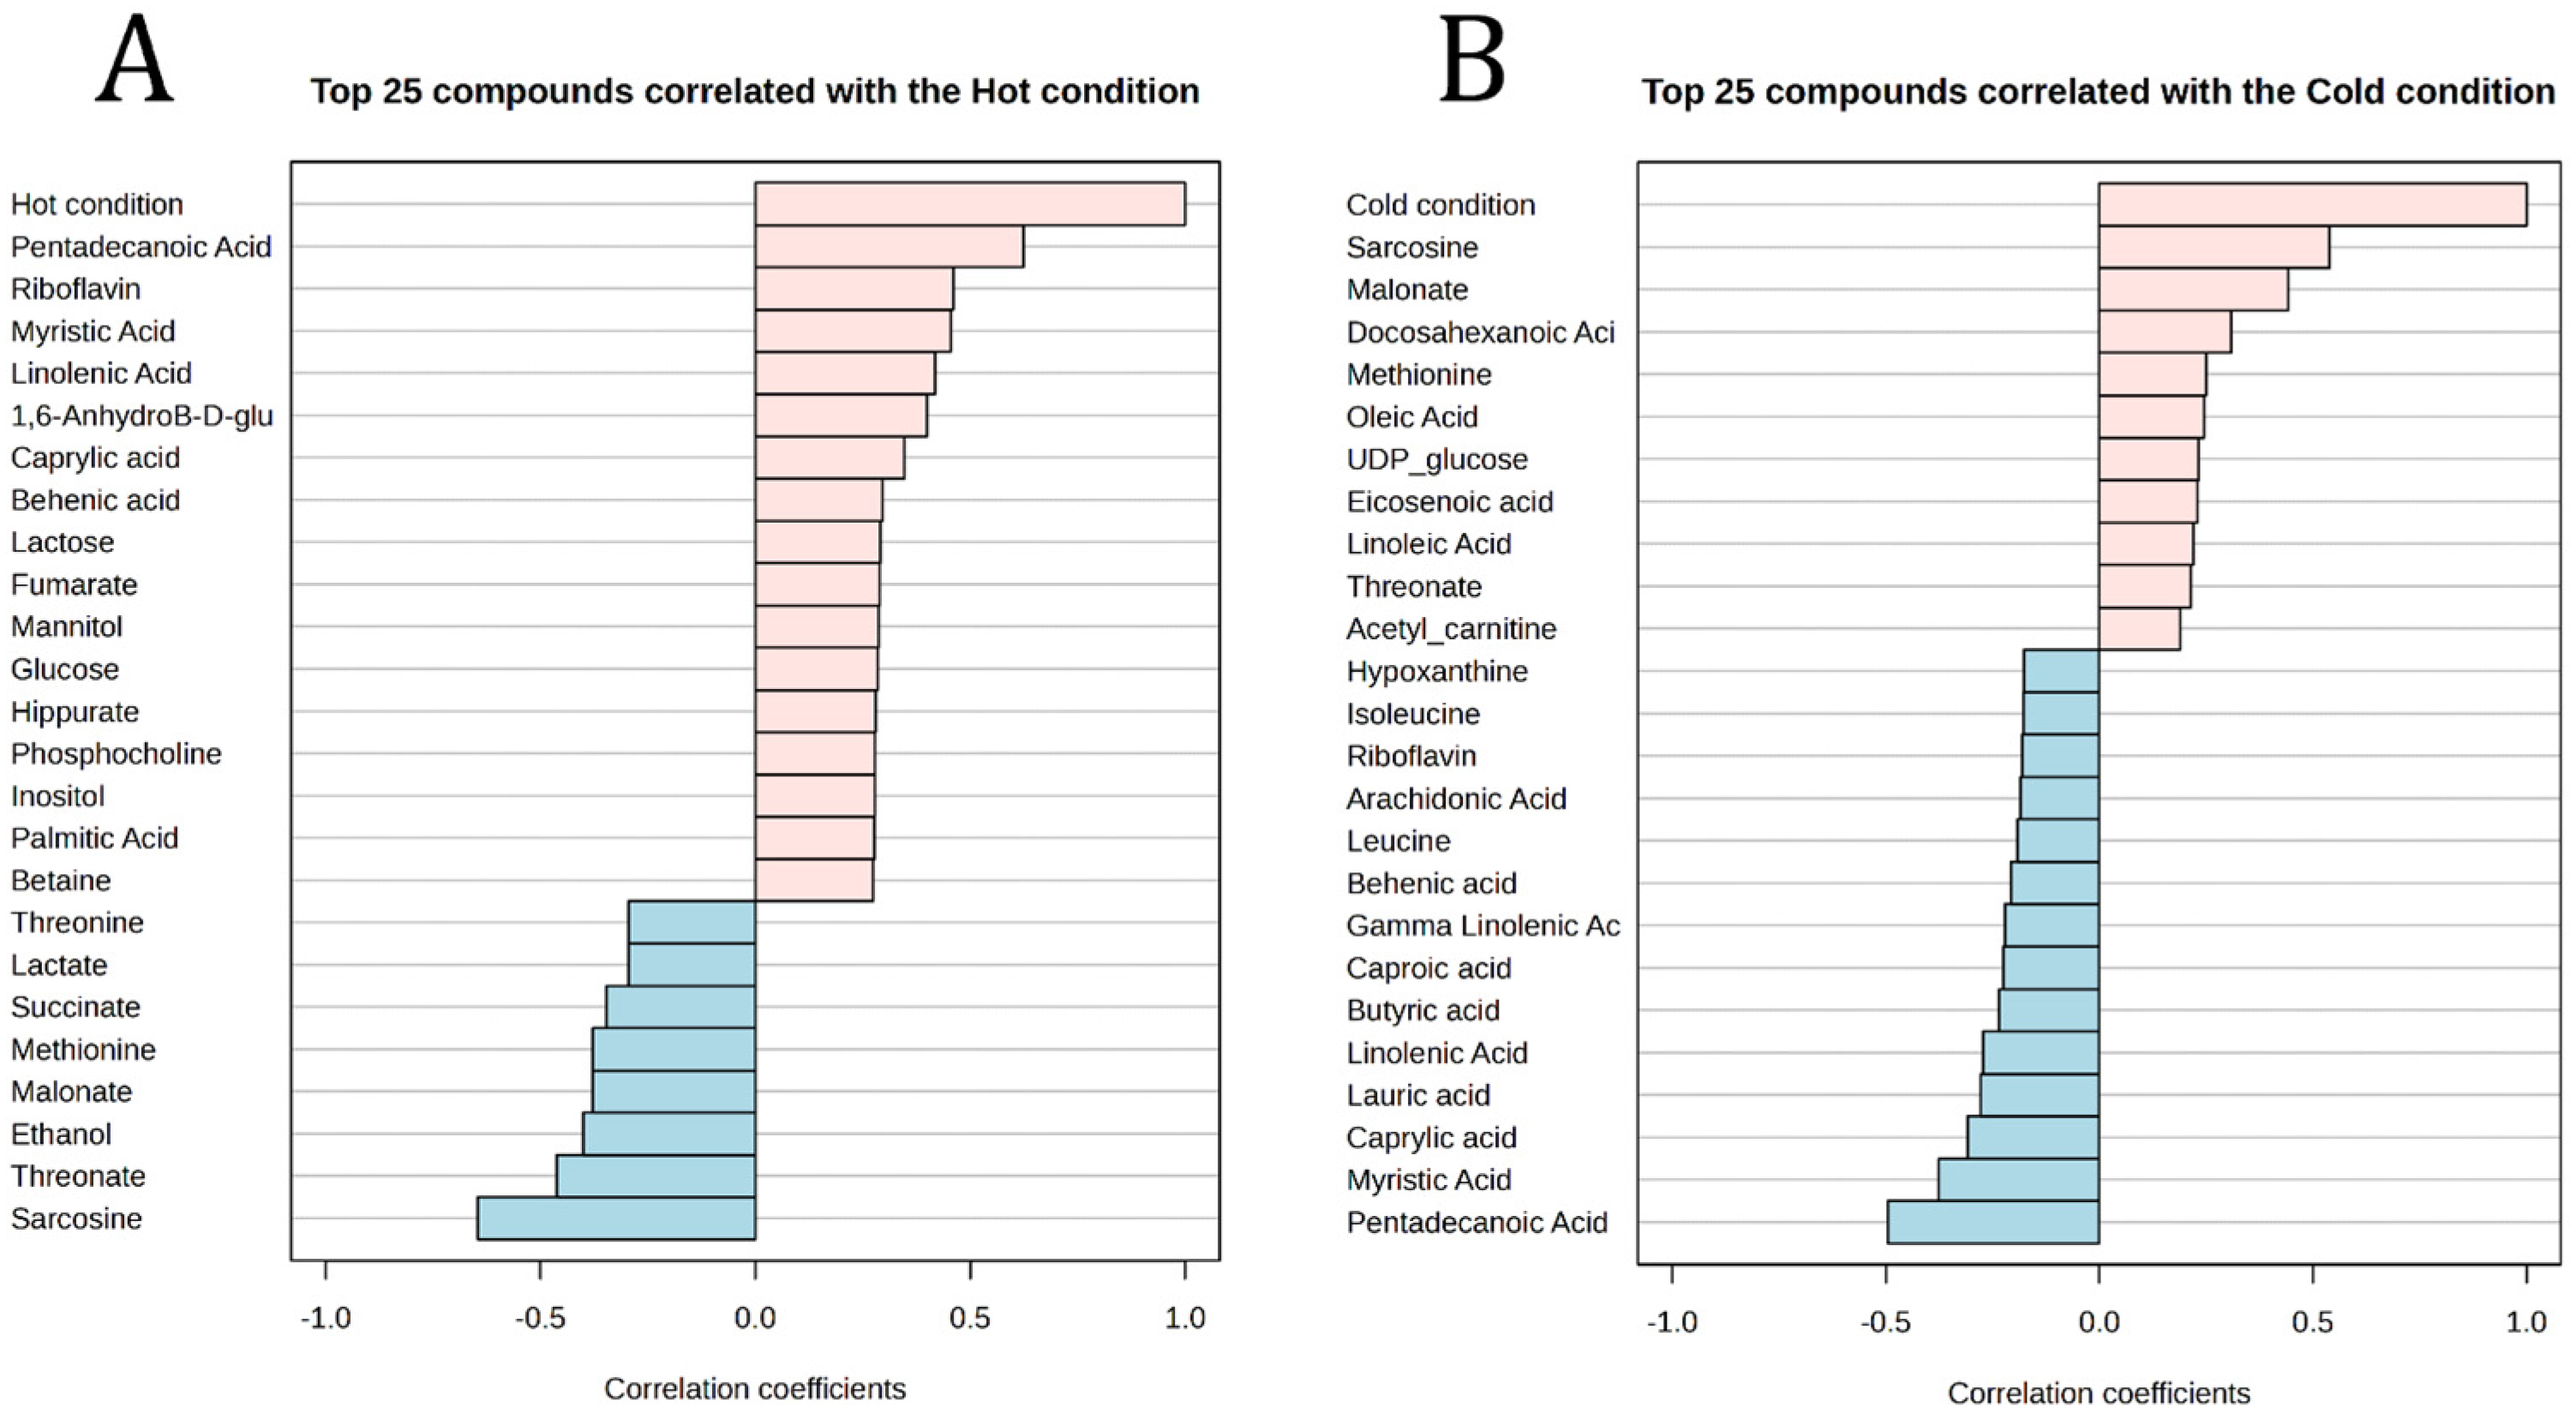
Based on Pearson’s correlation analysis, the metabolites and fatty acids showing the strongest correlation coefficients (r) with HCs and CCs are summarized in Figure 2. The results in the bar graphs demonstrate that HCs were positively correlated with increases in pentadecanoic acid (C15:0), riboflavin, myristic acid (C14:0), linolenic acid (C18:3n3), 1,6-anhydro-β-D-glucose, and caprylic acid (C8:0), but negatively correlated with the sarcosine, threonate, ethanol, malonate, and methionine contents in colostrum samples (Figure 2A). On the other hand, CCs exhibited positive correlations with sarcosine, malonate, methionine, and oleic acid (C18:1n9c), while showing negative correlations with pentadecanoic acid (C15:0), myristic acid (C14:0), caprylic acid (C8:0), lauric acid (C12:0), and linolenic acid (C18:3n3) in colostrum samples (Figure 2B).
Figure 2.
Pearson’s correlation coefficient plots of the top 25 metabolite and fatty acid components, represented as horizontal bars, with colors in light pink indicating positive correlations and light blue indicating negative correlations, to hot (panel A) and cold (panel B) climate conditions.
3.7. Disturbed Metabolic Pathway Analysis
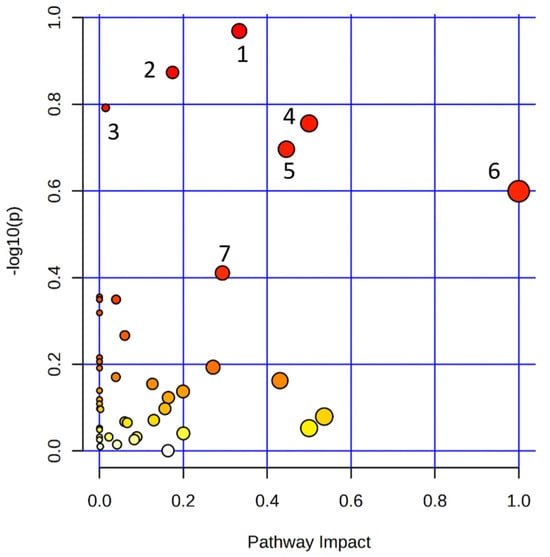
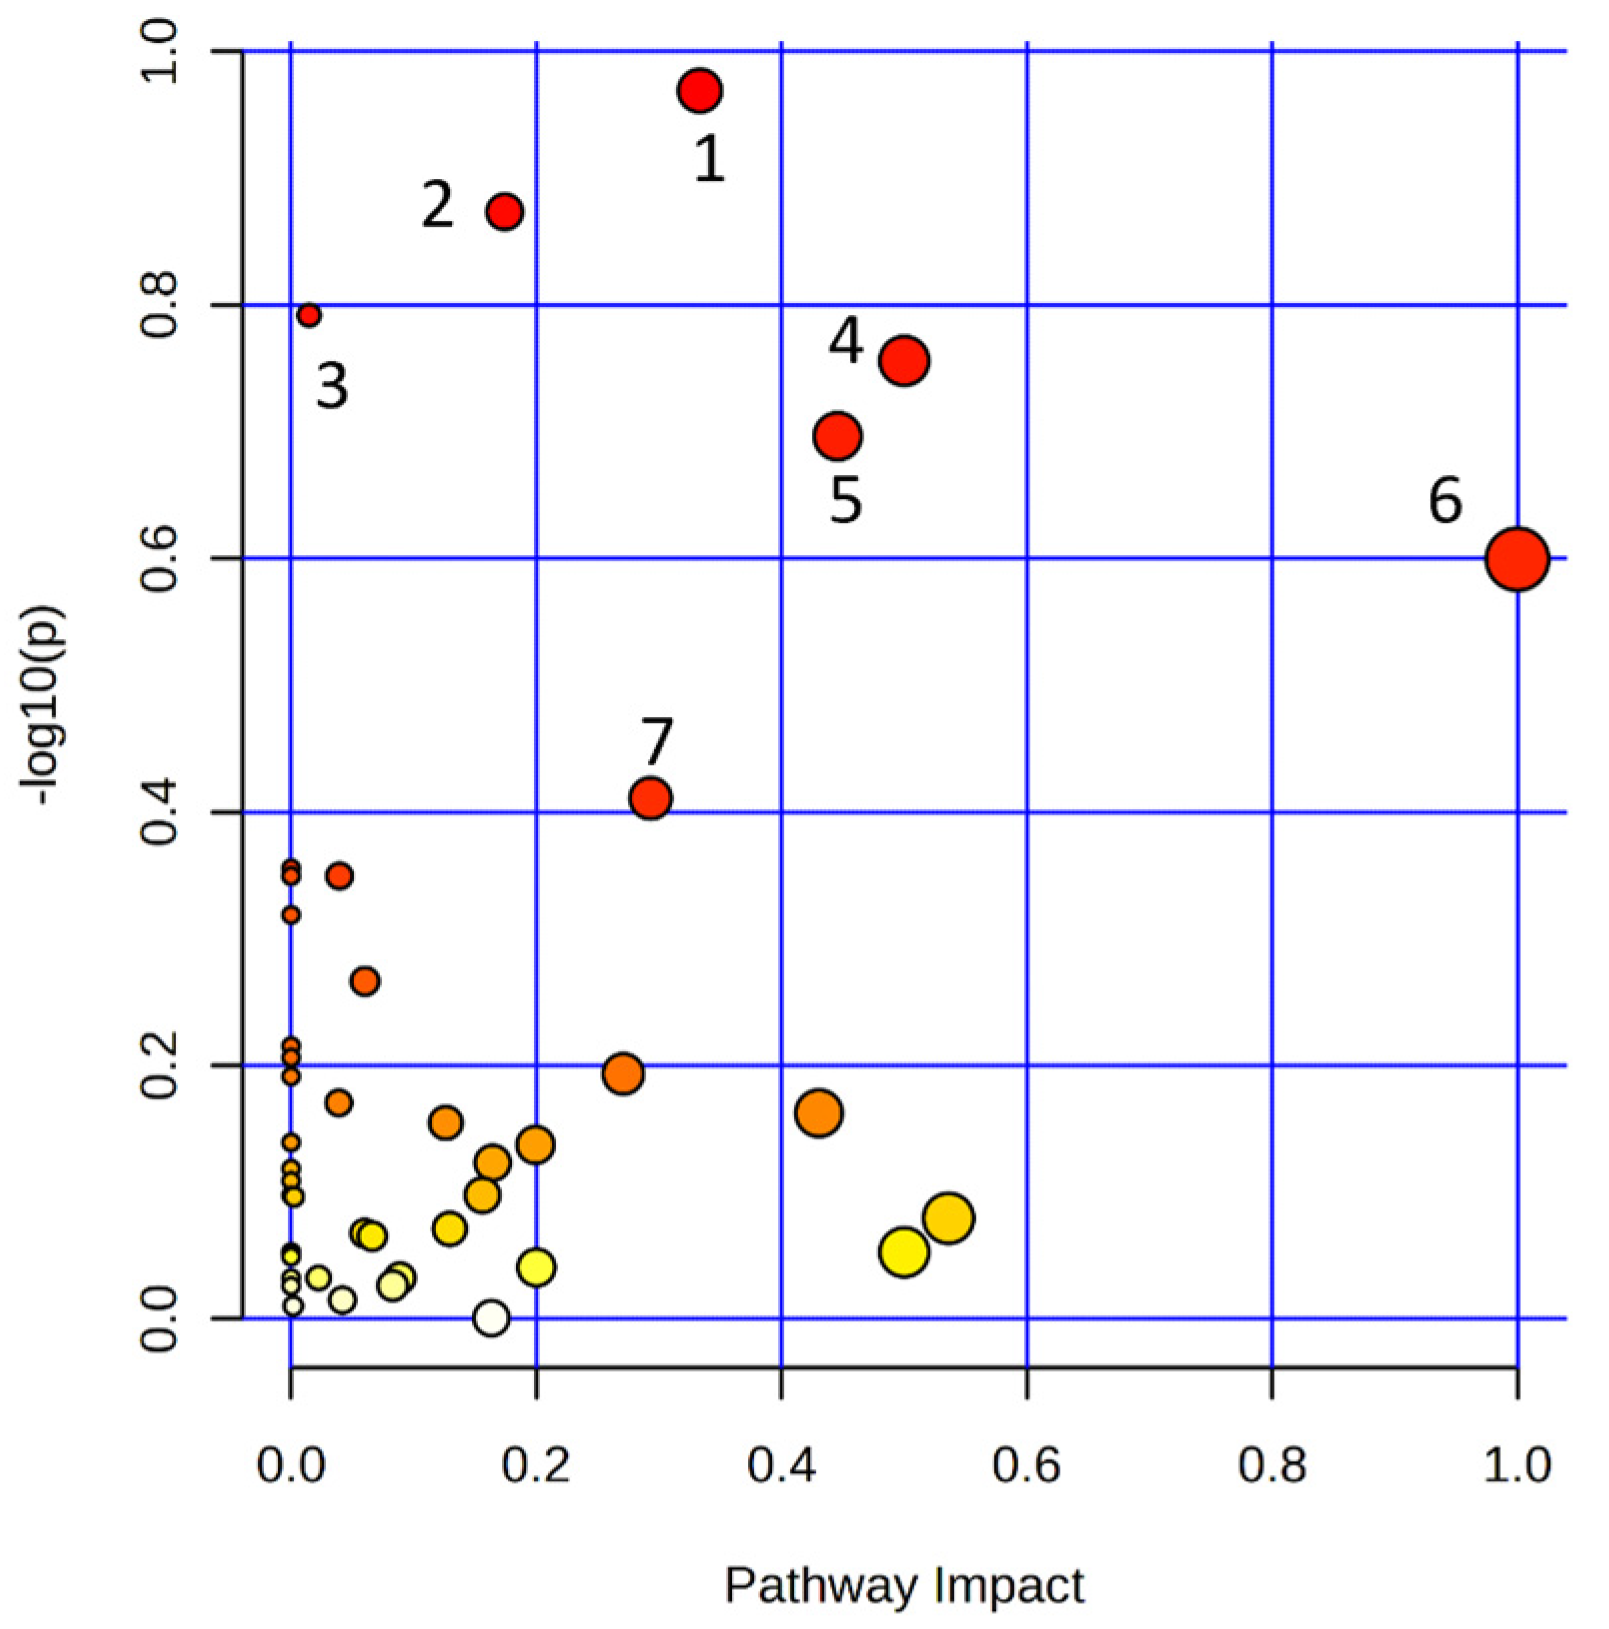
To determine the key metabolic pathways associated with differences between HCs and CCs, the combined metabolite and fatty acid datasets were analyzed using pathway impact analysis in MetaboAnalyst 6.0 against the KEGG (www.genome.jp/kegg/, accessed on 17 November 2025) pathway database for Capra hircus (Figure 3). Pathway enrichment was evaluated using an Over-Representation Analysis (ORA) with Fisher’s Exact Test to calculate the enrichment p-values. Pathways with p < 0.05 were considered significantly enriched. The in silico mapping revealed that the most significantly altered metabolites and fatty acids were involved in seven major metabolic pathways, including linolenic acid metabolism, folate metabolism, fatty acid biosynthesis, riboflavin metabolism, glycine, serine and threonine metabolism, linoleic acid metabolism, and arachidonic acid metabolism, suggesting differential regulation of these pathways in animals raised under hot versus cold environmental conditions.
Figure 3.
Alterations in the metabolic pathways of Black Bengal goats (Capra hircus) during hot and cold climate conditions. The x-axis indicates the pathway impact, and the y-axis indicates the pathway enrichment. Bubbles with darker color and larger size represent higher p-values from enrichment analysis and a greater impact from the pathway topology analysis, respectively. Metabolic pathway: (1) Linolenic acid metabolism, (2) folate metabolism, (3) fatty acid biosynthesis, (4) riboflavin metabolism, (5) glycine, serine, and threonine metabolism, (6) linoleic acid metabolism, and (7) arachidonic acid metabolism.
4. Discussion
In order to avoid individual variation in metabolic and fatty acid results, colostrum samples were collected from the same dams. A previous study showed that litter size and parity affected the nutrient composition in the colostrum [17]. The colostrum of dams with multiple litter sizes had higher fat and total solids but lower glycine, trimethylamine N-oxide, mannitol, myo-inositol, and betaine than those with single litters. Meanwhile, the colostrum of multiparous dams had lower fat, TS, and pantothenate than that from primiparous dams. To minimize the effects of litter size and parity, all dams in the present experiment were those that delivered the same number of kids for two consecutive parities.
The major constituents of mammary gland secretions can be affected by seasonal changes. Although data on colostrum composition are limited, a previous study in cows showed that the protein and casein contents in milk were the lowest in summer and highest in winter [12,23]. Their study showed that the THI during summer was around 75, while those in the winter and spring were 45–50 and 65, respectively [12]. The low concentration during summer was suggested to be due to heat stress affecting milk protein synthesis because the THI at the beginning of heat stress was around 72 for protein and fat yield. Lower milk fat, protein, and lactose levels were found in the milk of heat-stressed goats [24]. In the present study, the unaltered major constituents in the colostrum may have been due to BB goats being able to tolerate the hot environment of the subtropical area well. The THIs during hot and cold conditions were less variable, and the temperature was not too high during the hot conditions, such that the term “heat stress” could not be applied. Moreover, hot conditions minimally affected protein catabolism in dams, as suggested by the unchanged creatine concentration compared with CCs.
For the metabolomic profiles in the colostrum, most of the metabolites were higher in CCs than in HCs, especially carbohydrate and lipid derivatives. Seasonal two-fold increases in 22 metabolites in the colostrum have been reported in dairy cows calved during autumn compared to spring [18]. The metabolic differences were related to environmental temperature and diet, which differed between seasons, rather than the parity of the dams and genetic merit.
For amino acids and derivatives, non-protein molecules containing nitrogen, such as creatine, creatinine, carnitine, free amino acids, nucleotides, and polyamines, were observed. Creatine and carnitine in milk are provided by de novo synthesis or dietary intake. Creatine is essential for neural development, and deprivation can cause intellectual disability in humans [25]. Creatinine is a product of muscle metabolism. Sarcosine and tyrosine increased during CCs. The function of sarcosine is obscured, while tyrosine is essential for the synthesis of thyroid hormone and the neurotransmitter levodopa. The lower tyrosine in HCs corresponds to lower production of TSH, T4, and T3, as seen in heat-stressed steers [26]. The decrease in levodopa may be due to the hypersecretion of prolactin, a stress hormone, as seen in Holstein heifers subjected to heat stress [27]. Thus, higher thyroid function was suggested during CCs and may be responsible for the mobilization and utilization of fats and glucose metabolism.
Regarding organic acids and their derivatives, citrate and succinate contents in the colostrum were lower in dams delivered in HCs. No signs of heat discomfort were detected during either HCs or CCs. The data were inconsistent with a previous study in dairy goats showing higher milk citrate after intramammary challenge with lipopolysaccharide under heat stress at 35 °C compared to 15–20 °C, the thermoneutral zone [28]. The differences may be due either to the mammary immune response after simulated infection in a previous study or the BB goats being subjected to heat adaptation when raised in a subtropical area. It was suggested that the citrate in milk comes from secretory cells of the mammary gland rather than blood plasma, as shown previously in dairy cows [6]. Thus, changes in citrate concentration in milk may not be related to carbohydrate metabolism in dams but rather to alveolar function. Citrate in milk may play a crucial role in calcium homeostasis and the fluidity of milk. Lower citrate may cause clumping of calcium, affecting the quality of the colostrum. Moreover, lower citrate may affect udder health, where calcium could damage the barrier between blood and milk at alveoli. Thus, lower citrate in the colostrum during HCs may negatively affect udder health. Moreover, citrate is involved in de novo fatty acid synthesis.
For carbohydrates and derivatives, the higher sugar (galactose, glucose, lactose, and mannitol) content in the colostrum collected during CCs may suggest enhanced glucose production via the acceleration of hepatic gluconeogenesis and glycogenolysis. This process could be a result of higher thyroid function during CCs. Moreover, CCs may suppress insulin levels or responses, leading to reduced glucose utilization. Heat stress was reported to enhance basal insulin levels and responses [8]. A previous study also showed that heat acclimatization induces a shift toward carbohydrate use [29]. Thus, CCs may contribute to higher glucose levels.
N-acetyl-D-glucosamine was found in mammalian milk as a monosaccharide unit of oligosaccharides. A previous study demonstrated a concentration of N-acetyl-D-glucosamine in cow milk of 146.7 mg/L, which was 32 times higher than that in goat milk, as measured using GC-MS analysis [30]. In humans, human milk oligosaccharides (HMOs), mainly lacto-N-tetraose (LNT) and lacto-N-neotetraose (LNnT), which are the most important core structures, have positive effects on the infant, such as prebiotic effects, inhibiting the adhesion of harmful pathogens to the gut wall, and modulating the immune system [31]. They are the fourth most abundant component of human milk, following water, lactose, and fat [32]. The HMO concentration in the colostrum has been reported to be higher than that in milk [33], while some studies have reported no differences [32]. Nevertheless, information regarding the role of N-acetyl-D-glucosamine in relation to kid health and immune function in goats is limited because its concentration in the colostrum of goats is minimal compared to that in humans. The high concentration in CCs may reflect the better health of kids delivered during CCs compared to HCs.
For lipids and derivatives, carnitine’s synthesis requires substances such as methionine, lysine, vitamin C, vitamin B6, iron, and niacin. Its function is related to fatty acid transport into mitochondria for energy supplementation. The increased carnitine in the colostrum suggests high-fat catabolism via β-oxidation during CCs. Both choline and its derivatives were lower during HCs. A study of the metabolomes of blood plasma and milk in heat-stressed cows during heat stress with THIs around 75–85 showed lower glycerophosphocholine and citrate but higher choline in milk than in the thermoneutral zone, in which the THI was 58.8–62.3 [9]. Thus, the variation in results may be due to the degree of heat stress and heat adaptation.
Gut-derived uremic toxin (tri-methylamine N-oxide, TMAO) was produced, but gastrointestinal microbes leaked into the plasma and could be detected in both the urine and milk. A high concentration of TMAO in the urine was reported in heat-stressed goats subjected to 37 °C day and 30 °C night temperatures compared with 15–20 °C thermoneutral temperatures, which is suggested to be due to reduced gastrointestinal blood flow, changes in rumen pH, or an increase in gut barrier permeability [24]. On the contrary, low levels of TMAO in both the plasma and milk were reported during heat exposure in cows [6,7]. Similar to in BB goats, the TMAO in the colostrum in the present study was significantly lower in HCs compared to CCs. The results of low TMAO in the colostrum in HCs suggested that the rumen environment may be altered, and gut microbiome-derived metabolism was suppressed during HCs. The higher uridine in the colostrum during CCs may be due to changes in nucleic acid metabolism in dams, while the nucleotide content in the milk may reflect cell function, metabolism, immunity, and lipid absorption [25].
Most of the vitamins come from dietary intake, especially roughage; cows raised in a pasture-based system had higher levels of B vitamins, especially thiamine and biotin, in their skim milk than those kept indoors and fed with total mixed rations [34]. No changes in B vitamins were found in the present study because roughage and the concentrate diet were supplied year-round similarly.
The major factors affecting the fatty acid concentrations in milk are breed, diet, and the animal’s energy metabolism. Therefore, the seasonal effects on milk fatty acids may be related to the amount and quality of roughage or changes in metabolic pathways during heat exposure and adaptation. Moreover, the time of mammary secretion also affected these components. Colostrum fatty acids decreased by 20% from the first to the seventh day, independent of season [20].
Among the types of fatty acids in the colostrum, saturated fatty acids showed the highest concentration; from high to low concentration, these included palmitic acid, myristic acid, stearic acid, and capric acid, which were similar to those found in milk [35]. Among the saturated fatty acids (SFAs), myristic acid, which had the second-highest concentration, showed significant alteration. The short-chain fatty acids (SCFAs) and medium-chain fatty acids (MCFAs) are synthesized de novo, while about half of the palmitic acid (C16:0) and long-chain fatty acids (LCFAs) are derived from the diet and adipose tissue lipolysis [13]. MCFAs and LCFAs, mainly C18:0, may be desaturated in the mammary gland to form corresponding MUFAs.
The SFAs were lower during CCs, while MUFAs were higher than in HCs. Lower SFAs with higher MUFAs and PUFAs were also found in the milk of buffalo, cattle, goats, sheep, and camels in winter than in summer [13]. These results suggest that the effect was due to the seasonal availability of green fodder, where the increased availability and feed proportion of green forages during winter enhanced unsaturated FAs and decreased SFAs.
The fatty acid composition was affected not only by the amount of green forage available in each season but also by the feeding system management. In dairy cows, the fatty acids in milk were tested under three different feeding systems—full-time grazing, part-time grazing, and indoor feeding—across different seasons: spring, summer, and autumn [23]. Although a significant interaction between the feeding system and season was observed, seasonal variation had a greater effect on fatty acid composition than the feeding system. Factors such as seasonal variations in grass composition and the energy balance of the cows were considered relevant for the milk FA composition.
For omega-3 PUFAs, our results showed no alteration between HCs and CCs. However, omega-9 MUFAs and linoleic acid were higher in CCs than in HCs. The results suggest lipid utilization during CCs. Although higher oleic acid in milk could be due to the biohydrogenation of PUFAs from feed in the rumen and the use of the concentrate diet, the result in BB goats may rather be a result of environmental temperature, because the same feed regimen was implemented in this farm. For the effect of temperature, the high oleic acid in CCs was inconsistent with reports of higher linoleic acid, linolenic acid, oleic acid, and CLA levels in milk during summer [14]. Moreover, higher plasma linoleic acid, oleic acid, and arachidonic acid levels were detected in heat-stressed cows [6]. These results suggest that a negative energy balance leading to fat mobilization occurs during heat stress.
In the present study, the lower SFAs with higher MUFAs and omega-6/omega-3 in CCs compared to HCs were unlikely to be due to differences in the feeding system and grass composition across seasons. The type of roughage was comparable in all seasons, and the feeding system should have had a minimal effect because they were kept in the barn on rainy days. On sunny days, all goats were allowed to walk in the field, in which the grass was cut to prevent grazing and parasitic infection. Therefore, the alterations in fatty acid profiles may be caused by temperature changes affecting energy metabolism.
The lower SFAs during CCs than HCs suggest lower fatty acid biosynthesis, lower lipolysis, or increased utilization during CCs. A meta-analysis of the fatty acid profiles under heat stress in the milk and plasma showed paradoxical findings regarding non-esterified fatty acids (NEFAs), with some studies reporting increased fat mobilization and others showing blunted NEFA responses [10]. Increased SCFAs and MCFAs with decreased LCFAs, MUFAs, and PUFAs in heat-stressed cows suggest changes in de novo fatty acid synthesis or adipose tissue mobilization. In contrast to under heat-stressed conditions, fatty acid utilization may have been enhanced in the present study during CCs compared to HCs. This effect could be due to increased thyroid function in CCs. Thyroid hormone can serve many functions regarding lipid metabolism, such as the stimulation of lipolysis, transportation of fat into cells, regulation of de novo lipogenesis, and stimulation of fatty acid oxidation. Lower SFAs/higher MUFAs in CCs may reflect enhanced β-oxidation due to higher thyroid activity.
Catecholamine is another hormone released during stressful situations. Higher concentrations of both plasma epinephrine and norepinephrine were seen in heat- stressed cows [6], resulting in enhanced lipolysis and triglyceride mobilization from adipose tissue. It is likely that HCs enhanced epinephrine release, which was responsible for the fat mobilization and glucose utilization for chronic heat adaptation in BB goats that were raised in the subtropical region.
5. Limitations
Although the goats were provided the same diet and composition throughout the year, the intake or nutritional status of the goats might have varied due to seasonal changes in the goats’ metabolic demands or the quality of the forage. Moreover, the goats were allowed to walk in the field. Even if the grass was cut short, the goats might have consumed varying amounts of local vegetation depending on the season. Additionally, the temperature and humidity data were not microclimate data collected at the farm but were obtained from a station 50 km away. This may have been a confounding factor between HCs and CCs. In addition, data on environmental changes for the whole seasons and on the day of colostrum collection were collected, while the changes in metabolomics and fatty acids in response to temperature adaptation may occur for a period of time.
6. Conclusions
During CCs, the colostrum sugar levels, citrate, MUFAs, and omega 6/omega 3 were higher while SFAs were lower than during HCs. These results suggest that, during CCs, there is a metabolic shift from carbohydrate toward fat utilization. The alterations in colostrum composition in the present study may reflect neurohumoral changes to maximize nutrient utilization for proper environmental adaptation in BB goats raised in a subtropical region. Future research is needed to investigate thyroid activity, catecholamine levels, and colostrum composition in relation to farm management, kid health, and colostrum quality across seasons.
Author Contributions
Conceptualization, C.B.; methodology, C.B., S.C., T.T.P.V., S.S. and K.H.; software, T.T.P.V., S.S. and K.H.; validation, C.B. and S.S.; formal analysis, C.B. and S.S.; investigation, C.B. and S.C.; resources, C.B.; data curation, C.B. and S.S.; writing—original draft preparation, C.B.; writing—review and editing, C.B., S.C. and S.S.; visualization, C.B. and S.S.; supervision, S.S.; project administration, C.B.; funding acquisition, C.B. All authors have read and agreed to the published version of the manuscript.
Funding
This research was partially supported by the 90th Anniversary of Chulalongkorn University Scholarship under the Ratchadaphiseksomphot Endowment Fund (GCUGR1125661064M), Chulalongkorn University, Thailand.
Institutional Review Board Statement
The present study was conducted according to the Animal Care and Use Protocol approved by the Animal Care and Use Committee, Faculty of Veterinary Science, Chulalongkorn University, Protocol number: 2231025 (12 July 2022–11 July 2023).
Informed Consent Statement
Not applicable.
Data Availability Statement
The original data presented in this study are openly available in the Figshare data repository at https://doi.org/10.6084/m9.figshare.30998236.
Acknowledgments
The authors acknowledge the support of the Chaipattana Foundation’s Black Bengal Goat Domestication Project’s Farm for their assistance with sample collection and for providing the records used in this study.
Conflicts of Interest
The authors declare no conflicts of interest.
References
- Settachaimongkon, S.; van Valenberg, H.J.F.; Smid, E.J. Metabolomics as an emerging strategy for the investigation of yogurt components. In Yogurt in Health and Disease Prevention; Shah, N.P., Ed.; Academic Press: London, UK, 2017; pp. 427–449. [Google Scholar]
- Cui, J.; Zhu, D.; Su, M.; Tan, D.; Zhang, X.; Jia, M.; Chen, G. The combined use of 1H and 2D NMR-based metabolomics and chemometrics for non-targeted screening of biomarkers and identification of reconstituted milk. J. Sci. Food Agric. 2019, 99, 6455–6461. [Google Scholar] [CrossRef] [Scilit]
- Eom, J.S.; Kim, H.S.; Lee, S.J.; Choi, Y.Y.; Jo, S.U.; Kim, J.; Lee, S.S.; Kim, E.T.; Lee, S.S. Metabolic profiling of rumen fluid and milk in lactating dairy cattle influenced by subclinical ketosis using proton nuclear magnetic resonance spectroscopy. Animals 2021, 11, 2526. [Google Scholar] [CrossRef] [Scilit]
- Luangwilai, M.; Duangmal, K.; Chantaprasarn, N.; Settachaimongkon, S. Comparative metabolite profiling of raw milk from subclinical and clinical mastitis cows using 1H-NMR combined with chemometric analysis. Int. J. Food Sci. Technol. 2021, 56, 493–503. [Google Scholar] [CrossRef] [Scilit]
- Zwierzchowski, G.; Zhang, G.; Mandal, R.; Wishart, D.S.; Ametaj, B.N. Milk metabotyping identifies metabolite alterations in the whole raw milk of dairy cows with lameness. J. Agric. Food Chem. 2020, 68, 4507–4514. [Google Scholar] [CrossRef] [Scilit] [PubMed]
- Tian, H.; Wang, W.; Zheng, N.; Cheng, J.; Li, S.; Zhang, Y.; Wang, J. Identification of diagnostic biomarkers and metabolic pathway shifts of heat-stressed lactating dairy cows. J. Proteomics 2015, 12, 17–28. [Google Scholar] [CrossRef] [Scilit] [PubMed]
- Tian, H.; Zheng, N.; Wang, W.; Cheng, J.; Li, S.; Zhang, Y.; Wang, J. Integrated metabolomics study of the milk of heat-stressed lactating dairy cows. Sci. Rep. 2016, 6, 24208. [Google Scholar] [CrossRef] [Scilit]
- Baumgard, L.H.; Rhoads, R.P. Ruminant nutrition symposium: Ruminant production and metabolic responses to heat stress. J. Anim. Sci. 2012, 90, 1855–1865. [Google Scholar] [CrossRef] [Scilit]
- Yue, S.; Ding, S.; Zhou, J.; Yang, C.; Hu, X.; Zhao, X.; Wang, Z.; Wang, L.; Peng, Q.; Xue, B. Metabolomics approach explore diagnostic biomarkers and metabolic changes in heat-stressed dairy cows. Animals 2020, 10, 1741. [Google Scholar] [CrossRef] [Scilit]
- Blaga, S.; Vizitiu, D.A.; Bratu, D.G.; Lungu, B.C.; Tripon, R.M.; Tulca, C.; Marc, S.; Huțu, I. Fatty acid profiles in blood and milk of cows under heat stress: A comprehensive review. Rom. J. Vet. Sci. 2025, 58, 1. [Google Scholar] [CrossRef] [Scilit]
- Cabrera, D.; Fraser, K.; Roy, N.C. A metabolomics analysis of interspecies and seasonal trends in ruminant milk: The molecular difference between bovine, caprine, and ovine milk. J. Dairy Sci. 2024, 107, 6511–6527. [Google Scholar] [CrossRef] [Scilit]
- Bernabucci, U.; Basiricò, L.; Morera, P.; Dipasquale, D.; Vitali, A.; Piccioli Cappelli, F.; Calamari, L. Effect of summer season on milk protein fractions in Holstein cows. J. Dairy Sci. 2015, 98, 1815–1827. [Google Scholar] [CrossRef] [Scilit]
- Saroj; Malla, B.A.; Tran, L.V.; Sharma, A.N.; Kumar, S.; Tyagi, A.K. Seasonal variation in fatty acid profile in the milk of different species under popularly followed feeding system in India. Indian J. Anim. Sci. 2017, 87, 484–489. [Google Scholar] [CrossRef] [Scilit]
- Kumar, G.; Devi, P.; Sharma, N.; Somagond, Y.M. Impact of thermal stress on milk production, composition and fatty acid profile in dairy cows: A review. J. Entomol. Zool. Stud. 2020, 8, 1278–1283. [Google Scholar]
- Vo, T.T.P.; Buranakarl, C.; Chamsuwan, S.; Thammacharoen, S.; Nuntapaitoon, M.; Settachaimongkon, S. Impact of colostrum lactose concentration in relation to metabolomic profiles on kid growth performance of Black Bengal goats. Thai J. Vet. Med. 2025, 55, 2. [Google Scholar] [CrossRef] [Scilit]
- Buranakarl, C.; Thammacharoen, S.; Semsirmboon, S.; Sutayatram, S.; Nuntapaitoon, M.; Katoh, K. Impact of insulin-like growth factor 1, immunoglobulin G and vitamin A in colostrum on growth of newborn Black Bengal goats and its crossbred. J. Anim. Physiol. Anim. Nutr. 2022, 106, 1238–1245. [Google Scholar] [CrossRef] [Scilit]
- Vo, T.T.P.; Buranakarl, C.; Chamsuwan, S.; Thammacharoen, S.; Ratchakom, P.; Nuntapaitoon, M.; Settachaimongkon, S. Changes in the metabolomic profiles of mammary secretion in relation to dam litter size and parity number in Black Bengal goats. Vet. World 2024, 17, 1469–1481. [Google Scholar] [CrossRef] [Scilit] [PubMed]
- Pariyani, R.; Rocchetti, G.; Lawless, A.; Dineen, M.; Maher, N.; Bateman, L.M.; Lucini, L.; O’Callaghan, T.F. Metabolic profiling of bovine colostrum: Unravelling the influences of diet and seasonality on functional dairy components. Food Chem. 2025, 493, 145900. [Google Scholar] [CrossRef] [Scilit]
- Costa, A.; Goi, A.; Penasa, M.; Nardino, G.; Posenato, L.; De Marchi, M. Variation of immunoglobulins G, A, and M and bovine serum albumin concentration in Holstein cow colostrum. Animal 2021, 15, 100299. [Google Scholar] [CrossRef] [Scilit] [PubMed]
- Coroian, A.; Erler, S.; Matea, C.T.; Mireșan, V.; Răducu, C.; Bele, C.; Coroian, C.O. Seasonal changes of buffalo colostrum: Physicochemical parameters, fatty acids and cholesterol variation. Chem. Cent. J. 2013, 7, 40. [Google Scholar] [CrossRef] [Scilit]
- National Research Council. A Guide to Environmental Research on Animals; The National Academies Press: Washington, DC, USA, 1971; 382p.
- Settachaimongkon, S.; Homyog, K.; Mekboonsonglarp, W.; Soonoue, P.; Lerdamnuaylarp, T.; Prayoonpeeraput, P.; Theil, P.K.; Nuntapaitoon, M. Dynamics of fatty acid and non-volatile polar metabolite profiles in colostrum and milk depending on the lactation stage and parity number of sows. Sci. Rep. 2023, 13, 1989. [Google Scholar] [CrossRef] [Scilit]
- Akert, F.S.; Kreuzer, M.; Kunz, C.; Reidy, B.; Berard, J. Effects of fulltime v. part-time grazing on seasonal changes in milk coagulation properties and fatty acid composition. J. Dairy Res. 2021, 88, 23–28. [Google Scholar] [CrossRef] [Scilit]
- Contreras-Jodar, A.; Nayan, N.H.; Hamzaoui, S.; Caja, G.; Salama, A.A.K. Heat stress modifies the lactational performances and the urinary metabolomic profile related to gastrointestinal microbiota of dairy goats. PLoS ONE 2019, 14, e0202457. [Google Scholar] [CrossRef] [Scilit]
- Garwolińska, D.; Namieśnik, J.; Kot-Wasik, A.; Hewelt-Belka, W. Chemistry of human breast milk-a comprehensive review of the composition and role of milk metabolites in child development. J. Agric. Food Chem. 2018, 66, 11881–11896. [Google Scholar] [CrossRef] [Scilit] [PubMed]
- Kahl, S.; Elsasser, T.H.; Rhoads, R.P.; Collier, R.J.; Baumgard, L.H. Environmental heat stress modulates thyroid status and its response to repeated endotoxin challenge in steers. Domest. Anim. Endocrinol. 2015, 52, 43–50. [Google Scholar] [CrossRef] [Scilit] [PubMed]
- Ronchi, B.; Stradaioli, G.; Verini Supplizi, A.; Bernabucci, U.; Lacetera, N.; Accorsi, P.A.; Nardone, A.; Seren, E. Influence of heat stress or feed restriction on plasma progesterone, oestradiol-17β, LH, FSH, prolactin and cortisol in Holstein heifers. Livest. Prod. Sci. 2001, 68, 231–241. [Google Scholar] [CrossRef] [Scilit]
- Salama, A.A.K.; Contreras-Jodar, A.; Love, S.; Mehaba, N.; Such, X.; Caja, G. Milk yield, milk composition, and milk metabolomics of dairy goats intramammary-challenged with lipopolysaccharide under heat stress conditions. Sci. Rep. 2020, 10, 5055. [Google Scholar] [CrossRef] [Scilit]
- Rhoads, R.P.; Baumgard, L.H.; Suagee, J.K.; Sanders, S.R. Nutritional interventions to alleviate the negative consequences of heat stress. Adv. Nutr. 2013, 4, 267–276. [Google Scholar] [CrossRef] [Scilit]
- Li, J.-Y.; Ge, Q.; Liu, B.; Gao, Z.-P.; Guo, C.-F. Quantification of cow milk in adulterated goat milk by HPLC-MS/MS using N-acetylglucosamine as a reliable biomarker of cow milk. J. Food Compos. Anal. 2023, 123, 105583. [Google Scholar] [CrossRef] [Scilit]
- Hu, M.; Miao, M.; Li, K.; Luan, Q.; Sun, G.; Zhang, T. Human milk oligosaccharide lacto-N-tetraose: Physiological functions and synthesis methods. Carbohydr. Polym. 2023, 316, 121067. [Google Scholar] [CrossRef] [Scilit]
- Kunz, C.; Meyer, C.; Collado, M.C.; Geiger, L.; García-Mantrana, I.; Bertua-Ríos, B.; Rudloff, S. Influence of gestational age, secretor, and Lewis blood group status on the oligosaccharide content of human milk. J. Pediatr. Gastroenterol. Nutr. 2017, 64, 789–798. [Google Scholar] [CrossRef] [Scilit]
- Coppa, G.V.; Bruni, S.; Morelli, L.; Soldi, S.; Gabrielli, O. The first prebiotics in humans: Human milk oligosaccharides. J. Clin. Gastroenterol. 2004, 38, S80–S83. [Google Scholar] [CrossRef] [Scilit] [PubMed]
- Magan, J.B.; O’Callaghan, T.F.; Zheng, J.; Zhang, L.; Mandal, R.; Hennessy, D.; Fenelon, M.A.; Wishart, D.S.; Kelly, A.L.; McCarthy, N.A. Effect of diet on the vitamin B profile of bovine milk-based protein ingredients. Foods 2020, 9, 578. [Google Scholar] [CrossRef] [Scilit] [PubMed]
- Saroha, V.; Kumar, D.; Sharma, A.; Jayakumar, S.; Tyagi, A.K.; Nagda, R.K.; Dixit, S.P. Quantitative analysis of fatty acid in Indian goat milk and its comparison with other livestock. Livestock Sci. 2014, 5, 1–8. [Google Scholar]

Disclaimer/Publisher’s Note: The statements, opinions and data contained in all publications are solely those of the individual author(s) and contributor(s) and not of MDPI and/or the editor(s). MDPI and/or the editor(s) disclaim responsibility for any injury to people or property resulting from any ideas, methods, instructions or products referred to in the content. |
© 2026 by the authors. Licensee MDPI, Basel, Switzerland. This article is an open access article distributed under the terms and conditions of the Creative Commons Attribution (CC BY) license.