Article

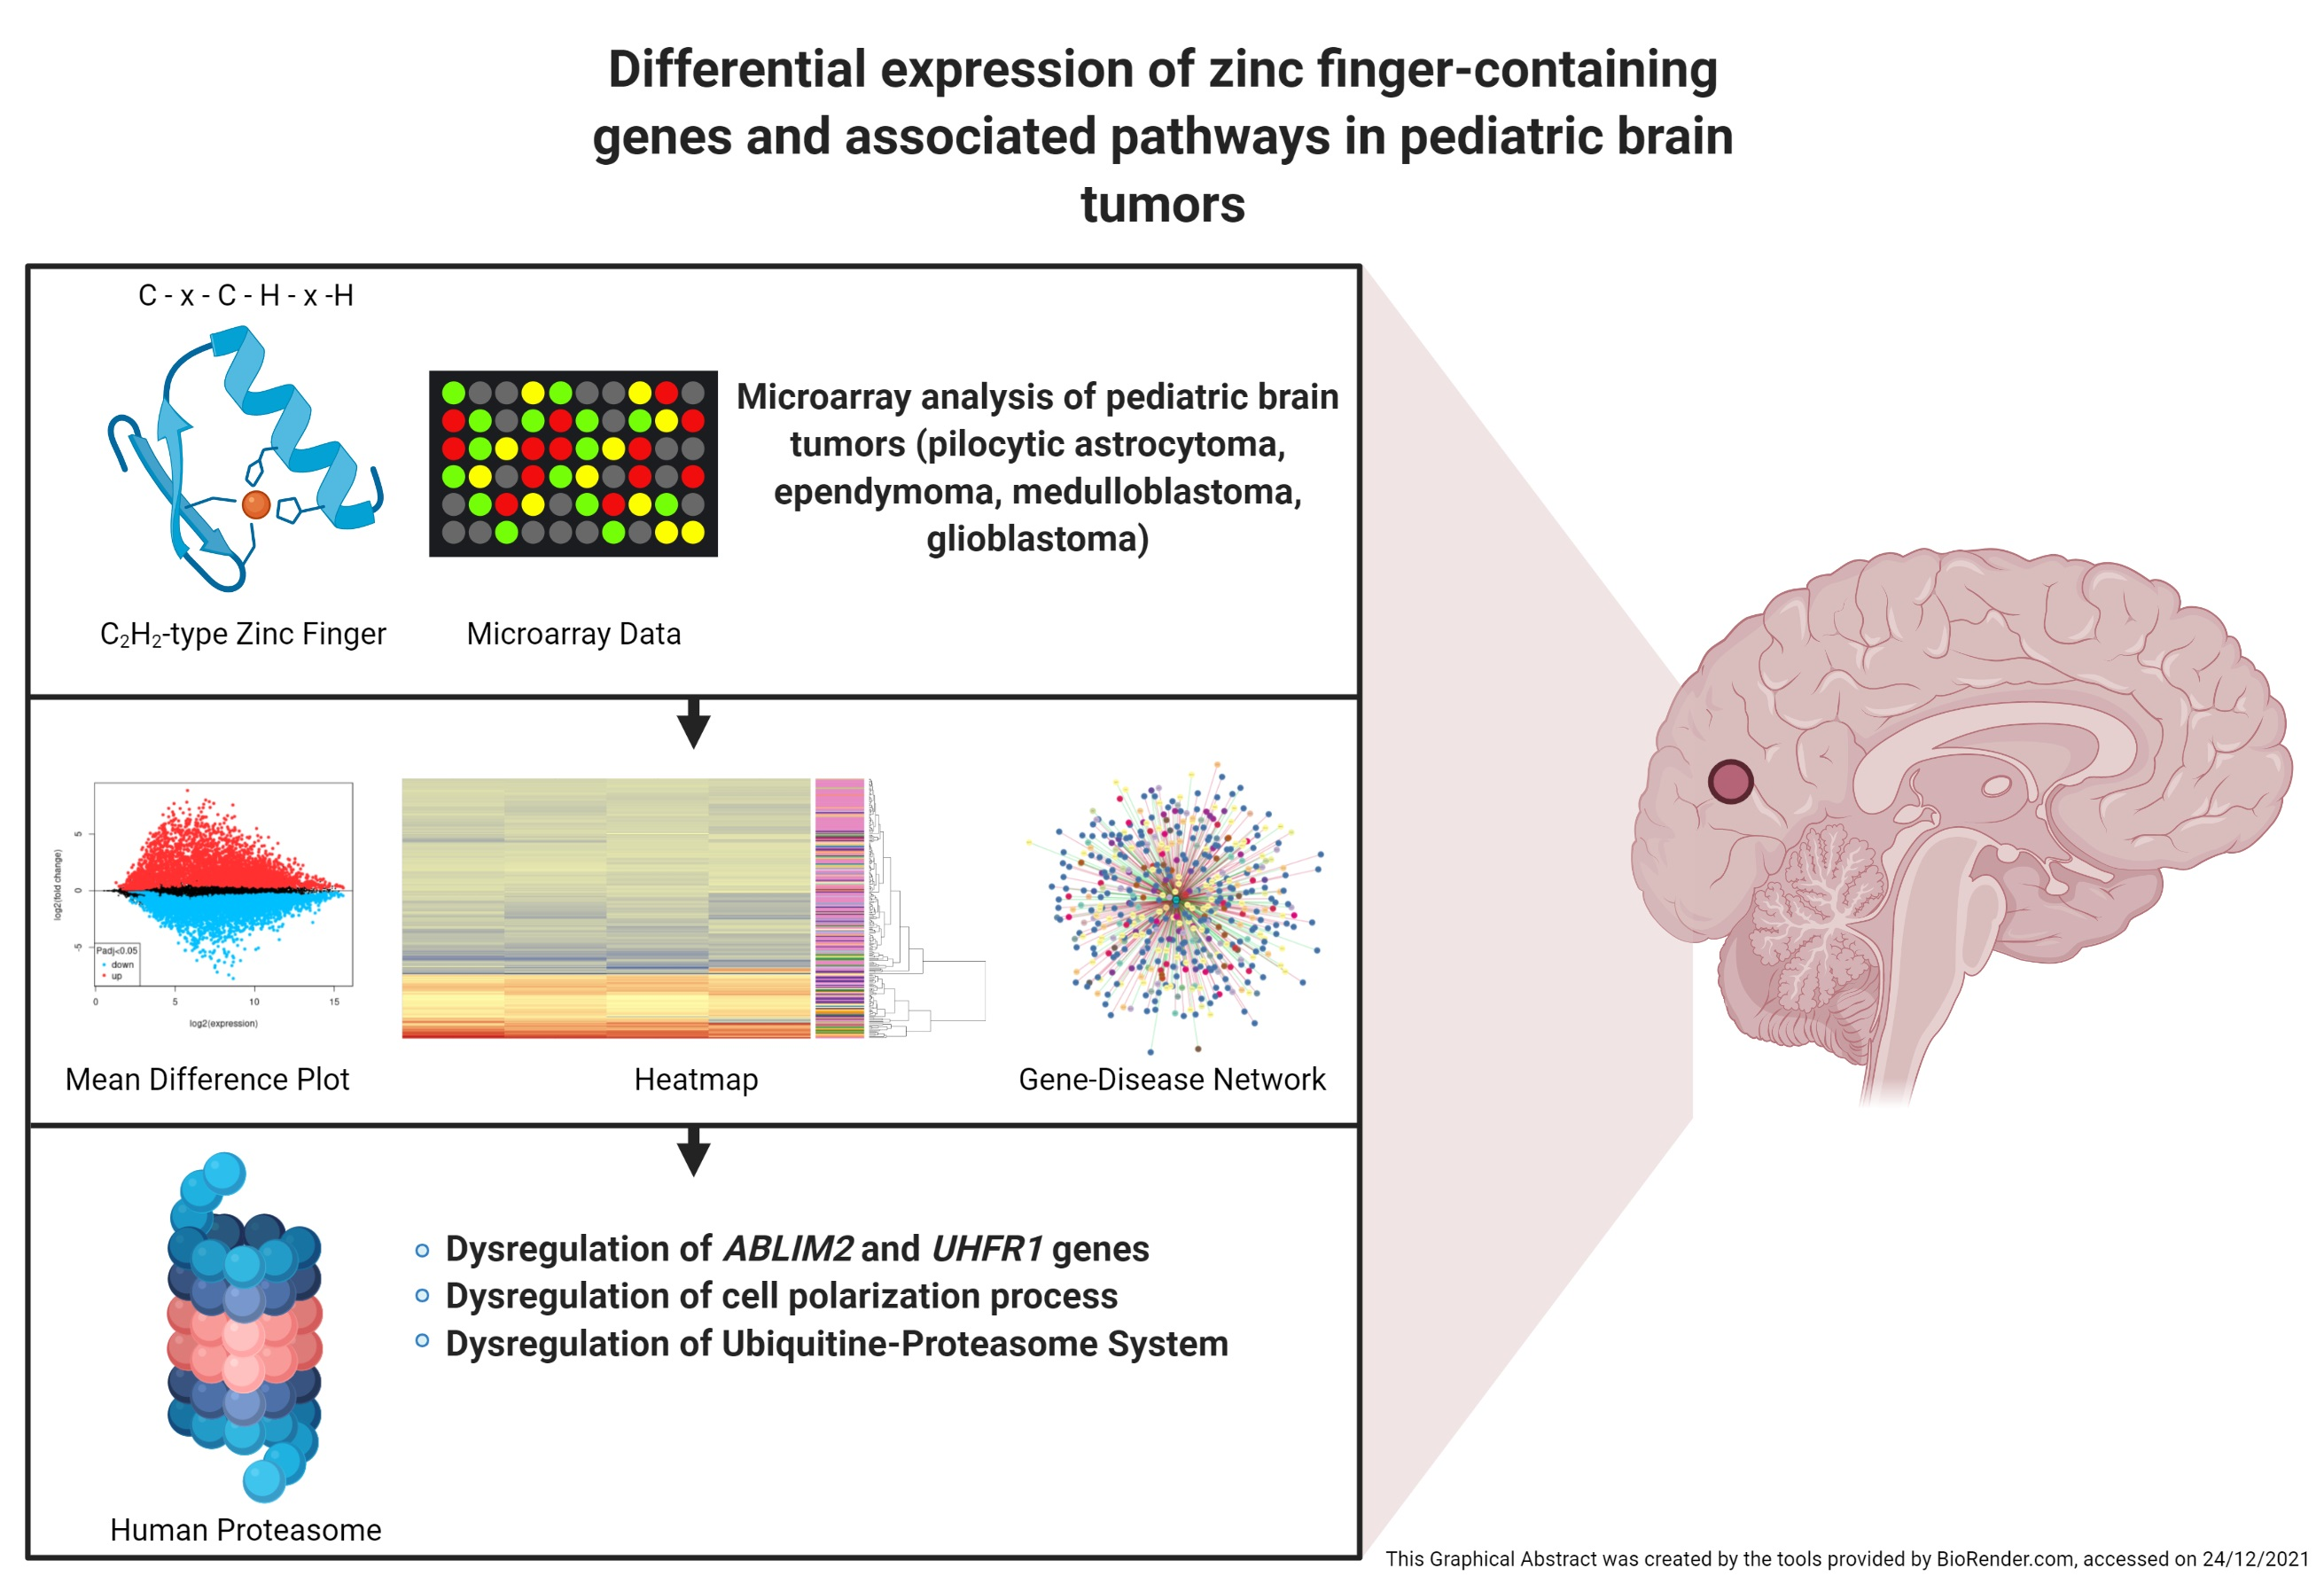
Central Role of C2H2-Type Zinc Finger-Containing Genes in Pediatric Brain Tumors

by
Dimitrios S. Kanakoglou
1,*,
Andromachi Pampalou
1,
Lina S. Malakou
2,
Eleftheria Lakiotaki
1,
Theodoros Loupis
3,
Dimitrios M. Vrachnos
3,
Panayiotis D. Glekas
4,
Alexia Klonou
2,
Angeliki-Ioanna Giannopoulou
2,
Madison Carpenter
5,
Penelope Korkolopoulou
1 and
Christina Piperi
2
1
First Department of Pathology, Medical School, National and Kapodistrian University of Athens, 75 Mikras Asias Street, 11527 Athens, Greece
2
Department of Biological Chemistry, Medical School, National and Kapodistrian University of Athens, 75 Mikras Asias Street, 11527 Athens, Greece
3
Haematology Research Lab, Clinical, Experimental Surgery and Translational Research Center, Biomedical Research Foundation, Academy of Athens, 4 Soranou Ephessiou Street, 11527 Athens, Greece
4
Enzyme and Microbial Biotechnology Unit, Department of Biology, Zografou Campus, National and Kapodistrian University of Athens, 15772 Athens, Greece
5
Bioinformatics Department, College of Science, Northeastern University, 360 Huntington Avenue, 115 Richards Hall, Boston, MA 02115, USA
*
Author to whom correspondence should be addressed.
DNA 2022, 2(1), 1-21; https://doi.org/10.3390/dna2010001
Submission received: 26 November 2021 / Revised: 17 December 2021 / Accepted: 21 December 2021 / Published: 3 January 2022

Abstract

:
Zinc fingers consist of one of the most abundant motifs in transcription factors and DNA-binding proteins. Recent studies provide evidence on the pathological implication of zinc finger proteins in various neurodevelopmental disorders and malignancies but their role in pediatric brain tumors is largely unexplored. To this end, we investigated the differential expression of zinc finger-containing genes along with relevant biological processes and pathways among four main brain tumor categories (pilocytic astrocytomas, ependymomas, medulloblastomas and glioblastomas). By employing an extended bioinformatic toolset, we performed a preliminary in silico study in order to identify the expression of zinc finger-containing genes and associated functions in pediatric brain tumors. Our data analysis reveals the prominent role of C2H2-type zinc finger-containing genes in the molecular mechanisms underlying pediatric brain tumors followed by the Ring and PHD finger types. Significant dysregulation of ABLIM2 and UHFR1 genes was detected in all tumor types drawing attention to the dysregulation of cell polarization process and Ubiquitin-Proteasome System (UPS) in the pathogenesis of pediatric brain tumors. Moreover, significant gene clustering was observed in multiple locations with two highly visible clusters revealing a contrast in gene regulation between medulloblastomas and the other three brain tumor types, indicating a promising area of future research.

Graphical Abstract

1. Introduction

1.1. Zinc Fingers

Zinc fingers are a group of small protein domains, consisting of at least one zinc ion to achieve their functional structure and representing the most frequently used DNA-binding motifs in eukaryotic Transcription Factors (TFs). A zinc finger domain needs different combinations of cysteines and histidines to bind a Zn(II) ion which primarily offers thermal stability and enhances the conformation of the domain. However, the interaction of zinc with the cysteines and histidines is involved in the biological processes, and thus, the functional properties of each domain are dependent on the number and the assembly of cysteines and histidines [1].
Zinc fingers consist of one of the most abundant motifs in TFs and DNA-binding proteins, acetylases, deacetylases, etc. There are four key residue positions on the alpha-helix of the zinc fingers with hydrogen bond activity which can interact with DNA. Zinc finger domains offer high-affinity protein-based interactions. An individual zinc finger domain can identify a wide range of three contiguous base pairs, with orientation 3′ to 5′, making zinc fingers very resilient in recognizing DNA patterns, so that they can bind in a variety of DNA regions [2,3].
Zinc finger domains are capable of binding both DNA and proteins simultaneously since both heterotypic and homotypic interactions in proteins suggest the involvement of zinc finger domains. Many proteins, such as the GATA-family members, are homodimerizing during their binding to DNA, a process catalyzed by zinc finger domains in GATA protein structures. Furthermore, many TFs, in order to interact and bind to DNA elements, form looped domains with each other. It is proposed that Ikaros, Sp1, EKLF and GATA interact through zinc finger domains and facilitate communication between different elements in the DNA [4].
Certain classes of zinc fingers are crucial for RNA binding, mainly for mRNA targeting immune regulation, including the degradation and modulation of signaling pathways in immune cells. CCCH zinc fingers appear in proteins that regulate cytokine production and immune cell activation. For example, Roquin 1 contains a single CCCH zinc finger domain, a RING finger domain, a ROQ domain and a proline-rich domain. Roquin 1 recognizes motifs in the 3′ Untranslated Region (UTR) of its target mRNAs, through its ROQ domain and adjacent CCCH zinc finger domain, promoting mRNA decay [5].
Apart from their role in DNA-binding and DNA-binding protein interactions, zinc fingers exhibit variable effects in many cellular signaling pathways. All Protein kinase C isoforms contain at least one finger-like sequence and in many cases, these domains have been responsible for the binding of diacylglycerol (DAG) [6]. Furthermore, A20, a potent anti-inflammatory molecule, contains several CCCC type zinc fingers, and binds to TNFR1 as negative feedback, which has been triggered by TNF binding, to prevent sustained NF-κB (Nuclear Factor kappa B) activation [7]. Furthermore, ZPR1 binds to EGFR, through two zinc finger domains and communicates proliferative growth signals, induces neuron differentiation and stimulates axonal growth and formation of growth cones in spinal cord motor neurons [8], indicating a potential role of zinc fingers in neuronal physiology.

1.2. Role of Zinc Fingers in Brain Physiology and Disease

Brain development and homeostasis rely heavily on controlled cell differentiation. Neural stem cells give rise to neurons and glial cells, astrocytes, and oligodendrocytes, respectively. Terminally differentiated neurons and glial cells are critical for all brain activities, and thus require strict control of the differentiation process [9].
TFs are playing a significant role in neural stem cell differentiation with C2H2-type zinc finger domains being the most frequent. GLI3 (GLI Family Zinc Finger 3) is a poly-ZNF TF involved in the Sonic Hedgehog (SHH) signaling pathway which controls the cell cycle of Radical Progenitor Cells (RGPs). RGPs serve as progenitors for neural stem cells by shortening the G1 phase, leading to the development of various morphological abnormalities in the Central Nervous System (CNS) (43). Moreover, the ZEB family of C2H2-ZNFs (ZEB1 and ZEB2) are essential for normal brain development. ZEB1 has been shown to repress gene transcription and regulate proliferation, migration, and differentiation of RGPs, while being also associated with pathological conditions such as epilepsy and motor defects. Additionally, the ZIC-type poly-ZNFs (ZIC1, ZIC2, ZIC3, ZIC4, and ZIC5) are expressed in the specific regions of neuroectoderm during the early embryonic phase in mice, and they play essential role in CNS development [9,10]. Furthermore, Myelin Transcription Factor 1 (MyT1) Myt1, containing two clusters of C2HC zinc finger domains, is implicated in the differentiation of fibroblasts to neurons, mainly in oligodendrocytes. It is widely expressed during embryogenesis, playing an important role in neuronal development [11].
Homologous to Myt1 is the Neural Zinc Finger Factor-1 (NZF-1), a C2HC zinc finger TF which also plays a regulating role in the differentiation and maturation of nerve cells. NZF-1 has been detected in neurons where it regulates β-Retinoic Acid Receptor (β-RAR) expression, while MyT1 is found in oligodendrocytes, where it regulates expression of the Proteolipid Protein (PLP), the main myelin-forming protein in the CNS [12]. Moreover, NZF3 and Myt3 belong to the family of the non-classical zinc finger proteins, alongside the Suppression of Tumorigenicity 18 (ST18) member. Specifically, ST18 displays a high degree of homology to MyT1 and NZF1. Additionally, ST18 and NZF3 have been implicated in the regulation of mRNA levels of the proapoptotic and proinflammatory genes [13,14].
Recent studies have discovered the pathological implication of C2H2-type zinc finger proteins (C2H2-ZNFs) in neurodevelopmental disorders. These disorders are characterized by abnormal development of the CNS and morphological malfunctions, such as autism spectrum disorders, motor diseases, neuropsychiatric problems, cognitive impairment, genetic disorders, such as Down syndrome and fragile-X syndrome, neuropsychiatric disorders such as schizophrenia, major depressive disorder, and bipolar affective disorder [9]. Aberrant expression and misregulation of MyT1 and Myt1-like (MyT1l) zinc finger proteins have been associated with syndromal intellectual disability, schizophrenia, and periventricular leukemia [15,16,17].
Emerging data has shown that several zinc finger proteins are been implicated in the pathology of adult brain tumors. ZFAND3 (AN1/A20 Zinc Finger Domain Containing Protein 3) has been revealed as a crucial player in glioblastoma invasion. It was shown to activate gene transcription through a nuclear protein complex, promoting the transcription and expression of invasion-essential genes [18]. Moreover, scRNA-Seq studies have detected ZNF671 in gliomas and glioblastomas playing primarily a tumor suppressor role, but with the detailed mechanism remaining elusive [19]. Additionally, ZHX1 (Zinc Fingers and Homeoboxes Protein 1) was found overexpressed in glioblastoma. This nuclear transcription repressor was shown to be involved in cell differentiation and tumorigenesis. It was demonstrated to regulate proliferation and invasiveness of glioblastoma cells via regulation of TWIST1 and SNAI2 [20]. Epigenome profiling studies have further detected the overexpression of the MYT1 gene in glioblastomas compared to normal brains. They have demonstrated corresponding hypomethylation and active chromatin states in the MYT1 gene promoter and in known enhancer regions [21].
Additional studies in glioblastoma cell lines have shown a correlation between Myt1 and Myt1l TFs and Hippo signaling pathway. The overexpression of these two C2HC zinc finger TFs was shown to repress the YAP1 transcriptional coactivator, a basic mediator of Hippo signaling, promoting glioblastoma proliferation and growth [22].
Although there is significant evidence on the role of zinc fingers in brain physiology and disease, their role in pediatric brain tumors is currently largely unexplored.

1.3. Pediatric Brain Tumors

Childhood CNS tumors emerge as the most common solid tumors of variable degrees of malignancy and are often associated with high mortality rates, posing major clinical challenges [23]. Recently, the morphology-based categorization of these tumors has been replaced by a complicated histology/molecular-based classification which is crucial for their therapeutic stratification [24]. A major distinction between pediatric brain tumors is the cell of tumor’s origin, which can be divided into glial/glioneuronal and non-glial brain tumors [24]. Among these two categories, glial/glioneuronal derived tumors encompass gliomas (LGGs and HGGs) and ependymal tumors (ependymomas) [24,25,26]. Non-glial derived tumors, include embryonal tumors that are the most frequent clinical entities, along with other less studied categories such as pineal tumors, craniopharyngiomas, meningiomas, and choroid plexus tumors [24,25,26].
Embryonal tumors (Grade IV) appear mostly in children of ages between 0–14 years old at a 15% rate and encompass Medulloblastomas (MDBs, 61,9%), Atypical Teratoid/Rhabdoid Tumors (ATRT, 15%), primitive neuroectodermal tumors (14,9%), and other types (8,1%) [27]. MDBs represent the most prevalent malignant type among children (approximately 20% of all pediatric brain neoplasms) [27]. They are mainly formed in the posterior fossa and classified into four subgroups (WNT, SHH, Group 3, and Group 4) according to their molecular characteristics. Unfortunately, the least frequent WNT group (10%) carries the most favorable prognosis with a >95% 5-year survival compared to the remaining groups [27]. ATRTs develop within the cranium and are accompanied by a controversial prognosis that reaches a 50% survival for patients with localized disease [27]. Neuroectodermal tumors are considered rather uncommon, with a 3% occurrence rate and a poor prognosis [27].
Craniopharyngiomas are benign neoplasms of epithelial origins which arise close to the optic chiasm and represent 5-10% of all pediatric brain tumors [27]. Choroid plexus neoplasms appear in a 3–4% percentage among pediatric intracranial malignancies and include tumors of variable aggressiveness (Grade I-III) and prognosis [27]. Meningiomas (Grade II-III) are quite rare and overall account for just 1–2% of primary brain tumors [28] while pineal tumors account for 2.8–11% of all brain tumors in children and adolescents (<21 years old) [29].
Gliomas are considered the most common neoplasms in children. They consist of low-grade gliomas such as the most frequent Pilocytic Astrocytomas (PAs, Grade I) followed by gangliogliomas and Dysembryoplastic Neuroepithelial Tumors (DNET) which are rather slowly growing tumors, as well as diffuse astrocytomas (Grade II) characterized by a more aggressive behavior [23]. PAs are neurological neoplasms that represent 20% of total CNS tumors among children [30]. They have a relatively benign clinical course and an excellent prognosis, with a 5-year survival of 80–90% [30]. Gangliogliomas are rare primary tumors consisting both of neuronal ganglion and glial cells, which account approximately for 10% of all childhood brain tumors [31].
Childhood high-grade gliomas mainly consist of anaplastic astrocytomas and gangliogliomas (Grade III) and Grade IV tumors [Glioblastomas (GBMs) and H3K27M-mutant diffuse midline gliomas]. Glioblastomas are malignant tumors with a 2–3% incidence rate among pediatric brain cancer patients and an overall survival rate that varies from 10–73 months [32]. Diffuse Intrinsic Pontine Gliomas (DIPGs) are considered highly aggressive, located mainly in the brainstem, mostly affecting children of 6–7 years old. They represent 10% of all pediatric tumors and have a 2-year survival of less than 10% [33,34].
Ependymomas (EPNs, Grade I-III) comprise subependymomas (Grade I), EPNs Grade II, RELA fusion-positive ependymomas (Grade II or III) and anaplastic ependymomas (Grade III) [26]. They encompass 8-10% of pediatric CNS tumors and they are the third most developed childhood neoplasms with a survival rate of 50–70% [27].

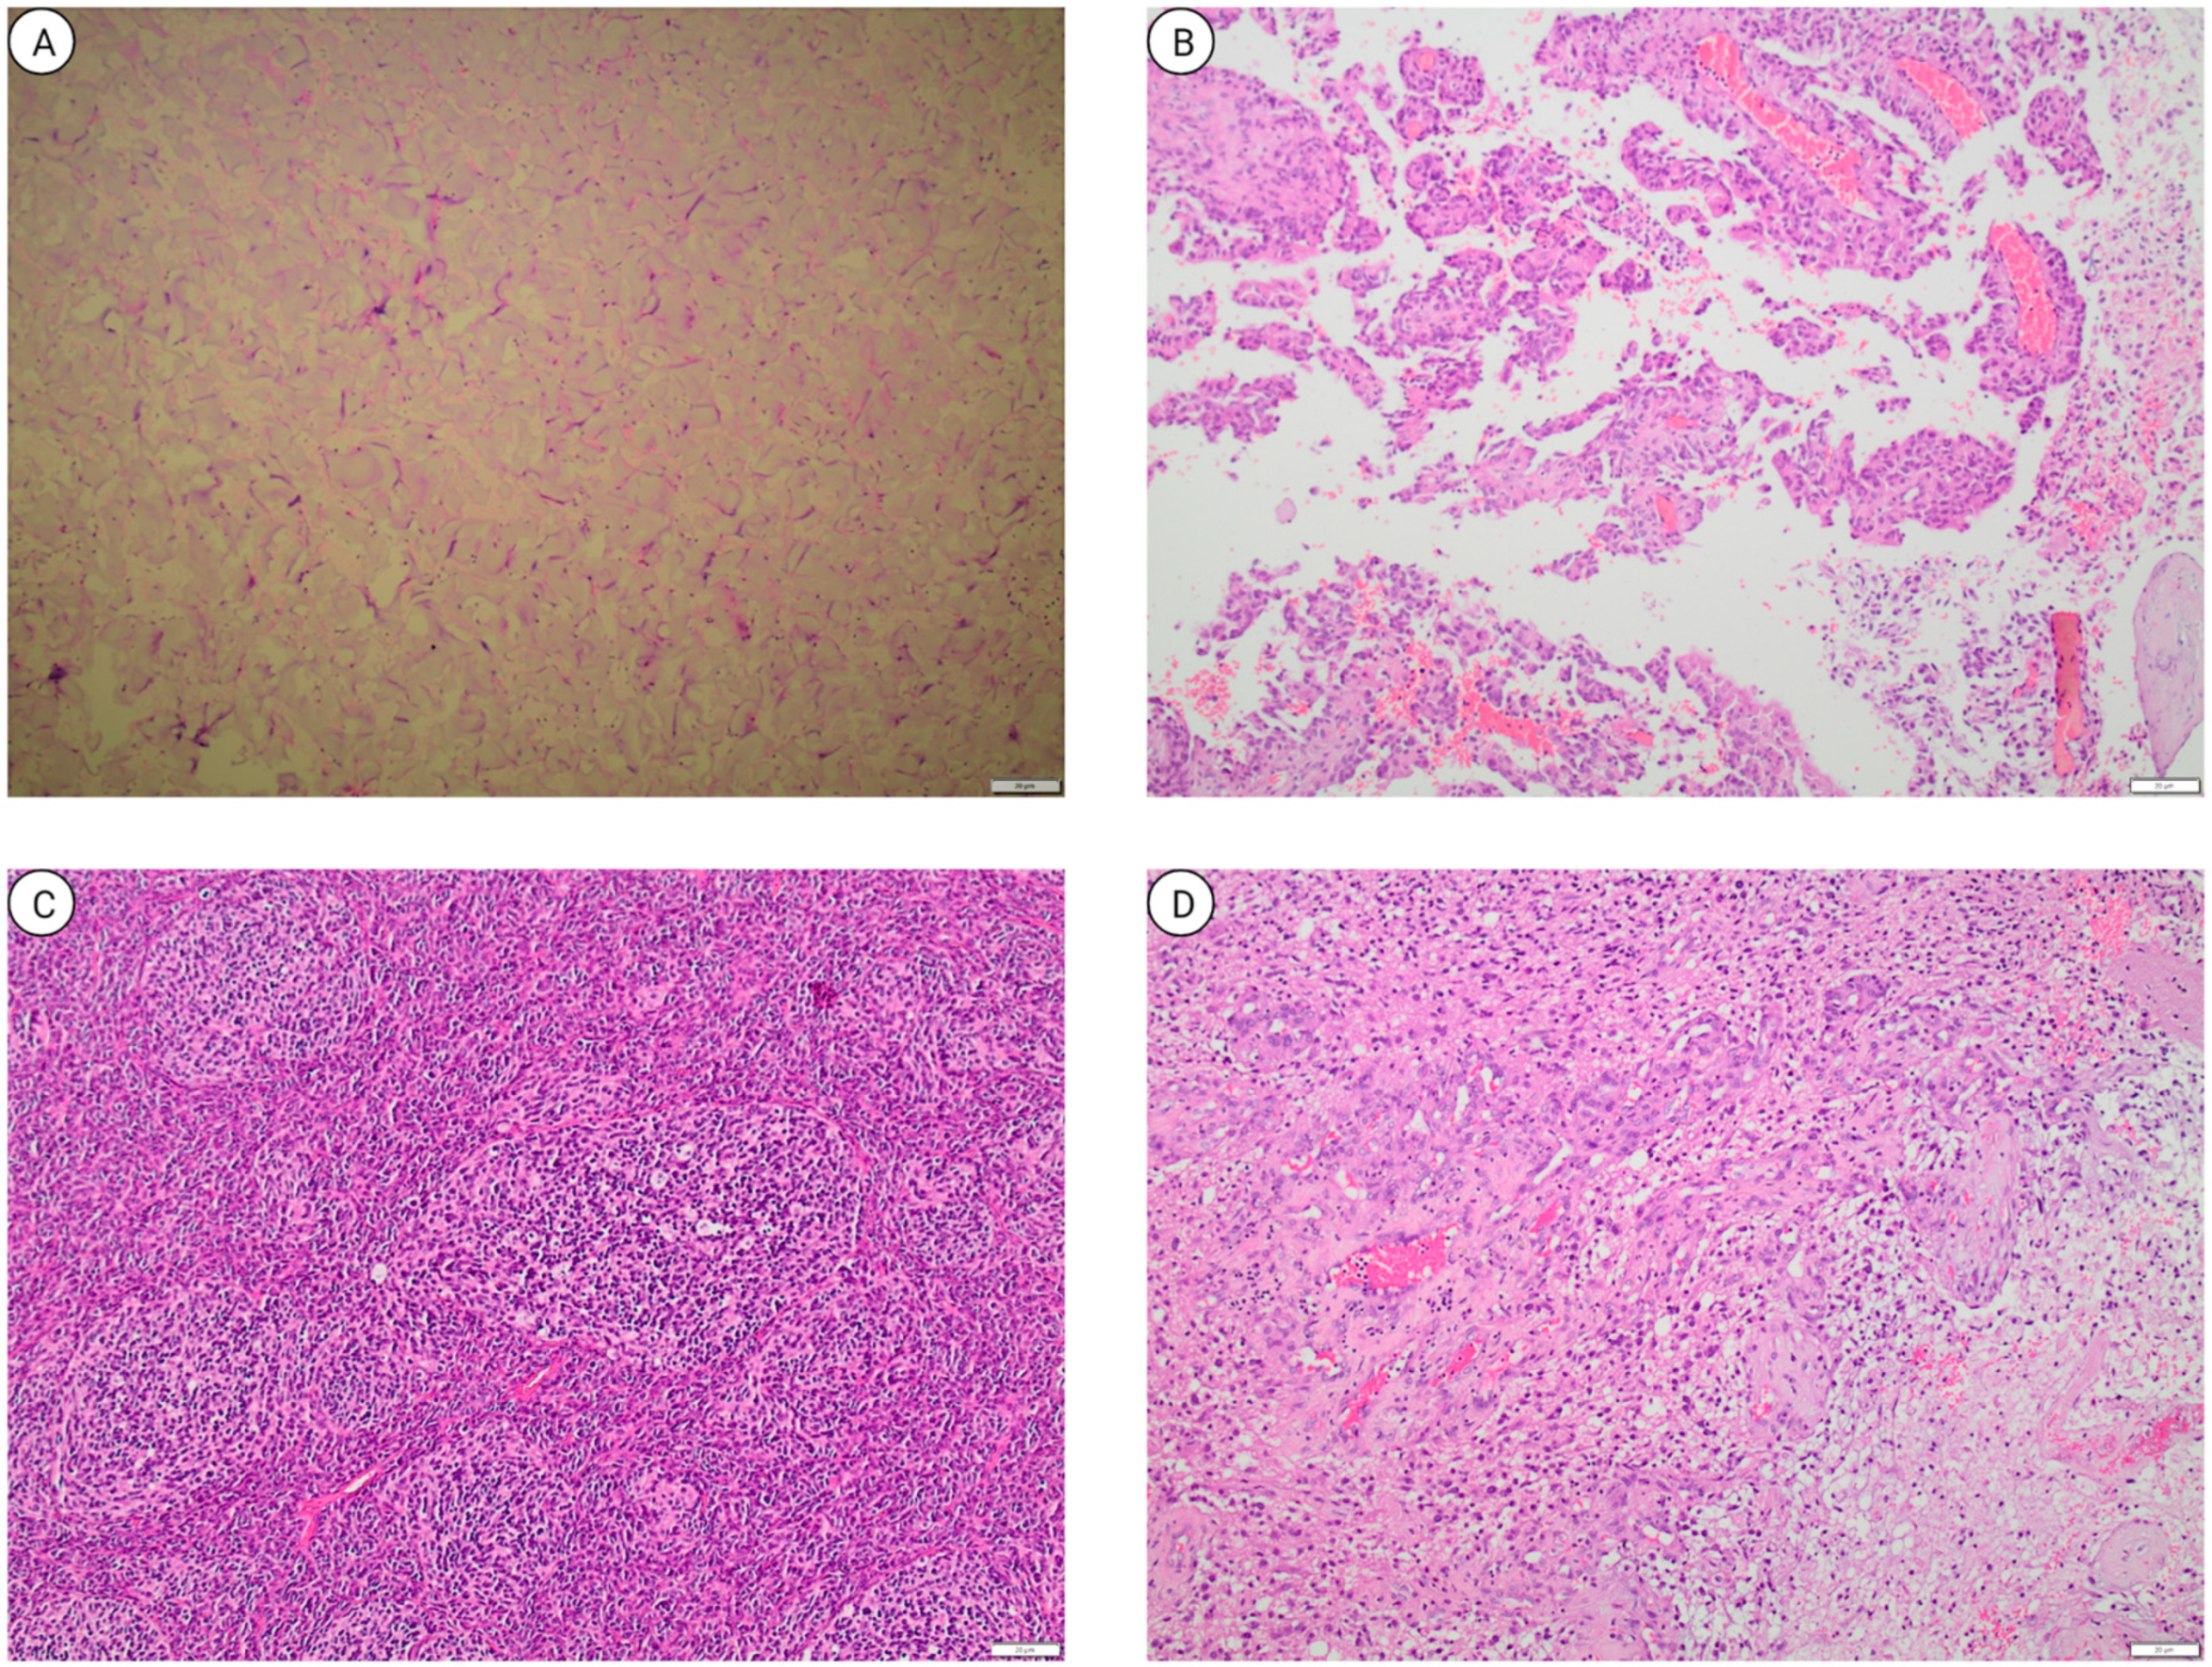
1.4. Pediatric Brain Tumor Pathology

The pathology of pediatric brain tumors varies significantly among tumor types. PA accounts for one-third of pediatric gliomas and is defined as a low-grade (Grade I) astrocytoma showing a biphasic pattern with variable proportions of compacted bipolar cells with Rosenthal fibers and loose, textured multipolar cells with microcysts and occasional granular bodies [25,35]. Its most common location is the cerebellum and cerebral midline structures and an often-encountered genetic change is tandem duplication of 7q34 resulting in BRAF fusion proteins that drive PA oncogenesis [36].
EPN is composed of uniform small cells with round nuclei in a fibrillary matrix and is characterized by perivascular anucleate zones (pseudorosettes) and less frequently ependymal rosettes [25]. It is located supratentorially, in the spinal canal of the posterior fossa, with the latter being more common in children [37]. Of the molecular groups described after DNA methylation profiling, pediatric EPNs usually fall into ST-EPN-RELA, ST-EPN-YAP1, PF-EPN-A, PF-EPN-B and SP-EPN groups [38].
MDB is one of the most common malignant pediatric brain tumors (Grade IV), with >65% of cases diagnosed earlier than the 16th year of age [39]. It is defined as an embryonal neuroepithelial tumor arising in the cerebellum or dorsal brain stem, presenting mainly in childhood and consisting of densely packed small round undifferentiated cells with mild to moderate nuclear pleomorphism and a high mitotic count [25]. It is currently subdivided in four main histologic types (classic MDB, desmoplastic/nodular MDB, MDB with extensive nodularity, large cell/anaplastic MDB) and four genetic types [MDB WNT-activated, MDB SHH-activated and TP53-mutant, MDB SHH-activated and TP53-wildtype and MDB non-WNT/non-SHH (groups 3 and 4)] [25].
GBM is a high-grade (Grade IV) glioma, commonly located on hemispheres, with predominantly astrocytic differentiation that is characterized by nuclear atypia, cellular pleomorphism, mitotic activity, microvascular proliferation, and necrosis. On adults, GBMs are predominantly categorized as IDH-wildtype and IDH-mutant, but pediatric GBM differs from adult GBM both concerning location (pediatric tumors are frequently located in the midline structures) and genetic findings, as IDH1/2 mutations are uncommon, showing alterations in genes coding for proteins involved in chromatin and transcription regulation, receptor tyrosine kinase/RAS/MAPK or retinoblastoma protein/p53 pathways [25]. The main histological characteristics of pediatric brain tumors are shown below (Figure 1).
Taken together, the heterogeneity and dismal prognosis of most pediatric brain tumors as well as the constant need for identification of molecular biomarkers and associated gene regulatory mechanisms, we proceeded to investigate the expression of zinc finger-containing genes among pediatric brain tumors in available datasets, along with associated biological processes and pathways in order to identify potential pathogenic targets.

2. Materials and Methods

2.1. Dataset Queries

In order to identify proper datasets for the evaluation of zinc finger protein expression in various pediatric brain tumors, we utilized the European Nucleotide Archive (ENA) [40] and ArrayExpress [41] advanced search engines. The datasets would ideally include pediatric tissue samples from both low- and high-grade gliomas, while also additionally providing non-tumor control samples. Initially, both RNA-Seq and Microarray datasets were preferred for performing the subsequent analyses. The queries were intended to narrow down the results and exclude experiments, platforms, and materials that were irrelevant to the purposes of this study (Supplementary Materials, Table S1). The ArrayExpress query generated 38 accessions, and the ENA queries overlap generated 668 accessions. All results were thereafter manually curated.

2.2. Zinc Finger Information Acquisition

In order to properly identify zinc finger-containing gene groups and subgroups, we accessed HUGO Gene Nomenclature Committee’s (HGNC) website https://www.genenames.org [42] (last accessed on 19 November 2021). By utilizing and manually curating both the information in HGNC’s zinc finger-containing gene group [43] and Cassandri et al. “Zinc-finger proteins in health and disease” publication [44], we have updated the data according to the most recent scientific evidence (Table 1).
In total 30 different gene groups and subgroups are approved by HGNC, containing 1539 genes classified based on the zinc finger domain structure. It is worth mentioning that some genes belong to more than one type of zinc finger such as UHRF1, TRIM24, ZCCHC4, ZMYND11, etc. The most substantial group is zinc fingers C2H2-type containing the ZNF proteins and having in total 748 zinc finger genes. In this work, each zinc finger gene was tested as a potential human TF and was characterized according to strict rules. More specifically, for each gene to be considered as a TF had to be clearly reported as such either in TRANSFAC [45] OR in UniProt Knowledge Base (UniProtKB) [46] AND in Alliance of Genome Resources (Alliance) [47] AND in Gene Ontology (GO) [48,49,50]. In total 887 TFs were recognized by TRANSFAC and 409 by the other databases. This significant difference between the results is mainly because UniProtKB identifies the vast majority of ZNFs as potential TFs.

2.3. Microarray Analysis

For the analysis of the final dataset, a variety of tools and algorithms were utilized. The majority of the tools used in this work are packages provided by the Bioconductor (BiocManager version 3.14) [51] suite for the R (version 4.1.1) statistical programming language [52]. Code in R was executed through the RStudio IDE (version 2021.09.0+351) [53]. Furthermore, GEO2R [54,55] was utilized both locally and at its respective platform for further visualizations and data acquisition.

2.3.1. Raw Data Quality Assessment and Normalization

Several Quality Control (QC) techniques were implemented to properly evaluate the data used in this study. Principal Components Analysis (PCA) plots were created with the PCAtools (version 2.6.0) [56] Bioconductor package, and Uniform Manifold Approximation Projections (UMAP) were drawn by the umap (version 0.2.7.0) R package [57] (Supplementary Materials, Figure S1). Boxplots representing the distribution of sample values before and after normalization were created using the boxplot (graphics version 3.6.2) R package [58]. Density plots were created with the limma (version 3.50.0) Bioconductor package [59] (Supplementary Materials, Figure S2). Any outliers were excluded from subsequent analyses.

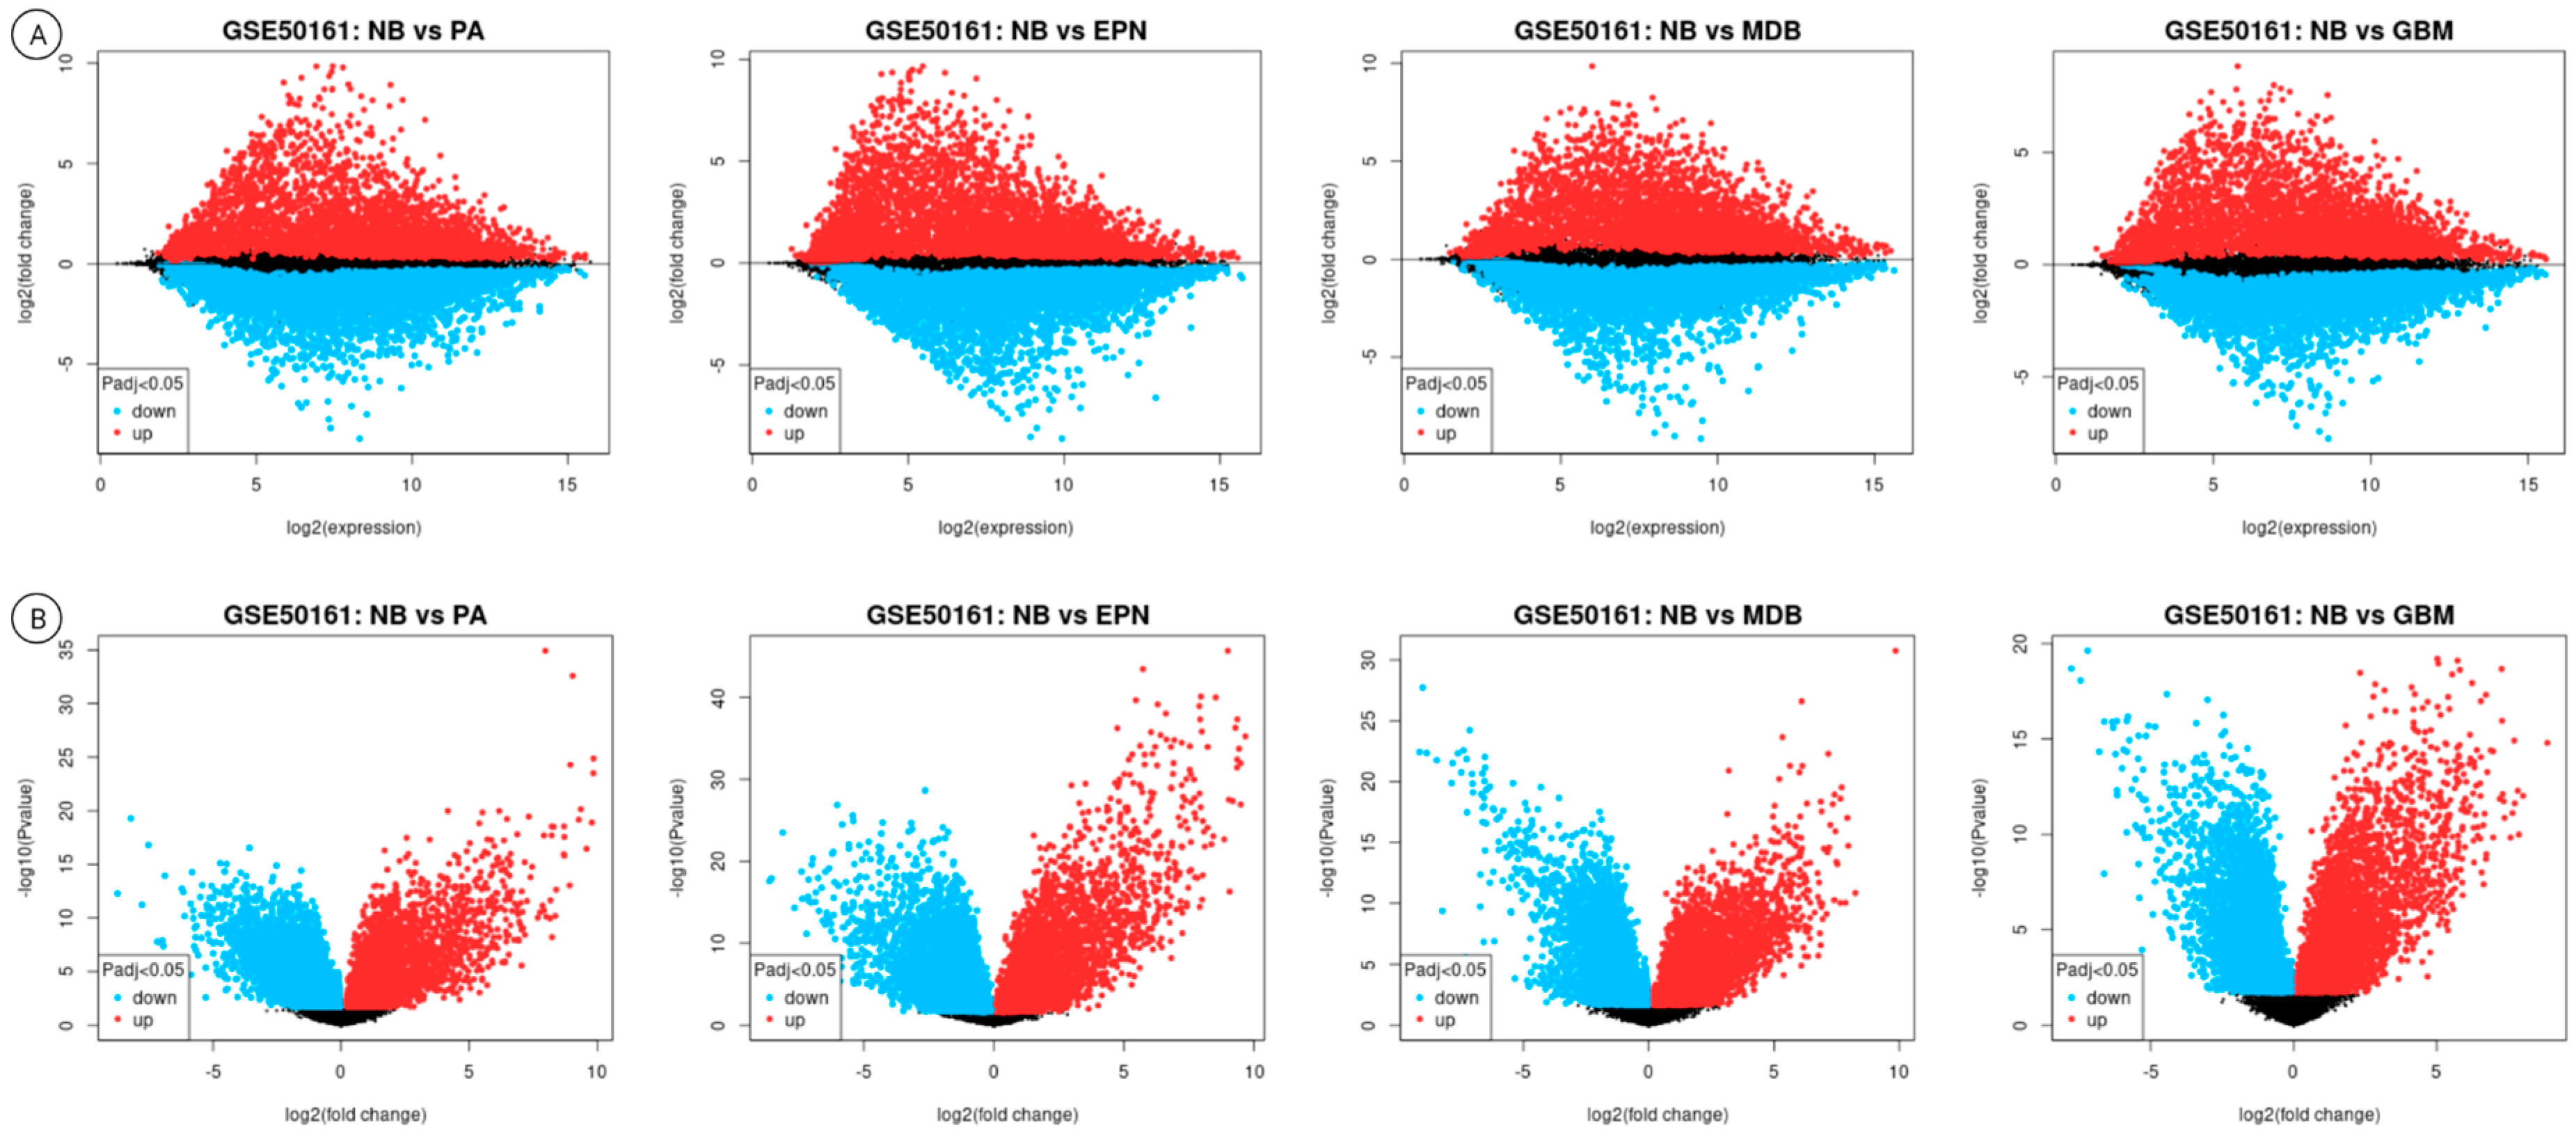
2.3.2. Differential Gene Expression Analysis

Adjusted p-values were produced by the Benjamini and Hochberg False Discovery Rate (FDR) [60] method via the limma Bioconductor package. Log2 Fold Change (Log2FC) values were produced with the limma Bioconductor package. To achieve similar distribution across the arrays set, expression intensities were normalized by applying quantile normalization via the limma Bioconductor package, a process that normalizes expression values to achieve consistency between arrays.

2.3.3. Functional Enrichment Analysis and Gene-Disease Networks Construction

For the functional enrichment analysis (also Gene Set Enrichment Analysis—GSEA [61]) we used the publicly available tool WebGestalt (http://www.webgestalt.org) [62] (last accessed on 17 November 2021). The method of choice was the Over-Representation Analysis (ORA) [63], an approach that can determine whether known biological functions and/or processes are enriched in an experimentally-derived gene list more than would be expected by chance. Parameters for the analysis were: Gene Ontology (Biological Process no Redundant) and Pathway (KEGG) [64] using as microarray reference platform the Affymetrix Human Genome U133 Plus 2.0 Array. Furthermore, input p-values were adjusted with the Benjamini and Hochberg FDR method, and those that exceeded the adjusted p-value < 0.01 threshold, were regarded as statistically significant.
Furthermore, gene-disease networks were constructed by associating the zinc finger-containing genes (p-value < 0.005) and the 4 types of brain tumors: PA, EPN, MDB and GBM, using the open-source software platform Cytoscape [65]. Disease networks, such as the ones presented here, are formed by diseases and their associated genes and usually are shown as bipartite/heterogeneous networks [66,67] that facilitate the prediction of possible relationships between entities of different types, such as diseases and genes, following a guilt-by-association paradigm [68]. In the final constructed networks, genes are represented as circles—where each different color represents a different family, diseases are represented as hexagons, while edges are colored red when gene expression is down-regulated, and green when up-regulated. In addition, in the combined network, the size of the nodes is in accordance with their degree (the degree of a node is the number of connections that it has to other nodes in the same network). The graph layout chosen for constructing the uncombined networks was the Prefuse Force Directed Layout [69], while the Edge-weighted Spring-Embedded algorithm [70] was utilized for the larger scale combined network. In all cases, weights were calculated according to each association’s p-value, so that genes with stronger evidence of association are closer to the disease nodes. A final editing to the illustrations was performed in Inkscape [71].

3. Results

3.1. Final Dataset

The ArrayExpress query identified 38 accessions and the ENA queries identified 668 overlapping accessions. Unfortunately, after manually curating the ENA queries, data were either restricted (and/or had limited access) or were not suitable for the purposes of this study and therefore were excluded. Subsequent analyses were performed on the publicly available E-GEOD-50161 microarray dataset (Affymetrix Human Genome U133 Plus 2.0 Array - Platform GPL570) [72]. This dataset consists of 15 Pilocytic Astrocytomas (PAs), 46 Ependymomas (EPNs), 22 Medulloblastomas (MDBs), 34 Glioblastomas (GBMs) and 13 Normal Brain (NB) control samples.

3.2. Differential Gene Expression Results

Differentially expressed genes were identified for these four distinct combinations: NB vs. PA, NB vs. EPN, and NB vs. MDB (Supplementary Materials, Spreadsheet S1). Mean Difference (MD) and volcano plots (Figure 2) were generated by utilizing the limma Bioconductor package embedded in GEO2R.

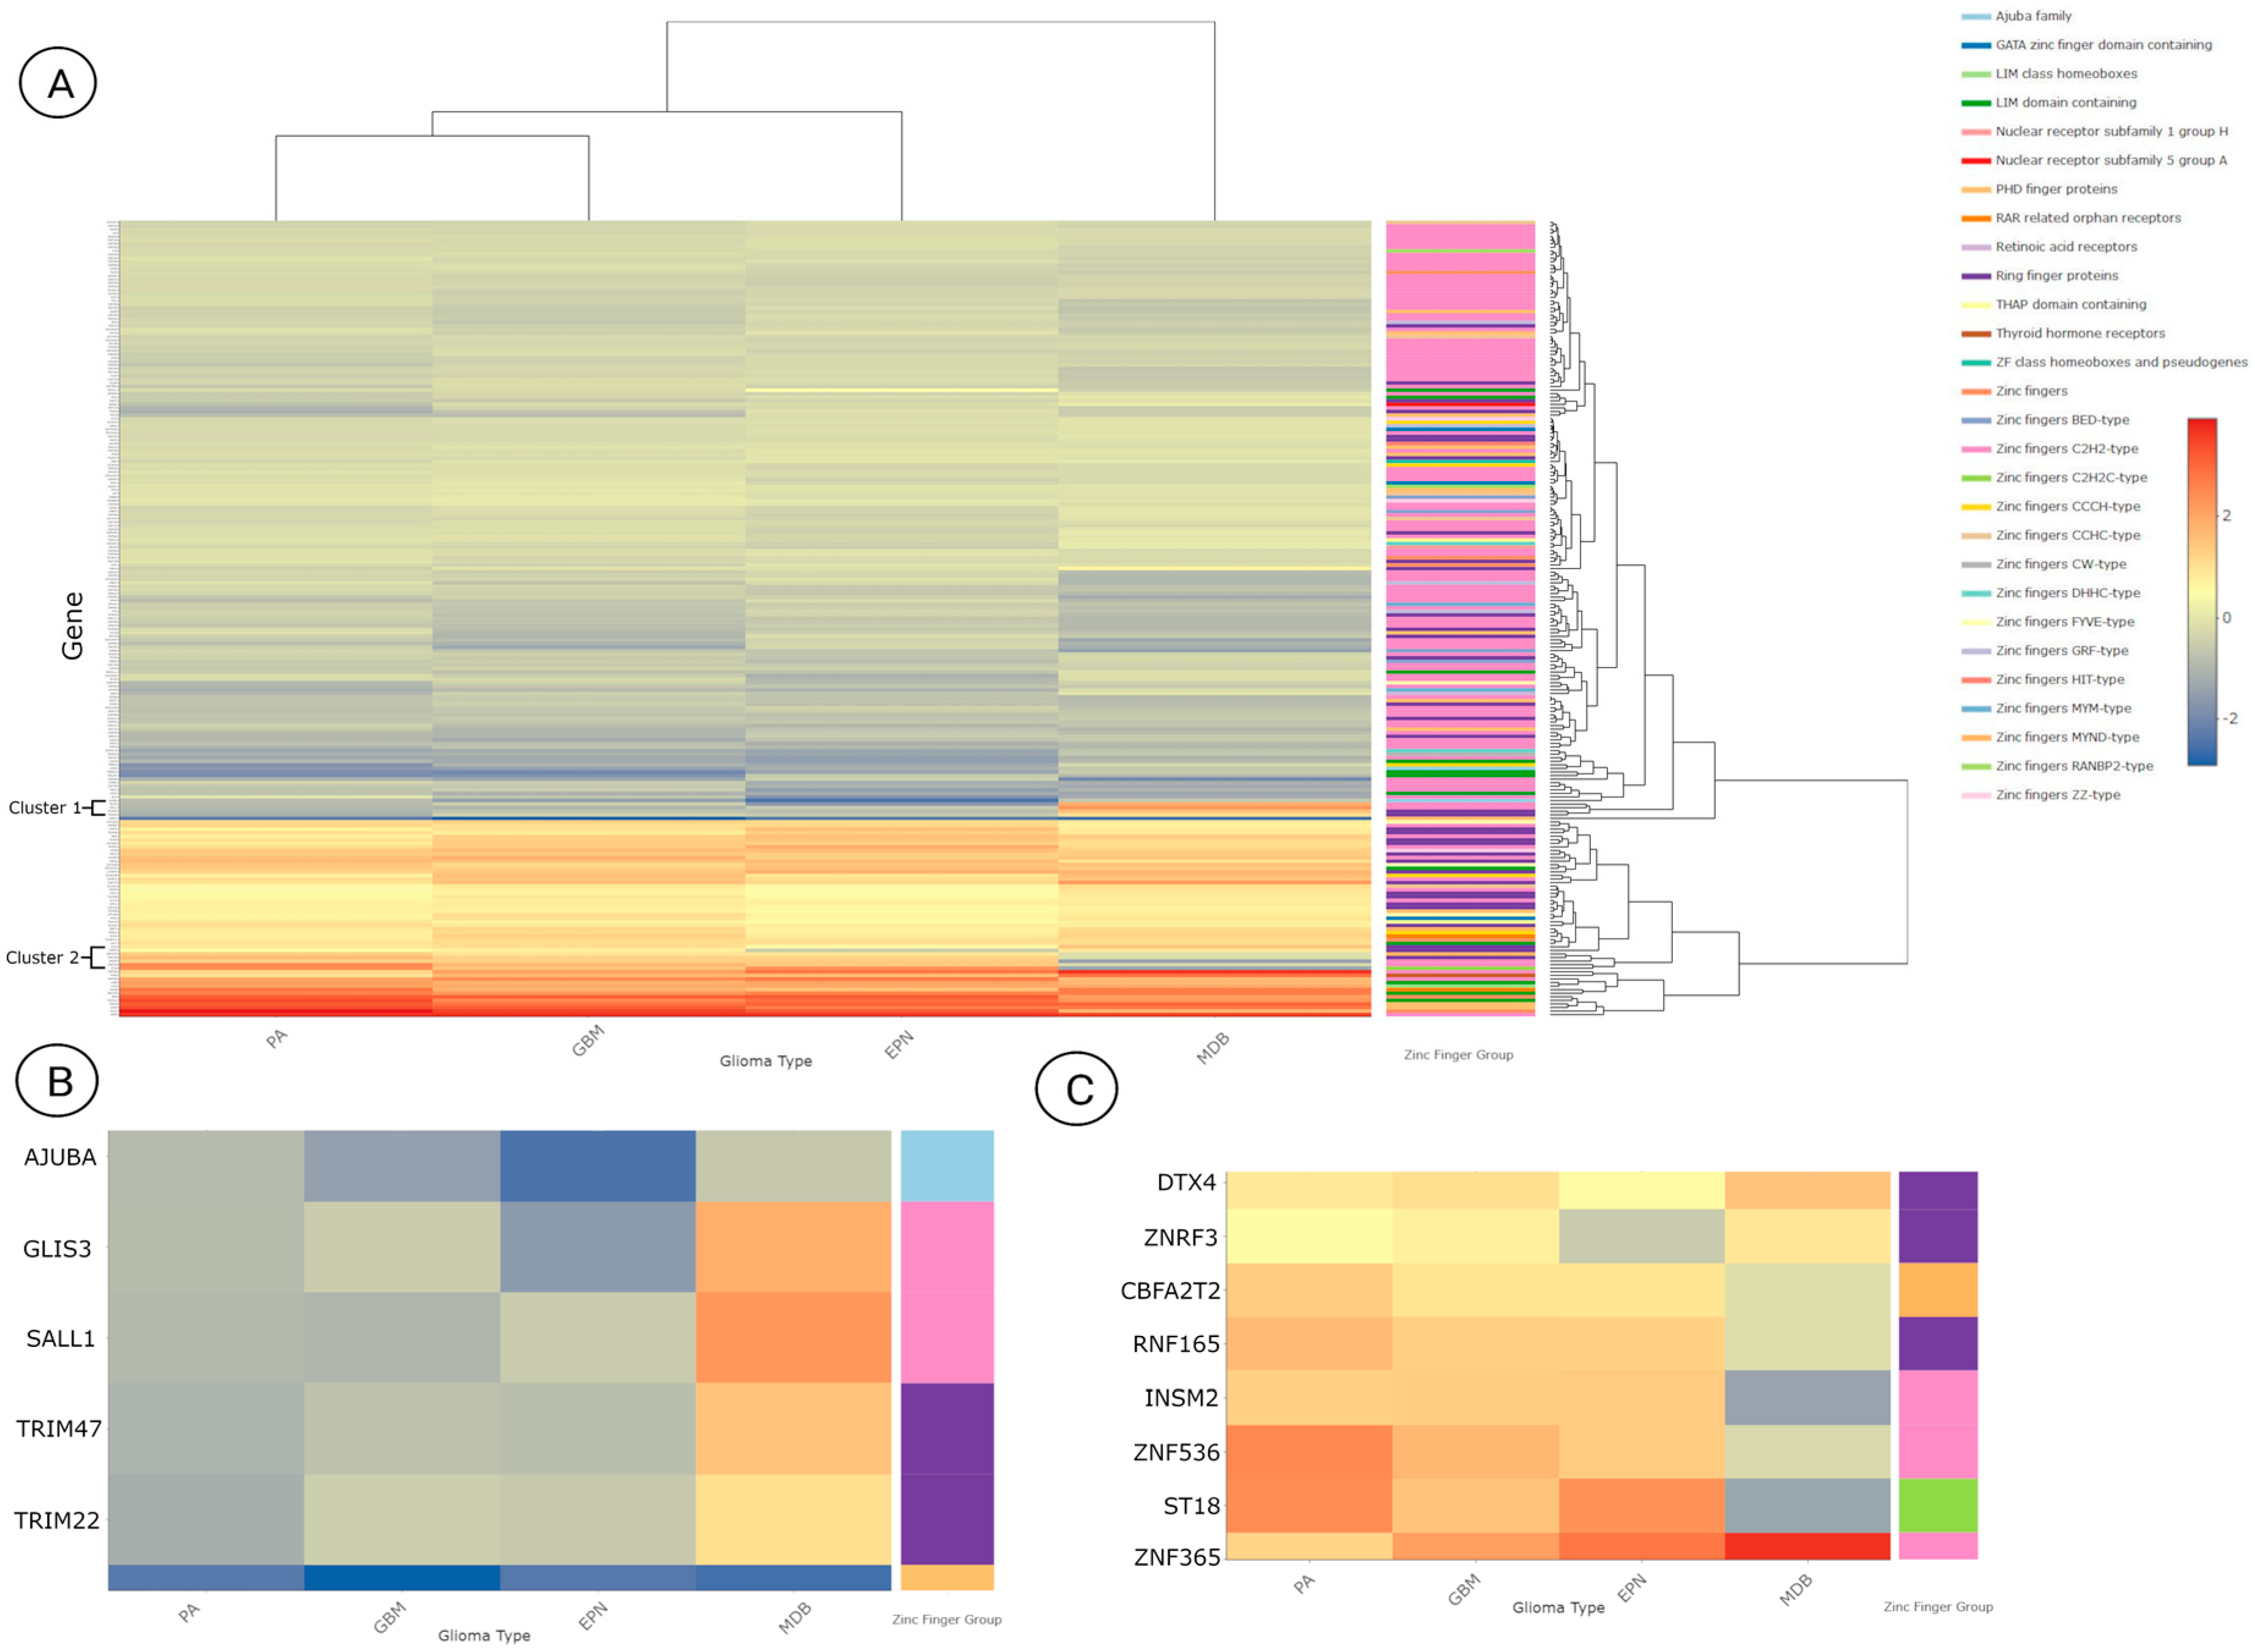
3.3. Differentially Expressed Zinc Finger-Containing Genes

To properly identify zinc finger-containing genes expression in distinct conditions, we utilized the HGNC’s zinc finger-containing gene group list and matched it with our differential expression analysis results (Supplementary Materials, Spreadsheet S2).
To demonstrate trends and differences amongst brain tumor types, differentially expressed zinc finger-containing genes and types were visualized with heatmaps (Figure 3) using the heatmaply (version 1.3.0) R package [73]. Common up-regulated and down-regulated genes between brain tumor differential expression results that also met the additional criteria of having adjusted p-values < 0.05 and LogFC > 1 or < −1 were included.

3.4. Over-Representation Analysis

By importing the differentially expressed zinc finger-containing gene lists in WebGestalt, we identified enriched biological processes/pathways (Table 2). Part of the resulting information is the intersections and unions of biological processes/pathways in the four brain tumor types. Specifically, GO:0051865, GO:0000209, GO:0018205, GO:0048545, GO:0030522, GO:0016569, GO:0009755, and GO:0006513 (8) were common in PA, EPN, MDB and GBM. GO:0052192 and hsa05202 (2) were common in PA, EPN and GBM. GO:0006352, GO:0021953, GO:0008213, GO:0043543, GO:0040029, and GO:0045444 (6) were common in EPN, MDB, and GBM. GO:0010498 and GO:0009896 (2) were common in PA, and EPN. hsa04120 is common in PA, and GBM. GO:0032259 and GO:1903706 (2) are common in MDB, and GBM. GO:0032606 is unique for PA. GO:0048732, GO:0006302, GO:0000726, and GO:0018198 (4) are unique for EPN. GO:1990823, GO:0030099, GO:0033044, GO:0071514, GO:0006397, GO:0010948, and GO:0098727 (7) are common in MDB.

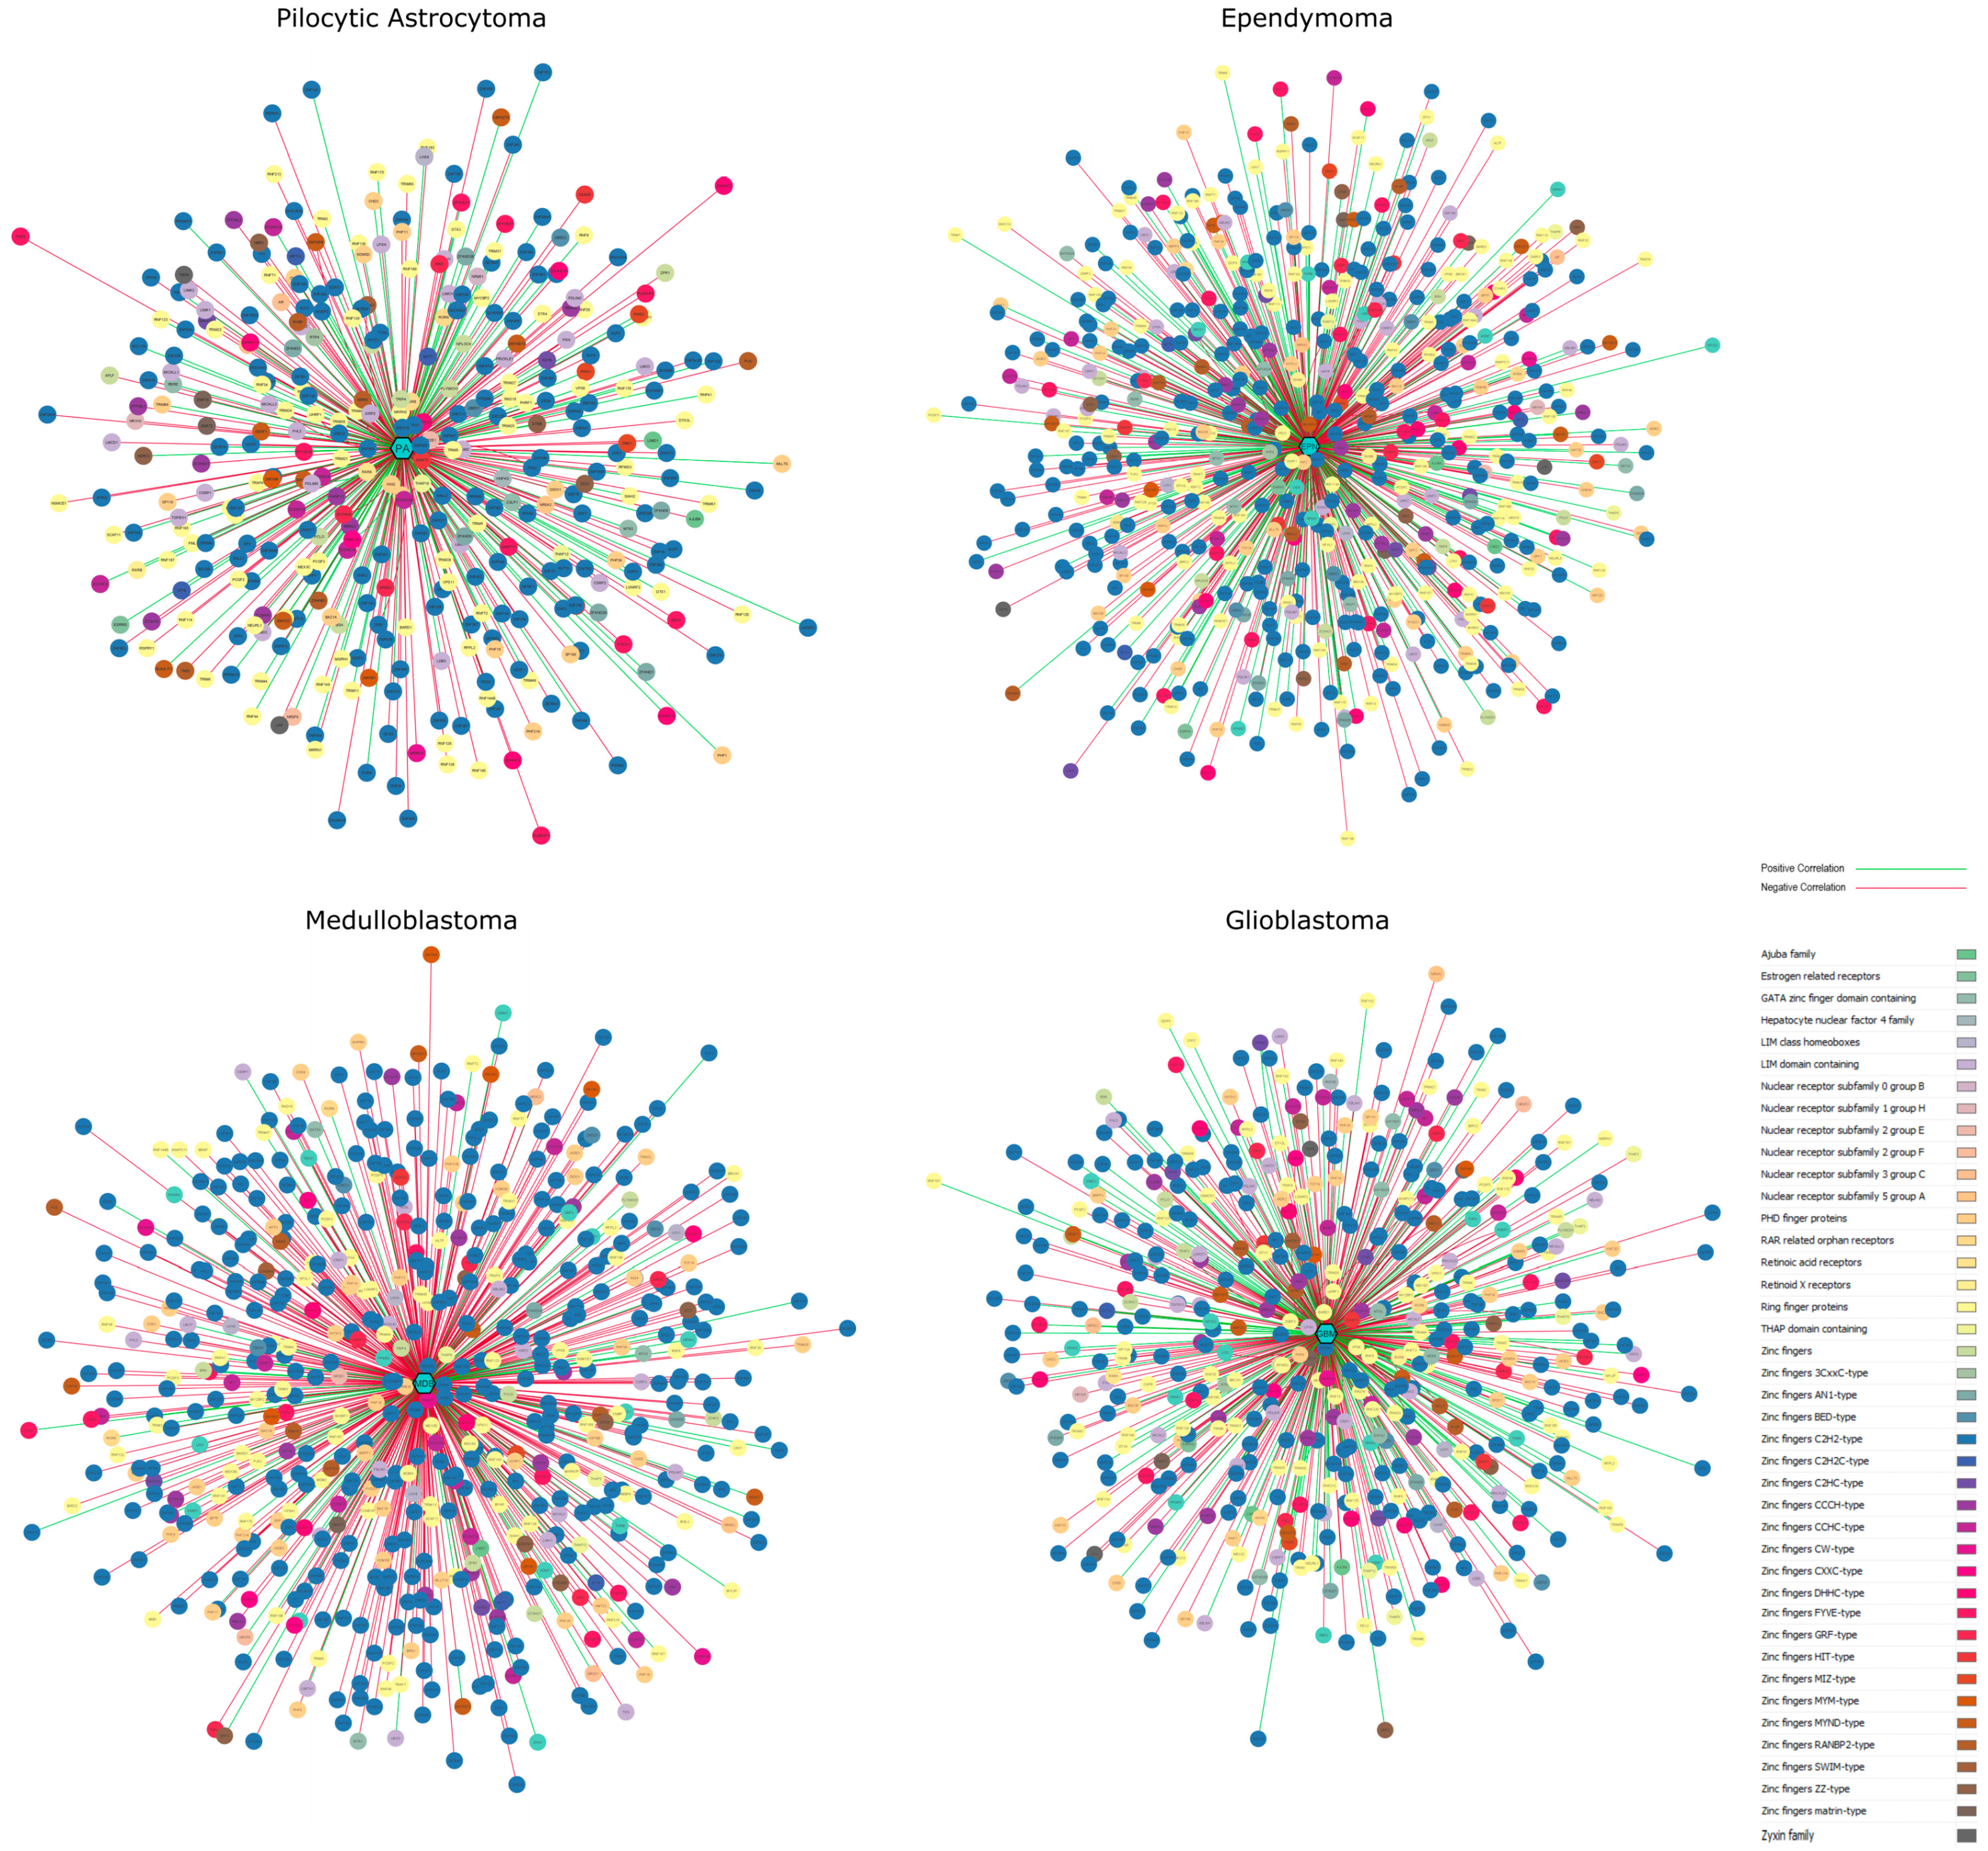
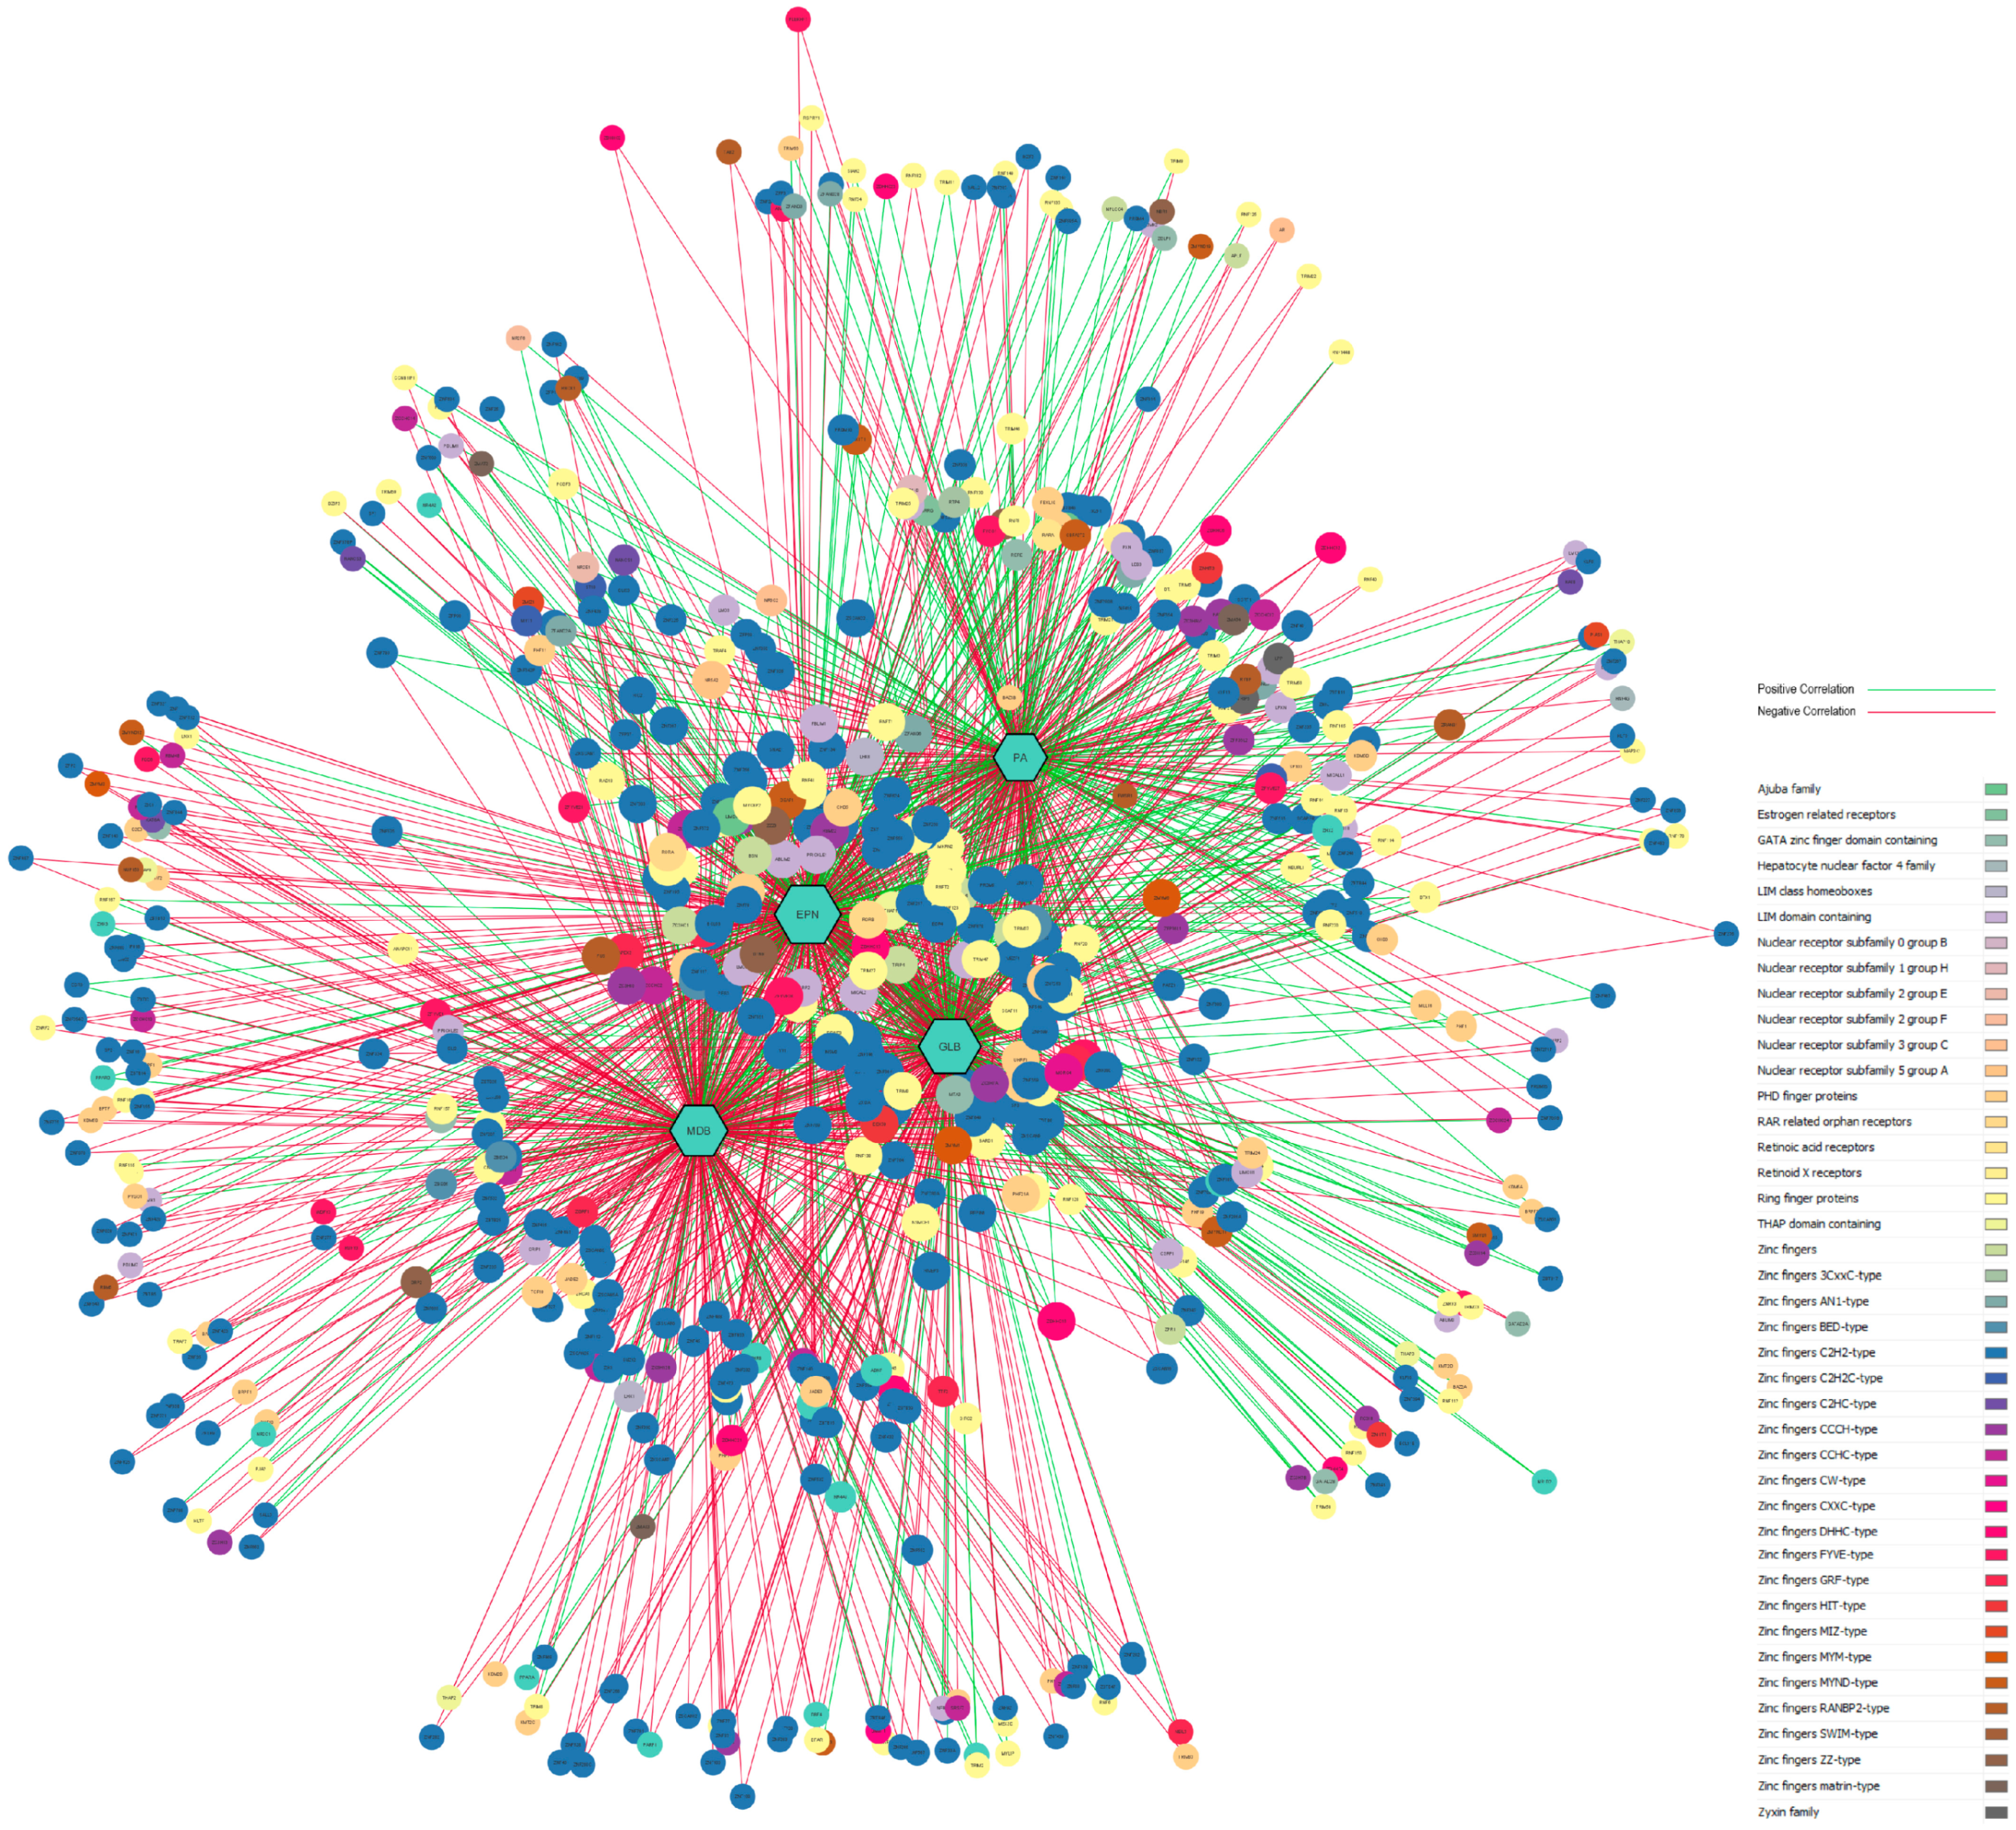
3.5. Gene-Disease Network Analysis

In total, five different zinc finger-containing gene-disease association networks were constructed, by utilizing the filtered zinc finger-containing gene lists that have had the highest statistical significance (p-value < 0.005). The first four networks (Figure 4) show each disease’s associations separately (PA, EPN, MDB, GBM), and the final combined network (network presents a more balanced distribution, where 52% of the edges show a negative correlation. The second network (Figure 5) is constructed with genes that are expressed in more than one type. More specifically, the PA network consists of 361 nodes connected with 372 edges, the EPN network consists of 572 nodes and 586 edges, the MDB network consists of 574 nodes and 573 edges, the GBM network consists of 479 nodes and 501 edges, and the combined network contains 591 nodes and 1659 edges. All four types of brain tumors relate to a similar number of zinc finger-containing genes; although, a slight deviation is observed in the PA network having the smallest number of associations.
Homogeneity can also be observed in the distribution of nodes and the edges’ length in the graph, as genes that show the highest correlation are similar in all brain tumor types (and therefore similar in the combined network), so the representative nodes are closer to the disease nodes in all graphs. The combined network also delineates that the brain tumor types with the highest similarity are MDB and GBM, as also portrayed by their nodes’ adjacency and proximity at the graph’s center, after the Edge-weighted Spring-Embedded algorithm’s implementation. Among all the interactions, the most prevalent zinc finger-containing group, is the zinc fingers C2H2-type family, with 905 interactions in the four gene-disease networks and 727 interactions in the combined network, a 44% percentage in both cases. Regarding edges color, in the PA, EPN and GBM networks ~61% are down-regulated (shown in red), while in the MDB network 80% are down-regulated. The combined network presents a more balanced distribution, where 52% of the edges show a negative correlation.

4. Discussion

Gene level analysis revealed that up- or down-regulation of zinc finger-containing genes presents a similar trend for all brain tumor types. By examining the produced heatmap, there is significant clustering in multiple locations (like the higher up-regulation of PA zinc finger-containing genes e.g., MICAL2, CHD5, RORB, and ABLIM2 compared to the other conditions) with two highly visible gene clusters that reveal a contrast in regulation between MDB and the other three types of brain tumors. In the first cluster, the genes GLIS3, SALL1, TRIM47, and TRIM22 are upregulated in MDB compared to PA, EPN and GBM. In the second cluster, the genes INSM2 and ST18 are significantly downregulated in MDB compared to PA, EPN and GBM, while the genes CBFA2T2, RNF165 and ZNF536 show a similar trend, respectively. Up to date, there are no experimental data regarding these genes in medulloblastomas. However, some evidence exists only for adult GBM, with SALL1 expression being downregulated in GBM tissues and correlated with reduced survival [74] and TRIM47 being associated with different glioma grades and poor prognosis [75]. Furthermore, TRIM22 has been detected as an NF-κB activator in GBM cell lines, involved in cell proliferation [76]. The downregulation of ST18 in MDB which is a related MyT1 family member implicated in the regulation of neuronal differentiation, reflects a general neuronal disease relevance of zinc finger proteins.
A statistically significant zinc finger-containing gene, common in all four brain tumor categories, is ABLIM2 (Actin-binding LIM protein) which encodes for a scaffold protein that is highly implicated in cell polarization, migration, and invasion of cancer cells. It has been recently investigated in GBM where it is upregulated and involved in the process of cell invasion. Silencing of ABLIM2 was further shown to diminish GBM spread, thus representing a potential therapeutic target [77].
By importing the differentially expressed zinc finger-containing gene lists in WebGestalt, we identified enriched biological processes/pathways (Table 2). Examining more closely the biological processes GO:0000209 (protein polyubiquitination), GO:0051865 (protein autoubiquitination), and GO:0006513 (protein monoubiquitination), common in all four brain tumor types, the recurrence of ubiquitin processes cannot be overlooked. Ubiquitination can be described as a dynamic and reversible process of a specific modification of target proteins catalyzed by a series of ubiquitination enzymes and plays a role in the localization, metabolism, regulation, and degradation of proteins [78]. Furthermore, E3 ubiquitin ligases (and deubiquitinating enzymes) are emerging as promising sources of novel drug targets [79].
Regarding the above information and upon closer inspection of the differentially expressed zinc finger-containing gene lists, UHRF1 (Ubiquitin-like with PHD and Ring Finger Domains 1) is amongst the most statistically significant dysregulated genes across all four conditions. E3 ubiquitin-protein ligase UHRF1 plays a role in DNA methylation and takes part in chromatin modification through its tudor-like regions and PHD-type zinc finger domains. It specifically recognizes and binds to histone H3 trimethylated at ‘Lys-9’ (H3K9me3) and unmethylated at ‘Arg-2’ (H3R2me0) [80,81,82]. Downregulation of UHRF1 enhances the migratory and invasive properties of human cancer cells by inducing Epithelial-Mesenchymal Transition (EMT) [83]. The emergence of UHRF1 as a potential cancer drug target derives from several studies demonstrating that knockdown or silencing of UHRF1 in cancer cells led to reduced proliferation and increased apoptosis [84]. Despite being a controversial topic, UHRF1 remains a potential candidate to be considered as a universal biomarker for cancer [83,85].
Moreover, a common biological pathway in PA and GBM, hsa04120 (ubiquitin-mediated proteolysis), further ascertains the importance of ubiquitin regulation. This pathway implicates some highly regulated zinc finger-containing genes discovered in our differential gene expression analysis, like PIAS1, TRIM37, MAP3K1, MGRN1, HERC2, MDM2 in both conditions; PML and PIAS2 in PA; BRCA1, ANAPC11, and BIRC2 in GBM.
These findings indicate the possible dysregulation, and thus the involvement of the Ubiquitin-Proteasome System (UPS) in pediatric brain tumors, further supporting other studies that already implicate UPS as a therapeutic [79] or prognostic target [78] in brain tumors.
Finally, gene-disease networks offer a simple and efficient visual reference of the genetic interactions between specific diseases and their associated genes [67]. Genes associated with the same disorders show a higher possibility to physically interact or to be involved in the same biological processes. Graph theory and interaction networks act as an important tool to clarify the role of disease genes in the appearance, development, and treatment and to identify possible biomarkers. The combined network reveals MDB and GBM as highly statistically similar conditions (also portrayed by their nodes’ adjacency and proximity at the graph’s center) while also describing the zinc finger C2H2-type family as the most prevalent. The fold group consists of domains found in many TFs and in other DNA-binding proteins while recently, it was highlighted an emerging role in Protein–Protein Interactions (PPIs).
On a final note, previous identification of zinc finger-containing genes such as GLI3, ZEB1, ZFAND3, and ZHX1 which were experimentally associated with adult gliomas, were also differentially expressed in one or more conditions in our analysis, indicating some common elements between adult and pediatric brain tumorigenesis.

5. Conclusions

By using an extended bioinformatic toolset, we identified the high involvement of zinc finger domains in genes involved in the pathogenesis of main pediatric brain tumors. Furthermore, we have updated some existing data regarding zinc finger-containing gene families, while also briefly delineating some aspects of zinc finger-containing genes and the relevant pathways involved in pediatric brain tumor research’s current state. Careful curation and bibliographic research assisted by the functional enrichment analyses results revealed interesting evidence on the role of ubiquitin regulation in all brain tumors. However, the construction and interpretation of specific results (e.g., the produced Gene-Disease network) requires a significantly less broad research subject and a larger dataset. The most important findings regarding our research in zinc finger-containing genes’ implications in brain tumors were summarized in the discussion. The information and interactions extracted from the E-GEOD-50161 dataset, while informative, lacked some level of sensitivity due to inherent microarray analysis limitations. Techniques like RNA-Seq, which offer higher sensitivity and dynamic range at the transcript level will be further employed to validate current findings and shed light as to why certain genes (i.e., UHFR1) exhibit aberrant regulation in certain brain tumors.

Supplementary Materials

The following are available online at https://www.mdpi.com/article/10.3390/dna2010001/s1, Table S1: The queries that were used for the identification of the raw data used in this study, Figure S1: QC results, Figure S2: Boxplot and density plots before/after normalization, Spreadsheet S1: Differential gene expression analysis results, Spreadsheet S2: Differentially expressed zinc finger-containing genes.

Author Contributions

Conceptualization, C.P. and D.S.K.; methodology, D.S.K., A.P., T.L., D.M.V. and C.P.; software, D.S.K., A.P., T.L., D.M.V. and M.C.; validation, D.S.K. and A.P.; formal analysis, D.S.K., A.P., T.L., D.M.V. and M.C.; investigation, D.S.K., A.P. and M.C.; resources, E.L. and P.K.; data curation, D.S.K. and A.P.; writing—original draft preparation, D.S.K., A.P., L.S.M., E.L., P.D.G., A.K., A.-I.G. and C.P.; writing—review and editing, D.S.K., P.K. and C.P.; visualization, D.S.K., A.P., E.L., T.L. and D.M.V.; supervision, D.S.K. and C.P.; project administration, D.S.K.; All authors have read and agreed to the published version of the manuscript.

Funding

This research received no external funding.

Conflicts of Interest

The authors declare no conflict of interest.

Abbreviations

AllianceAlliance of Genome Resources
ATRTAtypical Teratoid/Rhabdoid Tumors
CNSCentral Nervous System
DAGDiacylglycerol
DIPGsDiffuse Intrinsic Pontine Gliomas
DNETDysembryoplastic Neuroepithelial Tumors
EMTEpithelial-Mesenchymal Transition
ENAEuropean Nucleotide Archive
EPNsEpendymomas
FDRFalse Discovery Rate
GBMsGlioblastomas
GLI3GLI Family Zinc Finger 3
GOGene Ontology
GSEAGene Set Enrichment Analysis
HGNCHUGO Gene Nomenclature Committee
Log2FCLog2 Fold Change
MDMean Difference
MDBsMedulloblastomas
MyT1Myelin Transcription Factor 1
NF-κBNuclear Factor kappa B
NZF-1Neural Zinc Finger Factor-1
ORAOver-Representation Analysis
PAsPilocytic Astrocytomas
PCAPrincipal Component Analysis
PLPProteolipid Protein
PPIsProtein–Protein Interactions
QCQuality Control
RGPsRadical Progenitor Cells
SHHSonic Hedgehog
ST18Suppression of Tumorigenicity 18
TFsTranscription Factors
UHRF1Ubiquitin-like with PHD and Ring Finger Domains 1
UMAPUniform Manifold Approximation Projections
UniProtKBUniProt KnowledgeBase
UPSUbiquitin-Proteasome System
UTR3′ Untranslated Region
ZFAND3AN1/A20 Zinc Finger Domain Containing Protein 3
ZHX1Zinc Fingers and Homeoboxes Protein 1
β-RARβ-Retinoic Acid Receptor

References

  1. Isernia, C.; Malgieri, G.; Russo, L.; D’Abrosca, G.; Baglivo, I.; Pedone, P.V.; Fattorusso, R. Zinc Fingers. Met. Ions. Life Sci. 2020, 20, 415–436. [Google Scholar] [CrossRef]
  2. Roy, S.; Dutta, S.; Khanna, K.; Singla, S.; Sundar, D. Prediction of DNA-binding specificity in zinc finger proteins. J. Biosci. 2012, 37, 483–491. [Google Scholar] [CrossRef]
  3. Persikov, A.V.; Wetzel, J.L.; Rowland, E.F.; Oakes, B.L.; Xu, D.J.; Singh, M.; Noyes, M.B. A systematic survey of the Cys2His2 zinc finger DNA-binding landscape. Nucleic. Acids. Res. 2015, 43, 1965–1984. [Google Scholar] [CrossRef] [PubMed] [Green Version]
  4. Mackay, J.P.; Crossley, M. Zinc fingers are sticking together. Trends Biochem. Sci. 1998, 23, 1–4. [Google Scholar] [CrossRef]
  5. Fu, M.; Blackshear, P.J. RNA-binding proteins in immune regulation: A focus on CCCH zinc finger proteins. Nat. Rev. Immunol. 2017, 17, 130–143. [Google Scholar] [CrossRef] [PubMed] [Green Version]
  6. Zhao, F.; Ilbert, M.; Varadan, R.; Cremers, C.M.; Hoyos, B.; Acin-Perez, R.; Vinogradov, V.; Cowburn, D.; Jakob, U.; Hammerling, U. Are Zinc-Finger Domains of Protein Kinase C Dynamic Structures That Unfold by Lipid or Redox Activation? Antioxid. Redox Signal. 2010, 14, 757–766. [Google Scholar] [CrossRef] [PubMed] [Green Version]
  7. Priem, D.; Devos, M.; Druwé, S.; Martens, A.; Slowicka, K.; Ting, A.T.; Pasparakis, M.; Declercq, W.; Vandenabeele, P.; van Loo, G.; et al. A20 protects cells from TNF-induced apoptosis through linear ubiquitin-dependent and -independent mechanisms. Cell Death Dis. 2019, 10, 692. [Google Scholar] [CrossRef]
  8. Matera, A.G.; Hebert, M.D. The survival motor neurons protein uses its ZPR for nuclear localization. Nat. Cell Biol. 2001, 3, E93–E94. [Google Scholar] [CrossRef]
  9. Al-Naama, N.; Mackeh, R.; Kino, T. C2H2-Type Zinc Finger Proteins in Brain Development, Neurodevelopmental, and Other Neuropsychiatric Disorders: Systematic Literature-Based Analysis. Front. Neurol. 2020, 11, 32. [Google Scholar] [CrossRef] [Green Version]
  10. Nowick, K.; Gernat, T.; Almaas, E.; Stubbs, L. Differences in human and chimpanzee gene expression patterns define an evolving network of transcription factors in brain. Proc. Natl. Acad. Sci. USA 2009, 106, 22358. [Google Scholar] [CrossRef] [Green Version]
  11. Manukyan, A.; Kowalczyk, I.; Melhuish, T.A.; Lemiesz, A.; Wotton, D. Analysis of transcriptional activity by the Myt1 and Myt1l transcription factors. J. Cell. Biochem. 2018, 119, 4644–4655. [Google Scholar] [CrossRef]
  12. Besold, A.N.; Oluyadi, A.A.; Michel, S.L.J. Switching Metal Ion Coordination and DNA Recognition in a Tandem CCHHC-type Zinc Finger Peptide. Inorg. Chem. 2013, 52, 4721–4728. [Google Scholar] [CrossRef]
  13. Jiang, Y.; Yu, V.C.; Buchholz, F.; O’Connell, S.; Rhodes, S.J.; Candeloro, C.; Xia, Y.-R.; Lusis, A.J.; Rosenfeld, M.G. A Novel Family of Cys-Cys, His-Cys Zinc Finger Transcription Factors Expressed in Developing Nervous System and Pituitary Gland (*). J. Biol. Chem. 1996, 271, 10723–10730. [Google Scholar] [CrossRef] [PubMed] [Green Version]
  14. Yang, J.; Siqueira, M.F.; Behl, Y.; Alikhani, M.; Graves, D.T. The transcription factor ST18 regulates proapoptotic and proinflammatory gene expression in fibroblasts. FASEB J. 2008, 22, 3956–3967. [Google Scholar] [CrossRef] [PubMed]
  15. Kim, J.G.; Armstrong, R.C.; Agoston, D.v.; Robinsky, A.; Wiese, C.; Nagle, J.; Hudson, L.D. Myelin transcription factor 1 (Myt1) of the oligodendrocyte lineage, along with a closely related CCHC zinc finger, is expressed in developing neurons in the mammalian central nervous system. J. Neurosci. Res. 1997, 50, 272–290. [Google Scholar] [CrossRef] [Green Version]
  16. Stevens, S.J.; van Ravenswaaij-Arts, C.M.; Janssen, J.W.; Klein Wassink-Ruiter, J.S.; van Essen, A.J.; Dijkhuizen, T.; van Rheenen, J.; Heuts-Vijgen, R.; Stegmann, A.P.; Smeets, E.E.; et al. MYT1L is a candidate gene for intellectual disability in patients with 2p25.3 (2pter) deletions. Am. J. Med. Genet. A 2011, 155, 2739–2745. [Google Scholar] [CrossRef] [PubMed]
  17. Hirayama, A.; Oka, A.; Ito, M.; Tanaka, F.; Okoshi, Y.; Takashima, S. Myelin transcription factor 1 (MyT1) immunoreactivity in infants with periventricular leukomalacia. Dev. Brain Res. 2003, 140, 85–92. [Google Scholar] [CrossRef]
  18. Schuster, A.; Klein, E.; Neirinckx, V.; Knudsen, A.M.; Fabian, C.; Hau, A.-C.; Dieterle, M.; Oudin, A.; Nazarov, P.V.; Golebiewska, A.; et al. AN1-type zinc finger protein 3 (ZFAND3) is a transcriptional regulator that drives Glioblastoma invasion. Nat. Commun. 2020, 11, 6366. [Google Scholar] [CrossRef]
  19. Zhang, J.; Luo, J.; Jiang, H.; Xie, T.; Zheng, J.; Tian, Y.; Li, R.; Wang, B.; Lin, J.; Xu, A.; et al. The Tumor Suppressor Role of Zinc Finger Protein 671 (ZNF671) in Multiple Tumors Based on Cancer Single-Cell Sequencing. Front. Oncol. 2019, 9, 1214. [Google Scholar] [CrossRef] [Green Version]
  20. Kwon, R.-J.; Han, M.-E.; Kim, Y.-J.; Kim, Y.H.; Kim, J.-y.; Liu, L.; Heo, W.; Oh, S.-O. Roles of zinc-fingers and homeoboxes 1 during the proliferation, migration, and invasion of glioblastoma cells. Tumor Biol. 2017, 39, 1010428317694575. [Google Scholar] [CrossRef] [Green Version]
  21. Wu, Y.; Fletcher, M.; Gu, Z.; Wang, Q.; Costa, B.; Bertoni, A.; Man, K.-H.; Schlotter, M.; Felsberg, J.; Mangei, J.; et al. Glioblastoma epigenome profiling identifies SOX10 as a master regulator of molecular tumour subtype. Nat. Commun. 2020, 11, 6434. [Google Scholar] [CrossRef]
  22. Melhuish, T.A.; Kowalczyk, I.; Manukyan, A.; Zhang, Y.; Shah, A.; Abounader, R.; Wotton, D. Myt1 and Myt1l transcription factors limit proliferation in GBM cells by repressing YAP1 expression. Biochim. Biophys. Acta Gene Regul. Mech. 2018, 1861, 983–995. [Google Scholar] [CrossRef]
  23. Hauser, P. Classification and Treatment of Pediatric Gliomas in the Molecular Era. Child 2021, 8, 739. [Google Scholar] [CrossRef]
  24. Pfister, S.M.; Capper, D.; Jones, D.T.W. Modern Principles of CNS Tumor Classification. In Brain Tumors in Children; Gajjar, A., Reaman, G.H., Racadio, J.M., Smith, F.O., Eds.; Springer International Publishing: Cham, Switzerland, 2018; pp. 117–129. [Google Scholar]
  25. Louis, D.N.; Ohgaki, H.; Wiestler, O.D.; Cavenee, W.K.; Cancer, I.A.F.R.O. WHO Classification of Tumours of the Central Nervous System, 4th revised ed.; IARC Press: Lyon, France, 2016. [Google Scholar]
  26. Louis, D.N.; Perry, A.; Reifenberger, G.; von Deimling, A.; Figarella-Branger, D.; Cavenee, W.K.; Ohgaki, H.; Wiestler, O.D.; Kleihues, P.; Ellison, D.W. The 2016 World Health Organization Classification of Tumors of the Central Nervous System: A summary. Acta Neuropathol. 2016, 131, 803–820. [Google Scholar] [CrossRef] [Green Version]
  27. Udaka, Y.T.; Packer, R.J. Pediatric Brain Tumors. Neurol. Clin. 2018, 36, 533–556. [Google Scholar] [CrossRef]
  28. Toland, A.; McNulty, S.N.; Pekmezci, M.; Evenson, M.; Huntoon, K.; Pierson, C.R.; Boue, D.R.; Perry, A.; Dahiya, S. Pediatric meningioma: A clinicopathologic and molecular study with potential grading implications. Brain Pathol. 2020, 30, 1134–1143. [Google Scholar] [CrossRef]
  29. Schulz, M.; Afshar-Bakshloo, M.; Koch, A.; Capper, D.; Driever, P.H.; Tietze, A.; Grün, A.; Thomale, U.-W. Management of pineal region tumors in a pediatric case series. Neurosurg. Rev. 2021, 44, 1417–1427. [Google Scholar] [CrossRef] [PubMed]
  30. Tabash, M.A. Characteristics, survival and incidence rates and trends of pilocytic astrocytoma in children in the United States; SEER-based analysis. J. Neurol. Sci. 2019, 400, 148–152. [Google Scholar] [CrossRef]
  31. Oushy, S.; Perry, A.; Graffeo, C.S.; Raghunathan, A.; Carlstrom, L.P.; Daniels, D.J. Pediatric ganglioglioma of the brainstem and cervicomedullary junction: A retrospective cohort study. J. Neurosurg. Pediatr. 2019, 25, 30–36. [Google Scholar] [CrossRef]
  32. Singla, A.K.; Madan, R.; Gupta, K.; Goyal, S.; Kumar, N.; Sahoo, S.K.; Uppal, D.K.; Ahuja, C.K. Clinical behaviour and outcome in pediatric glioblastoma: Current scenario. Radiat. Oncol. J. 2021, 39, 72–77. [Google Scholar] [CrossRef]
  33. Chamdine, O.; Gajjar, A. Molecular characteristics of pediatric high-grade gliomas. CNS Oncol. 2014, 3, 433–443. [Google Scholar] [CrossRef]
  34. Perrone, M.G.; Ruggiero, A.; Centonze, A.; Carrieri, A.; Ferorelli, S.; Scilimati, A. Diffuse Intrinsic Pontine Glioma (DIPG): Breakthrough and Clinical Perspective. Curr. Med. Chem. 2021, 28, 3287–3317. [Google Scholar] [CrossRef]
  35. Ostrom, Q.T.; Gittleman, H.; Fulop, J.; Liu, M.; Blanda, R.; Kromer, C.; Wolinsky, Y.; Kruchko, C.; Barnholtz-Sloan, J.S. CBTRUS Statistical Report: Primary Brain and Central Nervous System Tumors Diagnosed in the United States in 2008–2012. Neuro-oncology 2015, 17 (Suppl. S4), iv1–iv62. [Google Scholar] [CrossRef]
  36. Louis, D.N.; Ohgaki, H.; Wiestler, O.D.; Cavenee, W.K.; Burger, P.C.; Jouvet, A.; Scheithauer, B.W.; Kleihues, P. The 2007 WHO classification of tumours of the central nervous system. Acta Neuropathol. 2007, 114, 97–109. [Google Scholar] [CrossRef] [Green Version]
  37. Bayliss, J.; Mukherjee, P.; Lu, C.; Jain, S.U.; Chung, C.; Martinez, D.; Sabari, B.; Margol, A.S.; Panwalkar, P.; Parolia, A.; et al. Lowered H3K27me3 and DNA hypomethylation define poorly prognostic pediatric posterior fossa ependymomas. Sci. Transl. Med. 2016, 8, 366ra161. [Google Scholar] [CrossRef] [Green Version]
  38. Pajtler, K.W.; Witt, H.; Sill, M.; Jones, D.T.W.; Hovestadt, V.; Kratochwil, F.; Wani, K.; Tatevossian, R.; Punchihewa, C.; Johann, P.; et al. Molecular Classification of Ependymal Tumors across All CNS Compartments, Histopathological Grades, and Age Groups. Cancer Cell 2015, 27, 728–743. [Google Scholar] [CrossRef] [Green Version]
  39. Ostrom, Q.T.; Gittleman, H.; Truitt, G.; Boscia, A.; Kruchko, C.; Barnholtz-Sloan, J.S. CBTRUS Statistical Report: Primary Brain and Other Central Nervous System Tumors Diagnosed in the United States in 2011–2015. Neuro-oncology 2018, 20, iv1–iv86. [Google Scholar] [CrossRef] [Green Version]
  40. Harrison, P.W.; Ahamed, A.; Aslam, R.; Alako, B.T.F.; Burgin, J.; Buso, N.; Courtot, M.; Fan, J.; Gupta, D.; Haseeb, M.; et al. The European Nucleotide Archive in 2020. Nucleic Acids Res. 2021, 49, D82–D85. [Google Scholar] [CrossRef]
  41. Athar, A.; Füllgrabe, A.; George, N.; Iqbal, H.; Huerta, L.; Ali, A.; Snow, C.; Fonseca, N.A.; Petryszak, R.; Papatheodorou, I.; et al. ArrayExpress update–from bulk to single-cell expression data. Nucleic Acids Res. 2019, 47, D711–D715. [Google Scholar] [CrossRef] [PubMed]
  42. Tweedie, S.; Braschi, B.; Gray, K.; Jones, T.E.M.; Seal, R.L.; Yates, B.; Bruford, E.A. Genenames.org: The HGNC and VGNC resources in 2021. Nucleic Acids Res. 2021, 49, D939–D946. [Google Scholar] [CrossRef]
  43. Krishna, S.S.; Majumdar, I.; Grishin, N.V. Structural classification of zinc fingers: Survey and summary. Nucleic Acids Res. 2003, 31, 532–550. [Google Scholar] [CrossRef] [Green Version]
  44. Cassandri, M.; Smirnov, A.; Novelli, F.; Pitolli, C.; Agostini, M.; Malewicz, M.; Melino, G.; Raschellà, G. Zinc-finger proteins in health and disease. Cell Death Discov. 2017, 3, 17071. [Google Scholar] [CrossRef] [Green Version]
  45. Matys, V.; Kel-Margoulis, O.V.; Fricke, E.; Liebich, I.; Land, S.; Barre-Dirrie, A.; Reuter, I.; Chekmenev, D.; Krull, M.; Hornischer, K.; et al. TRANSFAC and its module TRANSCompel: Transcriptional gene regulation in eukaryotes. Nucleic Acids Res. 2006, 34, D108–D110. [Google Scholar] [CrossRef] [Green Version]
  46. The UniProt, C. UniProt: The universal protein knowledgebase in 2021. Nucleic Acids Res. 2021, 49, D480–D489. [Google Scholar] [CrossRef] [PubMed]
  47. Alliance of Genome Resources Portal: Unified model organism research platform. Nucleic Acids Res. 2020, 48, D650–D658. [CrossRef] [PubMed] [Green Version]
  48. Ashburner, M.; Ball, C.A.; Blake, J.A.; Botstein, D.; Butler, H.; Cherry, J.M.; Davis, A.P.; Dolinski, K.; Dwight, S.S.; Eppig, J.T.; et al. Gene Ontology: Tool for the unification of biology. Nat. Genet. 2000, 25, 25–29. [Google Scholar] [CrossRef] [Green Version]
  49. The Gene Ontology resource: Enriching a GOld mine. Nucleic Acids Res. 2021, 49, D325–D334. [CrossRef]
  50. Carbon, S.; Ireland, A.; Mungall, C.J.; Shu, S.; Marshall, B.; Lewis, S. AmiGO: Online access to ontology and annotation data. Bioinformatics 2009, 25, 288–289. [Google Scholar] [CrossRef]
  51. Huber, W.; Carey, V.J.; Gentleman, R.; Anders, S.; Carlson, M.; Carvalho, B.S.; Bravo, H.C.; Davis, S.; Gatto, L.; Girke, T.; et al. Orchestrating high-throughput genomic analysis with Bioconductor. Nat. Methods 2015, 12, 115–121. [Google Scholar] [CrossRef]
  52. R Core Team. R: A Language and Environment for Statistical Computing. R Foundation for Statistical Computing. Available online: https://www.r-project.org/ (accessed on 1 November 2021).
  53. RStudio Team. RStudio: Integrated Development for R. RstudioInc. Available online: https://www.rstudio.com/ (accessed on 1 November 2021).
  54. Davis, S.; Meltzer, P.S. GEOquery: A bridge between the Gene Expression Omnibus (GEO) and BioConductor. Bioinformatics 2007, 23, 1846–1847. [Google Scholar] [CrossRef] [Green Version]
  55. Barrett, T.; Wilhite, S.E.; Ledoux, P.; Evangelista, C.; Kim, I.F.; Tomashevsky, M.; Marshall, K.A.; Phillippy, K.H.; Sherman, P.M.; Holko, M.; et al. NCBI GEO: Archive for functional genomics data sets—Update. Nucleic Acids Res. 2013, 41, D991–D995. [Google Scholar] [CrossRef] [Green Version]
  56. Blighe, K.; Lun, A. PCAtools: Everything Principal Components Analysis. 2021. Available online: https://bioconductor.org/packages/release/bioc/vignettes/PCAtools/inst/doc/PCAtools.html (accessed on 11 November 2021).
  57. McInnes, L.; Healy, J.; Melville, J. Umap: Uniform manifold approximation and projection for dimension reduction. arXiv 2018, arXiv:1802.03426. [Google Scholar]
  58. Murrell, P. R Graphics. WIREs Comput. Stat. 2009, 1, 216–220. [Google Scholar] [CrossRef]
  59. Ritchie, M.E.; Phipson, B.; Wu, D.; Hu, Y.; Law, C.W.; Shi, W.; Smyth, G.K. Limma powers differential expression analyses for RNA-sequencing and microarray studies. Nucleic Acids Res. 2015, 43, e47. [Google Scholar] [CrossRef]
  60. Benjamini, Y.; Hochberg, Y. Controlling the False Discovery Rate: A Practical and Powerful Approach to Multiple Testing. J. R. Stat. Soc. Ser. B Methodol. 1995, 57, 289–300. [Google Scholar] [CrossRef]
  61. Subramanian, A.; Tamayo, P.; Mootha, V.K.; Mukherjee, S.; Ebert, B.L.; Gillette, M.A.; Paulovich, A.; Pomeroy, S.L.; Golub, T.R.; Lander, E.S.; et al. Gene set enrichment analysis: A knowledge-based approach for interpreting genome-wide expression profiles. Proc. Natl. Acad. Sci. USA 2005, 102, 15545–15550. [Google Scholar] [CrossRef] [Green Version]
  62. Liao, Y.; Wang, J.; Jaehnig, E.J.; Shi, Z.; Zhang, B. WebGestalt 2019: Gene set analysis toolkit with revamped UIs and APIs. Nucleic. Acids Res. 2019, 47, W199–W205. [Google Scholar] [CrossRef] [PubMed] [Green Version]
  63. Khatri, P.; Sirota, M.; Butte, A.J. Ten years of pathway analysis: Current approaches and outstanding challenges. PLoS Comput. Biol. 2012, 8, e1002375. [Google Scholar] [CrossRef]
  64. Kanehisa, M.; Sato, Y.; Furumichi, M.; Morishima, K.; Tanabe, M. New approach for understanding genome variations in KEGG. Nucleic. Acids Res. 2019, 47, D590–D595. [Google Scholar] [CrossRef] [PubMed] [Green Version]
  65. Shannon, P.; Markiel, A.; Ozier, O.; Baliga, N.S.; Wang, J.T.; Ramage, D.; Amin, N.; Schwikowski, B.; Ideker, T. Cytoscape: A software environment for integrated models of biomolecular interaction networks. Genome Res. 2003, 13, 2498–2504. [Google Scholar] [CrossRef] [PubMed]
  66. Koutrouli, M.; Karatzas, E.; Paez-Espino, D.; Pavlopoulos, G.A. A Guide to Conquer the Biological Network Era Using Graph Theory. Front. Bioeng. Biotechnol. 2020, 8, 34. [Google Scholar] [CrossRef] [PubMed]
  67. Goh, K.I.; Cusick, M.E.; Valle, D.; Childs, B.; Vidal, M.; Barabási, A.L. The human disease network. Proc. Natl. Acad. Sci. USA 2007, 104, 8685–8690. [Google Scholar] [CrossRef] [Green Version]
  68. García Del Valle, E.P.; Lagunes García, G.; Prieto Santamaría, L.; Zanin, M.; Menasalvas Ruiz, E.; Rodríguez-González, A. Disease networks and their contribution to disease understanding: A review of their evolution, techniques and data sources. J. Biomed. Inform. 2019, 94, 103206. [Google Scholar] [CrossRef]
  69. Heer, J.; Card, S.; Landay, J. Prefuse: A toolkit for interactive information visualization. Proceedings of ACM CHI 2005 Conference on Human Factors in Computing Systems, Portland, OR, USA, 2 April 2005; pp. 421–430. [Google Scholar]
  70. Kawai, S. An Algorithm for Drawing General Undirected Graphs Tomihisa Kamada and Satoru Kawai. Inf. Process. Lett. 1989, 31, 7–15. [Google Scholar]
  71. Harrington, B. Inkscape Project. Available online: https://inkscape.org/ (accessed on 10 November 2021).
  72. Griesinger, A.M.; Birks, D.K.; Donson, A.M.; Amani, V.; Hoffman, L.M.; Waziri, A.; Wang, M.; Handler, M.H.; Foreman, N.K. Characterization of distinct immunophenotypes across pediatric brain tumor types. J. Immunol. 2013, 191, 4880–4888. [Google Scholar] [CrossRef] [Green Version]
  73. Galili, T.; O’Callaghan, A.; Sidi, J.; Sievert, C. Heatmaply: An R package for creating interactive cluster heatmaps for online publishing. Bioinformatics 2018, 34, 1600–1602. [Google Scholar] [CrossRef] [PubMed]
  74. Chi, D.; Zhang, W.; Jia, Y.; Cong, D.; Hu, S. Spalt-Like Transcription Factor 1 (SALL1) Gene Expression Inhibits Cell Proliferation and Cell Migration of Human Glioma Cells Through the Wnt/β-Catenin Signaling Pathway. Med. Sci. Monit. Basic Res. 2019, 25, 128–138. [Google Scholar] [CrossRef]
  75. Ji, B.; Liu, L.; Guo, Y.; Ming, F.; Jiang, J.; Li, F.; Zhao, G.a.; Wen, J.; Li, N. Upregulated Tripartite Motif 47 Could Facilitate Glioma Cell Proliferation and Metastasis as a Tumorigenesis Promoter. Comput. Math. Methods Med. 2021, 2021, 5594973. [Google Scholar] [CrossRef]
  76. Ji, J.; Ding, K.; Luo, T.; Zhang, X.; Chen, A.; Zhang, D.; Li, G.; Thorsen, F.; Huang, B.; Li, X.; et al. TRIM22 activates NF-κB signaling in glioblastoma by accelerating the degradation of IκBα. Cell Death Differ. 2021, 28, 367–381. [Google Scholar] [CrossRef]
  77. Chen, J.; Ananthanarayanan, B.; Springer, K.S.; Wolf, K.J.; Sheyman, S.M.; Tran, V.D.; Kumar, S. Suppression of LIM Kinase 1 and LIM Kinase 2 Limits Glioblastoma Invasion. Cancer Res. 2020, 80, 69–78. [Google Scholar] [CrossRef] [Green Version]
  78. Wang, L.; Liu, Y.; Xuan, C.; Liu, Y.; Shi, H.; Gao, Y. Identification of ubiquitination-related genes in human glioma as indicators of patient prognosis. PLoS ONE 2021, 16, e0250239. [Google Scholar] [CrossRef] [PubMed]
  79. Scholz, N.; Kurian, K.M.; Siebzehnrubl, F.A.; Licchesi, J.D.F. Targeting the Ubiquitin System in Glioblastoma. Front. Oncol. 2020, 10, 574011. [Google Scholar] [CrossRef]
  80. Nady, N.; Lemak, A.; Walker, J.R.; Avvakumov, G.V.; Kareta, M.S.; Achour, M.; Xue, S.; Duan, S.; Allali-Hassani, A.; Zuo, X.; et al. Recognition of multivalent histone states associated with heterochromatin by UHRF1 protein. J. Biol. Chem. 2011, 286, 24300–24311. [Google Scholar] [CrossRef] [PubMed] [Green Version]
  81. Rajakumara, E.; Wang, Z.; Ma, H.; Hu, L.; Chen, H.; Lin, Y.; Guo, R.; Wu, F.; Li, H.; Lan, F.; et al. PHD finger recognition of unmodified histone H3R2 links UHRF1 to regulation of euchromatic gene expression. Mol. Cell. 2011, 43, 275–284. [Google Scholar] [CrossRef] [Green Version]
  82. Xie, S.; Jakoncic, J.; Qian, C. UHRF1 double tudor domain and the adjacent PHD finger act together to recognize K9me3-containing histone H3 tail. J. Mol. Biol. 2012, 415, 318–328. [Google Scholar] [CrossRef]
  83. Jung, Y.-D.; Shim, J.-W.; Park, S.-J.; Choi, S.H.; Yang, K.; Heo, K.; Park, M.-T. Downregulation of UHRF1 promotes EMT via inducing CXCR4 in human cancer cells. Int. J. Oncol. 2015, 46, 1232–1242. [Google Scholar] [CrossRef] [PubMed] [Green Version]
  84. Sidhu, H.; Capalash, N. UHRF1: The key regulator of epigenetics and molecular target for cancer therapeutics. Tumor Biol. 2017, 39, 1010428317692205. [Google Scholar] [CrossRef] [PubMed] [Green Version]
  85. Ashraf, W.; Ibrahim, A.; Alhosin, M.; Zaayter, L.; Ouararhni, K.; Papin, C.; Ahmad, T.; Hamiche, A.; Mély, Y.; Bronner, C.; et al. The epigenetic integrator UHRF1: On the road to become a universal biomarker for cancer. Oncotarget 2017, 8, 51946. [Google Scholar] [CrossRef] [Green Version]
Figure 1. Representative H&E stain pictures from the corresponding cases. (A) H&E stain, X100: PA with predominantly microcystic morphology, (B) H&E stain, X100: anaplastic EPN (Grade III according to WHO 2016), showing rosette formation, (C) H&E stain, X100: MDB of desmoplastic/nodular type, (D) H&E stain, X100: GBM: focus of necrosis and microvascular proliferation. The final editing was concluded with the tools provided by BioRender.com, accessed on 14 November 2021.
Dna 02 00001 g001
Figure 2. (A) Mean Difference (MD) plots showing Log2FC change versus the average Log2 expression. With a significant cut-off of adjusted p-value of 0.05, up-regulated genes are colored red and down-regulated are colored blue. (B) Volcano plots displaying statistical significance (-Log10 p-value) against magnitude of change (Log2FC). With a significant cut-off of adjusted p-value of 0.05, up-regulated genes are colored red and down-regulated are colored blue. These plots were created with the limma Bioconductor package in the GEO2R platform. The final editing was concluded with the tools provided by BioRender.com, accessed on 13 November 2021.
Dna 02 00001 g002
Figure 3. (A) Heatmap of the differentially expressed zinc finger-containing genes in all four types of brain tumors. Genes up- or down-regulation appears to have a similar trend for all brain tumor types with two highly visible clusters (cluster 1 and 2) of genes showing a contrast in regulation between MDB and the other three types of brain tumors. (B) Zoom in of the heatmap at cluster 1. Genes GLIS3, SALL1, TRIM47, and TRIM22 are up-regulated in MDB compared to PA, EPN and GBM. (C) Zoom in of the heatmap at cluster 2. Genes INSM2 and ST18 are significantly down-regulated in MDB compared to PA, EPN and GBM, while genes CBFA2T2, RNF165 and ZNF536 show a similar trend respectively.
Dna 02 00001 g003
Figure 4. Gene-Disease networks where circles and hexagons correspond to zinc finger-containing genes and brain tumor types, respectively. Each network represents the associations with high quality (p-value < 0.005) in the PA, EPN, MDB and GBM datasets. The color of the nodes is in accordance with the zinc finger-containing gene group they belong, while the color of the edges represents up- or down-regulation. The Prefuse Force Directed Layout is used with (1- p-value) as weight. This network was constructed in the Cytoscape platform. Final editing of the network was performed in Inkscape.
Dna 02 00001 g004
Figure 5. Combined Gene-Disease network where circles and hexagons correspond to zinc finger-containing genes and brain tumor types, respectively. In this network only genes with high-quality associations (p-value < 0.005) in more than one disease are shown. The color of the nodes is in accordance with the zinc finger-containing gene group they belong, while the color of the edges represents up- or down-regulation. The Edge-weighted Spring-Embedded Layout is used with (1- p-value) as weight. This network was constructed in the Cytoscape platform. Final editing of the network was performed in Inkscape.
Dna 02 00001 g005
Table 1. This table was created with reference to Cassandri et al. "Zinc finger proteins in health and disease" publication [44]. The data have been updated according to the most recent scientific evidence. More specifically, the number of genes has been obtained from HUGO Gene Nomenclature Committee [42], which is responsible for approving unique symbols and names for human loci to allow unambiguous scientific communication. The number of Transcription Factors (TFs) in each zinc finger group was counted after examining three strict rules. In particular each gene to be considered as TF has to be clearly reported as such either in TRANSFAC [45] OR in UniProt KnowledgeBase (UniProtKB) [46] AND in Alliance of Genome Resources (Alliance) [47] AND in Gene Ontology (GO) [48,49,50].
Type NameZinc Finger StructureNumber of GenesNumber of TFs
TRANSFACUniProtKB AND Alliance AND GO
Zinc fingers C2H2-type (ZNF)C-x-C-x-H-x-H748676166
Ring finger proteins (RNF)C-x-C-x-C-x-H-xxx-C-x-C-x-C-x-C3052548
PHD finger proteins (PHF)C-x-C-x-C-x-C-xxx-H-x-C-x-C-x-C904053
LIM domain containingC-x-C-x-H-x-C-x-C-x-C-x-C-x-(C,H,D)5367
LIM domain subgroups-221011
Nuclear hormone receptors (NR)C-x-C-x-C-x-C-xxx-C-x-C-x-C-x-C494640
Zinc fingers CCCH-type (ZC3H)C-x-C-x-C-x-H3752
Zinc fingers FYVE-type (ZFYVE)C-x-C-x-C-x-C-xxx-C-x-C-x-C-x-C3101
Zinc fingers CCHC-type (ZCCHC)C-x-C-x-H-x-C2402
Zinc fingers DHHC-type (ZDHHC)C-x-C-x-H-x-C-xxx-C-x-C-x-H-x-C24O0
Zinc fingers MYND-type (ZMYND)C-x-C-x-C-x-C-xxx-C-x-C-x-H-x-C2158
Zinc fingers RANBP2-type (ZRANB)C-x-C-x-C-x-C2135
Zinc fingers ZZ-type (ZZZ)C-x-C-x-C-x-C1843
Zinc fingers C2HC-type (ZC2HC)C-x-C-x-H-x-C1678
GATA zinc finger domain containing (GATAD)C-x-C-x-C-x-C151515
ZF class homeoboxes and pseudogenesC-x-C-x-H-x-H15139
THAP domain containing (THAP)C-x-C-x-C-x-H12115
Zinc fingers CXXC-type (CXXC)C-x-C-x-C-x-C-xxx-C-x-C-x-C-x-C1277
Zinc fingers SWIM-type (ZSWIM)C-x-C-x-C-x-H1000
Zinc fingers AN1-type (ZFAND)C-x-C-x-C-x-C-xxx-C-x-H-x-H-x-C811
Zinc fingers 3CxxC-type (Z3CXXC)C-x-C-x-H-x-C800
Zinc fingers CW-type (ZCW)C-x-C-x-C-x-C700
Zinc fingers GRF-type (ZGRF)C-x-C-x-C-x-C702
Zinc fingers MIZ-type (ZMIZ)C-x-C-x-H-x-C716
Zinc fingers BED-type (ZBED)C-x-C-x-H-x-H664
Zinc fingers HIT-type (ZNHIT)C-x-C-x-C-x-C-xxx-C-x-C-x-H-x-C600
Zinc fingers MYM-type (ZMYM)C-x-C-x-C-x-C610
Zinc fingers matrin-type (ZMAT)C-x-C-x-H-x-H500
Zinc fingers C2H2C-typeC-x-C-x-H-x-H333
Zinc fingers DBF-type (ZDBF)C-x-C-x-H-x-H310
Zinc fingers PARP-typeC-x-C-x-H-x-C201
Zinc finger encoding genes that are not grouped into further subsets-1512
Table 2. Enriched biological processes and pathways for zinc finger-containing genes in all four brain tumor types (PA, EPN, MDB, GMB).
Gene SetDescriptionAdj. p-ValueFDR
Pilocytic Astrocytoma
Gene Ontology
GO:0000209Protein polyubiquitination5.55 × 10−164.72 × 10⁻¹³
GO:0030522Intracellular receptor signaling pathway3.32 × 10−121.41 × 10⁻⁹
GO:0051865Protein autoubiquitination4.02 × 10−101.03 × 10⁻⁷
GO:0006513Protein monoubiquitination4.85 × 10−101.03 × 10⁻⁷
GO:0009755Hormone-mediated signaling pathway7.89 × 10−91.34 × 10⁻⁶
GO:0016569Covalent chromatin modification1.02 × 10−71.45 × 10⁻⁵
GO:0048545Response to steroid hormone2.83 × 10−73.43 × 10⁻⁵
GO:0009896Positive regulation of catabolic process8.52 × 10−68.27 × 10⁻⁴
GO:0010498Proteasomal protein catabolic process8.75 × 10−68.27 × 10⁻⁴
GO:0032606Type I interferon production1.33 × 10−51.13 × 10⁻³
GO:0052192Movement in environment of other organism involved in symbiotic interaction1.73 × 10−51.27 × 10⁻³
GO:0018205Peptidyl-lysine modification1.79 × 10−51.27 × 10⁻³
KEGG
hsa04120Ubiquitin mediated proteolysis2.02 × 10−54.12 × 10⁻³
hsa05202Transcriptional misregulation in cancer2.60 × 10−54.12 × 10⁻³
Ependymoma
Gene Ontology
GO:0016569Covalent chromatin modification00
GO:0000209Protein polyubiquitination00
GO:0051865Protein autoubiquitination00
GO:0030522Intracellular receptor signaling pathway8.90 × 10−131.89 × 10⁻¹⁰
GO:0006513Protein monoubiquitination5.31 × 10−129.03 × 10⁻¹⁰
GO:0018205Peptidyl-lysine modification1.17 × 10−101.66 × 10⁻⁸
GO:0009755Hormone-mediated signaling pathway2.77 × 10−102.94 × 10⁻⁸
GO:0043543Protein acylation2.77 × 10−102.94 × 10⁻⁸
GO:0048545Response to steroid hormone1.85 × 10−71.75 × 10⁻⁵
GO:0018198Peptidyl-cysteine modification1.23 × 10−61.04 × 10⁻⁴
GO:0006352DNA-templated transcription, initiation1.47 × 10−61.14 × 10⁻⁴
GO:0021953Central nervous system neuron differentiation1.83 × 10−61.26 × 10⁻⁴
GO:0052192Movement in environment of other organism involved in symbiotic interaction1.98 × 10−61.26 × 10⁻⁴
GO:0040029Regulation of gene expression, epigenetic2.07 × 10−61.26 × 10⁻⁴
GO:0010498Proteasomal protein catabolic process7.75 × 10−64.39 × 10⁻⁴
GO:0000726Non-recombinational repair3.18 × 10−51.56 × 10⁻³
GO:0006302Double-strand break repair3.30 × 10−51.56 × 10⁻³
GO:0008213Protein alkylation3.31 × 10−51.56 × 10⁻³
GO:0009896Positive regulation of catabolic process1.04 × 10−44.64 × 10⁻³
GO:0045444Fat cell differentiation2.14 × 10−49.08 × 10⁻³
GO:0048732Gland development2.38 × 10−49.63 × 10⁻³
KEGG
hsa05202Transcriptional misregulation in cancer6.68 × 10−72.12 × 10⁻⁴
Medulloblastoma
Gene Ontology
GO:0016569Covalent chromatin modification00
GO:0018205Peptidyl-lysine modification1.04 × 10−124.41 × 10⁻¹⁰
GO:0043543Protein acylation6.04 × 10−111.71 × 10⁻⁸
GO:0040029Regulation of gene expression, epigenetic3.03 × 10−106.43 × 10⁻⁸
GO:0006513Protein monoubiquitination4.90 × 10−108.33 × 10⁻⁸
GO:0000209Protein polyubiquitination1.43 × 10−92.02 × 10⁻⁷
GO:0051865Protein autoubiquitination5.05 × 10−96.13 × 10⁻⁷
GO:0009755Hormone-mediated signaling pathway1.25 × 10−61.33 × 10⁻⁴
GO:0030522Intracellular receptor signaling pathway3.81 × 10−63.60 × 10⁻⁴
GO:0021953Central nervous system neuron differentiation9.88 × 10−68.40 × 10⁻⁴
GO:0071514Genetic imprinting1.26 × 10−59.70 × 10⁻⁴
GO:0006397Mrna processing1.37 × 10−59.70 × 10⁻⁴
GO:0048545Response to steroid hormone3.58 × 10−52.23 × 10⁻³
GO:0098727Maintenance of cell number3.67 × 10−52.23 × 10⁻³
GO:0008213Protein alkylation4.49 × 10−52.54 × 10⁻³
GO:0006352DNA-templated transcription, initiation5.83 × 10−53.10 × 10⁻³
GO:0045444Fat cell differentiation6.22 × 10−53.11 × 10⁻³
GO:1903706Regulation of hemopoiesis9.34 × 10−54.41 × 10⁻³
GO:1990823Response to leukemia inhibitory factor1.08 × 10−44.64 × 10⁻³
GO:0033044Regulation of chromosome organization1.09 × 10−44.64 × 10⁻³
GO:0010948Negative regulation of cell cycle process1.35 × 10−45.45 × 10⁻³
GO:0032259Methylation1.84 × 10−47.10 × 10⁻³
GO:0030099Myeloid cell differentiation2.06 × 10−47.62 × 10⁻³
Glioblastoma
Gene Ontology
GO:0000209Protein polyubiquitination00
GO:0051865Protein autoubiquitination4.44 × 10−161.89 × 10⁻¹³
GO:0016569Covalent chromatin modification1.96 × 10−135.56 × 10⁻¹¹
GO:0030522Intracellular receptor signaling pathway6.42 × 10−131.36 × 10⁻¹⁰
GO:0009755Hormone-mediated signaling pathway2.38 × 10−124.04 × 10⁻¹⁰
GO:0006513Protein monoubiquitination4.77 × 10−116.75 × 10⁻⁹
GO:0048545Response to steroid hormone6.85 × 10−98.32 × 10⁻⁷
GO:0018205Peptidyl-lysine modification8.24 × 10−88.75 × 10⁻⁶
GO:0045444Fat cell differentiation4.51 × 10−63.92 × 10⁻⁴
GO:0006352DNA-templated transcription, initiation4.77 × 10−63.92 × 10⁻⁴
GO:0040029Regulation of gene expression, epigenetic5.08 × 10−63.92 × 10⁻⁴
GO:0043543Protein acylation7.13 × 10−65.05 × 10⁻⁴
GO:0008213Protein alkylation5.57 × 10−53.38 × 10⁻³
GO:0021953Central nervous system neuron differentiation5.57 × 10−53.38 × 10⁻³
GO:0052192Movement in environment of other organism involved in symbiotic interaction6.78 × 10−53.84 × 10⁻³
GO:0032259Methylation7.92 × 10−54.21 × 10⁻³
GO:1903706Regulation of hemopoiesis1.25 × 10−46.23 × 10⁻³
KEGG
hsa05202Transcriptional misregulation in cancer1.68 × 10−75.32 × 10⁻⁵
hsa04120Ubiquitin mediated proteolysis2.63 × 10−54.16 × 10⁻³
Publisher’s Note: MDPI stays neutral with regard to jurisdictional claims in published maps and institutional affiliations.

