
Orientation-Dependent Indentation Behaviour of Additively Manufactured FeCo Sample: A Quasi In-Situ Study


Chair of Materials Science, Paderborn University, Warburger Straße 100, 33098 Paderborn, Germany
*
Author to whom correspondence should be addressed.
Magnetism 2022, 2(2), 88-104; https://doi.org/10.3390/magnetism2020007
Submission received: 1 December 2021
/
Revised: 10 February 2022
/
Accepted: 28 February 2022
/
Published: 25 March 2022
Abstract
:The quasi in-situ indentation behaviour of <110>||BD and <111>||BD-oriented grains in a FeCo alloy is studied in this investigation. The effect of build height on melt pool shape and melt pool size is also studied by finite element method simulations. As the building height increases, the aspect ratio of the elliptical melt pool increases. Correspondingly, the effect of the laser scan speed on the melt pool shape and size is studied by the finite element method, because, as the laser scan speed increases, the aspect ratio of the elliptical melt pool increases, too. The microstructural characterisation of the indentation area before and after indentation is performed by electron backscatter diffraction (EBSD). Based on the EBSD data grain reference orientation deviation (GROD), calculations are performed to describe the effect of indentations on the neighbouring grain orientations. High GROD angles are detected in the neighbouring grain region adjoining the indented grain. An in-depth slip trace analysis shows the activation of all three slip systems ({110}<111>, {112}<111> and {123}<111>) which is also confirmed by slip lines on the sample surface that are detected by laser scanning confocal microscopy. A high concentration of geometrically necessary dislocations (GNDs) are observed on the adjoining area to the indentation. Local surface topography measurements by laser scanning confocal microscopy confirmed the formation of pile-ups near the indentation.
1. Introduction
Soft magnetic materials such as FeCo alloys are important materials for components in electrical machines. Among all engineering soft magnetic alloys, FeCo alloys have a high saturation, high permeability, low coercivity and high Curie temperature. However, FeCo alloys are brittle due to the formation of ordered phases during conventional processing. Hence, additive manufacturing of FeCo alloys offers an alternative route to manufacture electrical machine components in a near-net shape. Due to the high cooling rate (>105 °C/s) during additive manufacturing, the formation of ordered phases is suppressed. In addition, the formation of microstructural features (equiaxed grains with subgrains, high dislocation density, elongated voids) over length scale ranges has been reported. This leads to the formation of high-strength and ductile FeCo alloys (yield strength 600 MPa, elongation 35%) [1]. In addition, the formation of equiaxed fine grains (≈5–10 µm) has been reported, which can increase the strength by the Hall–Petch strengthening. Further on, Babuska et al. [2] showed that the addition of artificial struts on tensile samples leads to a further increase in ductility. These artificial struts act as local heat sinks which increase the heat dissipation rate, leading to a lower temperature for a longer time, resulting in a higher atomic disorder, which increases the ductility. As-built FeCo alloys exhibit a weak texture due to repetitive phase transformation by the heating (body-centred cubic to face-centred cubic) and cooling (face-centred cubic to body-centred cubic) of the previous build layers [3]. However, during tensile testing, a strong <101> texture has been noticed due to slip on the {110} planes [1].
Previous studies on FeCo and FeCoV alloys have focussed on the magnetic and mechanical properties [1,2,3,4,5,6]. The successful additive manufacturing of a PMSM rotor shaft using a FeCo alloy was undertaken [6]. Here, the implementation of a novel rotor coil design was undertaken. The amorphous FeCo-based composite alloy (Fe-Co-Si-B-P) showed fairly good magnetic properties (saturation magnetisation 1.75 T) and bending ductility upon stress relief annealing. According to Chaudhary et al. [4], the saturation magnetisation decreases with Co concentration in additively manufactured functionally graded FeCo alloys. Nevertheless, up to now, the orientation-dependent indentation behaviour of FeCo alloys has not been studied in detail. The orientation-dependent indentation behaviour is important as hard orientations (grain orientations unfavourably oriented for plastic deformation) are expected to be resistant to crack initiation. Identifying and increasing the volume fraction of hard orientations is likely to produce crack-resistant FeCo alloys. Increased crack-resistant FeCo alloys are expected to increase the service life of rotating electrical machine components subjected to fatigue stress.
Previous studies on the orientation-dependent indentation behaviour have been reported for hcp materials (titanium [7], zinc [8,9]). During the indentation of Ti alloys, the hardness is strongly dependent on the grain orientation [7]. [0001]-oriented grains have a high hardness due to reduced slip or twinning, whereas grain orientations along the [100]-[30] axis exhibit low hardness. Grains with low hardness have large orientation gradients leading to crack nucleation and propagation. During the indentation of pure zinc, the hardness variation is not influenced by the grain orientation. However, Young’s modulus increased when the grain orientation changed from basal (41 GPa ± 6 GPa) to prismatic (103 GPa ± 6 GPa) [9]. The morphology around the indentation (pile-up, local surface depression) depends on the grain orientation. Due to the relatively low melting temperature of zinc, pure grain boundary sliding or slip-induced grain boundary sliding has been observed during the indentation of zinc [8]. During the nanoindentation-induced slip behaviour of austenitic stainless steel under varying loads on the (111), (110) or (100)-oriented grains, the flow direction changes from forward flow to sideways flow with the change in the angle between the slip plane and surface [10]. During the onset of indentation, slip steps on positively inclined slip planes are activated. Due to the formation of pile-up and the change in surface topography, the local stress state changes, resulting in the activation of a negatively inclined slip plane [11].
Furthermore, few studies have addressed exclusively the indentation behaviour of partially crystalline bulk metallic glass-based FeCo alloy composites [12,13]. The formation of semicircular shear bands is observed under the indentations. When indenting bulk metallic glass-based FeCo alloy composites with less than a critical load, the formation of corner cracks are not observed, whereas, above the critical load, the formation of corner cracks occurs. In addition, the formation of chips in the side of the sample is apparent along with corner crack formation. Nonetheless, in the literature, there are no studies on the local indentation response of completely crystalline FeCo alloys. Therefore, the current study focuses on the quasi in-situ indentation behaviour of an additively manufactured FeCo alloy. The stress field near the indentation is simulated by the finite element method (FEM) to predict the size of the plastic zone. Before that, the effect of building height and the laser scan speed on the melt pool shape and melt pool size are simulated by FEM. In addition, the influence of the laser scan speed on both melt pool shape and size is predicted by FEM. Changes in the surface topography after indentation are visualised by laser scanning confocal microscopy. Here, the effect of grain orientation on the pile-up behaviour is addressed. Further on, the microstructure is investigated by the electron backscatter diffraction (EBSD) technique. Here, the local grain rotation is examined before and after indentation with a focus on the indentation-induced slip transfer between neighbouring grains. The local misorientation within a neighbouring grain is derived from the EBSD data by the grain reference orientation deviation (GROD) calculation. The objective of the GROD calculation is to identify the deformation accommodation within a neighbouring grain. To complete the investigation, the evolution of geometrically necessary dislocations (GNDs) in the surrounding grain of the indentation is investigated. Potential changes in the local grain orientation resulting from the indentation are examined by inverse pole figure plots.
2. Materials and Methods
2.1. Sample Preparation
FeCo samples containing 50 wt.% Fe and 50 wt.% Co were manufactured by laser powder bed fusion (LPBF) in an argon atmosphere using the SLM250HL (SLM Solutions Group AG, Lübeck, Germany) [14]. A 400 W ytterbium continuous laser with a spot diameter of 70 µm was employed for melting the pre-alloyed FeCo powder. The optimised processing parameters for LPBF were 270 W laser power, 700 mm/s scan speed, 0.11 mm hatch distance and 0.05 mm layer thickness. Further details regarding the LPBF processing are explained in Ref. [14]. Rectangular samples of 20 mm length, 10 mm width and 40 mm height were built by LPBF.
2.2. Indentation
Small rectangular samples (10 mm length, 3 mm width and 2 mm thickness) were cut from the as-built sample (Supplementary Figure S1a). The cut sample surface was parallel to the build direction. The cut surface was polished with abrasive paper followed by polishing for 24 h using a 50 nm-size colloidal silica suspension in a BUHLER VibroMet polisher. On each sample, 20 indentations were made on the polished surface with a Vickers hardness tester (Supplementary Figure S1b). All indentations were made on a rectangular grid with 5 indentations per row and 4 rows with a load of 0.2 N and a holding time of 30 s. The distance between two indentations was 80 µm.
2.3. Microstructural Analysis
The microstructural characterisation before and after indentation was conducted with EBSD employing an EDAX detector in a scanning electron microscope (Zeiss Ultra Plus (SEM)). A 0.3 µm step size was used for acquiring the EBSD maps with the SEM operating at a 20 kV accelerating voltage. A probe current of 77 pA and an objective lens aperture with a diameter of 120 µm were used to capture EBSD maps at a working distance of 13 mm. For the analysis, EBSD maps of the same area were performed before and after indentation. SEM images of the indentation area were captured by the secondary electron detector at a 12 kV accelerating voltage, 5 mm working distance and 217 pA probe current.
EBSD data analysis was carried out using both TSL OIM 7 and Mtex 5.6.1 [15]. The EBSD data were exported from TSL OIM 7 via the .ang file format to Mtex 5.6.1 [15] to perform the GROD analysis. In brief, during GROD calculation, the mean orientation of grains was calculated. Then, the misorientation of each grain pixel from the mean orientation was determined [15]. The GROD data had two components: GROD angle and GROD axis. The distribution of GROD angles was plotted on the EBSD map for each grain pixel, whereas the GROD axis distribution was plotted on the EBSD map and inverse pole figure. To determine the active slip planes, the slip trace of the {110}<111> system, {112}<111> system and {123}<111> system was also determined from the EBSD data.
GNDs were evaluated from the EBSD data using Mtex 5.6.1 [15]. The procedure outlaid by Pantleon et al. [16] was used for the calculation and plotting of GNDs. In brief, the EBSD data were suitably cleaned and smoothed to avoid GNDs overestimation followed by incomplete curvature tensor calculation. Now, the different bcc dislocations (48 edge dislocations and 4 screw dislocations) were considered to minimise the total energy. The slip trace analysis of the {110}<111> slip system, {112}<111> slip system and {123}<111> slip system was completed using the Mtex 5.6.1 [15]. The orientations of the grains were plotted in an inverse pole figure before and after indentation by performing orientation distribution function (ODF) calculations following the kernel density estimation in Mtex 5.6.1 [15]. The halfwidth of the kernel density function was calculated before the ODF calculation to minimise the ODF estimation error.
2.4. Laser Scanning Confocal Microscopy
The local surface topography after indentation was measured by laser scanning confocal microscopy (Olympus LEXT OLS3100). A 100× objective magnification and 3× zoom were used to take the images. As the laser scanned the surface, the pinhole on the camera allowed images to be taken for different focal planes, allowing a 3D image generation.
2.5. Finite Element Method Simulations
FEM simulations of the LPBF process were undertaken using Abaqus CAE 2017. The effects of the (i) building height and (ii) laser scan speed on the shape and size of the melt pool and the melt pool temperature distribution were modelled. For simulation, a solid block of 0.1 m length and 0.1 m width was selected. The final build height of the sample was 0.1 m. To study the effect of the building height on the melt pool characteristics, three samples at different stages of the building height (0.001 m, 0.01 m and 0.1 m) were selected. To study the effect of the laser scan speed on the melt pool characteristics, two different laser scan speeds (675 mm/s and 775 mm/s) were chosen. Here, 675 mm/s and 775 mm/s were the slowest and the fastest laser scan speeds, respectively, that were used to build the FeCo alloy samples in Ref. [14].
To account for phase transformations during the scanning of the laser beam, the temperature-dependent material properties (thermal conductivity, specific heat, density) of the FeCo alloy were assigned to the sample. A laser beam with a gaussian size distribution was used to simulate the moving heat source. A DFLUX subroutine was written in FORTRAN to move the heat source on the sample. A bidirectional scanning strategy was used in this FEM model. The bottom surface of the sample was maintained at 200 °C (build platform temperature). All other sample surfaces were assigned a temperature of 25 °C. The surrounding environment temperature was assumed to be 25 °C as well. Variable mesh size was used where a finer mesh was used at the interaction point of the laser beam with the sample and a coarser mesh was used at the other regions. Hexahedral elements were utilized during mesh generation. Between the sample surface and the surrounding atmosphere, a convective heat transfer was assumed. In the FEM model, the temperature distribution of the previously built layers was ignored. Thus, it can be assumed that this FEM model gave approximate melt pool properties.
The FEM simulation of the Vickers indentation was performed using Abaqus CAE 2017. For this purpose, a rectangular sample (9 mm length, 3 mm width, 2 mm thickness) was created for which the material properties, particularly the stress-strain response, of the FeCo alloy [17] were assigned. A Vickers indenter with a pyramidal shape and square base (5 mm length) was created using SOLIDWORKS 2018 and subsequently imported into Abaqus CAE 2017 via a STEP file. The material properties of the diamond were assigned to the Vickers indenter. The angle between the faces of the pyramid was 136°. A load of 20 gm was applied to the indenter. A master surface–slave surface approach in FEM was used to model the penetration of the indenter in the sample. Here, the master surface was the indenter tip and the slave surface was the sample top surface. A mesh with the variable size was used in the FEM model. Here, the mesh size was finer at the indenter contact area but coarser at the sample edges. Tetrahedral mesh elements were used for the indenter and hexahedral elements were used for the sample during mesh creation.
3. Results
3.1. Finite Element Method Simulations
3.1.1. Effect of Building Height on Melt Pool Shape during LPBF
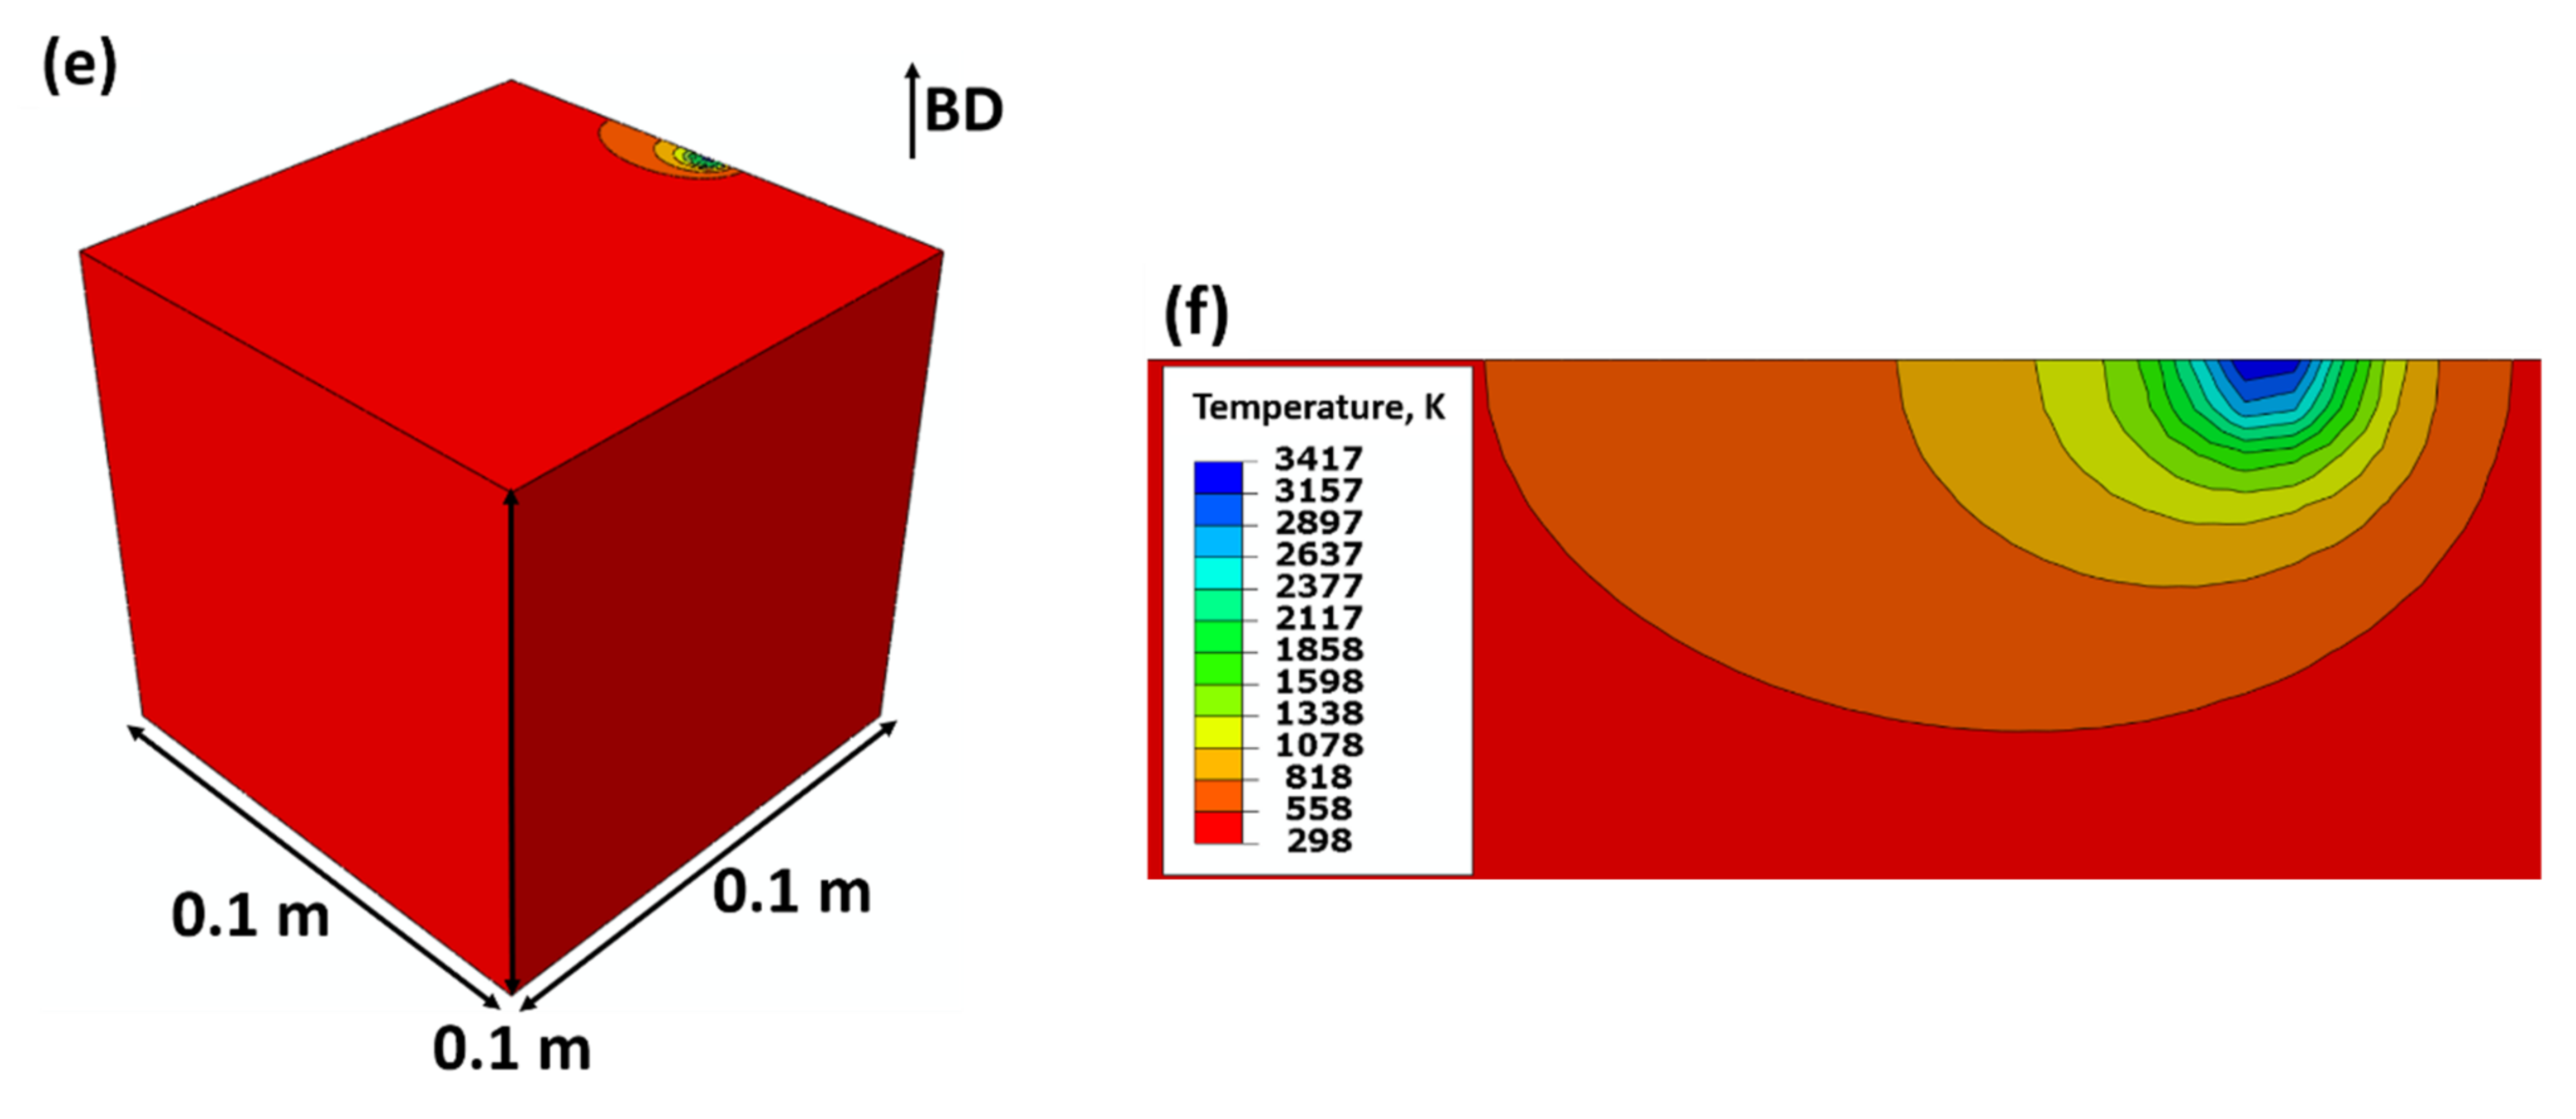
Figure 1 shows the effect of the building height on the melt pool shape and temperature distribution. Figure 1a,c,e depict the isometric views of the samples showing the temperature distribution for the 0.001 m height, 0.01 m height, and 0.1 m height, respectively. The magnified top view of the sample for the 0.001 m building height with a circular melt pool having an aspect ratio of 1.03 is illustrated in Figure 1b. In contrast to Figure 1b, Figure 1d shows the magnified top view of the sample for the 0.01 m build height with an elliptical melt pool having an aspect ratio of 1.16. The magnified top view of the sample for the 0.1 m build height is shown in Figure 1f. Here, the melt pool is elliptical, too, with an aspect ratio of 1.37. However, the aspect ratio of the melt pool ellipse is higher for the 0.1 m build height compared to 0.01 m. However, for a given laser scan speed, no significant change in melt pool shape is observed by the infrared (IF) camera during LPBF of the Inconel 718 alloy [18]. Here, the IR camera is used to measure the solidus and liquidus temperatures from which the melt pool dimensions are calculated. Thus, the effect of build height on the melt pool shape depends on the processing parameters and also on the alloy composition. As the building height increases, the heat dissipation during laser beam scanning becomes difficult due to the residual heat from the previous build layers. For the 0.001 m build height sample, the number of previous build layers is very low, so the melt pool is nearly circular. As the building height increases, the number of previous build layers increases. This leads to a slower heat dissipation due to residual heat from the previous build layers. This leads to an increase in the aspect ratio of the melt pool with the increase in build height.
3.1.2. Effect of Laser Scan Speed on Melt Pool during LBPF
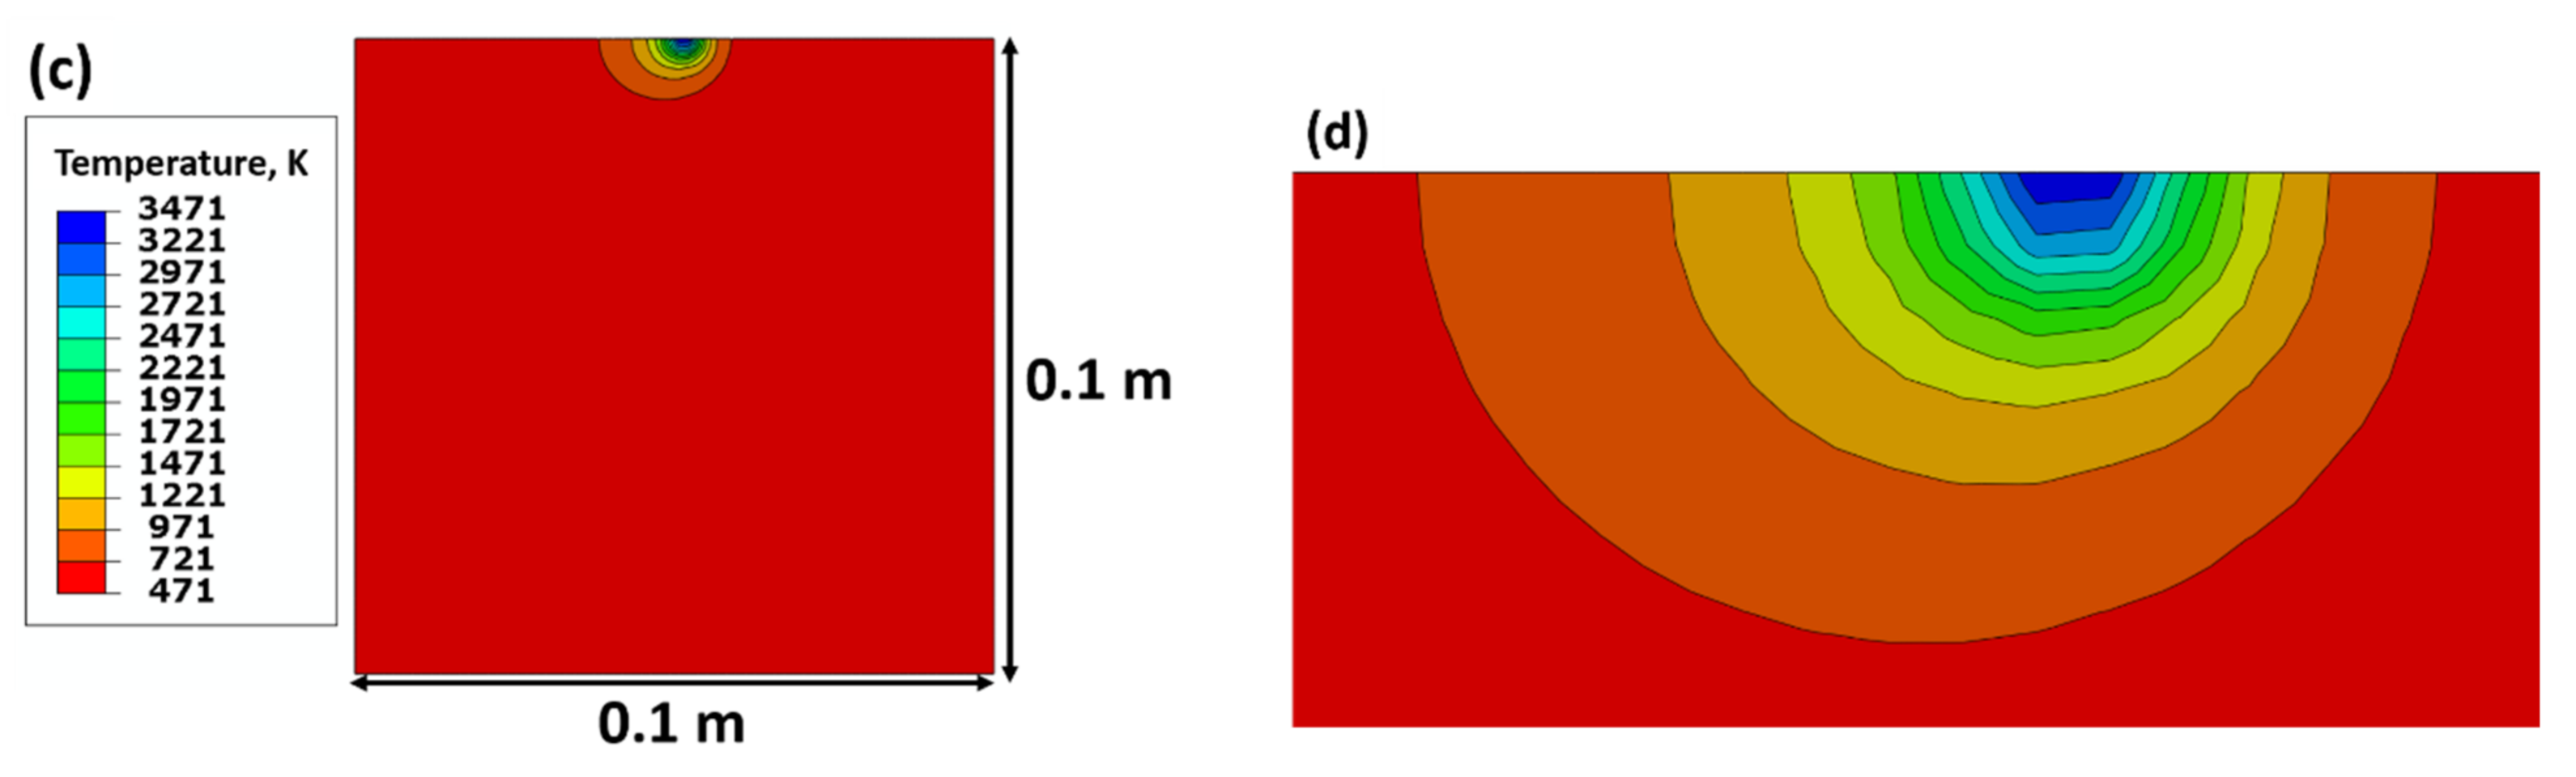
Figure 2 summarises the influence of the laser scan speed on the melt pool shape and temperature distribution. Figure 2a,b show the top views of the melt pool shape for a laser scan speed of 675 mm/s. The aspect ratio of the melt pool shape is 1.08. Figure 2c,d shows the top view of the melt pool shape for a laser scan speed of 775 mm/s. In this case, the aspect ratio of the melt pool shape is 1.15. As the laser scan speed increases, the aspect ratio of the melt pool increases (i.e., the melt pool shape becomes more elliptical). During the LPBF processing of the Inconel 718 alloy, the melt pool width decreases with the laser scan speed [18]. This is expected to increase the aspect ratio of the melt pool. With the increase in the laser scan speed, the time available for the heat generated due to laser beam scanning to become dissipated decreases. This leads to the increase in the melt pool aspect ratio with the laser scan speed.
3.1.3. Indentation Geometry upon Vickers Hardness Testing
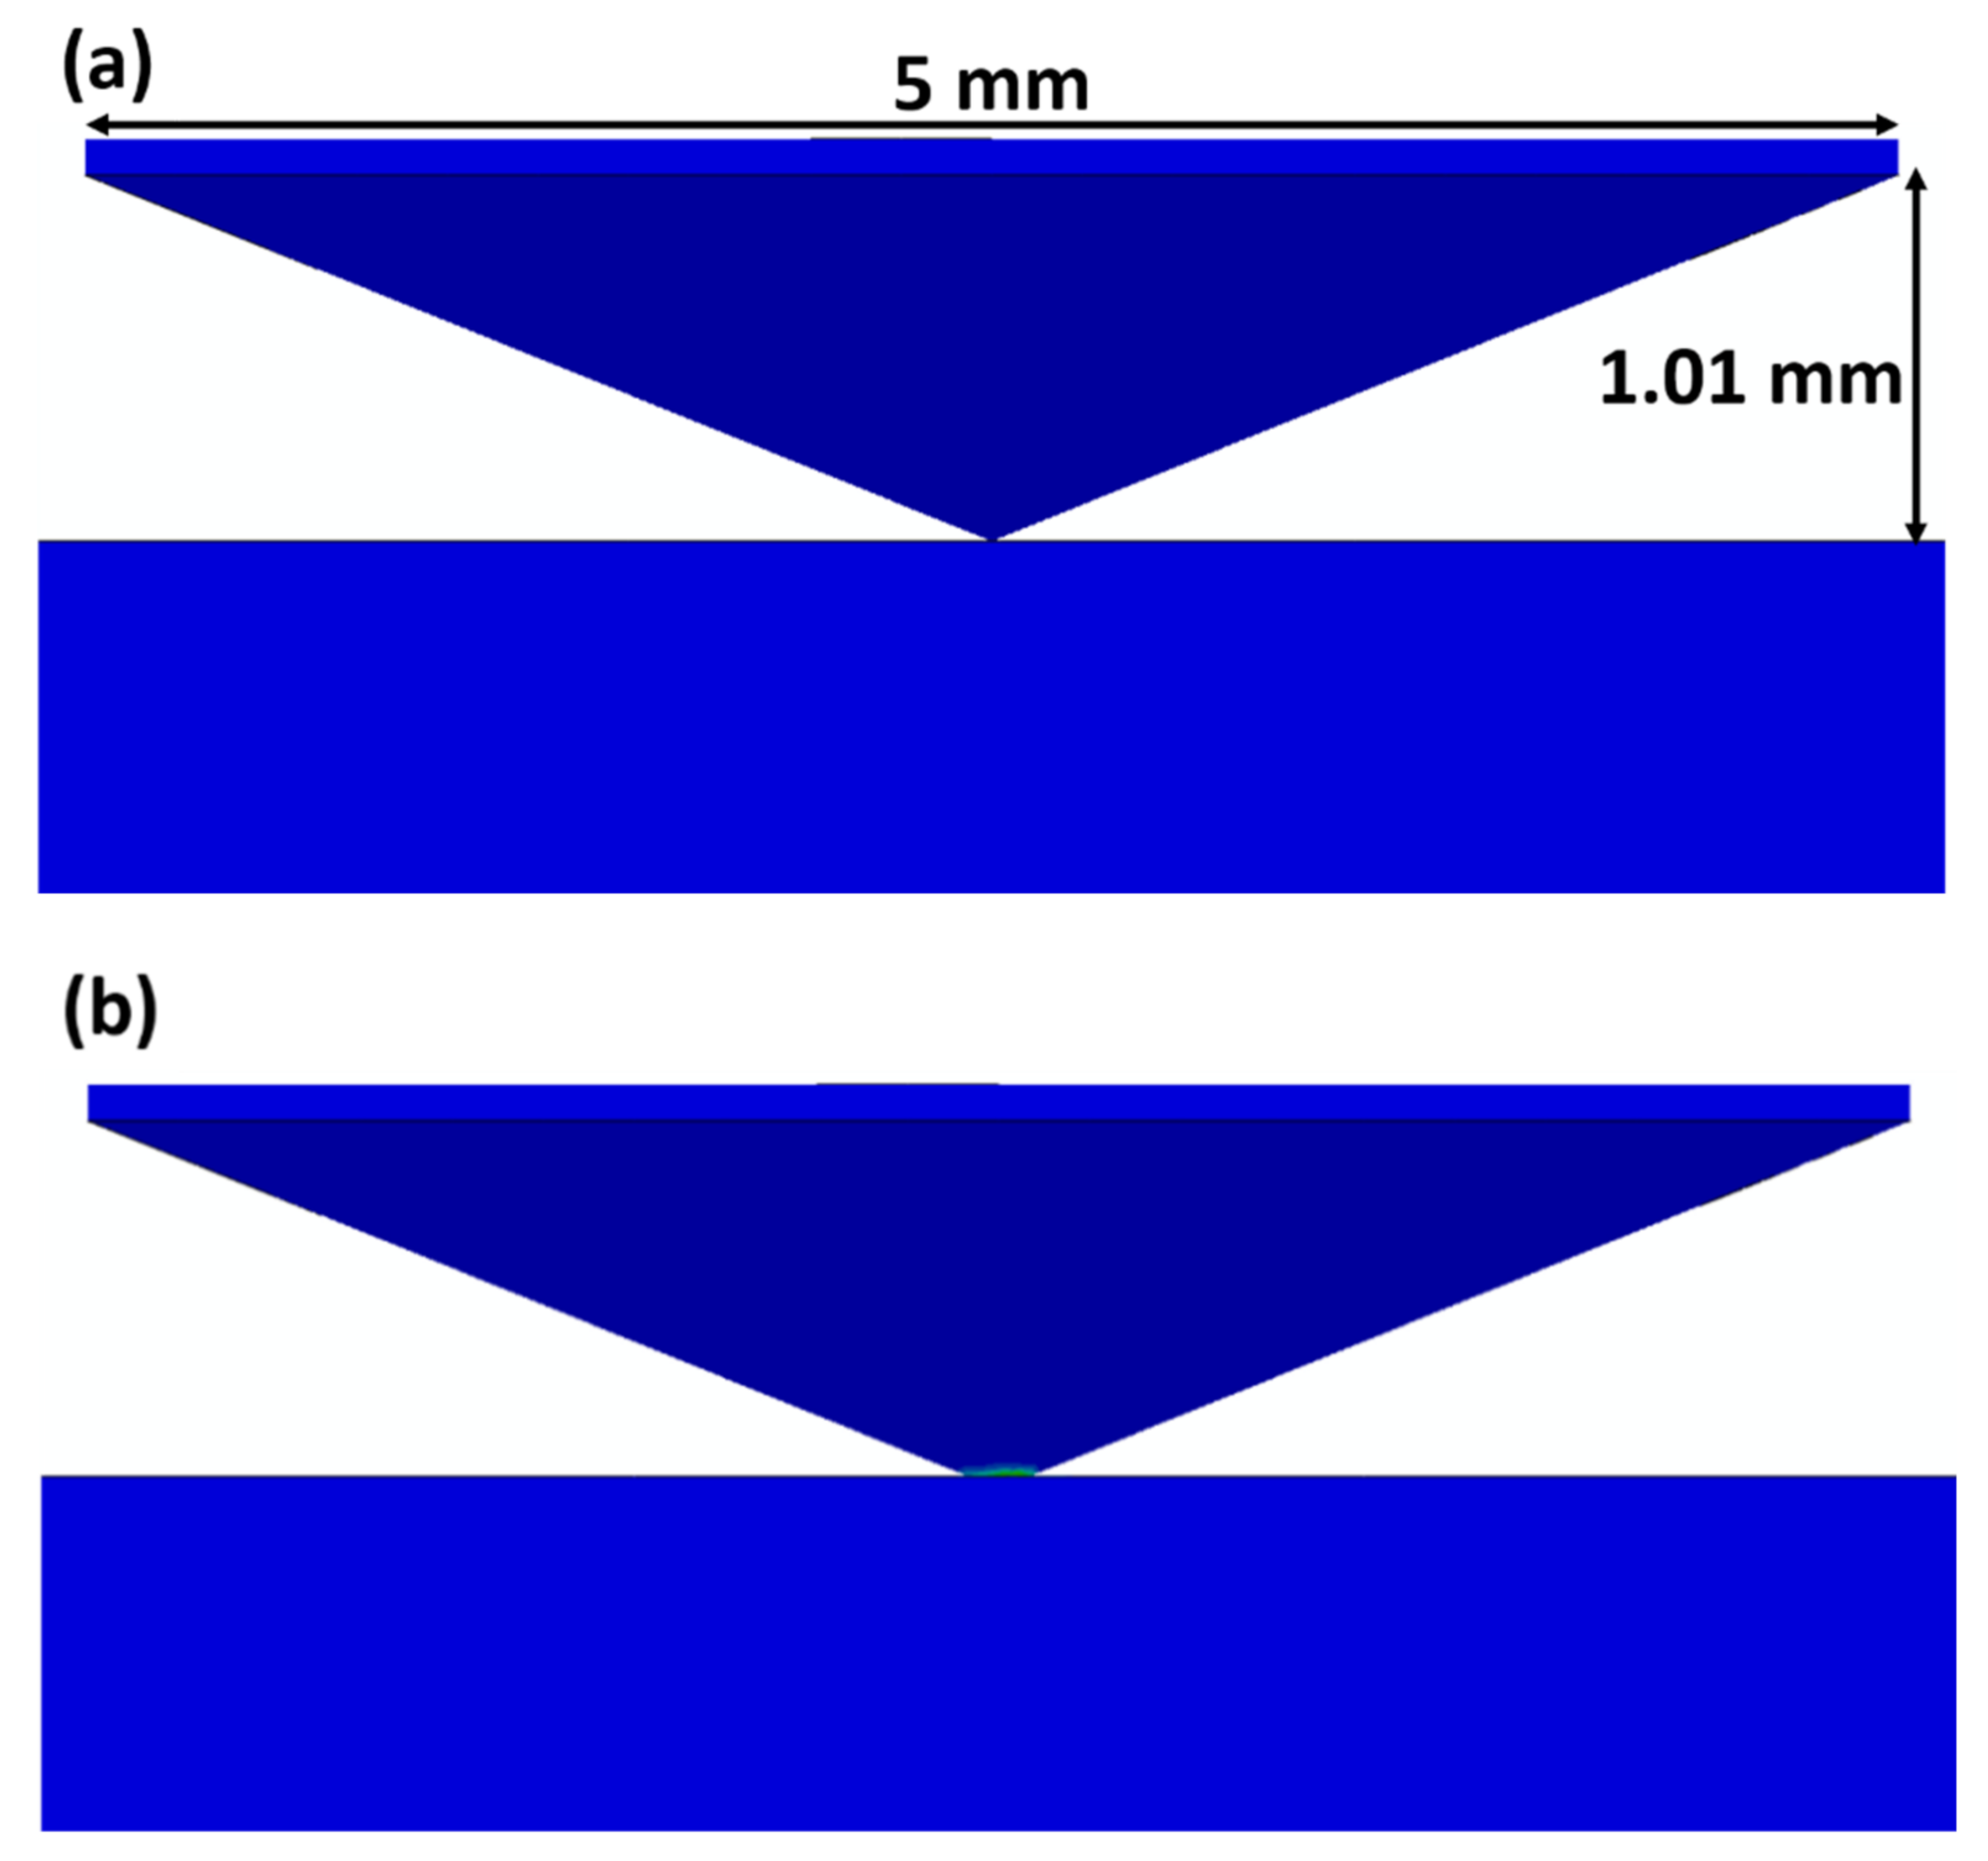
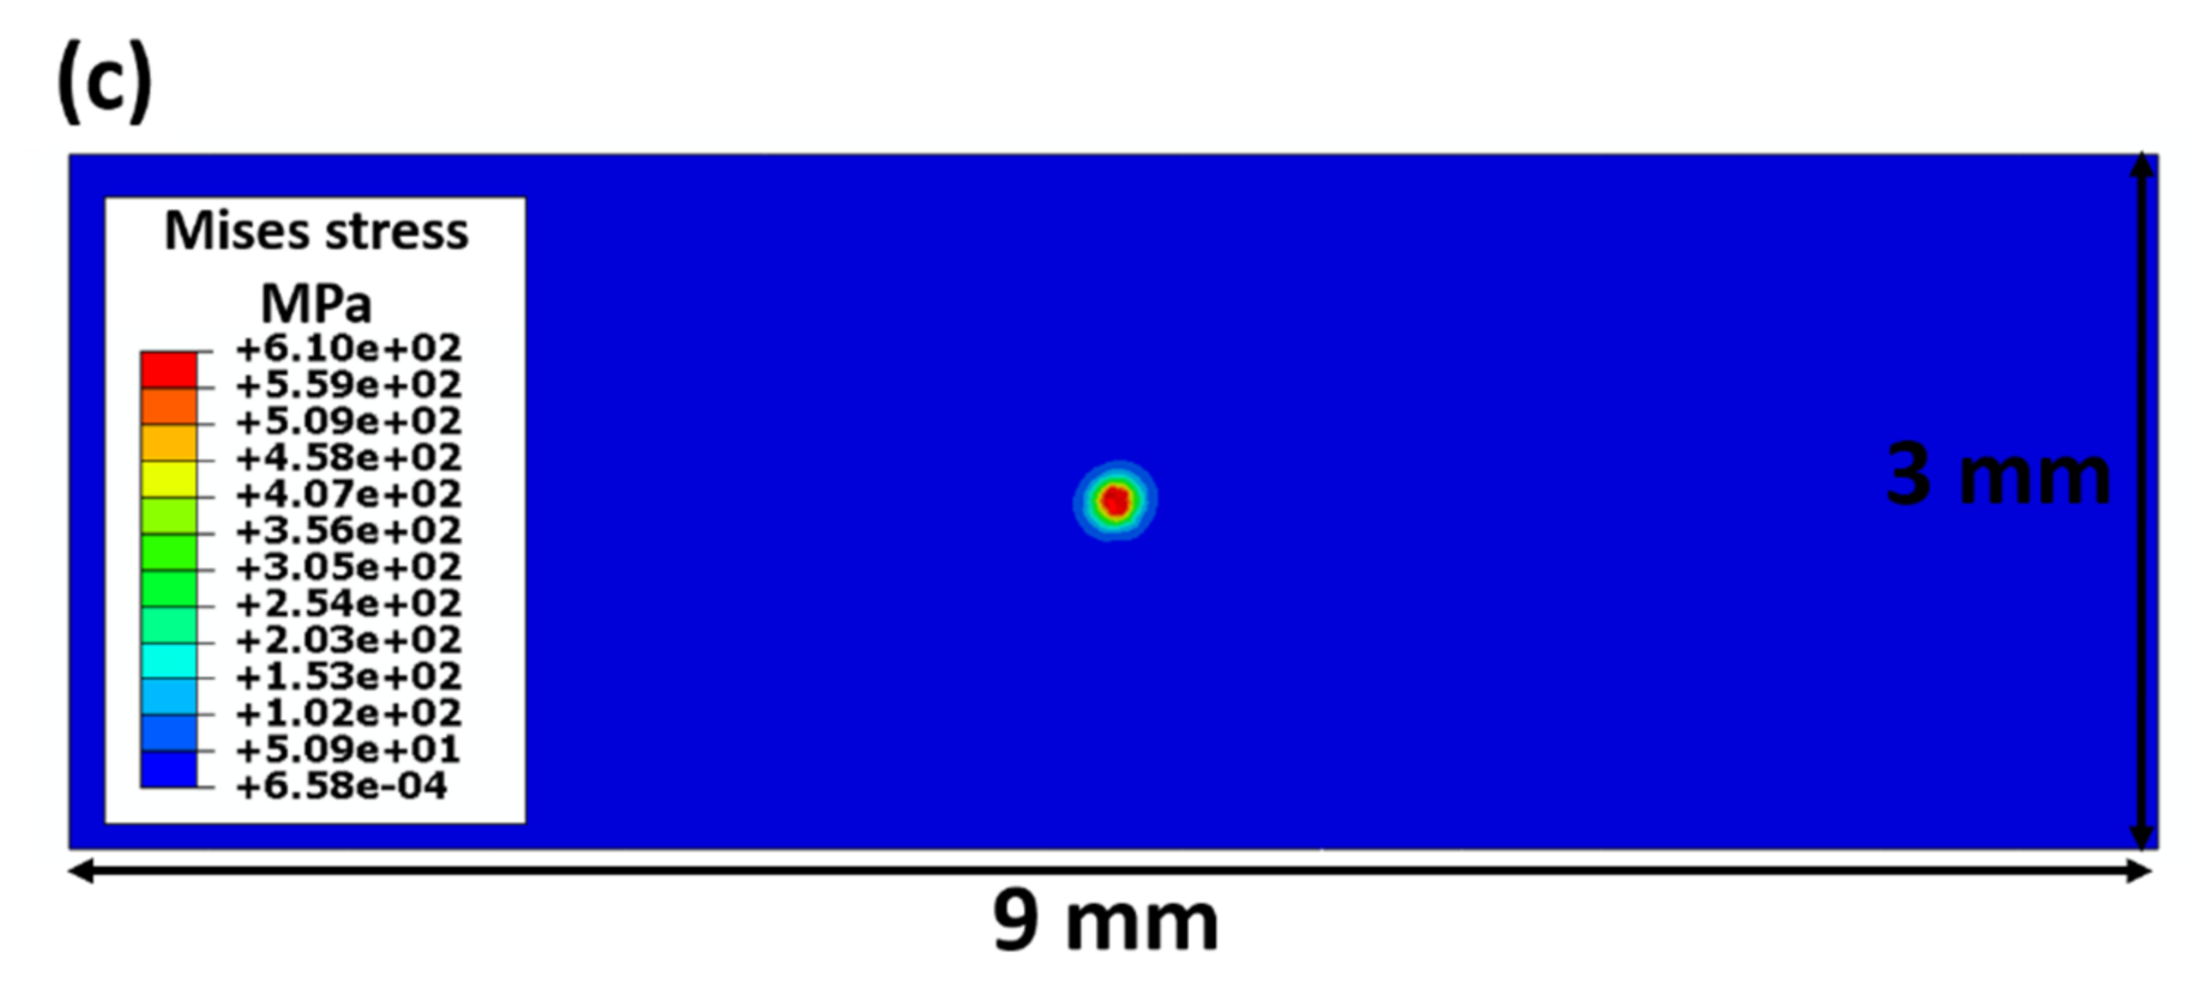
In Figure 3, the Vickers indentation behaviour is studied by the FEM model. The side view of the sample and Vickers indenter assembly before indentation are presented in Figure 3a. Similarly, Figure 3b displays the sample and Vickers indenter assembly after indentation. The top view of the sample (without Vickers indenter) after indentation is illustrated in Figure 3c. The square projection of the Vickers’ indenter can be observed on the sample surface. The stress value at the indented region is greater than 600 MPa (yield strength = 315 MPa [17]). This is expected to result in the local sample deformation.
3.2. Microstructural Characterisation
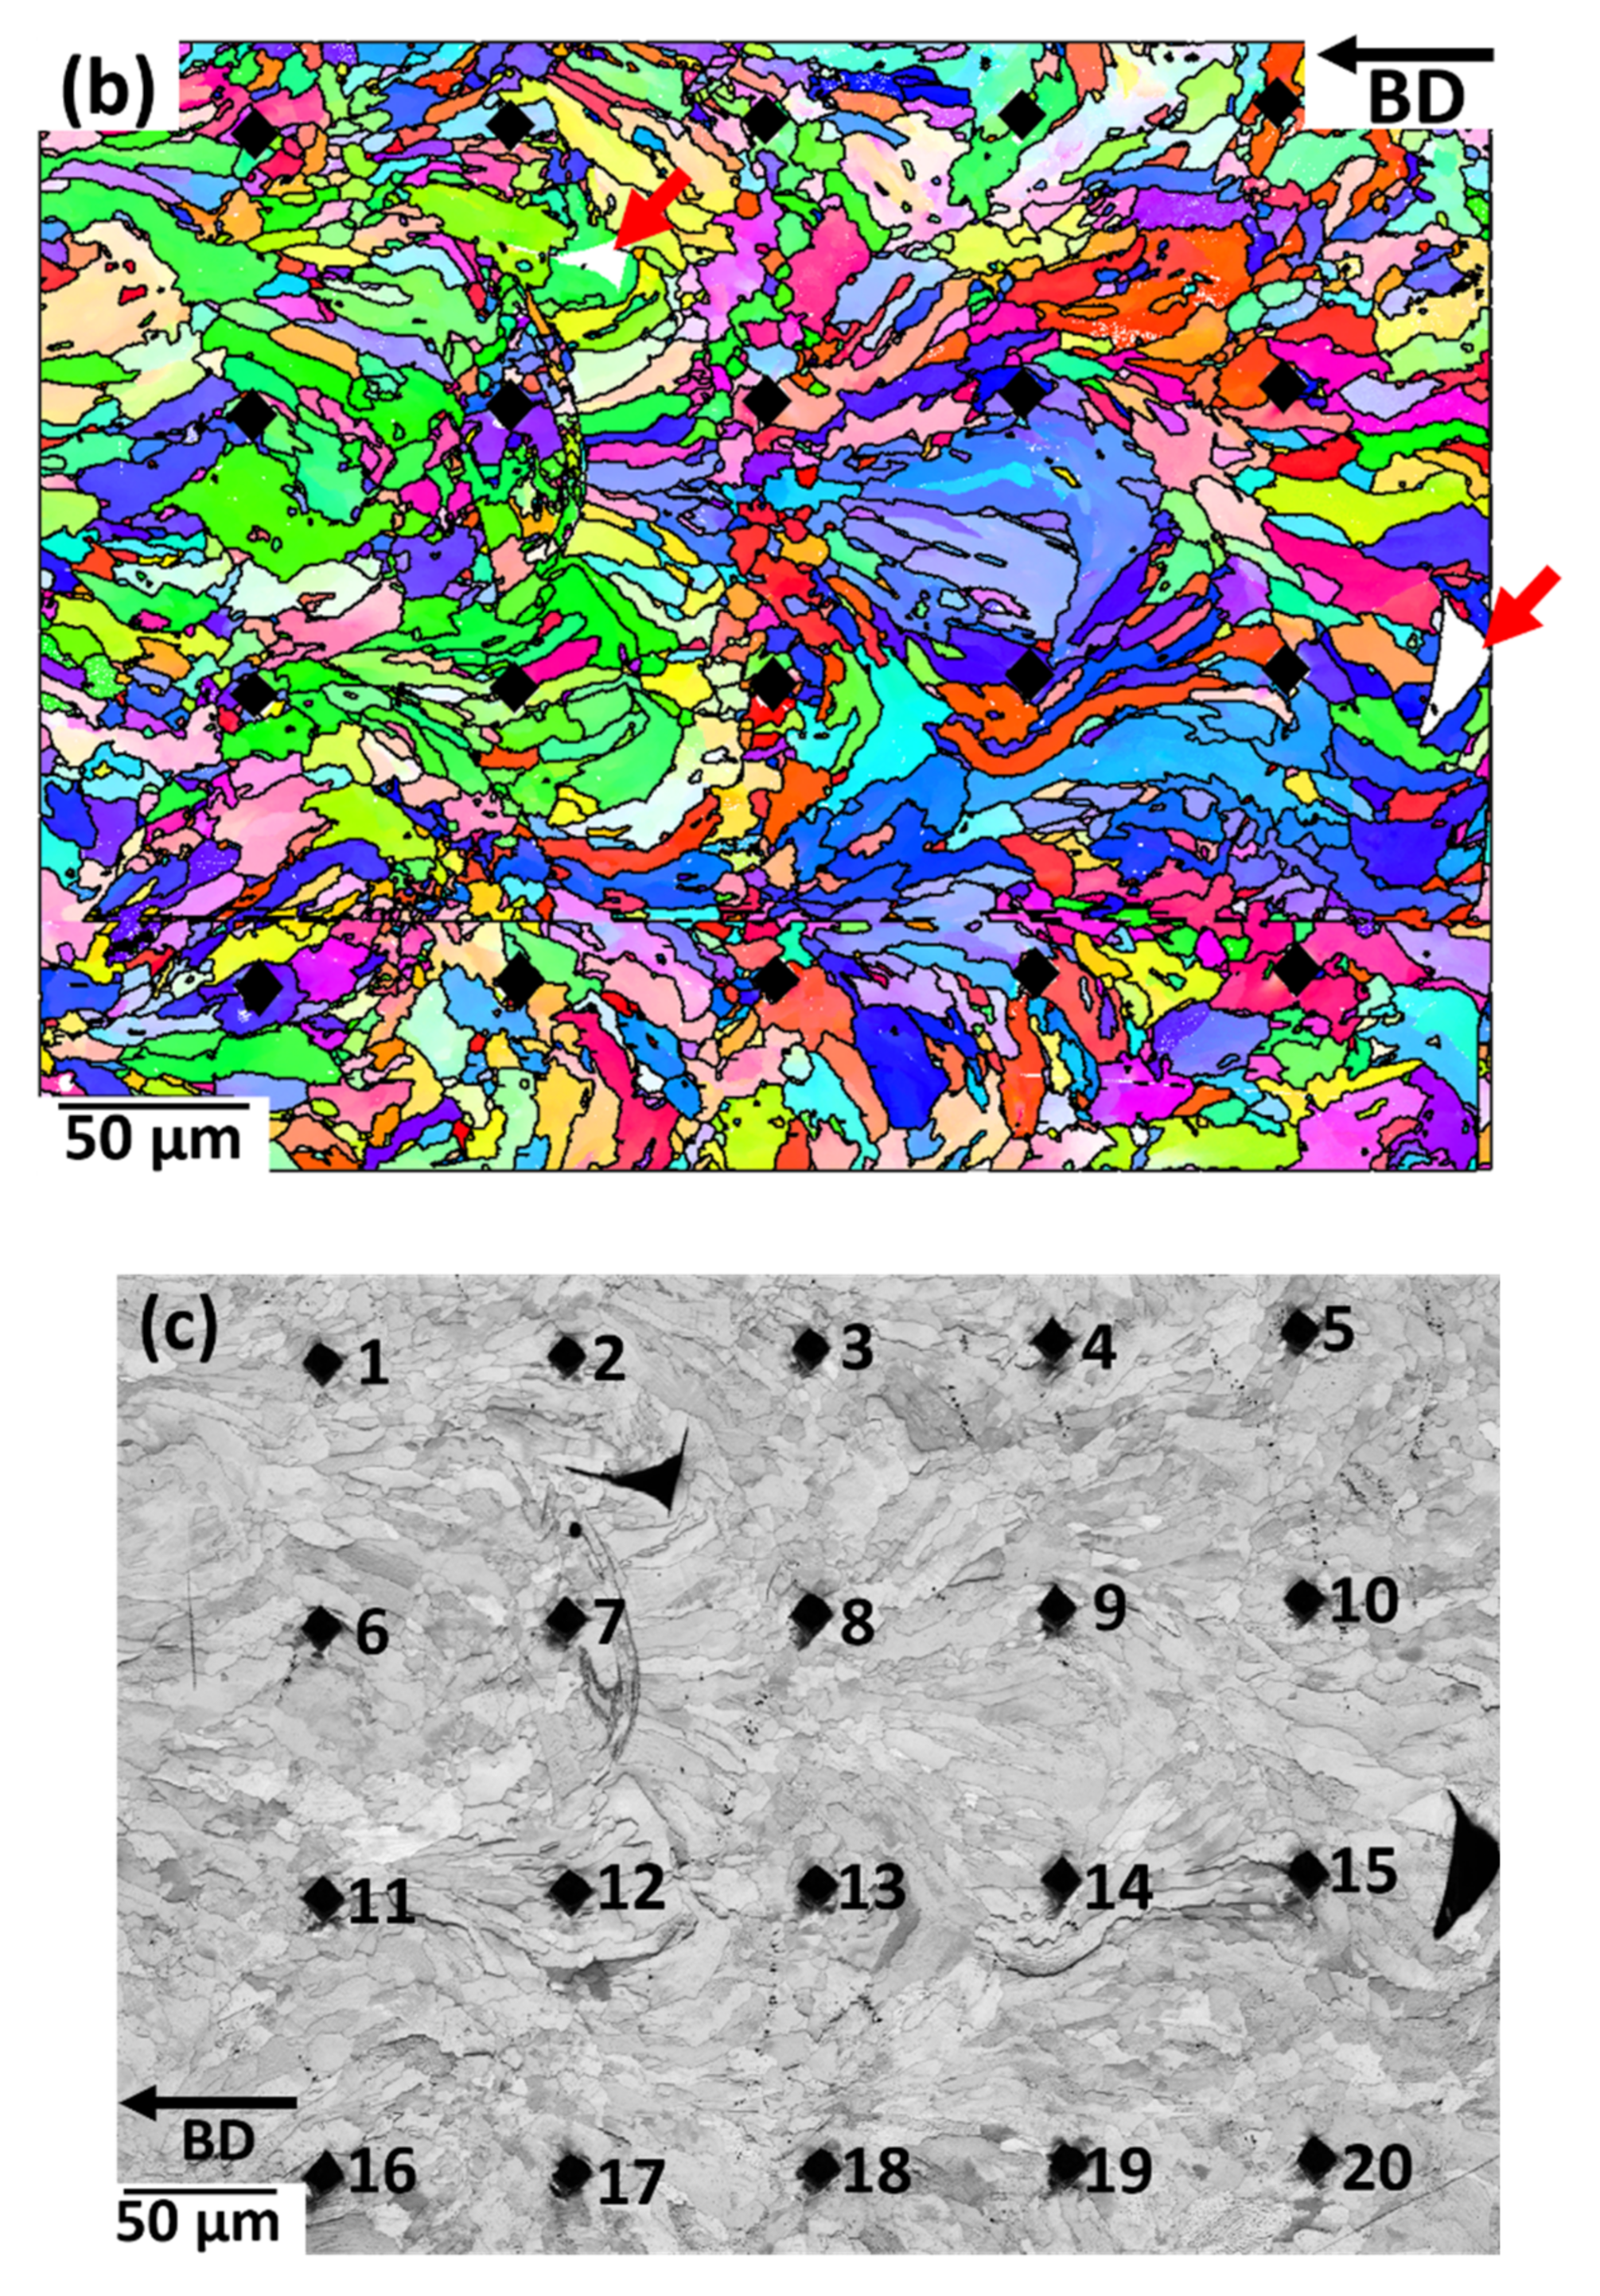
Figure 4 gives an overview of the microstructure of approximately the same region before indentation (Figure 4a) and after indentation (highlighted by black squares, Figure 4b,c). Elongated columnar grains are observed along the building direction (BD), which is along the horizontal direction. The melt pool borders (black dotted lines) are highlighted in Figure 4a.
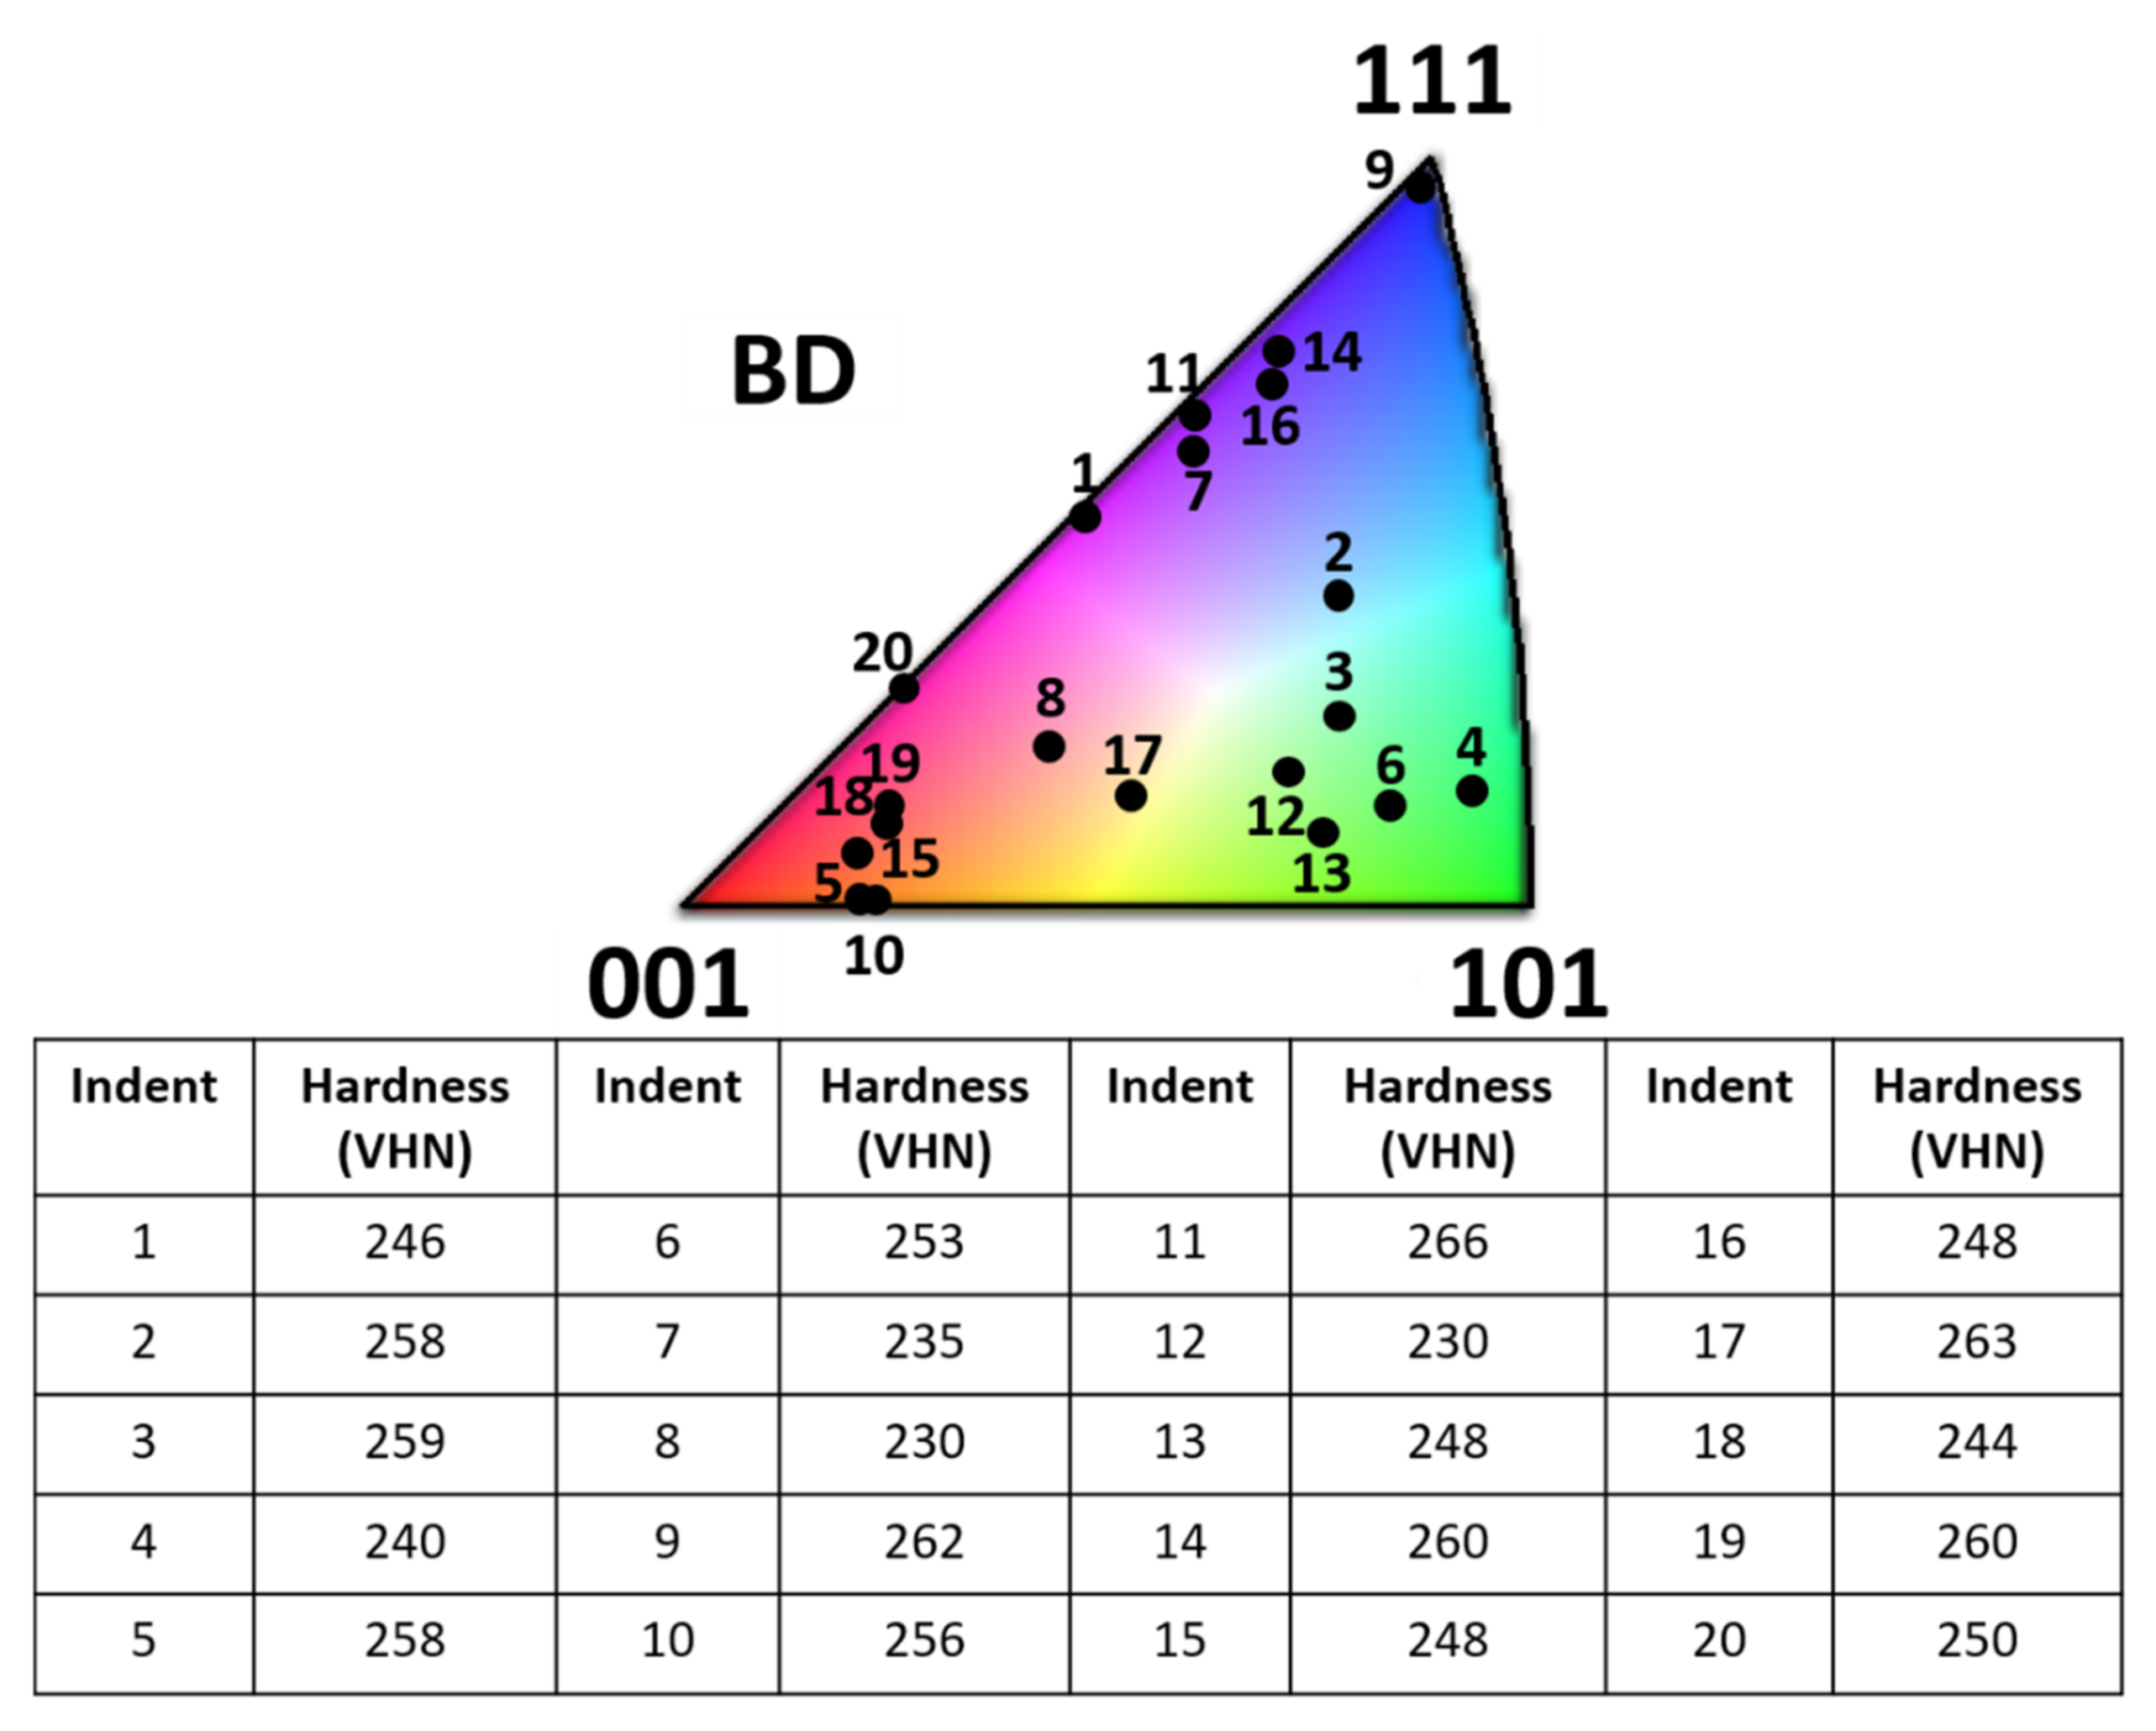
Conclusively, Figure 5 illustrates the orientation of the indented grains plotted on the inverse pole figure. As, in some cases, the indentation is at the grain boundary or not confined to one grain, here, the grain orientation is plotted for the grain containing the largest indentation area. In addition, the hardness values of the corresponding indentations are provided for each indentation. The hardness values vary between 230 VHN and 266 VHN (Vickers hardness number). For <111>||BD-oriented grains (indentation 7), the hardness is 235 VHN; for <110>||BD-oriented grains (indentation 13), it is 248 VHN. Quasi in-situ microstructural analysis of indentation 7 and indentation 13 are performed in the following sections.
4. Discussion
4.1. Quasi In-Situ Microstructural Analysis of Indentation 13
Figure 6a displays the SEM image of indentation 13 (marked in black square shape) and Figure 6b shows the magnified SEM image with wavy slip lines (due to multiple slip system activation). In Figure 6c,d, EBSD micrographs of indentation 13 are depicted. Here, three grains with orientations <100>||BD, <110>||BD and <111>||BD are observed. A <110>||BD-oriented grain before indentation (Figure 6c) and after indentation (Figure 6d) is highlighted. The indentation is not only confined to the <110>||BD oriented grain. Accordingly, the distribution of GNDs around indentation 13 is given in Figure 6e. A high concentration of GNDs is observed in the region near indentation 13 (highlighted by black arrows).
4.2. Topography of Indentation 13
Figure 7a shows the two-dimensional surface topography of indentation 13. Black and blue regions represent surface depression, whereas bright green regions represent the surface elevation for an indentation depth of 0.8 µm. In addition, the local surface height along the line AA′ (Figure 7a) is given in Figure 7b. Adjacent to the indentation region, a pile-up is observed due to dislocation propagation on slip planes [10]. The pile-up (height ≈ 0.4 µm) is due to deformation accommodation in the <110>||BD-oriented grains. No local surface depression is observed adjacent to the indentation. The plastic flow anisotropy during indentation can occur from (i) material or (ii) indenter geometry. Due to the noncentrosymmetric pyramidal shape of the Vickers’ indenter tip, anisotropic surface plastic flow or surface artefacts may occur during indentation. To overcome this issue and to study the effect of only the sample’s anisotropy on plastic flow, indentations using spherical or conical indentation tips are recommended.
4.3. Quasi In-Situ Microstructural Analysis of Indentation 7
Figure 8a,b show the SEM images of indentation 7. The magnified SEM image in Figure 8b shows slip lines. Figure 8c shows a grain with an orientation near <111>||BD before indentation and Figure 8d after indentation. Here, grain 1 (neighbouring the indentation) is marked for further analysis. Figure 8e plots the GNDs in the area near indentation 7. A high GND presence is observed near indentation 7. Grain 1 especially shows a high concentration of GNDs (highlighted by black arrows) near the region close to indentation 7 due to indentation-induced slip transfer.
4.4. Effect of Indentation within Grain 1 near Indentation 7
The effect of the indentation on grain 1 is visualised in Figure 9. Here, the grain 1 orientation before indentation (Figure 9a) is compared to the orientation after indentation (Figure 9b). Conclusively, Figure 9c summarises the change in orientation of grain 1 before and after indentation. A rotation of grain 1 by 5° around the [2] axis is detected. This effect is attributed to indentation-induced slip transfer in grain 1. To prove this, Figure 9d shows the GROD angles plotted on grain 1: a high GROD angle (>6°) is observed in grain 1 whose area is close to indentation 7. A concentration of the GROD axis at <112> can be noticed according to the inverse pole figure (Figure 9e). Figure 9f is the GROD axis plot on the EBSD map in which each pixel colour represents the corresponding GROD axis colour coded according to Figure 9e. For example, magenta-coloured pixels in Figure 9f represent the GROD axis clustering at the ≈<112> axis (Figure 9e). Due to deformation accommodation, the GROD axis includes concentrated magenta-coloured pixels (Figure 9f). A similar analysis of EBSD data by GROD has been undertaken for zirconium alloys to understand deformation mechanisms [19,20]. GROD misorientation maps are used to predict the amount of shear strain within the grains [19]. The presence of twins in the microstructure leads to a slightly lower average misorientation [19]. Regions within a twin show a lower GROD misorientation in comparison to the parent grain and nontwinned areas of the microstructure [19]. Microstructural features such as grain boundaries and triple junctions show higher GROD misorientations [19].
4.5. Indentation-Induced Slip Transfer in Grain 1 near Indentation 7
Figure 10a–c give an impression of the slip traces of the (a) {110}<111> slip system, (b) {112}<111> slip system and (c) {123}<111> slip system. Due to crystal symmetry, only 6 slip traces are identified for the {110}<111> slip system, 12 slip traces are identified for the {112}<111> slip system and 24 slip traces are identified for the {123}<111> slip system. For a better overview, Figure 10d shows the magnified SEM image of grain 1 near indentation 7. The formation of slip lines is noted (highlighted by black lines) and the formation of wavy slip lines is observed. This is due to the activation of multiple slip systems. Moreover, on superimposing the direction of slip lines with slip traces of slip systems, it is determined that the slip traces of all the slip systems match the slip line directions. Thus, multiple slip systems are activated in grain 1 near indentation 7.
4.6. Effect of Indentation on Micro-Texture
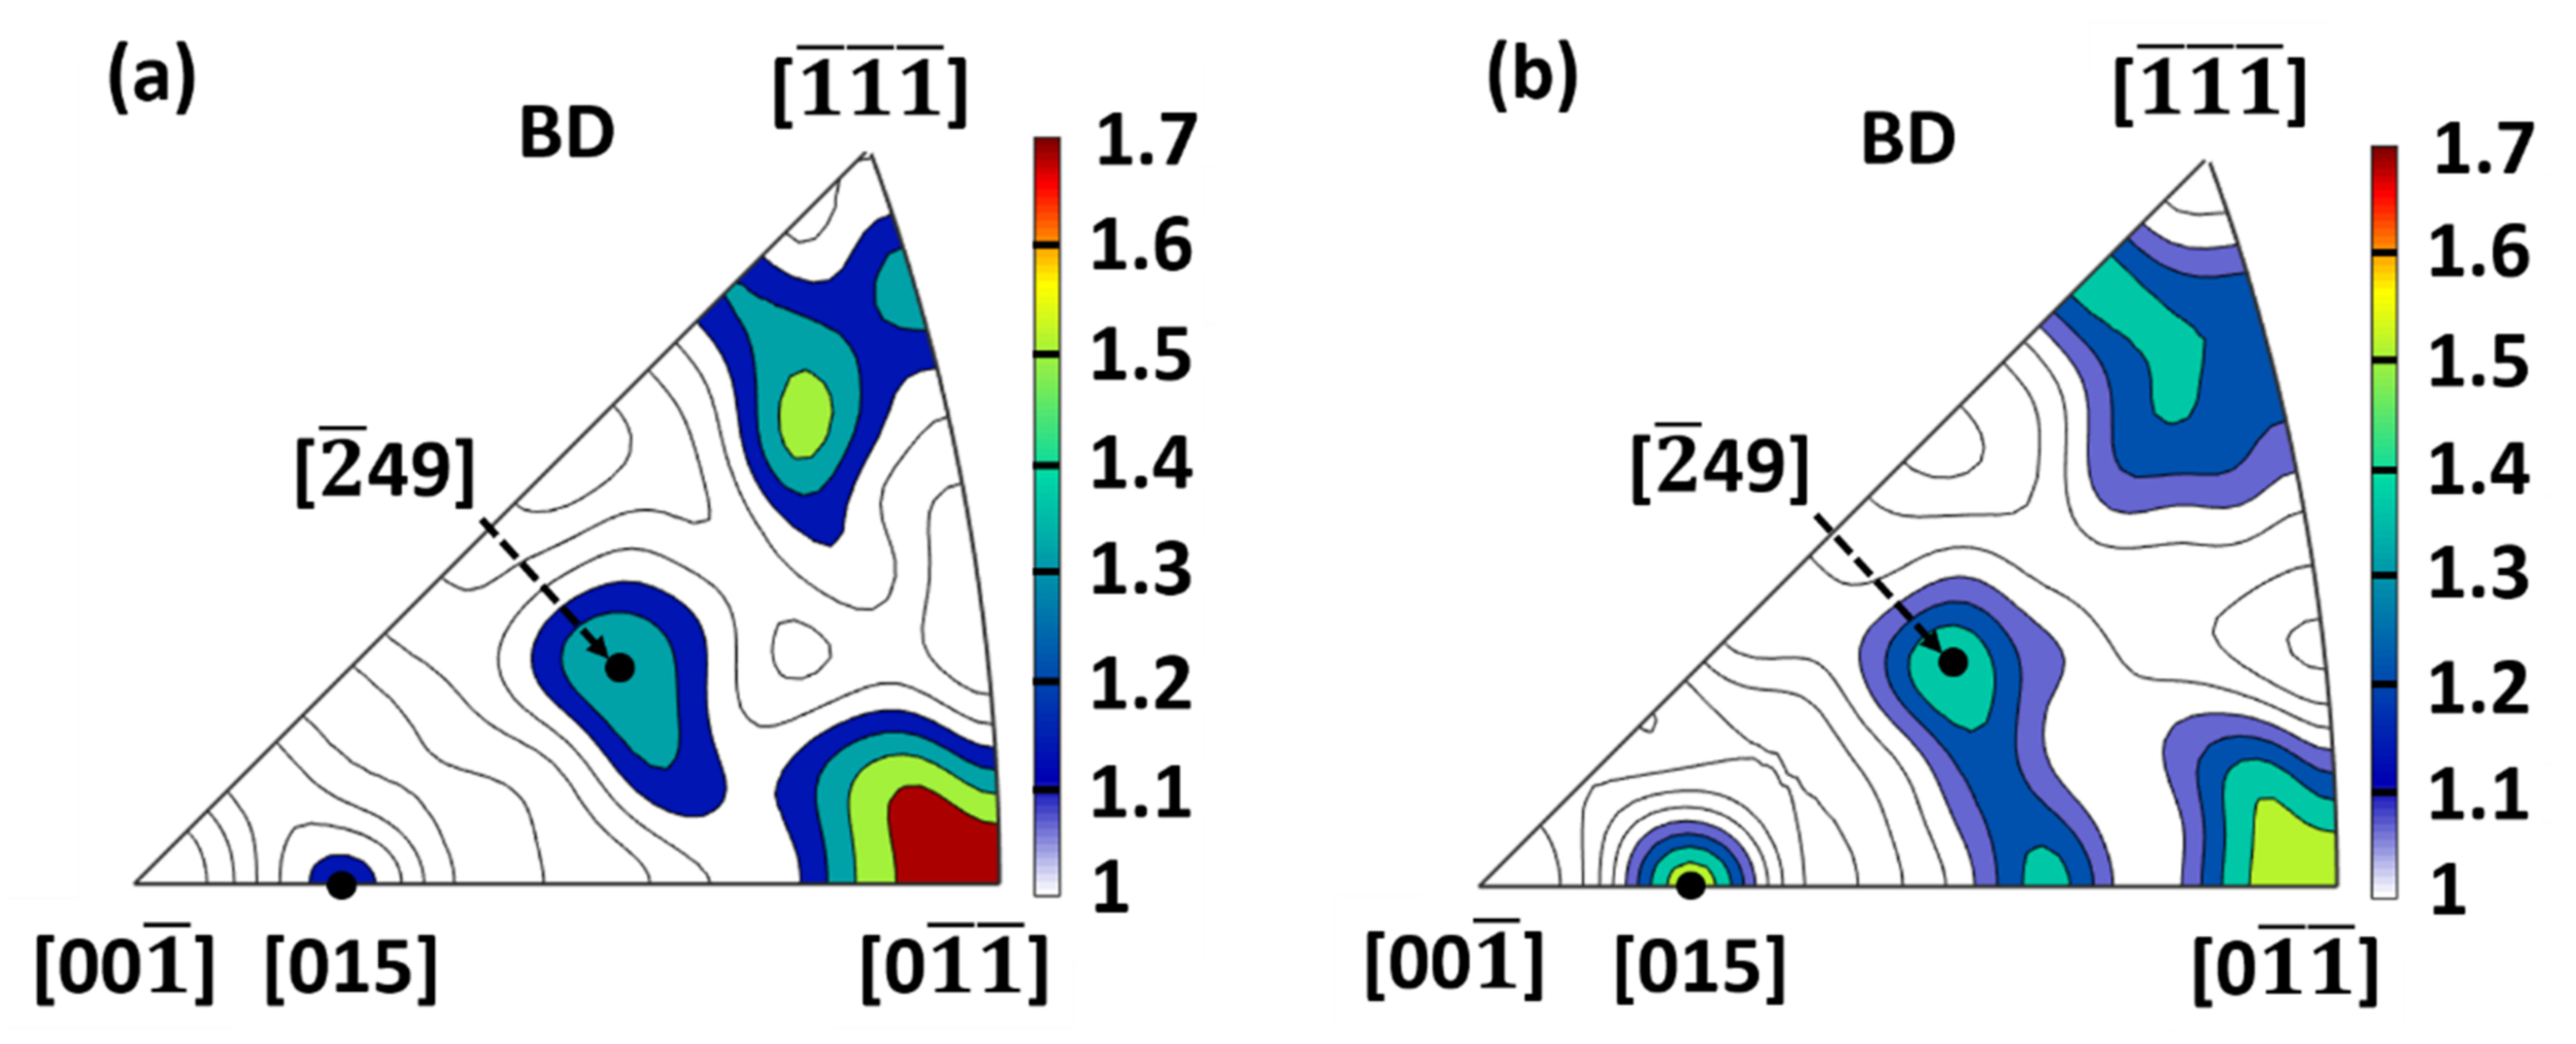
Figure 11 depicts the micro-texture plotted on an inverse pole figure (a) before and (b) after indentation. Both inverse pole figures show a weak texture (max intensity ≈ 1.7). The formation of new orientations is not observed upon comparing Figure 11a,b. Only a change in the intensity of pre-existing orientations is detected upon indentation. A weakening of the <011>||BD orientation is noticed after indentation. No change in the intensity of the [49]||BD orientation is perceived upon indentation, whereas a slight strengthening of the <015>||BD orientation is detected after indentation. The slight change in intensity of the orientations is due to indentation-induced slip transfer in the neighbouring grains, as discussed in Section 4.5. The slip transfer causes a change in the orientation of the neighbouring grains.
5. Conclusions
Based on the FEM simulations and quasi in-situ analysis of indentations on the surface of an additively manufactured FeCo sample, the following conclusions can be drawn:
- (1)
- FEM simulations show that as the building height increases from 0.001 m to 0.1 m, the melt pool shape changes from nearly circular to elliptical. The aspect ratio of the melt pool changes from 1.03 to 1.17. The melt pool shape depends on processing parameters, alloy composition and building height. This is due to the decrease in the heat dissipation capacity due to the stored residual heat from the previous build layers.
- (2)
- As the laser scan speed increases from 675 mm/s to 775 mm/s, the aspect ratio of the elliptical melt pool changes from 1.08 to 1.17. With the increase in laser scan speed, the time available for heat dissipation decreases. This leads to the increase in the aspect ratio of the elliptical melt pool.
- (3)
- FEM simulations of the Vickers indentation show a high-stress concentration (greater than 600 MPa) which is higher than the yield strength (314 MPa) of the FeCo alloy investigated. This is expected to result in a large plastic zone near the indentation.
- (4)
- Laser scanning confocal microscopy emphasises a pile-up near the indentation. Due to deformation accommodation in the <110>||BD-oriented grains, a pile-up is observed.
- (5)
- GROD analysis underlines the indentation-induced slip transfer in the neighbouring grains. A high GROD misorientation is observed in the neighbouring grain region adjacent to the indented grain due to deformation accommodation.
- (6)
- A high concentration of GNDs is observed in the area near the indentation due to misorientation (generated due to deformation accommodation).
- (7)
- On superimposing the direction of slip lines with slip traces, the activation of all the three slip systems ({110}<111>, {112}<111> and {123}<111>) is confirmed. This result is also verified by SEM images showing wavy slip lines. Hence, in grain 1 near indentation 7, multiple slip systems are activated.
- (8)
- Inverse pole figure maps highlight the weakening of the <110>||BD orientation and strengthening of the <015>||BD orientation. No change in the intensity of the [49]||BD orientation is detected. A minor change in the intensity of pre-existing orientations is detected upon indentation due to indentation-induced slip transfer in the neighbouring grains.
Supplementary Materials
The following supporting information can be downloaded at: https://www.mdpi.com/article/10.3390/magnetism2020007/s1, Figure S1: (a) Image of the sample and (b) image of the hardness testing machine used for making the indentations.
Author Contributions
Conceptualization, S.P. and K.-P.H.; methodology, S.P and K.-P.H.; software, S.P. and F.T; validation, S.P., F.T. and K.-P.H.; formal analysis, S.P.; investigation, S.P.; resources, K.-P.H. and M.S.; data curation, S.P. and F.T.; writing—original draft preparation, S.P.; writing—review and editing, K.-P.H.; visualization, S.P.; supervision, K.-P.H. and M.S.; project administration, M.S.; funding acquisition, M.S. All authors have read and agreed to the published version of the manuscript.
Funding
This research received no external funding.
Institutional Review Board Statement
Not applicable.
Informed Consent Statement
Not applicable.
Data Availability Statement
Not applicable.
Acknowledgments
The authors would like to thank Thomas Janzen for performing the EBSD experiments. The authors would like to acknowledge the help from the Chair of Applied Mechanics (FAM) for providing access to Abaqus CAE 2017 software.
Conflicts of Interest
The authors declare no conflict of interest.
References
- Babuska, T.F.; Wilson, M.A.; Johnson, K.L.; Whetten, S.R.; Curry, J.F.; Rodelas, J.M.; Atkinson, C.; Lu, P.; Chandross, M.; Krick, B.A.; et al. Achieving high strength and ductility in traditionally brittle soft magnetic intermetallics via additive manufacturing. Acta Mater. 2019, 180, 149–157. [Google Scholar] [CrossRef]
- Babuska, T.F.; Johnson, K.L.; Verdonik, T.; Subia, S.R.; Krick, B.A.; Susan, D.F.; Kustas, A.B. An additive manufacturing design approach to achieving high strength and ductility in traditionally brittle alloys via laser powder bed fusion. Addit. Manuf. 2020, 34, 101187. [Google Scholar] [CrossRef]
- Kustas, A.B.; Susan, D.F.; Johnson, K.L.; Whetten, S.R.; Rodriguez, M.A.; Dagel, D.J.; Michael, J.R.; Keicher, D.M.; Argibay, N. Characterization of the Fe-Co-1.5V soft ferromagnetic alloy processed by Laser Engineered Net Shaping (LENS). Addit. Manuf. 2018, 21, 41–52. [Google Scholar] [CrossRef]
- Chaudhary, V.; Sai Kiran Kumar Yadav, N.M.; Mantri, S.A.; Dasari, S.; Jagetia, A.; Ramanujan, R.V.; Banerjee, R. Additive manufacturing of functionally graded Co–Fe and Ni–Fe magnetic materials. J. Alloys Compd. 2020, 823, 153817. [Google Scholar] [CrossRef]
- Han, Y.; Ding, J.; Kong, F.L.; Inoue, A.; Zhu, S.L.; Wang, Z.; Shalaan, E.; Al-Marzouki, F. FeCo-based soft magnetic alloys with high Bs approaching 1.75 T and good bending ductility. J. Alloys Compd. 2017, 691, 364–368. [Google Scholar] [CrossRef]
- Urbanek, S.; Ponick, B.; Taube, A.; Hoyer, K.P.; Schaper, M.; Lammers, S.; Lieneke, T.; Zimmer, D. Additive Manufacturing of a Soft Magnetic Rotor Active Part and Shaft for a Permanent Magnet Synchronous Machine. In Proceedings of the 2018 IEEE Transportation and Electrification Conference and Expo, ITEC 2018, Long Beach, CA, USA, 13–15 June 2018; Institute of Electrical and Electronics Engineers, Inc.: Piscataway, NJ, USA, 2018; pp. 217–219. [Google Scholar]
- Suresh, K.S.; Kitashima, T.; Yamabe-Mitarai, Y. Effects of orientation on hardness, strain accumulation, and fracture. Mater. Sci. Eng. A 2014, 618, 335–344. [Google Scholar] [CrossRef]
- Gokhale, A.; Sarvesha, R.; Huang, E.W.; Lee, S.Y.; Prasad, R.; Singh, S.S.; Jain, J. Quantitative evaluation of grain boundary sliding and its dependence on orientation and temperature in pure Zn. Mater. Lett. 2019, 246, 24–27. [Google Scholar] [CrossRef]
- Sarvesha, R.; Gokhale, A.; Kumar, K.; Sharma, N.K.; Jain, J.; Singh, S.S. Effect of crystal orientation on indentation-induced deformation behavior of zinc. Mater. Sci. Eng. A 2020, 776, 139064. [Google Scholar] [CrossRef]
- Xia, W.; Dehm, G.; Brinckmann, S. Insight into indentation-induced plastic flow in austenitic stainless steel. J. Mater. Sci. 2020, 55, 9095–9108. [Google Scholar] [CrossRef]
- Xia, W.; Dehm, G.; Brinckmann, S. Unraveling indentation-induced slip steps in austenitic stainless steel. Mater. Des. 2019, 183, 108169. [Google Scholar] [CrossRef]
- Zameer Abbas, S.; Ahmad Khalid, F.; Zaigham, H. Indentation fracture toughness behavior of FeCo-based bulk metallic glass intrinsic composites. J. Non-Cryst. Solids 2017, 457, 86–92. [Google Scholar] [CrossRef]
- Zameer Abbas, S.; Ahmad Khalid, F.; Zaigham, H. Indentation and deformation behavior of FeCo-based bulk metallic glass alloys. Mater. Sci. Eng. A 2016, 654, 426–435. [Google Scholar] [CrossRef]
- Pramanik, S.; Tasche, L.; Hoyer, K.-P.P.; Schaper, M. Investigating the microstructure of an additively manufactured FeCo alloy: An electron microscopy study. Addit. Manuf. 2021, 46, 102087. [Google Scholar] [CrossRef]
- Hielscher, R.; Schaeben, H. A novel pole figure inversion method: Specification of the MTEX algorithm. J. Appl. Crystallogr. 2008, 41, 1024–1037. [Google Scholar] [CrossRef]
- Pantleon, W. Resolving the geometrically necessary dislocation content by conventional electron backscattering diffraction. Scr. Mater. 2008, 58, 994–997. [Google Scholar] [CrossRef]
- Pramanik, S.; Tasche, L.; Hoyer, K.-P.; Schaper, M. Correlation between Taylor model prediction and TEM-based microstructural investigations of quasi in-situ tensile deformation of additively manufactured FeCo alloy. J. Mater. Eng. Perform. 2021, 30, 8048–8056. [Google Scholar] [CrossRef]
- Cheng, B.; Lydon, J.; Cooper, K.; Cole, V.; Northrop, P.; Chou, K. Melt Pool Dimension Measurement in Selective Laser Melting Using Thermal Imaging. In Proceedings of the 28th Annual International Solid Freeform Fabrication Symposium—An Additive Manufacturing Conference, Austin, TX, USA, 14 August 2017. [Google Scholar]
- Tong, V.; Wielewski, E.; Britton, B. Characterisation of slip and twinning in high rate deformed zirconium with electron backscatter diffraction. arXiv 2018, arXiv:1803.00236. [Google Scholar]
- Tong, V.; Wielewski, E.; Britton, B. Understanding plasticity in zirconium using in-situ measurement of lattice rotations. arXiv 2019, arXiv:1910.04187. [Google Scholar]
Figure 1.
Isometric views (a,c,e) and magnified top views (b,d,f) of the sample for (a,b) 0.001 m build height, (c,d) 0.01 m build height and (e,f) 0.1 m build height. The length and width of the sample is 0.1 m.
Figure 1.
Isometric views (a,c,e) and magnified top views (b,d,f) of the sample for (a,b) 0.001 m build height, (c,d) 0.01 m build height and (e,f) 0.1 m build height. The length and width of the sample is 0.1 m.
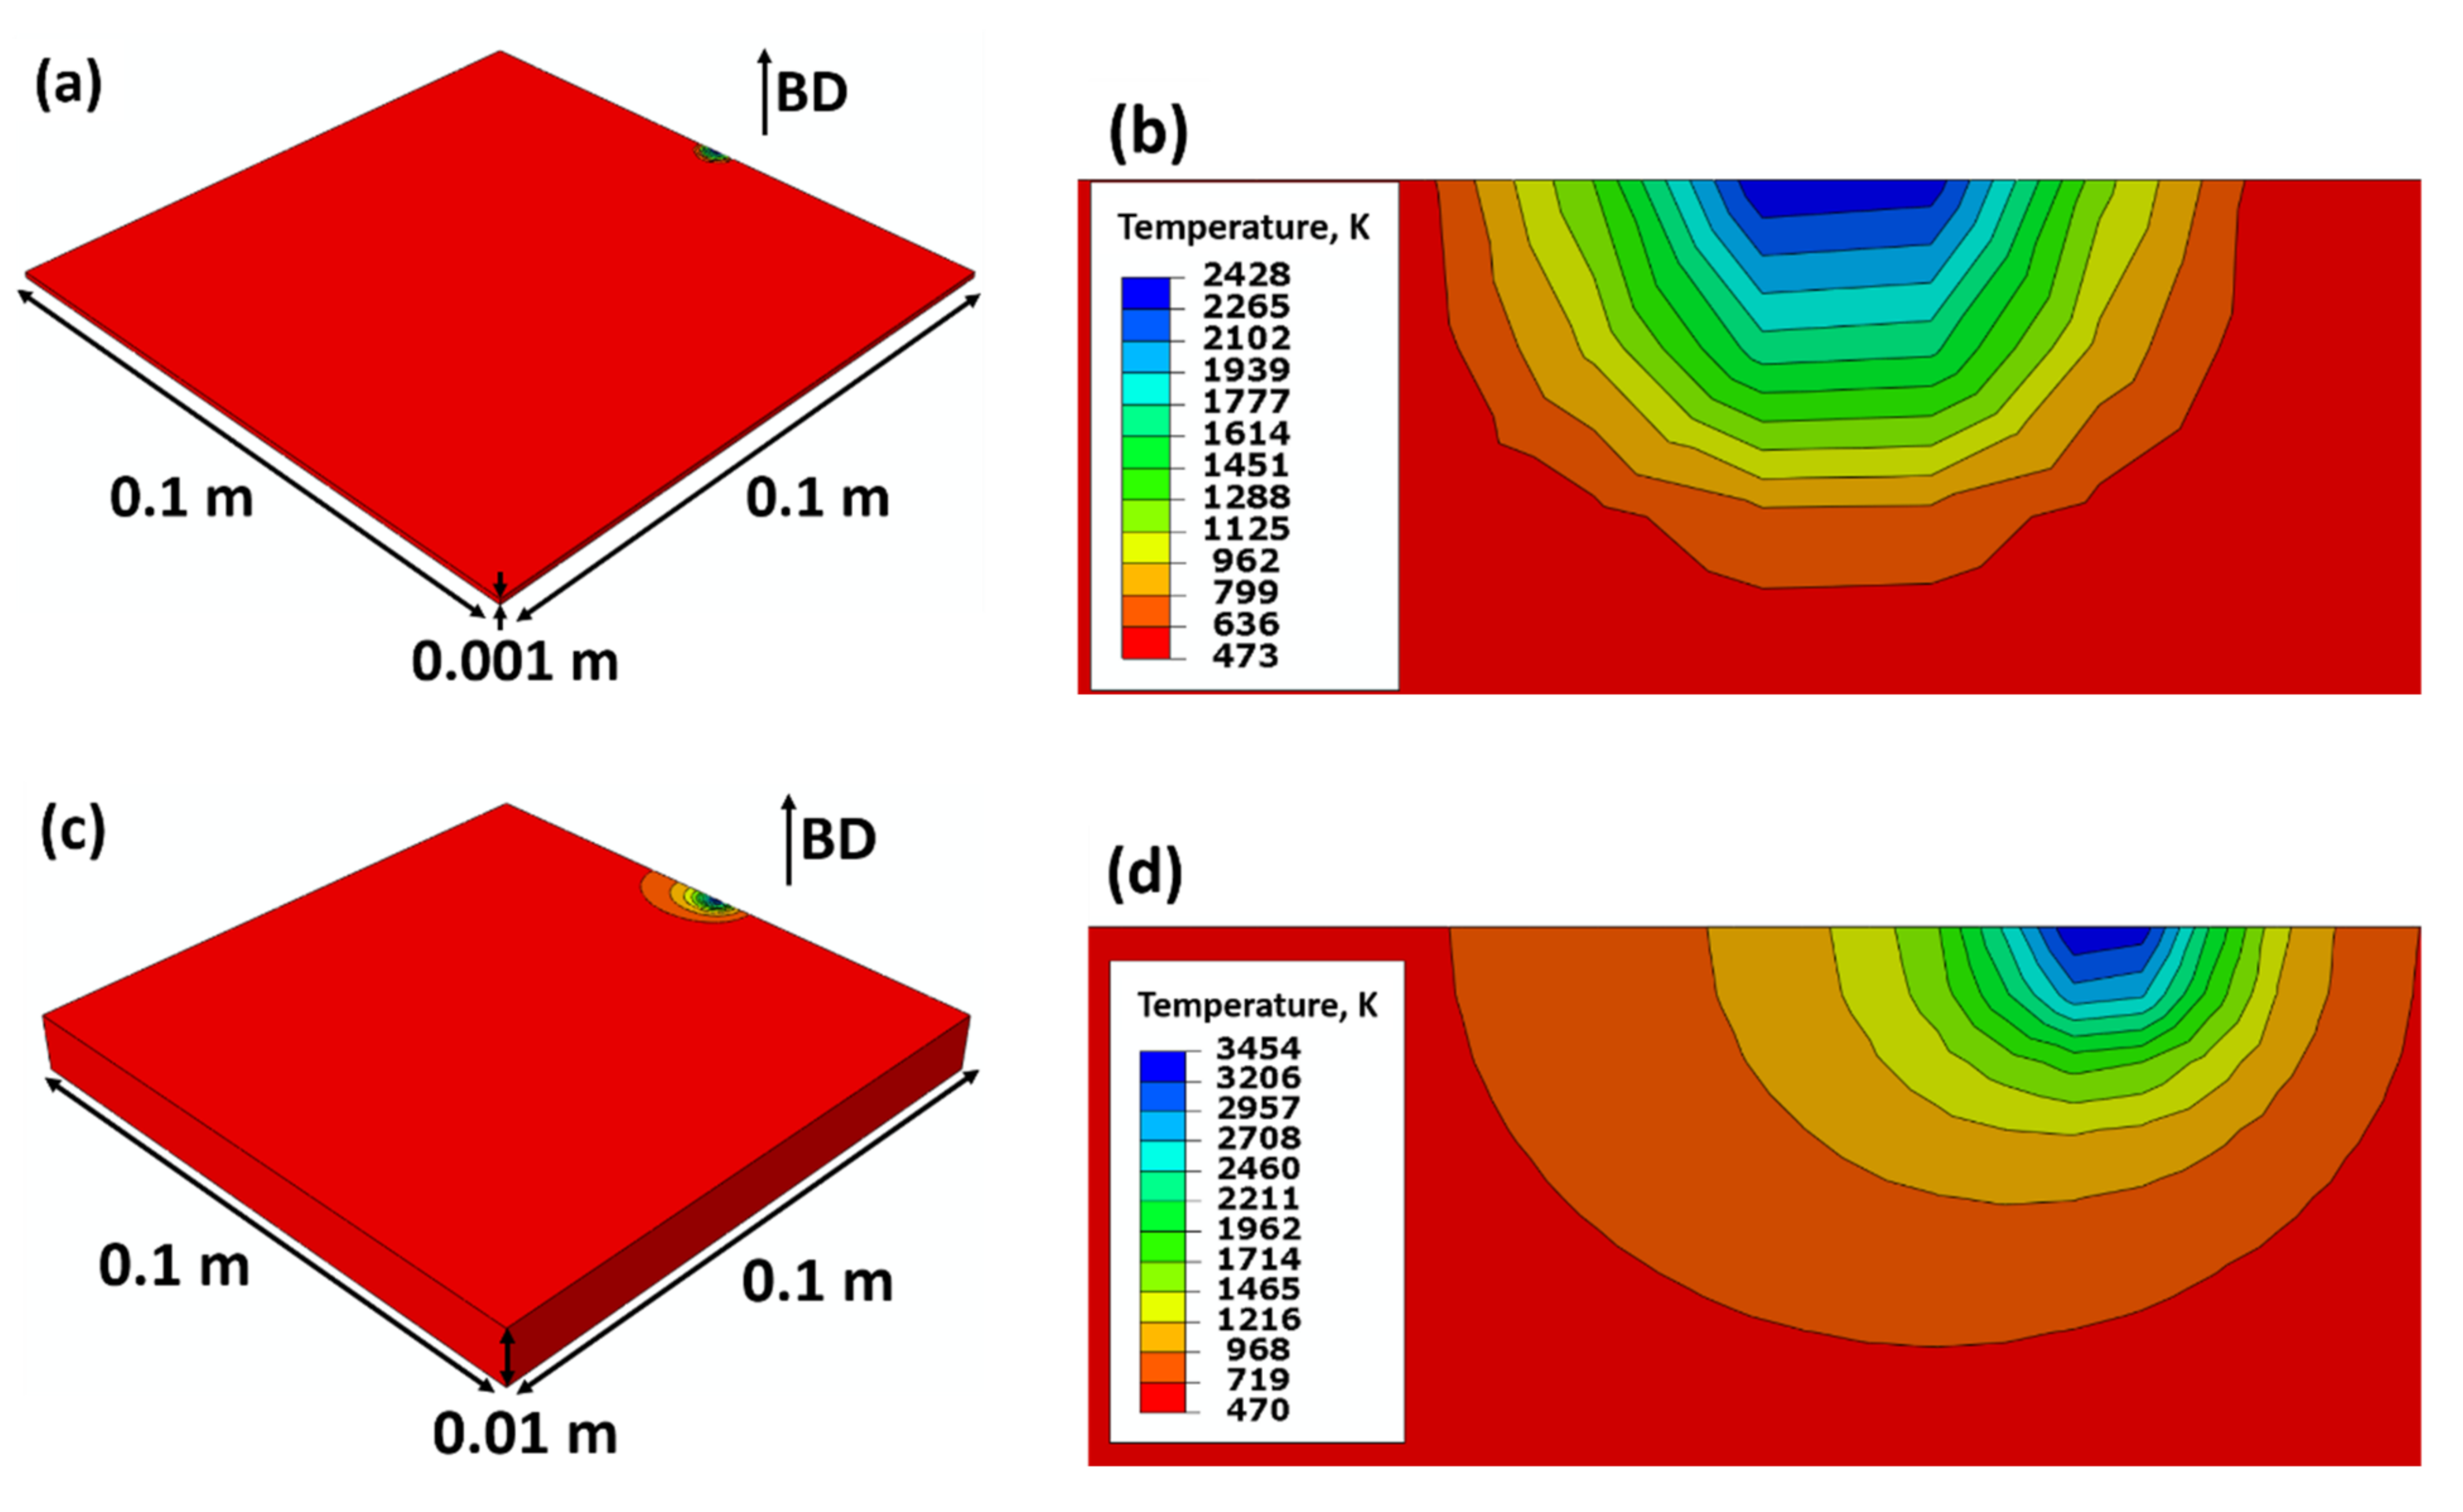

Figure 2.
Top view (a,c) and magnified top view (b,d) of the sample for 675 mm/s laser scan speed (a,b) and 775 mm/s laser scan speed (c,d). The sample dimensions are length 0.1 m, width 0.1 m and height 0.01 m.
Figure 2.
Top view (a,c) and magnified top view (b,d) of the sample for 675 mm/s laser scan speed (a,b) and 775 mm/s laser scan speed (c,d). The sample dimensions are length 0.1 m, width 0.1 m and height 0.01 m.
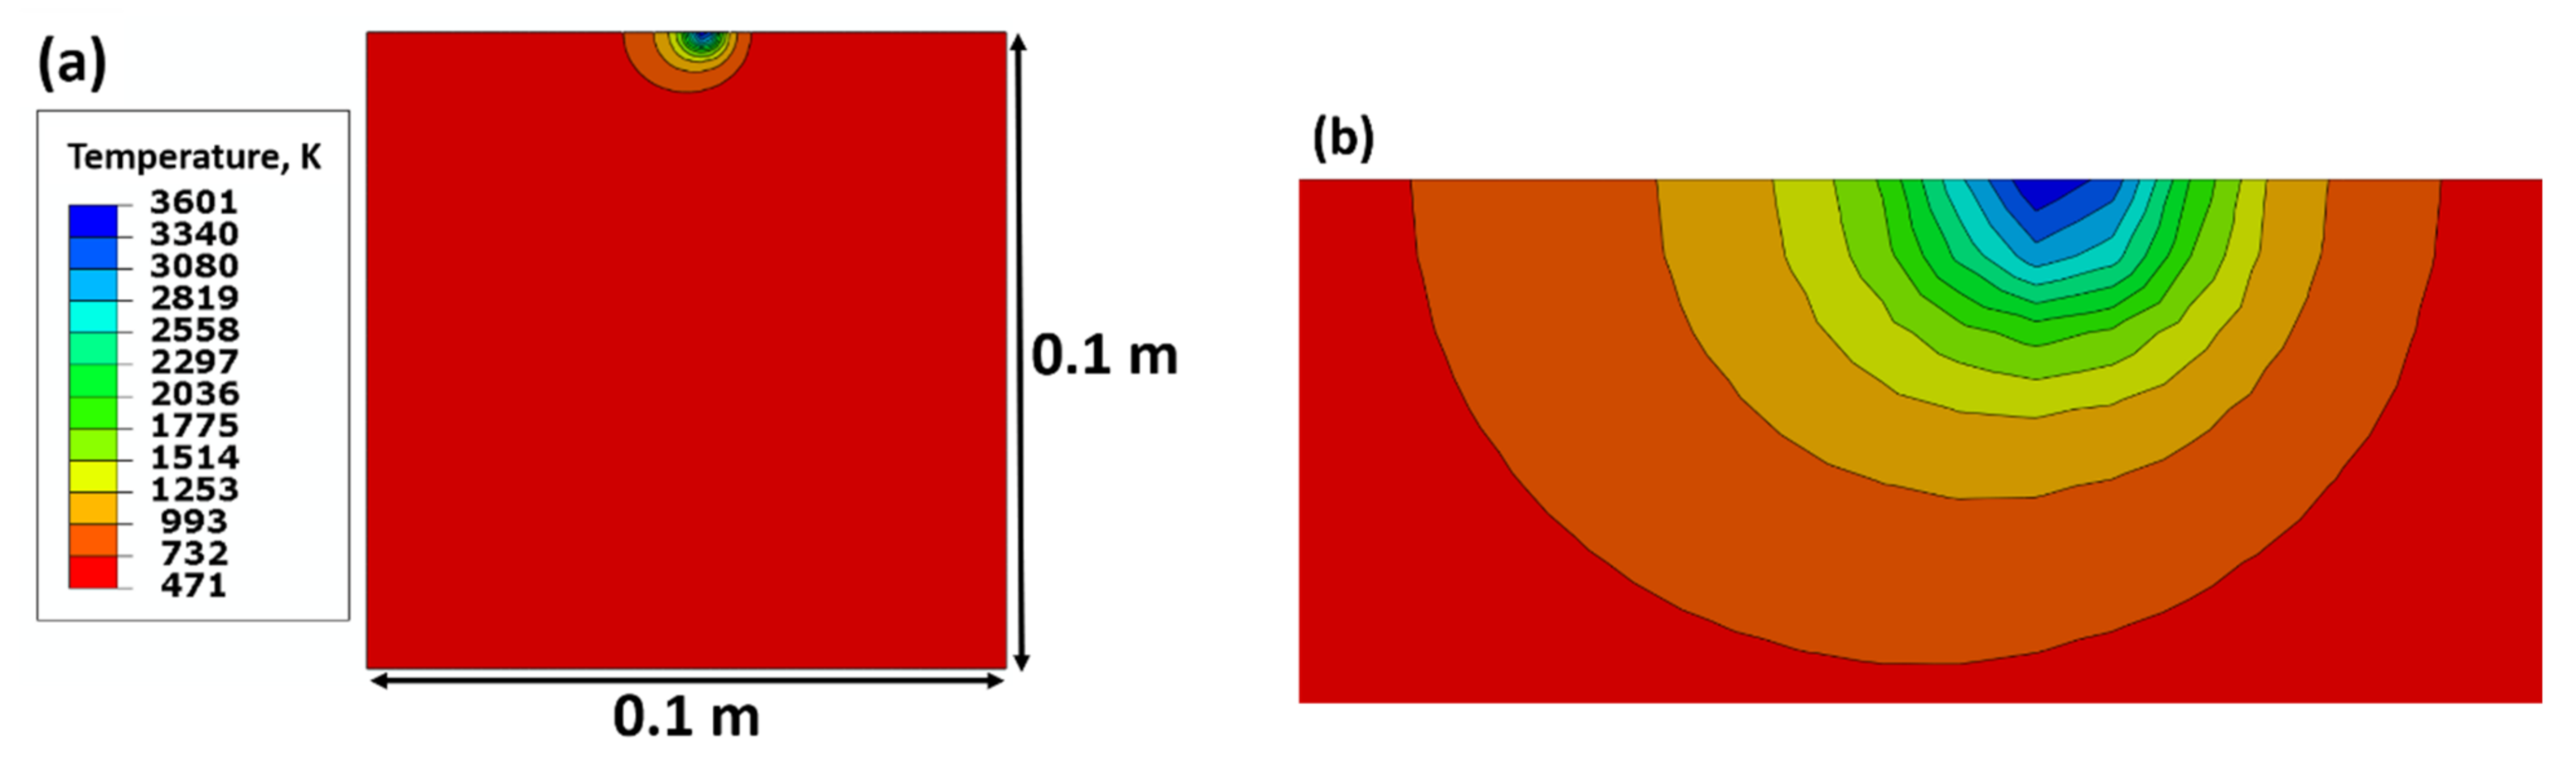

Figure 3.
Magnified side view image of the sample and Vickers indenter assembly (a) before indentation and (b) after indentation, and (c) top view of the surface after indentation.
Figure 3.
Magnified side view image of the sample and Vickers indenter assembly (a) before indentation and (b) after indentation, and (c) top view of the surface after indentation.


Figure 4.
EBSD microstructure of sample (a) before indentation and (b) after indentation (black squares), and (c) image quality microstructure after indentation. White areas (marked by red arrows) in (b) show the unindexed areas. In (c), indentations are visualised by squares and their corresponding numbers. BD = build direction.


Figure 5.
Inverse pole figure plot showing the orientation of the indented grains. The table summarizes the indentation number and the corresponding hardness values. BD is the build direction.
Figure 5.
Inverse pole figure plot showing the orientation of the indented grains. The table summarizes the indentation number and the corresponding hardness values. BD is the build direction.

Figure 6.
(a,b) SEM microstructures after indentation 13; quasi in-situ EBSD microstructure of indentation 13 (c) before and (d) after indentation; and (e) geometrically necessary dislocations (in m−2). Black arrows in (e) point out a high concentration of geometrically necessary dislocations near indentation 13.
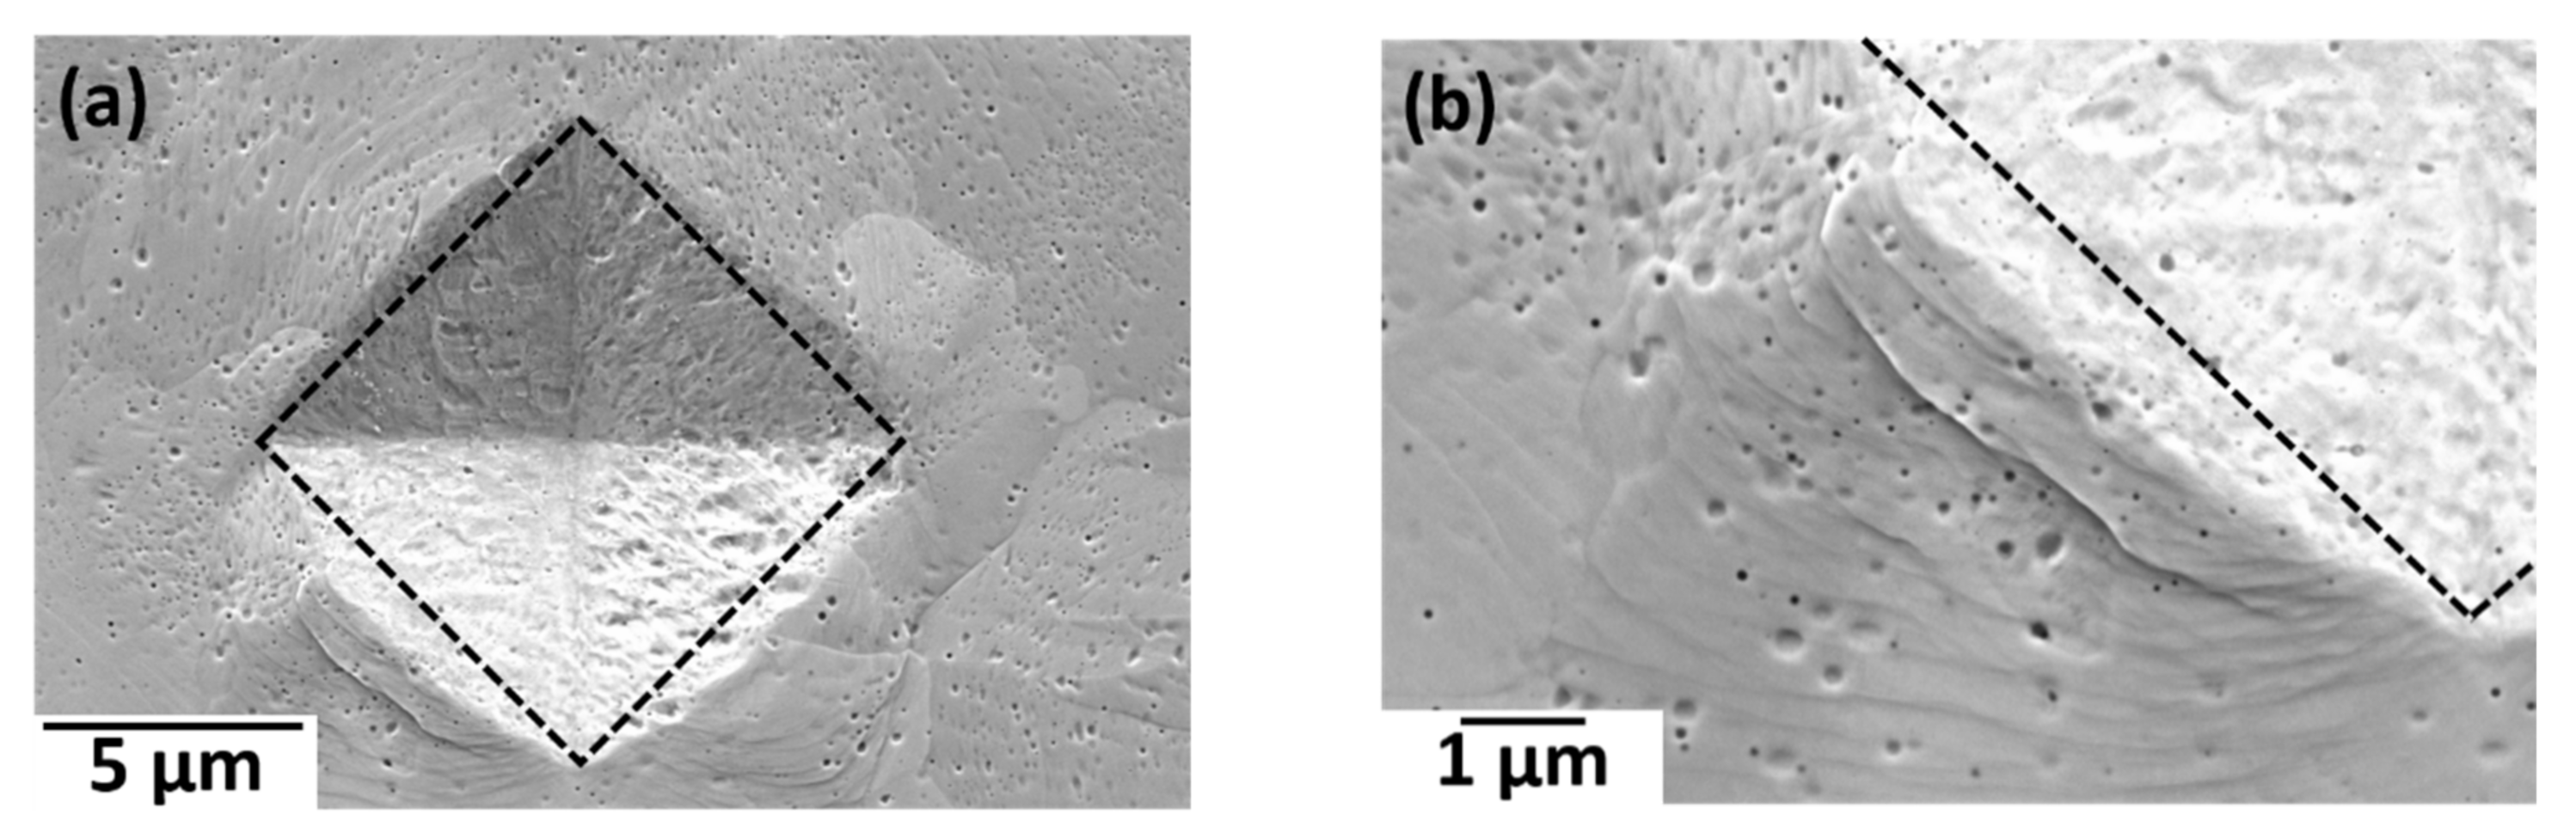
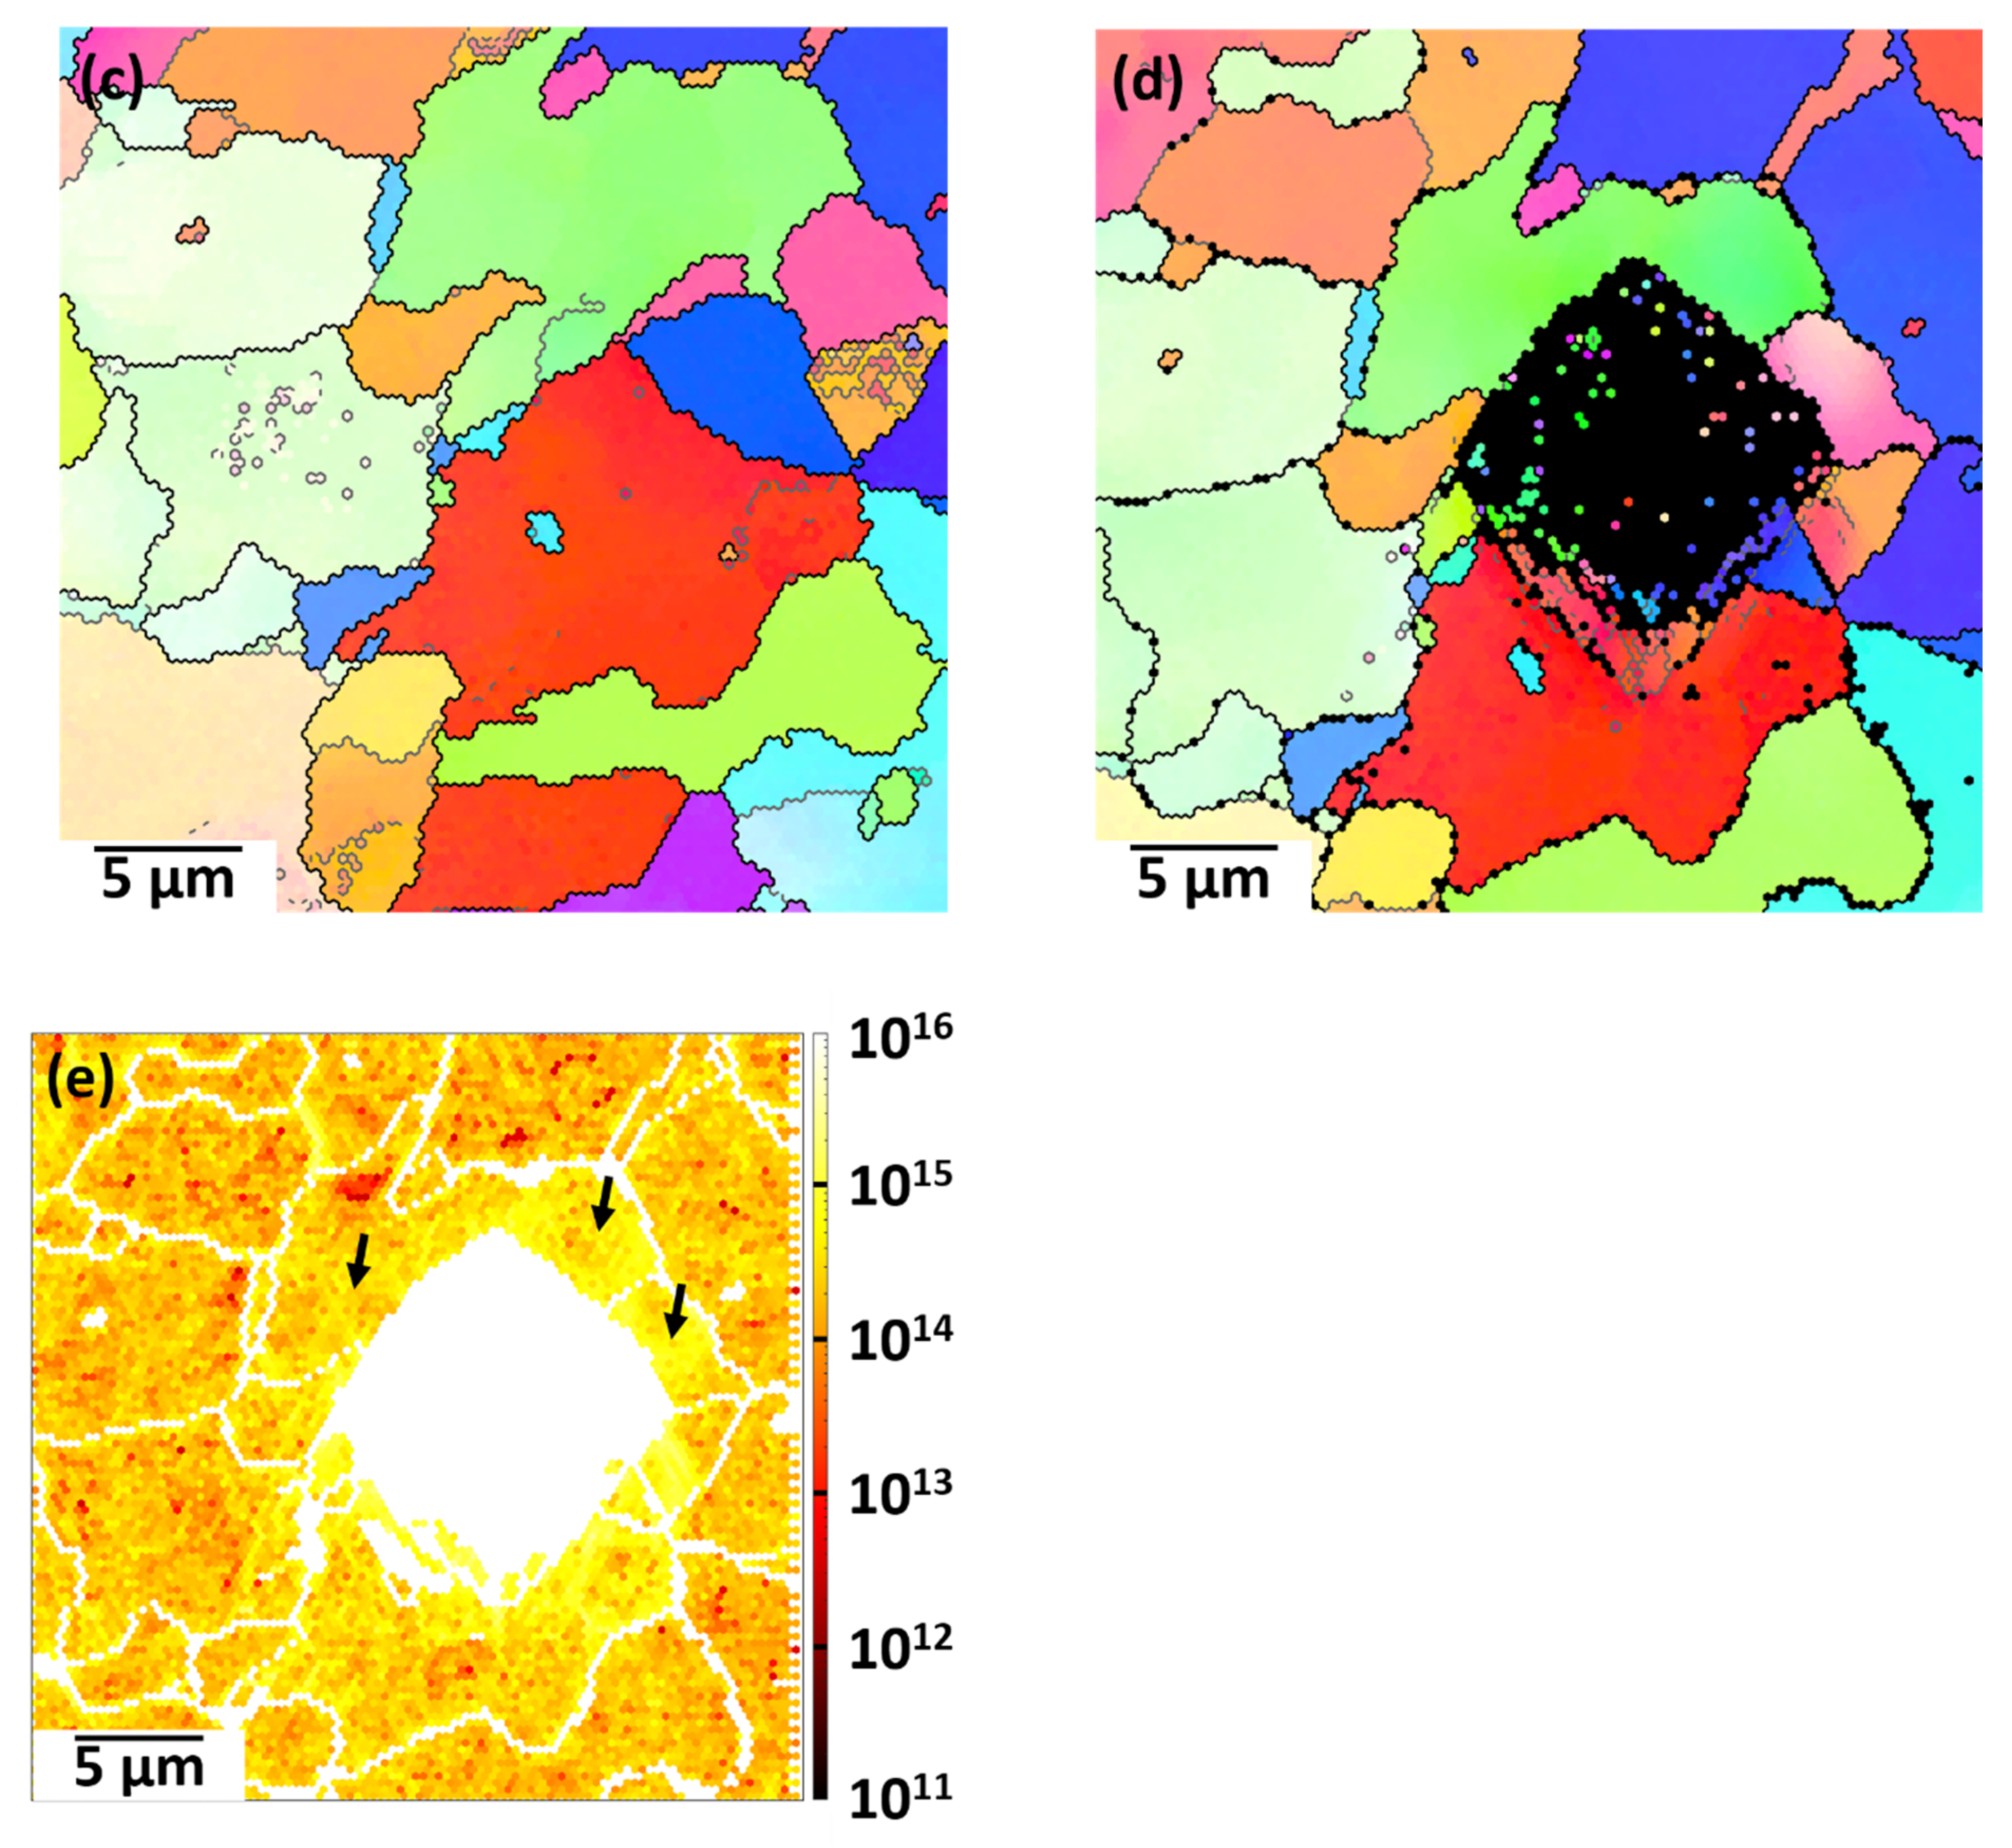
Figure 7.
(a) 2-D representation of the surface height profile of indentation 13, and (b) surface height profile of indentation 13 along line AA′ in (a).
Figure 7.
(a) 2-D representation of the surface height profile of indentation 13, and (b) surface height profile of indentation 13 along line AA′ in (a).
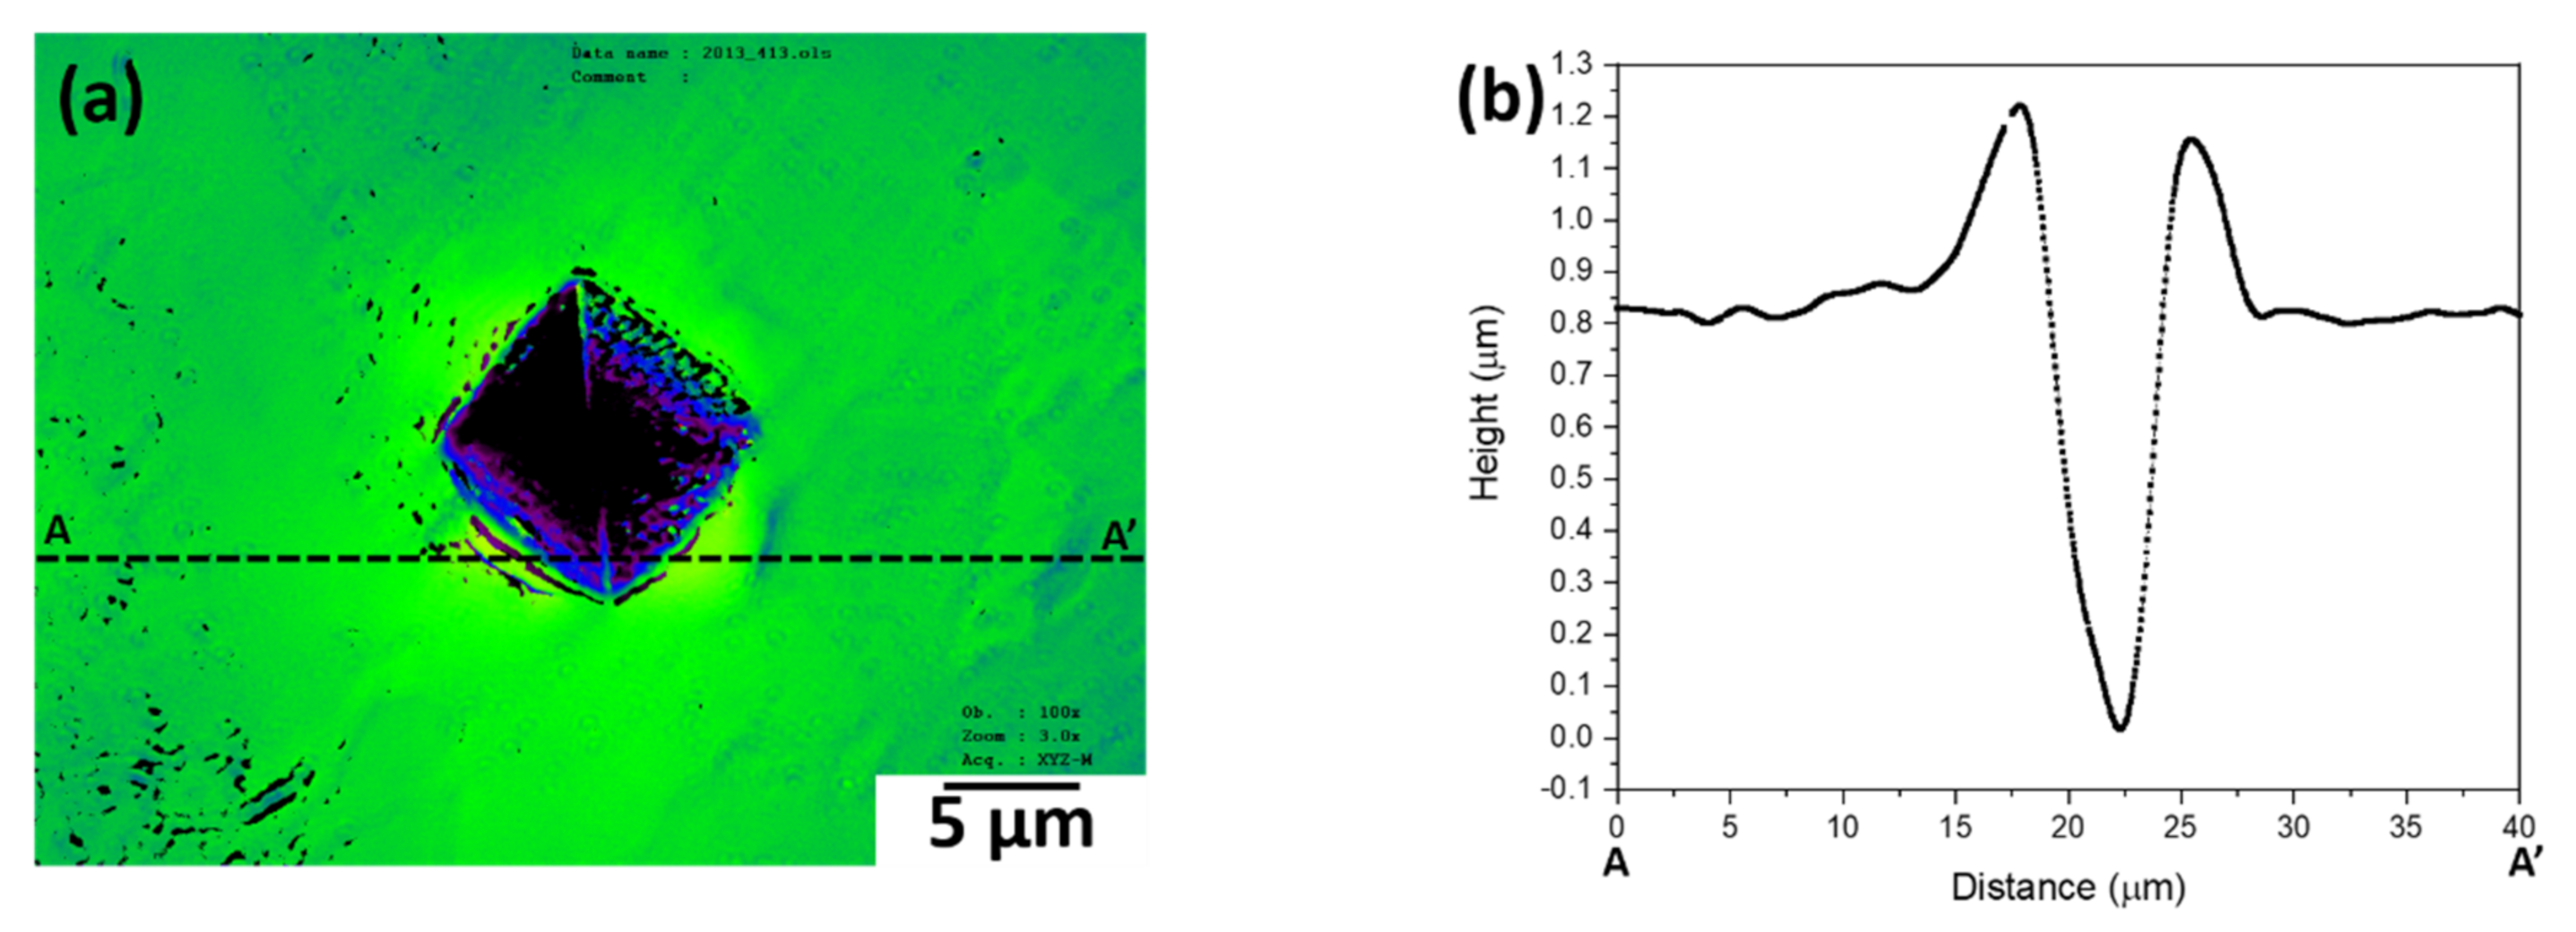
Figure 8.
(a,b) SEM microstructures after indentation 7; quasi in-situ EBSD microstructure of the indentation 7 (c) before and (d) after indentation; and (e) geometrically necessary dislocations (in m−2). The black arrow in (e) shows a high geometrically necessary dislocations concentration within grain 1.
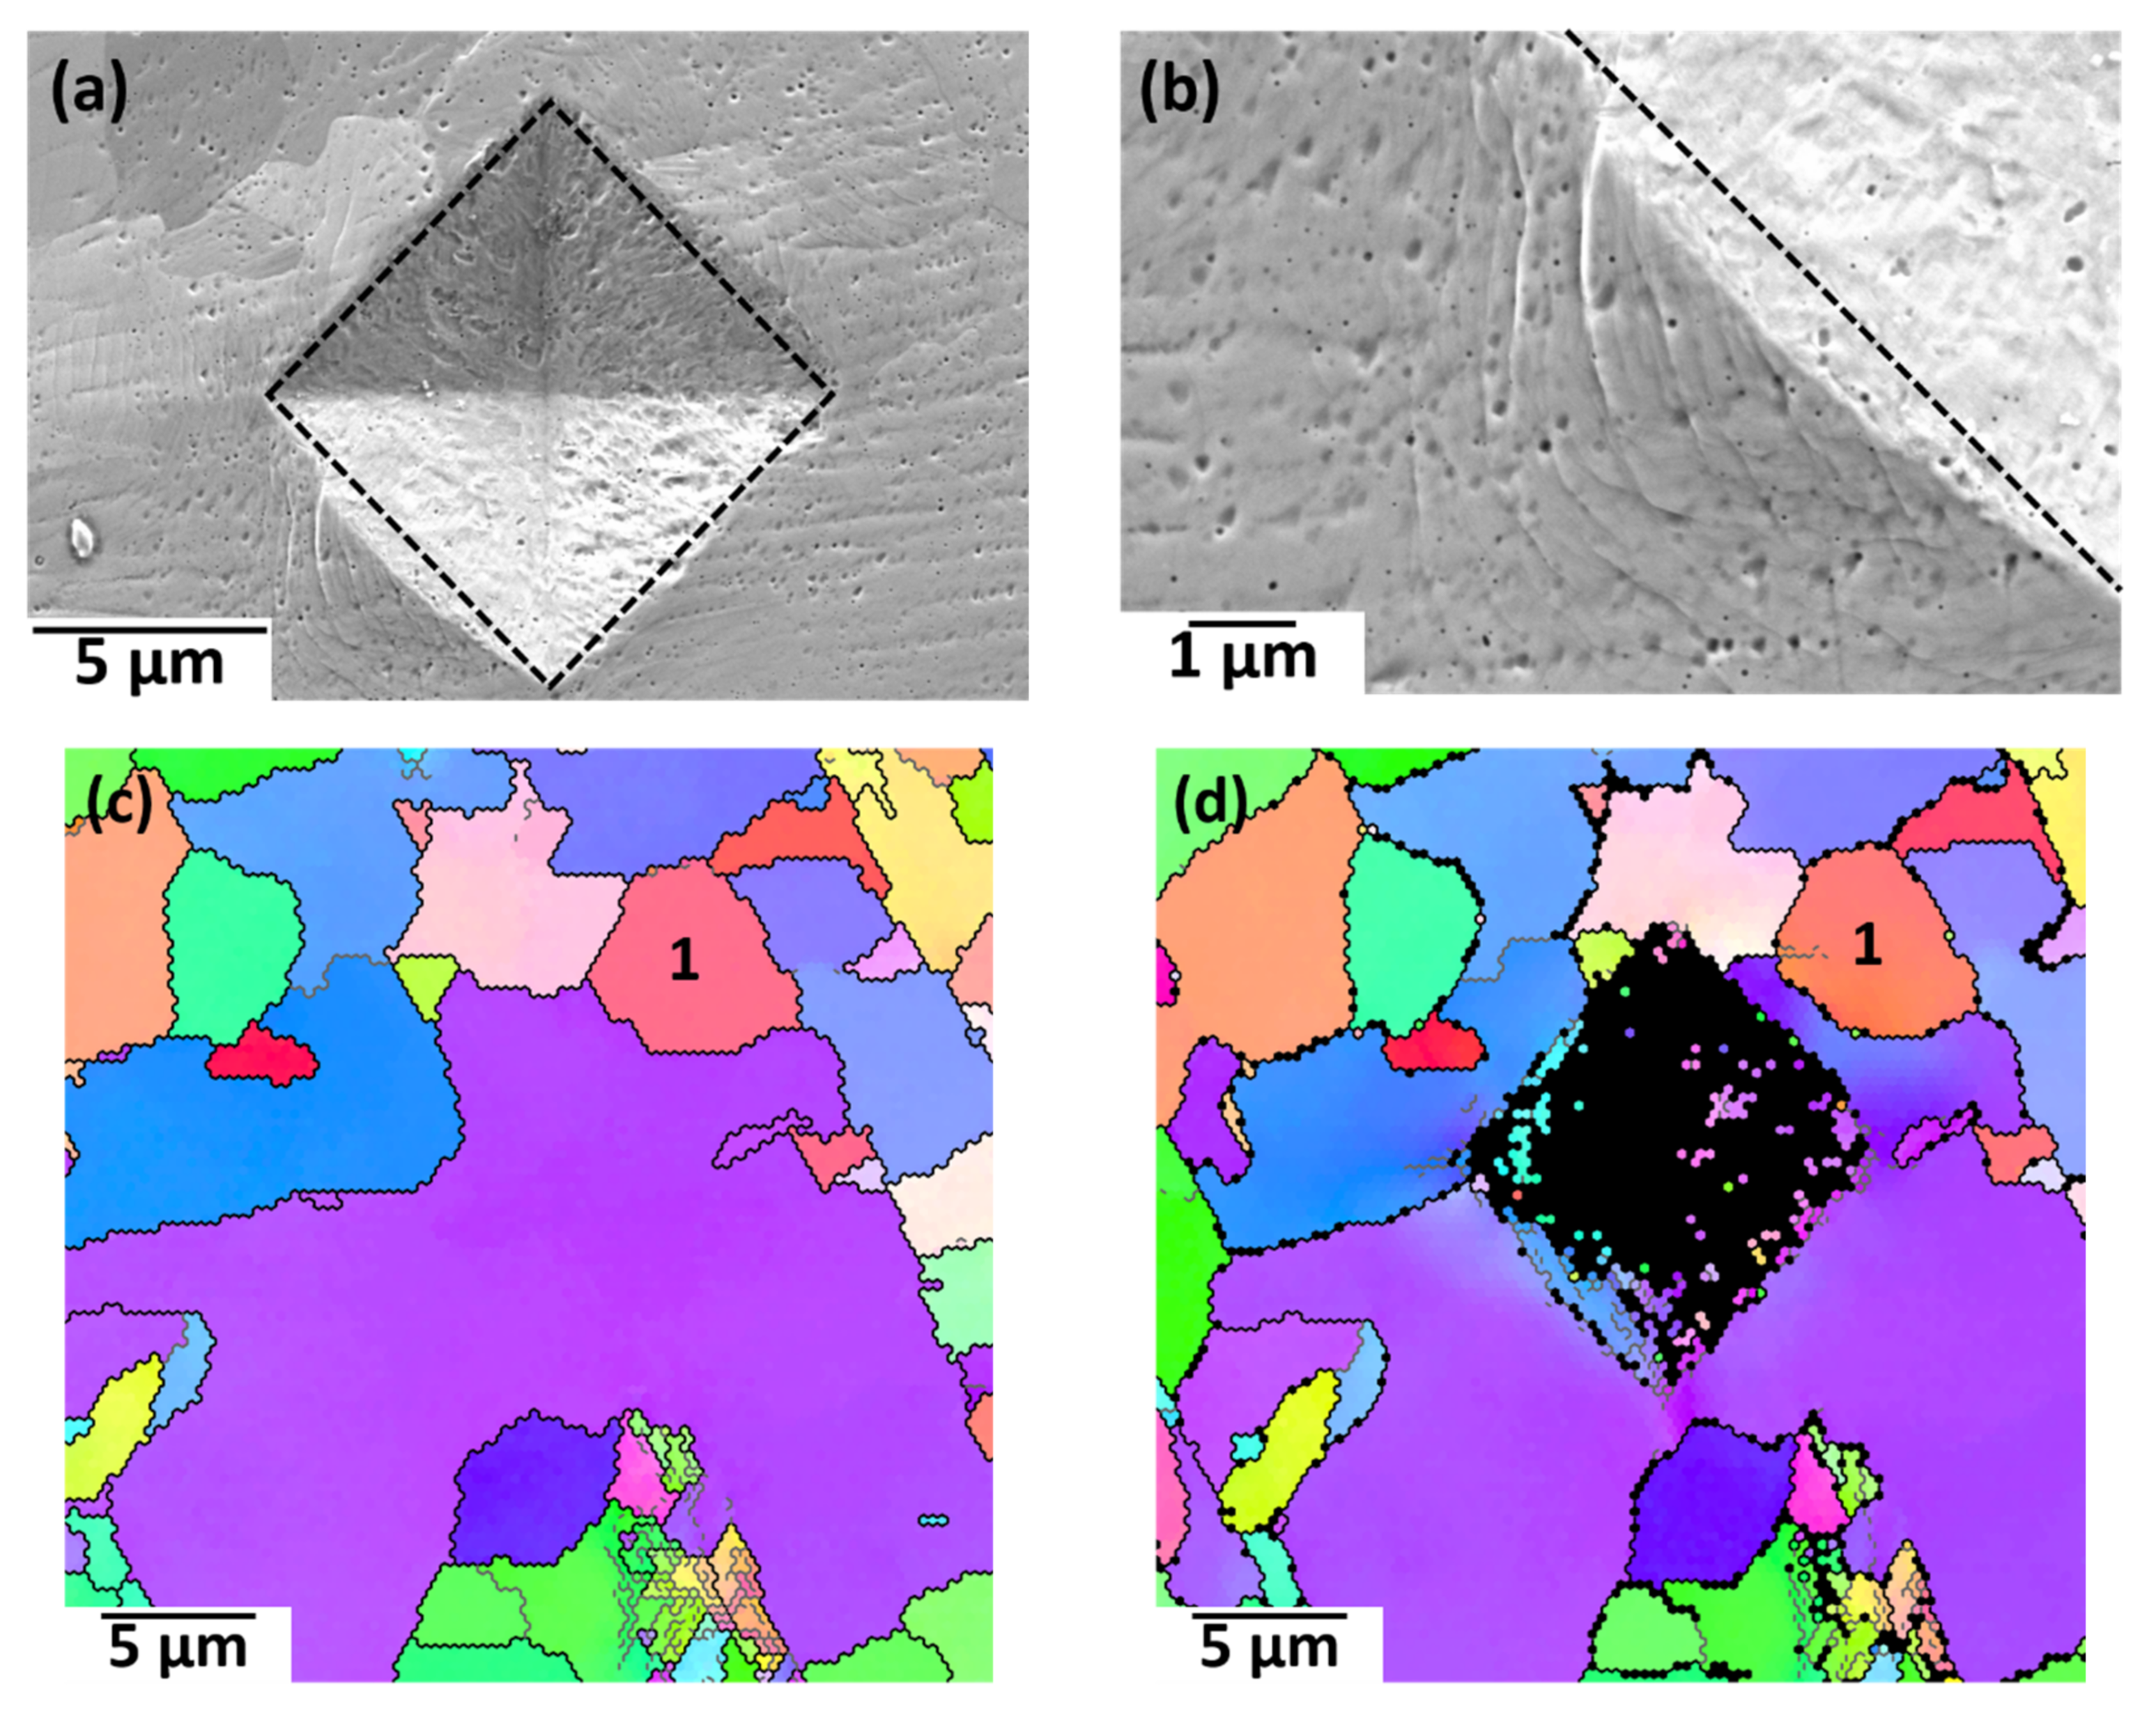
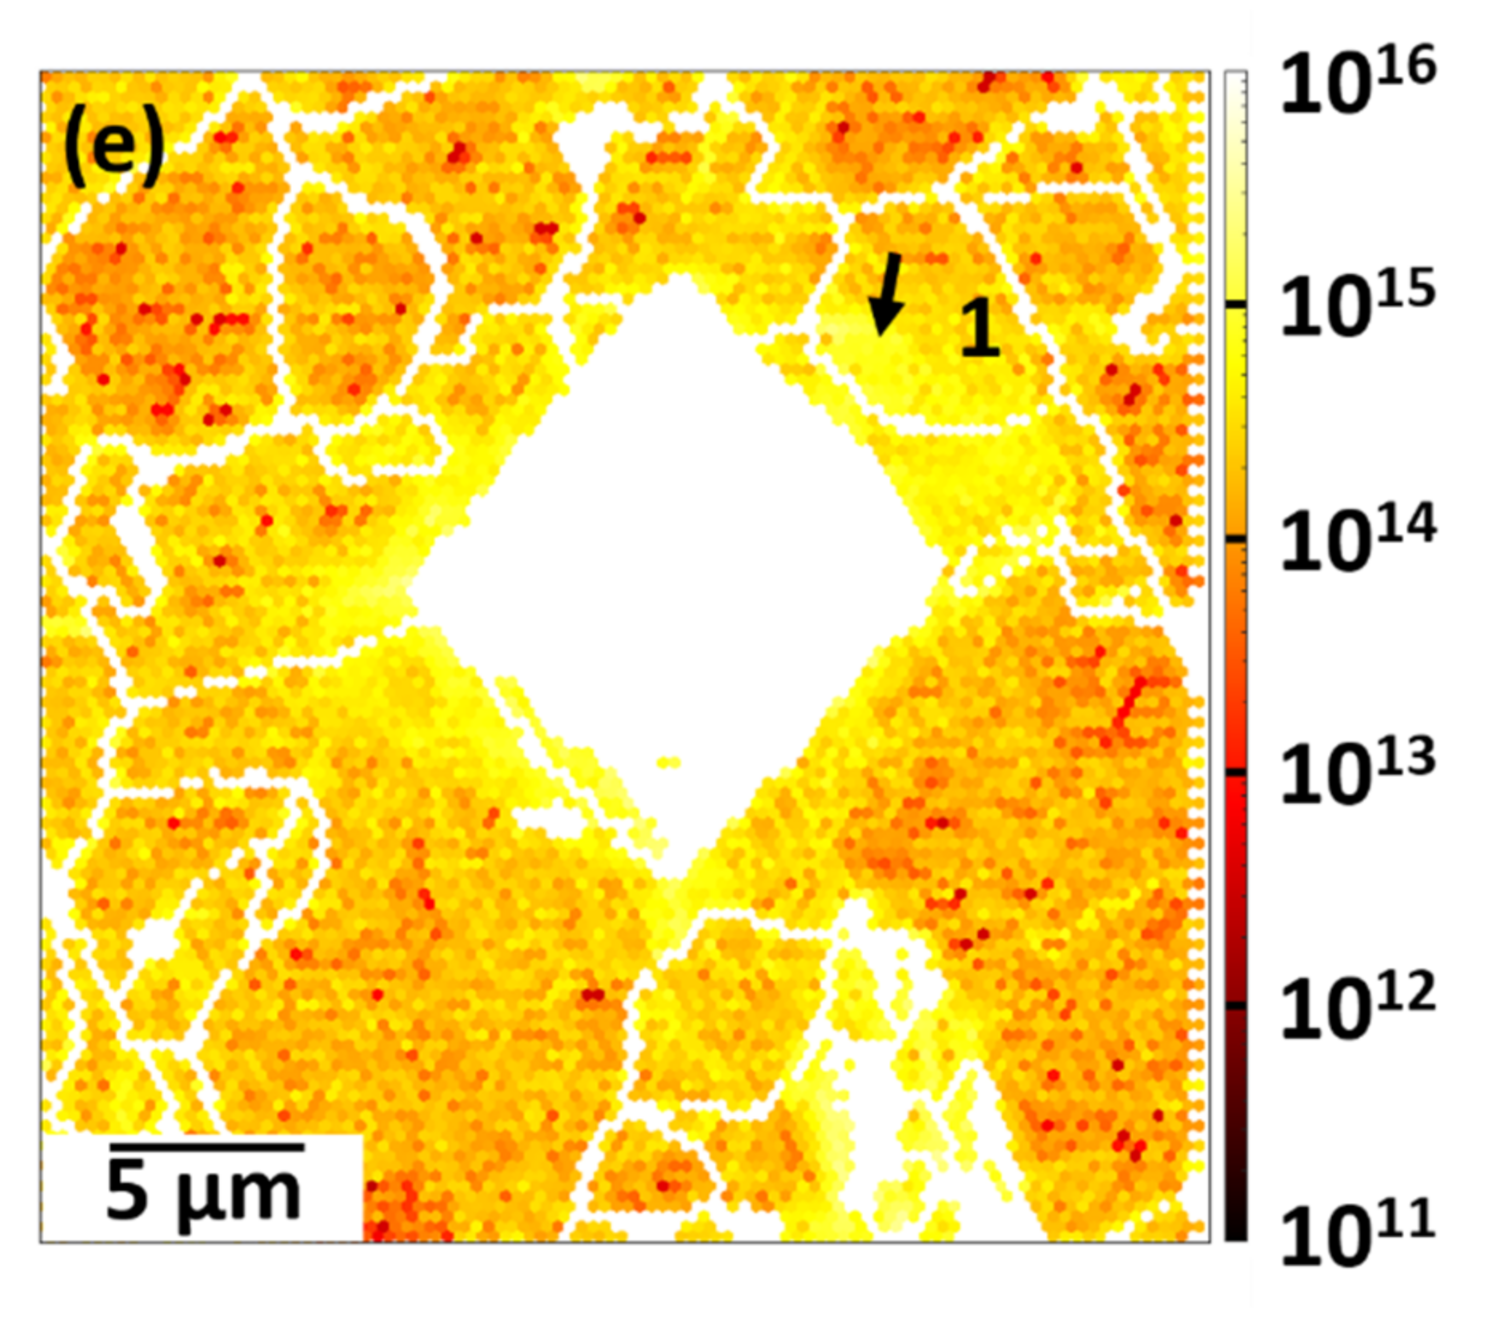
Figure 9.
Quasi in-situ EBSD microstructure of grain 1 near indentation 7 (a) before and (b) after indentation, (c) grain 1 orientation before indentation and after indentation plotted on the inverse pole figure (along BD), (d) GROD misorientation angles of grain 1 after indentation plotted on EBSD map, (e) GROD misorientation axis of grain 1 after indentation plotted on the fundamental region and (f) GROD misorientation axis of grain 1 after indentation plotted on EBSD map.
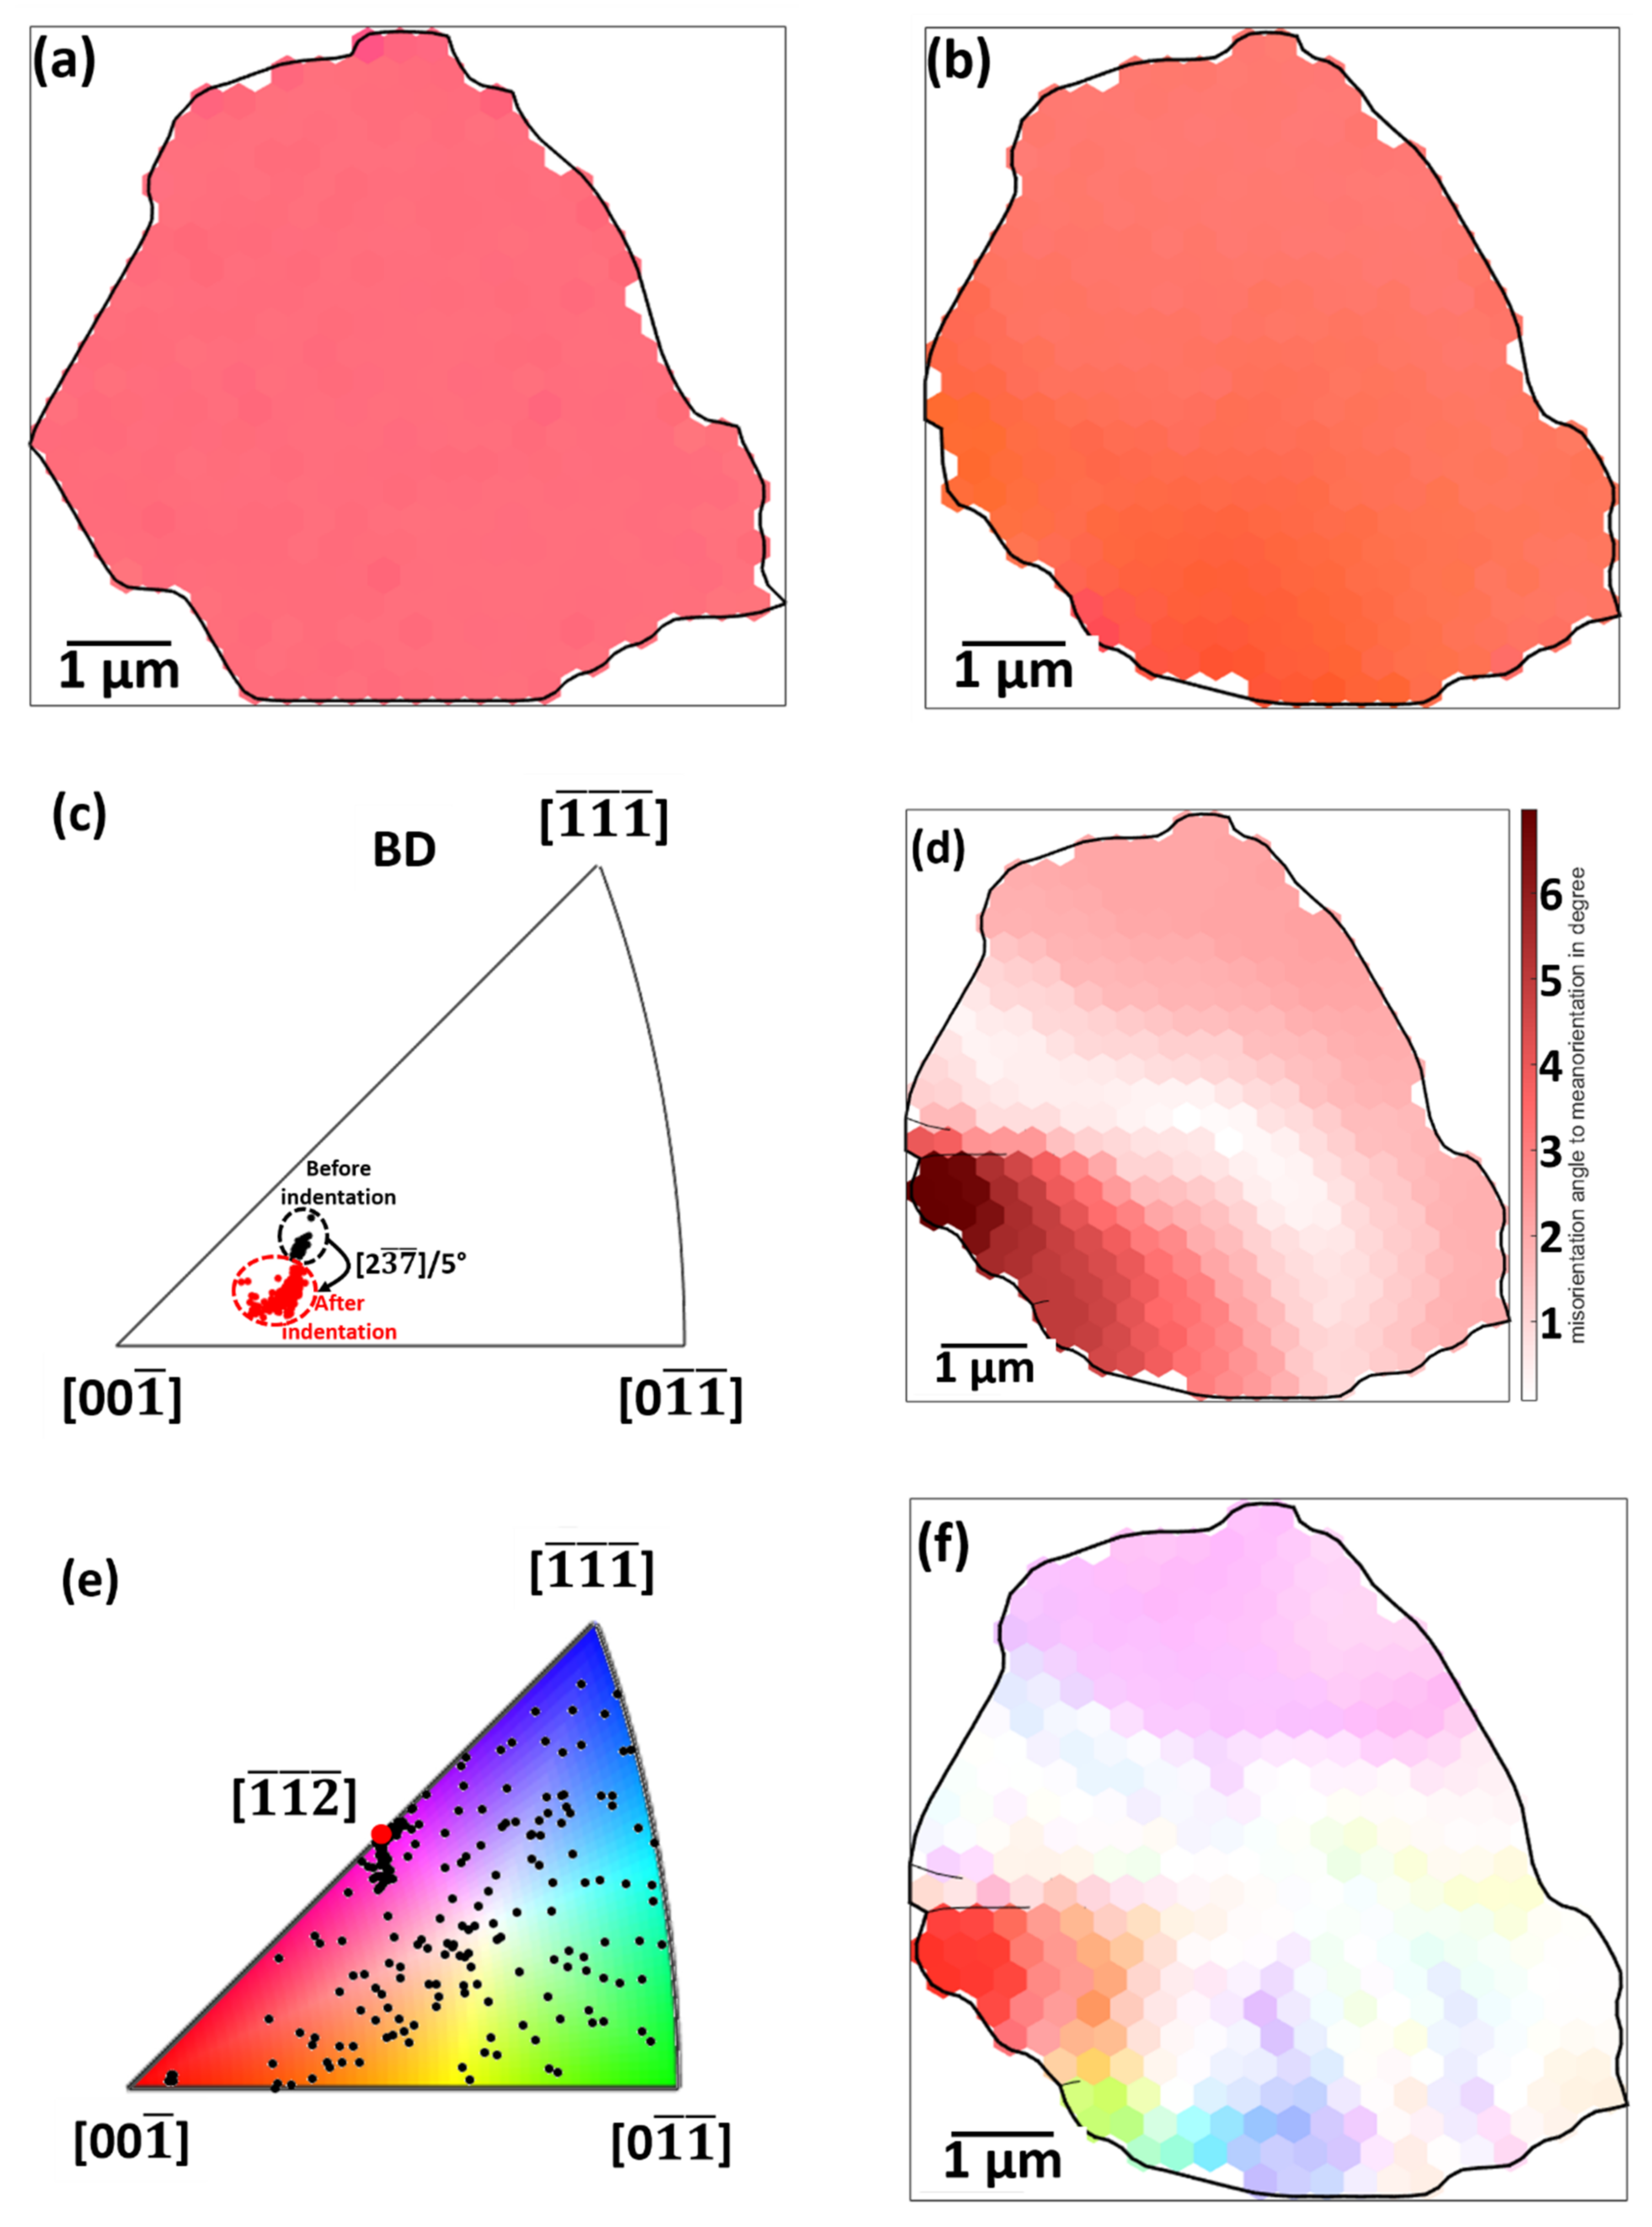
Figure 10.
Slip traces of grain 1 for the (a) {110}<111> slip system, (b) {112}<111> slip system and (c) {123}<111> slip system, and (d) magnified SEM image of grain 1 showing the slip lines highlighted by black arrows.
Figure 10.
Slip traces of grain 1 for the (a) {110}<111> slip system, (b) {112}<111> slip system and (c) {123}<111> slip system, and (d) magnified SEM image of grain 1 showing the slip lines highlighted by black arrows.
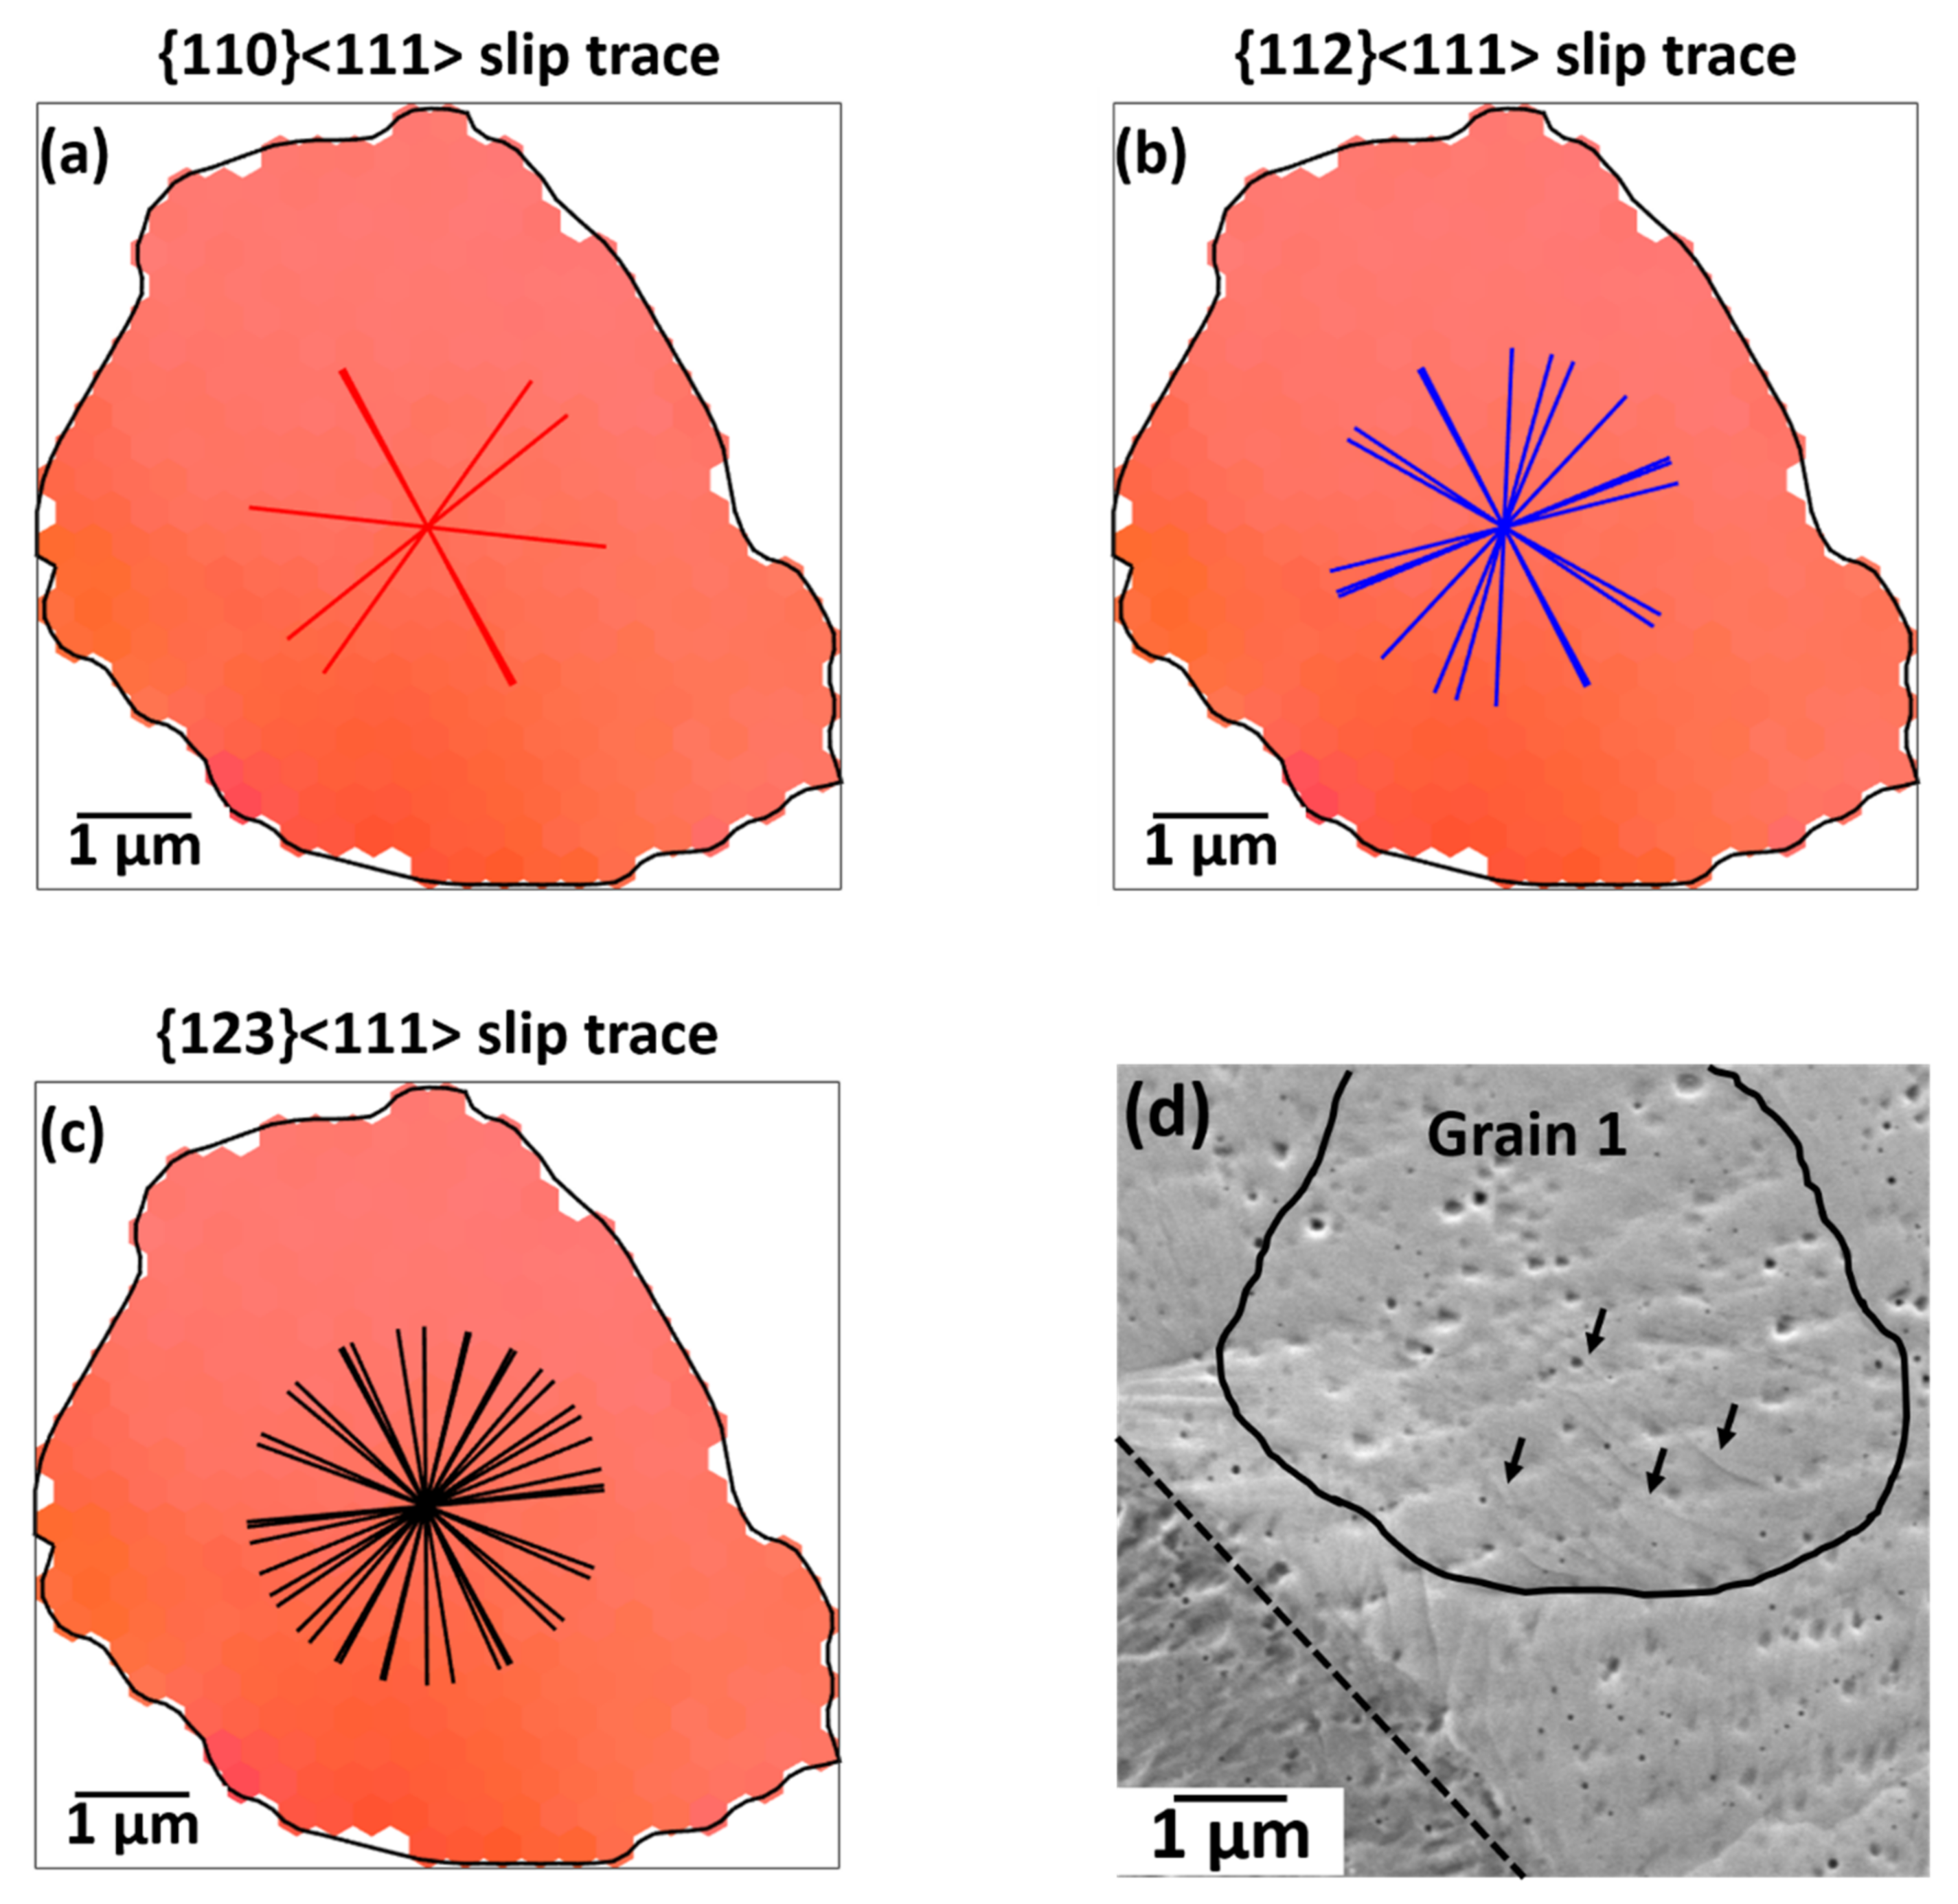
Figure 11.
Inverse pole figures showing the micro-texture (a) before and (b) after indentation. The inverse pole figures are plotted along the BD.
Figure 11.
Inverse pole figures showing the micro-texture (a) before and (b) after indentation. The inverse pole figures are plotted along the BD.

Publisher’s Note: MDPI stays neutral with regard to jurisdictional claims in published maps and institutional affiliations. |
© 2022 by the authors. Licensee MDPI, Basel, Switzerland. This article is an open access article distributed under the terms and conditions of the Creative Commons Attribution (CC BY) license (https://creativecommons.org/licenses/by/4.0/).
Share and Cite
MDPI and ACS Style
Pramanik, S.; Tasche, F.; Hoyer, K.-P.; Schaper, M. Orientation-Dependent Indentation Behaviour of Additively Manufactured FeCo Sample: A Quasi In-Situ Study. Magnetism 2022, 2, 88-104. https://doi.org/10.3390/magnetism2020007
AMA Style
Pramanik S, Tasche F, Hoyer K-P, Schaper M. Orientation-Dependent Indentation Behaviour of Additively Manufactured FeCo Sample: A Quasi In-Situ Study. Magnetism. 2022; 2(2):88-104. https://doi.org/10.3390/magnetism2020007
Chicago/Turabian StylePramanik, Sudipta, Frederik Tasche, Kay-Peter Hoyer, and Mirko Schaper. 2022. "Orientation-Dependent Indentation Behaviour of Additively Manufactured FeCo Sample: A Quasi In-Situ Study" Magnetism 2, no. 2: 88-104. https://doi.org/10.3390/magnetism2020007