Article

The Utility of the Shock Index for Predicting Survival, Function and Health Status Outcomes in Major Trauma Patients: A Registry-Based Cohort Study

1
Faculty of Medicine, Lund University, 22184 Lund, Sweden
2
School of Public Health and Preventive Medicine, Monash University, Melbourne, VIC 3004, Australia
3
Department of Intensive- and Perioperative Care, Skåne University Hospital, 22381 Lund, Sweden
*
Author to whom correspondence should be addressed.
Trauma Care 2022, 2(2), 268-281; https://doi.org/10.3390/traumacare2020023
Submission received: 17 December 2021 / Revised: 29 March 2022 / Accepted: 5 May 2022 / Published: 13 May 2022

Abstract

:
The shock index (SI; heart rate/systolic blood pressure) has been found to predict mortality in trauma patients. The aims of this study were to establish whether the SI improved the prediction of an existing model for both mortality and longer-term outcomes in major trauma patients. In total, 29,574 adult (>15 years) major trauma patients were included from the Victorian State Trauma Registry with a date of injury from July 2009 to June 2019. Outcomes of interest were survival to hospital discharge and function and health status at 6 months post-injury. Survival and function were analysed using measures of discrimination and calibration, whereas health status was assessed with R2 and MRSE measures. The area under the receiver operating characteristic curve (AUC) of the VSTR survival model improved when the SI was added (AUC 0.797 (0.787–0.807) versus AUC 0.807 (0.797–0.816), p < 0.001). For the prediction of functional outcome 6 months post-injury, the inclusion of the SI increased the AUC marginally (AUC 0.795 (0.786–0.803) versus AUC 0.799 (0.791–0.807), p < 0.001). When predicting in-hospital mortality and health status 6 months post-injury, including the SI resulted in a slightly better fit to the registry-risk adjustment model. In the future, external validation and the exploration of other models to improve prediction outcomes are warranted.

1. Introduction

Traumatic injury is a global phenomenon and a major cause of mortality and morbidity worldwide. One tool used in trauma care is the use of validated trauma systems that allow the standardisation of procedures, appropriate triage and efficient communication between care providers [1]. Several countries have implemented different forms of structured systems to manage trauma care, and these have been shown to improve patient survival [2,3,4]. The use of validated trauma prediction models is important for prognostication and benchmarking to improve trauma triage and care. There are currently a multitude of prediction models for predicting outcome in trauma, including the Trauma and Injury Severity Score (TRISS), the Revised Trauma Score (RTS), the Probability of Survival and the Trauma Risk Adjustment Model (TRAM). Many of these prediction models include variables such as respiratory rate, systolic blood pressure (SBP), the Glasgow Coma Scale (GCS), the Injury Severity Score (ISS), injury mechanism and patient age [5,6]. Despite the widespread use of TRISS and RTS, both prediction models have been widely criticised [7,8,9].
Haemorrhage is one of two leading causes of mortality in traumatic injury as it can result in hypovolemic shock [10]. Nevertheless, commonly used prognostic tools do not specifically include a measure of shock and mostly rely on SBP. A score that could help to predict haemorrhagic shock and risk of a poorer outcome is the shock index (SI) [11]. The SI is defined as the heart rate (HR) divided by the SBP. The SI was first developed by Allgöwer and Buri [12] in 1967 as a quick, non-invasive measure to predict hypovolemic shock where the normal range is between 0.5–0.7. The SI has been shown to be a valuable predictor for haemodynamic instability and the need for blood transfusion in trauma patients [13,14]. In several studies [15,16,17], a high SI (SI ≥ 1) has been associated with a higher mortality rate in trauma patients. However, most patients survive their injuries and often with ongoing morbidity. The capacity of the SI to predict morbidity outcomes in trauma patients is largely unknown.
The aim of this study was to establish whether the SI improved the prediction of an existing risk-adjustment model used by an established population-based trauma registry in major trauma patients. In addition, we aimed to assess the SI as a predictor in key patient sub-groups and compare the performance of SI models to established prediction tools.

2. Methods

The Victorian State Trauma Registry (VSTR) is a population-based trauma registry in the state of Victoria, Australia. The registry has ethics approval from the Department of Health and Human Services Human Research Ethics Committee and each participating health service. This study was approved by the Monash University Human Research Ethics Committee.

2.1. Study Design

This was a registry-based cohort study using data from the population-based VSTR.

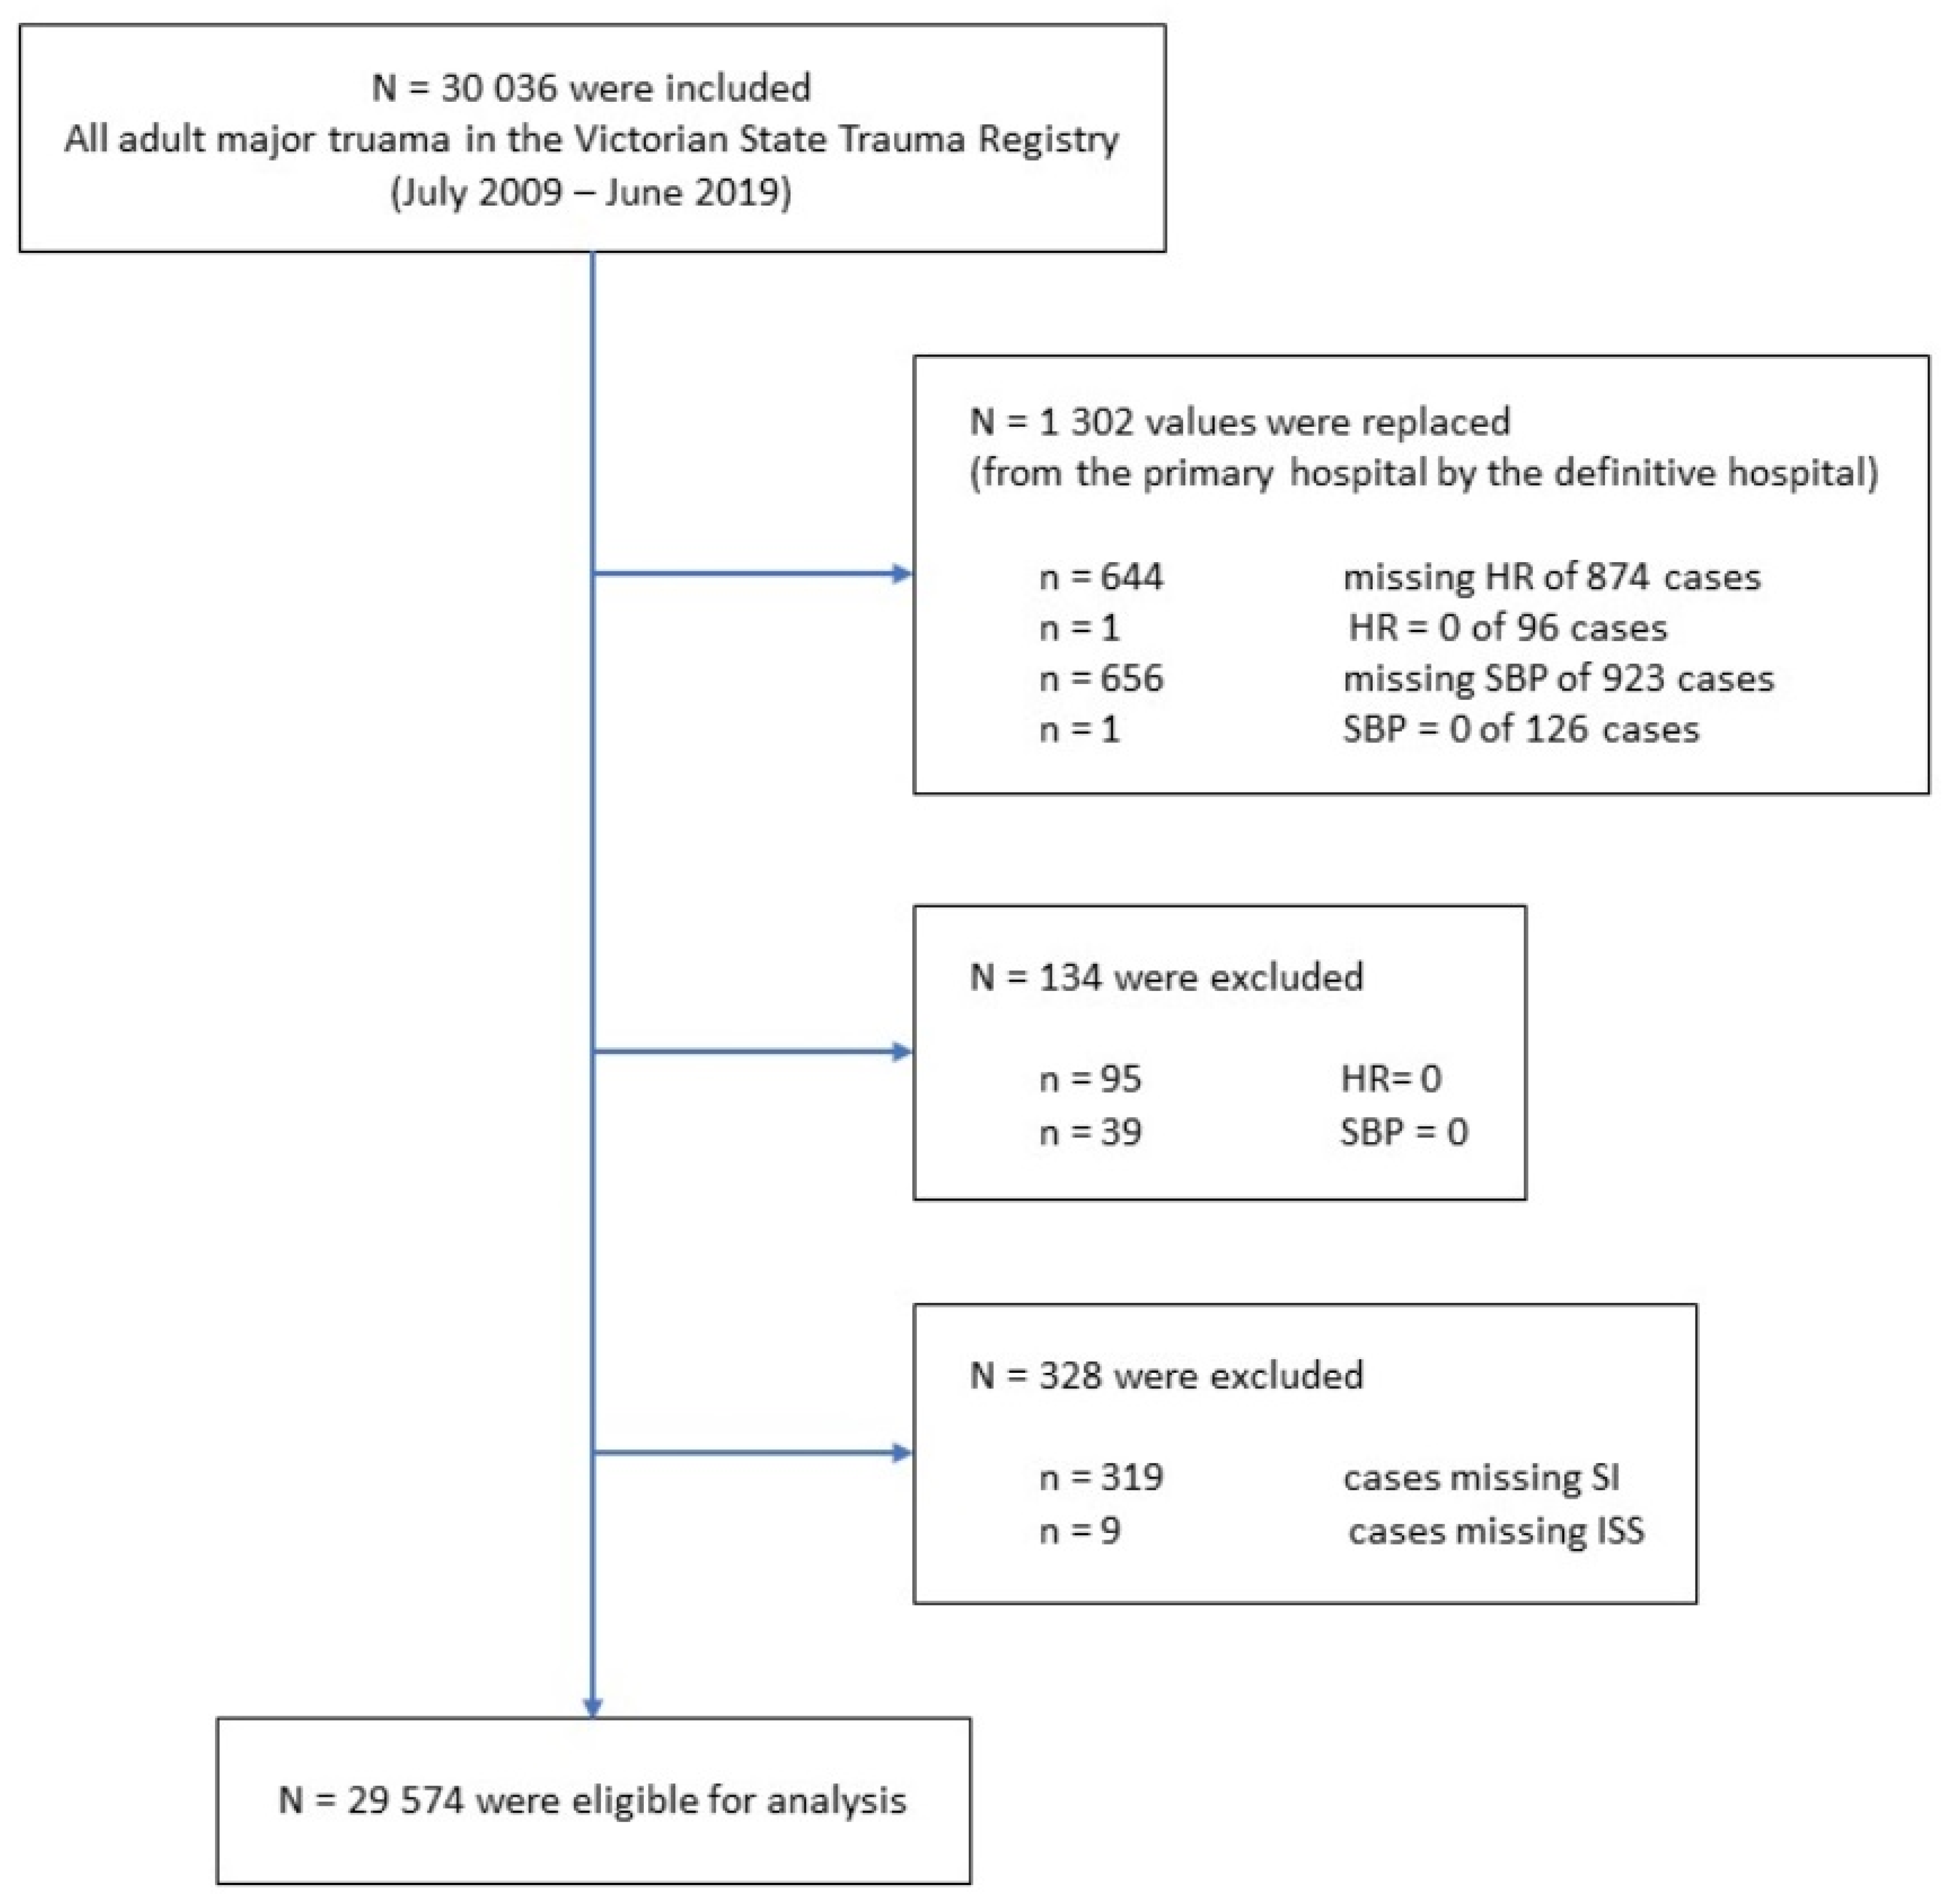
2.2. Study Setting and Participants

The State of Victoria, Australia, has a population exceeding 6.7 million people, accounting for over 25% of the Australian population [18]. Victoria operates an integrated, state-wide trauma system with centralised coordination and management of trauma cases. The state has a single ambulance service, staffed by paramedics with Advanced Trauma Life support training, which provides road and air transport for cases. There are three designated major trauma services (MTS, Level 1 trauma centre equivalent) that operate in Victoria: two adult and one paediatric. All other trauma-receiving health services (n = 135) provide resuscitation and stabilisation services and organise transfer to an MTS as necessary [19]. The VSTR exists to enable critical review and analysis of the performance of the trauma system. The VSTR collects data from all 138 trauma-receiving hospitals and includes all major trauma patients managed in the trauma system. Major trauma is defined if any of the following are present: (1) death following injury, (2) an ISS > 12, (3) an intensive care unit stay > 24 h, (4) urgent surgery (5) or burns with a total body surface area ≥20% [19].

2.3. Patient Selection

Data from adult (>15 years) major trauma patients in Victoria, with a date of injury from July 2009 to June 2019, were included. Exclusion criteria included patients with cardiac arrest (SBP or HR equal to zero) on arrival at hospital and patients with incomplete data in variables used in prognostic model development (sex, age, ISS, Head Injury Severity Scale (HISS), mechanism of injury and SI).

2.4. Procedures

All data for this study were obtained from the VSTR, and no new data were collected for this project. Existing data were extracted from the registry and included patient demographics, injury type, injury severity, observations on arrival at each treating hospital, hospital length of stay, mortality and follow-up at six months. Standardised telephone follow-up interviews were conducted for patients who survived to hospital discharge at 6 months post-injury to collect data about function and health status. Post-discharge deaths were identified through a linkage with the Victorian Registry of Births, Deaths and Marriages.
The SI was calculated as the HR divided by the SBP using values recorded at the first hospital admission with additional values. In the cases where the HR or the SBP were not recorded or equal to zero on the first hospital admission (primary hospital), they were replaced with valid data from the definitive care hospital (an appropriate trauma service) to which the patient was transferred (Figure 1). Next, the calculated SI score was categorised into two groups with low (SI < 1) and high SI (SI ≥ 1) based on prior research [15,16,17,20].
A key challenge for prognostication is the aging population resulting in a changing age profile of major trauma patients with an increase in older adults over recent years, creating a need for new updated prediction models [21]. Therefore, age was dichotomised into younger adults (<65 years) and older adults (≥65 years) depending on their age at the time of injury in order to analyse these two subgroups. Mechanism of injury was grouped as low fall (<1 m), high fall (≥1 m), motor vehicle, motorcycle, pedestrian, pedal cyclist, collision with person or object or other. HISS was categorised into two groups: none or mild–moderate head injury (Abbreviated Injury Scale (AIS) severity score) < 3) and severe head injury (AIS severity score ≥ 3). The AIS is an injury severity scoring system that classifies each injury per body region on a six-point scale [22]. The TRISS was calculated using the National Trauma Data Bank coefficients from 2009, and the RTS was calculated for the included patients. The RTS is a prediction model that includes respiratory rate, SBP and the Glasgow Coma Scale (GCS) as outcome predictors [5]. The TRISS combines the RTS, the ISS, injury mechanism and patient age to predict mortality [6].
The outcomes of interest were survival to hospital discharge, and the 6-month post-injury Glasgow Outcome Scale—Extended (GOS-E) and three-level EuroQol five dimensions (EQ-5D-3L) summary scores. The GOS-E is a measure of function and has an eight-level scale from death to upper good recovery [23,24]. For this study, the GOS-E was dichotomised with a score of 1–4 representing dependent living and a score of 5–8 representing independent living based on prior publication [25]. The EQ-5D-3L is a health status measure comprising five items: mobility, usual activities, self-care, pain or discomfort and anxiety or depression. For each item, the level of problems experienced is measured on a three-point scale. The summary score of all items is calculated with age- and gender-specific population weights, resulting in a score ranging from −0.594 to 1. A score of 0 represents a health state equivalent to death, 1 represents perfect health, and <0 represents a health state considered worse than death [26]. Where patients had died either in-hospital or after discharge, a summary score of 0 (a value equal to death) was substituted to the EQ-5D-3L 6 months post-injury. In-hospital deaths were also included in the GOS-E at 6 months post-injury [27].

2.5. Statistical Analysis

The prediction models that were analysed were the VSTR model of age + sex + ISS + HISS + mechanism of injury with and without the SI and a simple model of age + sex + ISS with and without the SI. The trauma prediction models—the TRISS and the RTS—were also analysed for comparative reasons. A split dataset approach was used to randomly divide the dataset into two equal parts, creating a test and a training dataset [28]. The prediction models were analysed using a training dataset and internally validated using a test dataset. The descriptive statistics included frequencies and percentages for categorical variables, mean ± standard deviation for normally distributed continuous variables and median and interquartile range for continuous variables with a skewed distribution. Binary logistic regression models were used to predict survival to discharge and independent living (GOS-E). A linear regression model was used to predict health status (EQ-5D-3L summary score).
Model performance was analysed using measures of discrimination and calibration [28,29]. For binary regression models, discrimination was analysed using the area under the receiver operating characteristic (ROC) curve (AUC) with 95% confidence intervals (CI). The AUC measures the capacity of a model to discriminate between different outcomes. Discrimination is generally classified as poor (AUC < 0.7), acceptable (AUC ≥ 0.7 and <0.8), excellent (AUC ≥ 0.8 and <0.9) and outstanding (AUC ≥ 0.9) [30]. Calibration was assessed using calibration curves (plot of the observed events against the predicted probabilities) and the Hosmer–Lemeshow (H-L) statistics. The H-L test is a measure of goodness of fit for logistic models, where a higher p-value (p > 0.05) corresponds to acceptable calibration [30]. The H-L test can be oversensitive for very large samples, and hence calibration curves and H-L tests were used in this study. Likelihood ratio (LR) tests were used to enable the comparison of the model fit for nested models [30].
For the linear models, the primary measure of performance was the R2 value and the root-mean-square error (RMSE). The R2 is a measure of model fit and assesses the percentage of the variance for an observed dependent outcome that can be explained by independent variables [31]. The RMSE measures the average of the square of the errors for the estimation of an observed outcome in a linear regression. Interpreting RMSE, a higher value equals a larger error, and a value closer to zero equals a better fit [32]. A p-value < 0.05 was considered as statistically significant. Stata Version 16.0 (StataCorp, College Station, TX, USA) was used for all analyses.

3. Results

3.1. Overview of the Dataset

A total of 30,036 adult major trauma patients were admitted to the Victorian trauma-receiving hospitals during the study period. After applying the exclusion criteria, 29,574 patients were included (98.5%) (Figure 1). Most patients were men, and the majority had sustained blunt trauma (Table 1). A total of 7.5% (n = 2230) had an SI ≥ 1. The random split resulted in 14,815 cases in the training dataset and 14,759 cases in the test dataset. Patient characteristics in the two datasets were comparable (Table 1 and Table 2). In both datasets, 89% of the population survived to hospital discharge. Of the survivors, 95.3% had a valid GOS-E score, and 90.3% had a valid EQ-5D-3L summary score. Of these cases, 64% were classified as independent living (GOS-E ≥ 5) at 6 months, and the mean EQ-5D-3L summary score was 0.53 at 6 months post-injury.

3.2. Contribution of Shock Index to Prediction of Outcomes

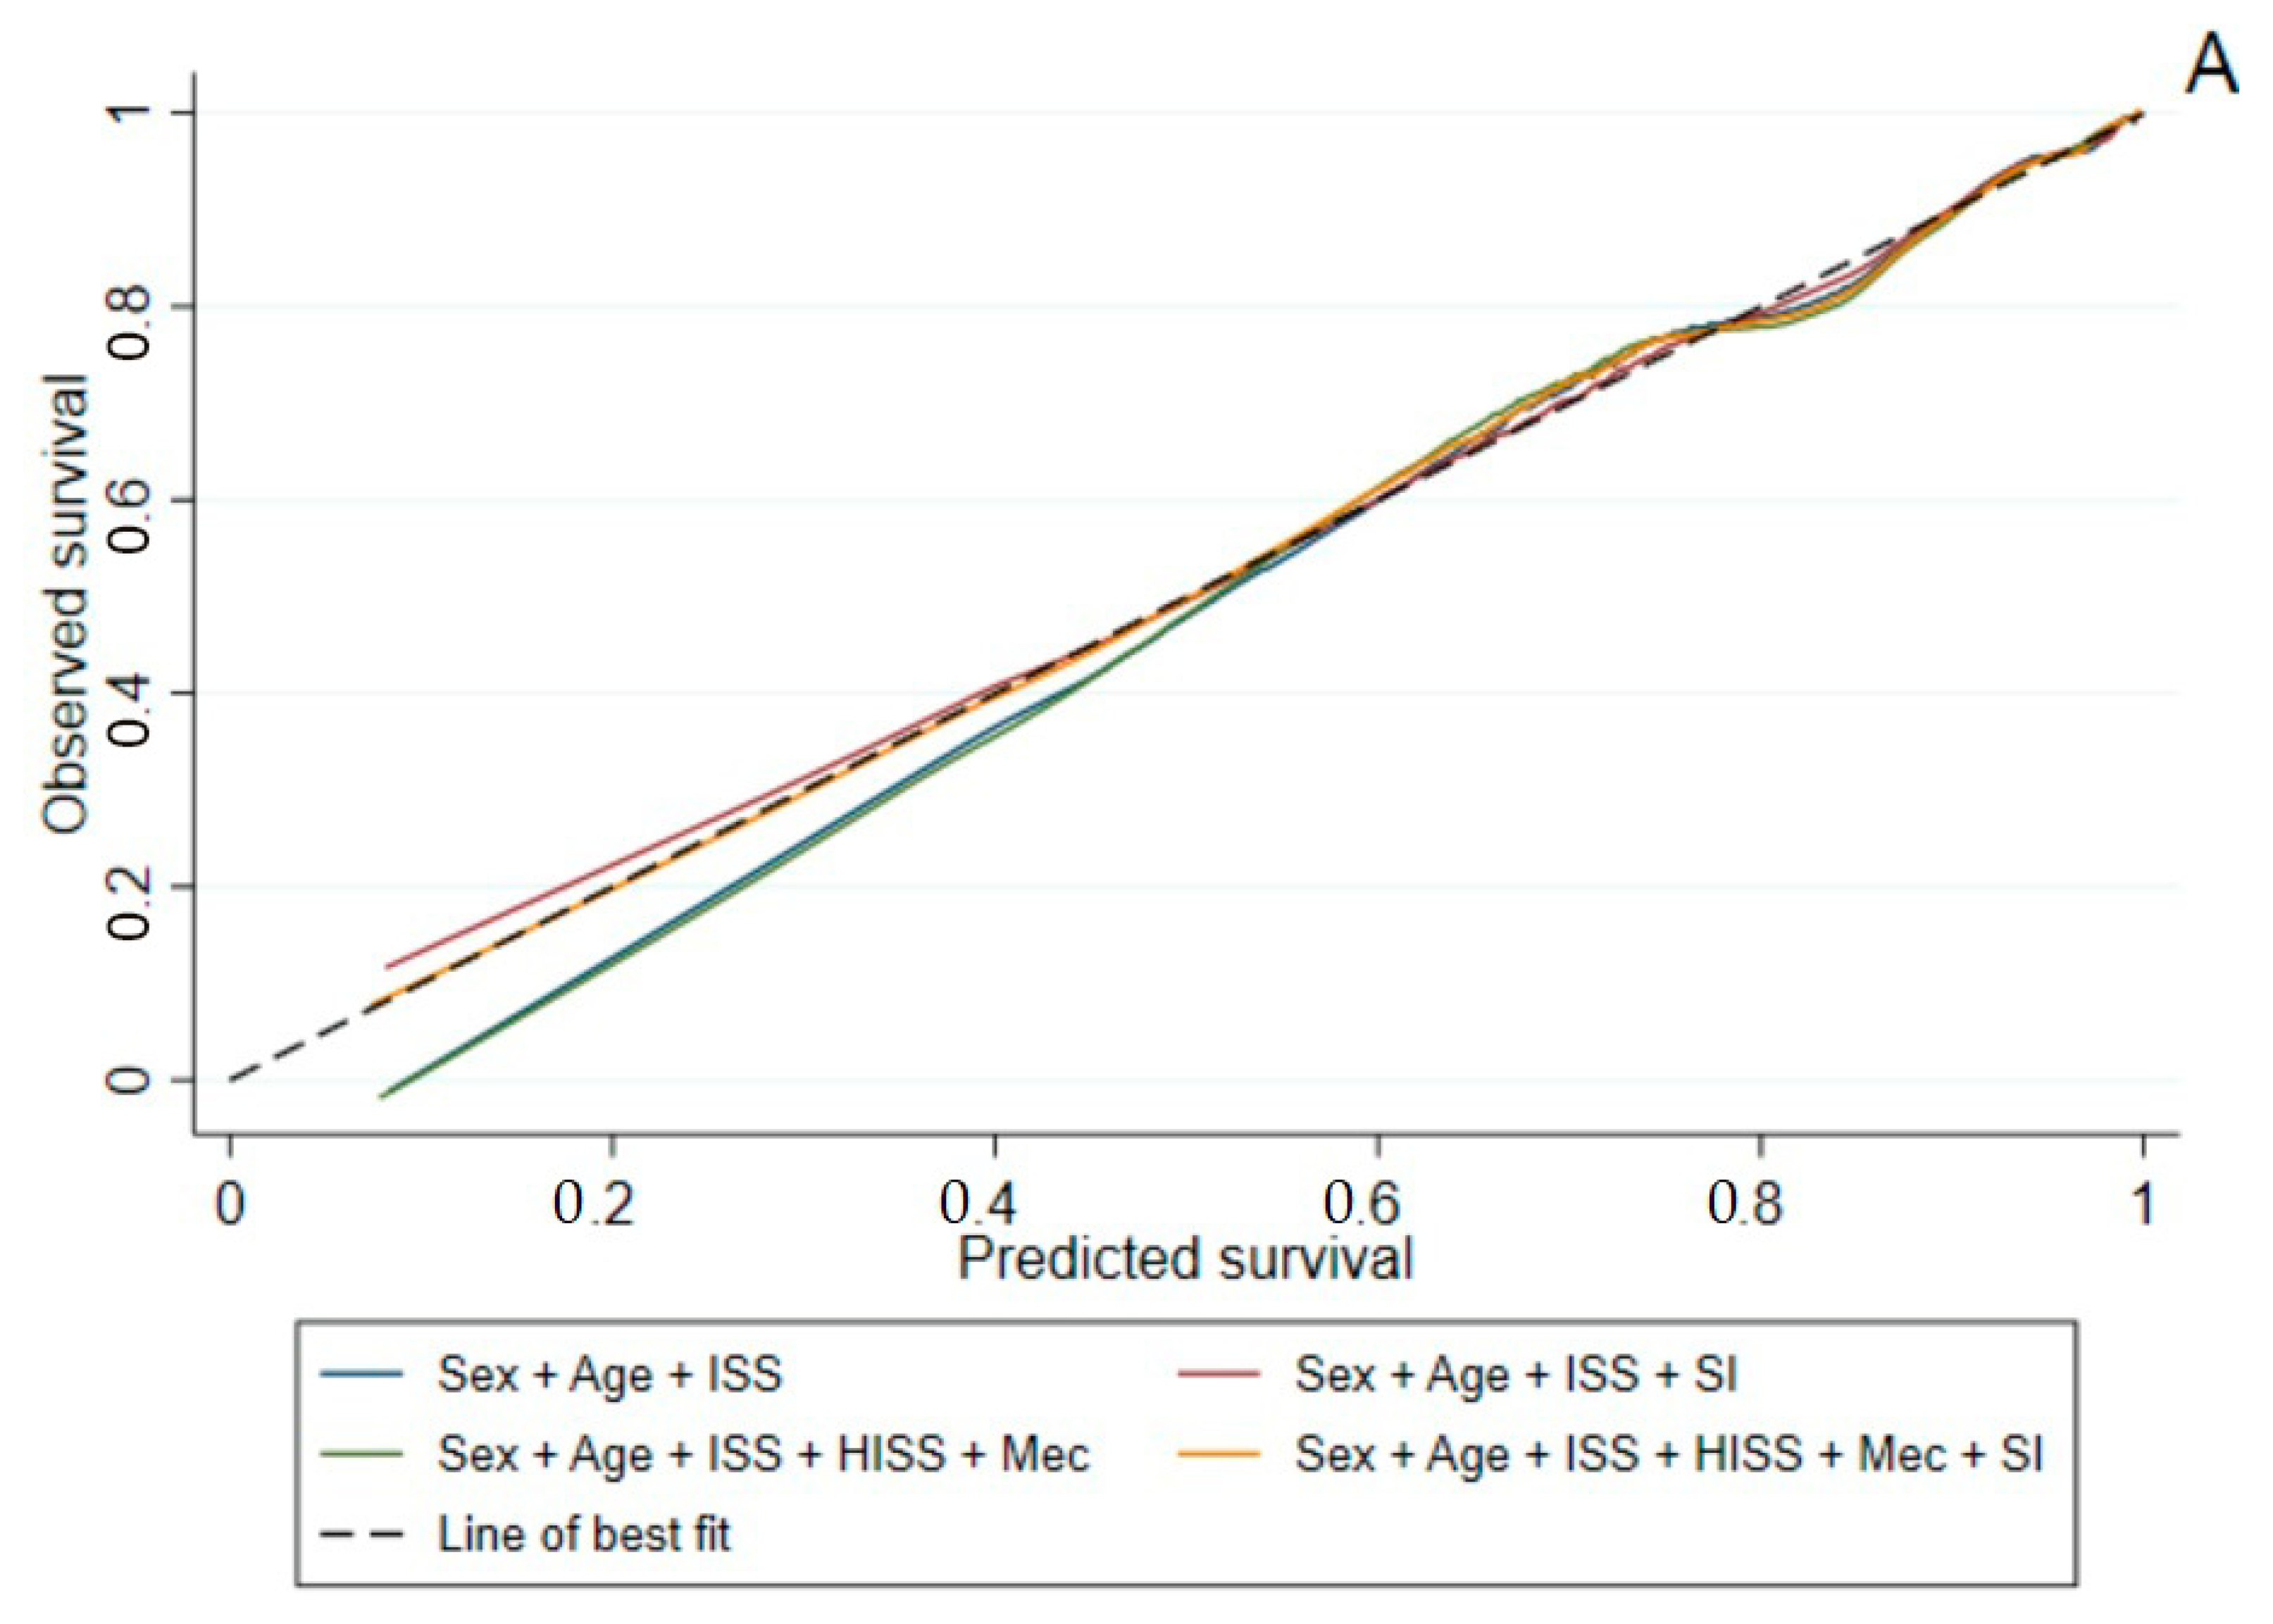
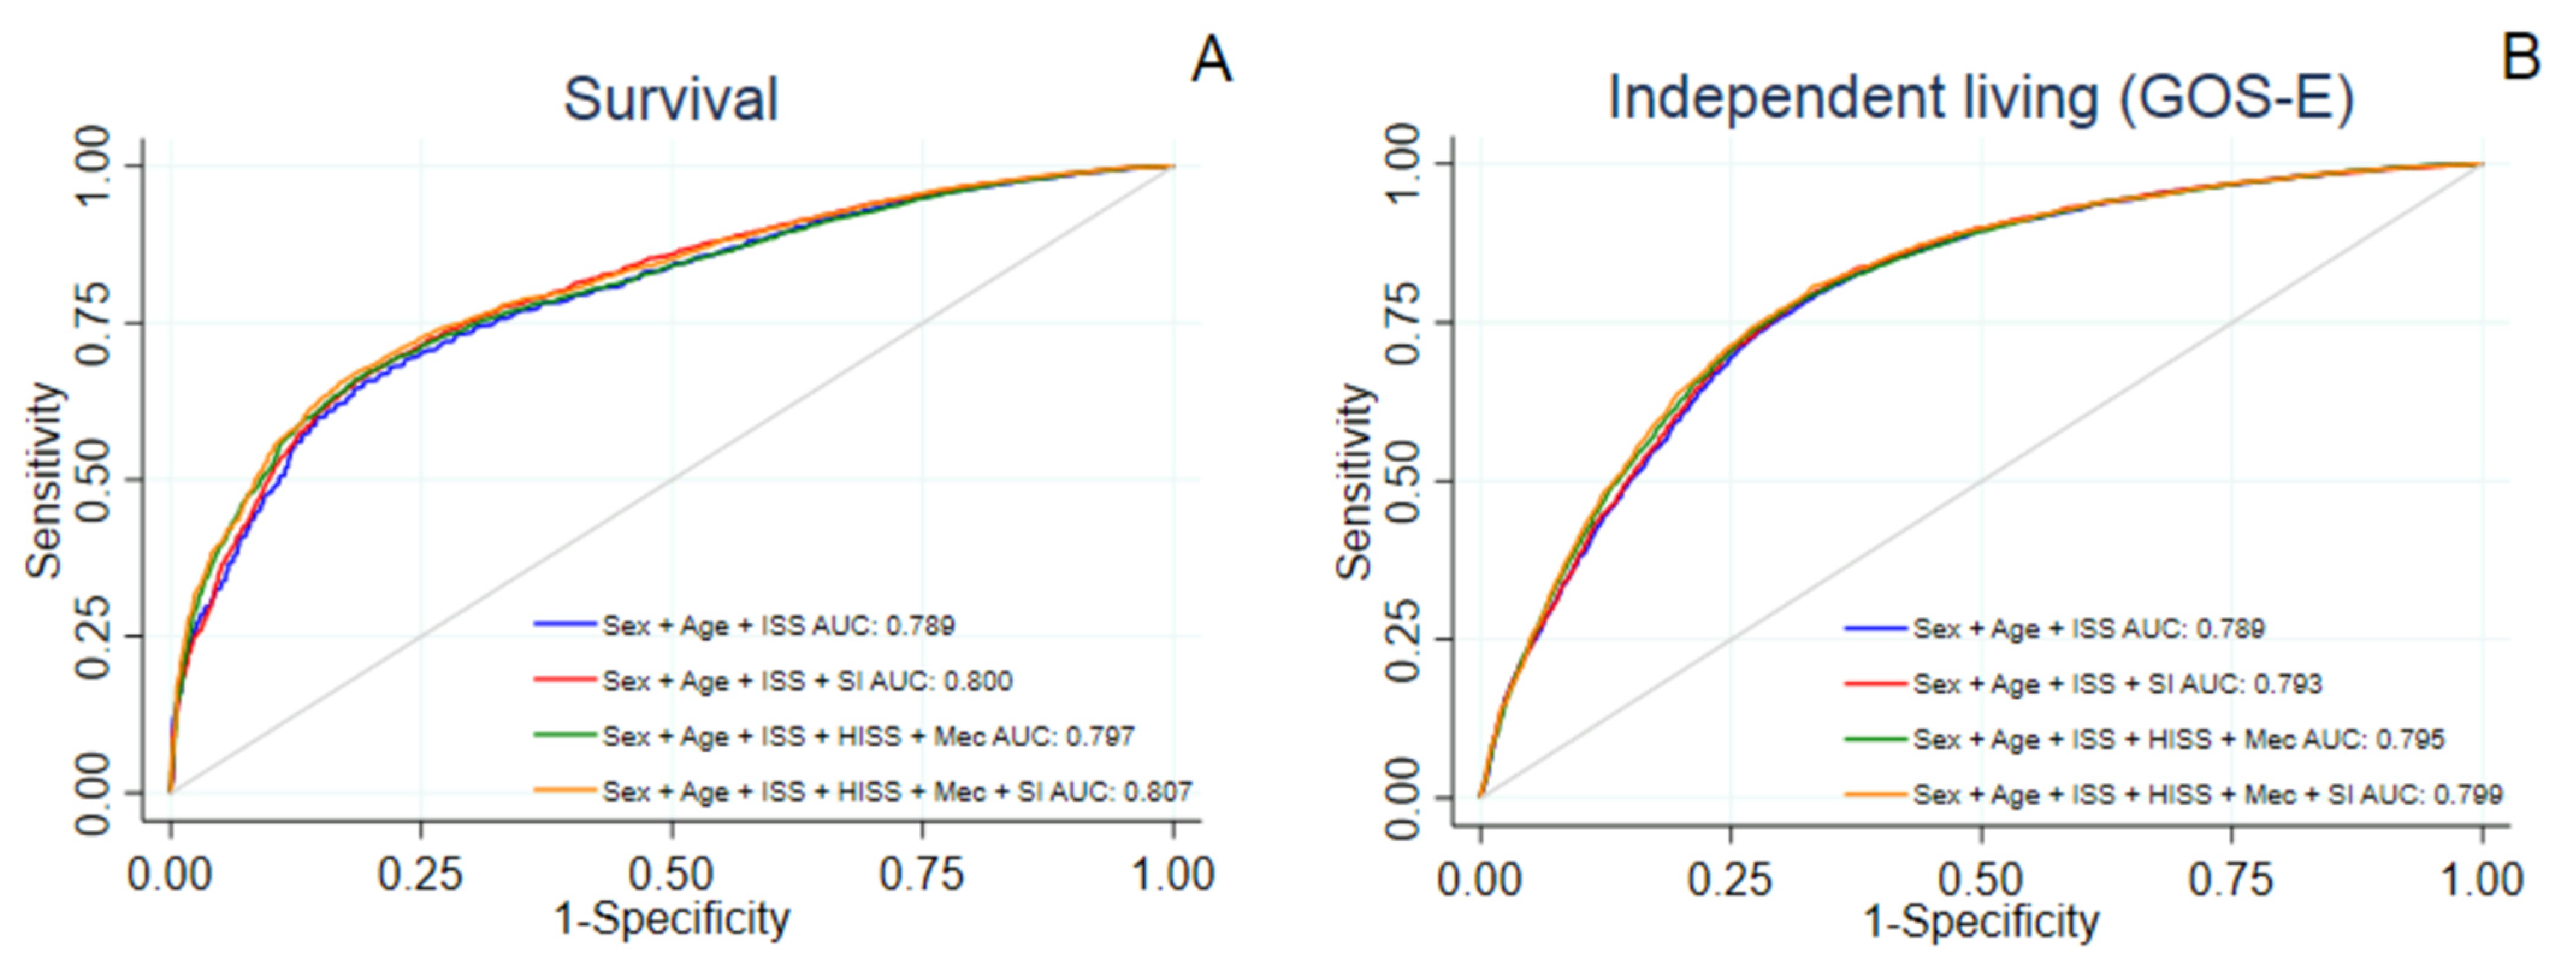
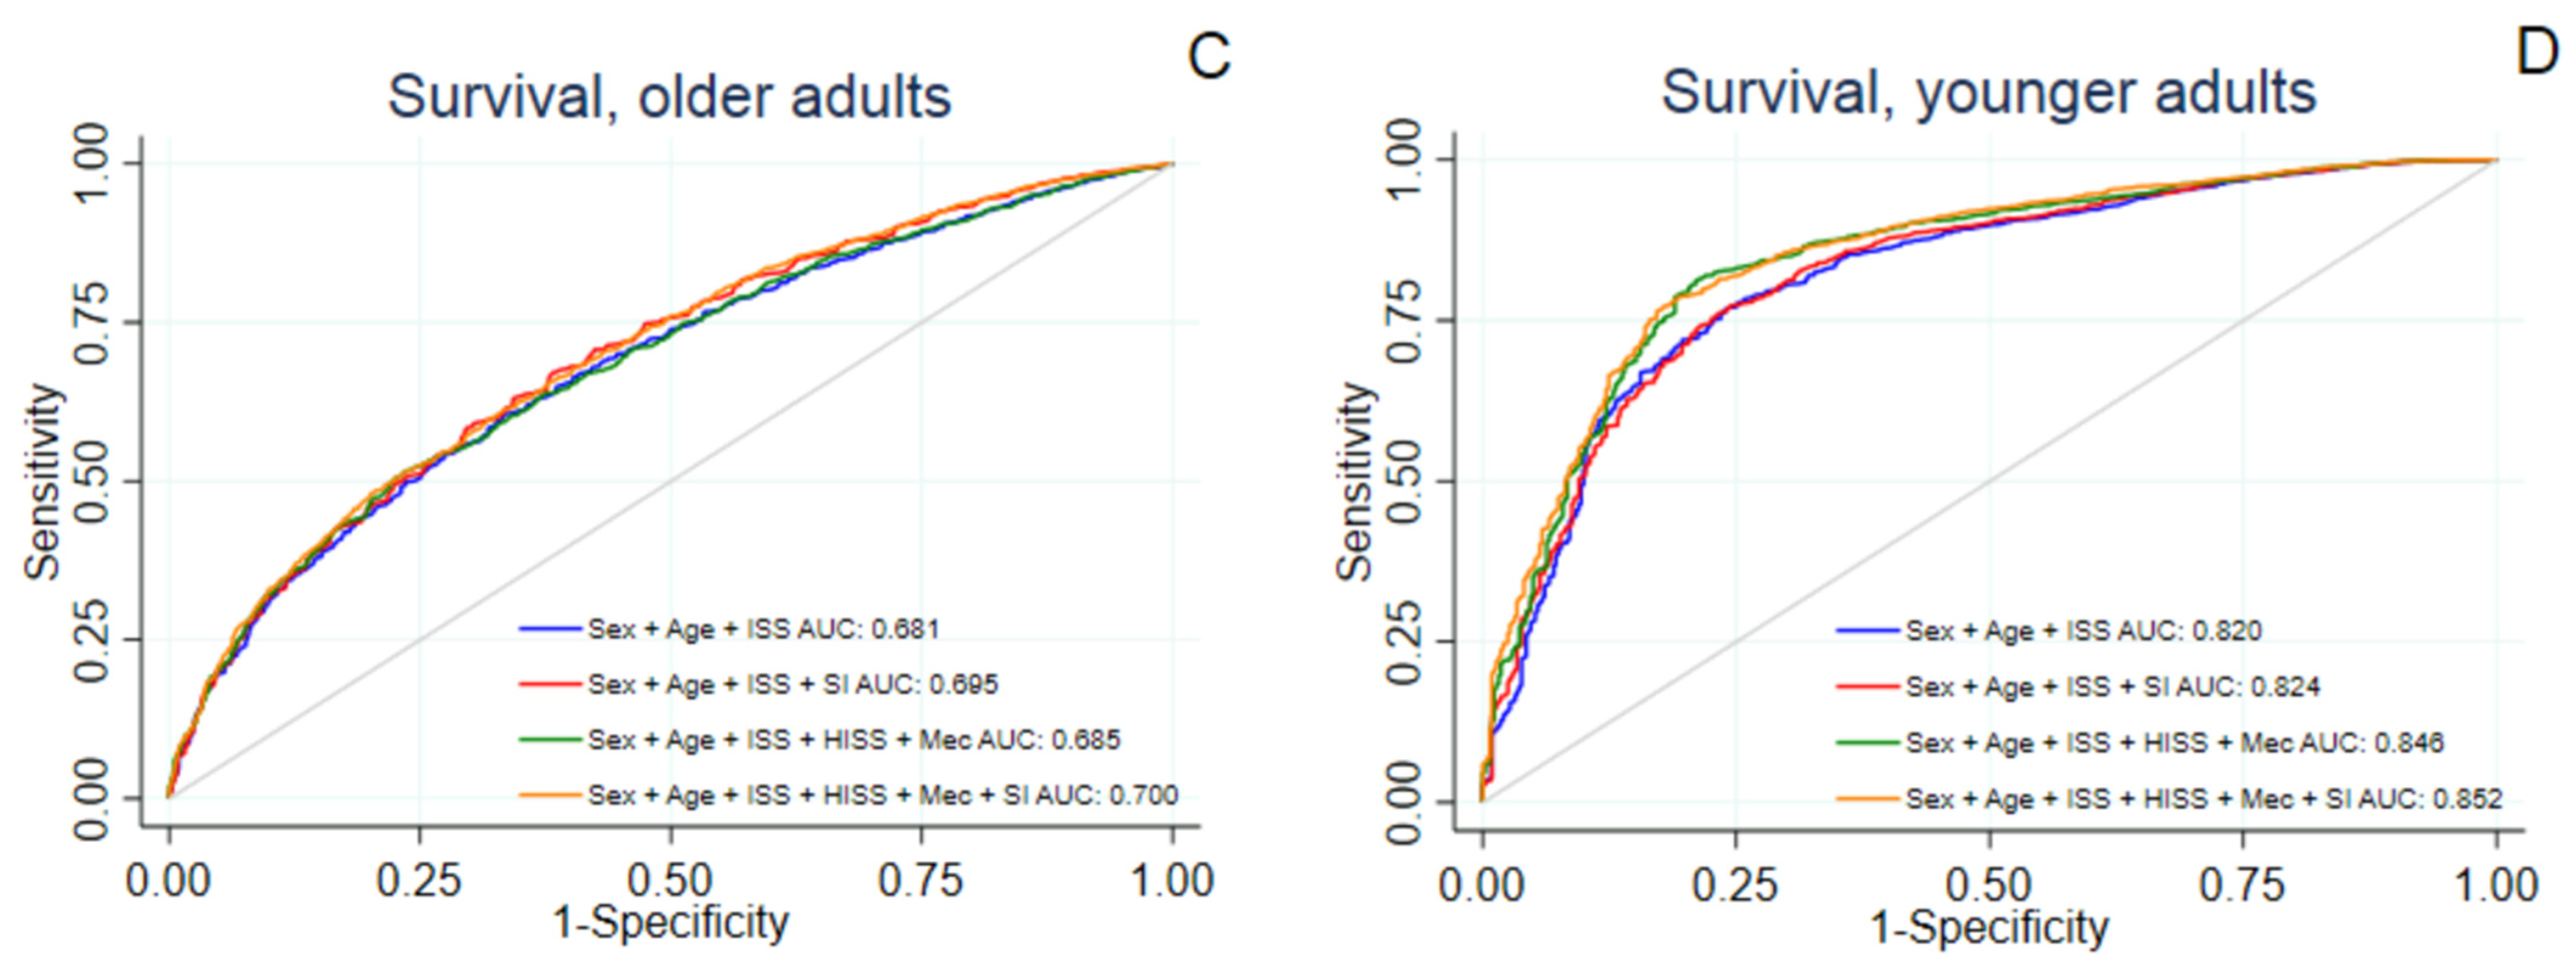
3.2.1. Survival to Hospital Discharge

Adding the SI to the VSTR model resulted in a small but significant improvement in model fit for survival (Table 3). The ROC curves are presented in Figure 2A. The discrimination of the VSTR model was improved if the SI was added to the model (p < 0.001) (Table 3). In comparison to the VSTR model with and without the SI, the widely used prediction models TRISS and RTS had lower AUC values. No model demonstrated acceptable calibration measured using the H-L statistic, although the calibration curves tracked close to the line of best fit (Figure 3A). Model performance was similar in the test dataset (Table 4).
When analysing model performance in age groups, adding the SI to the VSTR model resulted in a significantly improved discrimination for survival in older and younger adults (Table 5 and Table 6). The survival discrimination of the prognostic models was poor in the older group (AUC ranging between 0.681 to 0.699) versus excellent in the younger group (AUC ranging between 0.820 to 0.852). The ROC curves for younger and older adults are presented in Figure 2C,D. All models in older adults achieved acceptable calibration using H-L statistics (Table 5), although the calibrations of models in younger adults were not acceptable (Table 6).

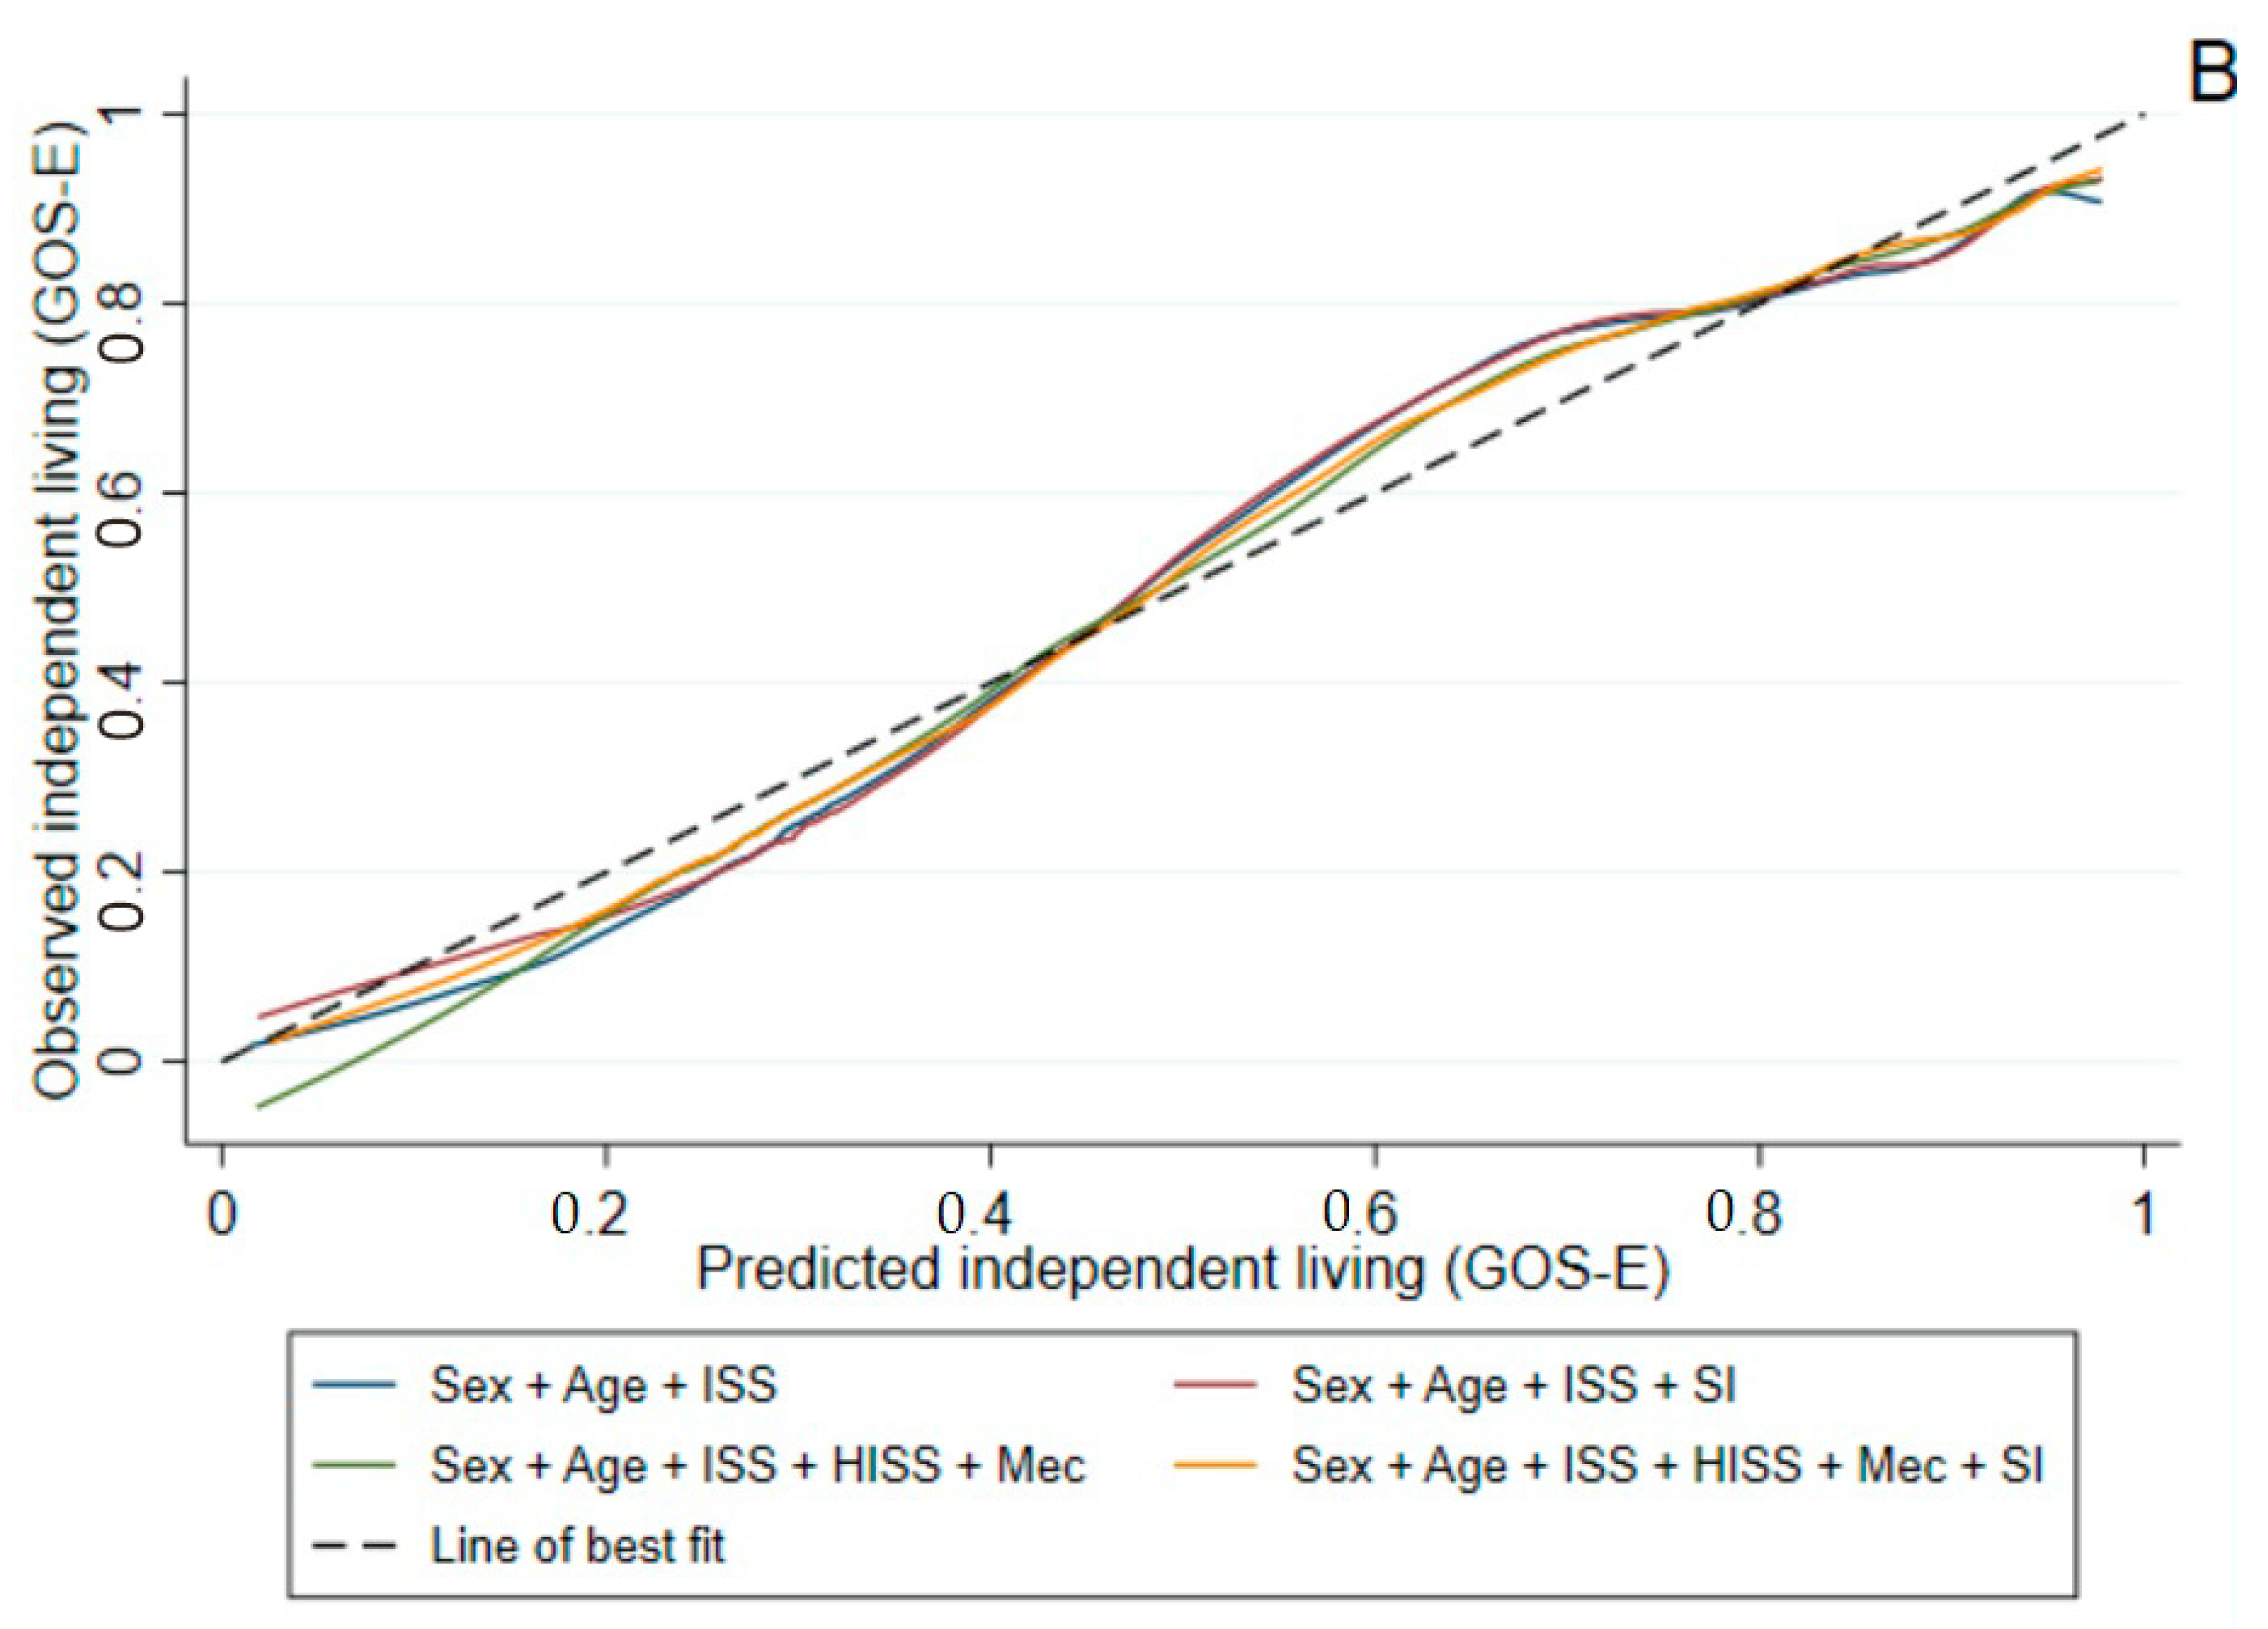
3.2.2. GOS-E at Six Months Post-Injury

The model fit was small but significant when including the SI to the VSTR model when predicting independent living 6 months post-injury (Table 3). The ROC curves are presented in Figure 2B. The discrimination of models including the SI was higher than models without the SI. Adding the SI to the VSTR model improved the AUC. None of the models demonstrated acceptable calibration using the H-L statistic, and the calibration curves showed under-estimation at lower prediction percentiles and over-estimation at higher prediction percentiles (Figure 3B). The model performance was comparable in the test dataset (Table 4). In older and younger adults, the model fit was improved when including the SI to the VSTR model for the prediction of independent living (Table 5 and Table 6). The calibration of models in younger adults was not acceptable, whereas the calibration was acceptable in older adults according to the H-L statistics. In the older group, adding the SI to the VSTR model significantly increased the AUC, which was not the case in the younger group. The discriminative ability of the models overall was higher in older adults rather than in younger adults when predicting function at 6 months post injury.

3.2.3. EQ-5D-3L Summary Score at Six Months Post-Injury

The VSTR model with the SI included had a marginally increased explained variation for the observed data in terms of the R2 and a reduced MRSE when predicting health status 6 months post-injury (Table 3). In addition, these models could only explain 11–12% of the variation of the predicted outcome. Even though the SI improved model fit, the high RMSE values imply that the model fit was not acceptable. Similar results were seen in the test dataset (Table 4).

4. Discussion

The overall aim of this study was to investigate whether the inclusion of the SI improved prediction of survival to hospital discharge and 6 months function and health status in major trauma patients. The addition of the SI to the prognostic model used by the VSTR resulted in a statistically significant but small improvement in performance when predicting survival to hospital discharge and independent living 6 months post-injury (using the GOS-E score for function). When predicting survival, the inclusion of the SI to the existing prediction model improved the AUC by 0.01, equivalent to an increase in correct classification of 1%. Adding the SI to the VSTR model when predicting health status 6 months post-injury (using the EQ-5D-3L summary score) resulted in a negligible improvement in prediction. The inclusion of the SI in the VSTR model showed a similarly marginal improvement in older adults for all outcomes, whereas the effect in younger adults was less consistent.
The improved prediction of survival is consistent with the literature. In recent decades, there have been several studies that have analysed the SI and its ability to discriminate between survivors and non-survivors. In previous studies, the SI by itself has been shown to have a poor to acceptable discriminative ability, with an AUC that ranged between 0.66 to 0.73 when predicting mortality [33,34,35]. In other words, the SI predicted death as the outcome correctly 66–73% of the time. Previous studies [36,37] have demonstrated that the discriminative ability of the SI when predicting mortality was significantly lower in older patients and declined with age. However, in the present study, the inclusion of the SI to the VSTR model improved model discrimination significantly in older adults. A lower discrimination for survival using the VSTR model with the added SI was observed in older adults (AUC 0.70) compared to in younger adults (AUC 0.85). This confirms the importance of other factors and the need to develop this prediction model further by including more predictors. The SI adds to the model, yet future studies may need to look at the applicability of models such as the Probability of Survival (United Kingdom) or the Trauma Risk Adjustment Model (Canada) to the Australian context.
The SI had a small effect on predicting longer-term outcomes including function and health status—an outcome that has not been previously studied. Mortality is a limited measure of outcome in a mature trauma system since most patients survive their injuries and often with ongoing morbidity. In general, the predictive ability of the SI was worse for long-term function and health status outcomes compared to survival. Since the SI is a measure of a physiological state, it is understandable that the SI could better influence short-term outcome rather than long-term outcome. When it comes to predicting functional outcome, the discrimination of the models overall was better in older adults in comparison to the younger group. An interpretation of this might be that it is harder to predict longer-term outcome in the young group. This could be due to other factors not included in the model that might be more important in younger patients. Socioeconomic status, prior work status and pre-injury substance abuse are examples of other factors that have been shown to be important predictors for non-fatal outcome after traumatic injury [38,39].
The VSTR model with and without the SI performed better than the widely used TRISS and RTS trauma scoring systems. In a previous study on trauma patients, the TRISS and the RTS showed a discrimination ability of AUC 0.93 and AUC 0.85 [35]. However, when the TRISS and the RTS were applied to the current population with major trauma patients, they performed remarkably worse, with AUC 0.76 and AUC 0.70. Demetriades et al. [9] showed that the TRISS is a poor predictor of survival, especially in severely injured patients (ISS > 20). Compared to a median ISS of 9 (interquartile range (IQR) 4–11) in the previous study, the median ISS was 17 (IQR 13–25) in the current study. This may explain the low performance of the TRISS and the RTS in this study.
The key strengths of this study were the large sample size (n > 29,000), the standardised approach to follow-up, the high follow up rate at 6 months (90–95% of all survivors to hospital discharge) and the use of patient-reported outcomes—an important measure of the quality of survival. Additionally, the volume of missing data was low (1.5%) for the variables included in the models. Nevertheless, there were limitations. We excluded patients that were dead on hospital arrival (HR or SBP equal to 0) as the SI could not be calculated in these cases. Further, the SI was dichotomised for analysis to ensure that the model assumptions were met, but at the potential loss of information inherent in the full SI. We substituted missing vital signs at the primary hospital with vital signs from the definitive hospital, potentially introducing bias as patients who underwent an inter-hospital transfer may be more physiologically stable when arriving to the definitive care hospital. Finally, there was a responder bias in the follow-up interviews, with patients injured in intentional events, younger and less seriously injured patients more commonly lost to follow-up—an issue observed in previous studies [40].

5. Conclusions

Adding the SI to the VSTR prediction model for survival to discharge and long-term outcomes resulted in a marginal improvement in predictive capacity for all cases and in the older and younger adult sub-groups. In future research, the examination of other factors for inclusion in the VSTR predictive model is warranted to maximise discrimination and prediction capacity. These findings should be validated prospectively or by external validation undertaken using different datasets and trauma populations.

Author Contributions

L.W. analysed the collected data, edited the tables and wrote the manuscript. B.J.G. designed the study, extracted the data and revised the manuscript. T.K. revised the manuscript. All authors have read and agreed to the published version of the manuscript.

Funding

The Victorian State Trauma Registry (VSTR) is a Department of Health, State Government of Victoria and Transport Accident Commission funded project. The funders had no role in study design, data collection and analysis, decision to publish, or preparation of the manuscript.

Institutional Review Board Statement

The registry has ethics approval from the Department of Health and Human Services Human Research Ethics Committee and each participating health service, no 11/14, 03/09/2014. This study was approved by the Monash University Human Research Ethics Committee, no 8226, 07/03/2019.

Informed Consent Statement

The Victorian State Trauma Registry uses an opt-out consent process where all eligible patients are included and provided with a letter and a brochure that explains the purpose of the registry (including use of data for research), the information collected and how to opt-out of the registry if they wish to do so. At telephone follow-up, participants provide verbal consent to undertake the telephone follow-ups and to be contacted at the next follow-up time point.

Data Availability Statement

Data for this project were obtained from the Victorian State Trauma Registry. Access to this dataset can be obtained with data custodian approval and the relevant ethics approvals. The data access policy is available at the project website -https://www.monash.edu/medicine/sphpm/vstorm.

Acknowledgments

Thanks to Sue McLellan for her assistance in extracting the data and calculating the values of the TRISS and the RTS in the current study population. The Victorian State Trauma Outcomes Registry and Monitoring group Steering Committee is thanked for their support of this project.

Conflicts of Interest

The authors declare no conflict of interest.

Abbreviations

AIS: Abbreviated Injury Scale; AUC, area under the receiver operating characteristic curve; CI, confidence intervals, EQ-5D-3L, three-level version of the EuroQol EQ-5D dimensions questionnaire; GCS, Glasgow Coma Scale; GOS-E, Glasgow Outcome Scale—Extended; HISS, Head Injury Severity Score; H-L, Hosmer–Lemeshow; HR, heart rate, ICU, intensive care unit; IQR, interquartile range, ISS, injury severity score; LR, likelihood ratio; RMSE, root-mean-square error; MTS, major trauma service; ROC, receiver operating characteristics; RTS, Revised Trauma Score; SBP, systolic blood pressure; SD, standard deviation; SeRP, Secure eResearch Platform; SI, shock index; TRISS, Trauma and Injury Severity Score; VSTR, Victorian State Trauma Registry.

References

  1. Kauvar, D.S.; Wade, C.E. The epidemiology and modern management of traumatic hemorrhage: US and international perspectives. Crit. Care 2005, 9, S1–S9. [Google Scholar] [CrossRef] [Green Version]
  2. Goldman, S.; Siman-Tov, M.; Bahouth, H.; Kessel, B.; Klein, Y.; Michaelson, M.; Miklosh, B.; Rivkind, A.; Shaked, G.; Simon, D.; et al. The Contribution of the Israeli Trauma System to the Survival of Road Traffic Casualties. Traffic Inj. Prev. 2014, 16, 368–373. [Google Scholar] [CrossRef]
  3. Cameron, P.A.; Gabbe, B.J.; Cooper, D.J.; Walker, T.; Judson, R.; McNeil, J. A statewide system of trauma care in Victoria: Effect on patient survival. Med. J. Aust. 2008, 189, 546–550. [Google Scholar] [CrossRef]
  4. Alharbi, R.J.; Shrestha, S.; Lewis, V.; Miller, C. The effectiveness of trauma care systems at different stages of development in reducing mortality: A systematic review and meta-analysis. World J. Emerg. Surg. 2021, 16, 38. [Google Scholar] [CrossRef]
  5. Champion, H.R.; Sacco, W.J.; Copes, W.S.; Gann, D.S.; Gennarelli, T.A.; Flanagan, M.E. A revision of the Trauma Score. J. Trauma-Inj. Infect. Crit. Care 1989, 29, 623–629. [Google Scholar] [CrossRef]
  6. Boyd, C.R.; Tolson, M.A.; Copes, W.S. Evaluating trauma care: The TRISS method. Trauma Score and the Injury Severity Score. J. Trauma-Inj. Infect. Crit. Care 1987, 27, 370–378. [Google Scholar] [CrossRef]
  7. Gabbe, B.J.; Cameron, P.A.; Wolfe, R. TRISS: Does it get better than this? Acad. Emerg. Med. 2004, 11, 181–186. [Google Scholar] [CrossRef]
  8. Gabbe, B.J.; Cameron, P.A.; Finch, C.F. Is the revised trauma score still useful? ANZ J. Surg. 2003, 73, 944–948. [Google Scholar] [CrossRef]
  9. Demetriades, D.; Chan, L.S.; Velmahos, G.; Berne, T.V.; Cornwell, E.E., III; Belzberg, H.; Asensio, J.A.; Murray, J.; Berne, J.; Shoemaker, W. TRISS methodology in trauma: The need for alternatives. Br. J. Surg. 1998, 85, 379–384. [Google Scholar] [CrossRef]
  10. Tisherman, S.A.; Schmicker, R.H.; Brasel, K.J.; Bulger, E.M.; Kerby, J.D.; Minei, J.P.; Powell, J.L.; Reiff, D.A.; Rizoli, S.B.; Schreiber, M.A. Detailed Description of All Deaths in Both the Shock and Traumatic Brain Injury Hypertonic Saline Trials of the Resuscitation Outcomes Consortium. Ann. Surg. 2015, 261, 586–590. [Google Scholar] [CrossRef] [Green Version]
  11. Olaussen, A.; Blackburn, T.; Mitra, B.; Fitzgerald, M. Shock index for prediction of critical bleeding post-trauma: A systematic review. Emerg. Med. Australas. 2014, 26, 223–228. [Google Scholar] [CrossRef]
  12. Allgower, M.; Burri, C. Shockindex. Dtsch. Med. Wochenschr. 1967, 92, 1947–1950. [Google Scholar]
  13. El-Menyar, A.; Goyal, P.; Tilley, E.; Latifi, R. The clinical utility of shock index to predict the need for blood transfusion and outcomes in trauma. J. Surg. Res. 2018, 227, 52–59. [Google Scholar] [CrossRef]
  14. Wang, I.-J.; Bae, B.-K.; Park, S.-W.; Cho, Y.-M.; Lee, D.-S.; Min, M.-K.; Ryu, J.-H.; Kim, G.-H.; Jang, J.-H. Pre-hospital modified shock index for prediction of massive transfusion and mortality in trauma patients. Am. J. Emerg. Med. 2019, 38, 187–190. [Google Scholar] [CrossRef]
  15. Sahu, N.; Yee, S.; Das, M.; Trinh, S.; Amoruso, R.; Connolly, M.; Rama, A.; Zuberi, J. Shock Index as a Marker for Mortality Rates in Those Admitted to the Medical Intensive Care Unit from the Emergency Department. Cureus 2020, 12, e7903. [Google Scholar] [CrossRef]
  16. Hashmi, A.; Rhee, P.; Pandit, V.; Kulvatunyou, N.; Tang, A.; O’Keeffe, T.; Zangbar, B.; Wynne, J.; Gries, L.; Vercruysse, G.; et al. Shock Index Predicts Mortality in Geriatric Trauma Patients: An Analysis of The National Trauma Data Bank. J. Surg. Res. 2014, 186, 687. [Google Scholar] [CrossRef]
  17. Jouini, S.; Jebali, A.; Hedhli, H.; Ben Kaddour, R.; Mrabet, A.; Hebaieb, F. Predictive value of shock index ≥ 1 in severe trauma patients in emergency department. La Tunis. Med. 2019, 97, 802–807. [Google Scholar]
  18. National, State and Territory Population [Internet]: Australien Bureau of Statistics 2020. Available online: https://www.abs.gov.au/statistics/people/population/national-state-and-territory-population/latest-release (accessed on 12 November 2020).
  19. Annual Report 2018–2019; Victorian State Trauma Outcomes Registry and Monitoring Group (VSTORM): Melbourne, VIC, Australia, 2020; pp. 10, 59.
  20. Haider, A.A.; Azim, A.; Rhee, P.; Kulvatunyou, N.; Ibraheem, K.; Tang, A.; O’Keeffe, T.; Iftikhar, H.; Vercruysse, G.; Joseph, B. Substituting systolic blood pressure with shock index in the National Trauma Triage Protocol. J. Trauma Acute Care Surg. 2016, 81, 1136–1141. [Google Scholar] [CrossRef]
  21. Kehoe, A.; Smith, J.E.; Edwards, A.; Yates, D.; Lecky, F. The changing face of major trauma in the UK. Emerg. Med. J. 2015, 32, 911–915. [Google Scholar] [CrossRef] [Green Version]
  22. Stevenson, M.; Segui-Gomez, M.; Lescohier, I.; Di Scala, C.; McDonald-Smith, G. An overview of the injury severity score and the new injury severity score. Inj. Prev. 2001, 7, 10–13. [Google Scholar] [CrossRef]
  23. Wilson, J.L.; Pettigrew, L.E.; Teasdale, G.M. Structured Interviews for the Glasgow Outcome Scale and the Extended Glasgow Outcome Scale: Guidelines for Their Use. J. Neurotrauma 1998, 15, 573–585. [Google Scholar] [CrossRef]
  24. Gabbe, B.J.; Williamson, O.D.; Cameron, P.A.; Dowrick, A.S. Choosing outcome assessment instruments for trauma registries. Acad. Emerg. Med. 2005, 12, 751–758. [Google Scholar] [CrossRef]
  25. Singh, R.; Venkateshwara, G.; Nair, K.; Khan, M.; Saad, R. Agitation after traumatic brain injury and predictors of outcome. Brain Inj. 2013, 28, 336–340. [Google Scholar] [CrossRef]
  26. Grobet, C.; Marks, M.; Tecklenburg, L.; Audigé, L. Application and measurement properties of EQ-5D to measure quality of life in patients with upper extremity orthopaedic disorders: A systematic literature review. Arch. Orthop. Trauma. Surg. 2018, 138, 953–961. [Google Scholar] [CrossRef]
  27. Wilson, L.; Boase, K.; Nelson, L.D.; Temkin, N.R.; Giacino, J.T.; Markowitz, A.J.; Maas, A.; Menon, D.K.; Teasdale, G.; Manley, G.T. A Manual for the Glasgow Outcome Scale-Extended Interview. J. Neurotrauma 2021, 38, 2435–2446. [Google Scholar] [CrossRef]
  28. Altman, D.G.; Vergouwe, Y.; Royston, P.; Moons, K.G.M. Prognosis and prognostic research: Validating a prognostic model. BMJ 2009, 338, b605. [Google Scholar] [CrossRef]
  29. Royston, P.; Moons, K.G.M.; Altman, D.G.; Vergouwe, Y. Prognosis and prognostic research: Developing a prognostic model. BMJ 2009, 338, b604. [Google Scholar] [CrossRef]
  30. Hosmer, D.W.; Lemeshow, S.; Sturdivant, R.X.; Hosmer, D.W., Jr. Applied Logistic Regression, 3rd ed.; John Wiley & Sons, Inc.: Hoboken, NJ, USA, 2013; pp. 12–15, 157–169, 173–177. [Google Scholar]
  31. Bewick, V.; Cheek, L.; Ball, J. Statistics review 7: Correlation and regression. Crit. Care 2003, 7, 451–459. [Google Scholar] [CrossRef] [Green Version]
  32. Kenney, J.F.; Keeping, E.S. Mathematics of Statistics, 3rd ed.; Van Nostrand: Princeton, NJ, USA, 1962. [Google Scholar]
  33. Bruijns, S.R.; Guly, H.R.; Bouamra, O.; Lecky, F.; Lee, W.A. The value of traditional vital signs, shock index, and age-based markers in predicting trauma mortality. J. Trauma Acute Care Surg. 2013, 74, 1432–1437. [Google Scholar] [CrossRef]
  34. Zarzaur, B.L.; Croce, M.A.; Magnotti, L.J.; Fabian, T.C. Identifying Life-Threatening Shock in the Older Injured Patient: An Analysis of the National Trauma Data Bank. J. Trauma Inj. Infect. Crit. Care 2010, 68, 1134–1138. [Google Scholar] [CrossRef] [Green Version]
  35. Wu, S.-C.; Rau, C.-S.; Kuo, S.C.H.; Chien, P.-C.; Hsieh, H.-Y.; Hsieh, C.-H. The Reverse Shock Index Multiplied by Glasgow Coma Scale Score (rSIG) and Prediction of Mortality Outcome in Adult Trauma Patients: A Cross-Sectional Analysis Based on Registered Trauma Data. Int. J. Environ. Res. Public Health 2018, 15, 2346. [Google Scholar] [CrossRef] [PubMed] [Green Version]
  36. Shibahashi, K.; Sugiyama, K.; Okura, Y.; Hoda, H.; Hamabe, Y. Can the shock index be a reliable predictor of early mortality after trauma in older patients? A retrospective cohort study. Acute Med. Surg. 2019, 6, 385–391. [Google Scholar] [CrossRef] [PubMed]
  37. Filipescu, R.; Powers, C.; Yu, H.; Yu, J.; Rothstein, D.H.; Harmon, C.M.; Clemency, B.; Guo, W.A.; Bass, K.D. Improving the performance of the Revised Trauma Score using Shock Index, Peripheral Oxygen Saturation, and Temperature–a National Trauma Database study 2011 to 2015. Surgery 2020, 167, 821–828. [Google Scholar] [CrossRef] [PubMed]
  38. Kruithof, N.; de Jongh, M.; de Munter, L.; Lansink, K.; Polinder, S. The effect of socio-economic status on non-fatal outcome after injury: A systematic review. Injury 2017, 48, 578–590. [Google Scholar] [CrossRef]
  39. Willemse-van Son, A.H.; Ribbers, G.M.; Verhagen, A.P.; Stam, H.J. Prognostic factors of long-term functioning and productivity after traumatic brain injury: A systematic review of prospective cohort studies. Clin. Rehabil. 2007, 21, 1024–1037. [Google Scholar] [CrossRef]
  40. Gabbe, B.J.; Simpson, P.M.; Cameron, P.; Ponsford, J.; Lyons, R.A.; Collie, A.; Fitzgerald, M.; Judson, R.; Teague, W.J.; Braaf, S.; et al. Long-term health status and trajectories of seriously injured patients: A population-based longitudinal study. PLoS Med. 2017, 14, e1002322. [Google Scholar] [CrossRef]
Figure 1. Flow of participants through the study and demonstration of replaced data. HR, heart rate; SBP, systolic blood pressure; SI, shock index (heart rate/systolic blood pressure); ISS, injury severity score.
Traumacare 02 00023 g001
Figure 2. Receiver operating characteristic (ROC) curve of models in the training dataset for predicting (A) survival to hospital discharge (B) independent living (GOS-E) 6 months post-injury (C) survival to discharge in older adults (D) survival to discharge in younger adults. ISS, injury severity score; HISS, Head Injury Severity Scale; Mec; mechanism of injury; SI, shock index (heart rate/systolic blood pressure); AUC, area under the receiver operating characteristic curve; GOS-E, Glasgow Outcome Scale—Extended.
Traumacare 02 00023 g002aTraumacare 02 00023 g002b
Figure 3. Calibration curves of models in the training dataset for (A) survival to hospital discharge and (B) independent living (GOS-E) 6 months post-injury. The calibration curve is a plot of the predicted versus the observed outcome in the training dataset. The 45° line represents perfect fit of the model. ISS, injury severity score; HISS, Head Injury Severity Scale; Mec; mechanism of injury; SI, shock index (heart rate/systolic blood pressure); AUC, area under the receiver operating characteristic curve; GOS-E, Glasgow Outcome Scale—Extended.
Traumacare 02 00023 g003aTraumacare 02 00023 g003b
Table 1. Patient characteristics.
Characteristics Total Dataset
n = 29,574 (100%)
Training Dataset
n = 14,815 (50.1%)
Test Dataset
n = 14,759 (49.9%)
Age aMean (SD), years54.3 (±23.1)54.2 (±0.19)54.4 (±0.19)
Gender aN (%)
Male20,707 (70.0)10,411 (70.3)10,296 (69.8)
Female8867 (23.0)4404 (29.7)4463 (30.2)
Injury Severity Score aMedian (IQR)17.0 (13.0–25.0)17 (13–25)17 (13–24)
Head Injury Severity Scale aN (%)
No17,847 (60.3)8960 (60.5)8887 (60.2)
Yes11,727 (39.7)5855 (39.5)5872 (39.8)
Mechanism of Injury aN (%)
Low fall (<1 m)8825 (29.8)4373 (29.52)4452 (30.2)
Motor vehicle5747 (19.4)2842 (19.2)2905 (19.7)
High fall 3292 (11.1)1650 (11.1)1642 (11.1)
Motorcycle2967 (10.0)1524 (10.3)1443 (9.8)
Collision with person or object2293 (7.8)1175 (7.9)1118 (7.6)
Pedestrian1606 (5.4)839 (5.7)767 (5.2)
Pedal cyclist1574 (5.3)779 (5.3)795 (5.4)
Other3270 (11.1)1633 (11.0)1637 (11.1)
Shock Index aN (%)
High SI ≥ 12230 (7.5)1134 (7.7)1096 (7.4)
Low SI < 127,344 (92.5)13,681 (92.4)13,663 (92.6)
Type of Injury bN (%)
Blunt27,445 (92.8)13,722 (92.7)13,723 (93.0)
Penetrating1193 (4.0)618 (4.2)575 (3.9)
Burn638 (2.2)334 (2.3)304 (2.1)
Other290 (1.0)135 (0.9)155 (1.1)
Glasgow Coma Scale Score Group cN (%)
3–82568 (8.9)1288 (8.9)1280 (8.9)
9–121678 (5.8)834 (5.8)844 (5.9)
13–1524,590 (85.3)12,323 (85.3)12,267 (85.2)
Hospital Legth of Stay dMedian (IQR), days6.9 (3.8–12.8)6.9 (3.8–12.9)6.9 (3.9–12.8)
In-Hospital Mortality aN (%)
No26,189 (88.6)13,087 (88.3)13,102 (88.8)
Yes3385 (11.5)1728 (11.7)1657 (11.2)
a n = 0 missing. b n = 8 missing. c n = 738 missing. d n = 6 missing. SD, Standard Deviation; IQR, Interquartile Range.
Table 2. Observed outcomes. Functional outcome was measured with GOS-E score and health status with EQ-5D-3L summary score six months post-injury.
Outcome Training Dataset
n = 14,815 (50.1%)
Test Dataset
n = 14,759 (49.9%)
Survival to DischargeN (%)29,574 (100)
No 1728 (11.7)1657 (11.2)
Yes 13,087 (88.3)13,102 (88.8)
GOS-E Score at 6 MonthsN (% of the survivors)24,953 (95.3)
Dependent living 4494 (36.0)4441 (35.6)
Independent living 8000 (64.0)8018 (64.4)
EQ-5D-3L at 6 MonthsN (% of the survivors)23,648 (90.3)
Mean (SD) 0.53 (0.40)0.53 (0.40)
GOS-E, Glasgow Outcome Scale—Extended; EQ-5D-3D, three-level EuroQol five dimensions; SD, standard deviation.
Table 3. Model performance in the training dataset (n = 14,815) to predict survival to discharge and functional and health status after major trauma. Functional outcome was measured with GOS-E score and health status with EQ-5D-3L summary score 6 months post-injury.
OutcomePrediction ModelAUC (95% CI)H-L Statistic (p-Value)LR-Test (p-Value)
Survival to Discharge
Sex + Age + ISS0.789 (0.779–0.800)37.3 (<0.001)-
Sex + Age + ISS + SI0.800 (0.790–0.810)15.4 (0.05)141.0 (<0.001) *
Sex + Age + ISS + HISS + Mechanism0.797 (0.787–0.807)32 (<0.001)-
Sex + Age + ISS + HISS + Mechanism + SI0.807 (0.797–0.816)38.1 (<0.001)146.6 (<0.001) **
TRISS0.764 (0.751–0.777)783.7 (<0.001)-
RTS0.696 (0.683–0.709)188.7 (<0.001)-
GOS-E at 6 Months
Sex + Age + ISS0.789 (0.781–0.798)146.0 (<0.001)-
Sex + Age + ISS + SI0.793 (0.784–0.801)156.2 (<0.001)71.1 (<0.001) *
Sex + Age + ISS + HISS + Mechanism0.795 (0.786–0.803)84.1 (<0.001)-
Sex + Age + ISS + HISS + Mechanism + SI0.799 (0.791–0.807)98.1 (<0.001)93.8 (<0.001) **
R2RMSE
EQ-5D-3L at 6 Months
Sex + Age + ISS0.1090.379
Sex + Age + ISS + SI0.1150.377
Sex + Age + ISS + HISS + Mechanism0.1100.379
Sex + Age + ISS + HISS + Mechanism + SI0.1160.377
* Compared to model sex + age + ISS. ** Compared to model sex + age + ISS + HISS + mechanism. SI, shock index; ISS, injury severity score; HISS, Head Injury Severity Scale; GOS-E, Glasgow Outcome Scale—Extended; EQ-5D-3D, three-level EuroQol five dimensions; AUC, area under the receiver operating characteristic curve; CI, confidence interval; H-L, Hosmer–Lemeshow; LR, likelihood Ratio; MSE, mean square error.
Table 4. Model performance in the test dataset (n = 14,759) to predict survival to discharge, functional and health status after major trauma. Functional outcome was measured with GOS-E score and health status with EQ-5D-3L summary score 6 months post-injury.
OutcomePrediction ModelAUC (95% CI)H-L Statistic (p-Value)
Survival to Discharge
Sex + Age + ISS0.774 (0.763–0.785)43.1 (<0.001)
Sex + Age + ISS + SI0.789 (0.778–0.799)43.7 (<0.001)
Sex + Age + ISS + HISS + Mechanism0.783 (0.773–0.794)41.3 (<0.001)
Sex + Age + ISS + HISS + Mechanism + SI0.799 (0.788–0.809)27.1 (<0.001)
TRISS0.768 (0.755–0.781)656.6 (<0.001)
RTS0.703 (0.690–0.716)203.1 (<0.001)
GOS-E at 6 Months
Sex + Age + ISS0.791 (0.782–0.799)178.0 (<0.001)
Sex + Age + ISS + SI0.796 (0.787–0.804)178.6 (<0.001)
Sex + Age + ISS + HISS + Mechanism0.798 (0.789–0.806)115.2 (<0.001)
Sex + Age + ISS + HISS + Mechanism + SI0.803 (0.795–0.812)122.0 (<0.001)
R2RMSE
EQ-5D-3L at 6 Months
Sex + Age + ISS0.1120.370
Sex + Age + ISS + SI0.1230.371
Sex + Age + ISS + HISS + Mechanism0.1130.372
Sex + Age + ISS + HISS + Mechanism + SI0.1230.373
SI, shock index; ISS, injury severity score; HISS, Head Injury Severity Scale; GOS-E, Glasgow Outcome Scale—Extended; EQ-5D-3D, three-level EuroQol five dimensions; AUC, area under the receiver operating characteristic curve; CI, confidence interval; H-L, Hosmer–Lemeshow; RMSE, root mean square error.
Table 5. Model performance in older adults (≥65 years) in the training dataset (n = 5486) to predict survival to hospital discharge and functional and health status after major trauma. Functional outcome was measured with GOS-E score and health status with EQ-5D-3L summary score 6 months post-injury.
OutcomePrediction ModelAUC (95% CI)H-L Statistic (p-Value)LR-Test (p-Value)
Survival to Discharge
Sex + Age + ISS0.681 (0.665–0.697)10.3 (0.24)-
Sex + Age + ISS + SI0.695 (0.679–0.711)7.8 (0.46)82.0 (<0.001) *
Sex + Age + ISS + HISS + Mechanism0.685 (0.669–0.700)14.8 (0.064)-
Sex + Age + ISS + HISS + Mechanism + SI0.699 (0.683–0.715)12.2 (0.14)81.1 (<0.001) **
GOS-E at 6 Months
Sex + Age + ISS0.751 (0.737–0.764)10.5 (0.23)
Sex + Age + ISS + SI0.753 (0.740–0.767)7.7 (0.47)
Sex + Age + ISS + HISS + Mechanism0.758 (0.744–0.771)9.0 (0.34)
Sex + Age + ISS + HISS + Mechanism + SI0.761 (0.748–0.775)8.9 (0.35)
R2RMSE
EQ-5D-3L at 6 Months
Sex + Age + ISS0.0950.392
Sex + Age + ISS + SI0.1020.390
Sex + Age + ISS + HISS + Mechanism0.0960.392
Sex + Age + ISS + HISS + Mechanism + SI0.1020.390
* Compared to model sex + age + ISS. ** Compared to model sex + age + ISS + HISS + mechanism. SI, shock index; ISS, injury severity score; HISS, Head Injury Severity Scale; GOS-E, Glasgow Outcome Scale—Extended; EQ-5D-3D, three-level EuroQol five dimensions; AUC, area under the receiver operating characteristic curve; CI, confidence interval; H-L, Hosmer–Lemeshow; LR, likelihood ratio; RMSE, root mean square error.
Table 6. Model performance in younger adults (<65 years) in the training dataset (n = 9329) to predict survival to hospital discharge and functional and health status after major trauma. Functional outcome was measured with GOS-E score and health status with EQ-5D-3L summary score six months post-injury.
OutcomePrediction ModelAUC (95% CI)H-L Statistic (p-Value)LR-Test (p-Value)
Survival to Discharge
Sex + Age + ISS0.820 (0.800–0.841)59.2 (<0.001)-
Sex + Age + ISS + SI0.824 (0.804–0.845)50.5 (<0.001)19.1 (<0.001) *
Sex + Age + ISS + HISS + Mechanism0.846 (0.826–0.865)42.2 (<0.001)-
Sex + Age + ISS + HISS + Mechanism + SI0.852 (0.833–0.870)19.6 (0.012)28.7 (<0.001) **
GOS-E at 6 Months
Sex + Age + ISS0.694 (0.678–0.710)74.6 (<0.001)-
Sex + Age + ISS + SI0.698 (0.683–0.714)49.3 (<0.001)22.6 (<0.001) *
Sex + Age + ISS + HISS + Mechanism0.707 (0.691–0.722)47.3 (<0.001)-
Sex + Age + ISS + HISS + Mechanism + SI0.711 (0.695–0.727)28.9 (<0.001)31.8 (<0.001) **
R2RMSE
EQ-5D-3L at 6 Months
Sex + Age + ISS0.0660.361
Sex + Age + ISS + SI0.0710.361
Sex + Age + ISS + HISS + Mechanism0.0700.361
Sex + Age + ISS + HISS + Mechanism + SI0.0740.360
* Compared to model sex + age + ISS. ** Compared to model sex + age + ISS + HISS + mechanism. SI, shock index; ISS, injury severity score; HISS, Head Injury Severity Scale; GOS-E, Glasgow Outcome Scale—Extended; EQ-5D-3D, three-level EuroQol five dimensions; AUC, area under the receiver operating characteristic curve; CI, confidence interval; H-L, Hosmer–Lemeshow; LR, likelihood ratio; RMSE, root mean square error.
Publisher’s Note: MDPI stays neutral with regard to jurisdictional claims in published maps and institutional affiliations.

