
Intrinsic Fluorometric Reporters of Pteridine Reductase 1, a Target for Antiparasitic Agents


Department of Life Sciences, University of Modena and Reggio, Via G. Campi 103, 41125 Modena, Italy
*
Author to whom correspondence should be addressed.
Physchem 2022, 2(2), 131-144; https://doi.org/10.3390/physchem2020010
Submission received: 20 March 2022
/
Revised: 20 April 2022
/
Accepted: 27 April 2022
/
Published: 6 May 2022
(This article belongs to the Section Biophysical Chemistry)
Abstract
:The intrinsic steady-state and time-resolved fluorescence of Leishmania major pteridine reductase 1, a tetrameric protein target for anti-infective agents, is investigated and deciphered in terms of the contributions from populations of the two tryptophans included in each protein monomer. Signals from these local fluorometric reporters contain molecular-level information on the conformational landscape of this protein and on its interaction with a nanomolar pteridinic inhibitor.

1. Introduction
Deciphering protein intrinsic fluorescence is a complex exercise, yet one that may produce valuable information on the conformational landscape of a protein in solution, including the changes brought about by its binding to a biological interactor. The source of this complexity is manifold, but its main aspects have now been fully resolved [1]. The two intrinsic fluorophores, tyrosine and tryptophans, give partially overlapping spectral emissions. Further, tryptophan (Trp) itself, as a fluorophore, features intrinsic complexity. Its two lowest excited states, corresponding to bands 1Lb and 1La according to Platt’s notation, are nearly degenerate in the isolated molecule or in low-polarity environments. Due to the pyrrole-to-benzene charge-transfer character of the S0 → 1La transition, this excited state is preferentially stabilized relative to the 1Lb and ground states by favourably oriented electric fields generated by a polar environment [1,2]. The latter is usually provided by nearby, favourably oriented water molecules. In fact, while electric fields due to protein-charged or dipolar portions may be intense [2], they can be both favourably and unfavourably oriented relative to the electric dipole moment of the excited indole, eventually cancelling each other out. Hence, a usually positive fluorosolvatochromism provides the basis for the widespread use of intrinsic emission to monitor the degree of exposure of protein Trps to water. As for time-resolved emission, even single-tryptophan proteins usually show multiexponential fluorescence decays that reflect the conformational complexity of proteins, and result from the high sensitivity of Trp emission properties to the microenvironment. In fact, in addition to the mentioned fluorosolvatochromism, Trp emission can be quenched by endogenous quenchers such as peptide bonds and carboxylic and aminic side chains through such processes as excitation energy and electron and proton transfers, whose efficiencies are sharply protein-conformation dependent [1,3,4,5]. In spite of this complexity, great progress has been made towards correlating the fluorometric features of proteins with their structure and dynamics, progress also boosted by the discovery that, in the absence of significant inter-tryptophan energy transfer, the fluorescence properties of multi-tryptophan proteins can be reasonably well expressed as a linear combination of those of the corresponding single-tryptophan proteins [4]. Thus, structural and dynamic information on the protein itself and its binding to relevant ligands, which is cryptated into the body of observables provided by intrinsic protein fluorescence, has now become more accessible. Indeed, the literature on the subject is plentiful. Concerning the relationship between protein structure and dynamics and their intrinsic fluorescence properties, extensively quoted reviews are due to Eftink, Engelborghs and Lakowicz [1,6,7]; for very recent specific examples, see Refs. [8,9,10,11]. On the other hand, the exploitation of protein, essentially tryptophan, emission features to monitor and quantitatively characterize protein–ligand binding, including the pitfalls therein, is reviewed and commented in Refs. [12,13,14], while recent examples, including metal ions and complexes as ligands, are reported as Refs. [15,16,17,18,19,20,21,22].
We will focus our attention on the intrinsic fluorescence of pteridine reductase 1 (PTR1), an enzyme that catalyses the synthesis of tetrahydrobiopterin from biopterin in, e.g., Leishmania species and Trypanosomas. These protozoa are responsible for several serious diseases that have become endemic in various regions of the world [23]. Most of the drugs that have been used to treat leishmaniasis (e.g., antimonial compounds, amphotericin B, pentamidine, ketoconazole and miltefosine) are characterized by either need for long treatments, or by limited or variable efficacy against the different forms of leishmaniasis, severe side effects and, not negligible, high costs [24]. Thus, efforts have recently focused on the discovery of new chemical tools able to fight the various forms of leishmaniasis and trypanosomiasis through the establishment of the neglected tropical diseases program [25]. A well-known strategy to develop anti-infective drugs targets the folate pathway of the microorganism [26]. PTR1 is a key enzyme within this pathway, as it provides pteridine salvage, hence, microorganism survival, when the dihydrofolate reductase (DHFR) enzyme is inhibited [27]; hence, the combined inhibition of DHFR and PTR1 is now a recognized strategy to achieve microorganism inactivation [28].
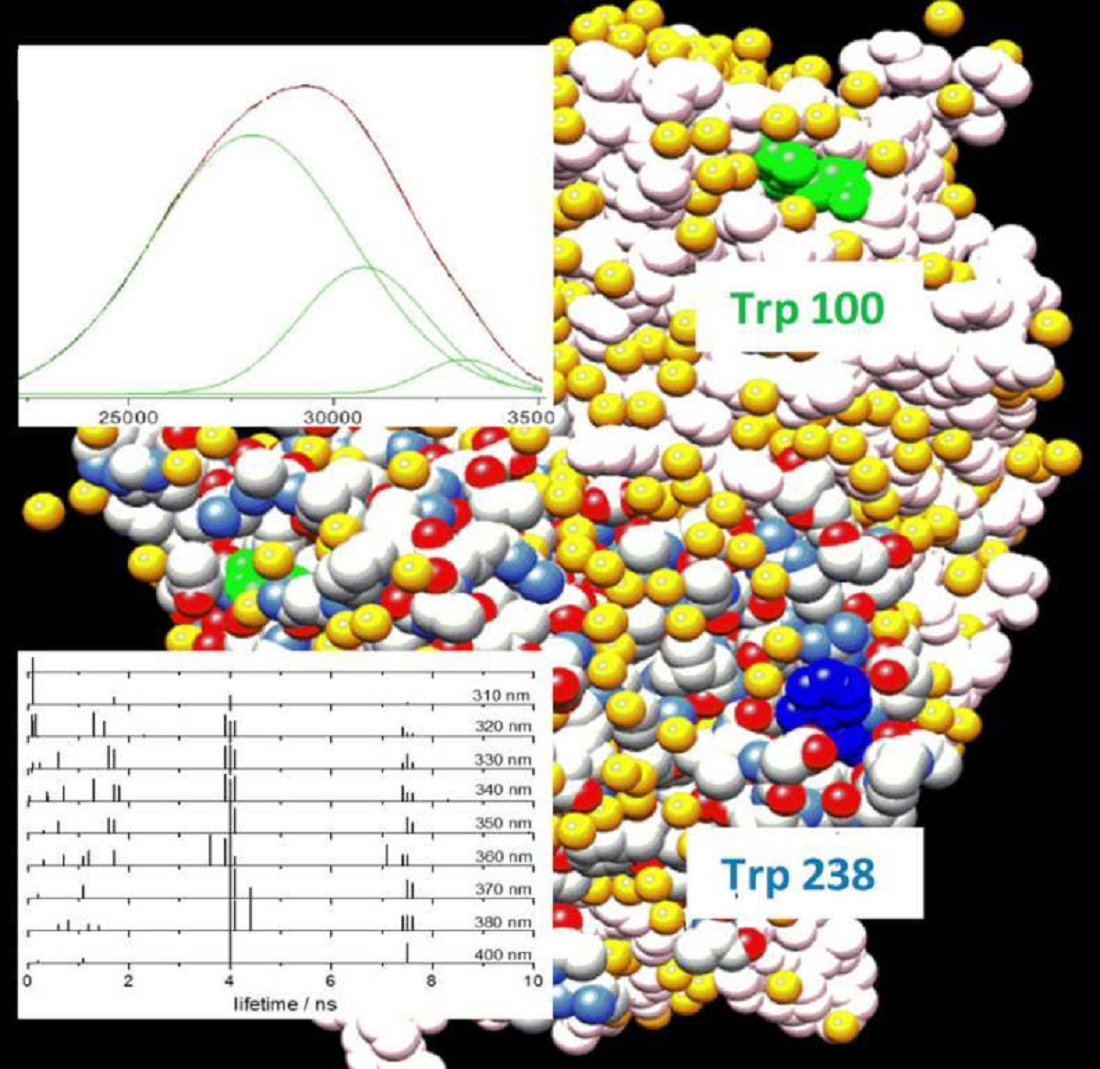
Leishmania major (Lm) PTR1 is an obligate 120 kDa tetramer with two tryptophans, Trp100 and Trp238, and 11 tyrosines per monomer (Figure 1). The diaminopteridinic compound, C3 (Scheme 1), has been found very active (Ki = 37 nM) against Lm PTR1 (compound 6b in Ref. [28]). Structural details of the Lm PTR1/C3 complex have been provided by X-ray crystallography (PDB ID: 5L42) [29]. However, to monitor proteins and their interaction with inhibitors in solution, we need spectroscopic reporters. Here, we will depict a fluorometric portrait of Lm PTR1 and will investigate its changes following binding to the C3 inhibitor.
2. Materials and Methods
All reagents and inorganic salts were obtained from the Sigma-Aldrich catalogue (Merck Life Science S.r.l., Milano, Italy). Both Lm and Trypanosoma brucei (Tb) PTR1 were expressed in Escherichia coli BL21(DE3) cultured at 37 °C in SuperBroth medium to mid-log phase and induced with isopropyl β-D-1-thiogalactopyranoside overnight at 30 °C. Cells, harvested by centrifugation, were resuspended and disrupted by sonication. The supernatant, collected by centrifugation, was purified by nickel-affinity chromatography (GE ÄKTA Prime FPLC, GE Healthcare Europe GmbH, Milano, Italy) using first a His-Trap column and then a Hi-Trap desalting column (GE Healthcare Europe GmbH, Milano, Italy). Fractions containing the proteins, identified by their absorbance at 280 nm, were pooled and combined with thrombin protease and then dialyzed overnight. Lm and Tb PTR1 were further purified by a second nickel-affinity chromatography followed by dialysis. The high purity of the proteins was confirmed by SDS-PAGE analysis and UHPLC-MS Q Exactive-Thermo Scientific mass spectrometry (Thermo Fisher Scientific Inc., Monza, Italy). Details of the expression and purification of the two proteins are provided in Ref. [30]. Compound C3 was obtained by reacting equimolar amounts of 6-bromomethyl-2,4-diaminopteridin hydrobromide and methyl 1-(4-methylaminobenzoyl) piperidine-4-carboxylate; the residue obtained after in vacuo solvent evaporation was purified by flash chromatography using CHCl3/MeOH (9:1, vol/vol) as the eluent to afford compound C3 with a 50% yield. Details of the synthesis are reported in ref. [28]. Absorption spectra were recorded with a Cary100 UV–vis spectrophotometer (Agilent Technologies Italia SpA, Milano, Italy) using either 1 × 1 or 1 × 0.4 cm2 quartz cells. Steady-state fluorescence measurements were carried out with a Horiba Jobin–Yvon FluoroMax3 spectrofluorometer (Horiba Italia Srl, Rome, Italy). The emission spectra were corrected for the detector response spectral sensitivity. Excitation wavelengths were either 280 nm, when we wished to observe both Tyr and Trp emissions, or 295 nm when selective Trp excitation was desired. In order to minimize protein aggregation and inner-filter effects, absorbances at 295 nm were 0.1, corresponding to 9 μM protein (ε295 ~ 11,200 M−1 cm−1, where M is moles of protein tetramer per litre) or lower. The emission spectra were decomposed into Gaussian components using Microcal Origin band decomposition. Emission band centroids, , I representing the emission intensity at a given wavelength of the emission band, were computed within a Microsoft Excel spreadsheet. Fluorescence time decays were collected with a Horiba FluoroMax4, employing a 285 nm LED excitation source at a 1 MHz repetition rate. The instrument response function was approximately 1 ns and was reduced to about 0.1 ns after deconvolution of the emission decays from the excitation flash in the measured time profiles. The peak channel in the decays contained 104 counts, and at least two decays were measured at each emission wavelength on different samples. The fluorescence decays were fitted to a sum of exponentials using Horiba DAS6 software. Accepted fittings had x2 values lower than 1.10. All measurements were made at 20 ± 2 °C at pH 6.0 in sodium phosphate buffer.
Ten X-ray crystallographic structures of LmPTR1, either ligand-free or complexed with substrates or ligands/inhibitors (Protein Data Bank, www.rcsb.org accessed on 28 February 2018), were used to analyse the conformation and solvent exposure variability of the LmPTR1 tryptophan residues. A total of 46 monomeric chains forming their asymmetric units were graphically compared and analysed with Chimera 1.9.
3. Results
3.1. Fluorometric Profile of Lm PTR1
3.1.1. Emission Spectra
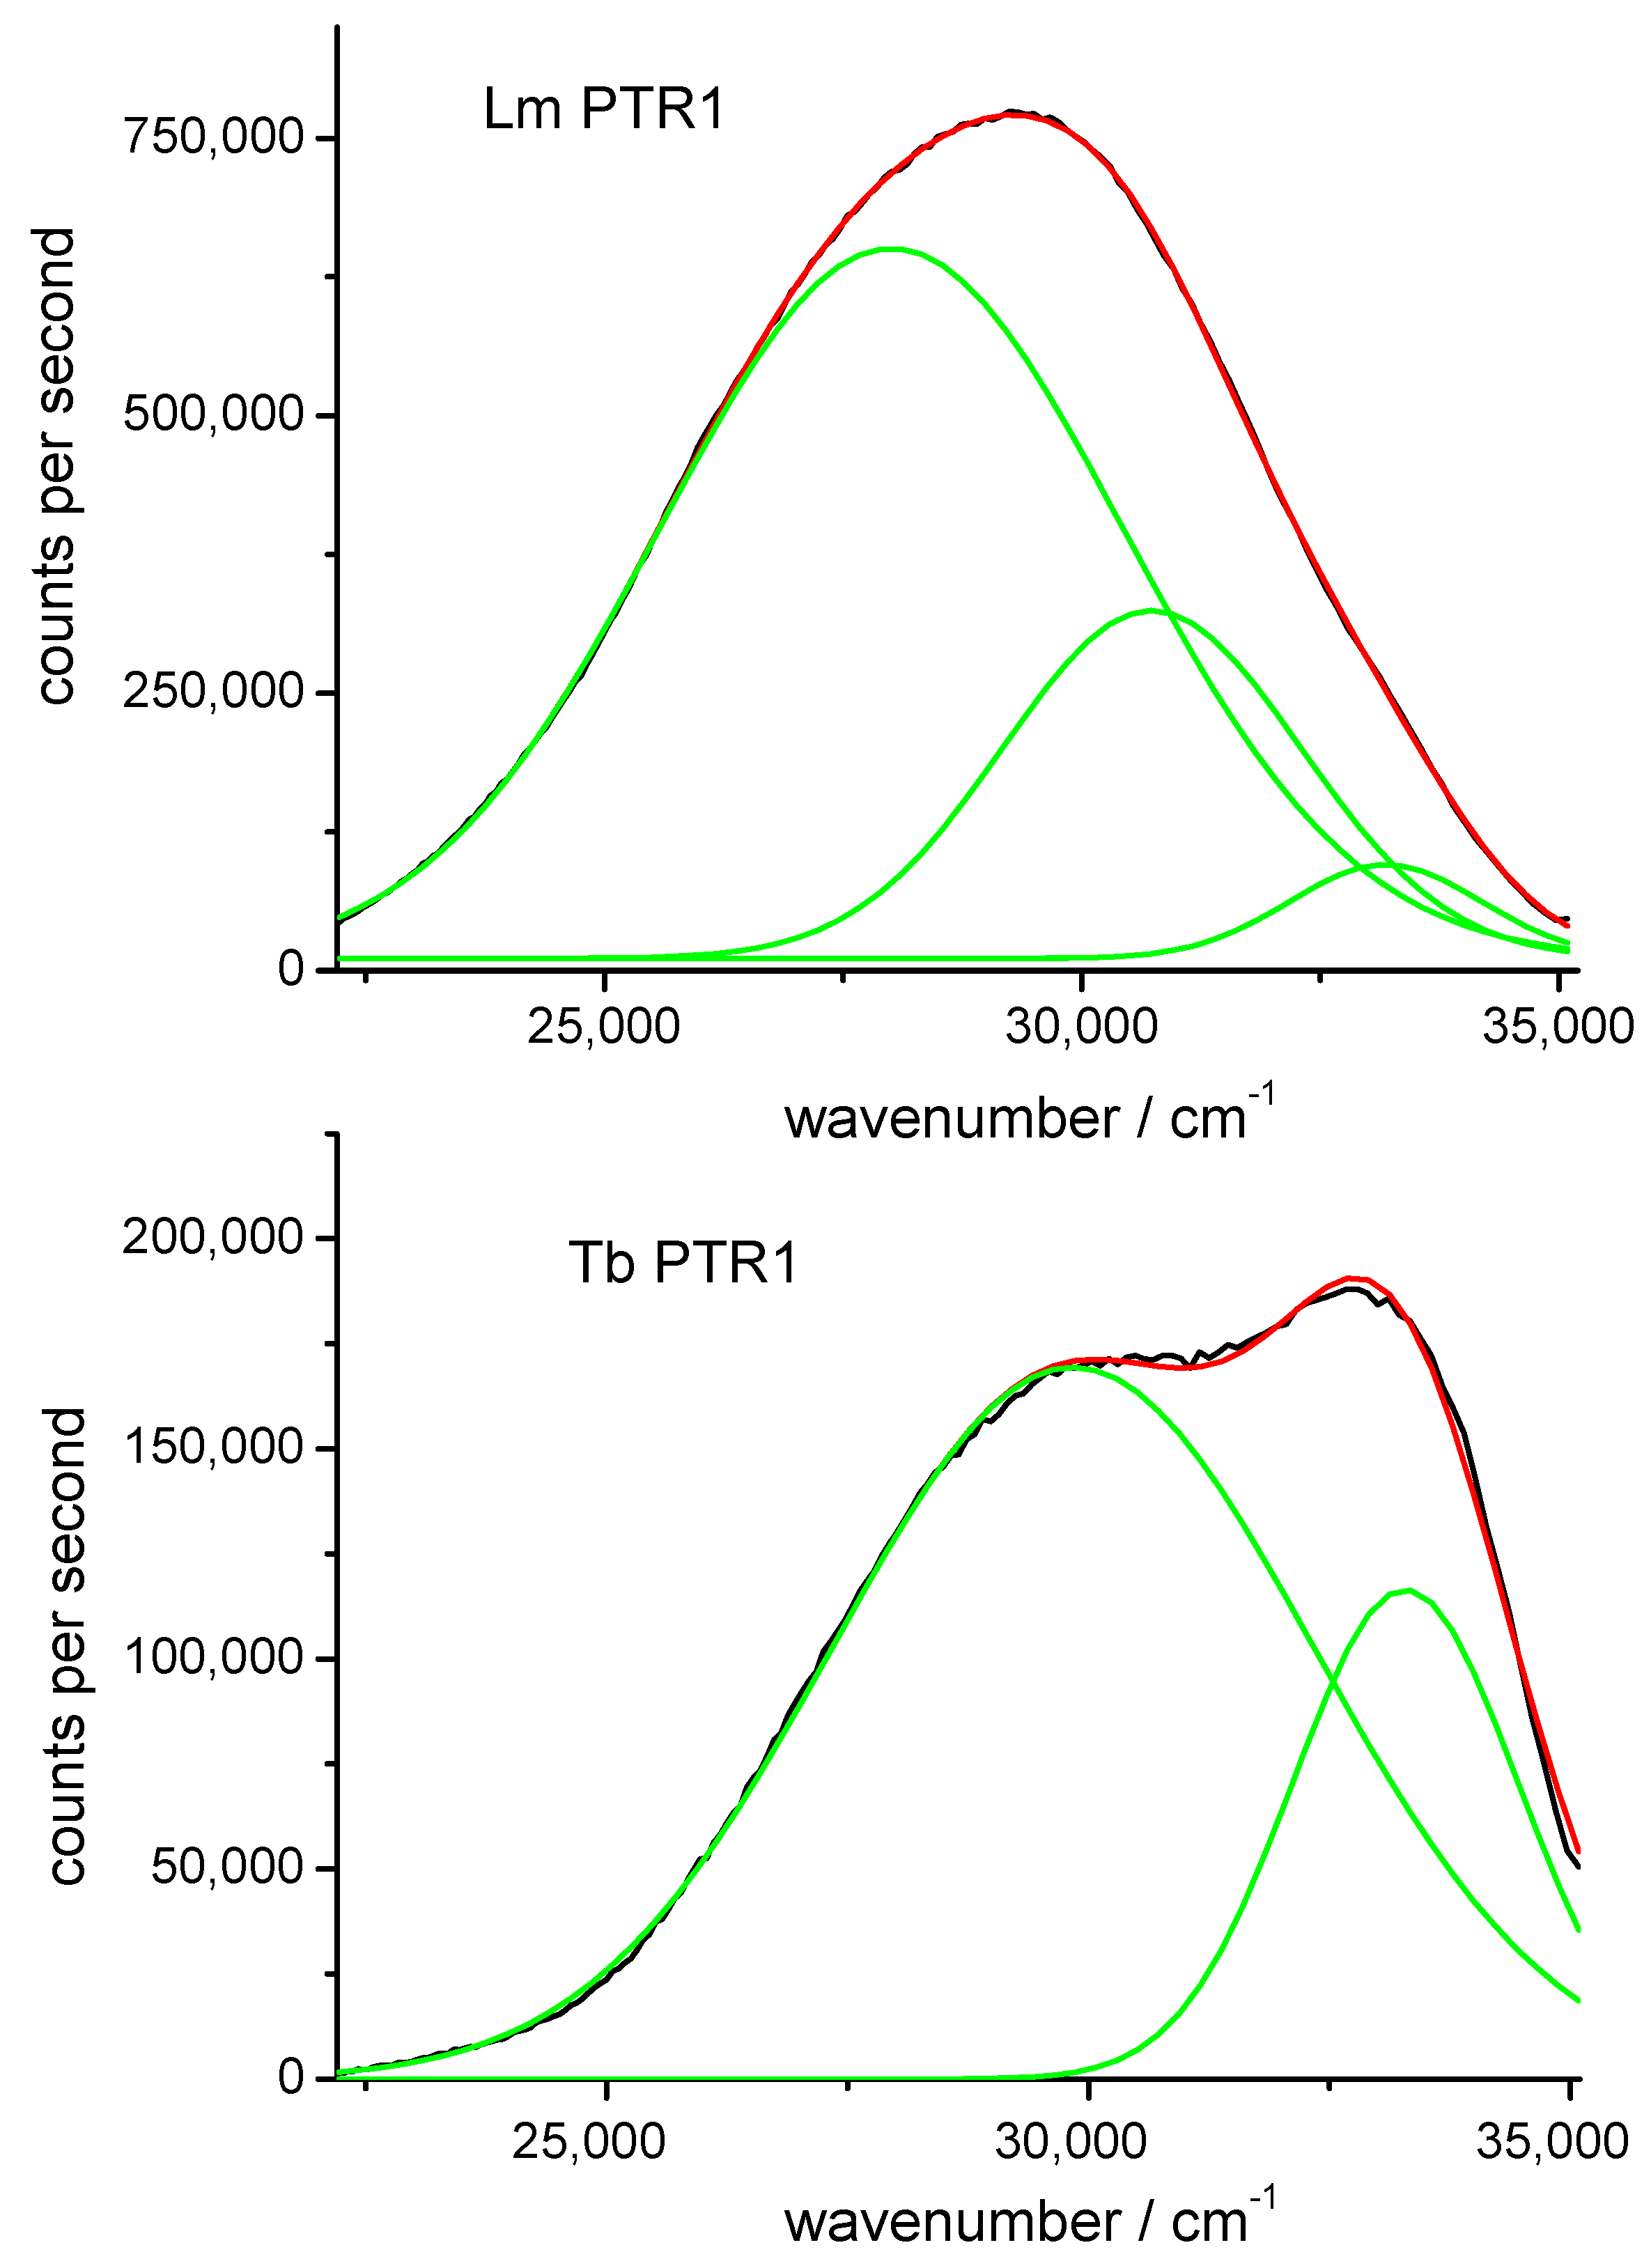
The emission spectra of Lm PTR1 and, for the sake of comparison, Tb PTR1, a variant with only one tryptophan per monomer, Trp221, are shown in Figure 2 together with their decompositions in Gaussian bands. While attempts to fit the emission spectra with two Gaussian bands proved unsatisfactory in the high-wavenumber low-wavelength region, both spectra were well decomposed as sums of three Gaussian bands, whose maxima and widths are collected in Table 1. The band with a maximum at 33,800 cm−1 (296 nm) is likely due to Rayleigh scattering of excitation light seen through the emission monochromator (6 nm bandwidths). The 33,000 cm−1 (303 nm) band can be attributed to tyrosine emission residues that are not completely quenched by the eight Trps of the protein tetramer [1]. The remaining band maxima are attributable to Trps. Based on the previously mentioned correlation between positive emission solvatochromism and exposure to water of protein indoles, Trp221 of Tb PTR1 (max = 29,700 cm−1, λmax = 337 nm) and one of Lm PTR1 Trps (max = 30,500 cm−1, λmax = 328 nm) can be rated as intermediately exposed to the solvent, while the second Lm PTR1 Trp (max = 28,000 cm−1, λmax = 357 nm) is fully exposed (this maximum coincides with that of N-acetyl-L-tryptofanylamide (NATA) in water [1]).
The single-band emission of Tb PTR1 Trp221 features inhomogeneous broadening, comparable with that of the exposed Trp residues of the Lm protein and somewhat larger than the emission from intermediately exposed Trp residues of the same protein. This suggests that the conformational disorder of Trp221 residues of Tb PTR1 and of solvent-exposed Trp residues of Lm PTR1 are larger than the disorder of the buried Trp residues of the latter protein.
3.1.2. Time-Decay Components
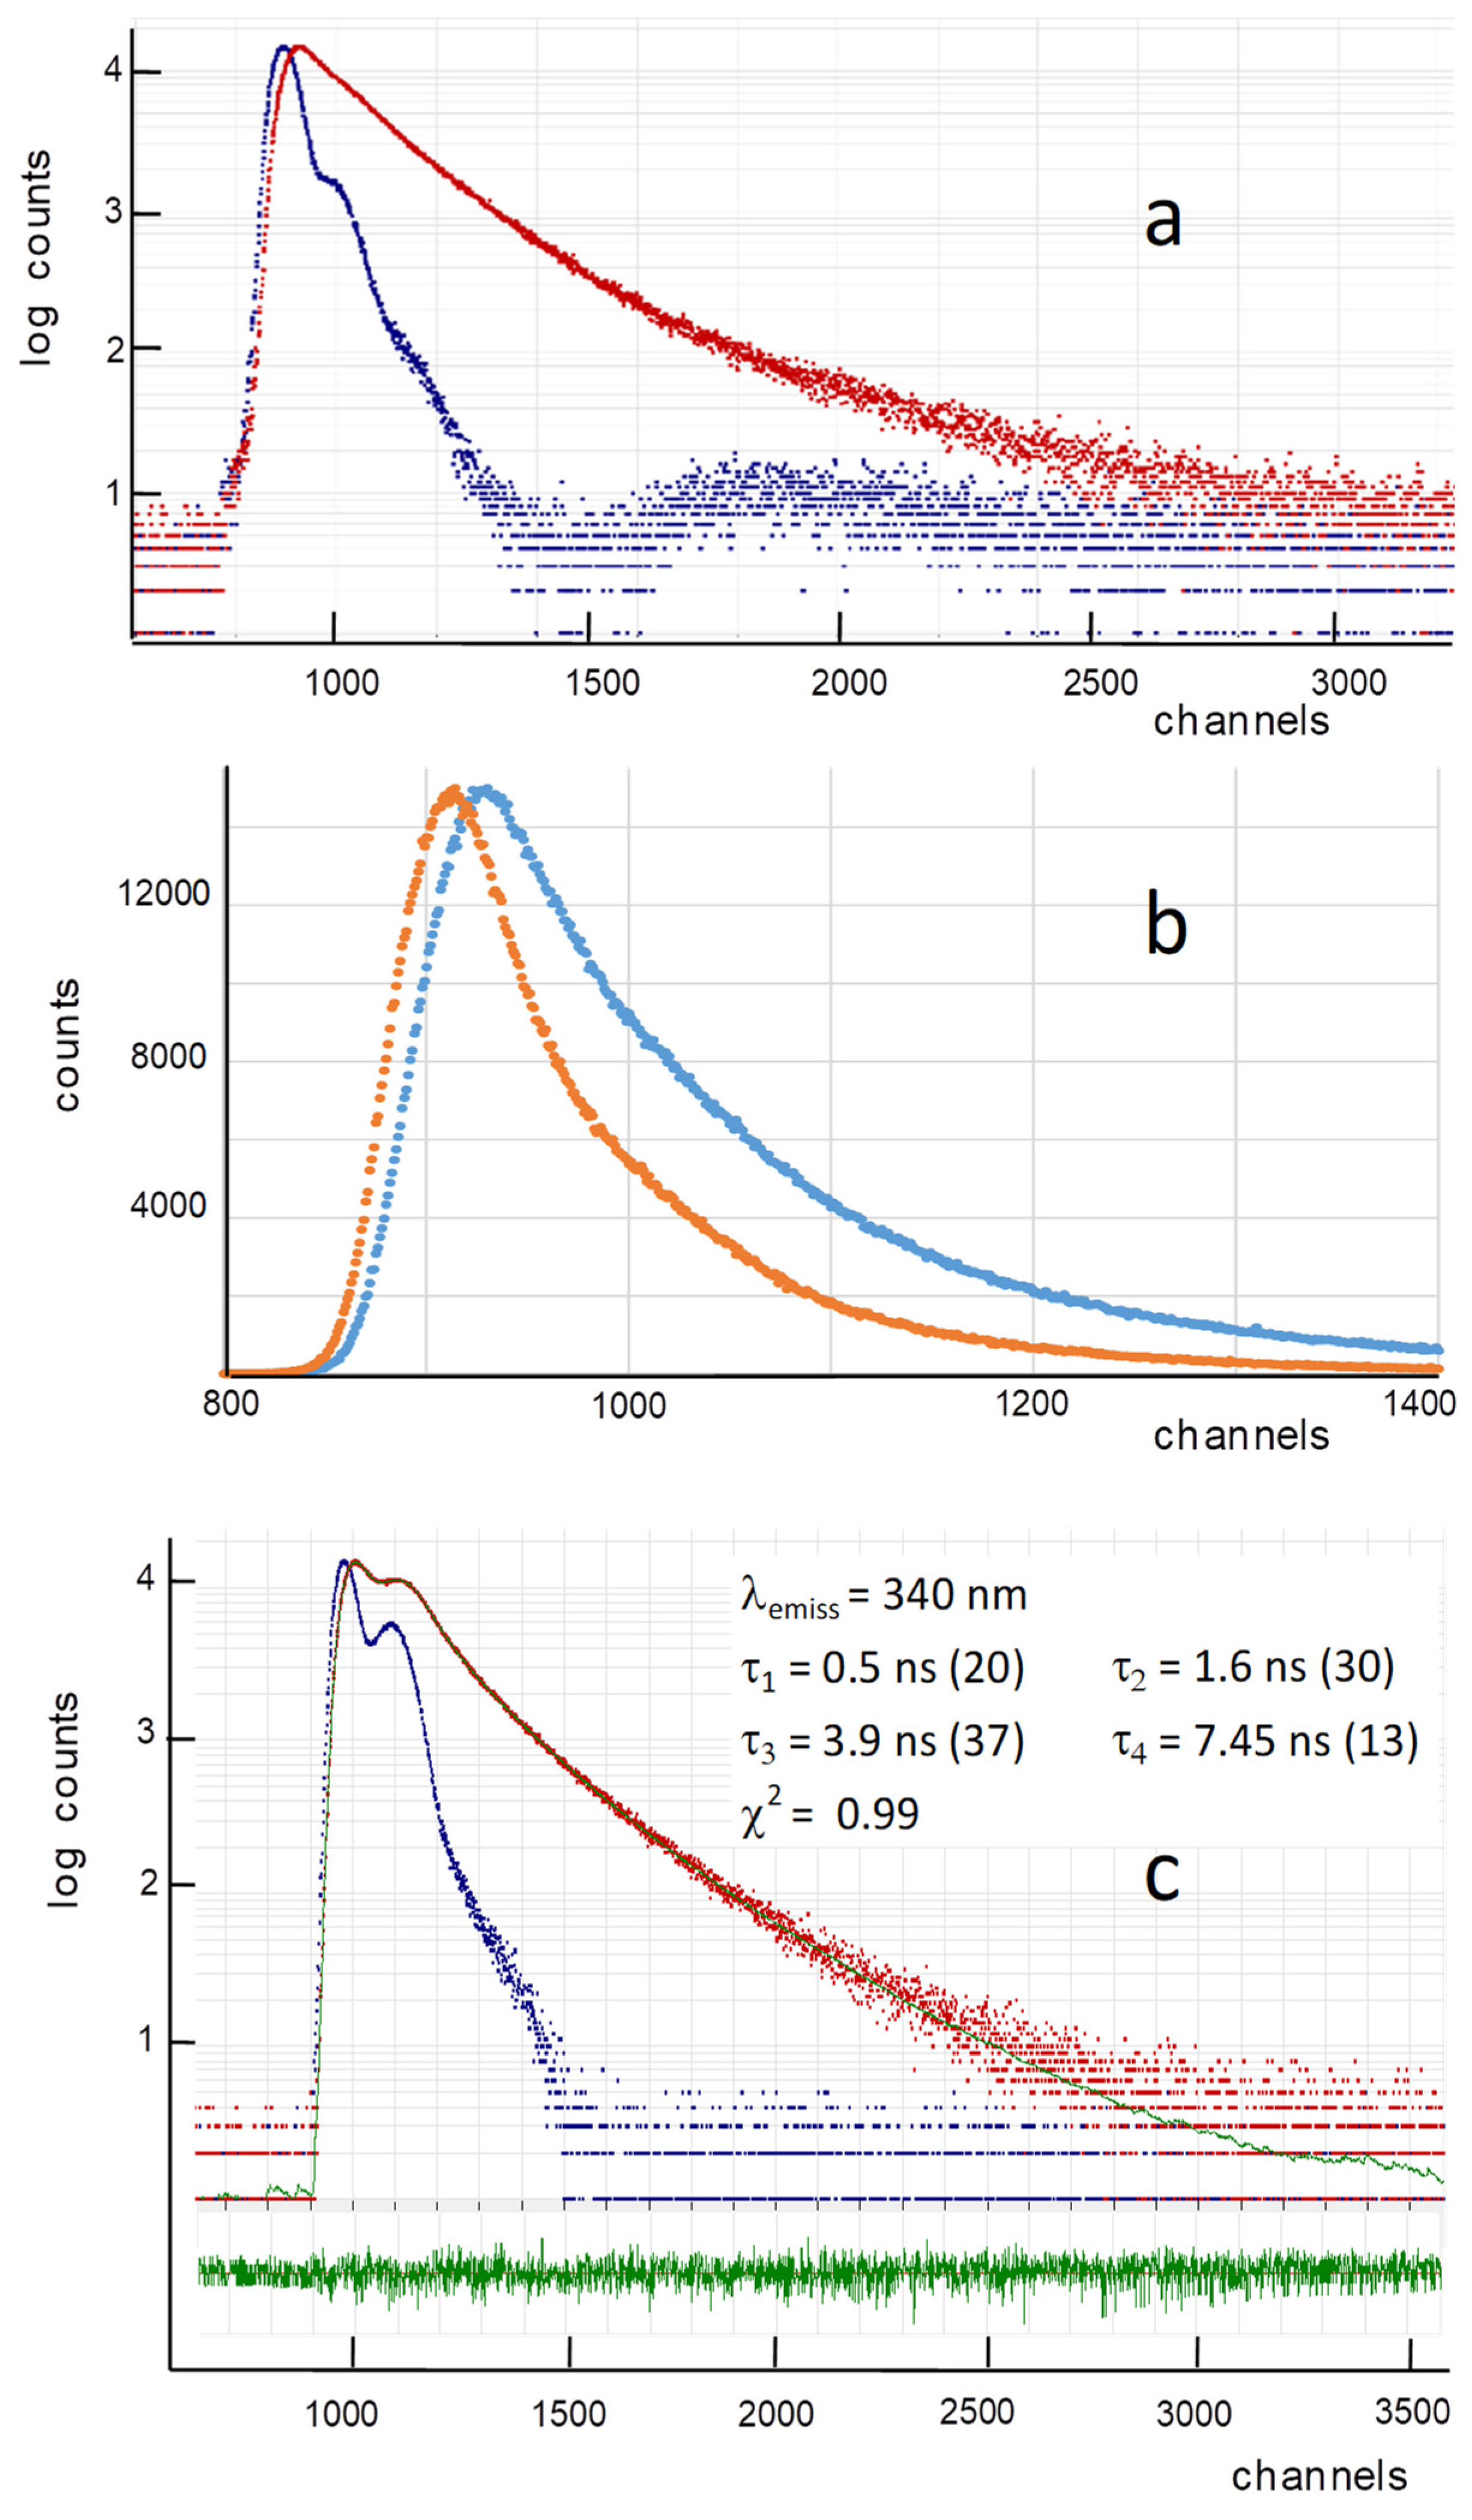
The time-resolved emission of the Lm PTR1 Trp residues (λexc = 295 nm, λemiss = 350 nm) is reported in Figure 3. In the semi-logarithmic plot employed in panel a, a single-lifetime emission would appear as a straight line. The multi-exponential character of this emission decay, , is thus apparent. The time-resolved emissions obtained from the same Lm PTR1 sample at two different emission wavelengths, 310 and 350 nm, are clearly different from each other (Figure 3b), with the Trp indoles characterized by a more bathochromic emission and, thus, more exposed to the solvent decaying more slowly with respect to the less-exposed ones.
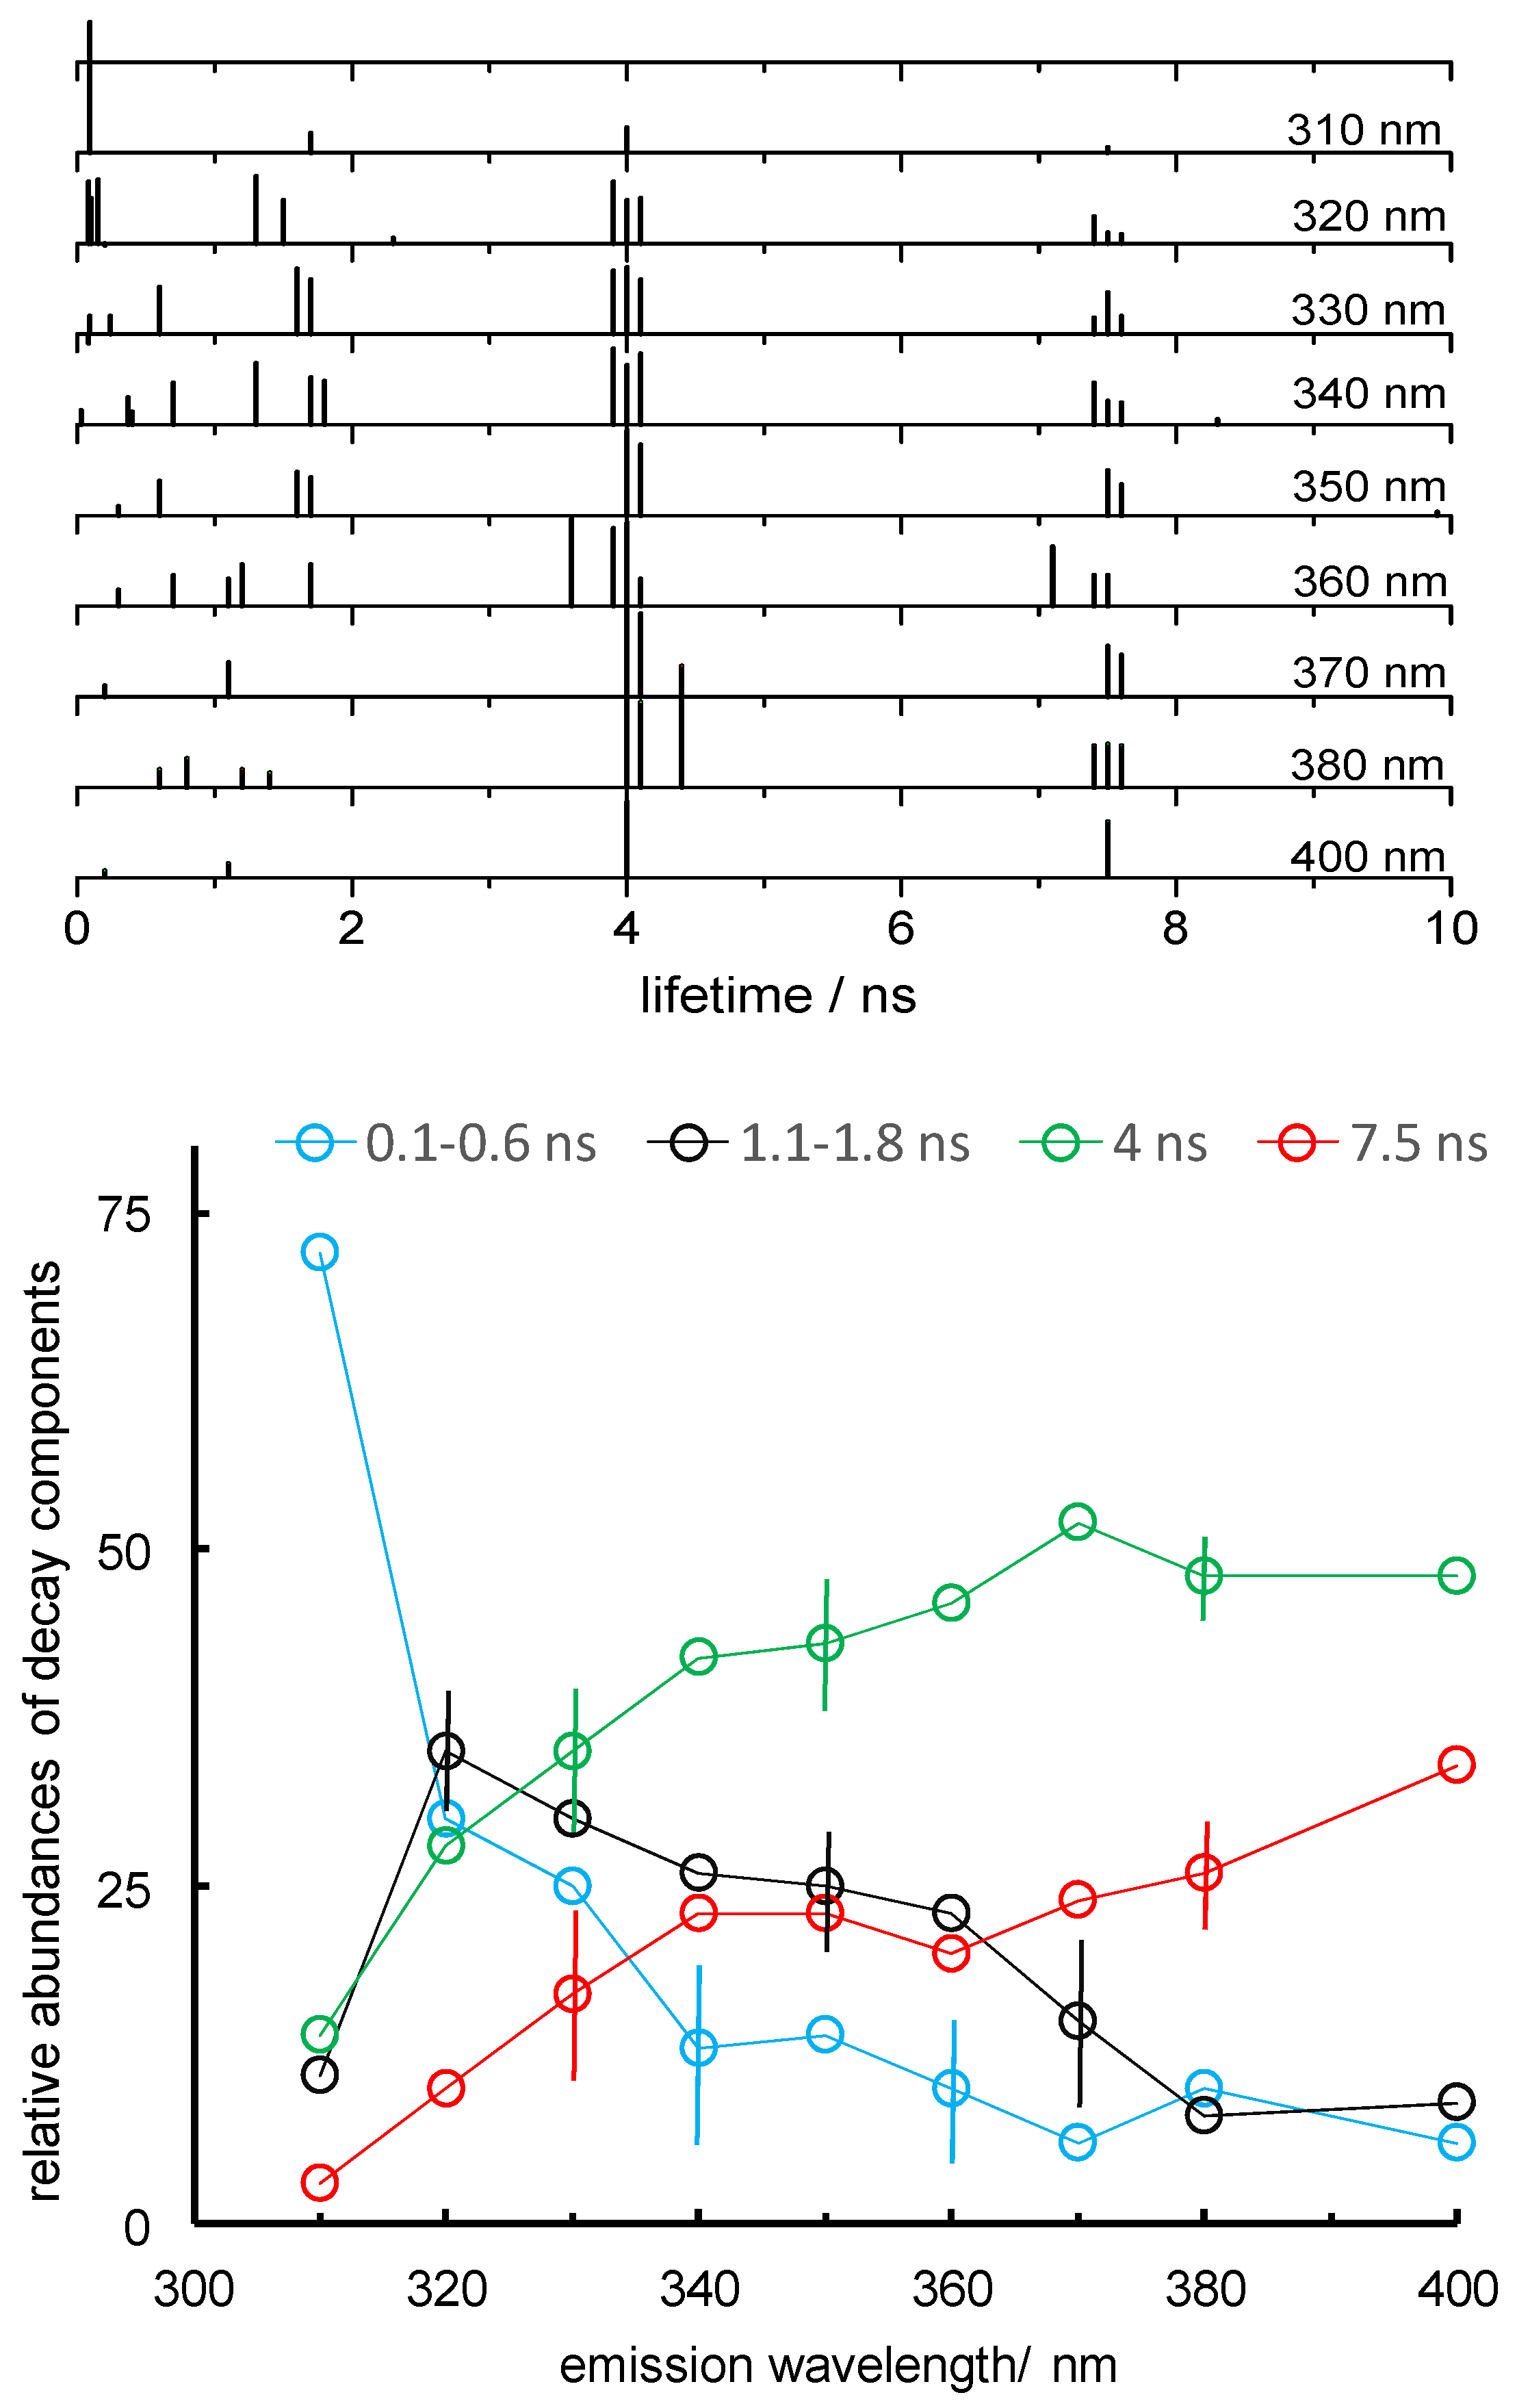
We have collected the decay lifetime profile across the emission spectrum of tryptophan, from 310 to 400 nm. Some representative examples of decay fittings, including the corresponding lifetimes, abundances and x2 values, are reported in Figure 3c and Figure S1 of the Supplementary Materials. Our four-exponential decay fitting analysis has provided the results shown in Figure 4.
Two longer-lived components (with lifetimes near 4 and 7.5 ns) were observed together with two faster decays (having lifetimes shorter than 2 ns, typically between 0.1 and 0.6 ns for the faster one, and between 1.1 and 1.8 ns for the slower). The values of the four lifetimes, averaged over all emission wavelengths, are 0.45, 1.5, 4.0 and 7.6 ns. The corresponding standard deviations are 0.16, 0.3, 0.2 and 0.5 ns, somewhat larger than the means of the standard deviations associated with the four lifetimes by the emission decay deconvolution procedure, namely, 0.05, 0.09, 0.08 and 0.10 ns. The two slower components are more abundant at longer emission wavelengths, and are thus more abundant among solvent-exposed Trps. The 1.1–1.8 ns component is observed at emission wavelengths between 320 and 360 nm and should, therefore, be more abundant in less-exposed Trps. The fastest component has a high contribution at 310 nm, the shortest emission wavelength employed, and is thus associated with quenched, buried Trps and, possibly, with Rayleigh scattered excitation light.
3.1.3. Accessibility to a Collisional Quencher
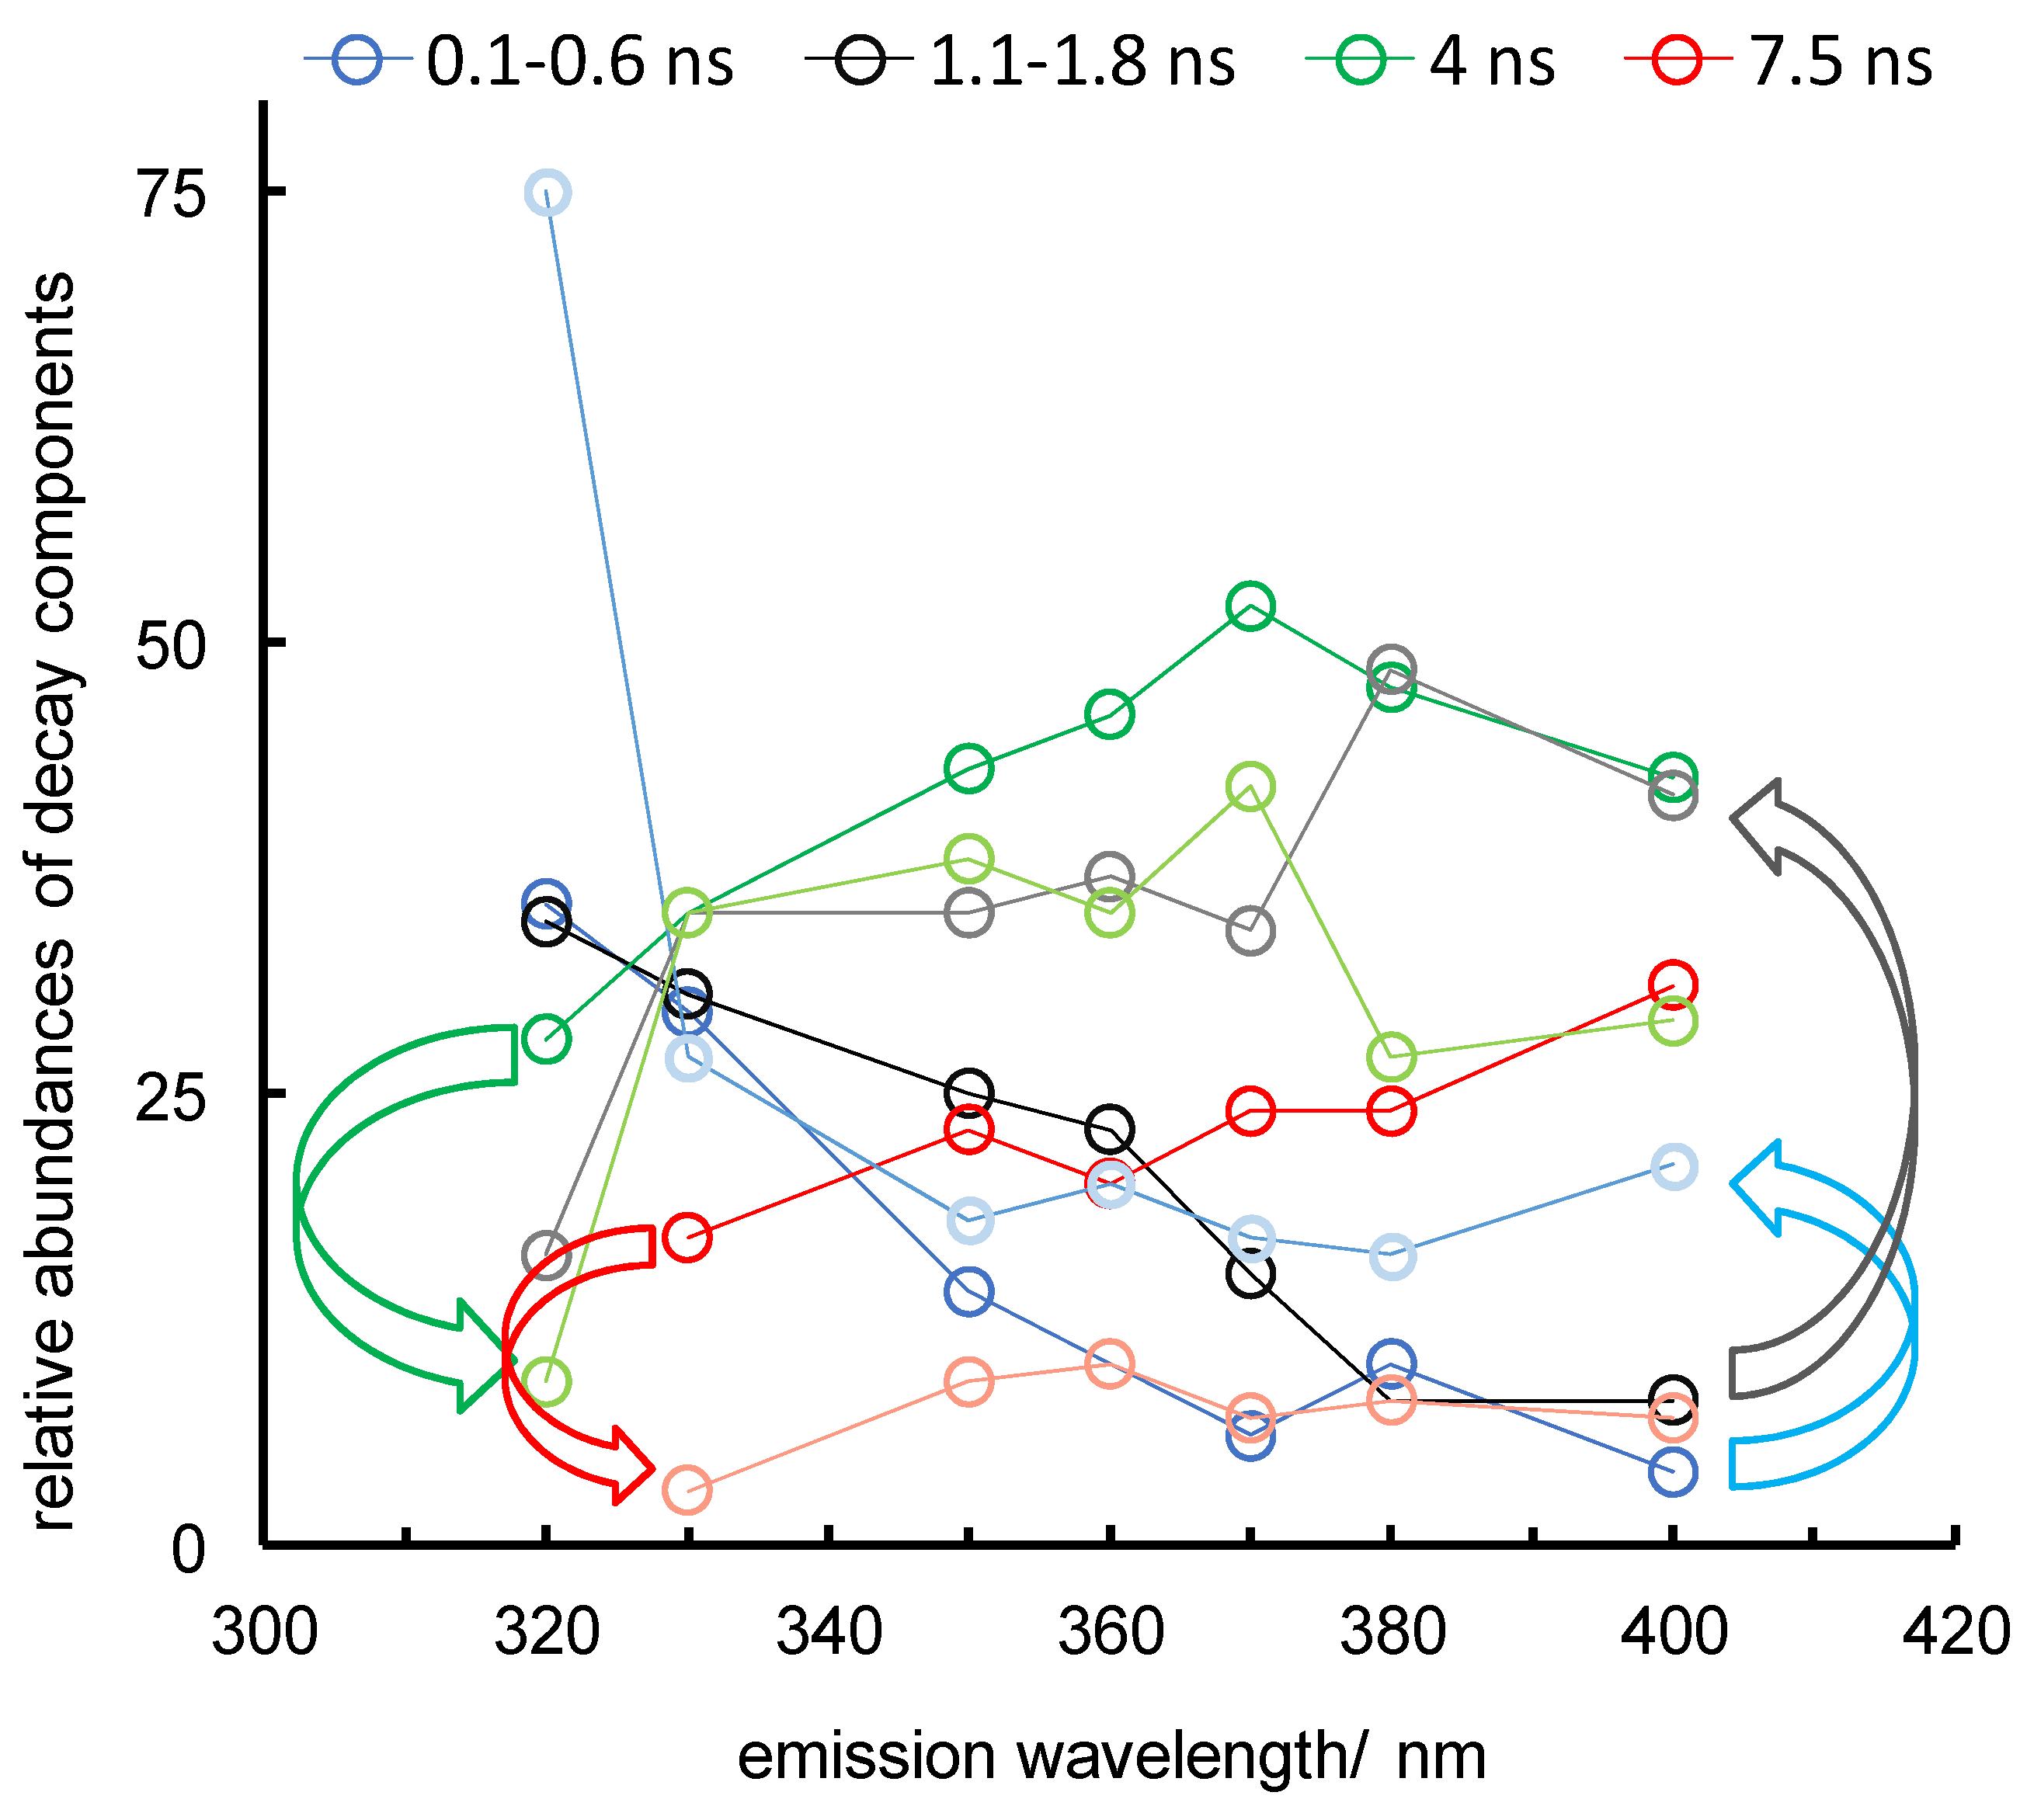
Iodide anions quench Trp emission by collisional quenching with a short-range (few Å) exchange (heavy-atom) interaction mechanism, resulting in singlet-to-triplet intersystem crossing [31]. To explore accessibility to Trp side chains of the iodide quenchers transported by the solvent, we analysed the PTR1 emission decay at different emission wavelengths in the presence of 0.1 M KI (Figure 5).
In the presence of I−, we observe a clear decrease in the relative abundances of the two longer-lived components and an increase in those of the shorter-lived ones (curved arrows on the left and right, respectively, of the bottom panel). This observation suggests a correlation between the accessibility of the Trp residues to the anionic quencher on the one hand, and the emission red-shift, hence, the degree of exposure to water, on the other.
3.2. Fluorometric Footprint of the Interaction of Lm PTR1 with the C3 Inhibitor
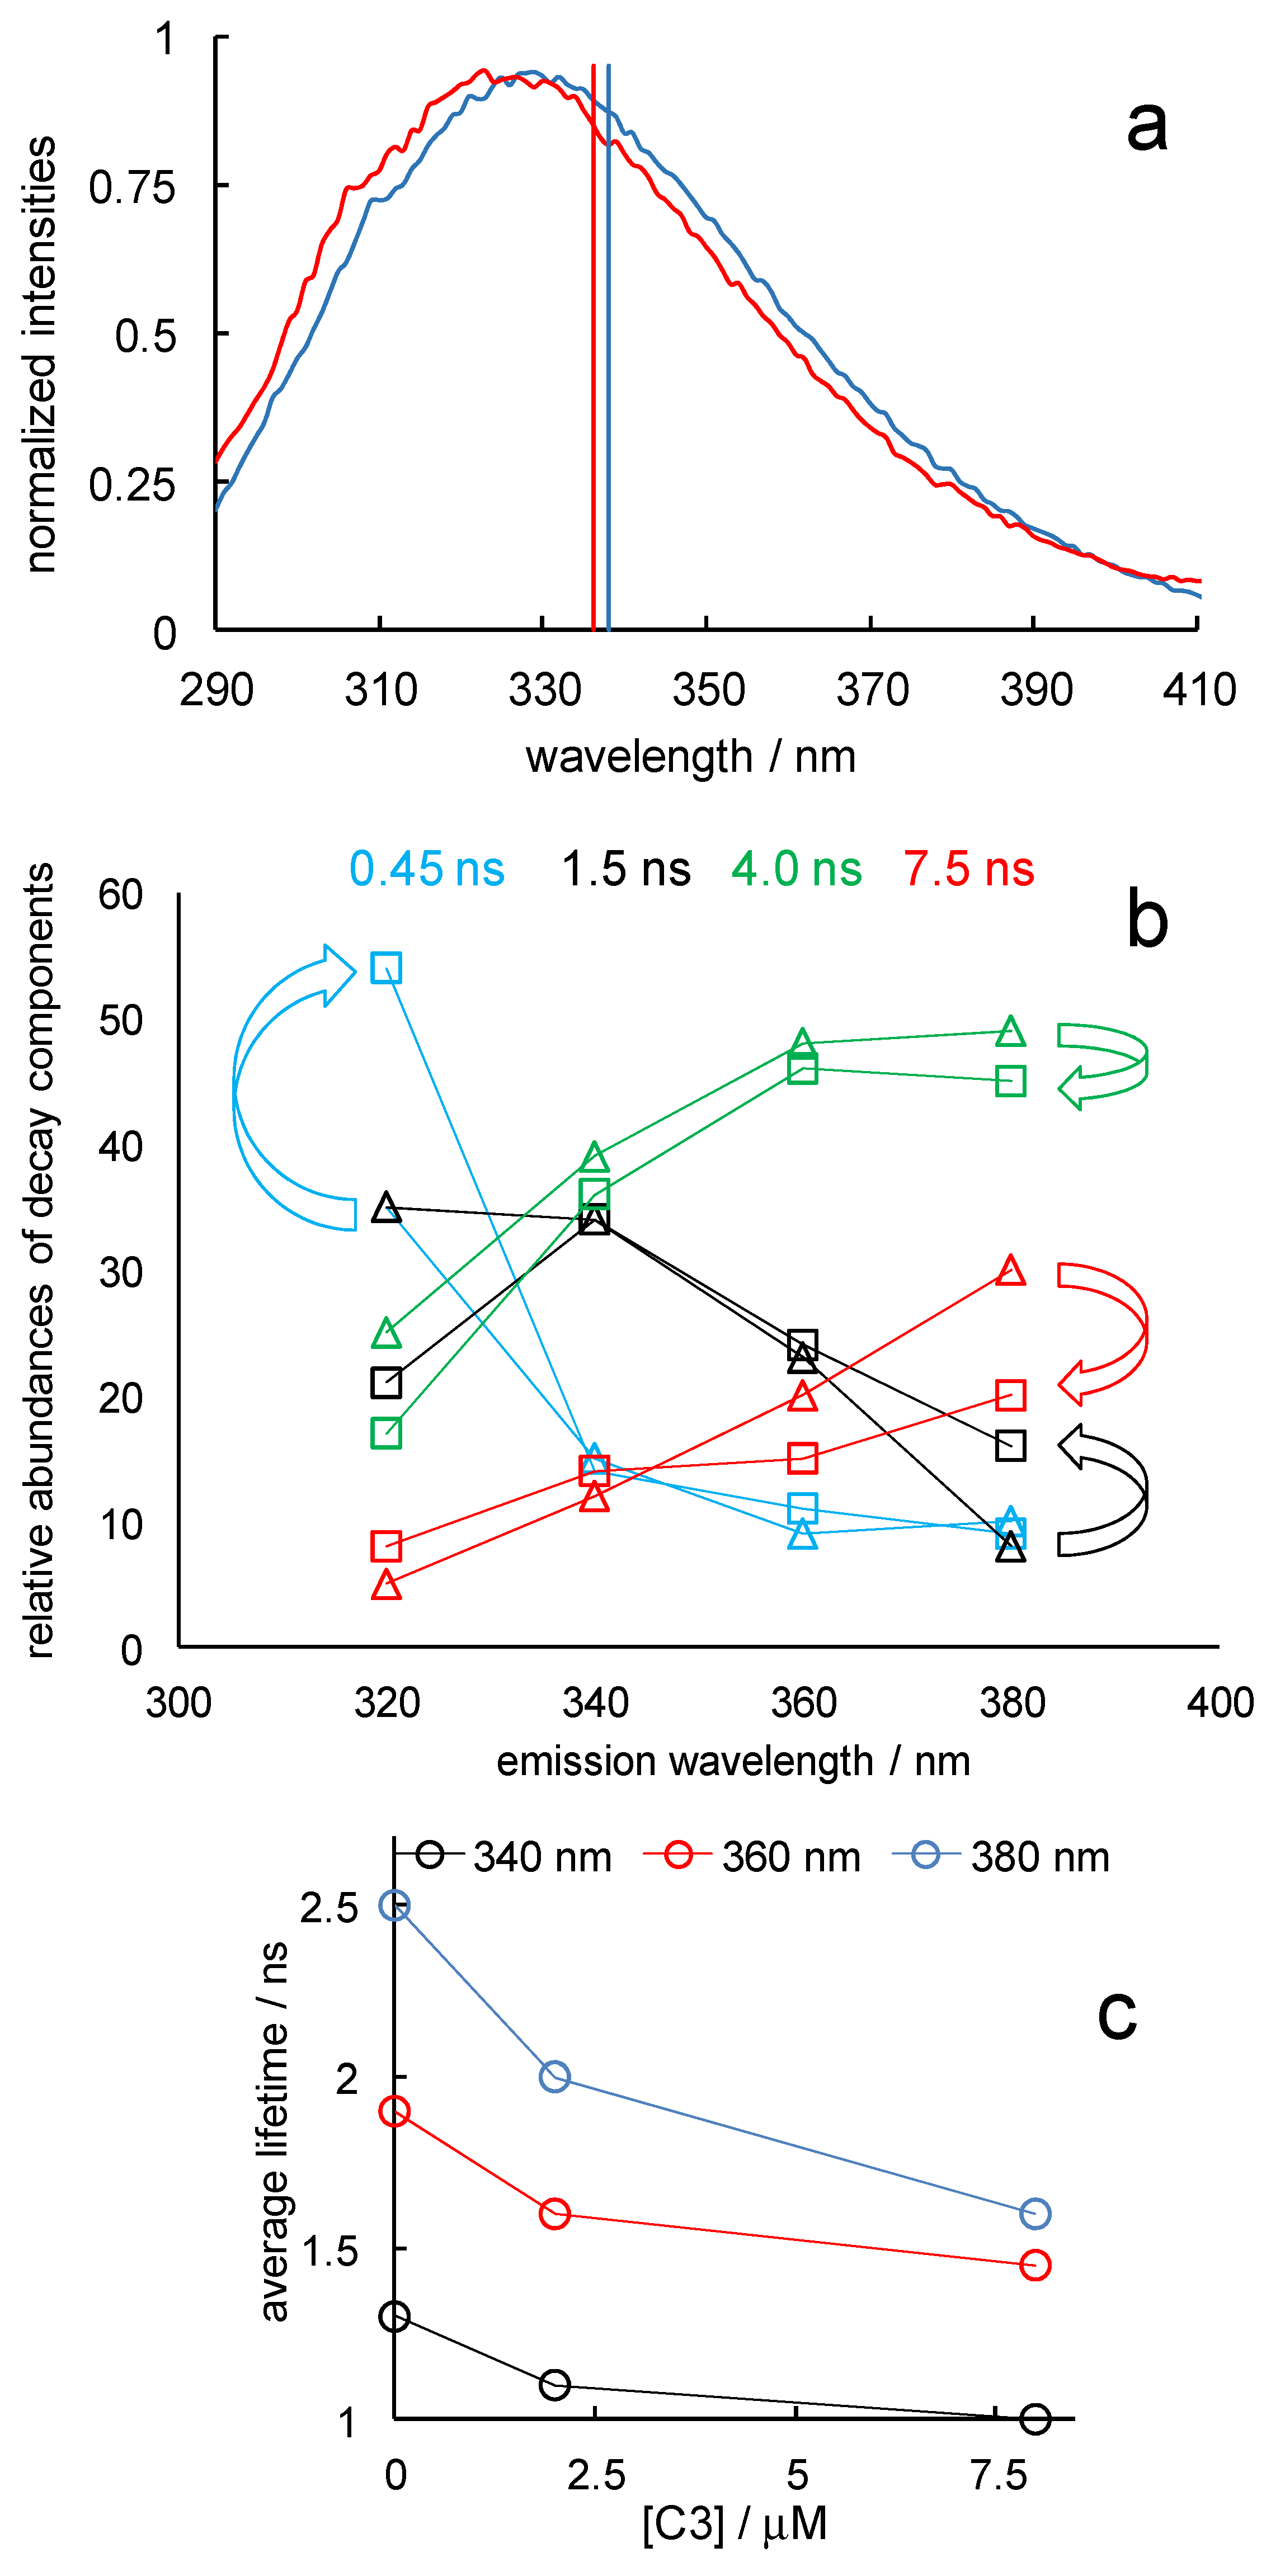
To investigate the changes in the fluorescence properties of Lm PTR1 induced by binding to C3, we added this inhibitor at concentrations 2 and 8 µM to a 1 µM solution of Lm PTR1. Because of the mentioned nanoMolar affinity of C3 for this protein [28], we expect about half and all binding sites to be occupied by the ligand at these concentrations. C3 features a typical pteridinic absorption spectrum, with an intense band below 320 nm, and a rather flat, weaker band between 335 and 375 nm that trails from 430–440 nm (see Supplementary Materials Figure S2). Therefore, it absorbs the protein excitation light at 280 and 295 nm (type I inner-filter effect) and the protein emission between 310 and 400 nm (type II inner-filter effect). The steady-state protein emission spectrum shows a small hypsochromic shift following C3 addition (the spectra measured without and with the ligand and normalized to the maximum intensity to make the shift more visible are shown, together with their centroid wavelengths, in Figure 6a).
The shape of the C3 absorption spectrum is hardly consistent with the hypsochromic shift of the PTR1 emission band resulting from reabsorption by the ligand, i.e., with a type II inner-filter effect. It might, instead, indicate a slightly preferential quenching of red-shifted and longer-lived emission components, i.e., of more solvent-exposed Trps. Consistently, we observe a decrease in the relative abundance of the longest-lived component in the decay of Lm PTR1 emission at a C3 concentration of 8 µM (Figure 6b), as well as a decrease in the amplitude-averaged lifetime, i.e., the sum of the component lifetimes each weighted by its amplitude, ai, in the I(t) expression in Section 3.1.2, divided by the sum of the amplitudes (Figure 6c). The inner-filter effects associated with protein-ligand spectral interferences [32] are expected to decrease all ai amplitudes of the decay components by the same factor; therefore, at a given emission wavelength, not only the lifetimes but also the relative amplitudes and, thus, the amplitude-averaged lifetimes will not be affected.
4. Discussion
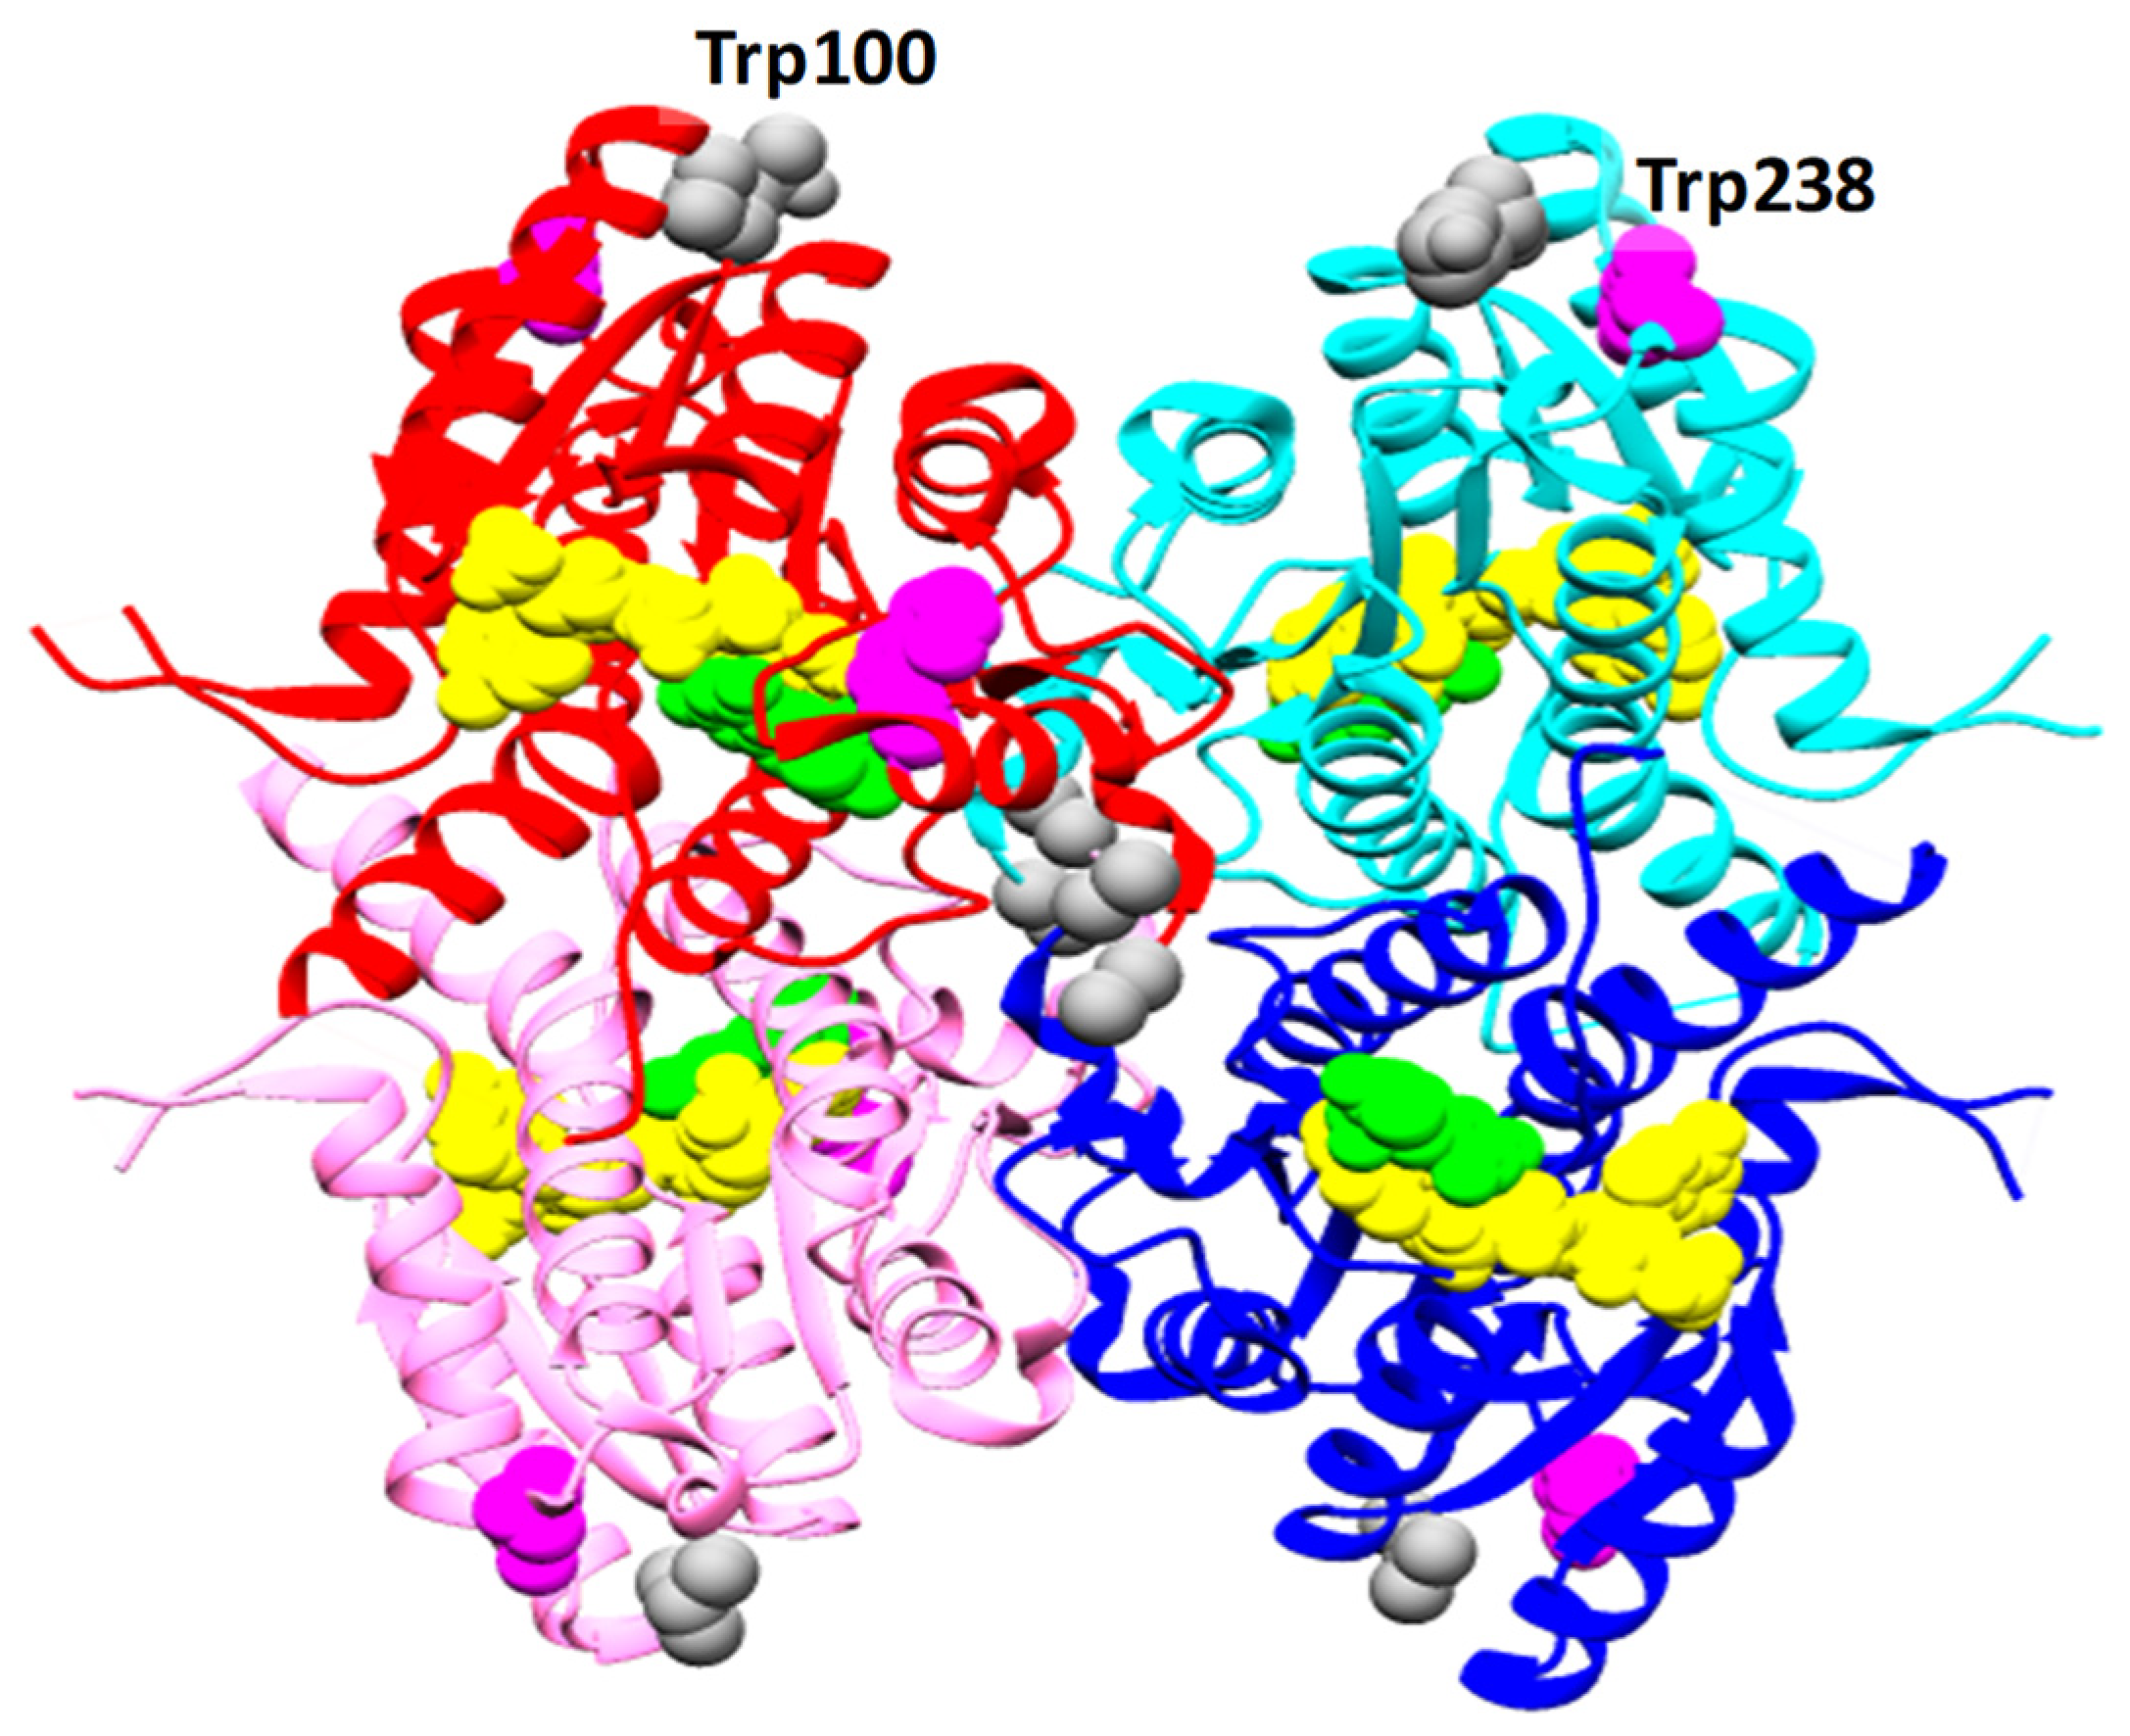
From the analysis of the available crystallographic structures, we found that the conformation of Trp100 and its nearer residues is highly conserved and little affected by substrate/ligand binding (Supplementary Materials Figure S3). On the other hand, Trp238 lies in a more disordered region (Supplementary Materials Figure S4). Indeed, in almost all the crystallographic structures available, the disorder of the 230–240 residue region, the ‘substrate-binding loop’, was too high for the positions of this Trp to be resolved in two of the four Lm PTR1 monomers, namely, monomers C and D, shown in red and pink in Figure 1. This loop, usually disordered or in an ‘open’ conformation in the unbound protein, takes an ordered, ‘closed’ conformation in the substrate/ligand bound protein.
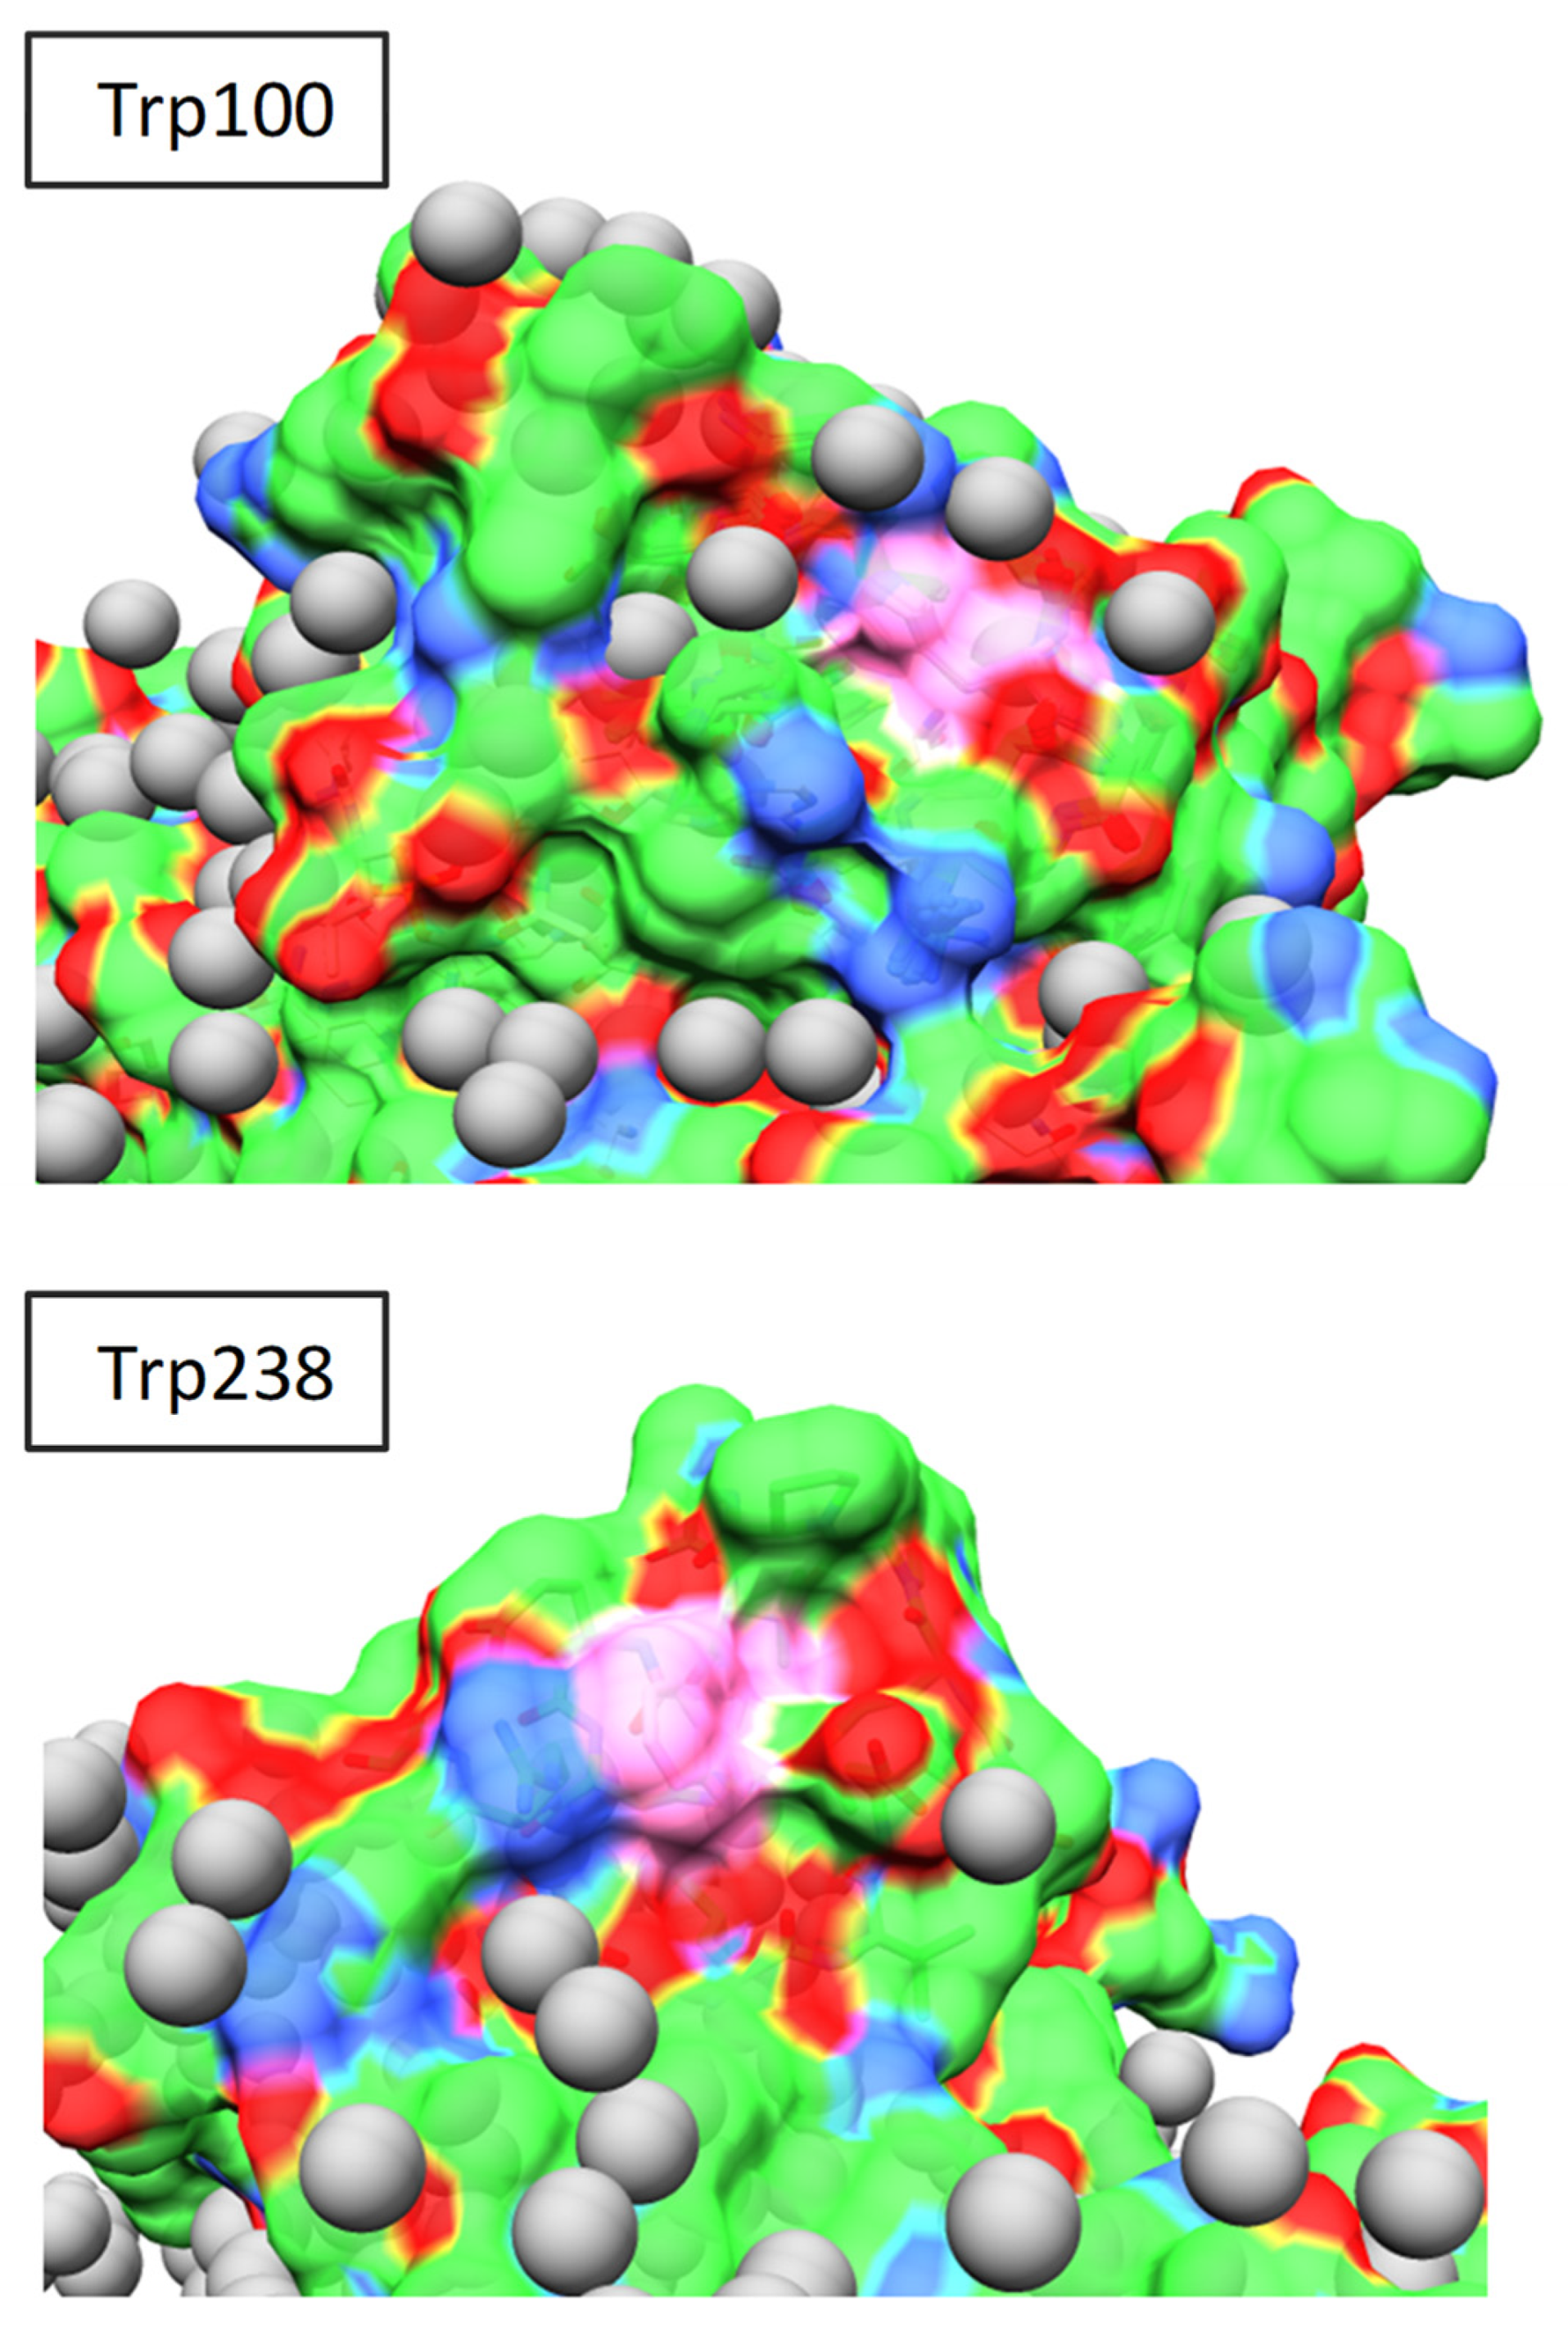
The larger conformational disorder of Trp238 suggests that the broader, red-shifted band in the protein emission spectrum (Figure 1 and Table 1, λmax = 357 nm) might be assigned mostly to this residue. However, if we try to proceed with this simple reasoning, i.e., one emission band: one protein tryptophan, and confirm the assignment of the most red-shifted emission to Trp238, thus assuming that its indole fluorophore experiences a more polar microenvironment than the Trp100 indole, analysis of the protein surface in the crystallographic structure (PDB ID: 1E92) leaves us with some doubts. In fact, both residues are quite well-exposed to the solvent (Figure 7), even though, while Trp238 exposes all of the indole C and N atoms on the external surface, Trp100 exposes only two of them (CD1 and NE1 of the pyrrole ring). Its emission is thus expected to be somewhat less bathochromically shifted by the internal Stark effect [2]. Based on the emission spectral position, we recognize two collections of Trp indoles: one, less conformationally disordered, less exposed to water and less accessible to aqueous iodide ions, with emission maxima around 328 nm; the other, more disordered, exposed to water and accessible to iodide ions, with emission maxima at 357 nm. Although Trp100 is likely more abundant in the first fluorophore collection and Trp 238 in the second, caution suggests to avoid rigidly identifying either collection with one or the other Trps in the primary sequence.
A somewhat more complex picture emerges from the emission-wavelength dependence of the fluorescence decay (see Figure 4). At the red limit of the emission band, 380–400 nm, the two longer lifetimes, 4 and 7.5 ns, contribute with comparable abundances. This suggests that, among highly solvent-exposed Trp indoles, at least two indole-quencher assemblies, corresponding to two slightly different intra-protein quenching efficiencies, are observed. The picture blurs even more if we move to shorter emission wavelengths. At 350–360 nm, which still corresponds to quite-well-exposed Trp indoles, a third, shorter (1.1–1.8 ns) emission component has an abundance similar to that of the almost unquenched 7.5 ns component. Finally, at 330–340 nm emission wavelengths, the three shorter components have significant abundances.
So, on one hand, a correlation between solvent exposure, emission red-shift, accessibility to collisional quenchers and low efficiency of static intramolecular quenching, hence long lifetimes, stems from the results. However, on the other hand, the four lifetimes used to fit the emission decays define four collections of Trp indoles with differing intramolecular quenching efficiencies. Further, each of these collections is part, though with variable abundances, of the two Trp indole collections defined by spectral shift/solvent exposure/iodide-ion quenchability.
This heterogeneity among protein-intrinsic fluorometric indicators was already made evident with single-tryptophan proteins by the often complex, i.e., multi-exponential, emission decays and by the lack of correlation observed between emission maximum and average lifetime [1]. While puzzling until about thirty years ago, these observations have now found an explanation that, though rooted in protein structural complexity, is fully convincing. In short, the conformational features that determine the steady-state spectral properties and the associated diagonal disorder, related with the polarity of the indole microenvironment, are different from and uncorrelated with the conformational features that determine the lifetime of a homogeneous collection of emitting Trp indoles, i.e., proximity to intramolecular quenchers, such as peptide groups or carboxylate ions, acting as electron-transfer quenchers, or ammonium groups, acting as proton-transfer quenchers [1,2,3,4,5].
The two Trp residues of each monomer of Lm PTR1 lie close to the catalytic site of the unit, and Trp238 is also quite close to the catalytic site of the nearby monomer (Figure 1). Thus, we can expect a twofold effect on the intrinsic fluorescence decay of the protein from its binding ligands at the catalytic pockets. Modulation of some of the fluorescence properties of Trps might result both from direct quenching of Trp emission, if the ligand has suitable quencher properties, and/or from structural changes induced in the protein. Compound C3 features a pteridinic absorption band between 320 and 400 nm (Supplementary Materials Figure S2), i.e., in the spectral region of the Trp fluorescence emission. Therefore, it might fulfil the energetic condition for resonance energy transfer from Trps [32]. In fact, from the emission spectrum of Lm PTR1 and the absorption spectrum of C3 we compute a Förster spectral overlap integral, = 1.0 × 10¹⁴ [33]. From this, using an average quantum yield for PTR1 Trps, Φ0 = 0.05, the isotropic distribution value for the orientation factor, = 2/3, and n = 1.4 for the refractive index of water, we estimate a critical distance for the PTR1 Trps–C3 donor-acceptor pair, = 20 Å. From the crystal structure of the Lm PTR-C3 complex (PDB ID: 5L42), the distance, R, between the indole ring of Trp238 and the pteridine ring of C3 lies in the 15–20 Å range (conformational disorder broadens this range). From these distance values, we estimate an efficiency for Lm PTR1-C3 excitation energy transfer, [32], from 0.5 to 0.8. Trp100 lies a little farther from the pteridine ring of the closer C3 molecule, 29–30 Å, but the corresponding estimated energy-transfer efficiency is still 0.4. In contrast with these high expected quenching efficiencies, we only found a decrease between 20 and 30% in the average lifetime (Figure 6c), a change that our four-lifetime description mainly attributes to partial quenching of the longest-lived, most red-shifted component. This suggests that the orientation factor, related with the cosine of the angle between the transition dipoles of the donor and acceptor, be somewhat unfavourable in this case. Indeed, in spite of the mentioned conformational variability around Trp238, the X-ray structure of the complex shows that, on average, the planes of the two chromophores most likely involved in quenching by excitation energy transfer, the Trp238 indole and the C3 pteridinic group, are nearly perpendicular to each other. As a consequence, the orientation factor and the efficiency of excitation energy transfer from this Trp are expected to be low, consistent with the modest change observed in the lifetime profile of Lm PTR1.
5. Conclusions
Steady-state and time-resolved emission experiments have allowed us to sketch a fluorometric profile of Lm PTR1, a protein whose inhibition combines with that of DHFR in a promising strategy to design more efficient anti-protozoa drugs. The steady-state results may be interpreted in terms of two collections of Trp indoles. Of these, one is more exposed to the solvent (emission maxima at 357 vs. 328 nm) and, showing a larger inhomogenous band broadening, more conformationally disordered; it is also somewhat longer-lived (larger abundances of 4 and 7.5 ns components are found at longer emission wavelengths) than the other collection of tryptophan indoles and more quenched by the iodide ion. On the other hand, the emission lifetime profile hardly adapts to this picture, with at least four collections of Trp indoles that are essentially unquenched (7.5 ns), little quenched (4 ns), rather well-quenched (1.1–1.8 ns) and almost fully quenched (0.1–0.8 ns) by intramolecular quenchers. Neither of these two intersecting collections of Trp indoles can fully correspond to only one of the two Trps, 100 and 238, present in each protein monomer, even though crystallographic data suggest that the latter is more represented in the collection characterized by a more red-shifted emission, the former in the other collection. This heterogeneity of the fluorometric profile is rooted in protein conformational plasticity and in the differences in physicochemical nature, and in the corresponding structural requirements of the processes that originate the steady-state and time-resolved observables used to build such fluorophore collections, i.e., dipolar interactions leading to fluorosolvatochromism, on the one hand, and excitation energy, electron and proton transfers, leading to fluorescence quenching, on the other hand [1,2,3,4,5].
Use of this combination of intrinsic reporters to sketch a fluorometric portrait of Lm PTR1, a protein of interest for public health, and investigate its interaction with a high-affinity ligand, has advantages over approaches that are based on steady-state data only. Contrary to descriptors based on spectra, emission decay descriptors do not suffer from spectral interference, i.e., inner-filter effects, by the ligand. Additionally, the variety of toolsets employed has allowed us to shed light on some otherwise hardly accessible structural complexities. Each one of two sets of intrinsically different observables, emission spectra and time decays, which are based on little-correlated physicochemical processes, allowed us to identify different collections of side-chain indoles of this protein. Thus, we expect to be able to monitor changes in the protein structure induced by chemical or biological stimuli that impact any of the mentioned physicochemical processes.
In order to test this toolset, we investigated the effects of binding of the nanoMolar inhibitor, C3, on the protein fluorometric profile and found it little-affected, with only a slight hypsochromic emission shift and a moderate decrease in the amplitude-averaged lifetime. This finding highlights the relevance, in relatively constrained conformations, of unfavourable relative orientations of the donor and acceptor transition dipoles in limiting excitation energy transfer efficiencies.
Supplementary Materials
The following supporting information can be downloaded at: https://www.mdpi.com/article/10.3390/physchem2020010/s1, Figure S1: Examples of Lm PTR1 fluorescence decay fittings; Figure S2: Absorption spectrum of compound C3; Figure S3: Conformational variability of Trp 100; Figure S4: Conformational variability of Trp 238.
Author Contributions
Conceptualization, G.P. and M.P.C.; methodology, S.F. and G.P.; investigation and formal analysis, G.P. and S.F.; writing—original draft preparation, G.P.; writing—review and editing, S.F. and M.P.C.; funding acquisition, M.P.C. All authors have read and agreed to the published version of the manuscript.
Funding
This project received funding from the European Union’s Seventh Framework Programme for research, technological development and demonstration under grant agreement no. 603240 (NMTrypI—New Medicines for Trypanosomatidic Infections). https://fp7-nmtrypi.eu (accessed on 1 May 2022).
Institutional Review Board Statement
Not applicable.
Informed Consent Statement
Not applicable.
Data Availability Statement
Not applicable.
Acknowledgments
Rosaria Luciani is thanked for the purification of Lm and Tb PTR1.
Conflicts of Interest
The authors declare no conflict of interest. The funders had no role in the design of the study; in the collection, analyses, or interpretation of data; in the writing of the manuscript; or in the decision to publish the results.
References
- Lakowicz, J.R. Principles of Fluorescence Spectroscopy, 3rd ed.; Springer: New York, NY, USA, 2006; Chapters 16 and 17. [Google Scholar]
- Vivian, J.T.; Callis, P.R. Mechanisms of tryptophan fluorescence shifts in proteins. Biophys. J. 2001, 80, 2093–2109. [Google Scholar] [CrossRef] [Green Version]
- Chen, Y.; Barkley, M.D. Toward understanding tryptophan fluorescence in proteins. Biochemistry 1998, 37, 9976–9982. [Google Scholar] [CrossRef] [PubMed]
- Engelborghs, Y. The analysis of time resolved protein fluorescence in multi-tryptophan proteins. Spectrochim. Acta A 2001, 57, 2255–2270. [Google Scholar] [CrossRef]
- Callis, P.R.; Liu, T. Quantitative prediction of fluorescence quantum yields for tryptophan in proteins. J. Phys. Chem. B 2004, 108, 4248–4259. [Google Scholar] [CrossRef]
- Eftink, M.R. Intrinsic Fluorescence of Proteins. In Topics in Fluorescence Spectroscopy, Volume 6: Protein Fluorescence; Lakowicz, J.R., Ed.; Kluwer Academic/Plenum Publishers: New York, NY, USA, 2000. [Google Scholar] [CrossRef]
- Engelborghs, Y. Correlating protein structure and protein fluorescence. J. Fluoresc. 2003, 13, 9–16. [Google Scholar] [CrossRef]
- Vitiello, S.; Caselli, M.; Pavesi, G.; Santucci, M.; Ferrari, S.; Costi, M.P.; Ponterini, G. Intrinsic fluorescence of the active and the inactive functional forms of human thymidylate synthase. Chem. Bio. Chem. 2021, 22, 1800–1810. [Google Scholar] [CrossRef]
- Chatterjee, S.; Brahma, R.; Raghuraman, H. Gating-related structural dynamics of the MgtE magnesium channel in membrane-mimetics utilizing site-directed tryptophan fluorescence. J. Mol. Biol. 2021, 433, 66691–66712. [Google Scholar] [CrossRef]
- Asamoto, A.K.; Kozachenko, I.A.; López-Peña, I.; Kim, J.E. Bimolecular quenching of tryptophan fluorescence in a membrane protein: Evolution of local solvation and environment during folding into a bilayer. Spectrochim. Acta A 2021, 260, 119919–119932. [Google Scholar] [CrossRef]
- Pal, S.; Bose, D.; Chakrabarti, A.; Chattopadhyay, A. Comparative analysis of tryptophan dynamics in spectrin and its constituent domains: Insights from fluorescence. J. Phys. Chem. B 2022, 126, 1045–1053. [Google Scholar] [CrossRef]
- Van de Weert, M. Fluorescence quenching to study protein-ligand binding: Common errors. J. Fluoresc. 2010, 20, 625–629. [Google Scholar] [CrossRef] [PubMed]
- Eftink, M.R. Fluorescence methods for studying equilibrium macromolecule-ligand interactions. Meth. Enzymol. 1997, 278, 221–257. [Google Scholar] [CrossRef]
- Bakar, K.A.; Feroz, S.R. A critical view on the analysis of fluorescence quenching data for determining ligand–protein binding affinity. Spectrochim. Acta A 2019, 223, 117337–117341. [Google Scholar] [CrossRef]
- Crouse, H.F.; Potoma, J.; Nejrabi, F.; Snyder, D.L.; Chohan, B.S.; Basu, S. Quenching of tryptophan fluorescence in various proteins by a series of small nickel complexes. Dalton Trans. 2012, 41, 2720–2731. [Google Scholar] [CrossRef] [Green Version]
- Di Rocco, G.; Bernini, F.; Borsari, M.; Martinelli, I.; Bortolotti, C.A.; Battistuzzi, G.; Ranieri, A.; Caselli, M.; Sola, M.; Ponterini, G. Excitation-energy transfer paths from tryptophans to coordinated copper ions in engineered azurins: A source of observables for monitoring protein structural changes. Z. Physik.Chem. 2016, 230, 1329–1349. [Google Scholar] [CrossRef] [Green Version]
- Bhuiya, S.; Chowdhury, S.; Das, S. Molecular insight into the binding aspects of benzo[c]phenanthridine alkaloid nitidine with bovine hemoglobin: A biophysical exploration. Spectrochim. Acta A 2019, 223, 117293–117300. [Google Scholar] [CrossRef]
- Paul, S.; Ghanti, R.; Sardar, P.S.; Majhi, A. Synthesis of a novel coumarin derivative and its binding interaction with serum albumins. Chem. Heterocycl. Compd. 2019, 55, 607–611. [Google Scholar] [CrossRef]
- Sindrewicz, P.; Li, X.; Yates, E.A.; Turnbull, J.E.; Lian, L.-Y.; Yu, L.-G. Intrinsic tryptophan fluorescence spectroscopy reliably determines galectin-ligand interactions. Sci. Rep. 2019, 9, 11851–11862. [Google Scholar] [CrossRef] [Green Version]
- Wang, Z.-J.; Soohoo, S.M.; Tiwari, P.B.; Piszczek, G.; Brelidze, T.I. Chlorpromazine binding to the PAS domains uncovers the effect of ligand modulation on EAG channel activity. J. Biol. Chem. 2020, 295, 4114–4123. [Google Scholar] [CrossRef]
- Duysak, T.; Afzal, A.R.; Jung, C.-H. Determination of glutathione-binding to proteins by fluorescence spectroscopy. Biochem. Biophys. Res. Commun. 2021, 557, 329–333. [Google Scholar] [CrossRef]
- Rout, J.; Swain, B.C.; Subadini, S.; Mishra, P.P.; Sahoo, H.; Tripathy, U. Spectroscopic and computational insight into the conformational dynamics of hemoglobin in the presence of vitamin B12. Int. J. Biol. Macromol. 2021, 189, 306–315. [Google Scholar] [CrossRef]
- Okwor, I.; Uzonna, J. Social and economic burden of human Leishmaniasis. Am. J. Trop. Med. Hyg. 2016, 94, 489–493. [Google Scholar] [CrossRef] [PubMed] [Green Version]
- Andrews, K.T.; Fisher, G.; Skinner-Adams, T.S. Drug repurposing and human parasitic protozoan diseases. Int. J. Parasitol. Drugs Drug Resist. 2014, 4, 95–111. [Google Scholar] [CrossRef] [PubMed] [Green Version]
- Hotez, P. Enlarging the “Audacious Goal”: Elimination of the world’s high prevalence neglected tropical diseases. Vaccine 2011, 29 (Suppl. 4), D104–D110. [Google Scholar] [CrossRef] [PubMed]
- Hyde, J.E. Exploring the folate pathway in Plasmodium falciparum. Acta Trop. 2005, 94, 191–206. [Google Scholar] [CrossRef] [Green Version]
- Gourley, D.G.; Schuttelkopf, A.W.; Leonard, G.A.; Luba, J.; Hardy, L.W.; Beverley, S.M.; Hunter, W.N. Pteridine reductase mechanism correlates pterin metabolism with drug resistance in trypanosomatid parasites. Nat. Struct. Biol. 2001, 8, 521–525. [Google Scholar] [CrossRef]
- Cavazzuti, A.; Paglietti, G.; Hunter, W.N.; Gamarro, F.; Piras, S.; Loriga, M.; Allecca, S.; Corona, P.; McLuskey, K.; Tulloch, L.; et al. Discovery of potent pteridine reductase inhibitors to guide antiparasite drug development. Proc. Natl. Acad. Sci. USA 2008, 105, 1448–1453. [Google Scholar] [CrossRef] [Green Version]
- Di Pisa, F.; Landi, G.; Dello Iacono, L.; Pozzi, C.; Borsari, C.; Ferrari, S.; Santucci, M.; Santarem, N.; Cordeiro-da-Silva, A.; Moraes, C.B.; et al. Chroman-4-one derivatives targeting pteridine reductase 1 and showing anti-parasitic activity. Molecules 2017, 22, 426. [Google Scholar] [CrossRef] [Green Version]
- Borsari, C.; Luciani, R.; Pozzi, C.; Poehner, I.; Henrich, S.; Trande, M.; Cordeiro-da-Silva, A.; Santarem, N.; Baptista, C.; Tait, A.; et al. Profiling of flavonol derivatives for the development of antitrypanosomatidic drugs. J. Med. Chem. 2016, 59, 7598–7616. [Google Scholar] [CrossRef]
- Zelent, B.; Kusba, J.; Gryczynski, I.; Johnson, M.L.; Lakowicz, J.R. Time-resolved and steady-state fluorescence quenching of N-acetyl-L-tryptophanamide by acrylamide and iodide. Biophys. Chem. 1998, 73, 53–75. [Google Scholar] [CrossRef]
- Valeur, B.; Berberan-Santos, M.N. Molecular Fluorescence, 2nd ed.; Wiley-VCH: Weinheim, Germany, 2013; Chapter 8. [Google Scholar]
- Visser, A.J.W.G.; Vysotski, E.S.; Lee, J. Critical transfer distance determination between FRET pairs. Photobiol. Sci. Online. 2011. Available online: http://www.photobiology.info/Experiments/Biolum-Expt.html (accessed on 20 March 2022).
Figure 1.
Quaternary structure of Lm PTR1 (PDB ID: 1E92). The four monomers are shown in red, pink, blue and pale blue ribbons. Tryptophans 100 and 238 are shown in, respectively, grey and fuchsia for all monomers. The NADP cofactor and the dihydrobiopterin substrate are reported in the catalytic pockets with atoms displayed as yellow and green spheres.

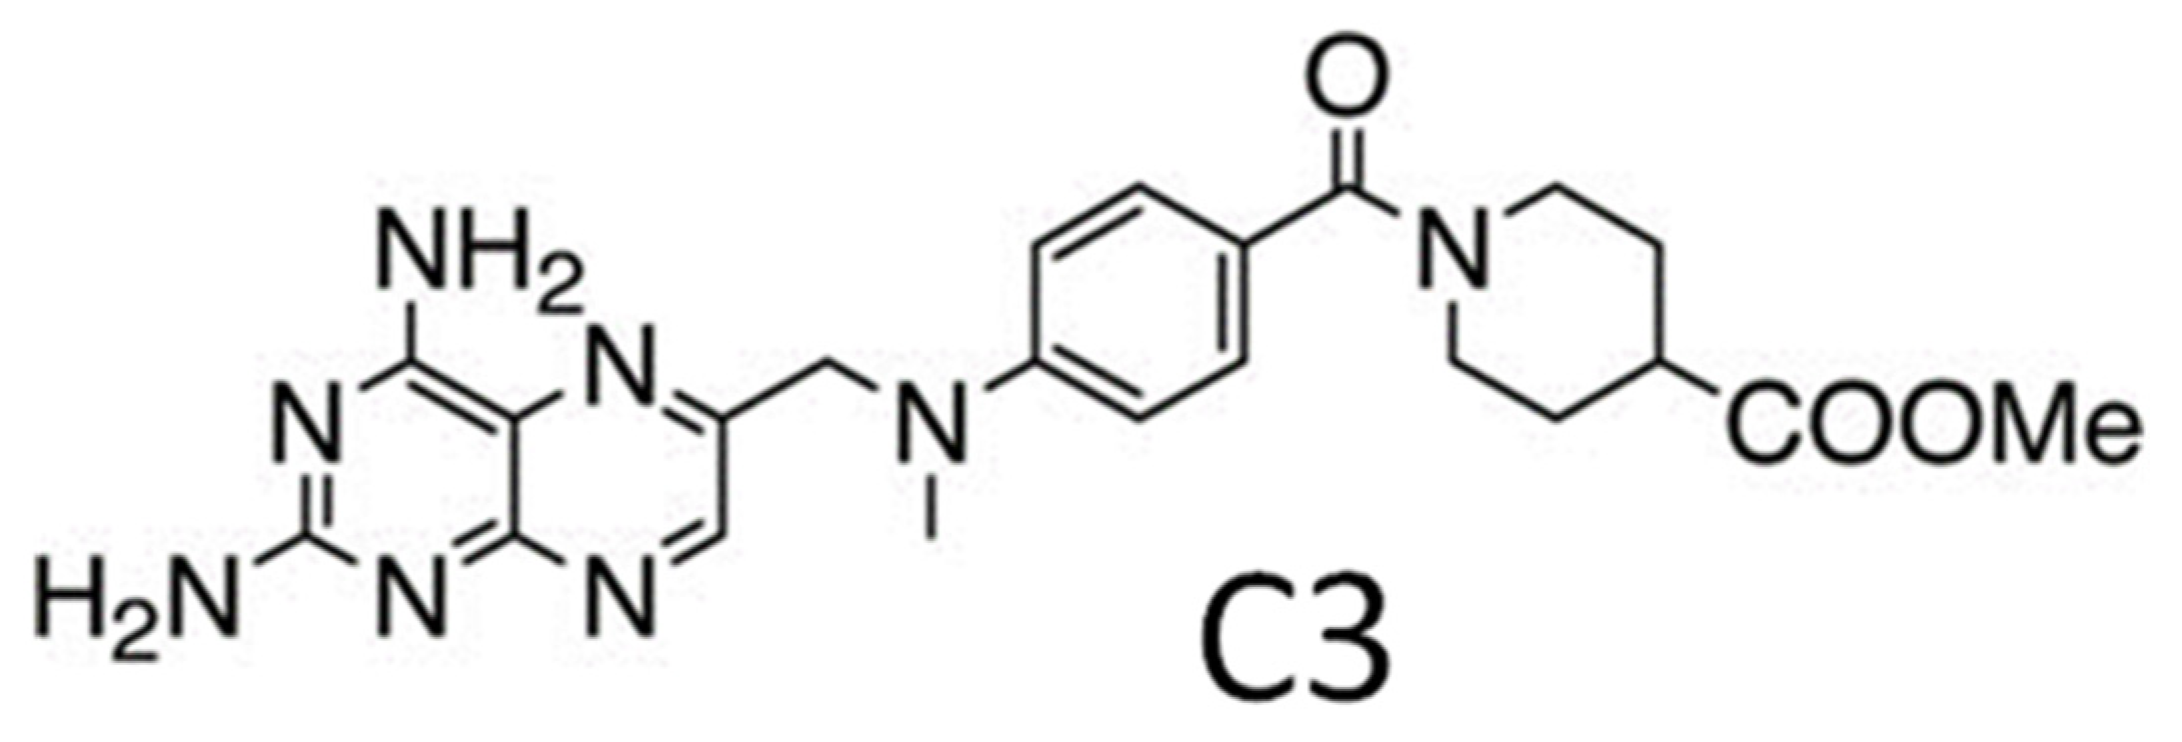
Scheme 1.
The diaminopteridinic inhibitor of PTR1, C3.

Figure 2.
Fluorescence emission spectra of Lm and Tb PTR1 (black lines) and their representations (red lines) as sums of three Gaussian bands (green lines). Excitation at 280 nm.
Figure 2.
Fluorescence emission spectra of Lm and Tb PTR1 (black lines) and their representations (red lines) as sums of three Gaussian bands (green lines). Excitation at 280 nm.

Figure 3.
Time decays of Lm PTR1 emission: (a) protein decay at 350 nm (red dots) and instrumental excitation profile (blue dots, obtained by elastic scattering from a glycogen suspension at λexc,em = 295 nm); (b) protein emission decays at 310 nm (orange dots) and 350 nm (blue dots); (c) example of four-lifetime deconvolution of the emission decay at 340 nm. The residuals, i.e., the differences between the recalculated decay curve (green) and the experimental data (red dots), are shown below in green. As in panel a, blue dots represent the excitation profile. The lifetimes obtained, with the corresponding percentage abundances within brackets, and the x2 value are in the inset. λexc = 295 nm; 1 channel = 27 ps.

Figure 4.
Lifetime profile of Lm PTR1. Top: schematic representation of the exponential components of emission decays of Lm PTR1 obtained at the given emission wavelengths of the decay measurement and analysis (the results of two-to-four repetitions, one at 310 and 400 nm, are shown). Each segment represents a component lifetime in the analysis of the emission decay, and its height the relative component abundance. Bottom: average relative abundances (expressed as %) of the four components in the emission decay of Lm PTR1 as functions of emission wavelengths. Vertical bars correspond to ± standard deviations of four to six abundance values. λexc = 285 nm.

Figure 5.
Effects of the addition of 0.1 M KI on the emission decays of Lm PTR1 at different emission wavelengths. Curved arrows and fading of colours of circles and lines indicate changes in the relative abundances (expressed as %) of the four decay components following iodide addition. λexc = 285 nm.

Figure 6.
Effects of binding of compound C3 on Lm PTR1 fluorescence (a) Emission spectra without (blue curve) and with (red curve) 8 μM C3 at λexc = 280 nm. The spectra were normalized to their maxima; the vertical segments indicate the wavelengths of the corresponding band centroids. (b) Relative abundances of the four main components of the Lm PTR1 emission decay at four emission wavelengths without (triangles) and with (squares) 8 μM C3. The curved arrows highlight the changes caused by ligand addition in the abundances of the 0.45 ns component at 320 nm and of the other three components at 380 nm. (c) Dependence of the amplitude-averaged lifetimes at three emission wavelengths on C3 concentration. λexc = 285 nm.

Figure 7.
Exposed surface of Lm PTR1 (PDB ID: 1E92). Colour code of surface atoms: C, green; N, blue; O, red; C atoms of Trp100 and Trp238, pink; O atoms of crystal water molecules, grey.
Figure 7.
Exposed surface of Lm PTR1 (PDB ID: 1E92). Colour code of surface atoms: C, green; N, blue; O, red; C atoms of Trp100 and Trp238, pink; O atoms of crystal water molecules, grey.


Table 1.
Results of Gaussian band reconstructions of emission spectra of Lm and Tb PTR1: hmw = width at half maximum. Excitation at 280 nm.
Table 1.
Results of Gaussian band reconstructions of emission spectra of Lm and Tb PTR1: hmw = width at half maximum. Excitation at 280 nm.
| Protein | λmax/nm | hmw/cm−1 | Attribution | |
|---|---|---|---|---|
| Lm PTR1 | 33,000 | 303 | 2000 | Tyrs |
| 30,500 | 328 | 3200 | intermediately exposed Trps | |
| 28,000 | 357 | 4400 | fully exposed Trps | |
| Tb PTR1 | 33,800 | 296 | 1600 | Tyrs + excitation scattering |
| 33,000 | 303 | 2500 | Tyrs | |
| 29,700 | 337 | 4800 | intermediately exposed Trps |
Publisher’s Note: MDPI stays neutral with regard to jurisdictional claims in published maps and institutional affiliations. |
© 2022 by the authors. Licensee MDPI, Basel, Switzerland. This article is an open access article distributed under the terms and conditions of the Creative Commons Attribution (CC BY) license (https://creativecommons.org/licenses/by/4.0/).
Share and Cite
MDPI and ACS Style
Ferrari, S.; Costi, M.P.; Ponterini, G. Intrinsic Fluorometric Reporters of Pteridine Reductase 1, a Target for Antiparasitic Agents. Physchem 2022, 2, 131-144. https://doi.org/10.3390/physchem2020010
AMA Style
Ferrari S, Costi MP, Ponterini G. Intrinsic Fluorometric Reporters of Pteridine Reductase 1, a Target for Antiparasitic Agents. Physchem. 2022; 2(2):131-144. https://doi.org/10.3390/physchem2020010
Chicago/Turabian StyleFerrari, Stefania, Maria Paola Costi, and Glauco Ponterini. 2022. "Intrinsic Fluorometric Reporters of Pteridine Reductase 1, a Target for Antiparasitic Agents" Physchem 2, no. 2: 131-144. https://doi.org/10.3390/physchem2020010