Article

Experimental Study on the Time-Dependent Resistance of Open-Ended Steel Piles in Sand

1
Department of Civil & Environmental Engineering, TUM School of Engineering and Design, Technical University of Munich, 80333 München, Germany
2
Federal Waterways Engineering and Research Institute, 22559 Hamburg, Germany
*
Author to whom correspondence should be addressed.
Geotechnics 2024, 4(4), 985-1006; https://doi.org/10.3390/geotechnics4040050
Submission received: 4 August 2024 / Revised: 23 September 2024 / Accepted: 25 September 2024 / Published: 30 September 2024

Abstract

Open-ended steel piles are commonly used as the foundation for offshore structures. Numerous model and field tests have demonstrated a time-dependent increase in the resistance of these piles, a phenomenon referred to as pile ageing or pile setup. Additionally, for open-ended steel piles with comparably small diameters, soil plugging enhances the resistance against axial compressive loads. Realistically predicting these effects is necessary for their reliable incorporation into design practice. This contribution presents static compression and tension pile load testing conducted in an experimental pit filled with wet, uniformly graded silica sand. In total, twelve piles ( L = 5.5 m, D o = 325 mm) were driven into homogeneously compacted sand using a pneumatic impact hammer. Firstly, static compression pile load testing was executed at various times after installation. Subsequently, static tension pile load tests were carried out. The results of the static compression pile load tests indicate that the compressive resistance doubles over an ageing period of 64 weeks. The experimental investigations of the effect of soil plugging showed marginal soil plugging during pile installation, but a significant influence of the soil plug on the compressive resistance.

1. Introduction

A reliable design for open-ended piles requires a precise knowledge of their load-displacement behavior and bearing capacity. As for mechanical soil behavior in general, in the case of piles, loading history is one of the essential influences on their bearing behavior. Prior to pile installation, earth-pressure-at-rest conditions typically prevail in the soil (the primary stress state). During the impact driving of the piles, the surrounding soil is significantly disturbed from to its original structure, which affects the density formed by natural diagenesis. In cohesionless soils, grain rearrangement and varying degrees of grain fracture, from surface abrasion to extensive grain rupture, may occur, particularly at the base of the pile, but also along the pile shaft [1,2]. During the pile driving process, some of the grains being displaced by the penetrating pipe will also move into and along the shear zones around the pile shaft and inside the pipe. Once the pile installation is completed, the soil adjacent to the pile has a new structure that is characterized by new grain locations and the distribution and orientation of contact forces. Compared to the original stable structure, this new grain skeleton configuration will continue to evolve towards a more stable configuration over time. For coarse materials such as sands and gravels, this evolution comes along with delayed contact force redistributions and grain rearrangements, which are considered to be one reason for the time-dependent increase in pile capacity, known as pile setup or pile ageing [3,4,5,6,7].
Under axial compressive loads, the load is transmitted through the outer pile, as well as through the inner pile’s friction and the annular pile base in the case of soil penetration within the tubular pile’s cross-section [8]. In the area of the pile base, the soil entering into the pipe can become heavily compacted, eventually leading to the formation of a plug [9,10]. This occurs when the inner shaft resistance becomes larger than the force required to completely displace the soil at the base of the pile. Under these extreme conditions, further penetration of the plug into the pipe will practically cease and the penetration resistance will become similar to the resistance of a closed-ended pile. In the case of static tension pile loading, only the outer skin’s friction governs the pile resistance.

1.1. Soil Plugging

There are several factors influencing the soil plugging of open-ended steel piles in cohesionless soils [11,12,13,14]. These include the following:
  • Pile properties: inner diameter, outer diameter, wall thickness, embedded pile length, surface roughness.
  • Type of loading: jacking/quasi-static loading, impact driving/dynamic loading, vibratory driving.
  • Granulometric properties and state: grain size distribution, grain shape, grain mineral, relative density, degree of saturation, stress state.
Various quantities have been proposed to assess the soil plug formation. In the original definition the “Plug Length Ratio” ( P L R f i n a l ) refers to the ratio between the embedment depth L e , f i n a l and the plug height h f i n a l when the final penetration depth of the pile is reached: see Paik and Lee [15].
P L R f i n a l = h f i n a l L e , f i n a l
A P L R f i n a l equal to one indicates that the entire length of the pile is filled with soil, meaning that no plugging has occurred. However, the Plug Length Ratio can also be determined continuously during pile driving. In model tests, Lüking [12] and Seo and Kim [11] investigated the influence of the diameter and the relative density on the plug height at the end of driving. Their observations from independently carried out experiments are
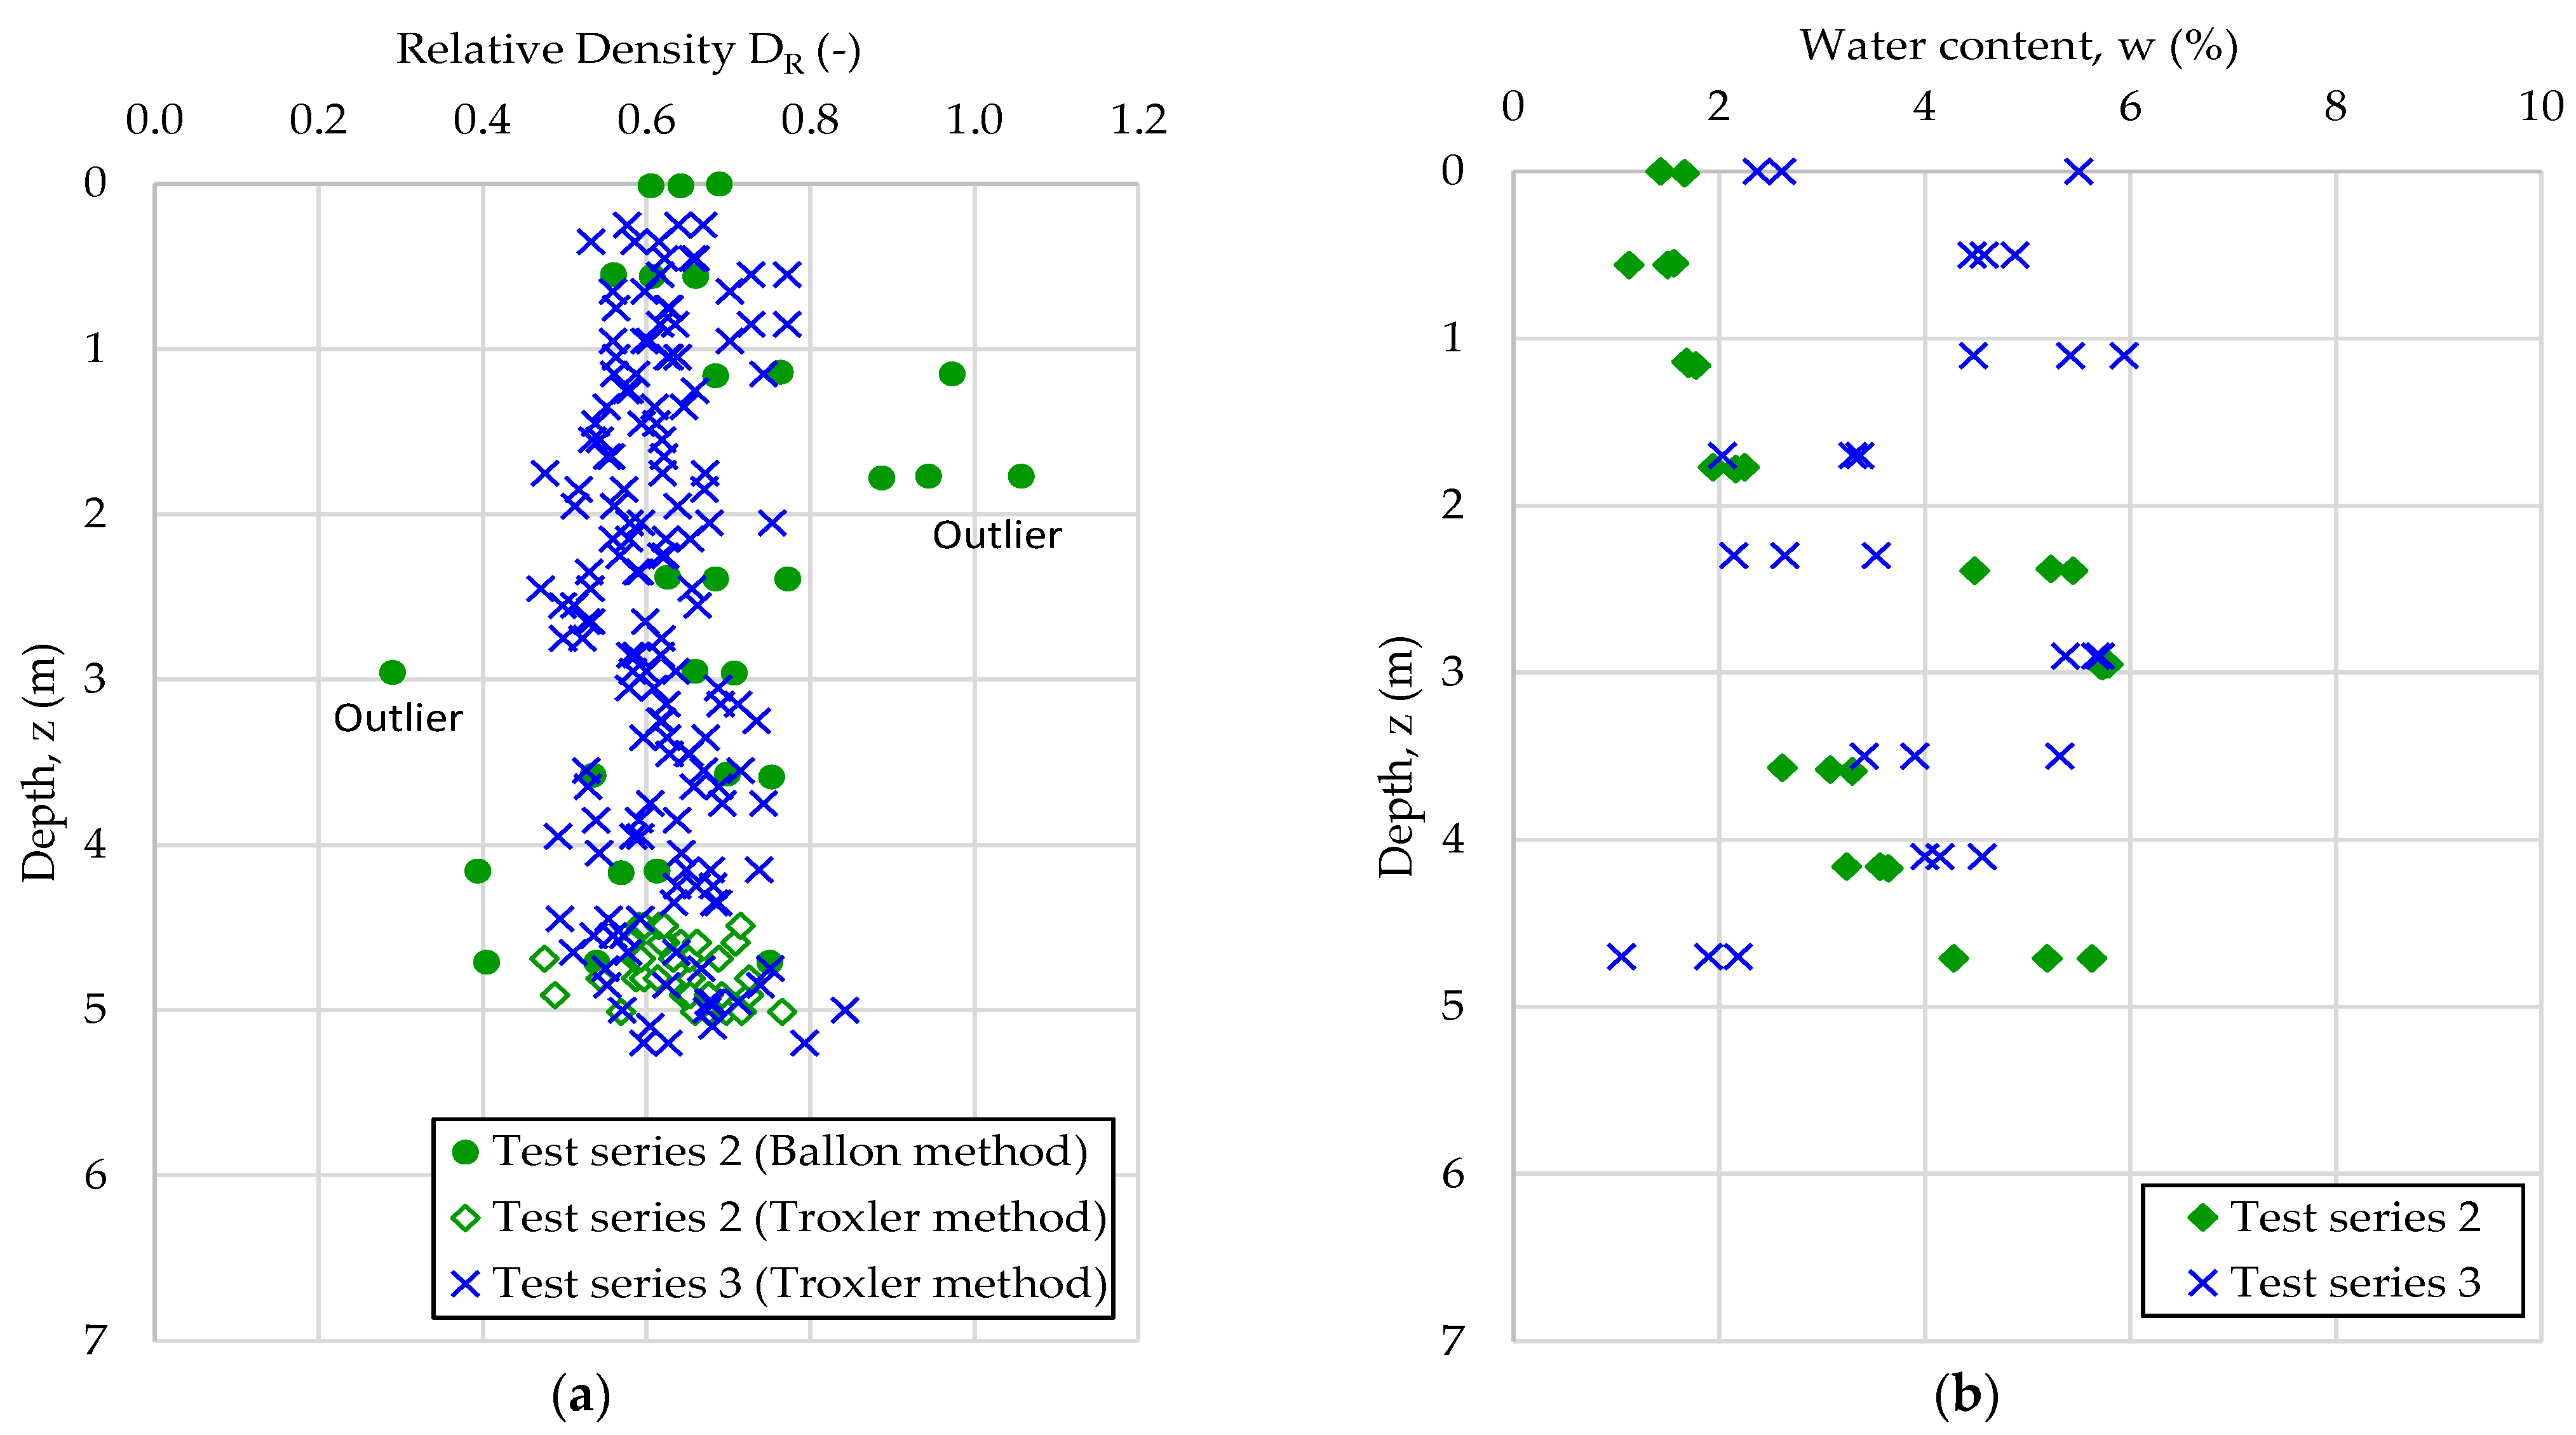
  • The lower the relative density of the sand, the lower the height of the soil column inside the pile, and, thus, the lower the value of the P L R f i n a l .
  • The larger the diameter of the pile, the greater the height of the soil column inside the pile, and the higher the associated value of the P L R f i n a l .
Another commonly used quantity to track soil plug formation is the Incremental Filling Ratio ( I F R ) [16], which is defined as the incremental change in the ratio of embedment depth L e to plug height h:
I F R = h L e
Henke [17] criticizes the frequent use of P L R and I F R as characteristic values for quantifying the effect of soil plugging. In general, the development of the plug height does not provide conclusive information about the values of the state variables (density and stresses) in the soil column, which govern its mechanical behavior. For example, during pile driving in loose sand, usually I F R 1. However, this is caused by compaction of the soil column rather than due to soil plugging. For this reason, Henke proposed the quantity KPf, which relates the actual horizontal stress acting at the depth z from the surface of the plug σ h to the vertical stress σ v = γ · z , resulting from the weight of the soil column above this depth:
K P f ( z ) = σ h ( z ) σ v ( z )
However, the experimental evaluation of K P f is very difficult, since this requires the measurement of the horizontal stresses in the soil column.
Randolph et al. [18] developed a model in which the plug is assumed to have an active and a passive part. The lower active part of the plug has a length of approximately 10–20% of the pile embedment depth. Within this zone, intense soil densification and compression occurs, resulting in a significant increase of vertical and horizontal stresses and internal skin friction. In the upper part of the soil column, which is the passive one, the change of the vertical and horizontal stresses and consequently the internal skin friction are comparatively small. This conceptual model has been largely confirmed by various experimental [12,19] and numerical [20,21] investigations.
Several authors point out that the soil plug can show limited ductility, may slide quite abruptly, and may eventually stick again during quasi-static pile loading. Kikuchi et al. [22] describe this phenomenon as “intermittent” plug formation.

1.2. Pile Ageing

The increase in the axial load-bearing capacity of piles has been observed for different soil types (cohesive, cohesionless) and different pile types (timber piles, concrete piles, steel piles) [23,24,25,26]. The causes of the setup effect can be related to various mechanical and chemical mechanisms at the scale of individual soil particles up to the scale of particle clusters at soil elements and the soil–pile interface, depending on the boundary conditions. The following explanations are limited to steel piles in sands.
There are few systematically conducted and fully instrumented field tests reported in the literature [7,23,27,28,29] that allow the identification of the causes and mechanisms of pile ageing in sands. Basically, the evaluation of the pile setup consists of comparing the bearing behavior observed at different times after installation with the bearing behavior obtained immediately after pile installation. This requires a series of piles to be driven into the same subsoil, with the same equipment, and then tested at different intervals. If a pile is tested multiple times, the pile setup will be significantly smaller, since each loading test will disturb the ageing process. In fact, the field test results presented in the literature show significant variability in pile ageing, which may be related to the following possible reasons:
  • The variability of the natural subsoil and differences in the pile installation process, pile loading tests, and instrumentation. For this reason, even tests on similarly installed, instrumented, and loaded piles, tested at the same time after installation, can show a significant scatter of the compressive resistance as well as tensile resistance.
  • In some cases, different types of pile loading tests are used to evaluate ageing (static/dynamic, tension/compression), leading to influences from the different test methods themselves, as well as from the test data evaluation and interpretation.
  • Different boundary conditions related to the pile geometry, pile installation process, and soil conditions will most likely have an effect on the setup effect.
  • For the evaluation of the pile ageing, different empirical functions describing the resistance as a function of time have been proposed in the literature. In most cases, the results are presented in semi-logarithmic plots. In these plots, a linear regression curve corresponds to an exponential function of type,   a 1 + a 2 · log t . The underlying assumption here is that the pile ageing decays exponentially. A slightly different approach is described in [23], which proposed a hyperbolic function, b 1 · tanh b 2 t . The latter is based on the assumption that the ageing will cease after a certain period of time (according to [23], 12–24 months).
The causes and influencing factors on the time-dependent increase of the compressive and tensile resistance of piles in sands are diverse and not yet fully understood. The installation of piles significantly disturbs the surrounding soil. The change in the state and eventually in the granulometric properties of the soil adjacent to the pile depends on the pile’s dimensions, the pile type, and the installation method. Anusic et al. [28] found from small-scale field tests that an increase in the driving frequency during pile installation leads to higher rates of the time-dependent gains in resistance. Busch [30] observed, in field tests with model piles, that the initial tensile resistance measured 24 h after pile installation is strongly dependent on the number of shear cycles applied during the pile installation process. The more shear cycles a pile experiences during installation, the greater the disturbance of the surrounding soil and the lower the initial tensile resistance. For this reason, vibrated piles showed a low initial resistance and a relatively high potential for ageing. Short-term pile ageing can even be observed during installation pauses. Bhattacharya et al. [31] analyzed pile driving data and found a significant increase in driving resistance after pauses of up to 24 h. In contrast to cohesive soils, the dissipation of pore water pressures is negligible in sands [32]. Instead, Chow et al. [25] hypothesize that hoop stresses form around the pile during installation, which slowly break down over time due to creep and fatigue at the grain contacts. At least on the scale of element tests in the laboratory, such phenomena can be well reproducibly observed: see [33,34]. Eventually, the radial stresses, which decreased during installation, start to increase again. This effect can be theoretically validated experimentally by measuring the evolution of the radial pressure on the pile shaft over time. However, as mentioned above, these measurements are very challenging. An overview of experiments with such measurements described in the literature can be found in [32,35]. In most cases, a time-dependent increase of the effective horizontal stresses was observed. However, in the field experiment with steel pipe piles in sand described in [32], a reduction in radial effective stresses was recorded.
Another possible explanation for the setup effect, mentioned in [25], is an increase of dilatancy due to time-dependent particle rearrangements leading to a denser particle assembly in the shear zone adjacent to the pile shaft.
The third possible cause of the setup effect listed by [25] involves physicochemical reactions between the soil as a three-phase system (solid particles, liquid, and gas) and the pile material. In several cases, a thin, but comparatively hard, crust-like layer of sand particles adhering to the pile surface was identified when piles were excavated some time after installation [25,32,35,36].
It can be concluded that the underlying mechanisms of pile ageing are complex and the phenomenon is most probably multicausal. For this reason, the development of reliable theoretical models to predict pile setup seems remote and uncertain. Empirical relationships are a pragmatic alternative. Nonetheless, high quality experimental data to evaluate pile ageing are scarce, and the existing relationships are based on a rather small database.
One of the main objectives of this research project was to add to the currently published experimental database by performing pile loading tests under controlled conditions in a test pit. For this purpose, comparatively rarely reported static compression pile loading tests were conducted to investigate pile ageing. Th extensive instrumentation of the piles, in addition to the analysis regarding pile ageing, was intended to provide deeper insight into the fundamental mechanisms and causes behind the effect of soil plug formation. The data from the measurements, collected under controlled boundary conditions, will serve to refine and validate numerical models, improving their accuracy and reliability. Ultimately, this research will contribute to a better understanding of pile behavior and support the development of more efficient and durable foundation systems.

2. Description of the Large-Scale Pile Tests

The objective of the presented research is to provide data from different methods of pile load tests under controlled boundary conditions. Table 1 provides an overview of the pile-testing program. For the investigation of pile ageing, the pile load tests were undertaken at different times after installation. The test methods comprised static pile load tests (compression and tension) as well as dynamic pile load tests (high-strain method, not presented in this study). The experiments were carried out in a test pit protected from varying weather conditions with the dimensions of width × length × depth = 4 m × 5 m × 8 m. To minimize the mutual influence of the concrete walls and neighboring piles, four piles were installed in each test series. Figure 1 shows the arrangement of the piles in the test pit.
At the beginning of test series 1, pile 1 ( D o   ×   t = 323.9 mm × 10.0 mm) was used to study the installation process, including the use of the pile hammer and the equipment for the static and dynamic pile load tests. For this reason, pile 1 was installed twice at the same position. Due to the installation of measurement equipment, piles 2–12 had a slightly greater wall thickness of t = 12.5 mm compared to pile 1. For test series 2 and 3, the pile embedment depth was reduced from 4.3 m to 3.9 m. This became necessary, because there was a risk of exceeding the load-bearing capacity of the reaction system in the static pile load tests on the long-aged piles.

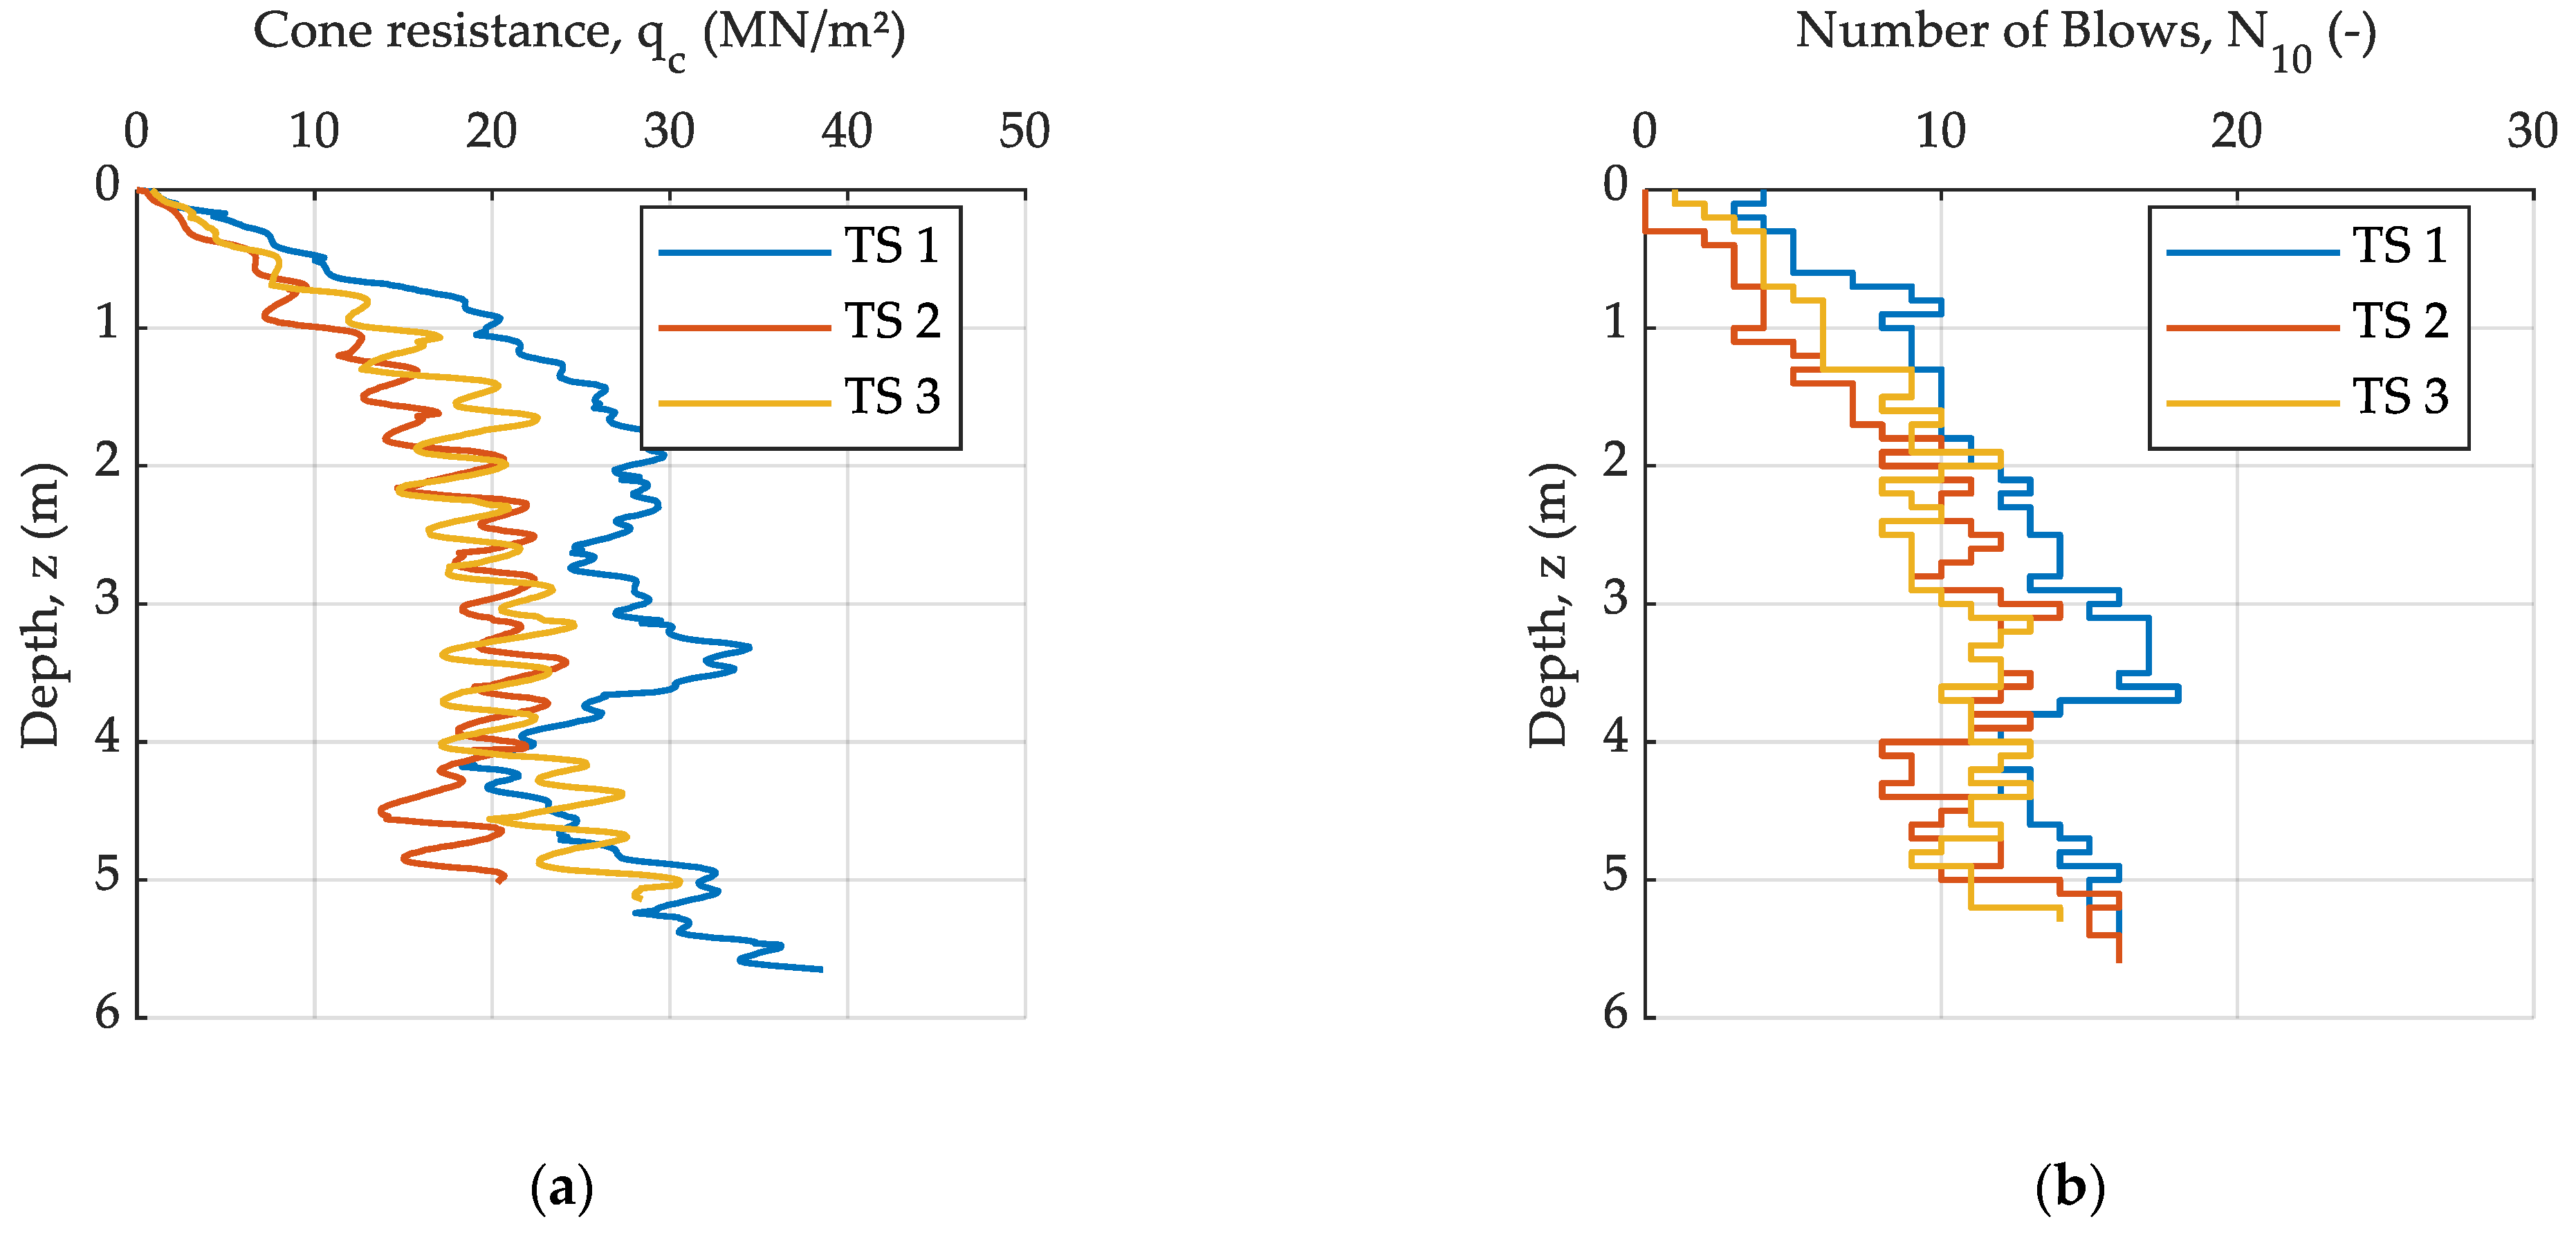
2.1. Soil Characterization

The sand was a uniformly graded medium silica sand with sub-rounded grains from a sand quarry in Sengenthal, Germany. The main properties of the sand were determined by laboratory experiments (Table 2). X-ray powder diffraction identified the mineralogical composition as 89% quartz and 11% microcline.
The sand was compacted using a vibratory plate compactor. The compaction concept follows the idea that the number of passes of the vibratory plate compactor should be such that the sand cannot be compacted any further due to its limited compaction energy.
During the placement and compaction of the soil in layers, a nuclear gauge (Type Troxler 3440) was used to check moisture and density. For the test series 1, only a few tests were conducted, at a soil filling level of approximately 1.0 m. The average bulk density was ρ f = 1.752 g/cm3, and the average water content was w = 3.8%. This resulted in an average relative density of D r = 0.68, indicating a dense soil state. Figure 2a shows the relative density derived from the measured bulk densities and water contents as a function of depth for test series 2 and 3. For test series 3, the average relative density over depth was D r = 0.66. The water content was in the range of 1–6% (Figure 2b).
The homogeneity of the soil was controlled by cone penetration testing (CPT) and dynamic probing heavy (DPH). For each test series (TS), a representative profile was chosen and is shown in Figure 3.
In general, there is good agreement between the results from the CPT and the DPH. Especially for test series 2 and 3, the individual soil layers created in the course of the compaction process are clearly recognizable. Generally, the smaller layer thickness in test series 1 (20 cm) results in a larger and more homogeneous density. At a depth of approx. 4.0 m in test series 1, there is a clear decrease in penetration resistance. Possibly, the proximity to the concrete floor of the test pit leads to a measurably lesser compaction when using the vibratory plate.

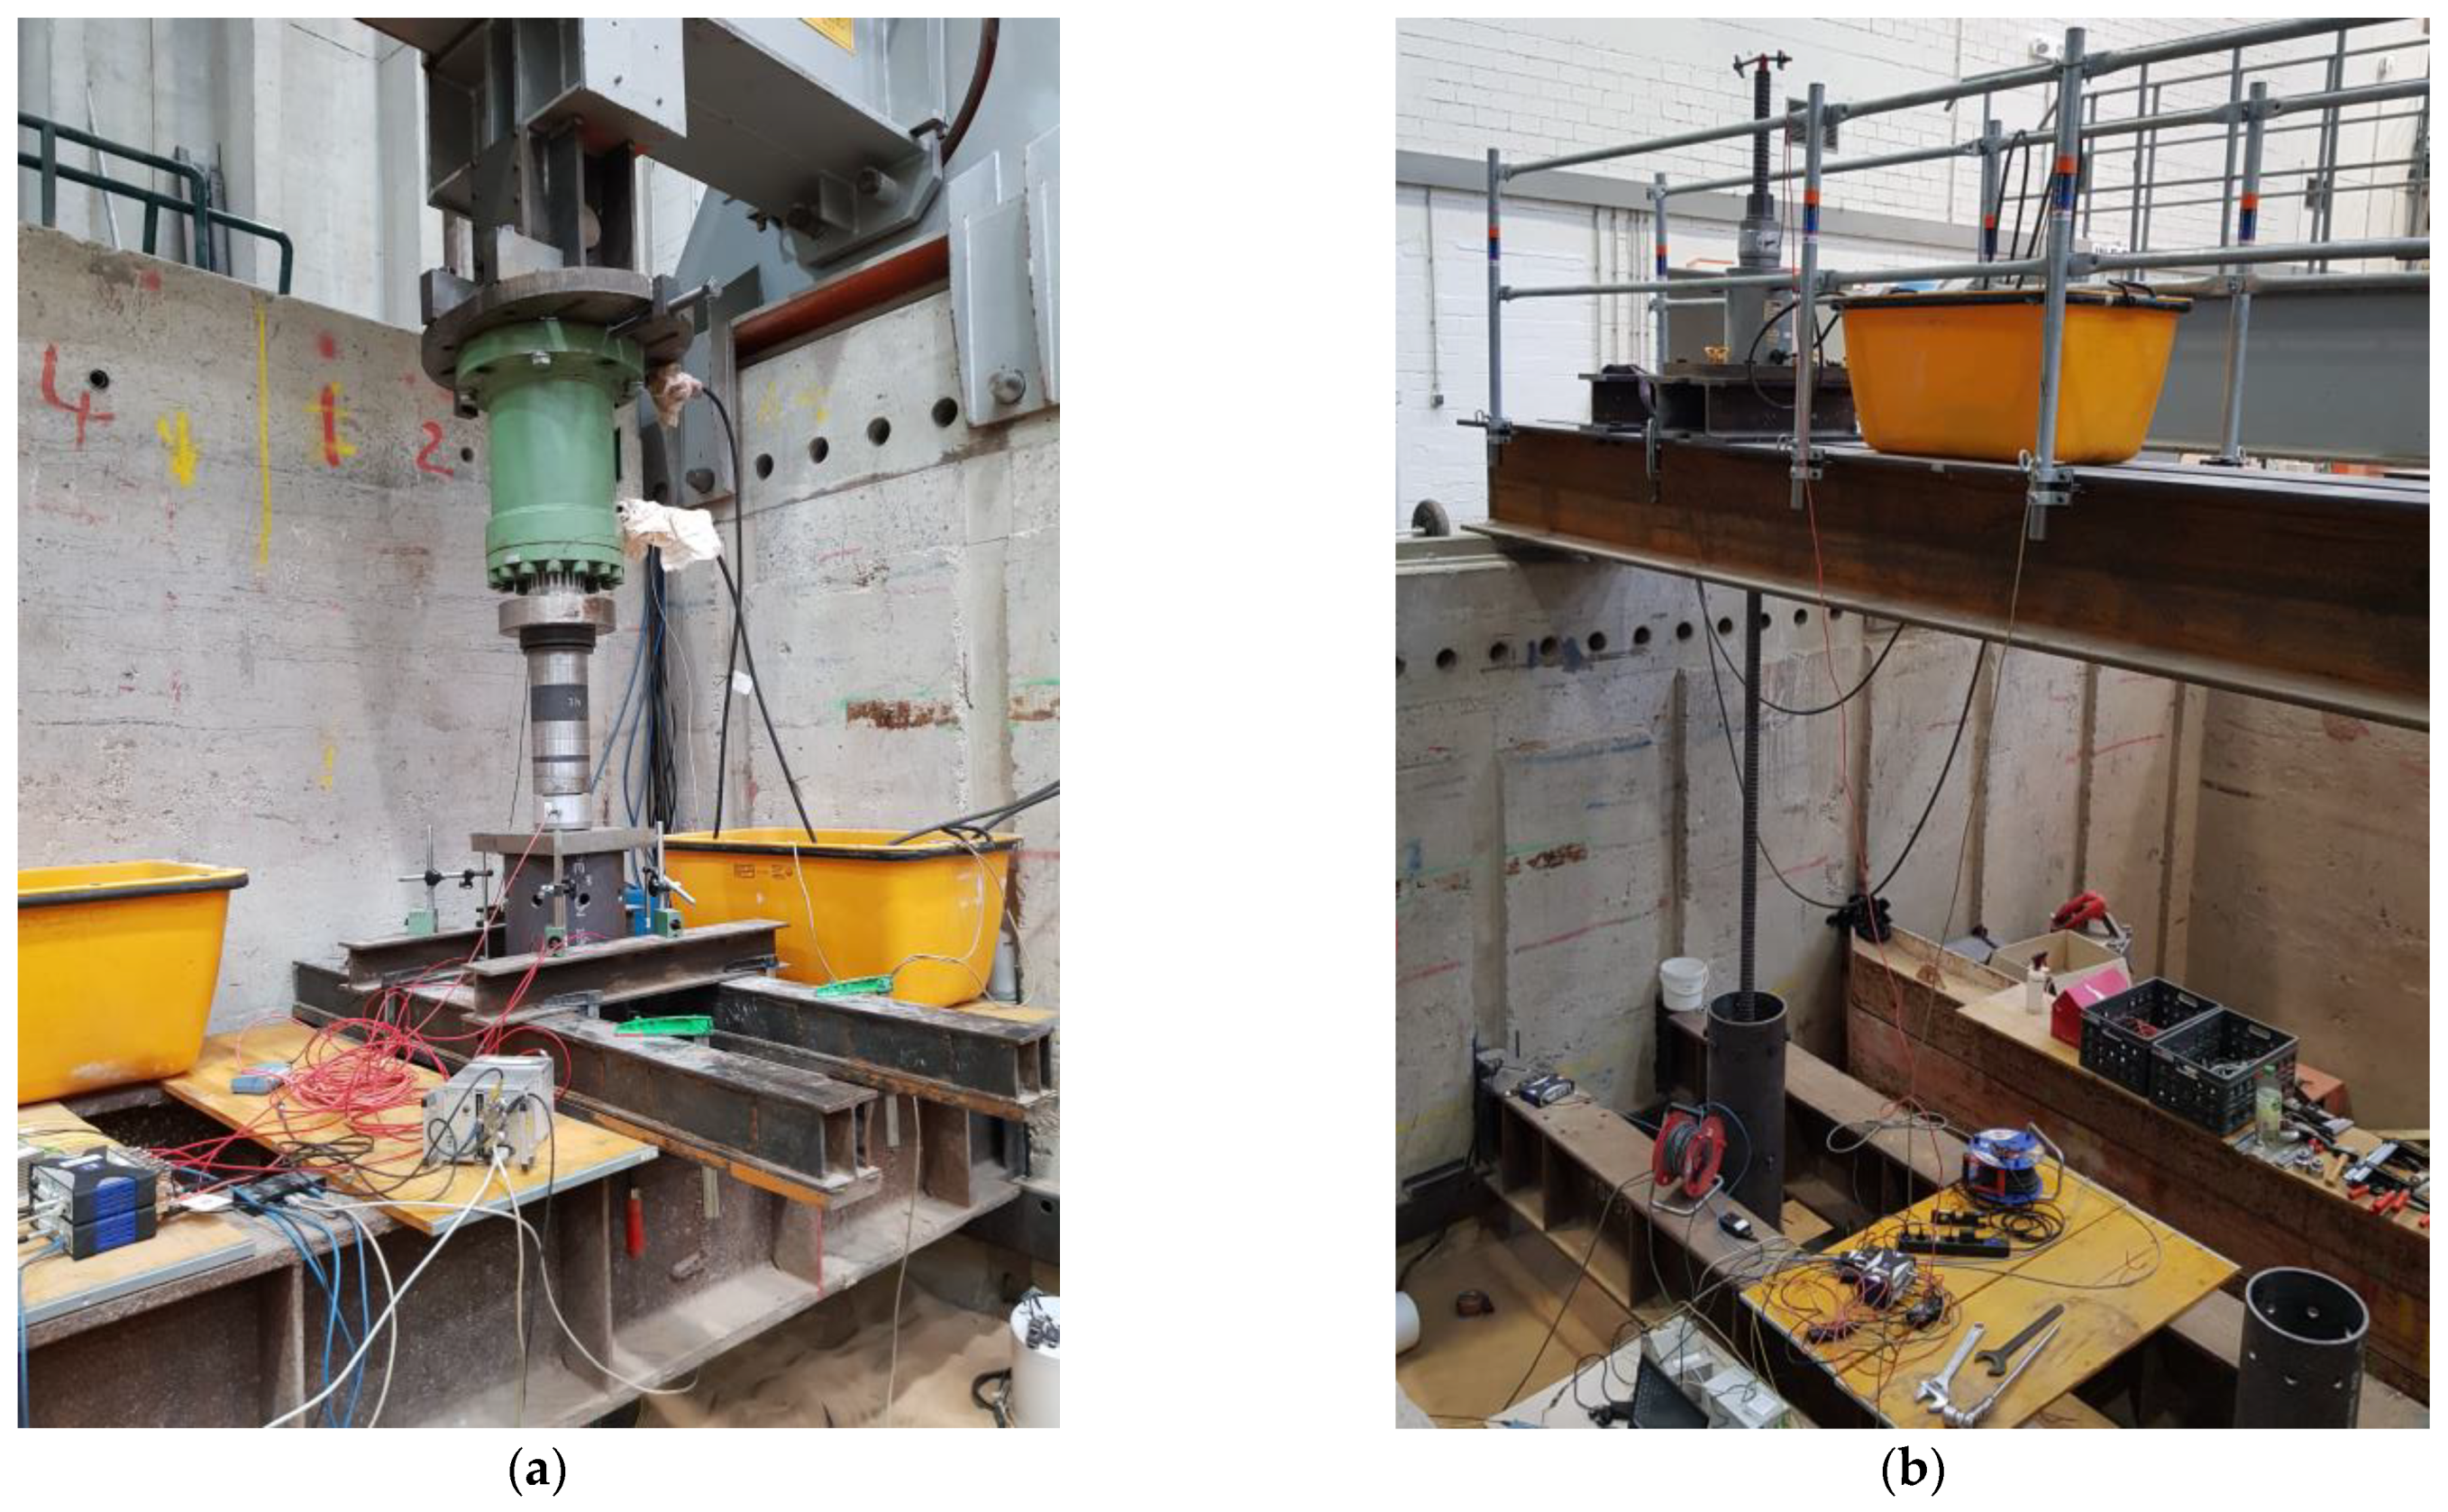
2.2. Pile Driving Hammer

For the installation of the open-ended steel piles, a double-acting air hammer, type Menck SB120 (Menck GmbH, Kaltenkirchen, Germany), was used. Table 3 shows the datasheet provided by the manufacturer.
The pile driving was carried out without using a cushion. The force of the piston was transferred to the pile by means of the striker plate (hard steel-to-steel contact).

2.3. Static Pile Load Testing

The static compression and tension pile load tests were performed by the stepwise increase of the axial load applied to the pile head. Subsequent to each stepwise loading, the force was kept constant for 15 min. After reaching an axial displacement of the pile head of s = 0.1 · D o = 33 mm, the pile was gradually unloaded. For the compression tests, a second loading cycle was performed after unloading. For some of the tested piles, the axial strain was measured at different cross-sections along the pile axis using fiber optic strain gauge chains. Each fiber optic measuring chain consisted of seven individual fiber Bragg grating (FBG) sensors. Two measuring chains were attached opposite each other on each pile. By averaging the values, the possible bending effects can be mathematically compensated. Figure 4 gives an impression of the test setup used for the compression (left image) and tension (right image) pile load tests.

3. Test Results

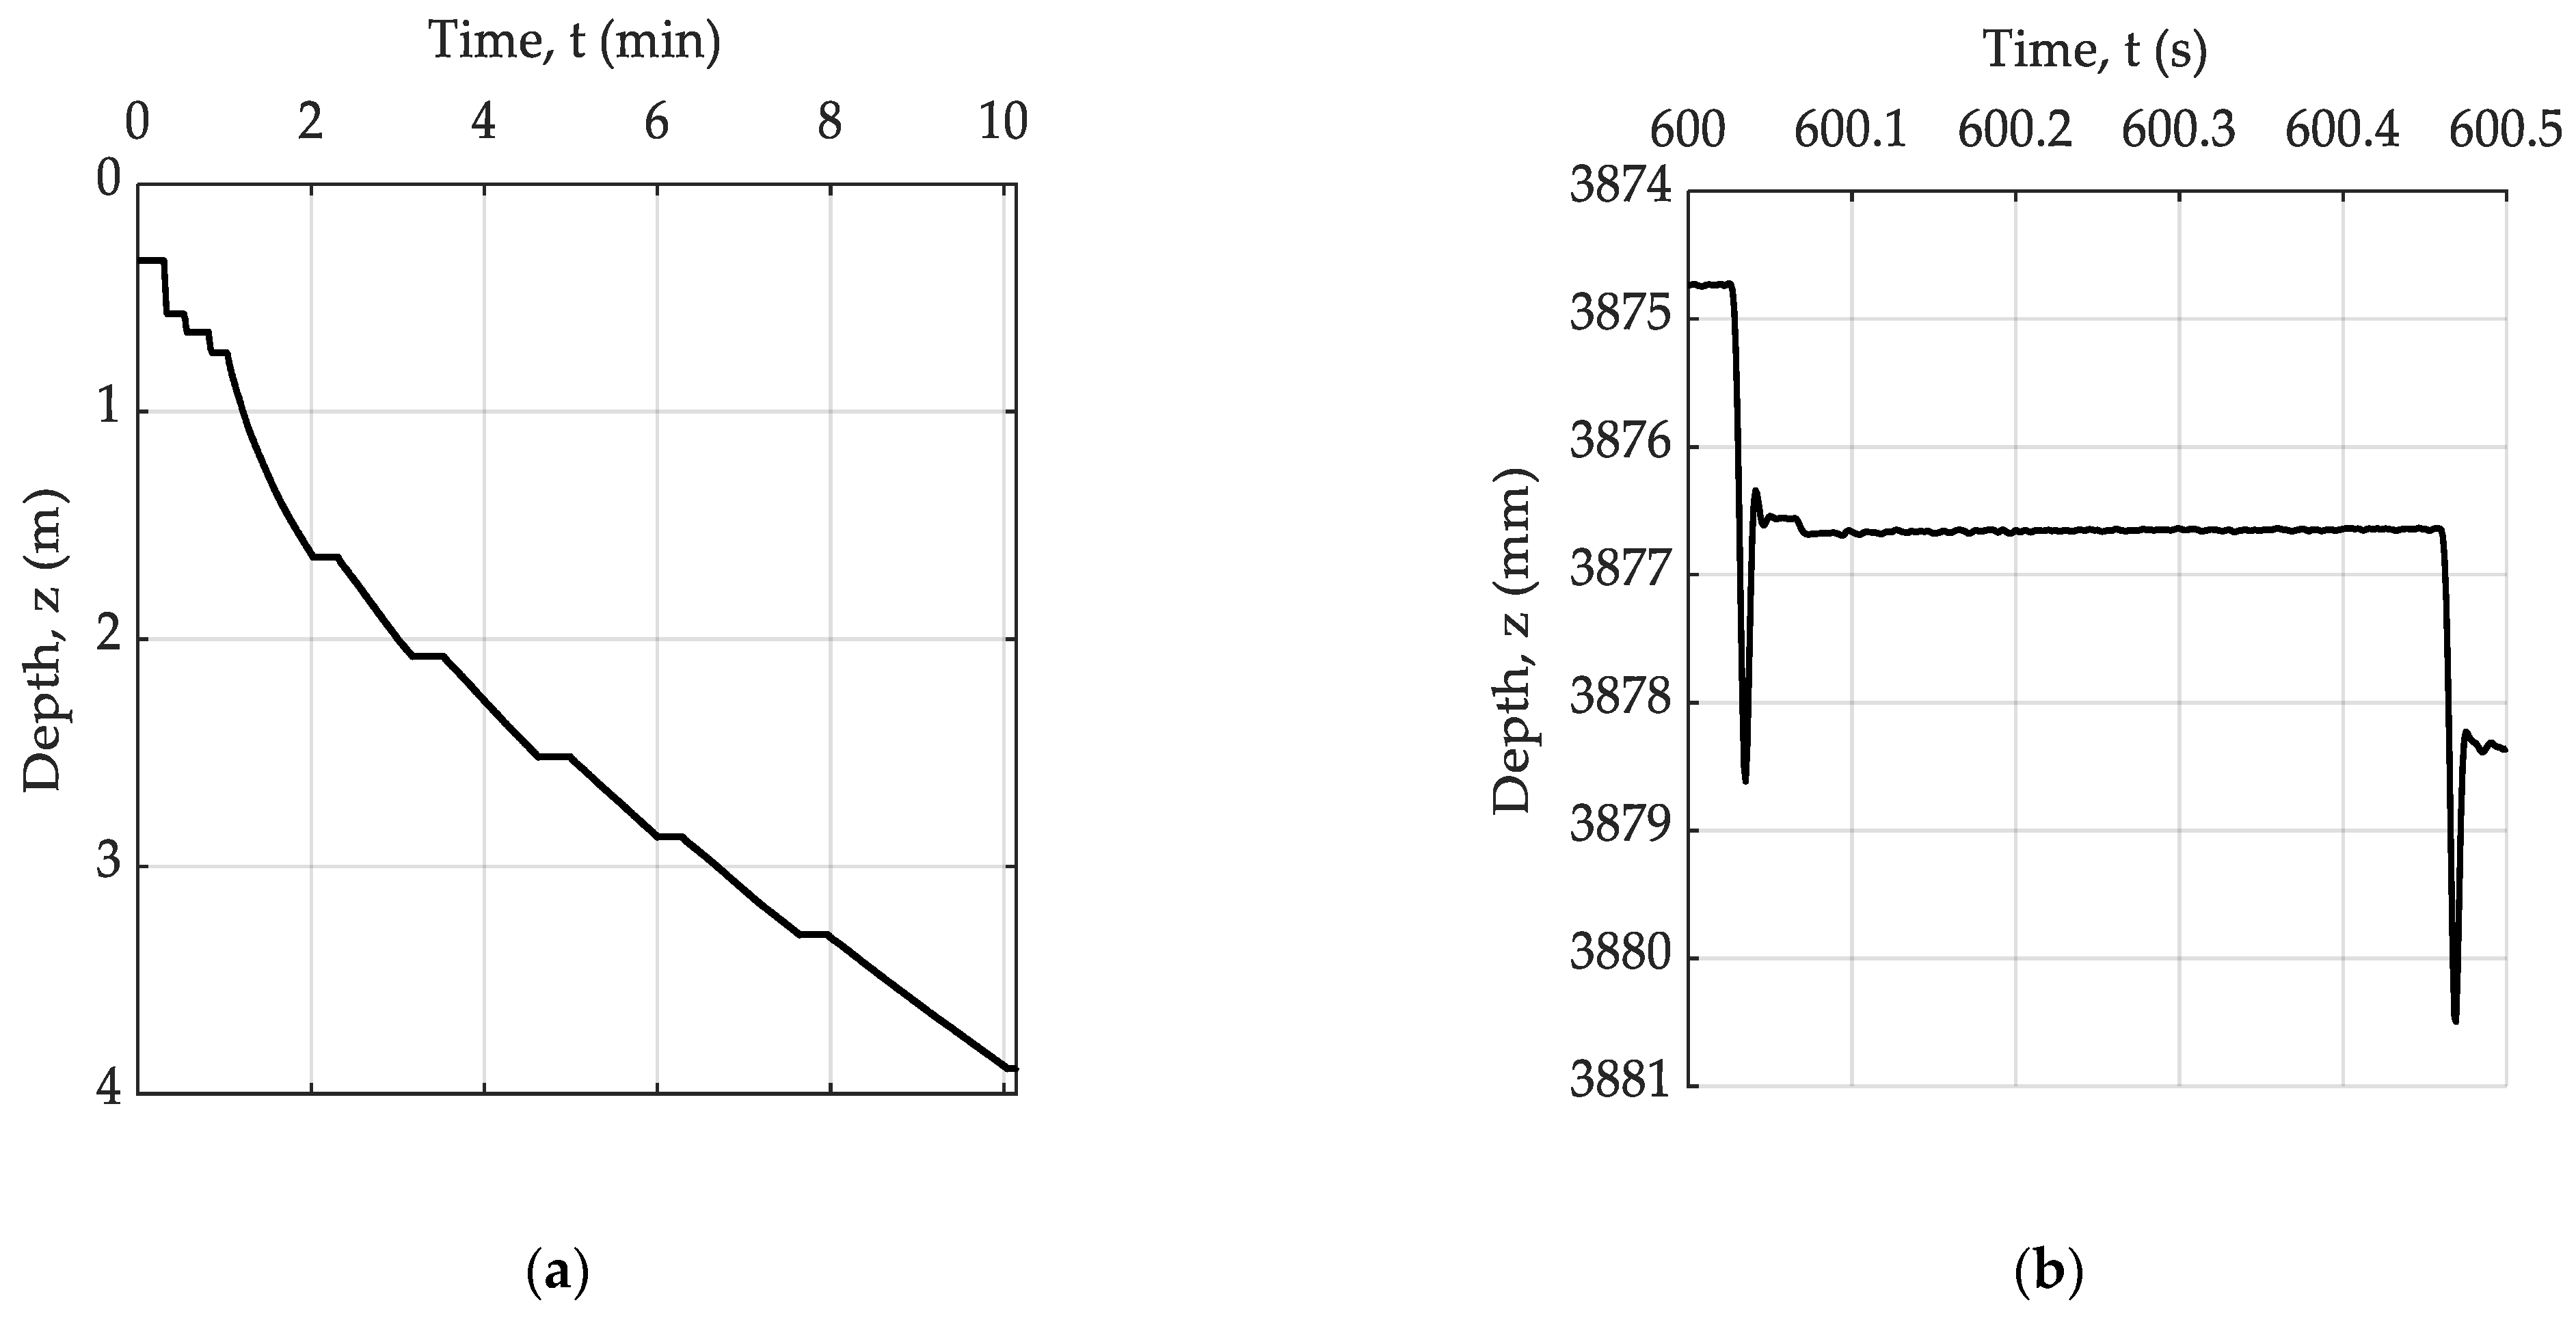
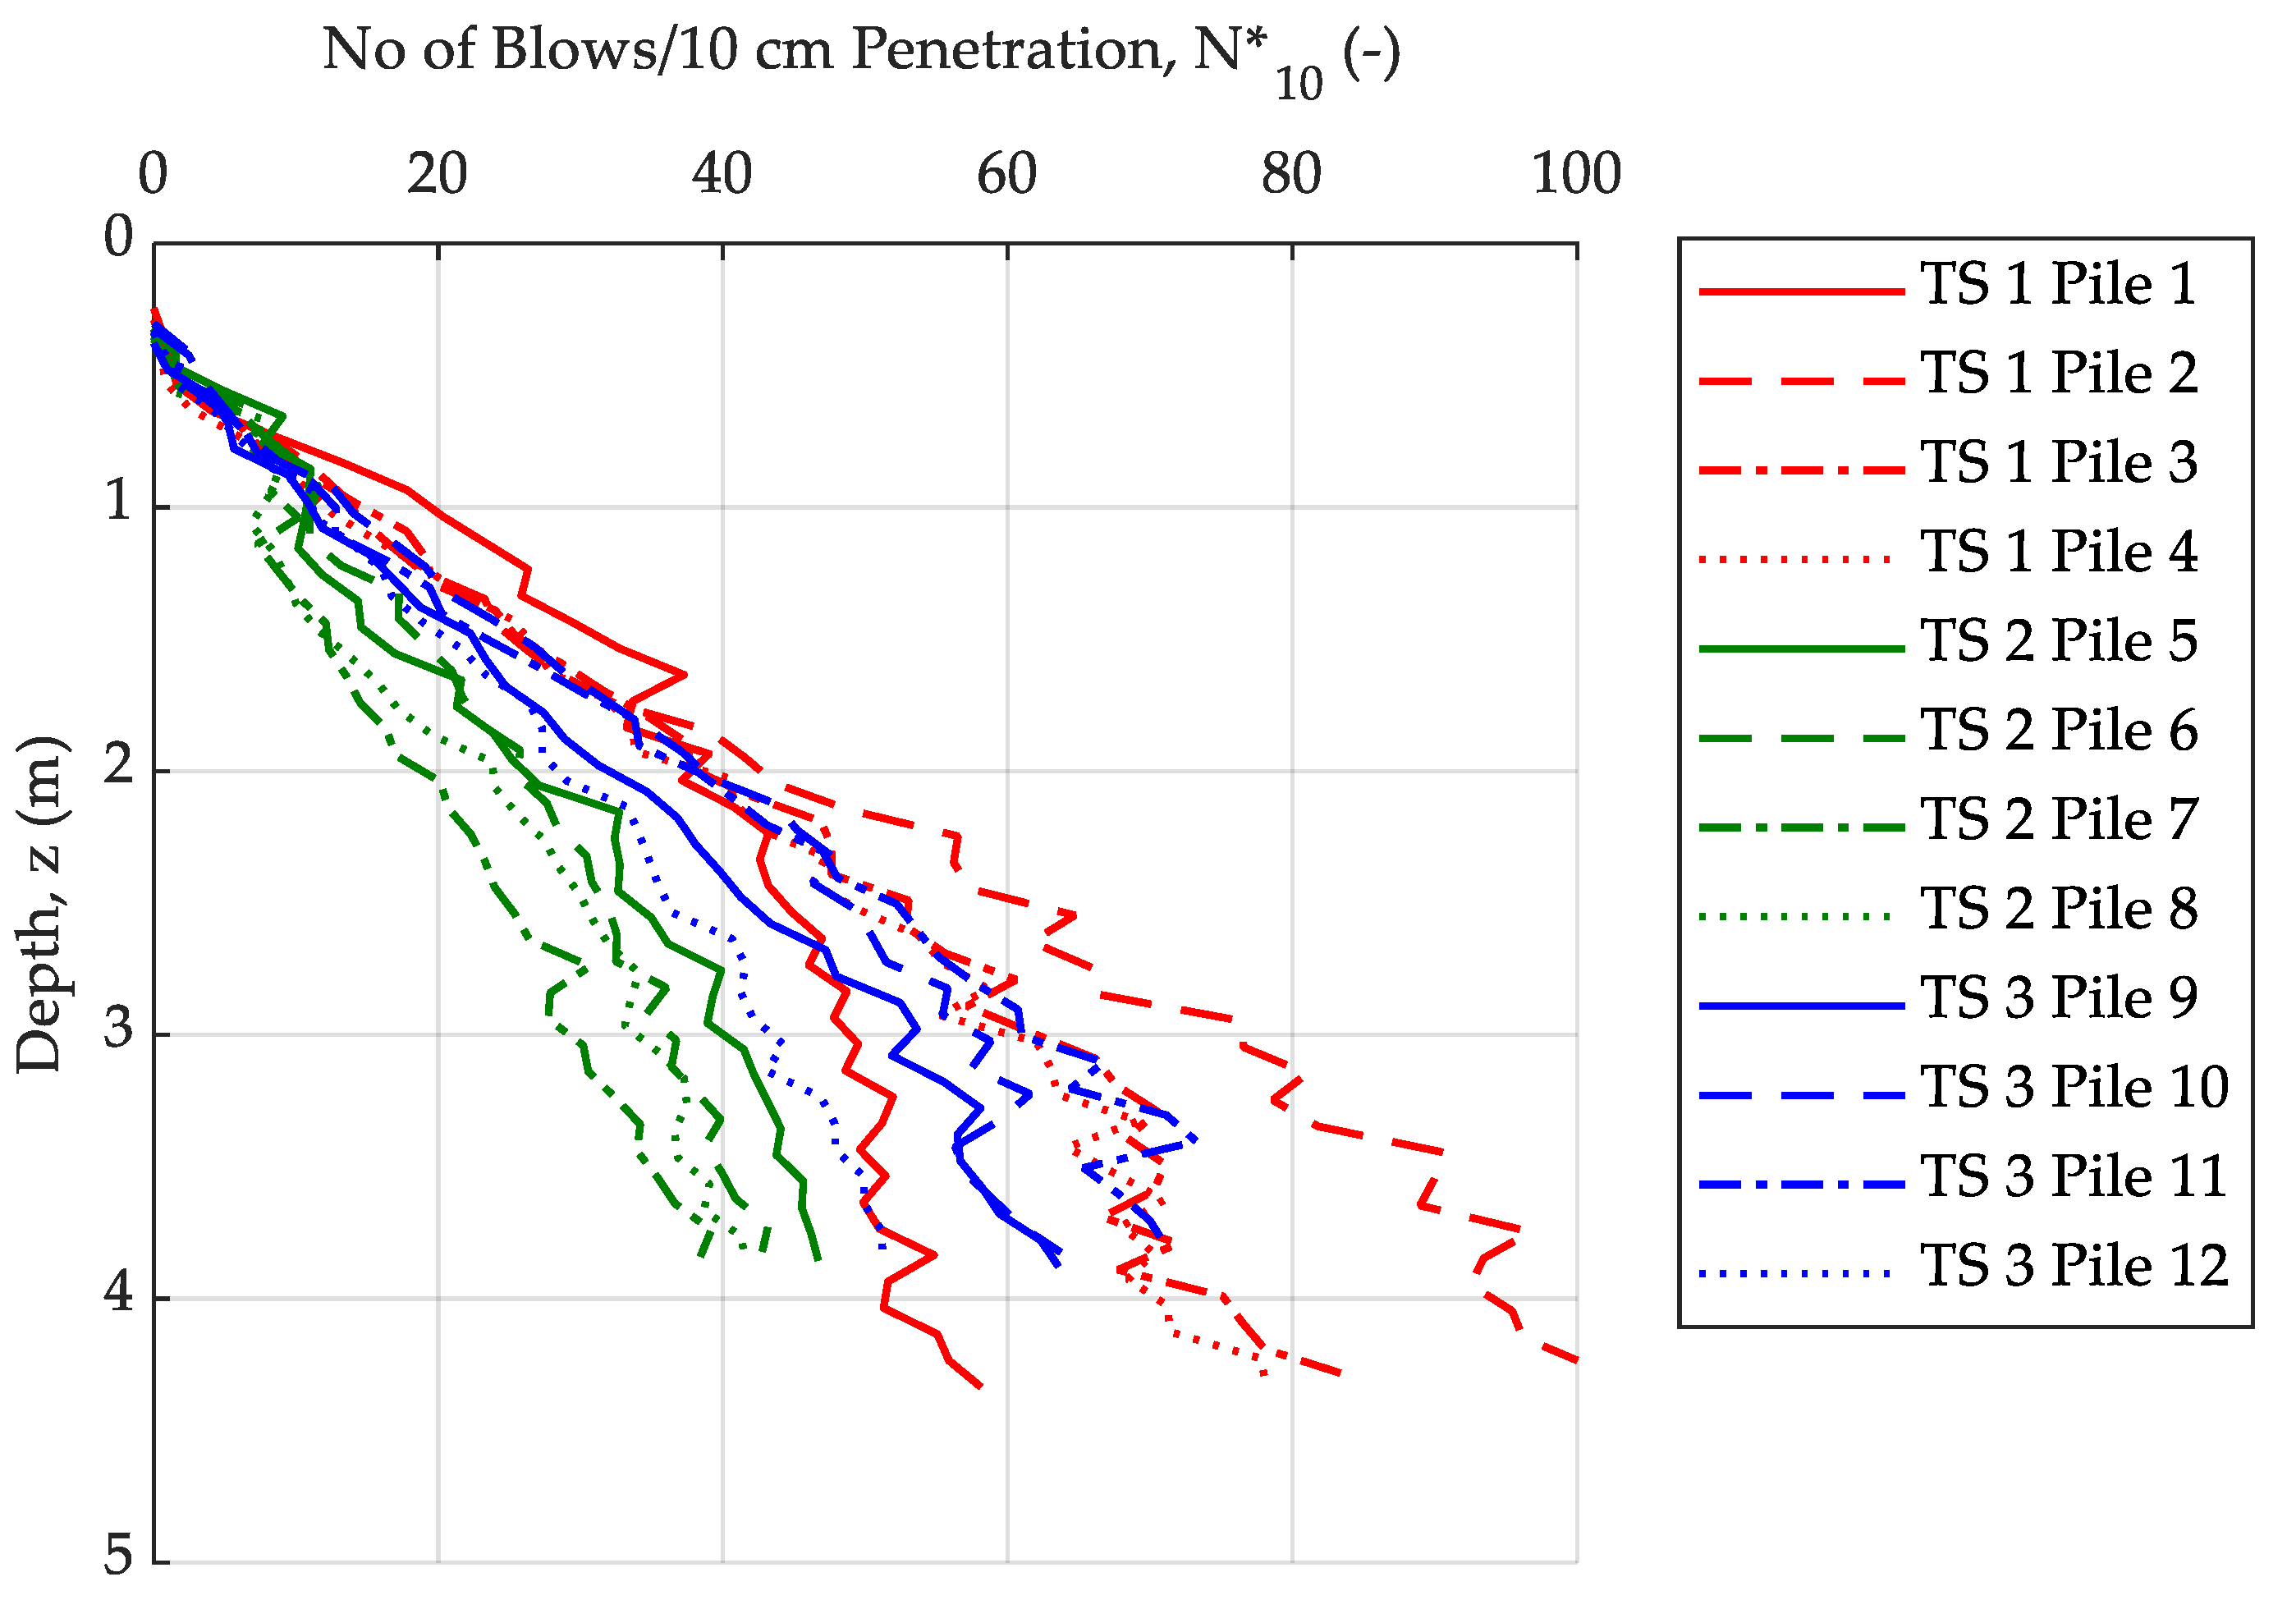
3.1. Pile Installation

Figure 5a shows the progression of pile penetration for pile 12 over the entire pile driving process. The penetration prior to the process of impact driving resulted from the pile penetrating the top-most soil layer due to its own weight and the weight of the hammer. Pile driving was stopped several times to check and possibly adjust the vertical alignment of the pile axis and to check all the sensors and the data recording. Figure 5b shows the axial pile displacement for two consecutive blows in detail. While for each blow the maximum displacement due to the impact is ~4 mm, the permanent axial displacement is only ~2 mm.
Figure 6 shows the number of blows required per 10 cm of pile penetration N 10 * over depth for piles 1–4, 5–8, and 9–12 of each test series. It is noticeable that the recorded blows for piles 9–12 of test series 3 are relatively close to the recorded N 10 * -values that were measured for piles 1–4 of the test series 1, which were driven into sand of a higher relative density. Compared to test series 1 and 3, the N 10 * -values for piles 5–8, installed in test series 2, show a comparably uniform increase with depth. It should be noted that in addition to the relative density of the soil, the efficiency of the pile hammer is also a factor in the interpretation of the results. Changes in lubrication and the associated frictional properties of the piston or irregularities in the air supply along with changing verticality and alignment between the pile and hammer could be an explanation for the different N 10 * values despite relatively similar relative densities.
In order to evaluate the soil plug formation at the end of driving, the mean ground level h f i n a l was measured in the open-ended steel pile. By considering the embedment depth L e , f i n a l , the P L R f i n a l was calculated according to Equation (1). By analyzing the resulting values of the P L R f i n a l (Table 4), a correlation can be drawn between the values of the P L R f i n a l and the number of blows per 10 cm of penetration N 10 * . The fewer blows required, the lower the P L R f i n a l , e x p . Piles 1–4 of test series 1 had the highest initial relative density and show the highest P L R f i n a l values. In general, the results agree with experiences from model tests on the plug formation reported in the literature [11,12]. These have shown that the lower the relative density, the lower the plug height, and, thus, the lower the P L R f i n a l values.
An analytical calculation was performed to assess whether the decrease in height of the inner soil column during driving was the result of compaction or of plug formation. A fictitious soil column with a diameter equal to the inner diameter of the open-ended steel pile was considered. The height of the soil column corresponded to the final penetration depth of the pile. This was 4.3 m in test series 1 and 3.9 m for both test series 2 and 3. The relative density of the sand before pile driving was obtained from the measurements made with the nuclear gauge during the placement of the sand. The change in the height of the fictitious soil column was calculated from the compaction of the measured values of Dr prior to the installation process to the densest soil state D r = 1 in accordance with DIN 18126:2022-10 [37]. It should be noted that it is possible to achieve a denser state of the soil than D r = 1. Table 5 shows the results of the analytical calculations.
In the case of test series 1 and 3, the calculated values of the P L R f i n a l , c a l resulting from the change in relative density are almost identical to the measured values after driving. For the piles in test series 2, the calculated value of the P L R f i n a l , c a l is significantly larger than the experimentally determined value of the P L R f i n a l , indicating that soil plugging actually occurred in piles 5–8. On the contrary, the P L R f i n a l , c a l P L R f i n a l for the open-ended steel piles 1–4 (test series 1) and 9–12 (test series 3) indicates that the compaction of the sand inside the pile (and not plugging) may be responsible for the deviation of h f i n a l , c a l from L e , f i n a l .

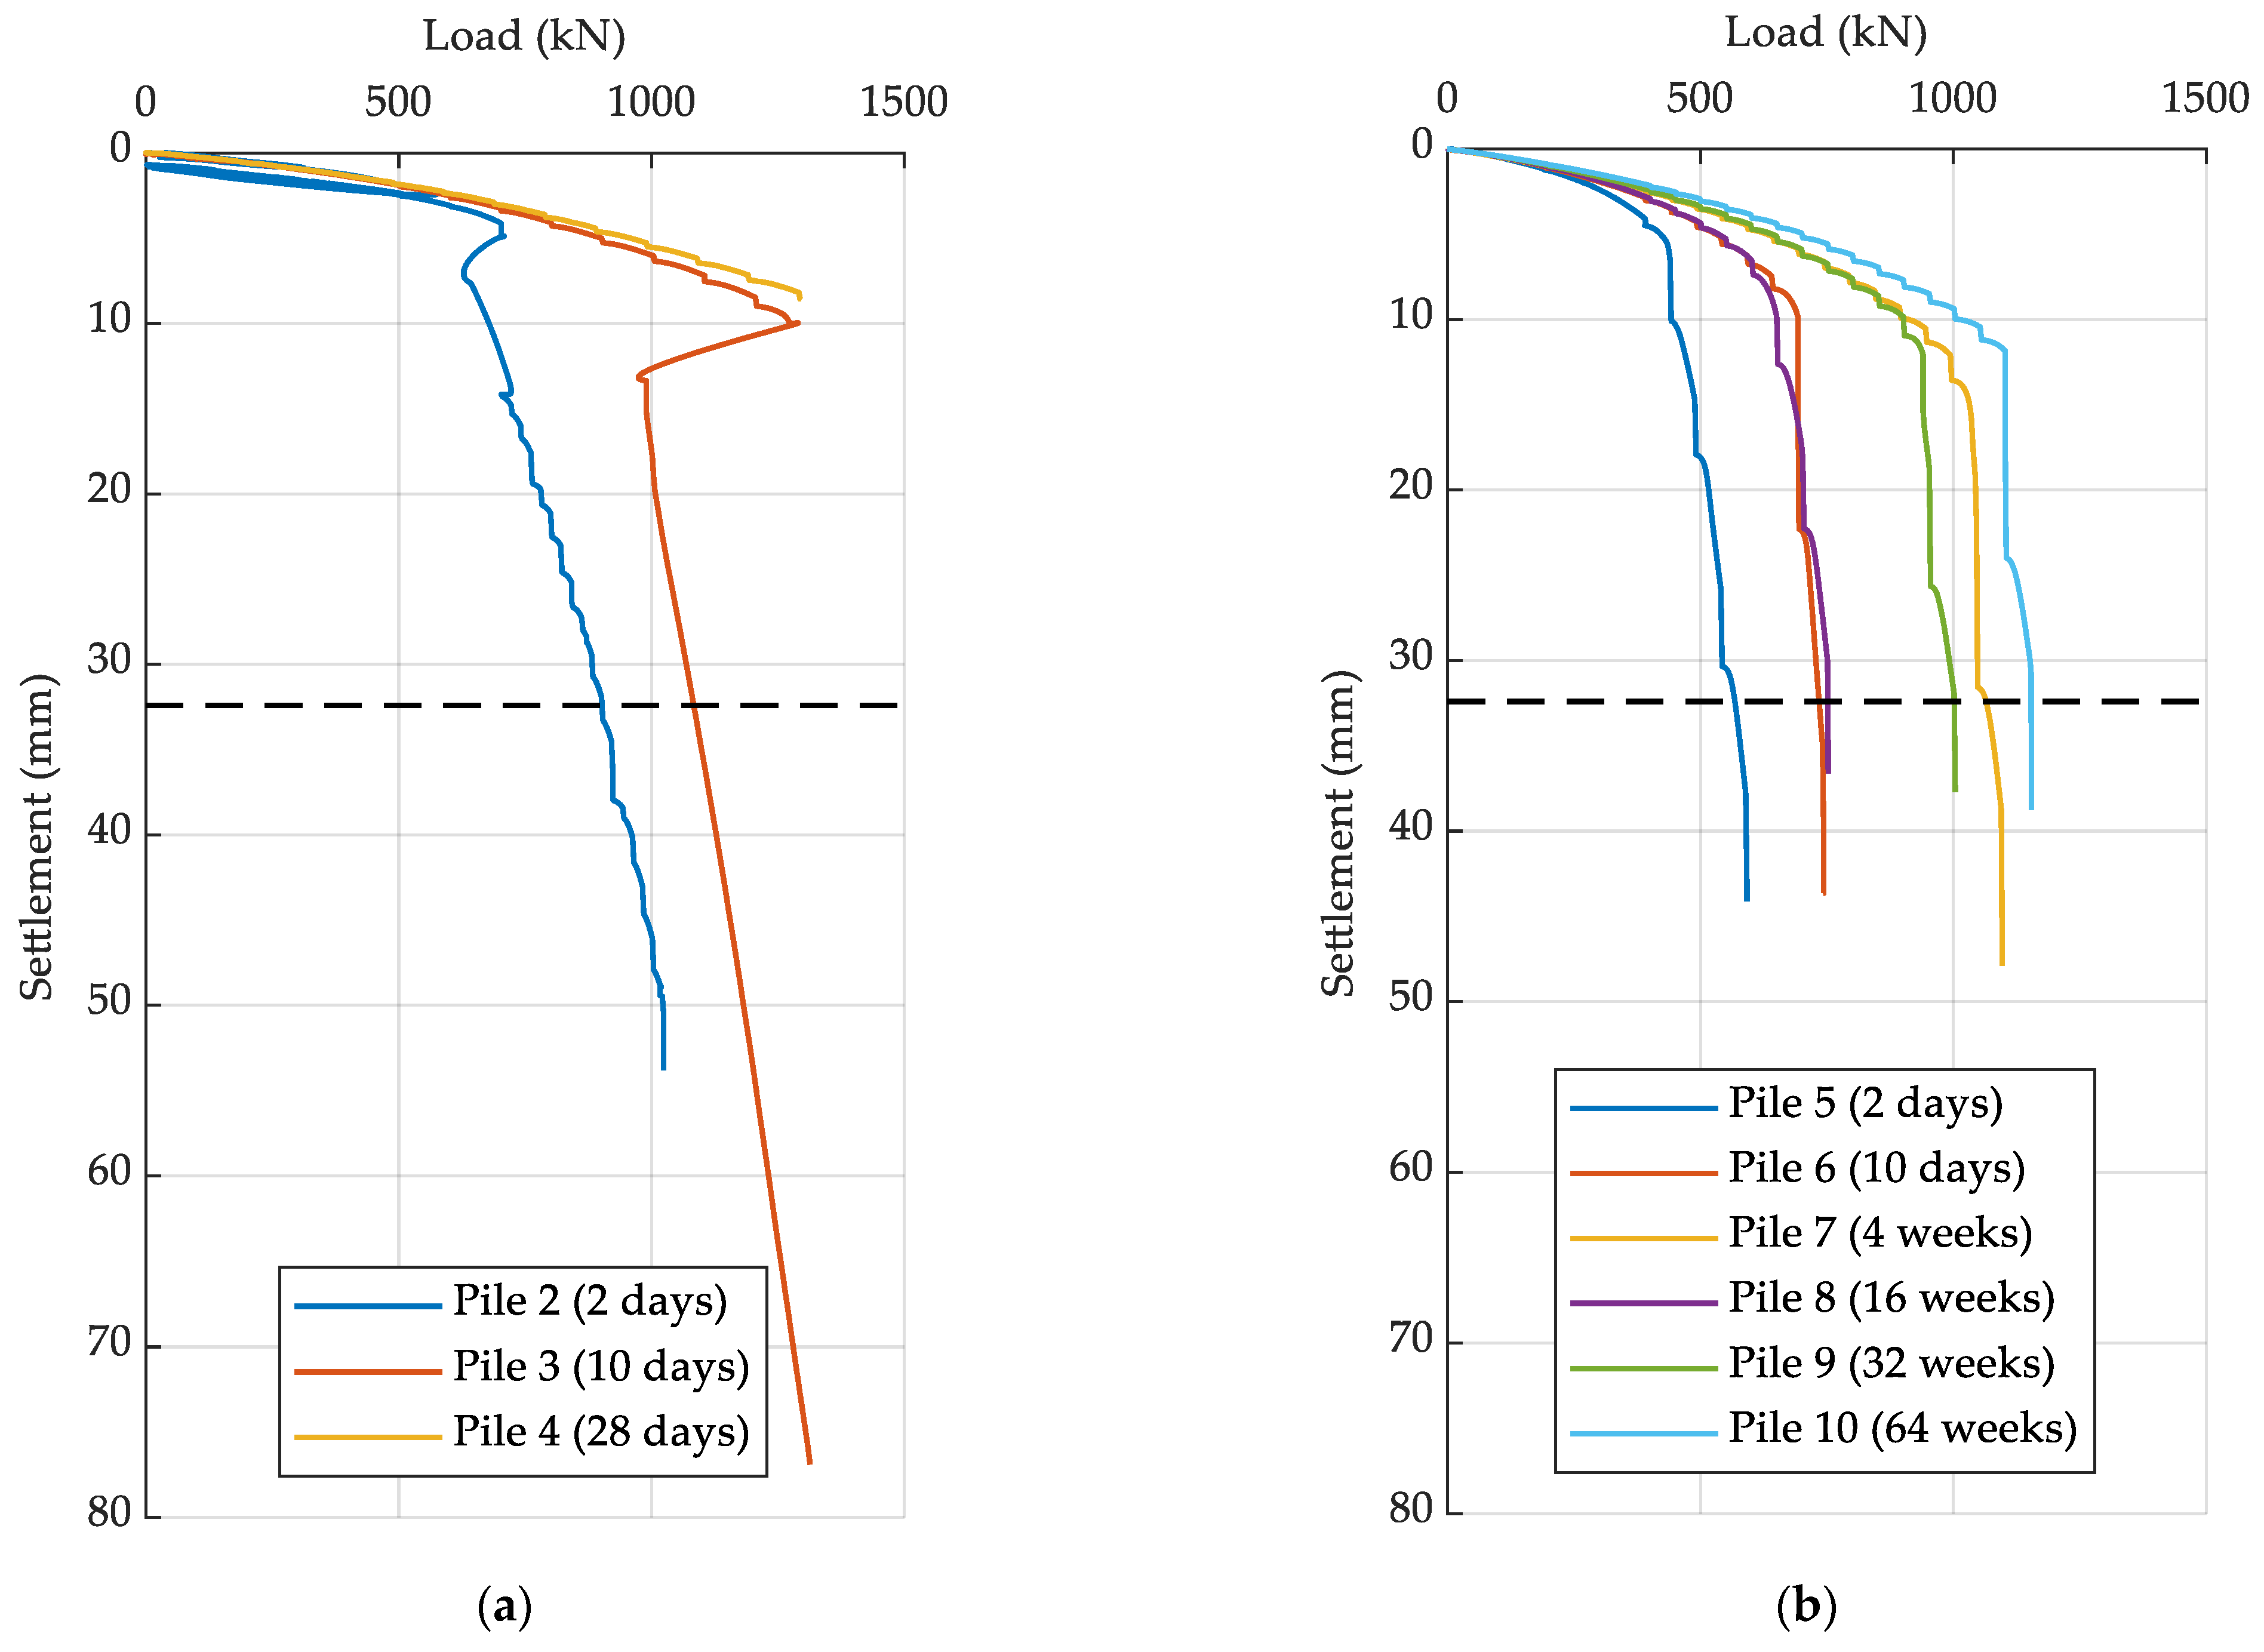
3.2. Static Compression Pile Load Testing

The phenomena of pile ageing have rarely been examined through compression pile load testing. The main reason is that static compression load tests require significantly more effort compared to static tension or dynamic load tests. Therefore, a primary focus of this research was the evaluation of pile ageing through compressive load tests. Figure 7a shows the axial load-displacement curves for piles 2, 3, and 4, loaded by compressive forces 2, 10, and 28 days (4 weeks) after installation. Unfortunately, pile 4 (28 days) could not be loaded to the target value of the axial displacement of the pile head due to a breakage of the ball and cup load introduction. From the data recorded up to the point of failure within the reaction frame, it is clear that pile 4 had the greatest stiffness of the three piles in test series 1 (the data from pile 1 are not plotted and discussed due to the different pile geometry). The results show a trend with regard to the effect of pile ageing in the period of up to 28 days (4 weeks) after installation. After the compression force applied on the pile 2 exceeded 700 kN (displacement at pile head s = 3.4 mm), a sudden drop of the force in combination with a sudden increase of the axial displacement of the pile head occurred. Lüking [12] observed similar behavior when performing loading tests on model piles. This behavior is termed as intermittent plug formation. When the applied compressive force reaches a certain value, a previously formed soil plug may eventually slip along the inner wall. Subsequently, according to the observations of this research and in agreement with [12], a transition from slipping to sticking, meaning the formation of a new soil plug, can occur.
As the test progressed, the load could be increased up to ~900 kN with a significant reduction in stiffness. A similar behavior was observed during the loading of pile 3. The plug failed at ~1300 kN. This caused the resisting force to drop to ~1000 kN. As for pile 2, the interpretation of the test data for pile 3 shows that the tangential pile stiffness defined as the increment of the pile resistance divided by the increment of the axial displacement of the pile head was more than 10 times smaller after the plug slippage than before. In order to investigate the intermittent plug formation, the load test on pile 3 was continued up to an axial displacement of the pile head of 132 mm, which is not displayed in Figure 7a. However, no recurrent soil plug slippage was detected. At the end of each loading test, the change in the height of the soil column situated inside of the open-ended steel pile was measured for all the piles. No change was detected, meaning the Incremental Filling Ratio was zero. By definition, this is an indicator of a fully plugged pile. However, as written before, no conclusions can be drawn about the extent of plug formation and the values of the state variables in the soil column.
Piles 5–10 of test series 2 and 3, characterized by a lower relative density and embedment length compared to test series 1 (piles 1–4), showed a different failure behavior (Figure 7b). No sudden reduction of pile resistance occurred, indicating the possible slippage of a previously formed soil plug. Based on the axial load-displacement curves, Figure 8 shows the pile ageing trend for all the piles, which were first subjected to static compression loading after installation. For clarification, the pile capacity values shown in Figure 8a were determined as the maximum measured axial force acting on the pile head within the range of the axial displacement of the pile head between 0 mm and 33 mm ( 0.1 · D o ). For Figure 8b, the absolute pile capacities Q have been normalized to the initial pile capacity two days after installation, denoted as Q r e f . The normalization of the data shows that the setup trend for test series 1 and 2 (within 28 days/4 weeks) is similar, even though the boundary conditions (relative density and embedment length) are different.
In test series 1, an increase of 80% in the compressive resistance was observed between 2 and 10 days. With regard to the test results of piles 5–10 (test series 2 and 3), two different interpretations of the observed pile ageing are possible:
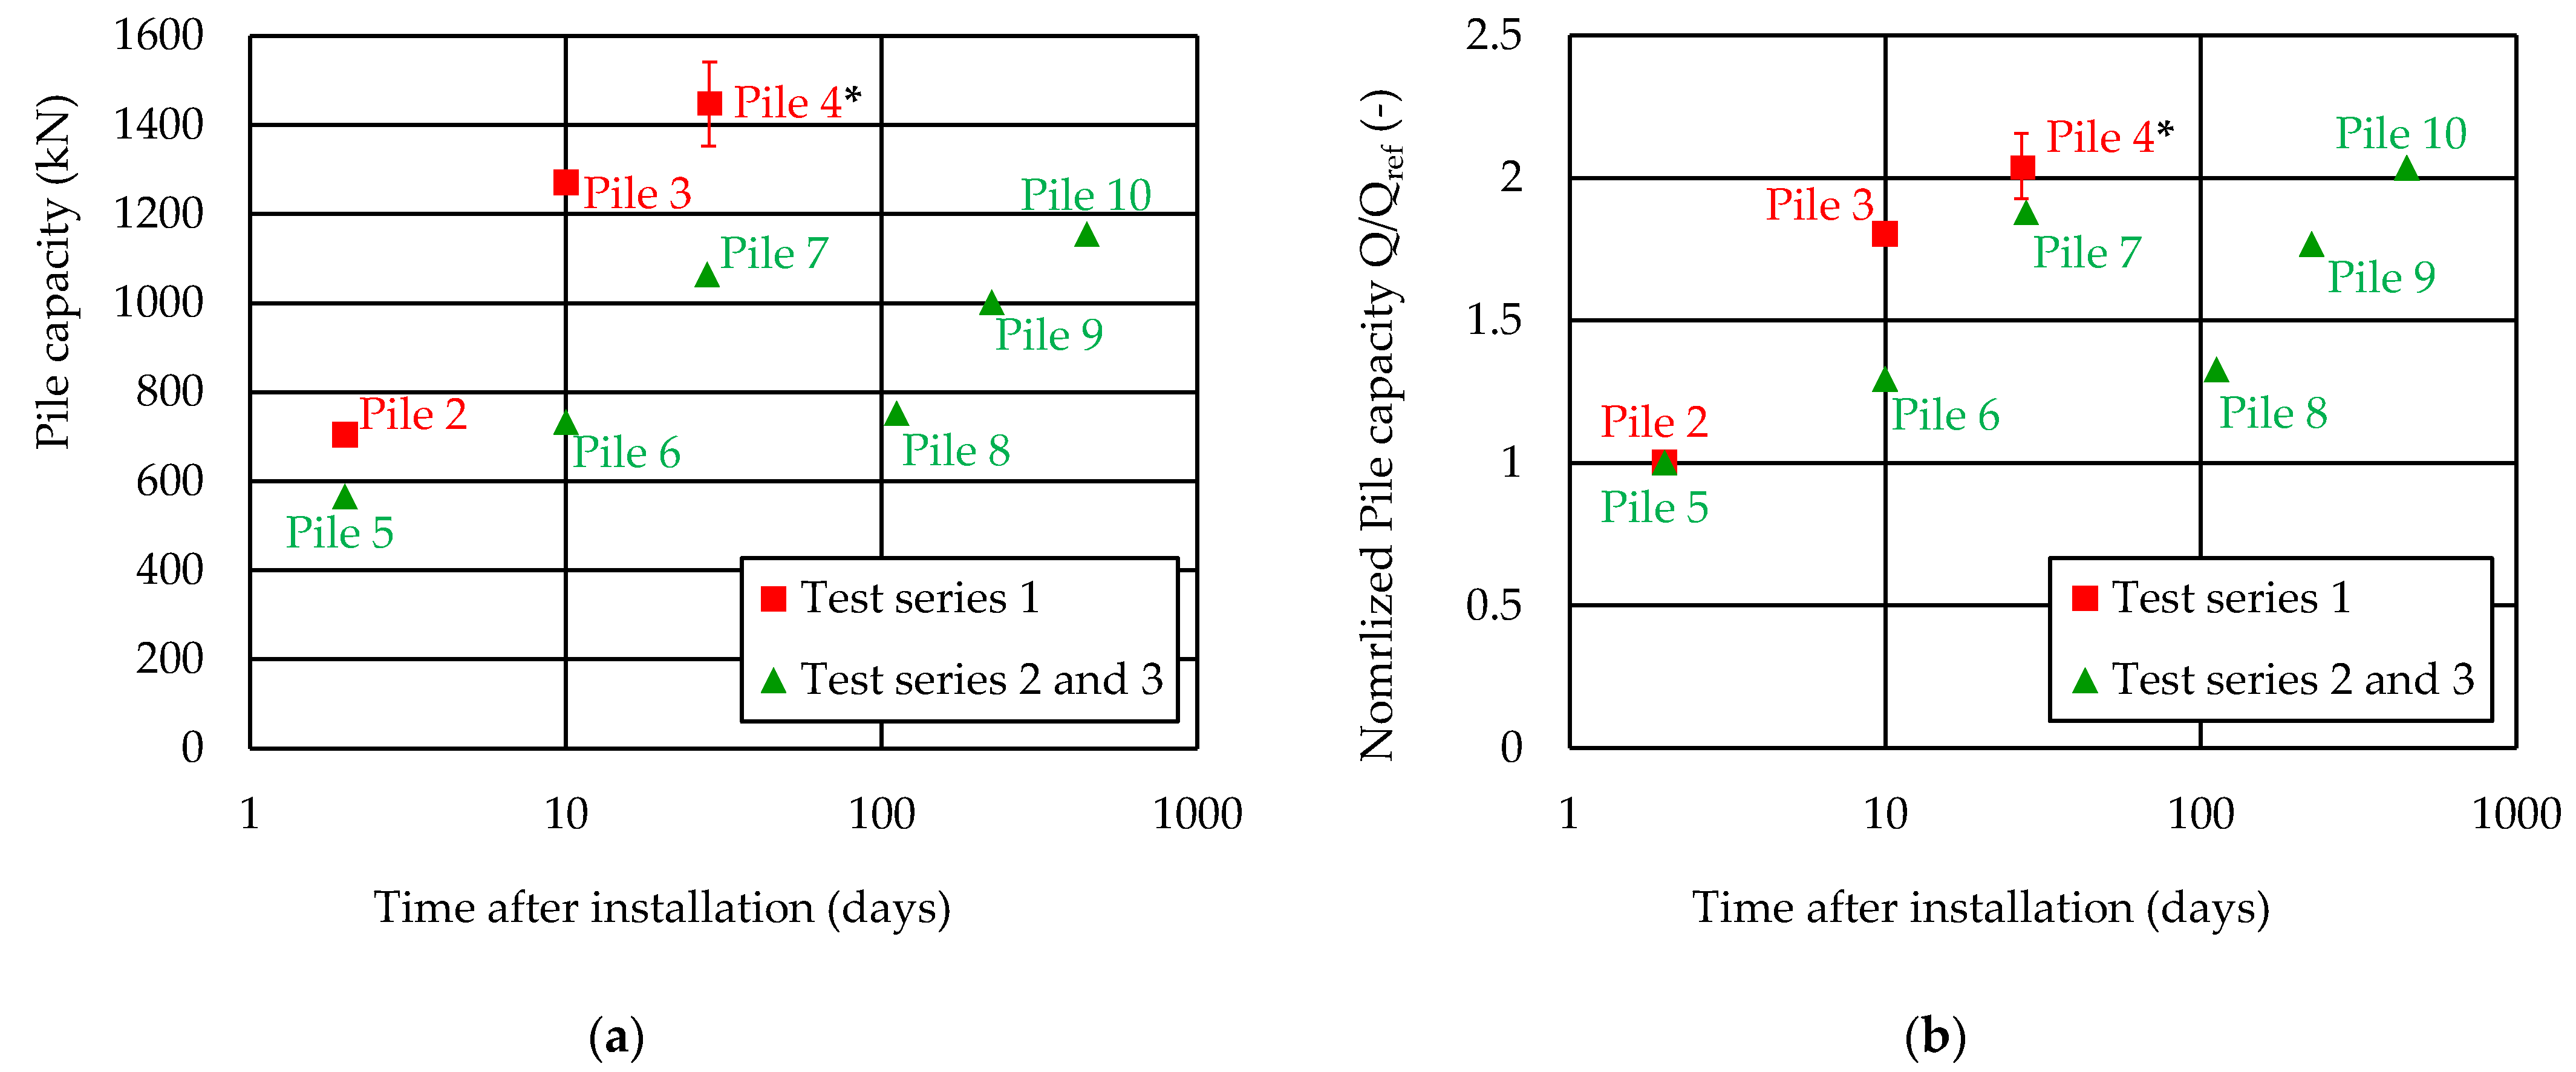
  • The application of a regression line of type a 1 + a 2 · log t using all of the data shown in Figure 8 would correspond to an exponential decrease in the rate at which pile setup evolves with time. By this interpretation, pile 7 (28 days/weeks) is then a clear upward outlier, and pile 8 (16 weeks) is a corresponding downward outlier.
  • Following the suggested second interpretation, the data of pile 7 have a more significant weight. Similar to the approach in [23], it is assumed that after a certain period of time, the rate at which pile ageing evolves with time comes to an almost complete standstill. From this point on, no further increase in the pile resistance was observed. Pile 8 (16 weeks) would still be a blatant downward outlier, whereas pile 10 (64 weeks) would be an upward outlier.
  • Figure 9 shows a comparison of the test data from this study with test data from field tests reported in the literature [7,27,29]. All the tests involved steel pipe piles installed in sandy soils. All the pile load tests are first-time tests. Unlike the first-time compression tests performed in this study, all the other piles were tested under tension only. Again, the absolute pile capacities have been normalized to the initial pile capacity two days after installation. For the tests from the literature, the reference compressive resistance Q r e f was determined by extrapolation.
A regression line can be determined for each test series using interpretation variant 1 (exponential decrease of pile ageing rate):
Q t Q r e f = a 2 · log t
a 2 corresponds to the slope of the regression line, characterizing the rate of pile ageing. The results in Table 6 show that the ageing rates from the piles in this study are in the range of the measurement data from the literature. However, it has to be noted that the results show significant variation. Despite the defined boundary conditions, the pile load tests presented here are no exception.
Table 7 compares the pile resistance measured during the first and second load cycles. Only for the test on pile 5 (2 days), the second loading cycle showed a higher resistance than the resistance observed during the first loading cycle. In the case of pile 8 (16 weeks), the pile resistance was identical for both load cycles. For all the other piles with a longer pile ageing time, there was a reduction in pile resistance during the second load cycle. This loss is particularly pronounced for pile 10, with the longest ageing time of 64 weeks. Obviously, the static penetration during the static compression pile load tests partially cancels out the increase in pile capacity related to pile ageing.
Pile 11 and Pile 12 were primarily subjected to dynamic pile load testing. At the end and after the completion of the dynamic load tests, a static compression pile load test was carried out. Figure 10 shows the corresponding axial load-displacement curves of the first and second loading cycles. The results from pile 10 (64 weeks) without the dynamic load tests are shown for comparison. The pile resistances in the first load cycle of piles 11 and 12, which had been dynamically loaded several times before, are slightly higher than the compressive resistance of pile 6 and significantly lower than the capacities of piles 7, 9, and 10. In contrast to pile 10, piles 11 and 12 achieved significant increases in compressive resistance during reloading. These increases are in the range of the results of the tests on pile 5.
Fiber optical strain sensors bonded to the pile (see Section 2.3) were used to determine the distribution of axial force along the pile axis. To compare the measurements of the axial distribution of the axial force from different compression pile load tests, the data from the strain sensors were normalized in respect to the force applied at the pile head (NTop) for each load step (LS). Figure 11 shows the results for pile 5 (2 days) and pile 7 (28 days/4 weeks) for the first load cycle. At the beginning of the pile load test, the load transfer to the soil occurred mainly through the pile’s outer skin friction above the lowest measurement cross-section, approximately 0.3 m from the pile base. As the compressive load increased, the pile increasingly mobilized resistance below the lowest measurement level. Thus, the contribution of the pile base to the load transfer from the pile to the soil gradually increased as the compressive forces acting on the pile head increased. In addition to the outer skin friction, these components include the annular base resistance and the inner skin friction due to soil plugging. These observations are consistent with the load transfer mechanism described in [38]. Accordingly, skin friction is mobilized predominantly at the shaft of the upper part of the pile for comparatively low compressive forces. Resistance at the pile base is only activated when sufficient axial displacement of the pile head has occurred. At the pile base, sand penetrates into the interior of the open-ended pile, leading to possible compaction and soil plug formation.
The results make it possible to evaluate the evolution of the load transfer mechanism during the period of pile ageing. The key finding is that the contribution of the resistance above and below the lowest measuring cross-section to the change of the total resistance due to pile ageing is relatively equal.
Generally, the axial load distribution measured during the pile load test does not allow a distinction to be made between inner and outer skin friction. Despite this, in [22] a suggestion is made regarding how to achieve a division of the pile resistance components (Figure 12). In the case of plug formation, the inner skin friction acts almost exclusively in the active part of the plug in the area of the pile base (below point D). Under the assumption of a linear distribution of outer and inner skin friction, points A and B can be found by extrapolation. The force remaining at point A then corresponds to the annular base resistance.
As an example, a separation of the resistance components was made based on the axial force distribution evaluated during the compression test of pile 6 when a load of 740 kN was reached (Figure 13a). The outer pile casing friction was initially determined using common empirical prediction methods:
  • Design method according to Lüking published in the recommendations on piling (EAP) from the German Geotechnical Society [39];
  • Imperial College pile design methods for driven piles in sands and clays (ICP) [40];
  • University of Western Australia’s design method for open- and closed-ended driven piles in siliceous sand (UWA) [13];
  • Unified CPT-based axial pile capacity design method for driven piles in sand (unified) [41].
The most important input variable of the prediction methods is the tip resistance from cone penetration testing. Since pile 6 was installed in test series 2, the corresponding CPT profile is curve “TS 2” in Figure 3a. Figure 13b shows the calculated outer skin friction curves. Using the outer skin friction curve, an axial load distribution can be calculated for each prediction method. The best agreement with the measurement data was achieved using the EAP profile. The distribution of the inner skin friction cannot be determined by any of the prediction methods. However, the measurement data in [19] and the numerical results in [12] offer a good indication of how it looks. Based on this, the curve shown in Figure 13c was constructed through iterative fitting. By considering the curves for both inner and outer skin friction, the calculated axial load distribution in Figure 13a can be determined. Another criterion that must be satisfied is that the combined resistance of all the components matches the force applied to the pile head ( F m a x = 740 kN). The annular base resistance can be calculated, as suggested in the ICP method, by multiplying the tip resistance from cone penetration testing with the cross-sectional area of the pile. Figure 13d shows that the sum of all the resistance components determined by the described procedure does not fully match the applied force. Further iteration steps could improve the result.

3.3. Static Tension Pile Load Testing

Static tension pile load tests were performed at the end of each test series (see Table 1). All the piles had already undergone static compression load tests, meaning none of the static tension pile load tests were first-time load tests. Therefore, the loading history of the piles since installation must be considered when interpreting the results. Table 8 compares the resistance determined from the static tension pile load tests with the resistance determined from the compression load tests. The time since installation and the time since the previous compression load tests provided for interpreting the pile ageing behavior that may affect the static tension pile load tests. For all the piles, the tensile resistance specified in the table corresponds to the maximum force measured during the static tension pile load test. For piles 1–8, this force corresponds to the resistance at the ultimate limit state (ULS). In the static tension pile load tests on piles 9, 10, 11 and 12, the applied displacement was not sufficient to finally reach the ultimate limit state. The specified resistances are therefore slightly below the loads of the piles in the ULS.
Piles 2 and 3, installed in test series 1, exhibited significantly higher resistance values in the tension test compared to all the other piles, despite the time since installation being rather short. When comparing test series 1 with test series 2 and 3, the results of the tension tests are dominated by the influence of the relative density, which was lower in test series 2 and 3 than in test series 1. Despite the significantly longer time since installation, piles 9 and 10 did not show larger resistances than piles 5–8. The results of the load tests on piles 9 and 10 suggest that the time elapsed after the compression load testing had no significant influence. In contrast, the ratios Qt/Qc of piles 5, 6, and 7 do show an influence from the time since the last compression test. Pile 8, already identified as a downward outlier in relation to the results of the compression load test, also had the lowest tensile resistance. Figure 14 shows the reason for this.
Pile 8 mobilized skin friction almost exclusively in the area below the lowest measurement level close to the pile base. In contrast, pile 7 showed a uniform distribution of the skin friction. As the tensile force increases, the load transfer is redistributed, and the upper part of the pile takes a higher share of the tensile forces. For the sake of a comparison between different loading steps within a single load test, as well as for a comparison between the tested piles, the values of the measured axial force are related to the maximum force measured at the pile head.

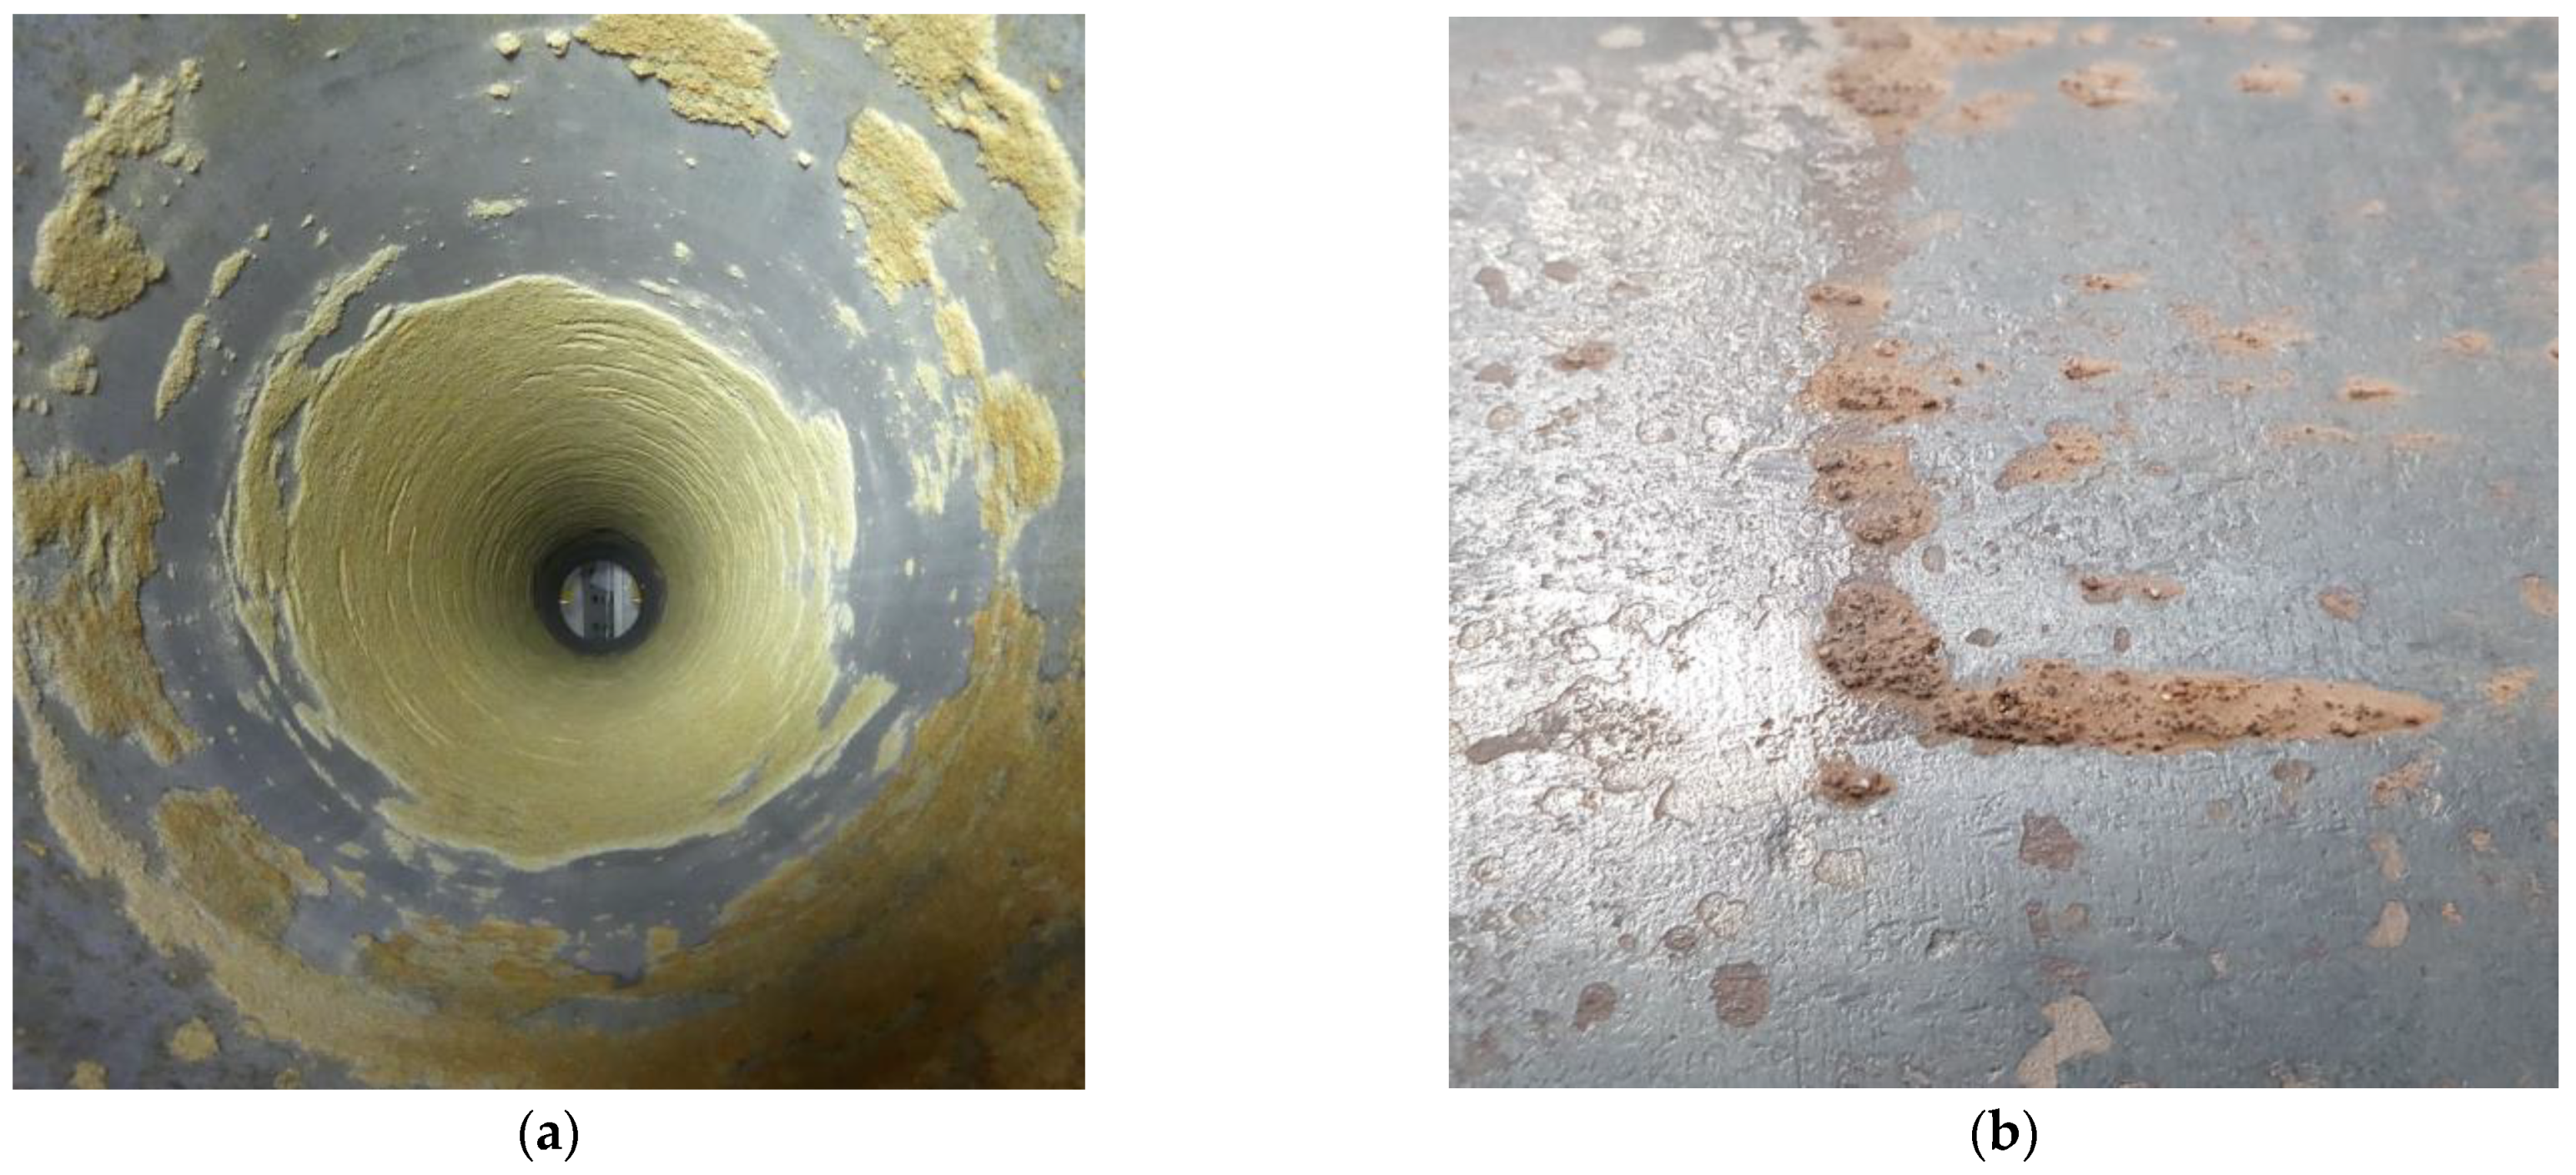
3.4. Macroscopic Analysis of Piles after Extraction

After completing the load tests of test series 1 and 2, the piles had to be removed. During the process of removing the tested piles, the soil inside each pile was initially stuck due to soil plugging. The open-ended steel piles were then struck against the wall of the test pit to dislodge the soil. Numerous areas of sand particles remained adhered to the inner and outer pile surfaces (Figure 15a). At the pile base, these consisted mainly of sand grains broken to varying degrees. As noted by [27], different layers could be identified within the sand that partially adhered to the pile. The adhesion of the first layer, shown in Figure 15b, was comparatively strong. The sand grains within this layer were difficult to remove, even by the use of a sandpaper. It can be assumed that chemical reactions between steel, sand, and water are responsible for the incrustations and the strong adhesion between the grains and the steel surface. The partially saturated conditions with a good availability of oxygen favor corrosion processes. A concentration of incrustations around the pile toe also indicated that high pressures and grain breakage enhanced the chemical reaction. On the other hand, the mill scale layer present on the steel surface in some areas acted as a kind of corrosion protection, preventing the formation of adhesive bonds between the grains and the steel.

4. Summary and Conclusions

In order to investigate the time-dependent resistance of open-ended steel piles in sand, large-scale pile load testing was conducted under well-defined and controlled boundary conditions. In three test series of four piles each, a uniformly graded medium silica sand was placed in an 8 m deep test pit. The sand was compacted in layers using a vibratory plate. Dry density measurements, cone penetration tests, and heavy dynamic probing tests were used to control the initial density of the soil. A total of twelve open-ended steel pipe piles ( L = 5.5 m, D o = 325 mm, t = 12.5 mm) were driven into the wet, densely packed sand using a pneumatic hammer. Static and dynamic pile load tests were conducted after the piles had been in place for varying time periods after installation. This study focuses on the results of the static compression and tension load tests.
In the static compression pile load tests, a doubling of the compressive resistance was observed within 64 weeks. The piles tested in test series 1, with the sand having a slightly higher initial relative density, showed an even more pronounced pile ageing. Axial strain measurements on the piles at multiple levels along the pile axis led to the conclusion that the increase in capacity resulted from a comparatively uniform increase in the skin friction as well as the resistance components below the lowest measurement level over time.
One cause for pile ageing already known from the literature was observed during the removal of the piles after completing a test series. Physical–chemical effects, like corrosion, at the pile surface cause a layer of sand to be adhesively bound to the surface of the pile. The strength of this layer was seemingly high. This may lead to an increase of the friction at the interface between the pile surface and the adjacent soil. Additionally, the properties of the sand in the shear zone changed due to the convective transport by solution and the dissolution of corrosion products. The partially saturated conditions with the availability of oxygen, the mechanism of grain breakage, and high pressure seems to intensify the corrosion process as well as the convective transport of corrosion products into the soil further away from the pile surface. The mill scale resulting from the production of the open-ended steel pile inhibited corrosion. The proportion of the change in resistance due to the corrosion processes in relation to other causes for pile setup mentioned in the literature could not be determined within the scope of this work.
During the pile driving and the compression pile load tests, the height of the soil column inside the pile, termed as plug height, was observed. Based on measurements and theoretical considerations, it was demonstrated that the reduction of the mentioned height during driving is due to both soil compaction as a result of the dynamic impacts and soil plugging at the pile base. During the static pile load tests, no change in the height of the internal soil column was detected. Nevertheless, the measurement data indicate that soil plugging must have occurred close to the pile base. In particular, during the compression load tests in test series 1 (very dense soil state), a characteristic abrupt slippage of the pile was observed. Overall, these test results support the hypothesis of an intermittent soil plug formation near to the pile base. The authors of this study agree with [17] that the commonly used parameters P L R (Plug Length Ratio) and I F R (Incremental Filling Ratio) are not solely suitable for assessing the extent of soil plugging.
The results of various pile load tests presented in this study provide further evidence of the increase in pile capacity over time. It would be of great benefit to engineering practice if this effect could be reliably integrated into design practice. The consideration of this effect can lead to a more efficient and resource-saving design of pile foundations. However, a comparison with other field tests on pile ageing shows significant variability in the time-dependent increase in load-bearing capacity, which is most likely dependent on conditions such as the soil type, pile geometry, and installation process. The underlying mechanisms and causes are complex, and the tests discussed in this paper are limited to the particular uniformly graded, densely compacted silica sand under partially saturated conditions and the open-ended steel pipe piles investigated.
The load tests performed will be further evaluated in terms of a model simulating the boundary value problem. For this purpose, a comprehensive series of laboratory tests, including interface shear tests, were carried out that will be used for model calibration and validation.
The signal analysis during impact driving and the executed dynamic pile load tests will allow the comparison between the pile resistance derived from different methods interpreting the dynamic measurements and the resistance determined by the conducted static pile load tests. The acceleration and strain gauge measurements not only applied at the pile head but also along the pile axis allow a fundamental analysis of the wave characteristics and energy transfer from the tested piles to the soil.

Author Contributions

Conceptualization and methodology: S.M., S.V. and R.C.; conducting experiments, the data analysis, visualization, and writing—original draft preparation: S.M.; supervision and writing—review and editing: S.V., R.C. and M.K.; supervision and resources: S.V. and R.C.; fund acquisition: S.V., R.C. and M.K.; project administration S.V. and M.K. All authors have read and agreed to the published version of the manuscript.

Funding

Federal Waterways Engineering and Research Institute (BAW) funded this research as part of the project no. B3952.06.04.70378.

Data Availability Statement

The data of this study are available from the corresponding author upon request.

Conflicts of Interest

The authors declare no conflicts of interest. The funders had no role in the design of the study; in the collection, analyses, or interpretation of data; in the writing of the manuscript; or in the decision to publish the results.

References

  1. Lehane, B.M.; Jardine, R.J.; Bond, A.J.; Frank, R. Mechanisms of Shaft Friction in Sand from Instrumented Pile Tests. J. Geotech. Eng. 1993, 119, 19–35. [Google Scholar] [CrossRef]
  2. Altaee, A.; Evgin, E.; Fellenius, B.H. Axial load transfer for piles in sand. II. Numerical analysis. Can. Geotech. J. 1992, 29, 21–30. [Google Scholar] [CrossRef]
  3. Bullock, P.J.; Schmertmann, J.H.; McVay, M.C.; Townsend, F.C. Side Shear Setup. I: Test Piles Driven in Florida. J. Geotech. Geoenviron. Eng. 2005, 131, 292–300. [Google Scholar] [CrossRef]
  4. Bowman, E.T.; Soga, K. Mechanisms of setup of displacement piles in sand: Laboratory creep tests. Can. Geotech. J. 2005, 42, 1391–1407. [Google Scholar] [CrossRef]
  5. Åstedt, B.; Weiner, L.; Holm, G. Increase in bearing capacity with time for friction piles in silt and sand. In Proceedings of the Nordic Geotechnical Meeting, Lyngby, Denmark, 28–30 May 1992. [Google Scholar]
  6. Zhang, Z.; Wang, Y.H. Examining Setup Mechanisms of Driven Piles in Sand Using Laboratory Model Pile Tests. J. Geotech. Geoenviron. Eng. 2015, 141, 04014114. [Google Scholar] [CrossRef]
  7. Jardine, R.J.; Standing, J.R.; Chow, F.C. Some observations of the effects of time on the capacity of piles driven in sand. Géotechnique 2006, 56, 227–244. [Google Scholar] [CrossRef]
  8. Jardine, R.J.; Chow, F.C. Some Recent Developments In Offshore Pile Design. In Proceedings of the Offshore Site Investigation and Geotechnics Conference, London, UK, 11–13 September 2007. [Google Scholar]
  9. Paikowsky, S.G.; Whitman, R.V. The effects of plugging on pile performance and design. Can. Geotech. J. 1990, 27, 429–440. [Google Scholar] [CrossRef]
  10. Isemoto, N.; Kishida, H. Behavior of Sand Plugs in Open-End Steel Pipe Piles. In Proceedings of the 9th International Conference on Soil Mechanics and Foundation Engineering, Tokyo, Japan, 10–15 July 1977; pp. 601–604. [Google Scholar]
  11. Seo, H.; Kim, M. Soil plug behaviour of open-ended pipe piles during installation. DFI J. J. Deep. Found. Inst. 2017, 11, 128–136. [Google Scholar] [CrossRef]
  12. Lüking, J. Tragverhalten von offenen Verdrängungspfählen unter Berücksichtigung der Pfropfenbildung in nichtbindigen Böden. Ph.D. Thesis, Universität Kassel, Kassel, Germany, 2010. [Google Scholar]
  13. Lehane, B.M.; Schneider, J.A.; Xu, X. Development of the UWA-05 Design Method for Open and Closed Ended Driven Piles in Siliceous Sand. In Contemporary Issues in Deep Foundations; Laefer, D.F., Camp, W., Castelli, R., Paikowsky, S., Eds.; Geo-Denver: Denver, CO, USA, 2007; pp. 1–10. ISBN 978-0-7844-0902-2. [Google Scholar]
  14. Henke, S.; Grabe, J. Field measurements regarding the influence of the installation method on soil plugging in tubular piles. Acta Geotech. 2013, 8, 335–352. [Google Scholar] [CrossRef]
  15. Paik, K.-H.; Lee, S.-R. Behavior of soil plugs in open—Ended model piles driven into sands. Mar. Georesour. Geotechnol. 1993, 11, 353–373. [Google Scholar] [CrossRef]
  16. Brucy, F.; Meunier, J.; Nauroy, J.-F. Behaviour of a pile plug in sandy soils during and after driving. In Proceedings of the Offshore Technology Conference, Houston, TX, USA, 6–9 May 1991; pp. 145–154. [Google Scholar]
  17. Henke, S. Untersuchungen zur Pfropfenbildung infolge der Installation Offener Profile in Granularen Böden. Habilitation; Technische Universität Hamburg-Harburg: Hamburg, Germany, 2013. [Google Scholar]
  18. Randolph, M.F.; Leong, E.C.; Houlsby, G.T. One-dimensional analysis of soil plugs in pipe piles. Géotechnique 1991, 41, 587–598. [Google Scholar] [CrossRef]
  19. Ko, J.; Jeong, S. Plugging effect of open-ended piles in sandy soil. Can. Geotech. J. 2015, 52, 535–547. [Google Scholar] [CrossRef]
  20. Guo, Y.; Yu, X.B. Design and analyses of open-ended pipe piles in cohesionless soils. Int. J. Geo-Eng. 2016, 10, 22–29. [Google Scholar] [CrossRef]
  21. Liu, J.; Duan, N.; Cui, L.; Zhu, N. DEM investigation of installation responses of jacked open-ended piles. Acta Geotech. 2019, 14, 1805–1819. [Google Scholar] [CrossRef]
  22. Kikuchi, Y.; Morikawa, Y.; Sato, T. Plugging mechanism of open-ended piles. In Proceedings of the 17th International Conference on Soil Mechanics and Geotechnical Engineering, Alexandria, Egypt, 5–9 October 2009; pp. 1370–1373, ISBN 9781607505082. [Google Scholar]
  23. Karlsrud, K. Time Effects on Pile Capacity: Summary and Evaluation of Pile Test Results; Final report; Norwegian Geotechnical Institute: Oslo, Norway, 2013. [Google Scholar]
  24. Ng, K.W.; Roling, M.; AbdelSalam, S.S.; Suleiman, M.T.; Sritharan, S. Pile Setup in Cohesive Soil. I: Experimental Investigation. J. Geotech. Geoenviron. Eng. 2013, 139, 199–209. [Google Scholar] [CrossRef]
  25. Chow, F.; Jardine, R.J.; Brucy, F.; Nauroy, J. Effects of Time on Capacity of Pipe Piles in Dense Marine Sand. J. Geotech. Geoenviron. Eng. 1998, 124, 254–264. [Google Scholar] [CrossRef]
  26. Axelsson, G. Long-Term Set-Up of Driven Piles in Sand. Ph.D. Thesis, Kungliga Tekniska Högskolan, Stockholm, Schweden, 2000. [Google Scholar]
  27. Gavin, K.G.; Igoe, D.; Kirwan, L. The effect of ageing on the axial capacity of piles in sand. Proc. Inst. Civ. Eng. Geotech. Eng. 2013, 166, 122–130. [Google Scholar] [CrossRef]
  28. Anusic, I.; Lehane, B.M.; Eiksund, G.R.; Liingaard, M.A. Evaluation of installation effects on set-up of field displacement piles in sand. Can. Geotech. J. 2019, 56, 461–472. [Google Scholar] [CrossRef]
  29. Bittar, E. Design and Optimization of Displacement Piles for Onshore and Offshore Application. Ph.D. Thesis, The University of Western Australia, Perth, Australia, 2022. [Google Scholar]
  30. Busch, A.V. Principles of the Axial Pile Setup. Ph.D. Thesis, University of Bremen, Bremen, Germany, 2022. [Google Scholar]
  31. Bhattacharya, S.; Carrington, T.; Aldridge, T. Observed increases in offshore pile driving resistance. Proc. Inst. Civ. Eng. Geotech. Eng. 2009, 162, 71–80. [Google Scholar] [CrossRef]
  32. Kirwan, L. Investigation into Ageing Mechanisms for Axially Loaded Piles Driven in Sand. Ph.D. Thesis, University College Dublin, Dublin, Ireland, 2015. [Google Scholar]
  33. Jessen, B.A.-M.; Cudmani, R.; Vogt, S. Creep and ageing of granular materials under isotropic pressure. Acta Geotech. 2024, 19, 1999–2012. [Google Scholar] [CrossRef]
  34. Levin, F.; Vogt, S.; Cudmani, R. Time-dependent behaviour of sand with different fine contents under oedometric loading. Can. Geotech. J. 2019, 56, 102–115. [Google Scholar] [CrossRef]
  35. Gavin, K.; Igoe, D. A Field Investigation into the Mechanisms of Pile Ageing in Sand. Géotechnique 2021, 71, 120–131. [Google Scholar] [CrossRef]
  36. Lehane, B.M.; Schneider, J.A.; Lim, J.K.; Mortara, G. Shaft Friction from Instrumented Displacement Piles in an Uncemented Calcareous Sand. J. Geotech. Geoenviron. Eng. 2012, 138, 1357–1368. [Google Scholar] [CrossRef]
  37. DIN 18126:2022-10; Baugrund, Untersuchung von Bodenproben—Bestimmung der Dichte Nicht Bindiger Böden bei Lockerster und Dichtester Lagerung. Beuth Verlag GmbH: Berlin, Germany, 2022.
  38. Liu, J.; Guo, Z.; Han, B. Load Transfer of Offshore Open-Ended Pipe Piles Considering the Effect of Soil Plugging. J. Mar. Sci. Eng. 2019, 7, 313. [Google Scholar] [CrossRef]
  39. Moormann, C.; Kempfert, H.-G. Jahresbericht 2014 des Arbeitskreises “Pfähle” der Deutschen Gesellschaft für Geotechnik (DGGT). Bautechnik 2014, 91, 922–932. [Google Scholar] [CrossRef]
  40. Jardine, R. ICP Design Methods for Driven Piles in Sands and Clays; Thomas Telford Ltd.: London, UK, 2005; ISBN 9780727732729. [Google Scholar]
  41. Lehane, B.M.; Liu, Z.; Bittar, E.; Nadim, F.; Lacasse, S.; Jardine, R.; Carotenuto, P.; Rattley, M.; Gavin, K.; Haavik, J. A New ‘Unified’ CPT-Based Axial Pile Capacity Design Method for Driven Piles in Sand. In Proceedings of the Fourth International Symposium on Frontiers in Offshore Geotechnics, Austin, TX, USA, 28–31 August 2022; Deep Foundations Institute, Ed.; Deep Foundations Institute: Hawthorne, NJ, USA, 2022; pp. 462–477. [Google Scholar]
Figure 1. (a) Side view of the test pit illustrating the position of the piles examined by test series 1. (b) Top view test pit.
Geotechnics 04 00050 g001
Figure 2. (a) Relative density, D r , and (b) water content, w , over depth.
Geotechnics 04 00050 g002
Figure 3. (a) q c as a result of cone penetration testing (CPT); (b) N 10 as a results of dynamic probing heavy testing (DPH).
Geotechnics 04 00050 g003
Figure 4. Setup of static pile load tests: (a) compression test and (b) tension test.
Geotechnics 04 00050 g004
Figure 5. (a) Penetration during installation process of pile 12. (b) Pile displacement for two consecutive blows of pile 12.
Geotechnics 04 00050 g005
Figure 6. Number of blows per 10 cm pile penetration N 10 * vs. penetration depth.
Geotechnics 04 00050 g006
Figure 7. Axial load-displacement curves from static compression pile load tests: (a) test series 1: piles 2, 3, and 4; (b) test series 2 and 3: piles 5–10.
Geotechnics 04 00050 g007
Figure 8. Evaluation of the pile setup observed by compression load tests: (a) absolute pile capacities; (b) normalized pile capacities. * Expected range of pile capacity (pile 4 could not be loaded to the target value of displacement).
Geotechnics 04 00050 g008
Figure 9. Normalized resistance Q / Q r e f evolving with time after installation ( Q / Q r e f = 1 for a time after installation of 2 days); the results of this study in comparison with data from the literature after [7,27,29].
Geotechnics 04 00050 g009
Figure 10. Axial load-displacement curves of first and second loading cycles of piles 10–12.
Geotechnics 04 00050 g010
Figure 11. Normalized axial load distribution for different loading steps: (a) pile 5 (2 days); (b) pile 7 (28 days).
Geotechnics 04 00050 g011
Figure 12. Relationship between the axial force distribution and the resulting skin friction for a plugged pile [22].
Geotechnics 04 00050 g012
Figure 13. (a) Axial force distribution pile 6 LS 740 kN. (b) Outer skin friction calculated using different empirical design methods. (c) Estimated internal and external skin friction. (d) Pile resistance components.
Geotechnics 04 00050 g013
Figure 14. Normalized axial load distribution for different load steps in the tension test: (a) pile 7; (b) pile 8.
Geotechnics 04 00050 g014
Figure 15. Pile surface after extraction: (a) layer of sand particles adhesively bound to the inside steel surface of the open-ended pile; (b) bonding of sand particles strongly adhering to the outside surface of the pile.
Geotechnics 04 00050 g015
Table 1. Overview of pile load tests.
Test SeriesPileTime after Pile Installation
2 Days10 Days4 Weeks16 Weeks32 Weeks48 Weeks64 Weeks
11 * SCST
1 * DHS
2SC ST
3 SCST
4 SC ST
25SC ST
6 SC ST
7 SCST
8 SC ST
39 SC ST
10 SC ST
11DHSDHSDHSSC ST
12 DHSDHSDHSDHSDHSSC ST
* Pile 1 was installed twice at an identical position. SC—static compression pile load test; ST—static tension pile load test; DHS—dynamic pile load test (high-strain).
Table 2. Properties of Sengenthaler Flugsand.
Mean grain size d 50 0.40 mm
Coefficient of uniformity C u 2.45
Peak   friction   angle   ( D r = 0.46) φ 34.5°
Peak   friction   angle   ( D r = 0.97) φ 37.8°
Roundness of grains R 0.58
Particle sphericity S p 0.78
Minimum void ratio e m i n 0.477
Maximum void ratio e m a x 0.738
Grain density ρ s 2.63 g/cm3
Table 3. Datasheet of impact hammer, type Menck SB120.
Total weight1875 kg
Height1835 mm
Piston weight390 kg
Maximum energy per blow5.89 kJ
Maximum number of blows175 blows/minute
Air pressure6–7 bar
Air consumption7 m3/min
Table 4. Plug Length Ratio at the end of driving.
Test SeriesPile L e , f i n a l
(m)
h f i n a l
(m)
P L R f i n a l
(-)
114.344.240.98
24.344.190.97
34.304.140.96
44.314.170.97
253.903.460.89
63.903.390.87
73.903.640.93
83.903.270.84
393.883.720.96
103.903.740.96
113.883.670.95
123.893.690.95
Table 5. Soil plug formation: results from the analytical calculation of the compaction of the inner soil column.
Test Series A p l u g L e , f i n a l D r e e m i n h f i n a l , c a l P L R f i n a l , c a l
(m2)(m)(-)(-)(-)(m)(-)
10.07174.30.680.5680.4774.150.96
23.90.650.5673.740.96
33.90.660.5663.750.96
Table 6. Comparison of the slope of regression lines as per Equation (4) for different series of field tests, assuming Q t / Q r e f = 1 at 2 days after installation.
Dunkirk [7]Blessington [27]Shenton Park 168 [29]Shenton Park 89 [29]Shenton Park 450 [29]Piles 2 and 3Piles 5–10
Q r e f (kN)613376584898705567
a 2 (-)1.970.640.330.210.561.150.35
Table 7. Comparison of compressive resistance of first and second loading cycles of piles 5–10.
Pile 5
(2 Days)
Pile 6
(10 Days)
Pile 7
(4 Weeks)
Pile 8
(16 Weeks)
Pile 9
(32 Weeks)
Pile 10
(64 Weeks)
First
load cycle
567 kN734 kN1065 kN753 kN1003 kN1155 kN
Second
load cycle
642 kN694 kN992 kN753 kN938 kN1043
Change+13%−5%−7%0%−6%−10%
Table 8. Comparison between the time-dependent resistances measured by static compression and the tension pile load tests.
PileTime Since
Installation (Days)
Time Since Static
Compression Test
(Days)
Compressive Resistance
Q c (kN)
Tensile
Resistance
Q t (kN)
Q t / Q c
11419086421024%
170--325-
29790360367%
33020127359447%
4-----
511611456724343%
611610673424834%
711486106524123%
8115275314119%
9455232100323123%
104551115522720%
1145834582820825%
12457679417122%
Disclaimer/Publisher’s Note: The statements, opinions and data contained in all publications are solely those of the individual author(s) and contributor(s) and not of MDPI and/or the editor(s). MDPI and/or the editor(s) disclaim responsibility for any injury to people or property resulting from any ideas, methods, instructions or products referred to in the content.

