Article

Cyclic Liquefaction Resistance of an Alluvial Natural Sand: A Comparison between Fully and Partially Saturated Conditions

by
Diana Cordeiro
,
Fausto Molina-Gómez
*,
Cristiana Ferreira
,
Sara Rios
and
António Viana da Fonseca
CONSTRUCT-GEO, Faculdade de Engenharia da Universidade do Porto (FEUP), Rua Dr. Roberto Frias s/n, 4200-465 Porto, Portugal
*
Author to whom correspondence should be addressed.
Geotechnics 2022, 2(1), 1-13; https://doi.org/10.3390/geotechnics2010001
Submission received: 29 November 2021 / Revised: 17 December 2021 / Accepted: 28 December 2021 / Published: 6 January 2022

Abstract

:
Earthquake-induced liquefaction is one of the major causes of building damage as it decreases the strength and stiffness of soil. The liquefaction resistance of soils increases significantly as the degree of saturation decreases, making soil desaturation an effective measure for the mitigation of this phenomenon. This paper presents a comparative analysis of liquefaction resistance of an alluvial sand from Aveiro (Portugal) under fully and partially saturated conditions. For this purpose, an in situ characterisation based on CPTu and a laboratory series of cyclic triaxial tests were carried out. The cyclic triaxial tests were conducted under undrained conditions on remoulded specimens with different degrees of saturation, including the full saturation. On the other hand, the triaxial apparatus was instrumented with Hall-effect transducers to accurately measure the strains during all testing phases. In addition, it was equipped with piezoelectric transducers to measure seismic waves velocities, namely P-wave velocity, for evaluation of the saturation level of the specimen in parallel with the Skempton’s B parameter. Hence, relations between the B-value, and P-wave velocity and cyclic strength resistance are presented. The number of cycles to trigger liquefaction, considering the pore pressure build-up criterion, is presented for the different degrees of saturation. Results confirmed the increase in liquefaction resistance for lower degrees of saturation in this soil.

1. Introduction

One of the most sensitive problems of buildings located in seismic zones and founded on granular soil deposits is liquefaction phenomena, which usually occur in saturated, cohesionless and contractive soils. During the cyclic loading, the soil volume tends to decrease, causing an increment of pore-water pressure (decrease in effective stress towards failure envelope), and consequently a reduction in the soil stiffness. Therefore, it is necessary to improve or stabilise the soils under existing or future structures [1].
Over the decades, several techniques to mitigate the phenomena have been developed to reduce or eliminate the liquefaction susceptibility and the associated structural damage [2,3]. Huang [4] stated that liquefaction countermeasures deal with the following issues: (i) how to achieve non-disruptive mitigation of liquefaction risk at developed sites susceptible to liquefaction, (ii) how to achieve liquefaction mitigation in large areas at low cost, and (iii) how to combine liquefaction mitigation with environmental friendliness. However, liquefaction mitigation measures are expensive, especially when applied in urban areas, which justify the study and development of affordable techniques for liquefaction mitigation that can be executed under existing structures [5]. Numerical simulations of liquefaction phenomenon showed that techniques, such as preloading, stone column installation, soil compaction or induced partial saturation, allow the pore pressure build-up and soil deformations to be reduced during seismic events [6,7]. Hence, it is of the utmost relevance to identify mitigation techniques able to tackle liquefaction susceptibility, while satisfying the requirements of design reliability, environmental impact, and cost-effectiveness [8,9].
It is well-known that soil liquefaction is triggered in saturated conditions [10,11]. Few researchers have investigated the feasibility of techniques involving the artificial formation of air bubbles within the liquefiable soil deposits, leading to a reduction in the degree of saturation and an increase in the soil resistance against liquefaction [12]. Laboratory results have shown that a small reduction in the degree of saturation of fully saturated sands, from 100 to 98%, can increase their resistance to liquefaction by 30% [13,14]. In addition, the desaturation of soils is one of the most promising techniques for increasing the liquefaction resistance on the field by changing the position of the groundwater level [15]. During seismic events, the pore pressure build up in the field can be controlled using drains (vertical or horizontal), offering good results against liquefaction as observed by Flora et al. [16].
This paper addresses the assessment of liquefaction resistance of natural sand under fully saturated and partially saturated conditions, providing laboratory evidence about the effects of degree of saturation in the liquefaction resistance for further applications involving desaturation of soils as a technique to mitigate liquefaction. The studied soil is alluvial sand from Aveiro, North of Portugal. This soil was characterised by in situ and laboratory tests, such as piezocone tests (CPTu), pressure plates tests and cyclic triaxial tests. The effects of degree of saturation on the liquefaction resistance were assessed by conducting a non-conventional experimental program, which involved cyclic triaxial tests under undrained conditions on saturated and partially saturated soil specimens. All cyclic tests were carried out using a triaxial cell equipped with piezoelectric transducers and high-precision internal instrumentation of the Hall-Effect type. The combination of P-wave velocity and B-value measurements allowed a strong framework to be defined to estimate the degree of saturation during triaxial testing. The results confirmed that the liquefaction resistance increases as the degree of saturation decreases.

2. Material Definition

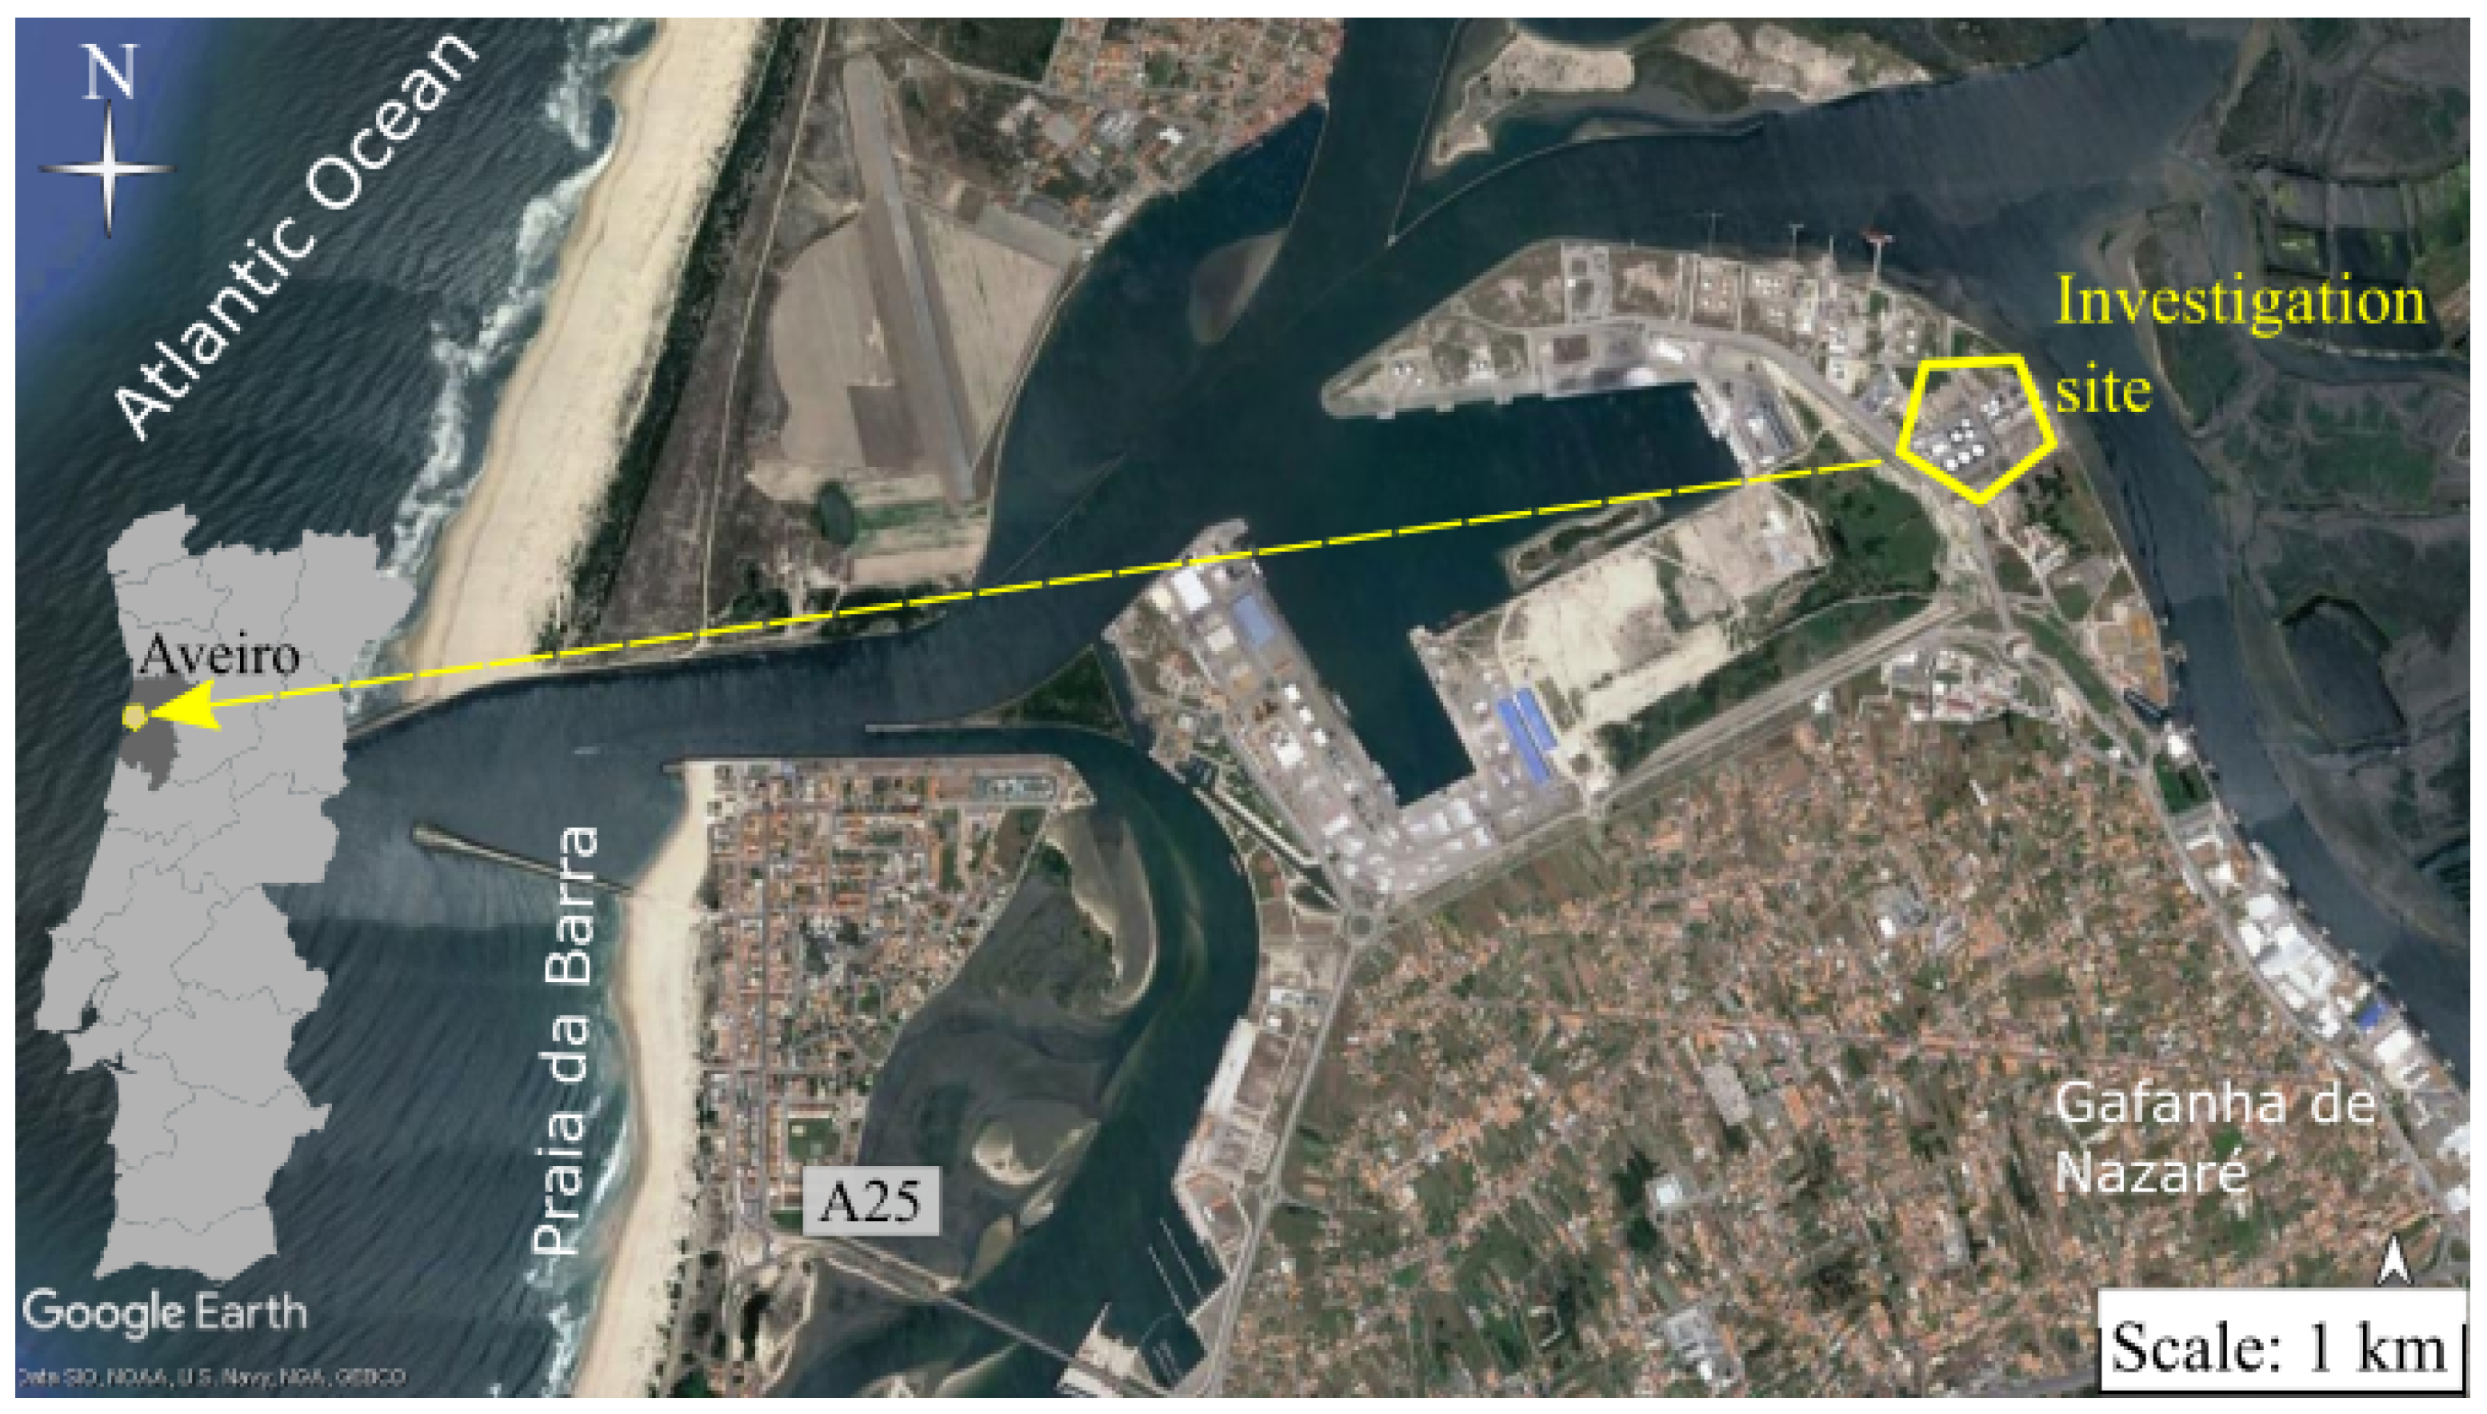
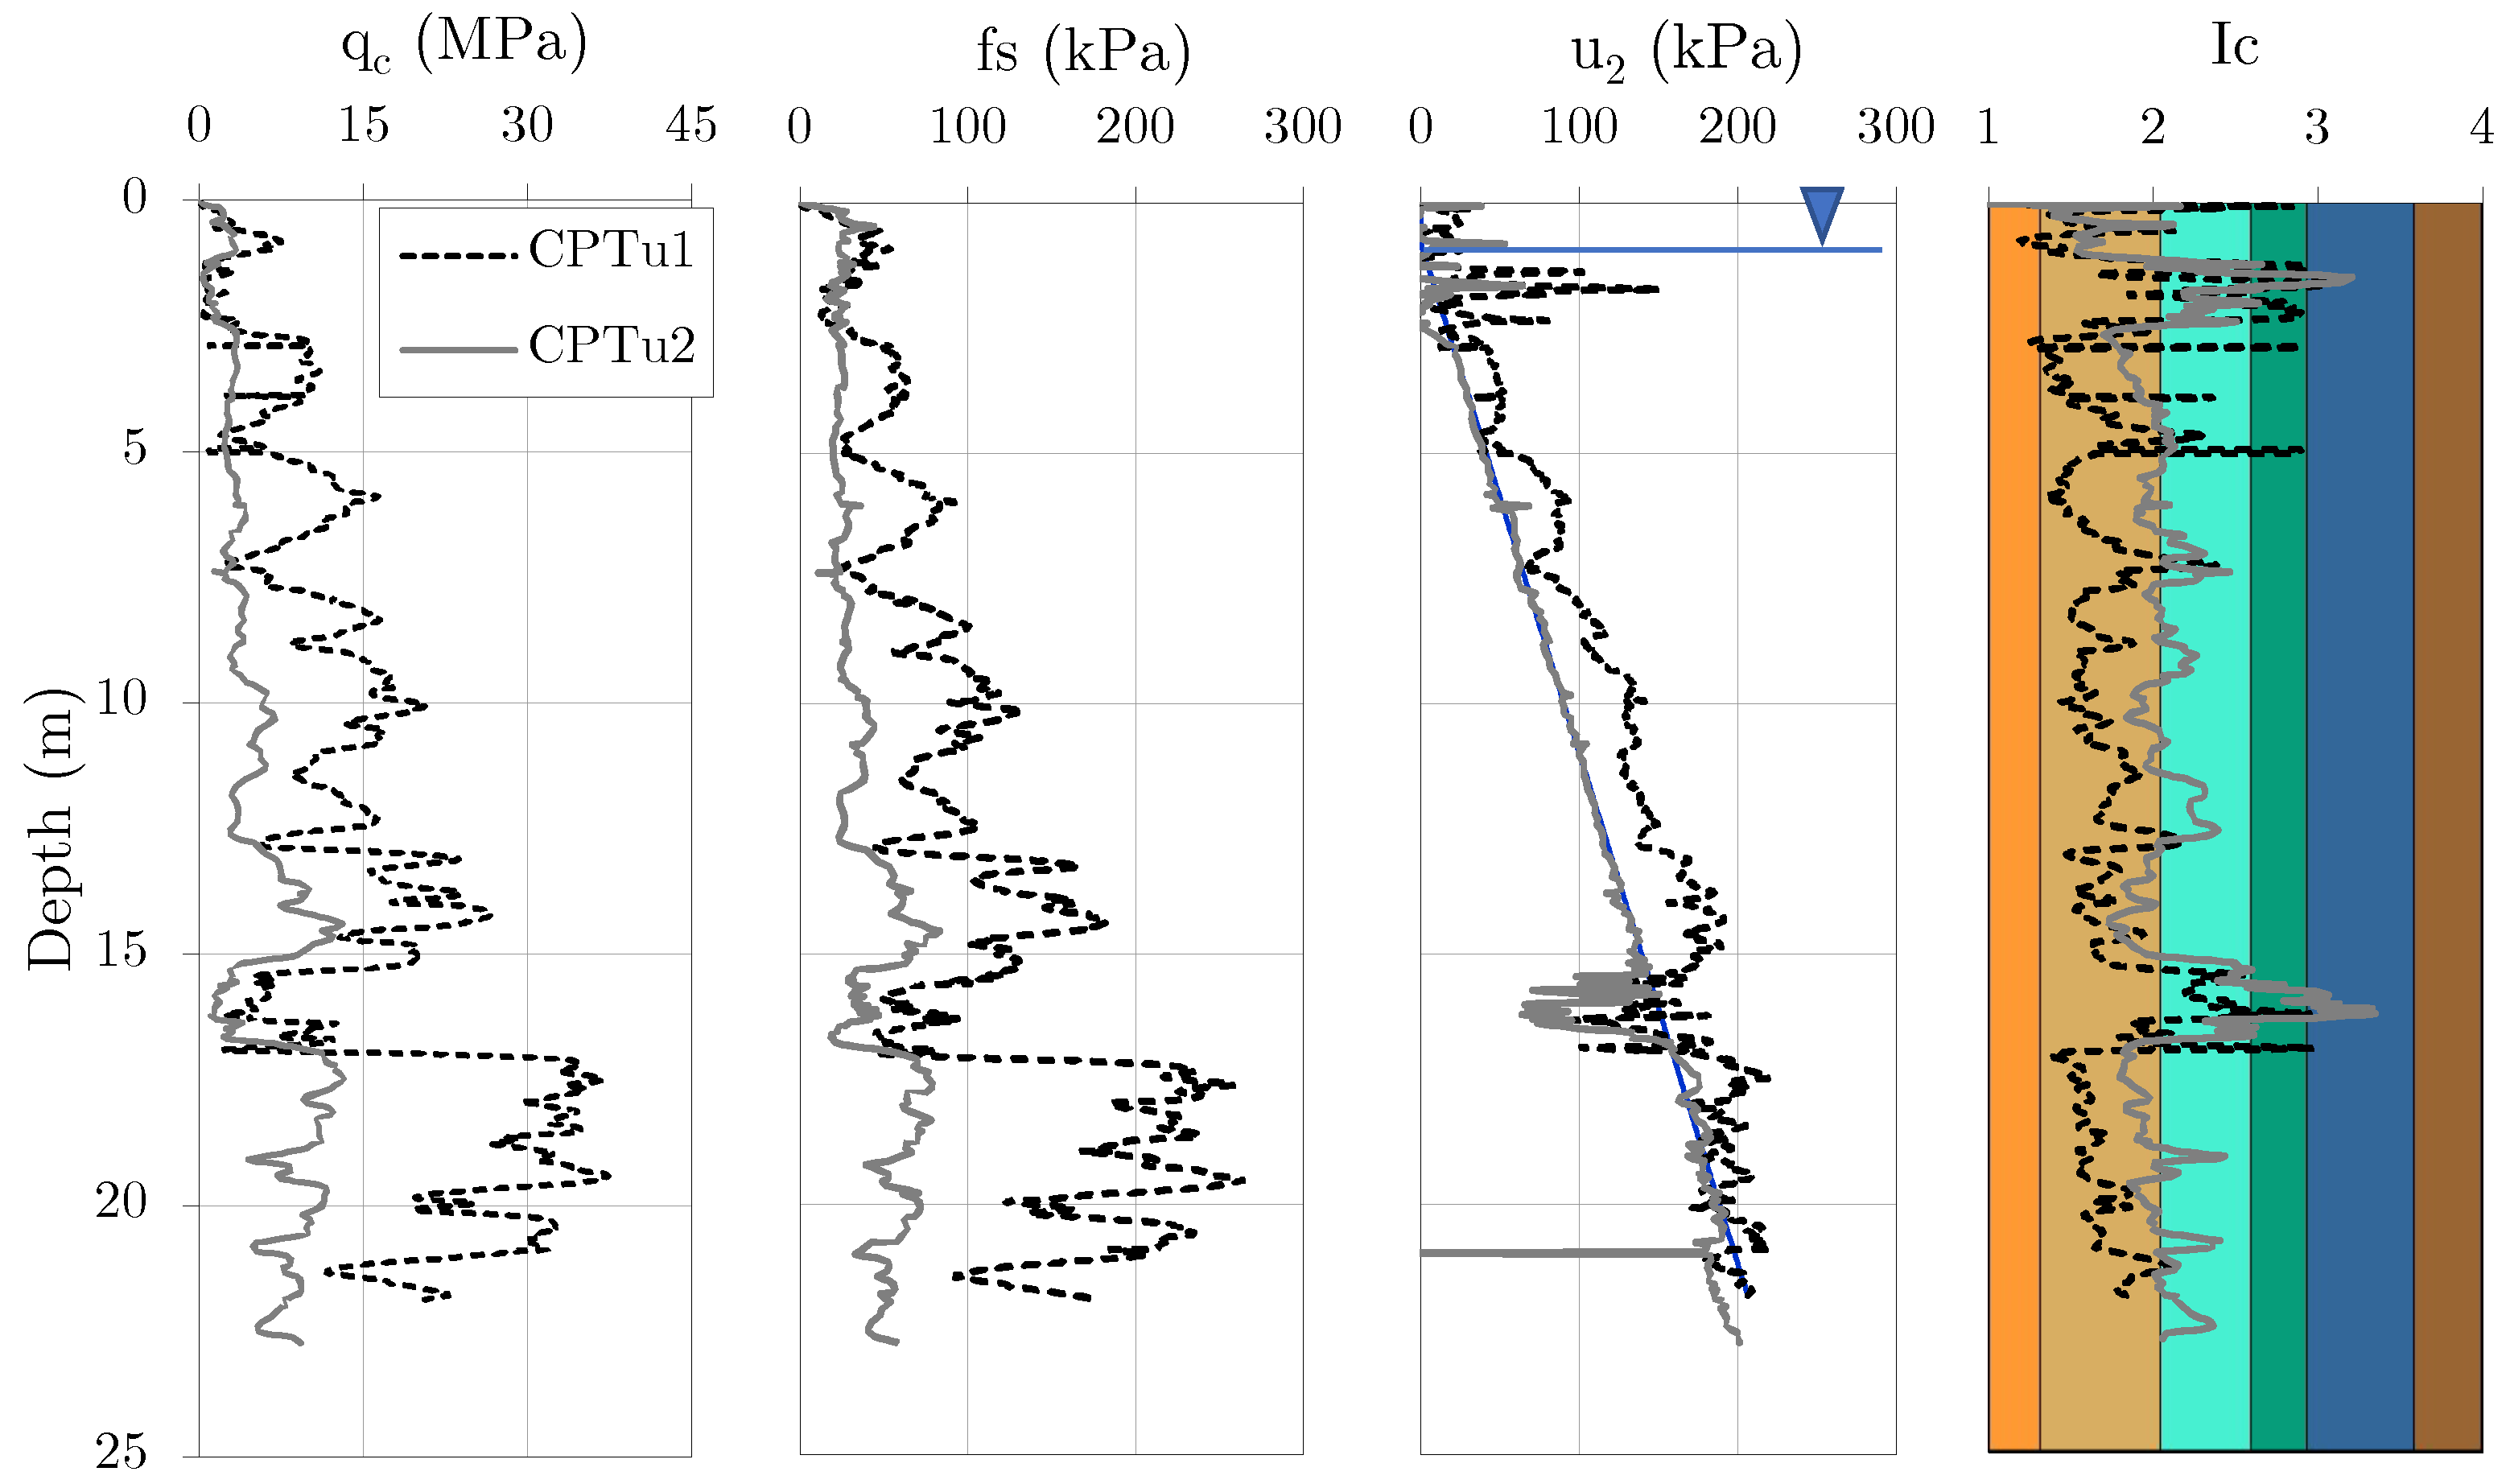
2.1. Experimental Site

This study was carried out on an alluvial sandy soil from Aveiro city in the north of Portugal. The Aveiro region corresponds to the northern sector of the Portuguese Occidental Meso-Cenozoic sedimentary basin. The soils in this region are mainly composed of thick sandy layers interspersed with layers of muddy nature, which can appear as lenticular layers or with a significant thickness [17]. In geological terms, such sandy soils correspond to alluvial deposits from ‘Ria de Aveiro’ with origin in the Holocene. In addition, this region is characterised by earthquakes mainly with offshore epicenters (far source), low frequency, high magnitude and long duration. Table 1 summarises the seismic action, recommended in the National Annex of Eurocode 8 [18] for the Aveiro region.
The investigation site is located in the coordinates 40 39 11.00 N– 8 42 15.13 W. At this investigation site, the alluvial deposits reach about 35 m thickness and lay on the Sandstone Aveiro Unit [19]. Figure 1 shows the location of the investigation site. The zone of this investigation site has important industrial facilities that can suffer serious structural problems during an earthquake of significant magnitude. In particular, the triggering of liquefaction phenomena can significantly increase the damage due to high differential settlements with the possibility of building tilt and lateral spreading.
For this study, two CPTu were compiled from [17,19]. These in situ tests were carried out with 3 m distance from each other. Figure 2 presents the CPTu profiles. The CPTu parameters are the corrected cone resistance q t , the sleeve friction f s , and the pore pressure u 2 . In addition, Figure 2 shows the soil behaviour index profile (Ic), according to Robertson [20], for the two CPTu. The groundwater level was identified at 0.80 m depth for both CPTu soundings.
From Figure 2, it can be observed layers composed of granular soils (i.e., Ic < 2.6) at 3 m to 5 m, 6 m to 15 m and 17 m to 21 m depth in both profiles. The soil profiles exhibit lenses/transitions of clayey soils between the sandy layers, which are typical in alluvial deposits [21]. Based on the in situ characterisation, integral samples of sandy soil (hereafter called Av-sand) were collected at 4 m depth for the assessment of liquefaction resistance in the laboratory.

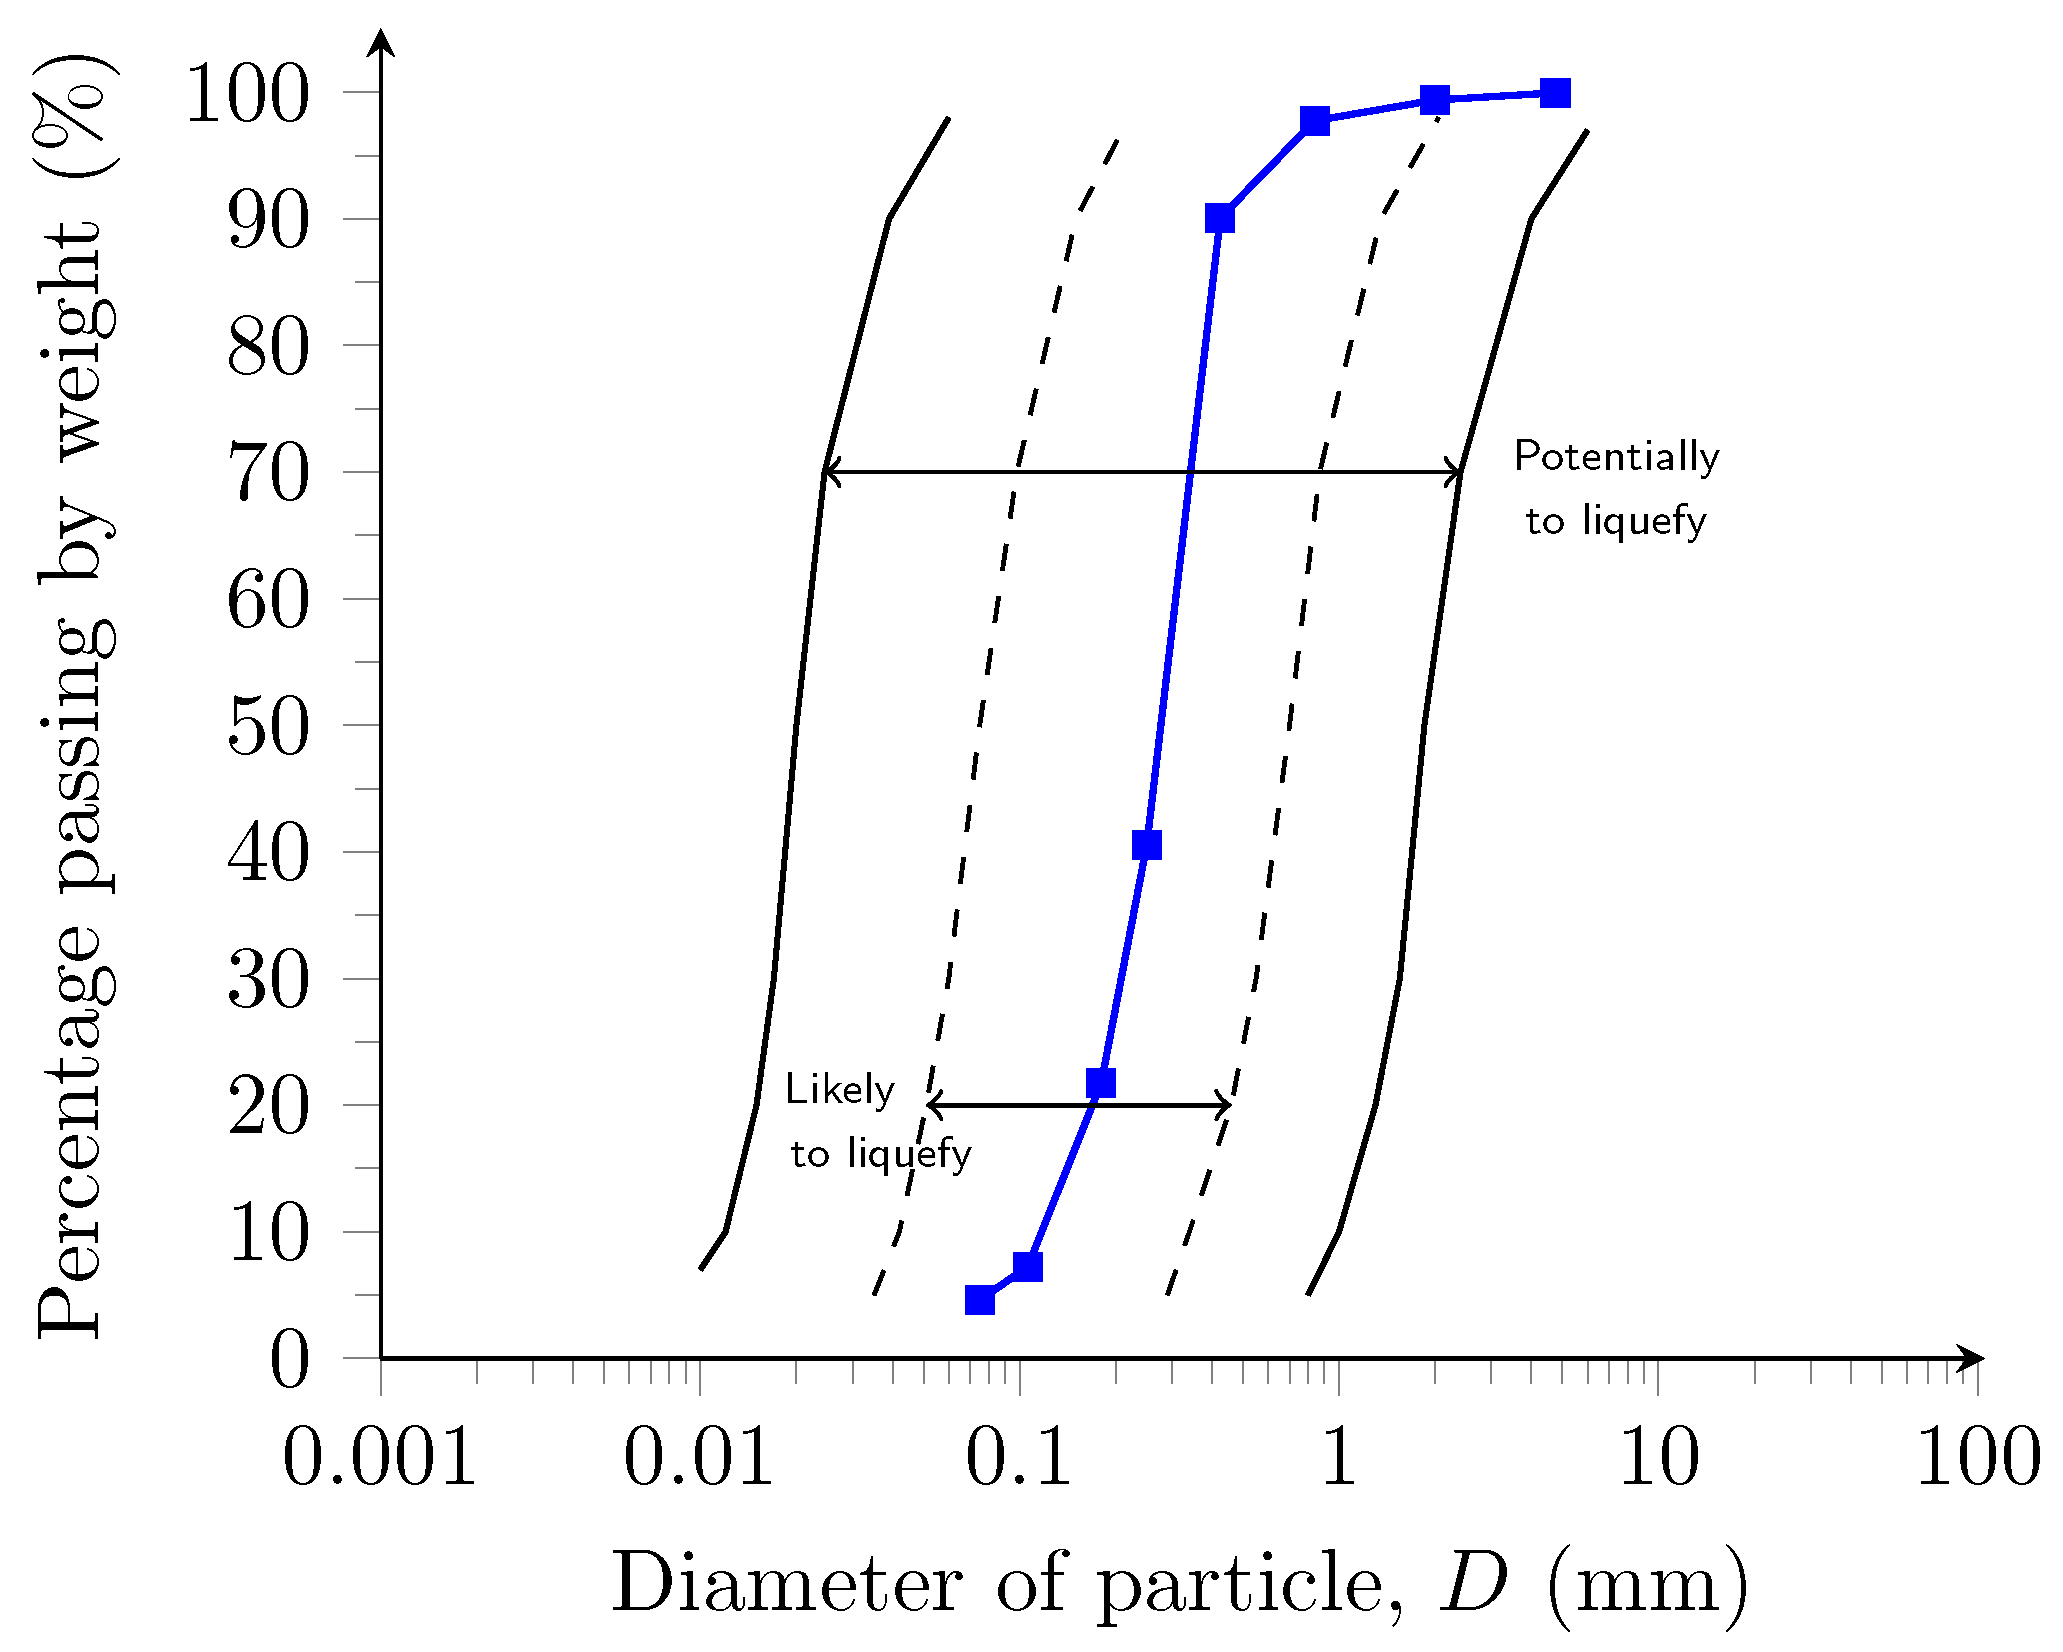
2.2. Soil Description

Figure 3 shows the grain size distribution (GSD) of Av-sand. According to the ASTM D-2487-17 classification, this soil was classified as poorly graded sand (SP). The GSD of Av-sand was compared against the boundaries proposed by Tsuchida [22] to estimate the liquefaction susceptibility based on the compositional criteria of the soil. The sand was categorised as likely to liquefy, with less than 5% fines content.
Table 2 presents the main physical properties of Av-sand, namely the specific gravity of solid particles ( G s ) maximum and minimum void ratio ( e m a x and e m i n ), fines content (FC) and mean diameter ( D 50 ). Such a table presents the coefficient of curvature ( C c ) and coefficient of uniformity ( C u ), which indicate a uniform particle size distribution.
Because the particle shape has a strong influence on the mechanical behaviour of sandy soils, Ramos et al. [23] measured the particle shape parameters of five Portuguese sands, including Av-sand. These parameters were obtained based on macro photographs and by applying the methodology proposed by Cho et al. [24]. Table 3 presents the particle shape parameters of Av-sand.

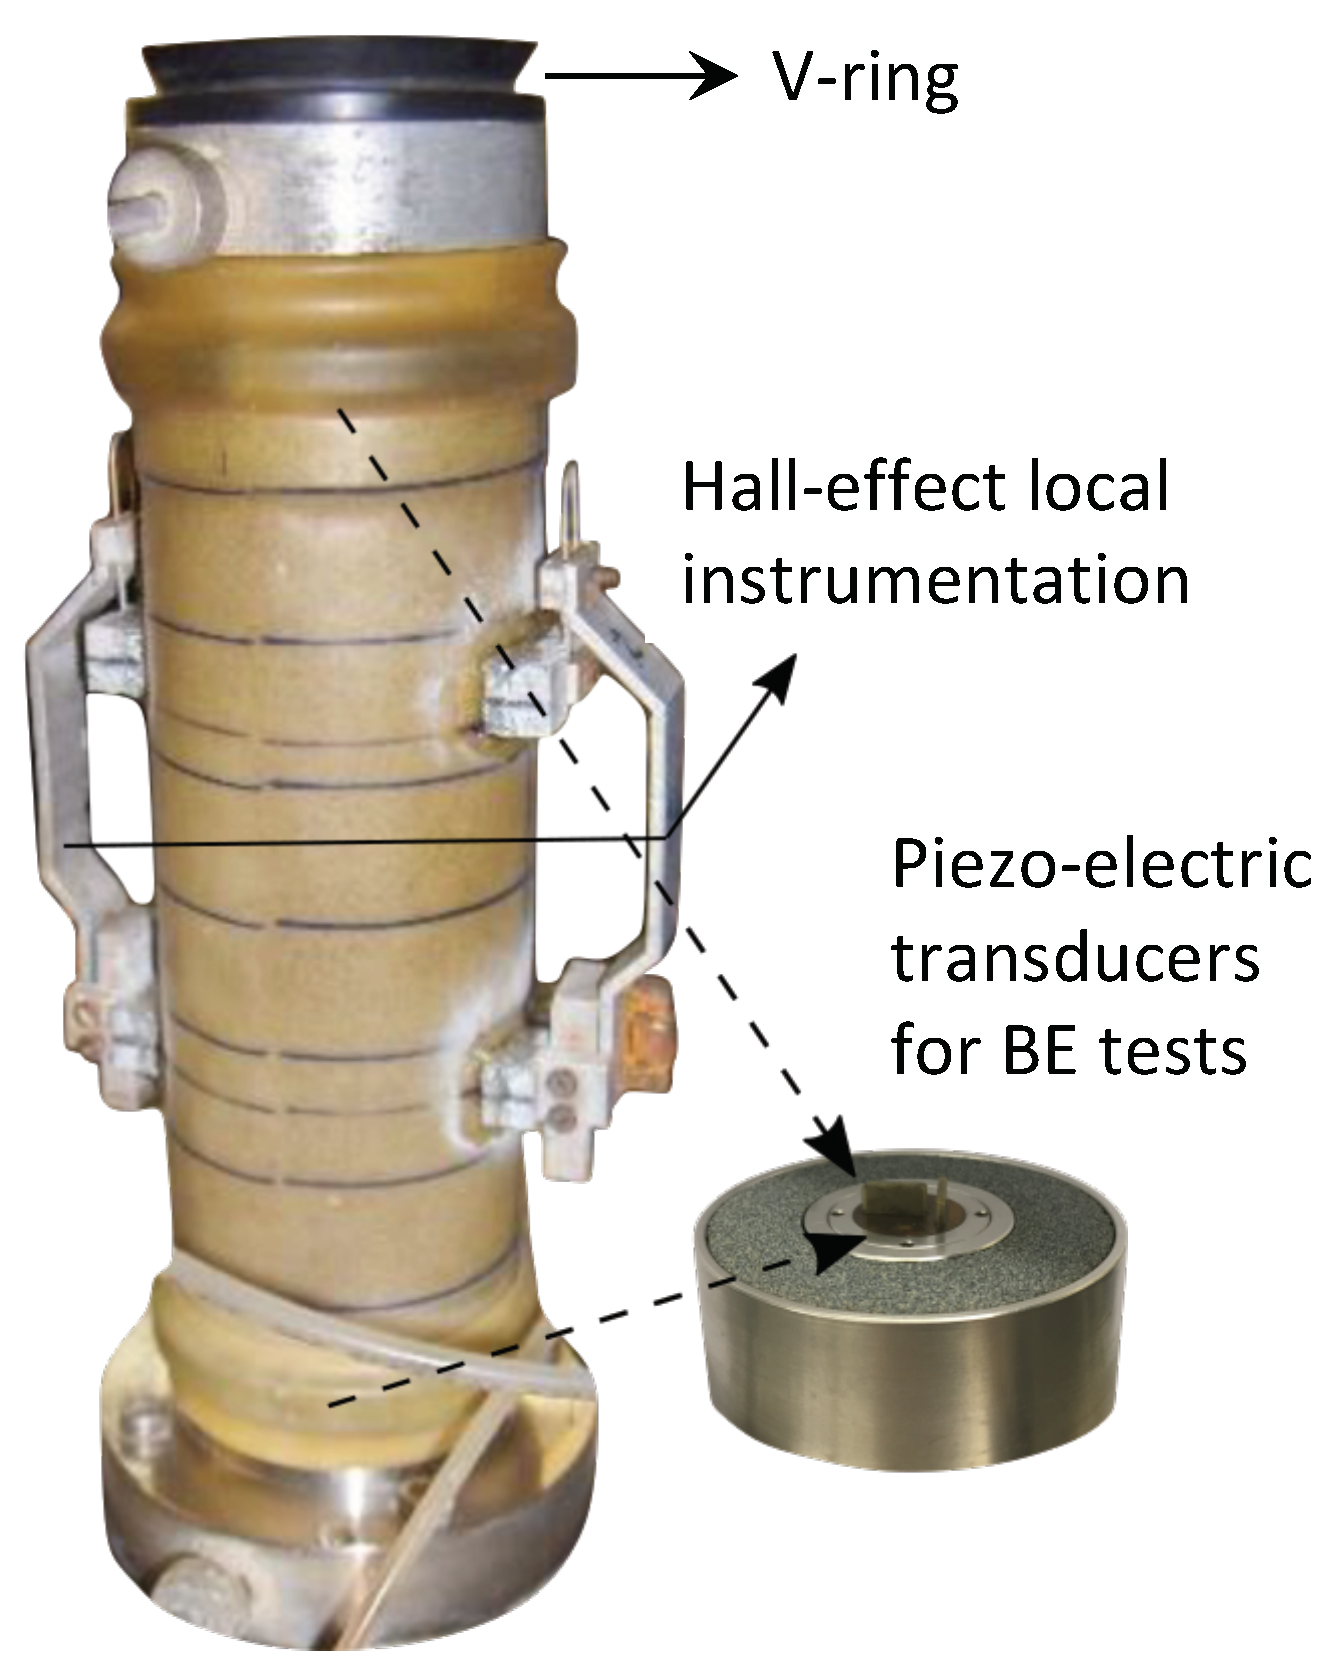
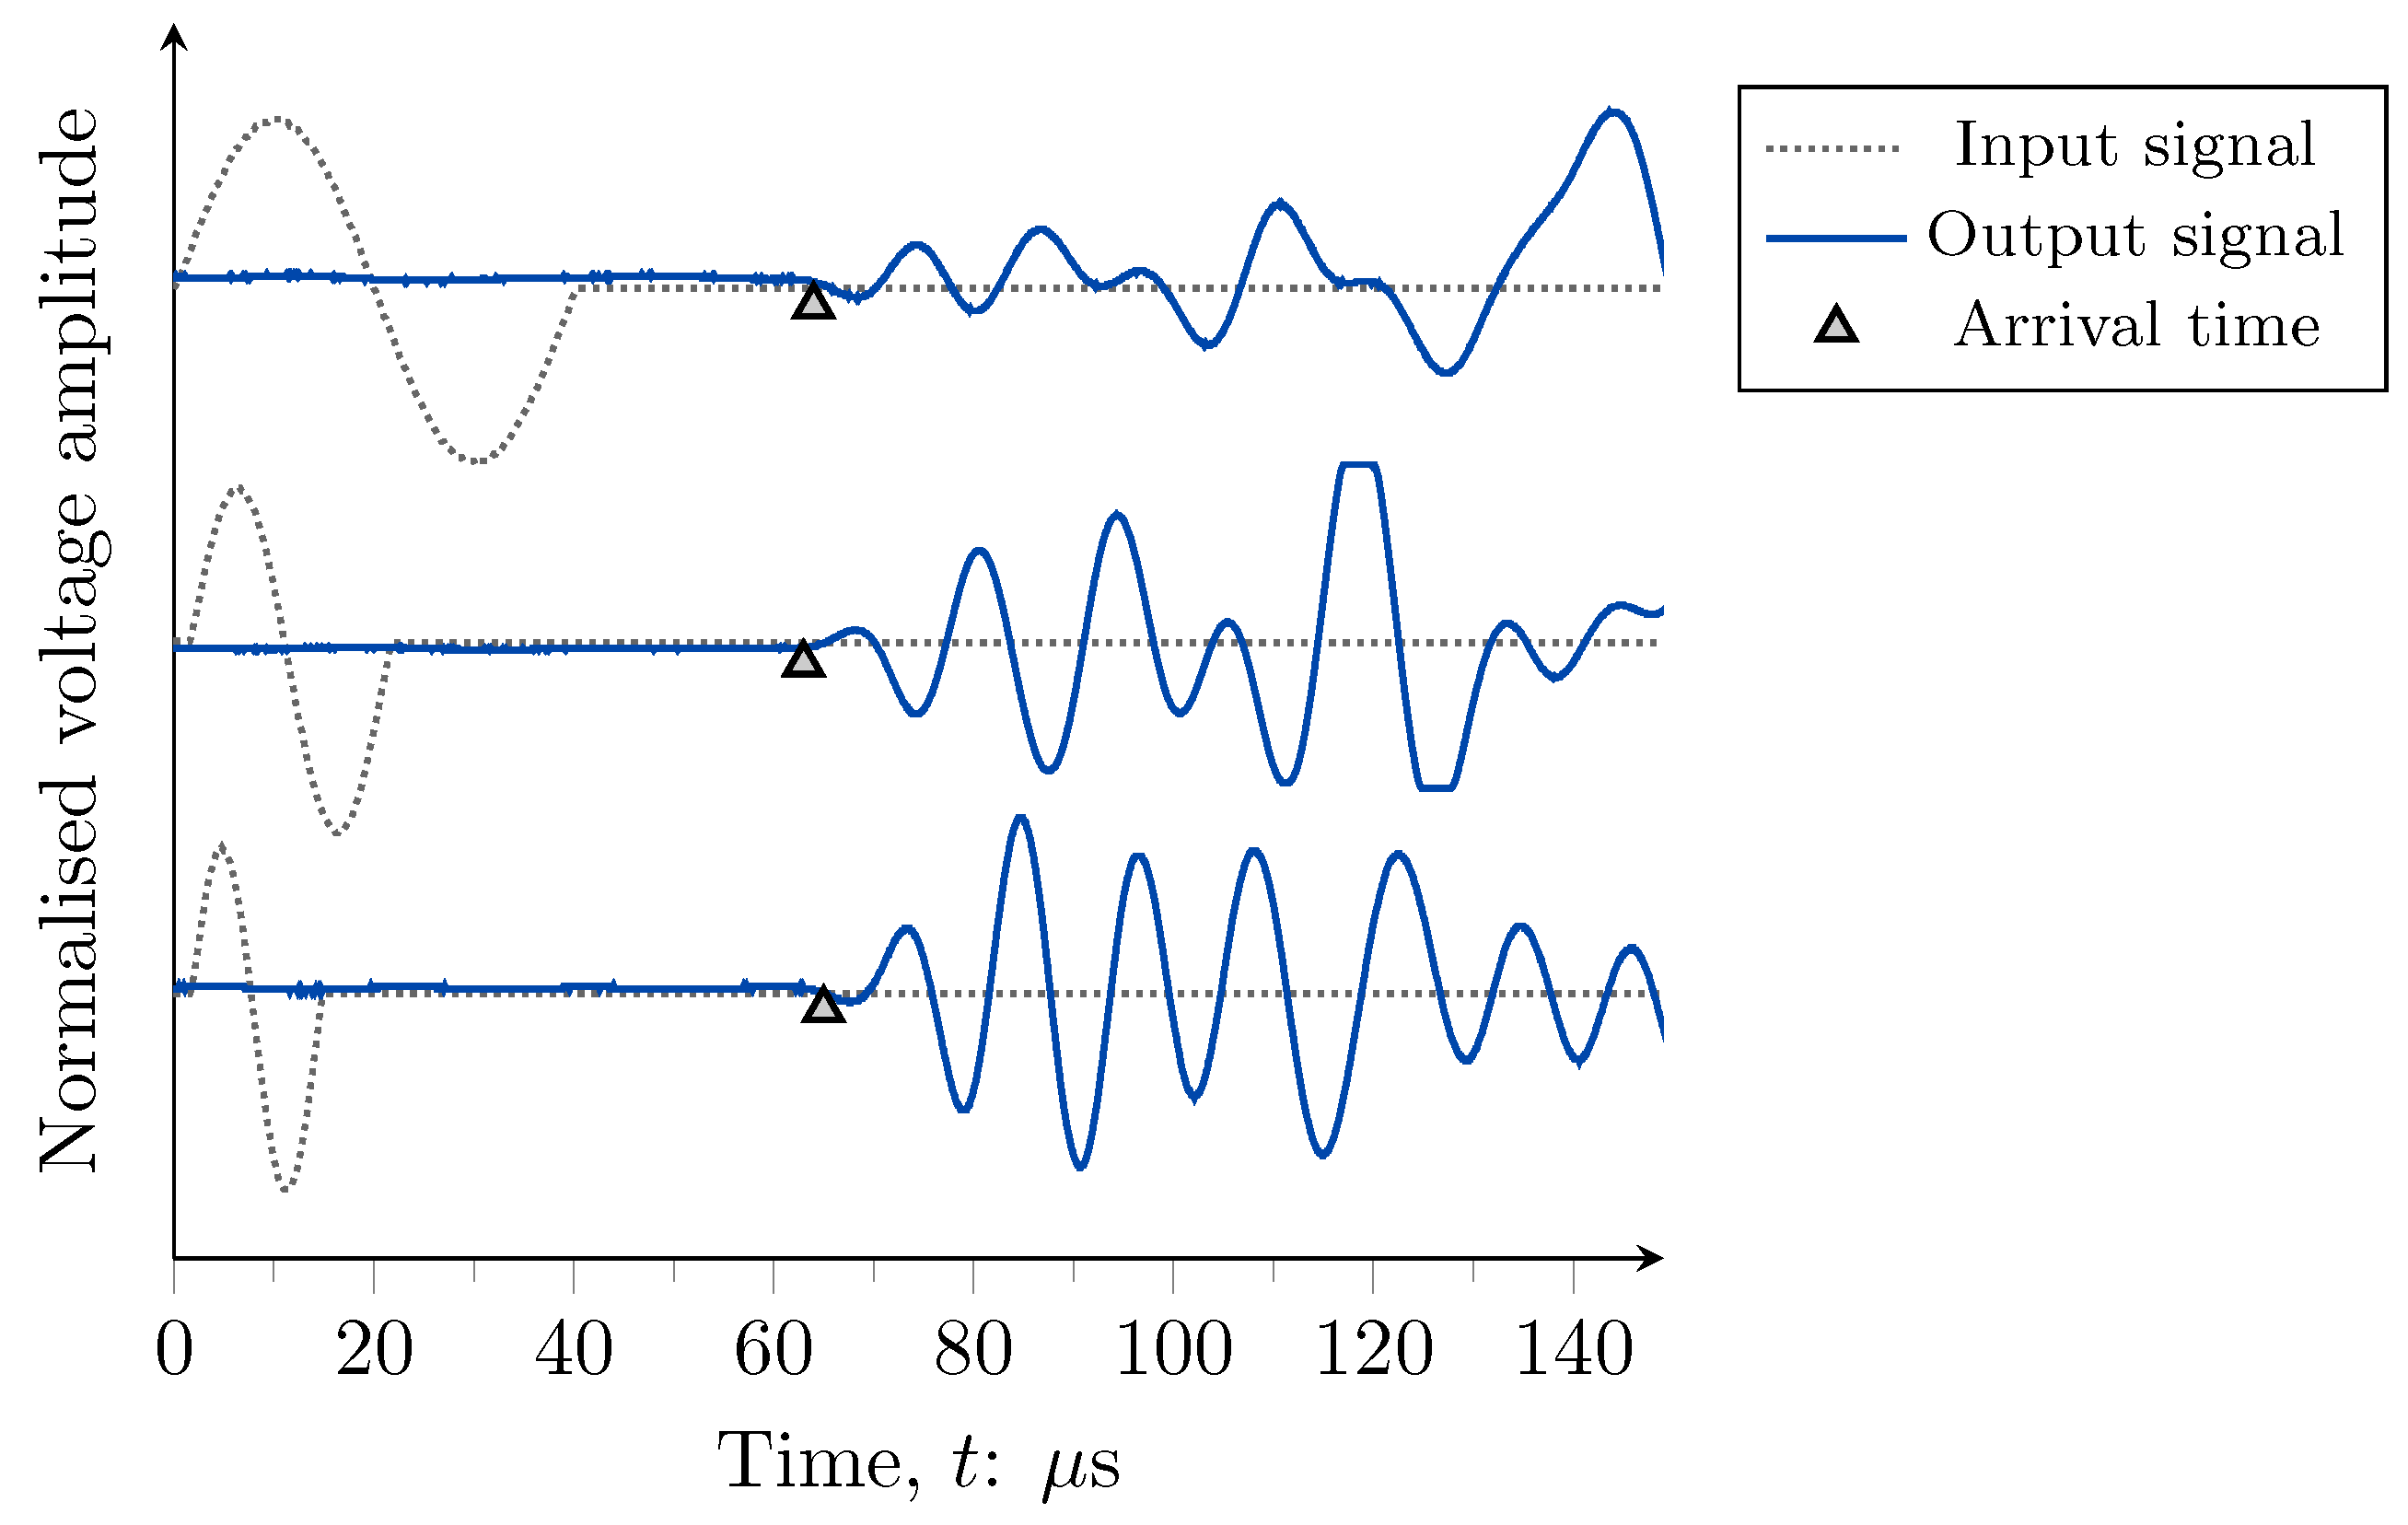
3. Experimental Methodology

In the laboratory, the liquefaction resistance of Av-sand was assessed by an experimental program, which comprised a series of cyclic triaxial tests in reconstituted specimens. The tests were carried out in a Bishop–Wesley-type stress-path triaxial cell equipped with piezoelectric transducers to measure the seismic wave velocities, namely P-wave, by means of Bender Element (BE) tests. Two local Hall-Effect transducers were glued to opposite sides of the specimens for estimating the void ratio changes—or axial strains—with higher precision during triaxial testing (Figure 4). The top cap has a rubber V-ring to ensure the load application during the compression/extension cycles.
Soil specimens of 50 mm diameter and 100 mm height were remoulded using the moist tamping technique. The samples were prepared for a relative density ( D r ) of about 35%. The specimens were prepared using different initial water content to obtain different degrees of saturation (including the full saturation condition) and then evaluate the effect of degree of saturation on liquefaction resistance. The saturation of all specimens was performed by increasing both cell pressure and back-pressure at a constant difference of 10 kPa by applying an increment rate of 50 kPa/h [25]. All soil specimens were isotropically consolidated at 40 kPa of confinement stress, corresponding to the mean effective stress in the field. The cyclic loading was applied considering different cyclic stress ratios (CSR), defined by Equation (1):
C S R = q 2 · p 0
where q is the deviatoric stress and p 0 is the confinement pressure before cyclic loading.
In the BE tests, a pair of piezoelectric ceramic instruments able to transmit or receive a mechanical perturbation was used. The input signal to excite the BE transmitter, and then generating the mechanical perturbation, corresponded to a sinusoidal pulse. The wave propagation travel time ( t t ) between the distance of the elements ( L t t ) was obtained using the first arrival method [26]. The test set-up consists of a pressure/volume control panel (triaxial cell), a function generator (TTi TG1010), two input-output amplifiers (designed at the University of Western Australia), an oscilloscope (Tektronix TDS 220) and a computer with WaveStar software to acquire the wave signals [27].
On the other hand, to estimate the effect of the soil suction on liquefaction resistance of Av-sand, the water retention curve was estimated using a Pressure Plate Apparatus (PPA). These tests were conducted by following the ASTM recommendation (ASTM D6836-16 2016) [28]. PPA tests involved the remoulding of four soil specimens into four rigid stainless steel rings, using the moist tamping method. The soil specimens were placed in the pressuring chamber over a high air-entry ceramic disk. All samples were saturated with deaired water and subjected to a series of air-pressure increments, namely 1, 4, 8, 20, 32, 60, 100, 200, 400, 600, and 700 kPa. The specimens were tested under pressure for seven days to achieve the equilibrium between soil water and air pressure for each increment. After testing the samples were weighed and oven-dried to measure the water content at the end of each air-pressure.

4. Analysis of Results and Discussion

The liquefaction resistance of Av-sand was assessed by conducting six cyclic triaxial tests. Such tests were carried out for fully saturated and partially saturated conditions. The variation of the degree of saturation ( S r ) was obtained by applying back-pressure values between 100 kPa to 500 kPa. During testing, the saturation of the soil specimens was monitored by combining P-wave velocity ( V p ) and the Skempton’s B parameter (B-value) during the back-pressure increment. Soares and Viana da Fonseca [29] considered that, in triaxial tests, the soil specimens are completely saturated if Skempton’s B-value is higher than 0.97 and V p > 1480 m/s, simultaneously. However, the actual degree of saturation in each soil specimen was estimated at the end of the test using the final water content (after testing), the strains reported by the local transducers (during saturation and consolidation phases) and the initial dimensions of the specimen (during assembly), because the cyclic shear was conducted in undrained conditions, and no volume change occurred during this phase.
The B-value was measured during the saturation ramp for different back-pressure values (i.e., 10, 40, 70, 100, 150, 200, 300, 400 or 500 kPa). B-value measurements were carried out by increasing the current cell pressure by 30 kPa in undrained conditions. Simultaneously to B-value measurements, V p was measured using the bender element transducers applying different input signals, namely sinusoidal pulses with different frequencies to obtain reliable results [30]. Figure 5 presents a series of typical results of P-wave in fully saturated conditions for 25, 50 and 75 kHz frequency. This procedure allowed estimating the evolution of the degree of saturation of soil specimens by combining B-value and V p measurements. Table 4 presents the final values of back-pressure, B-value and V p of the selected tests.
Figure 6 presents the relationship between B-value and V p registered during testing. These results were compared against the theoretical model proposed by Yang [31]. The comparisons between B-value and V p showed that specimens of the three tests presented different final results of B-value and V p , indicating different degrees of saturation for each specimen. Moreover, results showed a good agreement with the theoretical model of Yang [31], confirming the effect of the bulk modulus of the soil skeleton and the bulk modulus of the fluid phase—composed of air bubbles and water—on V p [32].
On the other hand, the soil-water characteristic curve (SWCC) of the studied soil was estimated to evaluate the influence of suction in the partially saturated samples and then in the liquefaction resistance. Figure 7 shows the SWCC of Av-sand. Experimental data were fitted to the model proposed by [33], which is described as follows in Equation (2):
θ w = θ s ln e + ψ a b c
where θ w = ( S r · ω · G s ) / ( S r + ω · G s ) is the volumetric water content, θ s = 44.31 is the saturated water content; e is the void ratio of the soil; ψ is the applied suction; a = 3.18 , b = 4.08 and c = 1.22 are fitting parameters for adjusting the curve shape.
Results of SWCC showed an air entry value of about 2 kPa. The above indicated that there is not an important effect of soil suction in the behaviour of Av-sand for degrees of saturation higher than 85%.
Table 5 presents the final test conditions of the specimens, as well as the number of cycles to trigger liquefaction ( N L ). In this study, the liquefaction triggering was considered when the soil specimen achieved a pore pressure ratio ( r u = Δ u / p ) higher than 0.95. The results of liquefaction resistance are presented in Figure 8. The results of fully saturated conditions (e.g., S r = 100 % ) provided a liquefaction resistance curve, which fitted with Equation (3) under a correlation coefficient R 2 = 0.945 .
C S R = 0.176 N 0.117
In order to evaluate the effect of degree of saturation on the liquefaction resistance of Av-sand, three tests performed under similar conditions of cyclic loading ( C S R 0.15 ) were compared. Figure 9 presents the comparison between such tests. The specimens and test conditions only differed in terms of degree of saturation; that is, S r equal to 100%, 93% and 90%. The degree of saturation of the samples tested under partially saturated conditions was above the air entry value (see Figure 7), indicating that the soil specimens did not have a continuous gas phase. Hence, the air in the soil specimen is present as bubbles, and there is a negligible effect of soil suction in the soil behaviour during cyclic loading.
Figure 9a indicated that the soil does not present axial deformation ( ε a ) higher than 0.05% during the first cycles of loading in all tests. Notwithstanding, once liquefaction was triggered, the soil presented a considerable deformation ( ε a > 2.5 % ), showing higher strains for the lower degree of saturation. This behaviour is due to the presence of air bubbles in the soil specimens, which can compress during cyclic loading, reducing the pore pressure build-up and consequently increasing the liquefaction resistance of the soil [34].
Experimental results presented in Figure 8 and Figure 9 showed that the liquefaction resistance of Av-sand increases as S r decreases. In this study, a reduction in the degree of saturation of about 7% and 10% almost doubled the number of cycles to trigger liquefaction, as also observed by Mele et al. [14] for poorly-graded sands. However, the variation of the number of cycles did not properly quantify the increment of liquefaction resistance when S r decreases. Therefore, an approach based on the normalised cyclic strength (NCS) and the P-wave velocity ( V p ), proposed by Ishihara & Tsukamoto [35], was implemented to analyse the increment of liquefaction resistance for different S r . The NCS was estimated by computing the ratio between the cyclic resistance obtained in partially saturated and fully saturated conditions; where the cyclic resistance of partially saturated conditions is the CSR applied during cyclic triaxial testing and the cyclic resistance of fully saturated conditions corresponds to the computation of Equation (3) for the number of cycles reported in partially saturated conditions.
Figure 10 presents the results of normalised cyclic strength ratio as a function of V p obtained for Av-sand. Besides, Figure 10 compared the results of this study against the results reported by Ishihara & Tsukamoto [35] for other natural sands. From Figure 10, it can be observed a good agreement between the experimental data obtained in this study with the fitting proposed by Ishihara & Tsukamoto [35]. In addition, such a figure showed that the liquefaction resistance of Av-sand effectively increased as S r decreased since the normalised cyclic strength conferred values of 1.17 and 1.23 for S r = 93 % and S r = 90 % , respectively.
On the other hand, to compare the effect of the degree of saturation on the liquefaction resistance of Av-sand, the evolution of excess of pore pressure generated during cyclic triaxial loading was analysed. This analysis covered the normalisation of both the pore pressure build-up ( r u = Δ u / p 0 ) and the number of cycles of testing ( N / N L ). Figure 11 presents the curves of normalised pore pressure evolution. Such results were compared against the model developed by Seed et al. [36], which is defined by Equation (4) as follows:
r u = 1 2 + 1 π arcsin 2 N N L 1 β 1
where r u is a pore pressure parameter that indicates the pore pressure build-up normalised to initial effective confining stress ( Δ u / p 0 ), N is the number of uniform cycles, N L is the number of cycles required to trigger liquefaction, and β is an empirical parameter. Seed et al. [36] proposed an upper and lower bounds, based on experimental data, using β = 1.4 and β = 0.7 , respectively.
The results presented in Figure 11 indicate that the pore pressure evolution is greater as the degree of saturation increases, that is, Tests 1–4 (full saturation condition) exhibited a slightly higher increment of pore pressure than Test 5 and Test 6. Furthermore, it was observed that for desaturated conditions, the curves fall outside of the bounds proposed by Seed et al. [36]. Differences between results are attributed to the effect of the air bubbles trapped in the soil, which induce a dissipation of energy during cyclic loading, confirming the effect of the air compressibility during cyclic loading and thus in the liquefaction resistance. Therefore, β = 0.85 and β = 0.35 are recommended to describe the evolution of pore pressure build-up for degrees of saturation between 90% and 100% of Av-sand.

5. Conclusions

This paper compared the liquefaction resistance of a Portuguese alluvial sand, collected in the Aveiro region, by changing the degree of saturation. For this purpose, a series of cyclic triaxial tests were conducted using a triaxial cell equipped with piezoelectric transducers and high-precision internal instrumentation of the Hall-Effect type. Av-sand is poorly graded sand with low fines content, which was categorised as likely to liquefy according to the compositional criterion proposed by Tsuchida [22]. The experimental results reported in this paper confirm an increment of liquefaction resistance as the degree of saturation decreases. From this experimental research, the following conclusions can be drawn:
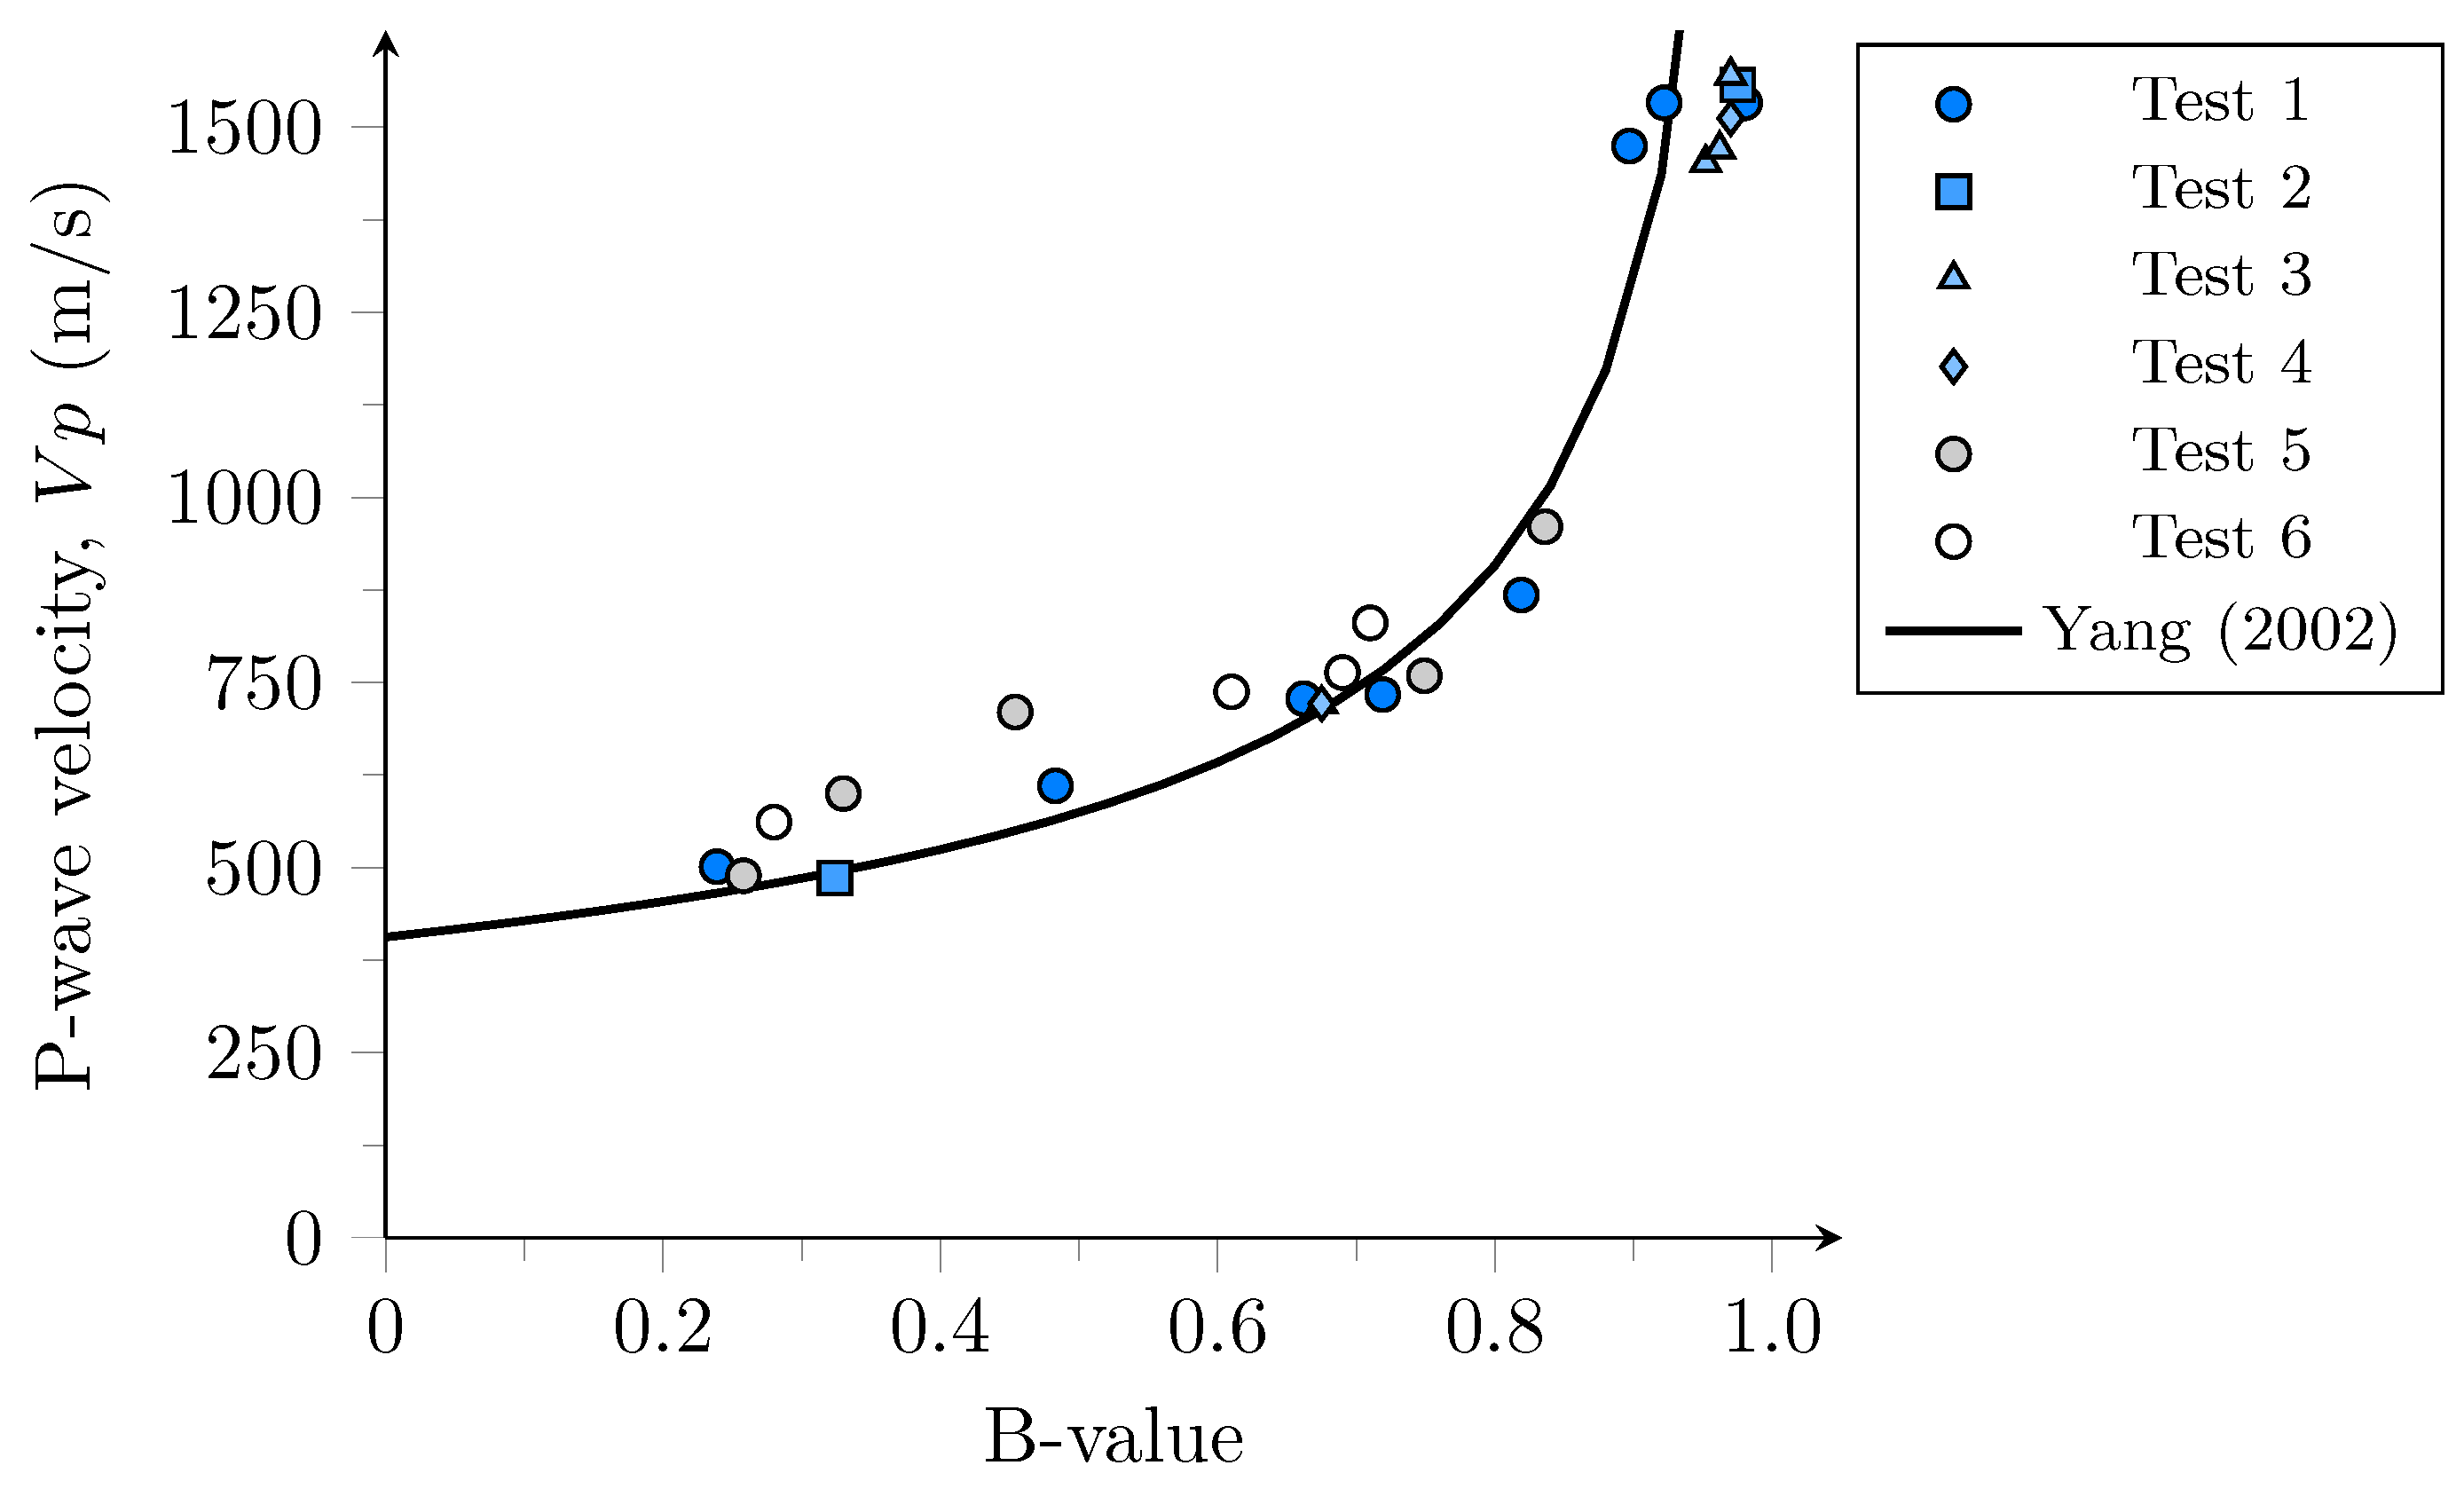
  • The relationship between B-value and P-wave velocity of the studied soil fit well with the theoretical model proposed by Yang [31], providing an experimental approach for estimating and controlling the degree of saturation during triaxial testing.
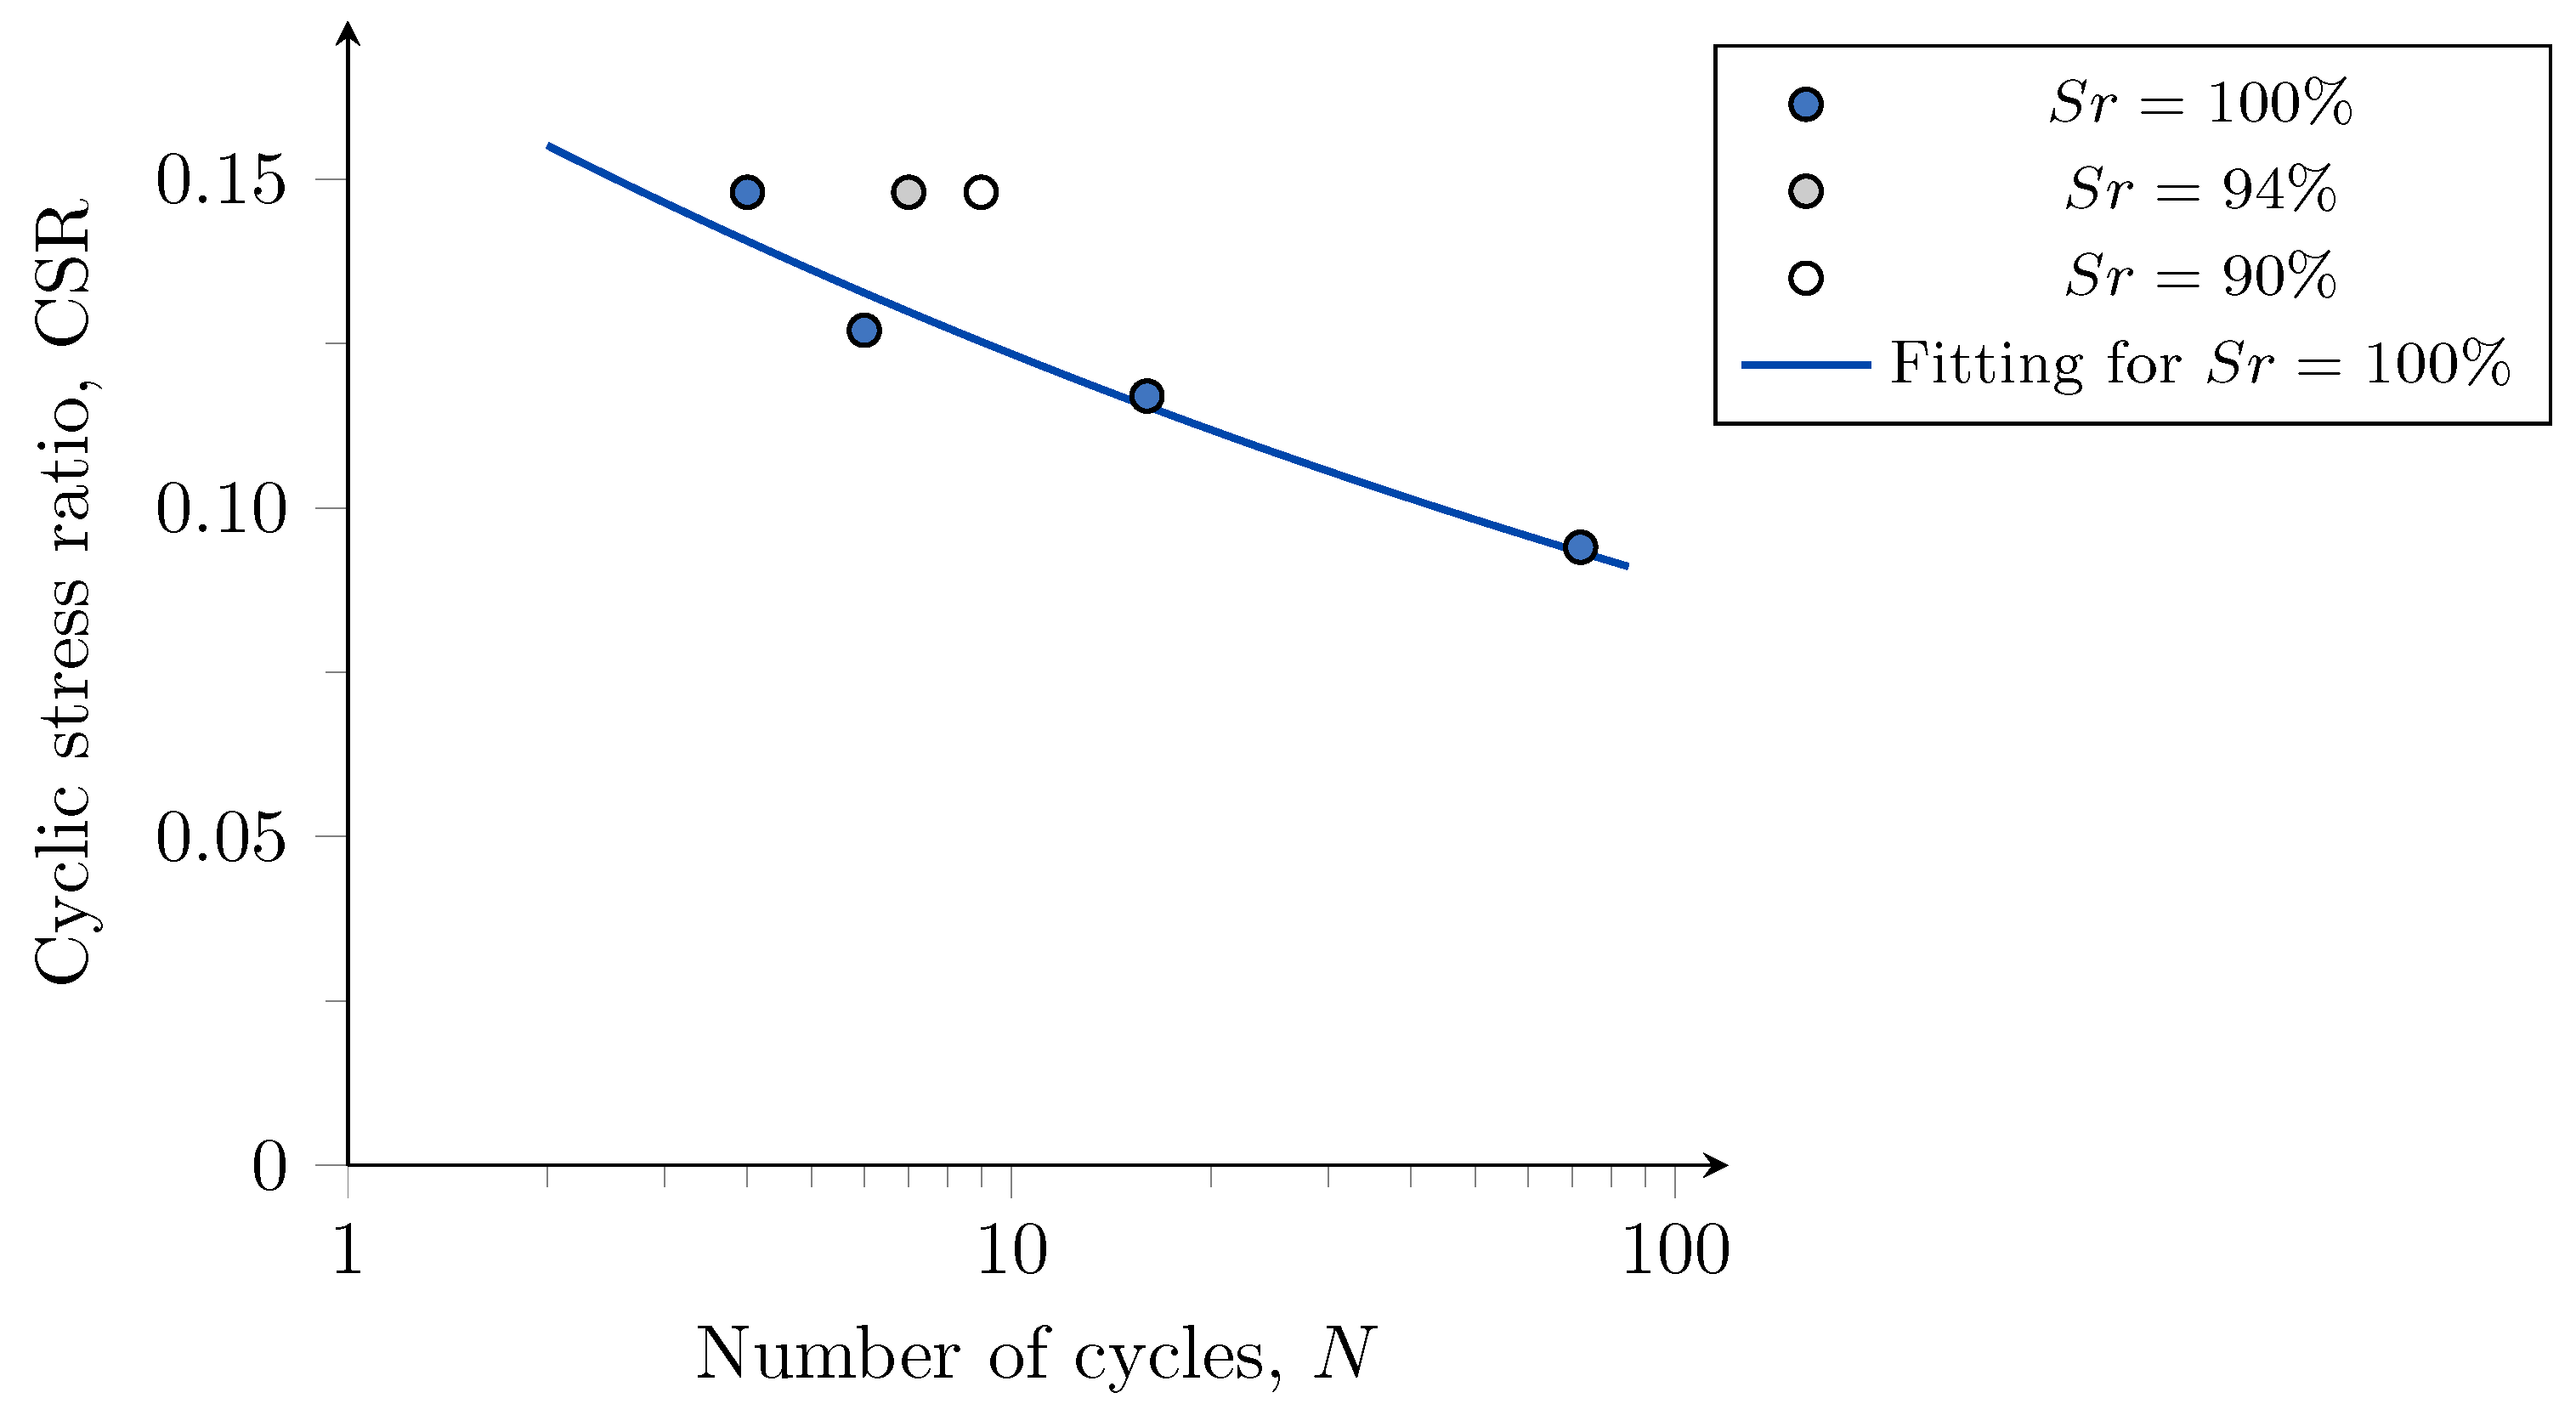
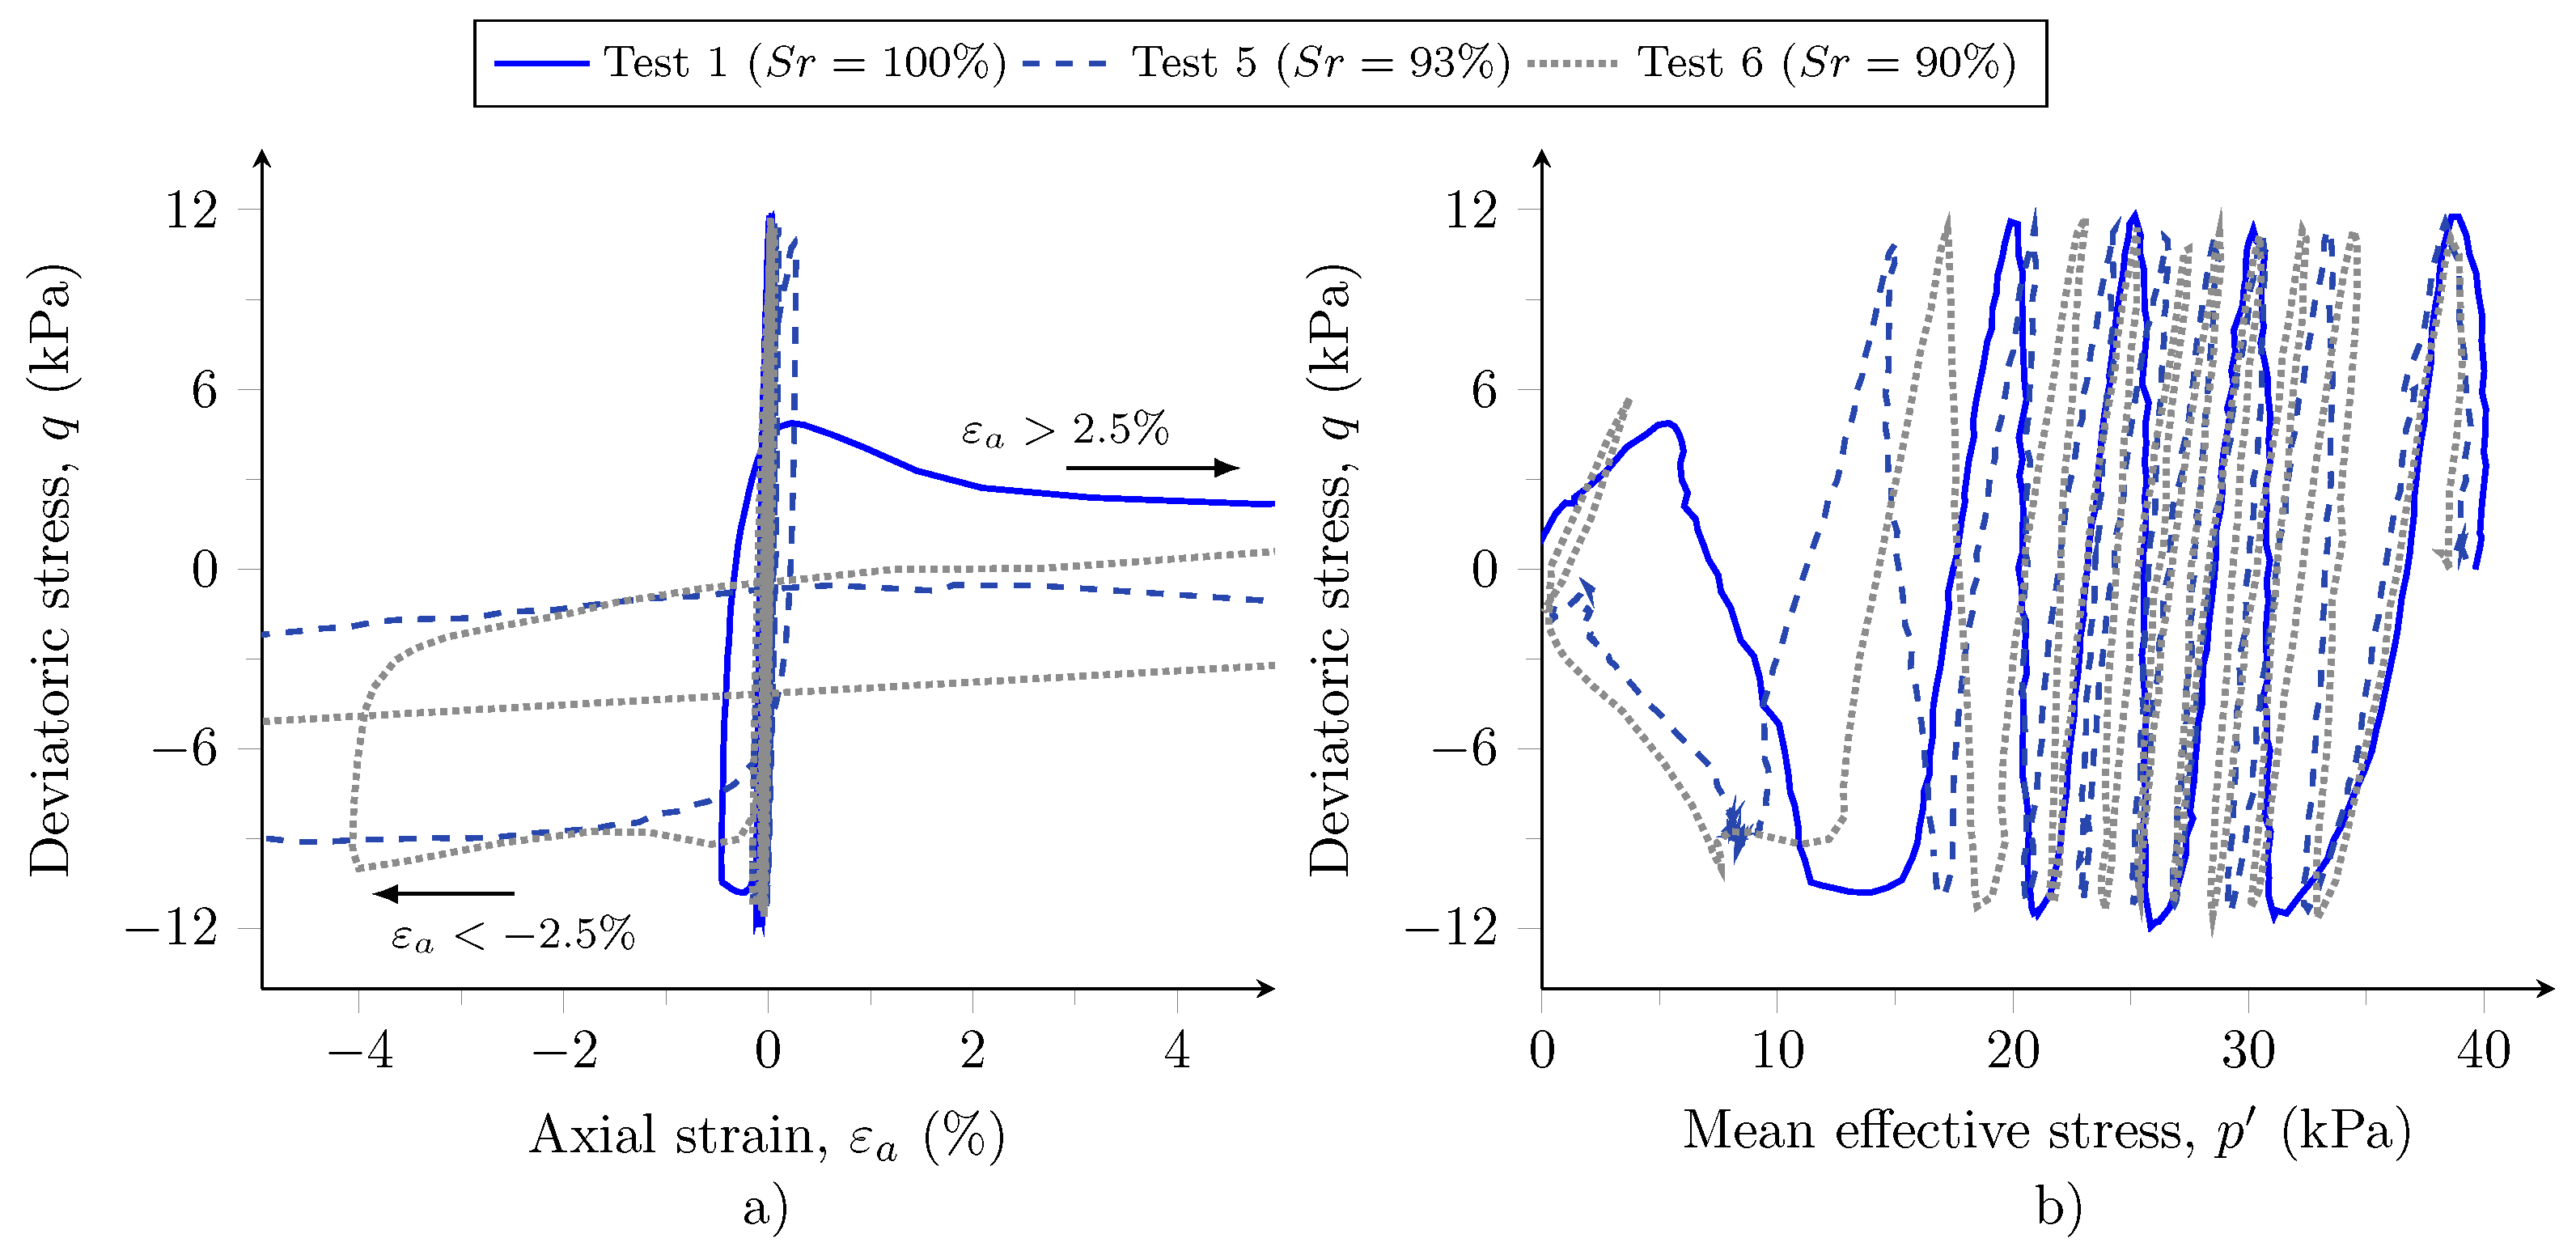
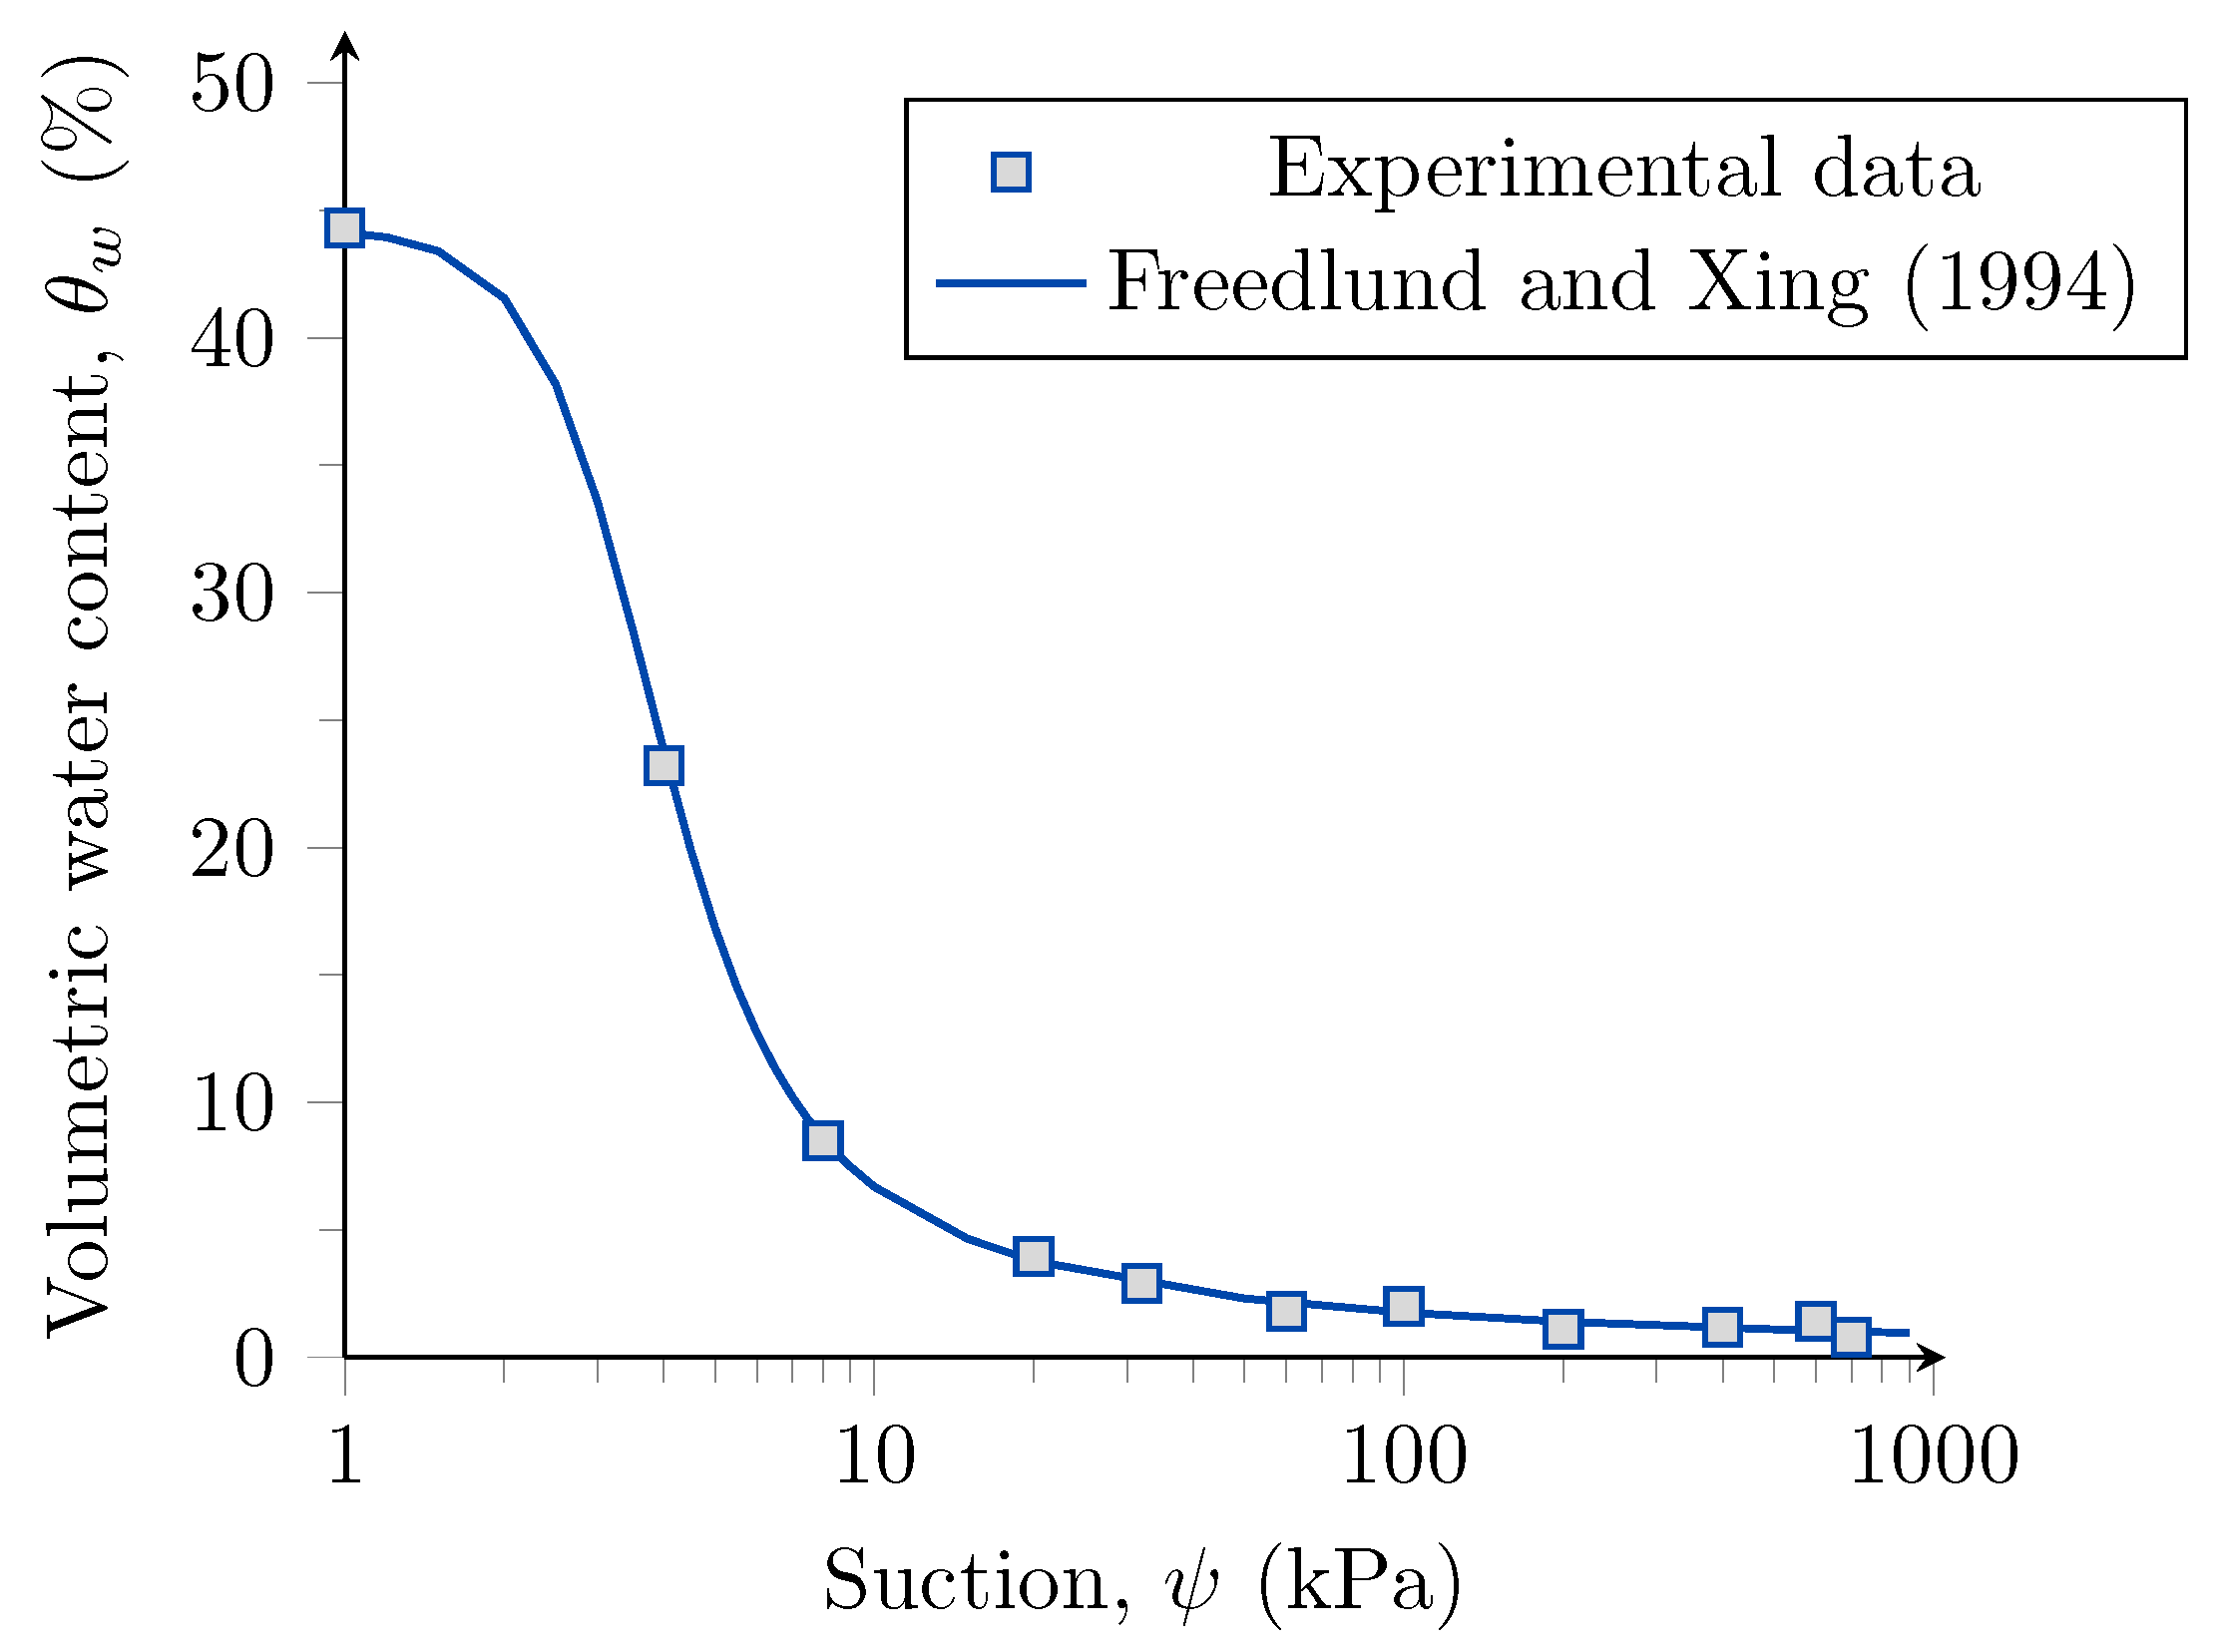
  • The decrease in the degree of saturation of about 7% to 10% almost duplicated the number of cycles to trigger liquefaction of Aveiro sand in full saturation conditions. Such an increment was attributed to the compressibility of the air bubbles in the soil voids. The effects of matric suction are negligible because the low value of air entry (of about 2 kPa) of the studied soil—identified for degrees of saturation higher than 85%.
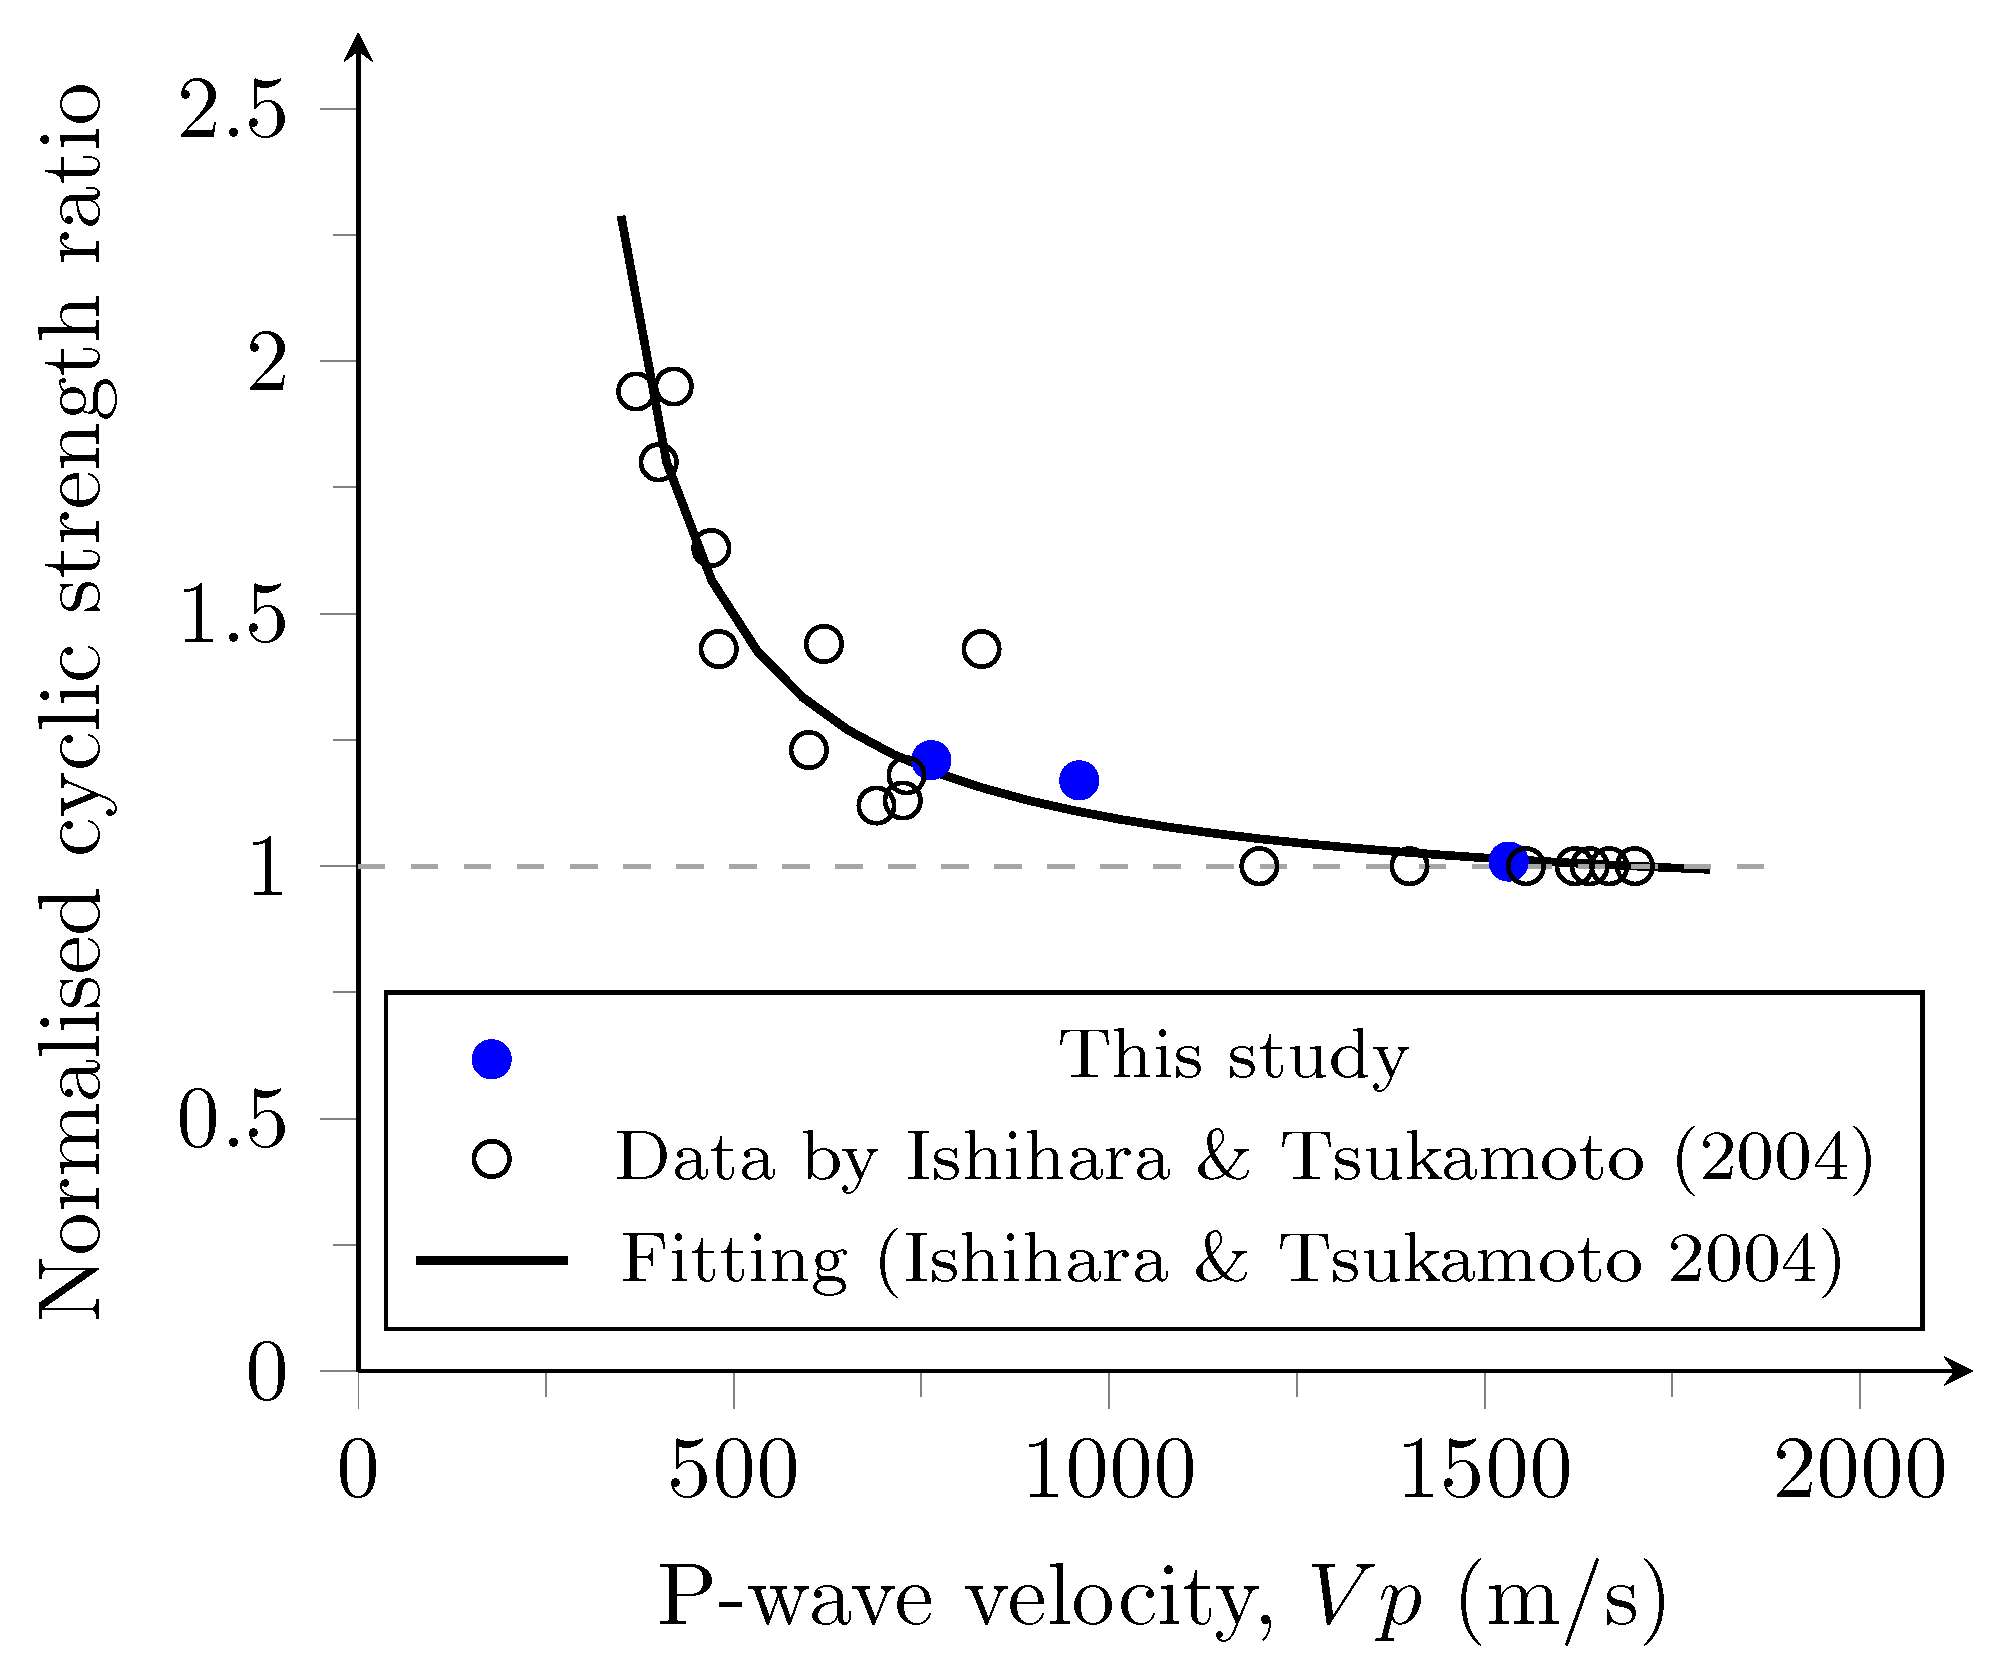
  • The normalised cyclic strength ratio as a function of P-wave velocity adequately described the increment of liquefaction resistance with the decrease in the degree of saturation. Experimental data showed that the liquefaction resistance for S r = 93 % and S r = 90 % is 1.17 and 1.23 times higher than S r = 100 % , respectively. Hence, such an approach provided a model suitable for comparisons of cyclic behaviour of the studied sand against other natural sands reported in the literature.
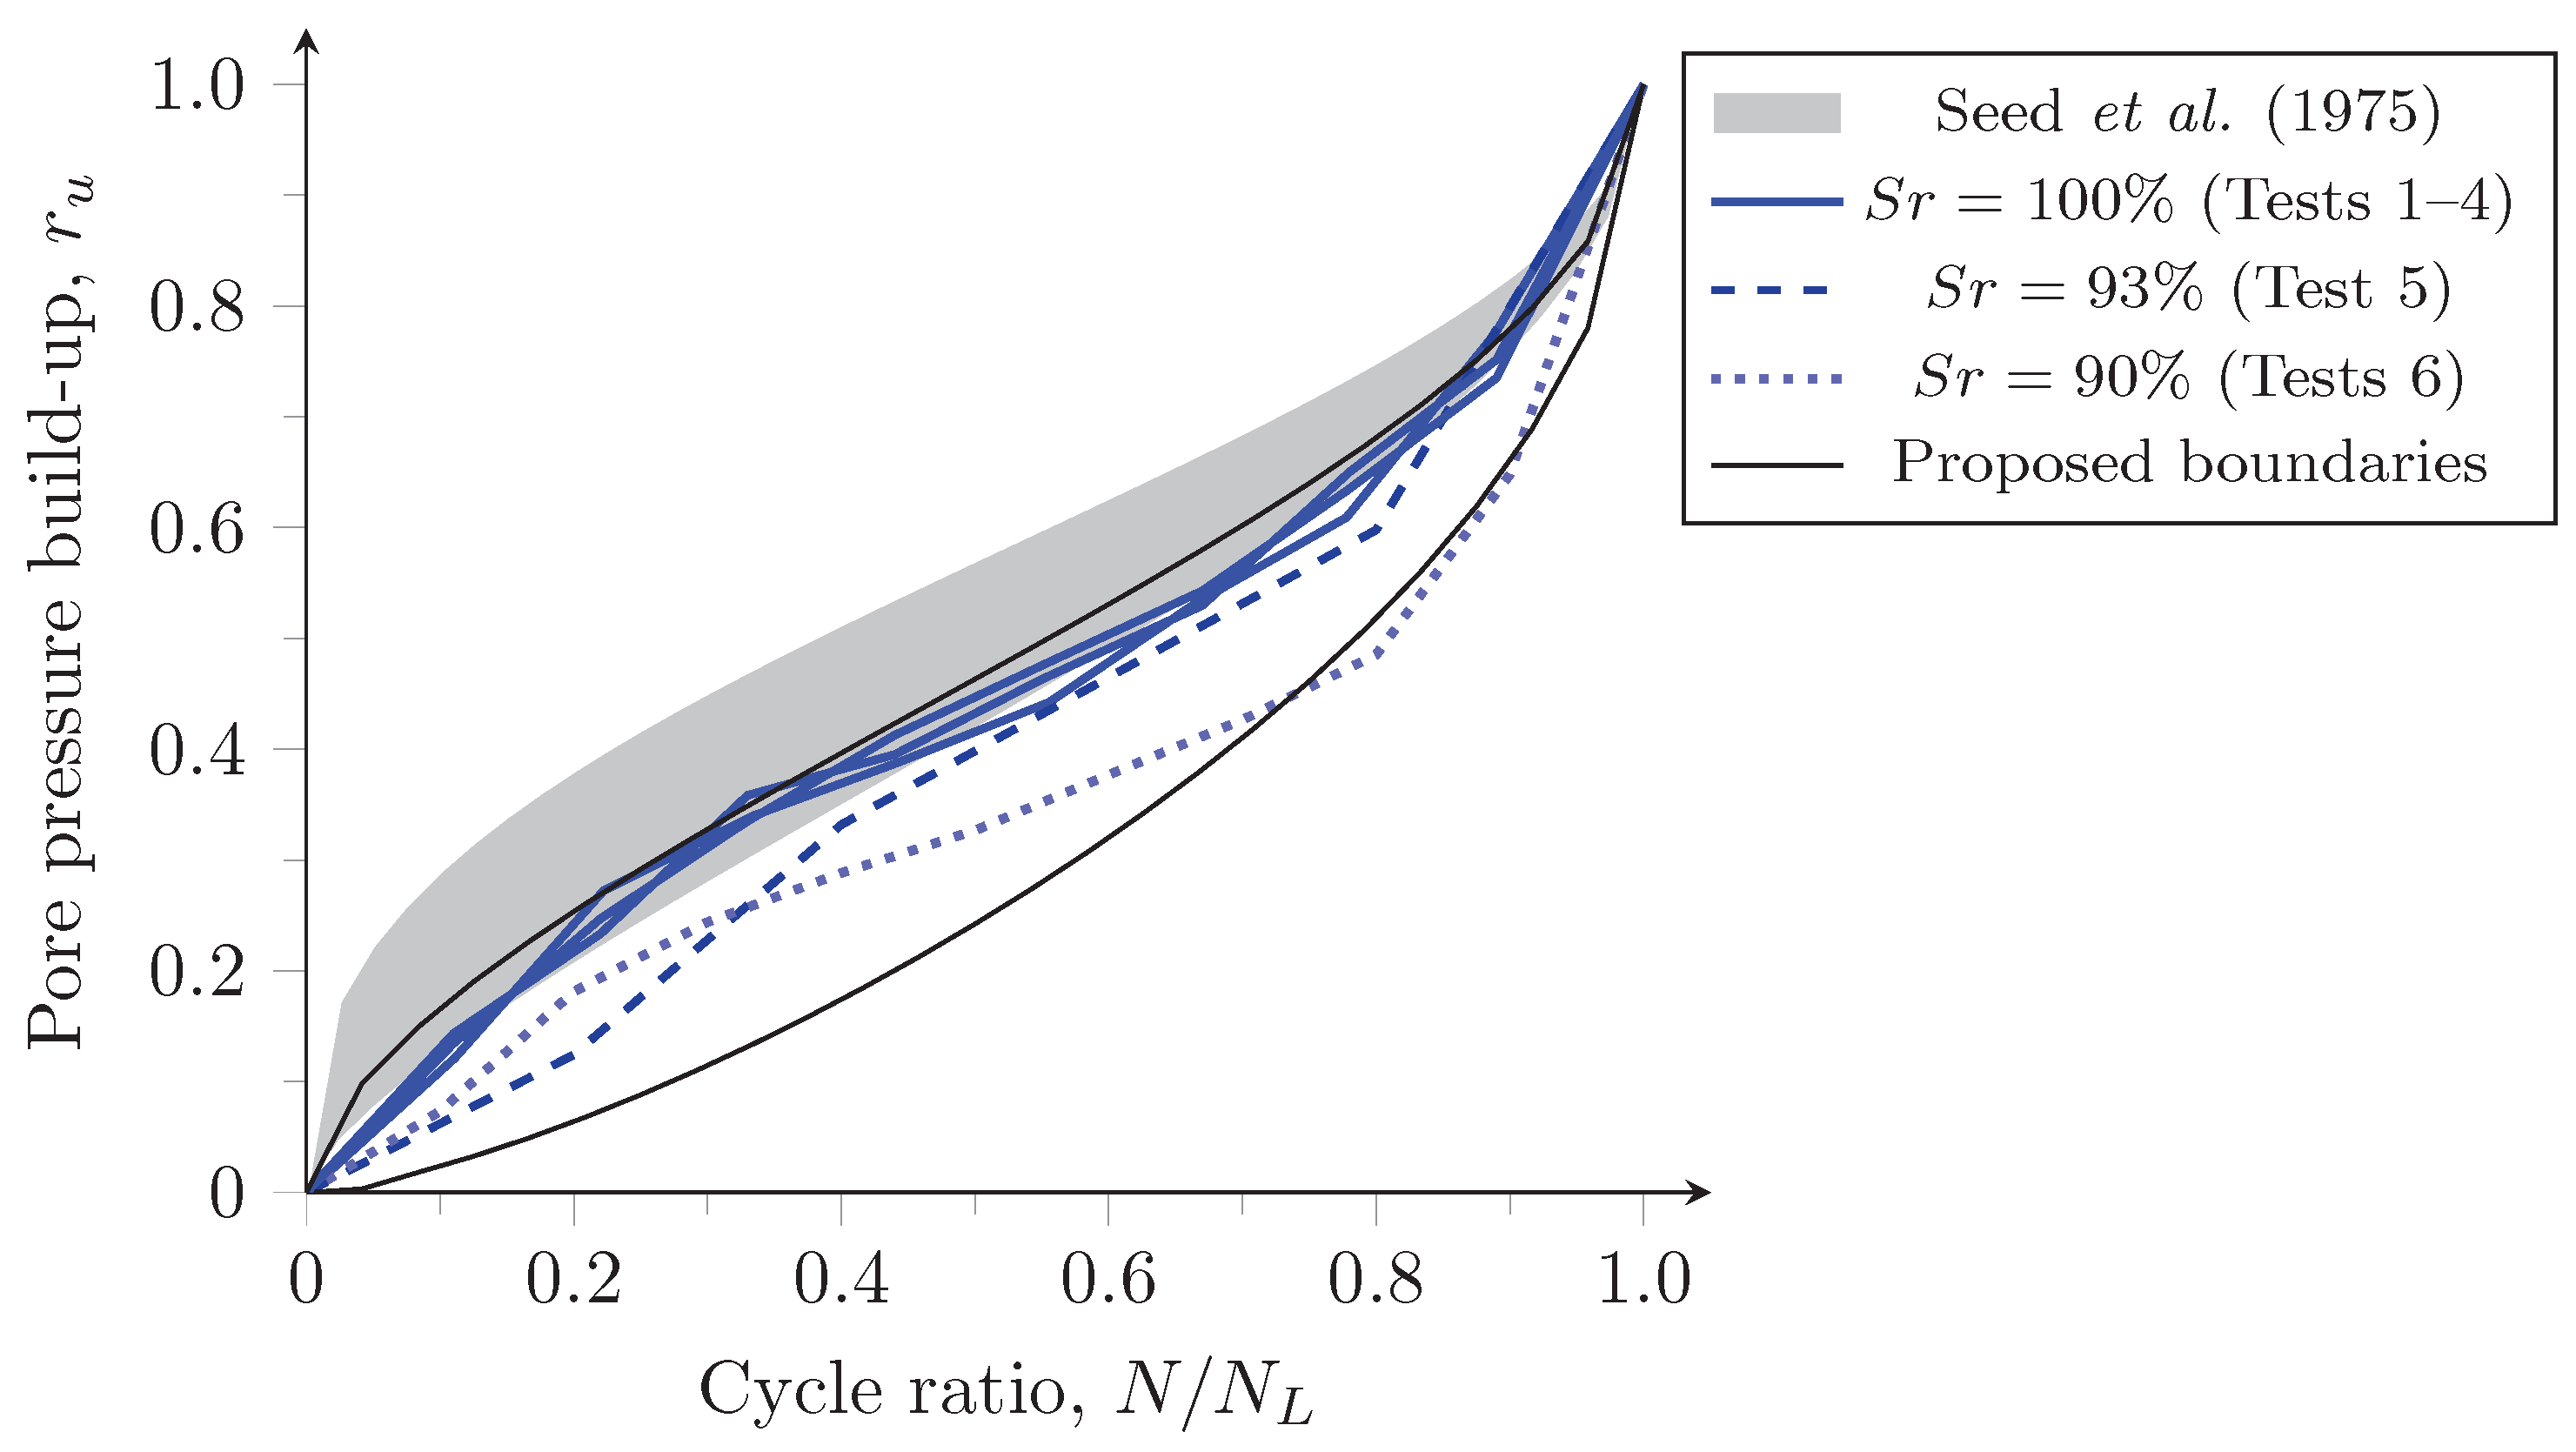
  • The pore pressure evolution results, represented by the curves r u and N / N L , showed that the pore pressure build-up of the unsaturated soil specimens does not fit with the narrow zone suggested by Seed & Idriss [36]. Hence, β = 0.85 and β = 0.35 were recommended to describe the evolution of pore pressure build-up for the studied S r . This is a direct consequence of the presence of the air bubbles in the soil pores during cyclic loading.

Author Contributions

Conceptualisation, D.C., F.M.-G. and C.F.; data curation, D.C.; formal analysis, D.C., F.M.-G., C.F., S.R. and A.V.d.F.; funding acquisition, A.V.d.F.; investigation, D.C.; and F.M.-G.; methodology, D.C., F.M.-G. and C.F.; resources, A.V.d.F.; supervision, C.F., S.R. and A.V.d.F.; validation, C.F., S.R. and A.V.d.F.; visualisation, D.C. and F.M.-G.; writing—original draft preparation, F.M.-G.; writing—review and editing, D.C., C.F., S.R. and A.V.d.F. All authors have read and agreed to the published version of the manuscript.

Funding

This work in FEUP was financially supported by: Base Funding—UIDB/04708/2020 of the CONSTRUCT—Institute of R&D in Structures and Construction funded by national funds through the FCT/MCTES (PIDDAC). The second author acknowledges the financially support of FCT through the grant SFRH/BD/146265/2019.

Institutional Review Board Statement

Not applicable.

Informed Consent Statement

Not applicable.

Data Availability Statement

Not applicable.

Acknowledgments

The authors acknowledge the technical support given by Daniela Coelho and Armando Pinto of LabGeo during the development of the experimental program. Acknowledgements are also due to Carlos Rodrigues for the CPTu data.

Conflicts of Interest

The authors declare no conflict of interest.

References

  1. Lai, C.G.; Bozzoni, F.; Conca, D.; Famà, A.; Özcebe, A.G.; Zuccolo, E.; Meisina, C.; Bonì, R.; Bordoni, M.; Cosentini, R.M.; et al. Cosentini RM Technical guidelines for the assessment of earthquake induced liquefaction hazard at urban scale. Bull. Earthq. Eng. 2021, 19, 4013–4057. [Google Scholar] [CrossRef]
  2. Dashti, S.; Bray, J.D.; Pestana, J.M.; Riemer, M.; Wilson, D. Mechanisms of Seismically Induced Settlement of Buildings with Shallow Foundations on Liquefiable Soil. J. Geotech. Geoenviron. Eng. 2010, 136, 151–164. [Google Scholar] [CrossRef] [Green Version]
  3. Forcellini, D. Numerical simulations of liquefaction on an ordinary building during Italian (20 May 2012) earthquake. Bull. Earthq. Eng. 2020, 17, 4797–4823. [Google Scholar] [CrossRef]
  4. Huang, Y.; Wen, Z. Recent developments of soil improvement methods for seismic liquefaction mitigation. Nat. Hazards 2015, 76, 1927–1938. [Google Scholar] [CrossRef]
  5. Towhata, I. Liquefaction Mitigation Measures: A Historical Review. In Latest Developments in Geotechnical Earthquake Engineering and Soil Dynamics; Sitharam, T., Jakka, R., Kolathayar, S., Eds.; Springer: Singapore, 2021; pp. 41–86. [Google Scholar]
  6. Ravichandran, N. Fully coupled finite element model for dynamics of partially saturated soils. Soil Dyn. Earthq. Eng. 2009, 29, 1294–1304. [Google Scholar] [CrossRef]
  7. Lopez-Caballero, F.; Modaressi-Farahmand-Razavi, A. Numerical simulation of mitigation of liquefaction seismic risk by preloading and its effects on the performance of structures. Soil Dyn. Earthq. Eng. 2013, 49, 27–38. [Google Scholar] [CrossRef]
  8. Lopez-Caballero, F.; Modaressi-Farahmand-Razavi, A. Numerical simulation of liquefaction effects on seismic SSI. Soil Dyn. Earthq. Eng. 2008, 28, 85–98. [Google Scholar] [CrossRef] [Green Version]
  9. Elgamal, A.; Lu, J.; Forcellini, D. Mitigation of Liquefaction-Induced Lateral Deformation in a Sloping Stratum: Three-dimensional Numerical Simulation. J. Geotech. Geoenviron. Eng. 2009, 135, 1672–1682. [Google Scholar] [CrossRef]
  10. Tatsuoka, F.; Toki, S.; Miura, S.; Kato, H.; Okamoto, M.; Yamada, S.-I.; Yasuda, S.; Tanizawa, F. Some factors affecting cyclic undrained triaxial strength of sands. Soils Found. 1986, 26, 99–116. [Google Scholar] [CrossRef] [Green Version]
  11. He, J.; Chu, J.; Liu, H. Undrained shear strength of desaturated loose sand under monotonic shearing. Soils Found. 2014, 54, 910–916. [Google Scholar] [CrossRef] [Green Version]
  12. Zeybek, A.; Madabhushi, G.S.P. Physical modelling of air injection to remediate liquefaction. Int. J. Phys. Model. Geotech. 2018, 18, 68–80. [Google Scholar] [CrossRef] [Green Version]
  13. Yegian, M.K.; Eseller-Bayat, E.; Alshawabkeh, A.; Ali, S. Induced-partial saturation for liquefaction mitigation: Experimental investigation. J. Geotech. Geoenviron. Eng. 2007, 134, 372–380. [Google Scholar] [CrossRef] [Green Version]
  14. Mele, L.; Tan Tian, J.; Lirer, S.; Flora, A.; Koseki, J. Liquefaction resistance of unsaturated sands: Experimental evidence and theoretical interpretation. Géotechnique 2019, 69, 541–553. [Google Scholar] [CrossRef]
  15. Molina-Gómez, F.; Bulla-Cruz, L.A.; Moreno-Anselmi, L.A.; Ruge, J.C.; Arévalo-Daza, C. Assessment of groundwater levelvariations using multivariate statistical methods. Ing. E Investig. 2019, 39, 36–42. [Google Scholar]
  16. Flora, A.; Bilotta, E.; Chiaradonna, A.; Lier, S.; Mele, L.; Pingue, L. A field trial to test the efficiency of induced partial saturation and horizontal drains to mitigate the susceptibility of soils to liquefaction. Bull. Earthq. Eng. 2021, 19, 3835–3864. [Google Scholar] [CrossRef]
  17. Rodrigues, C.; Amoroso, S.; Viana da Fonseca, A.; Cruz, N. Estudo do risco de liquefação das areias de Aveiro a partir de ensaios SCPTU e SDMT. In 14 Congresso Nacional de Geotecnia; UBI: Covilhã, Portugal, 2014. (In Portuguese) [Google Scholar]
  18. Eurocode 8—Design of Structures for Earthquake Resistance. Part 5: Foundations, Retaining Structures and Geotechnical Aspects; European Committee for Standardization: Brussels, Belgium, 2005; p. 229.
  19. Amoroso, S.; Rodrigues, C.; Viana da Fonseca, A.; Cruz, N. Liquefaction Evaluation of Aveiro Sands from SCPTU and SDMT Tests. In Proceedings of the 3rd International Conference on the Flat Dilatometer, Rome, Italy, 14–17 June 2015. [Google Scholar]
  20. Robertson, P.K. Interpretation of cone penetration tests—A unified approach. Can. Geotech. J. 2009, 46, 1337–1355. [Google Scholar] [CrossRef] [Green Version]
  21. Molina-Gómez, F.; Viana da Fonseca, A.; Ferreira, C.; Sousa, F.; Bulla-Cruz, L.A. Defining the soil stratigraphy from seismic piezocone data: A clustering approach. Eng. Geol. 2021, 287, 106111. [Google Scholar] [CrossRef]
  22. Tsuchida, H. Prediction and countermeasure against the liquefaction in sand deposits. In Seminar in the Port and Harbour Research Institute; Ministry of Transport of Japan: Yokosuka, Japan, 1970; pp. 3.1–3.2. (In Japanese) [Google Scholar]
  23. Ramos, C.; Ferreira, C.; Molina-Gómez, F.; Viana da Fonseca, A. Critical state lines of Portuguese liquefiable sands. E3S Web Conf. 2019, 92, 06003. [Google Scholar] [CrossRef]
  24. Cho, G.-C.; Dodds, J.; Santamarina, J.C. Particle Shape Effects on Packing Density, Stiffness, and Strength: Natural and Crushed Sands. J. Geotech. Geoenviron. Eng. 2006, 132, 591–602. [Google Scholar] [CrossRef] [Green Version]
  25. Viana da Fonseca, A.; Cordeiro, D.; Molina-Gómez, F. Recommended Procedures to Assess Critical State Locus from Triaxial Tests in Cohesionless Remoulded Samples. Geotechnics 2021, 1, 95–127. [Google Scholar] [CrossRef]
  26. Viana da Fonseca, A.; Ferreira, C.; Fahey, M. A Framework Interpreting Bender Element Tests, Combining Time-Domain and Frequency-Domain Methods. Geotech. Test. J. 2009, 32, 100974. [Google Scholar]
  27. Molina-Gómez, F.; Viana da Fonseca, A.; Ferreira, C.; Camacho-Tauta, J. Dynamic properties of two historically liquefiable sands in the Lisbon area. Soil Dyn. Earthq. Eng. 2020, 132, 106101. [Google Scholar] [CrossRef]
  28. D6836—Standard Test Methods for Determination of the Soil Water Chararcteristic Curve for Desorption Using a Hanging Column, Pressure Extractor, Chilled Mirror Hygrometer, and/or Centrifuge; ASTM International: West Conshohocken, PA, USA, 2016.
  29. Soares, M.; Viana da Fonseca, A. Factors Affecting Steady State Locus in Triaxial Tests. Geotech. Test. J. 2016, 36, 20150228. [Google Scholar] [CrossRef]
  30. Ferreira, C.; Díaz-Durán, F.; Viana da Fonseca, A.; Cascante, G. New approach to concurrent Vs and Vp measurements using bender elements. Geotech. Test. J. 2021, 44, 1801. [Google Scholar] [CrossRef]
  31. Yang, J. Liquefaction resistance of sand in relation to P-wave velocity. Géotechnique 2002, 52, 295–298. [Google Scholar] [CrossRef]
  32. Santamarina, J.C.; Klein, K.A.; Fam, M.A. Soils and Waves, 1st ed.; John Wiley & Sons, Ltd.: Chichester, UK, 2001. [Google Scholar]
  33. Fredlund, D.G.; Xing, A. Equations for the soil-water characteristic curve. Can. Geotech. J. 1994, 31, 521–532. [Google Scholar] [CrossRef]
  34. Tamura, S.; Tokimatsu, K.; Abe, A.; Sato, M. Effects of air bubbles on B-value and P-wave velocity of a partly saturated sand. Soils Found. 2002, 42, 121–191. [Google Scholar] [CrossRef] [Green Version]
  35. Ishihara, K.; Tsukamoto, Y. Cyclic strength of imperfectly saturated sands and analysis of liquefaction. Proc. Jpn. Acad. 2004, 80, 372–391. [Google Scholar] [CrossRef] [Green Version]
  36. Seed, H.B.; Idriss, I.M. Simplified procedure for evaluating liquefaction potential. J. Soil Mech. Found. Div. 1971, 97, 1249–1273. [Google Scholar] [CrossRef]
Figure 1. Location of the investigation site (adapted from Google Earth).
Geotechnics 02 00001 g001
Figure 2. CPTu profiles.
Geotechnics 02 00001 g002
Figure 3. Grain size distribution curve.
Geotechnics 02 00001 g003
Figure 4. Soil specimen with internal instrumentation and piezo-electric transducers.
Geotechnics 02 00001 g004
Figure 5. Typical signals of P-wave during triaxial testing (Test 1, t t 64 μs).
Geotechnics 02 00001 g005
Figure 6. Relationship between B-value and V p .
Geotechnics 02 00001 g006
Figure 7. Soil-water characteristic curve.
Geotechnics 02 00001 g007
Figure 8. Results of cyclic stress ratio versus number of cycles to trigger liquefaction.
Geotechnics 02 00001 g008
Figure 9. Comparison between cyclic triaxial tests under different S r : (a) stress-strain behaviour; (b) stress-paths.
Geotechnics 02 00001 g009
Figure 10. Normalised cyclic strength ratio as a function of V p .
Geotechnics 02 00001 g010
Figure 11. Evolution of pore pressure build-up for the different degrees of saturation.
Geotechnics 02 00001 g011
Table 1. Seismic actions of Aveiro site.
ParameterType 1Type 2
Seismic zone1.62.4
M w 7.24.4
a g R (m/s2)0.351.1
γ I 11
a g 0.351.1
Ground typeDD
S m a x 2.002.00
S2.001.97
a m a x (m/s2)0.702.16
a m a x (g)0.700.22
Table 2. Physical properties of the Av-sand.
ParameterValue
G s 2.67
e m a x 0.88
e m i n 0.53
FC (%)4.60
D 50 (mm)0.23
C c 2.31
C u 1.24
Table 3. Particle shape parameters.
ParameterSymbolValue
SphericityS0.70
RoundnessR0.57
Regularity ρ = ( S + R ) / 2 0.64
Table 4. Final values obtained for each specimen after the saturation stage.
TestBack-Pressure (kPa)B-Value V p (m/s)
15000.981532
25000.981567
35000.971570
41500.981512
51500.84690
61000.69763
Table 5. Final test conditions and number of cycles to trigger the liquefaction.
Test Dr (%) Sr (%)CSR N L
1341000.1484
2351000.1276
3361000.11716
4331000.09571
535930.1527
634900.1519
Publisher’s Note: MDPI stays neutral with regard to jurisdictional claims in published maps and institutional affiliations.

