1. Introduction
Chronic obstructive pulmonary disease (COPD) remains a major cause of preventable morbidity and mortality, reduced quality of life, and substantial healthcare use and expenditure worldwide [
1,
2,
3,
4,
5,
6,
7,
8]. Exacerbations are central to this burden, because they destabilize disease control, drive unscheduled care, and often prompt treatment reassessment or escalation [
1]. Because COPD is predominantly managed in primary care, early recognition of clinical instability is crucial for prevention, therapeutic optimization, and resource allocation [
8,
9,
10,
11,
12].
Instability is not confined to advanced airflow limitation or to the classical “frequent exacerbator” phenotype. Observational and prognostic studies show that even a single moderate or severe exacerbation is associated with an increased risk of subsequent events, hospitalization, and adverse outcomes [
13,
14,
15,
16,
17,
18,
19]. Reflecting this evidence, the 2026 update of the Global Initiative for Chronic Obstructive Lung Disease (GOLD) lowers the prior-year threshold for clinical assessment to any exacerbation, defined as a ≥1 moderate or severe event [
1]. This change may improve sensitivity to early vulnerability and help reduce therapeutic inertia [
20].
When applied to routinely collected electronic health records (EHRs), however, the meaning of “≥1 recorded exacerbation” is not self-evident. Such a record may reflect persistent systemic vulnerability, but it may also capture an isolated context-dependent event, variation in care-seeking, prescribing thresholds, documentation practices, or differences in data capture across settings [
1,
15]. Accordingly, in real-world primary-care EHRs, the GOLD 2026 criterion is better understood as a high-sensitivity operational signal than as a homogeneous high-risk phenotype. Here and throughout, “high-sensitivity” refers to the lower-threshold operating point of the endpoint, not to formally estimated diagnostic-test sensitivity.
This distinction is especially relevant in multimorbid COPD. Cardiovascular, metabolic, psychiatric, renal, and musculoskeletal comorbidities are common and can influence symptoms, treatment decisions, healthcare use, and outcome recording [
1,
21,
22,
23,
24,
25,
26,
27,
28]. In addition, different operational manifestations of instability are related but not interchangeable. Any exacerbation, recurrent or severe exacerbations, hospitalization, and reliever dispensing may share underlying vulnerability while also reflecting endpoint-specific clinical, behavioral, prescribing, access, adherence, and recording processes [
1,
29,
30,
31,
32]. Reliever-dispensing endpoints should therefore be interpreted as mixed clinical–operational indicators rather than direct biological endpoints or medication-effect estimands. This multidimensional view is consistent with treatable-traits and profile-based approaches, which frame COPD management as the integration of overlapping but non-equivalent domains [
33,
34,
35,
36].
Previous studies have linked comorbidity burden to COPD prognosis, often using mortality or other global outcomes [
26,
27,
37,
38,
39]. Although informative, these outcomes do not directly address day-to-day instability in primary care under the recalibrated GOLD 2026 threshold. It therefore remains unclear whether the ≥1 exacerbation criterion identifies a coherent multimorbidity-related structure when operationalized in routine primary-care EHRs and compared with stricter exacerbation-defined and reliever-dispensing endpoints.
To address this question, we conducted a retrospective multicenter pilot study using routine primary-care EHRs. Predictors and endpoints were summarized within a shared 12-month pre-index window, so the study was designed to characterize within-window conditional associations rather than causal, treatment, or prospective risk-prediction effects. We prespecified six binary exacerbation-defined and reliever-dispensing endpoints and analyzed them jointly within a Bayesian multi-outcome hierarchical framework [
40,
41,
42,
43]. More broadly, structured multivariate modeling of EHR data has emphasized the value of preserving latent clinical structure rather than treating recorded variables in isolation [
44]. Our primary objective was to determine whether the GOLD 2026 “any exacerbation” criterion captures a coherent operational pattern of COPD instability in routine primary-care EHRs or whether its greater operating-point sensitivity is accompanied by clinically relevant heterogeneity across related endpoints.
2. Materials and Methods
2.1. Study Design, Data Source, and Inferential Target
We conducted a retrospective, multicenter, observational pilot study using anonymized routinely collected electronic health record (EHR) data from two public primary-care centers within the Spanish National Health System, located in Valencia and Seville, Spain. The study was embedded within the Seleida Project, an initiative focused on developing auditable EHR-based analytical workflows for chronic respiratory disease in routine primary care [
45,
46].
The analytical design was outcome-anchored and within-window. For each patient, all descriptors and endpoints were aggregated over the same fixed 12-month retrospective window preceding a prespecified index date. This structure mirrors the prior-year logic of COPD exacerbation history assessment in clinical guidance [
1,
21,
31] and avoids exposure–outcome window mismatch. The estimand was therefore the patient-level conditional association structure within that window after accounting for residual patient-level heterogeneity. In practical terms, the study evaluated which routinely recorded patient descriptors co-occurred with each operational instability endpoint during the same prior-year EHR window; it was not designed to estimate causal, medication-effect, or forward-time predictive estimands. Patient-level cross-validation was used only to assess reproducibility across individuals under the same deterministic aggregation scheme, not to validate a prospective prognostic model.
Data sources comprised structured clinical EHRs, prescription registries, dispensing registries, and healthcare-utilization databases, including hospitalization indicators. Dispensing registries were prioritized when evaluating medication acquisition because they reduce misclassification from unfilled prescriptions. Dispensing was interpreted as medication acquisition, not as confirmed inhaler use, adherence, or biological exposure.
Records were deterministically linked at the individual level using a pseudonymized unique patient identifier; no probabilistic linkage was performed. All inputs were harmonized through a fully scripted, versioned, audit-ready preprocessing workflow including deterministic normalization, role-based variable mapping, internal consistency checks, and prespecified recording-quality filters. Additional technical details are provided in
Supplementary Section S1.
Ethical approval was obtained from the regional ethics committees in Valencia (CEIm 132.22; 6 March 2023) and Andalusia (1140-N-23; 12 September 2023), with endorsement by the SEMERGEN Research Department (2023-00035). Reporting followed RECORD and STROBE recommendations [
47,
48]. All procedures complied with the General Data Protection Regulation (EU 2016/679) and applicable Spanish legislation. Because only anonymized retrospective data were analyzed, informed consent was waived.
2.2. Study Population and Sampling
Eligibility required an age of 40–80 years, a recorded diagnosis of COPD, and evidence of active chronic respiratory disease management in routine primary care, consistent with guideline-based diagnostic frameworks [
1,
21,
31].
Among 82,631 registered patients across the two participating centers, 3989 were identified in the EHR systems as potentially meeting broad COPD eligibility criteria. This figure served as the source EHR denominator, but it was not converted into a fully extracted, linked, harmonized, and clinically audited analytic cohort, because the study was not designed as a population-level analysis of the complete COPD registry.
Instead, we used a prespecified random pilot sample of 110 individuals, selected between May and July 2024 for manual chart-level extraction, linkage, harmonization, and clinical auditing. The aim was to create an auditable pilot dataset suitable for endpoint construction, recording-quality assessment, and Bayesian structural modeling under sparse-event conditions, not to support formal representativeness claims relative to the 3989-patient source denominator.
The index date was defined as the sampling/extraction date. All predictors and endpoints were aggregated over the 12 months immediately preceding this date. After deterministic linkage and harmonization, active COPD management was re-verified using the predefined requirement of documented maintenance or rescue inhaled respiratory therapy during the study window. Four sampled individuals were excluded because no such therapy was recorded in the harmonized dataset during that period.
In retrospective EHR data, the absence of recorded inhaled therapy may reflect incomplete documentation, data entry error, inactive or miscoded COPD, untreated very mild disease, poor adherence or non-dispensation, unrecorded external care, or administrative misclassification. This exclusion was therefore prespecified as a recording-quality and active-management safeguard, particularly because treatment and dispensing records contributed to several endpoint definitions.
The final analytic cohort comprised 106 patients. It was considered suitable for the methodological and structural aims of the study but not for definitive population-level estimation or formal representativeness claims relative to the source denominator. The unit of inference was the individual patient; repeated EHR entries were deterministically aggregated into one record per patient, and residual patient-level heterogeneity was modeled explicitly in the Bayesian framework. A participant flow diagram is provided in
Figure S2.1 in accordance with RECORD recommendations [
47].
2.3. Variables, Operational Definitions, and Endpoint Construction
All variables were summarized at the patient level within the same fixed 12-month retrospective window. Descriptors and endpoints should therefore be interpreted as within-window EHR constructs, not as temporally ordered exposures and outcomes.
Predictors were grouped a priori into two domains. The first comprised etiological and baseline descriptors, including age, sex, and systemic comorbidities routinely recorded in primary care. Age was encoded in 10-year units during data construction. Systemic comorbidities were operationalized as binary EHR-recorded absence/presence indicators and included cardiovascular, metabolic, renal, psychiatric, respiratory, musculoskeletal, anemia-related, obesity/BMI-related, and allergy-related descriptors clinically relevant to COPD multimorbidity [
1,
22,
23,
24,
25,
26,
27,
28]. These included hypertension, diabetes mellitus, dyslipidemia, obesity, heart failure, ischemic heart disease, arrhythmias, chronic kidney disease, obstructive sleep apnea, anxiety–depressive disorder, gastroesophageal reflux disease, bronchiectasis, osteoporosis, peripheral arterial disease, anemia, and allergy-related descriptors.
The second domain comprised clinical management and care-pathway descriptors, including inhaled maintenance-regimen patterns and prespecified markers of management intensity derived primarily from prescription and dispensing registries. These variables were interpreted as operational descriptors of care pathways, healthcare contact, medication access, refill/adherence-related behavior, and prescribing practices, not as medication-effect estimands.
Exacerbation endpoints were defined using guideline-aligned constructs adapted to routinely recorded primary-care and healthcare-utilization data [
1,
21,
31,
49]. A moderate exacerbation was defined as acute COPD-related symptomatic worsening requiring systemic corticosteroids with or without antibiotics. A severe exacerbation was defined as an exacerbation requiring hospital admission, ascertained through linked healthcare-utilization data.
Three exacerbation-defined binary endpoints were prespecified: any exacerbation, aligned with the GOLD 2026 low-threshold criterion of a ≥1 moderate or severe event; high-risk exacerbation history, aligned with the GOLD 2025 criterion of a ≥2 moderate or ≥1 severe event; and severe exacerbation requiring hospitalization, defined as a ≥1 hospitalization for COPD exacerbation.
Three reliever-dispensing endpoints were also prespecified: ≥1 SABA dispensed package/year, ≥1 SAMA dispensed package/year, and ≥1 SABA and/or SAMA dispensed package/year. These endpoints were treated as mixed clinical–operational indicators because dispensing may reflect symptom burden, medication access, refill behavior, adherence-related patterns, prescribing thresholds, follow-up intensity, healthcare contact, and recording structure. They were not interpreted as biological endpoints, medication effects, or causal consequences of treatment.
To prevent circular inference, variables contributing directly to endpoint construction were excluded from the corresponding predictor sets. This design-based exclusion was prespecified and maintained within the joint multi-outcome framework.
2.4. Deterministic Normalization, Recording-Quality Filters, and Missingness Encoding
Raw EHR values were normalized using deterministic preprocessing rules before model fitting. Administrative placeholder codes, empty strings, implausible entries, and explicit “unknown” categories were recoded as missing according to prespecified criteria. Observed binary variables were harmonized to 0/1 coding. All six endpoints were fully observed in the final analytic cohort; therefore, no endpoint imputation was performed.
Predictor missingness was handled through a prespecified two-step design-matrix strategy. First, candidate predictors were screened using outcome-independent recording-quality filters before numerical placeholder assignment and model fitting. Predictors with ≥20% missingness or extreme binary sparsity were excluded, except for a clinically prespecified forced core set comprising sex, age, smoking status, obesity/BMI-related information, heart failure, and obstructive sleep apnea. This forced core set was retained irrespective of missingness or class size because of its clinical relevance to COPD instability and EHR recording structure. The exception was prespecified and not outcome-driven.
Second, retained predictors with missing values were modeled with explicit missingness indicators. Numerical placeholders only were used to complete the design matrix and should not be interpreted as observed values, clinical absence, normal BMI, never-smoking status, or recovered information. Thus, observed absence and unrecorded status entered the model as distinct covariate patterns. Missingness-indicator coefficients were treated as nuisance adjustment terms, not as primary clinical signals.
In the primary specification, missing binary values were assigned a 0 numerical placeholder, with the corresponding missingness indicators retained. In the missingness-coding sensitivity specification, missing binary values were assigned the observed-prevalence numerical placeholder instead, again retaining the same missingness indicators. Continuous predictors were assigned the observed-mean numerical placeholder when required for matrix construction. This strategy preserved the analytic cohort and made missingness explicit, but it did not recover unobserved values, identify the missingness mechanism, or constitute multiple imputations.
Complete-case analysis was not used because it would have discarded a substantial proportion of this small pilot cohort and could have introduced selection bias, particularly through BMI/obesity and smoking-status recording gaps.
Multiple imputation was not used because, in a small retrospective EHR cohort with sparse endpoints and plausible recording-dependent missingness, it would require strong unverifiable assumptions about the missing-data mechanism and could introduce model-driven pseudo-information.
Continuous BMI and the BMI categories shown in
Table 1 were descriptive only. The analytical anthropometric predictor was binary obesity, defined as a BMI ≥ 30 kg/m
2 among patients with a recorded BMI. Patients with a recorded BMI < 30 kg/m
2 were treated as observed non-obese. Patients without a recorded BMI were not classified as non-obese; they were treated as missing for the obesity variable and modeled with an explicit missingness indicator.
Smoking status was extracted from structured EHR fields and treated as a record-structured descriptor rather than as a fully validated lifetime smoking-history variable. No patient had an explicit structured EHR entry coded as a never-smoker. Therefore, the descriptive category “Recorded never smoker = 0” denotes the absence of recorded never-smoking status, not evidence that the cohort contained no true never-smokers. Unknown smoking status was not recoded as never-smoking and was handled through the missingness-indicator strategy.
2.5. Study Objectives, Event Frequency, and Bayesian Rationale
The primary objective was to evaluate whether the GOLD 2026 prior-year criterion—defined as ≥1 moderate or severe exacerbation within the shared 12-month window—behaved as a coherent high-sensitivity operational signal when compared with stricter exacerbation-defined endpoints and reliever-dispensing endpoints. The GOLD 2026 endpoint was therefore evaluated as an operational signal, not as a homogeneous high-risk phenotype. In this study, “high-sensitivity” is used in an endpoint-operating-point sense, denoting broader capture under a lower prior-year exacerbation threshold; it does not denote formally estimated diagnostic sensitivity against an external adjudication standard.
Secondary objectives were to compare association structures across exacerbation endpoints of increasing clinical specificity, examine reliever-dispensing endpoints as a mixed clinical–operational domain, and assess robustness across alternative model specifications, missingness-coding rules, and exclusion of highly incomplete descriptors.
The six prespecified endpoints were any exacerbation (GOLD 2026), high-risk exacerbation history (GOLD 2025), severe exacerbation requiring hospitalization, SABA dispensing, SAMA dispensing, and any rescue bronchodilator dispensing. Coherence was defined a priori as directionally consistent, clinically plausible, and uncertainty-aware association patterns across related endpoints, not as statistical significance of isolated coefficients.
No formal sample-size calculation for population-level effect estimation was performed. The analytic cohort was a manually audited pilot cohort designed to evaluate endpoint construction, recording-quality procedures, structural coherence, and model behavior under sparse-event conditions. It was not designed for definitive population-level estimation or formal representativeness claims relative to the 3989-patient source EHR denominator.
Endpoint frequencies were heterogeneous: any exacerbation occurred in 53/106 patients, high-risk exacerbation history in 25/106, severe hospitalization in 16/106, SABA dispensing in 45/106, SAMA dispensing in 31/106, and any rescue dispensing in 65/106. This event-frequency gradient defined an intrinsic information hierarchy. The GOLD 2026 “any exacerbation” endpoint was the most information-rich, exacerbation-defined construct in this pilot cohort, whereas hospitalization was clinically more specific but statistically information-limited.
Under sparse-event conditions, classical maximum-likelihood logistic regression is prone to instability, inflated variance, and quasi-separation, especially when multiple correlated descriptors are included [
50]. We therefore prespecified a Bayesian multi-outcome hierarchical strategy using weakly informative scale-aware priors, cross-endpoint partial pooling, and patient-level cross-validation [
40,
41,
42,
43].
The purpose of the Bayesian model was to compare related endpoints while preserving their distinct clinical and operational meanings. The model aimed to stabilize estimation, quantify posterior uncertainty, borrow strength across related endpoints where appropriate, and avoid misleading dichotomous interpretation of isolated estimates. It did not remove the intrinsic information limits of the pilot cohort; the inferential target remained structural coherence and uncertainty-aware interpretation, not precise effect estimation, causal inference, medication-effect estimation, or deployable prospective prediction.
2.6. Statistical Analysis
2.6.1. Analytical Estimand, Predictor Coding, and Computational Traceability
All analyses were implemented in R (v4.5.2) within a fully scripted, version-controlled, audit-ready pipeline. Deterministic random seeds, model-specification identifiers, input-file hashes, sampler settings, diagnostic outputs, and run metadata were archived to support end-to-end computational traceability and reproducibility under identical inputs.
The statistical estimand followed the inferential target defined in
Section 2.1: patient-level conditional association structure between routinely recorded descriptors and the six operational endpoints within the shared 12-month window, accounting for residual patient-level heterogeneity. Reported estimates were therefore interpreted as subject-specific conditional associations under the same deterministic aggregation scheme.
Predictor coding was prespecified. Observed binary descriptors were encoded as 0/1, age was encoded in 10-year units, and all predictors were standardized for model fitting to harmonize prior scales and improve posterior geometry. Posterior estimates were back-transformed and reported as subject-specific odds ratios for clinically interpretable contrasts: presence versus observed absence for binary descriptors and per 10-year increments for age. Missingness handling, design-matrix completion, and missingness-indicator coding followed the strategy described in
Section 2.4 and
Supplementary Section S1.
2.6.2. Bayesian Multi-Outcome Hierarchical Model
The six binary endpoints were modeled jointly using a Bayesian multi-outcome hierarchical logistic regression. The model included patient-level multivariate random intercepts to capture residual between-patient heterogeneity and cross-endpoint dependence and hierarchical partial pooling of predictor effects across endpoints to estimate both shared association structure and endpoint-specific deviation.
This joint framework was chosen to compare related endpoints without collapsing them into a single construct and is consistent with multivariate EHR approaches that seek to preserve latent clinical structure rather than analyze recorded variables in isolation [
44]. The model was intended to stabilize estimation and quantify uncertainty under sparse-event conditions, not to overcome the intrinsic information limits of the pilot cohort.
Weakly informative, scale-aware priors were specified on the standardized predictor scale to regularize implausibly large coefficients under sparse-event conditions [
42,
50]. The random-intercept correlation matrix was assigned an LKJ prior [
41]. The full mathematical specification, prior distributions, non-centered parameterizations, and scenario definitions are provided in
Supplementary Section S1.
2.6.3. Posterior Computation, Diagnostics, and Reporting
Models were fitted in Stan using CmdStan/CmdStanR [
40]. Hamiltonian Monte Carlo settings, convergence criteria, and diagnostic thresholds were prespecified. MCMC adequacy was assessed using
, bulk and tail effective sample sizes, trace inspection, divergent transitions, and treedepth checks.
Posterior summaries were reported as medians, 95% credible intervals, and posterior probabilities. P (OR > 1) quantified the posterior probability of a positive association, whereas P (OR < 1) = 1 − P (OR > 1) quantified inverse directionality. Pdir was defined as the posterior probability in the direction of the posterior median: P (OR > 1) for positive posterior medians and P (OR < 1) for inverse posterior medians.
For moderate-effect-aware supplementary summaries, where explicitly reported, we additionally used Pmod-dir, defined as P (OR > 1.25) for positive posterior medians and P (OR < 0.80) for inverse posterior medians; 0.80 was used as the reciprocal of 1.25. These probabilities supported uncertainty-aware interpretation under sparse-event conditions and were not treated as dichotomous significance tests, model-fitting criteria, predictor-inclusion criteria, or variable selection criteria.
Posterior predictive checks compared observed endpoint prevalences with posterior predictive distributions at the marginal level. Numerical PPC summaries by scenario and endpoint are reported in
Supplementary Table S3.14. These checks assessed marginal adequacy of the fitted binary model, not joint endpoint calibration, external transportability, temporal prediction, or causal validity.
Ranked forest displays were used only to compress and visualize posterior output. The Top-8 visualization set per endpoint was prespecified for graphical readability and did not affect model fitting, predictor inclusion, variable selection, clinical prioritization, or inferential decision-making. Interpretation was based on posterior direction, credible interval width, posterior probabilities, event frequency, subgroup support, cross-endpoint coherence, and robustness across scenarios.
Predictor support was reported as n/N (%) in uncertainty-focused visualizations. Signals involving sparse endpoints or low-frequency predictors were considered exploratory regardless of visual rank. Sparse support was defined as ≤5 patients, ≤5% prevalence, or equivalently sparse minimum class support. “Exploratory”, “Uncertain”, and “More supported” labels were used as descriptive visualization aids, not as confirmatory inference categories.
2.6.4. Cross-Validation, Scenario Architecture, and Sensitivity Analyses
Patient-level 10-fold cross-validation was used to evaluate out-of-sample reproducibility under the same deterministic 12-month aggregation scheme. Models were fully refitted in each fold. For each held-out patient, all six outcomes were jointly held out to preserve the patient as the unit of inference and prevent cross-endpoint leakage. Held-out patient random intercepts were not conditioned on held-out outcomes; predictive densities were averaged over posterior draws of the held-out patient random effects, sampled from the estimated population-level random-effect distribution. Fold assignment was prespecified and balanced by the hospitalization endpoint to improve distribution of rare severe events across folds.
Predictive performance was summarized using expected log predictive density (ELPD) [
43], with uncertainty derived from patient-level pointwise contributions. Under the within-window design, ELPD was interpreted as reproducibility across individuals under the same deterministic aggregation scheme, not as validation of a forward-time prognostic model.
Four prespecified scenarios were fitted under the same Bayesian multi-outcome structure, priors, posterior predictive checking approach, and cross-validation scheme. Scenario 01 (etiological base) included demographics and systemic comorbidities only; treatment and care-pathway markers were excluded; missing binary values were assigned a 0 numerical placeholder; and missingness indicators were retained. Scenario 02 (clinical + care markers) added prespecified treatment and dispensing-derived care-pathway descriptors to Scenario 01, again using a 0 numerical placeholder and retaining missingness indicators. Scenario 03 (age-interaction sensitivity) added prespecified age × heart failure and age × obstructive sleep apnea interactions to Scenario 01; interactions were constructed after design-matrix completion and then standardized. Scenario 04 (missingness-coding sensitivity) repeated Scenario 01 using the observed-prevalence numerical placeholder rather than the 0 numerical placeholder for missing binary values, again retaining missingness indicators.
Patterns consistent across these four prespecified scenarios were interpreted as more robust, whereas scenario-sensitive patterns were interpreted cautiously as potentially dependent on coding rules, care-pathway structure, or sparse-data uncertainty.
An additional high-missingness exclusion sensitivity analysis, Scenario 05, assessed whether the main posterior association structure depended on highly incomplete descriptors. The etiological baseline model was refitted after excluding smoking status, obesity/BMI-related information, and their corresponding missingness-indicator terms. The analytic cohort, endpoints, priors, Bayesian multi-outcome structure, posterior predictive checking, and patient-level 10-fold cross-validation were otherwise unchanged. No complete-case analysis was performed.
Scenario 05 was interpreted as an internal robustness and posterior-invariance assessment relative to Scenario 01, not as a null-hypothesis test and not as evidence of external transportability. All posterior draws, diagnostics, input mappings, and run metadata were archived to ensure reproducibility and auditability.
3. Results
3.1. Cohort, Unit of Inference, and Endpoint Frequencies
Baseline characteristics of the analytic cohort are summarized in
Table 1. The final manually audited pilot cohort included 106 patients with COPD. Participants were predominantly male (77/106; 72.6%), with a mean age of 68.8 ± 8.2 years. The distribution by center was Seville 60/106 (56.6%) and Valencia 46/106 (43.4%).
BMI was unavailable in 66/106 patients (62.3%), and smoking status was unknown in 30/106 patients (28.3%) within the 12-month window. These variables were retained in the primary etiological model through explicit missingness indicators and were subsequently evaluated in a high-missingness exclusion sensitivity analysis.
Comorbidity burden was moderate, with a mean of 3.2 ± 1.9 recorded conditions. The most frequent comorbidities were arterial hypertension (73/106; 68.9%), hypercholesterolemia (58/106; 54.7%), diabetes mellitus (31/106; 29.2%), anxiety–depressive disorder (29/106; 27.4%), and gastroesophageal reflux disease (27/106; 25.5%). Environmental allergy was uncommon, being recorded in only 5/106 patients (4.7%). Maintenance inhaled regimens reflected routine care, with LAMA/LABA and ICS/LAMA/LABA each recorded in 33/106 patients (31.1%).
All predictors and endpoints were deterministically aggregated into one record per patient within the same 12-month retrospective window. No longitudinal follow-up structure was modeled.
All six endpoints were fully observed:
Any exacerbation (GOLD 2026): 53/106 (50.0%).
High-risk exacerbation history (GOLD 2025): 25/106 (23.6%).
A ≥1 severe exacerbation requiring hospitalization: 16/106 (15.1%).
SABA dispensing: 45/106 (42.5%).
SAMA dispensing: 31/106 (29.2%).
Any rescue bronchodilator dispensing: 65/106 (61.3%).
This prevalence gradient defines the information structure of the study. The GOLD 2026 “any exacerbation” endpoint was the most frequent exacerbation-defined outcome and therefore provided the greatest statistical resolution in this pilot cohort. However, this higher resolution should not be interpreted as evidence that the endpoint represents a homogeneous high-risk phenotype. Rather, it supports its interpretation as a high-sensitivity operational signal in the endpoint-operating-point sense defined above, whose clinical meaning requires refinement through severity-filtered history, hospitalization-defined events, and systemic vulnerability profiling.
3.2. Bayesian Computation and Numerical Diagnostics
Across the four prespecified scenarios, Hamiltonian Monte Carlo sampling was stable. No divergent transitions occurred, and no transitions reached the maximum allowed treedepth. The largest observed treedepth was 7, well below the conservative cap of max_treedepth = 13, indicating that no transitions were truncated by the treedepth limit. All monitored parameters showed , with adequate bulk and tail effective sample sizes.
These diagnostics indicate an excellent computational performance. Wider credible intervals for low-frequency endpoints or sparse predictors should therefore be interpreted as intrinsic information limitations rather than Hamiltonian Monte Carlo convergence, exploration, or model-fitting failure.
3.3. Recording Quality, Missingness Structure, and Retained Predictors
Prespecified recording-quality filters were applied before model fitting. Predictors with a ≥20% missingness or extreme binary sparsity were excluded, except for the clinically prespecified forced core set. Two candidate predictors, food allergy and nasal polyps, were excluded because of extreme rarity. Among non-forced predictors retained in the model, missingness was ≤1.9%.
Obesity/BMI-related information and smoking status were retained in the primary etiological model despite high missingness, because they belonged to the forced core set and were clinically relevant to COPD instability and the EHR recording structure. Missingness was explicitly encoded rather than treated as a clinical absence.
The effective number of retained fixed predictors, excluding missingness indicators, was P = 22 in Scenario 01, P = 31 in Scenario 02, P = 24 in Scenario 03, and P = 22 in Scenario 04.
3.4. Scenario 01 (Etiological Base): Exacerbation-Defined Outcomes
Scenario 01 included demographics, systemic comorbidities, and baseline descriptors only. Results are presented as posterior association structures rather than ranked discoveries (
Figure 1). The ranked forest plots provide a compact visualization of posterior output, but the Top-8 ordering should not be interpreted as a hierarchy of importance. Interpretation is based on posterior direction, credible interval width, posterior probabilities, event frequency, subgroup support, cross-endpoint coherence, and robustness across scenarios.
Because several endpoints and predictors were sparse, large posterior medians must be interpreted together with their credible intervals and subgroup support. This is particularly relevant for severe hospitalization, which occurred in 16/106 patients, and for environmental allergy, recorded in only 5/106 patients. Signals arising from these sparse cells are treated as exploratory even when visually prominent.
For the GOLD 2026 any exacerbation endpoint, heart failure showed the most clinically coherent positive posterior direction. This pattern was directionally consistent across the stricter exacerbation-defined endpoints, including high-risk history and severe hospitalization, supporting cross-endpoint coherence. However, the corresponding credible intervals were wide, indicating that these estimates should be interpreted as directional structural signals rather than precise effect-size estimates.
Severe hospitalization contributed clinical specificity but limited statistical resolution, because only 16 events were observed. Therefore, hospitalization results are interpreted primarily in terms of directional alignment with the broader exacerbation hierarchy, not as precise stand-alone estimates.
Environmental allergy also showed positive posterior directionality across several exacerbation endpoints. However, because this descriptor was recorded in only 5/106 patients and had wide credible intervals, it is interpreted as a sparse exploratory signal, not as a robust or clinically actionable association.
Inverse posterior patterns involving osteoporosis and peripheral arterial disease were directionally consistent across exacerbation-defined endpoints. These inverse associations should not be interpreted as biological protection. Under the within-window EHR design, they may reflect recording structure, competing clinical pathways, selection effects, residual confounding, or sparse-data behavior.
Cross-endpoint pooling parameters indicated partial structural coherence with endpoint-specific deviation. Heart failure showed the clearest shared positive direction across exacerbation-defined outcomes, whereas non-negligible dispersion parameters indicated that endpoint-specific variation remained present. These summaries support a shared directional structure without implying homogeneous effects across endpoints.
Absolute Probability Translation (Δp)
Posterior g-computation was used to translate selected conditional associations into cohort-averaged absolute probability contrasts. For heart failure, the estimated conditional probability of any exacerbation increased from 0.475 to 0.788, corresponding to Δp = +30.4 percentage points (95% CrI −1.2 to +52.2). For obstructive sleep apnea, the estimated probability decreased from 0.526 to 0.427, corresponding to Δp = −9.8 percentage points (95% CrI −34.1 to +20.8).
These probability contrasts are within-window, conditional, and model-based. Their credible intervals include 0, underscoring residual uncertainty and reinforcing that they should not be interpreted as causal risk differences.
3.5. Scenario 01: Reliever-Dispensing Endpoints
Reliever-dispensing endpoints encode a composite of disease activity and care-process structure. SABA, SAMA, and any rescue bronchodilator dispensing may reflect symptom burden, medication access, refill behavior, adherence-related patterns, clinicians’ prescribing thresholds, follow-up intensity, healthcare contact, and recording structure within the same 12-month window. Associations with these endpoints are therefore interpreted as mixed clinical–operational signals rather than biological endpoints, medication-effect estimates, or causal treatment relationships (
Figure 2).
For SABA dispensing and any rescue bronchodilator dispensing, environmental allergy and anemia showed positive posterior directionality, whereas osteoporosis and peripheral arterial disease showed inverse posterior directionality. Environmental allergy again had very limited subgroup support and wide credible intervals, so these findings are hypothesis-generating only.
For SAMA dispensing, heart failure showed positive posterior directionality, whereas osteoporosis showed an inverse posterior pattern. These estimates should be interpreted as conditional associations with a mixed care-pathway endpoint, not as medication-effect estimates.
The partial overlap, but incomplete alignment, between exacerbation-defined endpoints and reliever-dispensing endpoints supports distinct endpoint semantics rather than contradictions.
3.6. Residual Heterogeneity and Cross-Outcome Dependence
Residual between-patient heterogeneity remained substantial. Random-intercept standard deviations ranged from 2.29 to 2.87 on the log-odds scale, corresponding to latent variance fractions of approximately 0.62–0.72. This indicates that routinely recorded descriptors captured only part of the patient-level instability structure.
Random-intercept correlations were strongest within the exacerbation hierarchy:
Any exacerbation—high-risk history: 0.75 (95% CrI 0.12–0.97).
High-risk history—hospitalization: 0.76 (95% CrI 0.09–0.97).
Any exacerbation—hospitalization: 0.64 (95% CrI 0.01–0.96).
Associations between exacerbation-defined and dispensing-derived endpoints were weaker and more uncertain. This supports the interpretation that reliever dispensing is related to, but not interchangeable with, exacerbation-defined instability (
Figure 3).
3.7. Scenario Robustness and Directional Stability
Directional concordance summarizes whether the posterior median association for a given predictor–endpoint pair had the same direction across scenarios, defined as posterior median OR > 1 versus posterior median OR < 1. It does not imply identical effect size, posterior certainty, or clinical certainty.
Directional stability across the four prespecified scenarios was high among overlapping scenario-specific Top-8 visualization pairs. No direction reversals were observed within these overlapping visualization-selected pairs. This concordance was computed only for predictor–endpoint pairs that appeared in the Top-8 visualization set of both scenarios and should not be interpreted as global model-wide invariance, agreement in effect magnitude, or predictive superiority.
This robustness assessment should therefore be interpreted as directional stability under alternative prespecified coding and model structure choices, not as confirmatory evidence for individual predictors. Selected posterior summaries, Top-8 visualization tables, directional stability summaries, cross-endpoint pooling parameters, and model-implied probability contrasts are provided in
Supplementary Tables S3.9–S3.13.
3.8. Posterior Predictive Checks
Posterior predictive checks reproduced observed marginal endpoint prevalences across all six endpoints. Observed values lay within the corresponding 95% posterior predictive intervals in the prespecified scenarios. Numerical PPC summaries by scenario and endpoint are provided in
Supplementary Table S3.14. These checks support the marginal adequacy of the sparse-event likelihood under the fitted model. They do not establish joint endpoint calibration, external transportability, temporal prediction, or causal validity.
3.9. Out-of-Sample Evaluation
Patient-level 10-fold cross-validation showed no material improvement in the expected log predictive density with increasing model complexity (
Table 2). Scenario 03, the age-interaction sensitivity model, achieved the best point estimate, but it was not meaningfully distinguishable from the etiological baseline model within uncertainty. Scenario 02, which added clinical and care-pathway markers, performed worse numerically.
No prespecified component achieved meaningful out-of-sample improvement. This supports the interpretation that the study’s principal inferential target was structural characterization under uncertainty, not predictive optimization.
3.10. High-Missingness Exclusion Sensitivity (Scenario 05)
Given the high proportion of missing BMI/obesity-related information and unknown smoking status in routine EHRs, we performed an additional high-missingness exclusion sensitivity analysis. In this analysis, the etiological baseline model was refitted after excluding smoking status, obesity/BMI-related information, and their corresponding missingness-indicator terms. The analytic cohort, six endpoints, priors, Bayesian multi-outcome hierarchical structure, posterior predictive checking framework, and patient-level 10-fold cross-validation were otherwise unchanged. No complete-case analysis was performed.
The high-missingness exclusion model showed excellent computational performance, with no divergent transitions, no treedepth saturations, max = 1.004, minimum bulk ESS = 1765, and minimum tail ESS = 2084. After the exclusion of smoking status and obesity/BMI-related information, 20 fixed predictors remained in the etiological model.
Across all 120 overlapping predictor–endpoint pairs, directional concordance with Scenario 01 was 100.0% (120/120), with no direction reversals. The median absolute change in log(OR) was 0.061, corresponding to a median relative OR change of 1.06×. The maximum absolute change in log(OR) was 0.233, corresponding to a maximum relative OR change of 1.26×. Overall, 119/120 pairs (99.2%) remained within the prespecified ±log(1.25) comparison band. The single outside-band comparison only marginally exceeded the band.
Patient-level 10-fold cross-validation did not deteriorate after the exclusion of these descriptors. The difference relative to Scenario 01 was ΔELPD05−01 = +3.69, with paired SE = 2.18. This supports the absence of deterioration without implying clinically meaningful superiority.
These findings indicate that the main posterior association structure was materially unchanged after removing the most incomplete descriptors. Therefore, the principal structural conclusions were not driven by smoking status, obesity/BMI-related information, their numerical placeholders, or their missingness indicators. This analysis is presented as a robustness and posterior-invariance assessment of posterior median log(OR) estimates, not as a null-hypothesis significance test. The full posterior-median log(OR) agreement plot, endpoint-specific Δlog(OR) distributions, and stability summary are shown in
Supplementary Figure S4-9.
4. Discussion
4.1. Principal Interpretation and Inferential Boundary
In this retrospective, outcome-anchored, same-window pilot study of primary-care COPD, the GOLD 2026 criterion of a ≥1 moderate or severe exacerbation behaved as a high-sensitivity operational signal in an endpoint-operating-point sense rather than as a homogeneous high-risk phenotype [
1]. Its higher observed frequency improved the statistical resolution relative to recurrent or hospitalization-defined endpoints, but this gain in operating-point sensitivity came with broader clinical and recording heterogeneity.
Because predictors and endpoints were aggregated within the same 12-month retrospective window, all estimates should be interpreted as within-window conditional associations under residual patient-level heterogeneity. They do not establish the temporal sequence, causal effects, medication effects, or prospective risk prediction. Patient-level cross-validation assessed reproducibility under the same deterministic aggregation scheme, not forward-time prognostic performance [
43].
4.2. Clinical Meaning of the GOLD 2026 Threshold
The clinical implication is a shift in the operating point toward sensitivity, understood as broader capture for structured reassessment rather than as formally estimated diagnostic sensitivity. In routine EHRs, a single recorded moderate or severe exacerbation is best interpreted as a prompt for structured reassessment, not as definitive evidence of a stable high-risk state [
1,
14,
15,
16,
17,
18,
19,
20]. Specificity should be restored by integrating recurrent exacerbations, hospitalization-defined events, and broader vulnerability profiling.
This interpretation is consistent with cross-guideline differences: phenotype-oriented frameworks do not necessarily equate a single moderate non-hospitalized event with a recurrent or severe exacerbation history [
21,
49,
51,
52,
53]. In small EHR cohorts, this trade-off becomes particularly evident: the lower-threshold GOLD 2026 endpoint is statistically more informative, whereas stricter endpoints are clinically sharper but information-limited. The present findings therefore support the clinical utility of the GOLD 2026 threshold as an early-warning trigger, while arguing against its use as a stand-alone phenotype definition [
1,
21,
49,
51,
52,
53].
4.3. Multimorbidity, Cardiovascular Overlap, and Sparse Exploratory Signals
Heart failure showed the most coherent positive pattern across exacerbation-defined endpoints. This is clinically plausible given the overlap between COPD, dyspnea, cardiovascular comorbidity, healthcare utilization, and exacerbation-related cardiovascular vulnerability [
1,
22,
54,
55,
56,
57,
58,
59]. However, in routine EHRs, heart failure may reflect both biological vulnerability and diagnostic-recording coupling, as acute breathlessness, decompensation, treatment escalation, and exacerbation coding can converge within the same clinical episode [
54,
55,
56,
57,
58,
59]. The association is therefore clinically meaningful but not causal.
Other positive signals—including GERD, anxiety–depressive disorder, anemia, bronchiectasis, and hypertension—were directionally plausible but uncertain and should be interpreted as uncertainty-aware structural signals rather than definitive etiologic findings [
1,
22,
23,
24,
25,
26,
27,
28]. Conversely, inverse patterns involving osteoporosis or peripheral arterial disease should not be interpreted as biological protection; under a same-window EHR design, they may reflect competing pathways, differential healthcare contact, selection effects, residual confounding, or sparse-data behavior.
Environmental allergy illustrates the distinction between directional recurrence and evidential strength: despite repeated positive directionality, it was recorded in very few patients and consistently showed wide credible intervals and should therefore only be regarded as hypothesis-generating.
4.4. Endpoint Semantics: Exacerbation Constructs Versus Reliever Dispensing
The six endpoints were not interchangeable. Exacerbation-defined outcomes approximate guideline constructs but remain dependent on treatment proxies, documentation practices, and hospitalization linkages [
1,
21,
31,
49]. Circularity was reduced by prespecifying endpoint definitions and excluding endpoint-defining proxies from the corresponding predictor sets, although residual misclassification remains intrinsic to EHR-based research.
Reliever-dispensing endpoints represent a more composite layer. SABA, SAMA, and any rescue bronchodilator dispensing may reflect symptoms, medication access, refill behavior, adherence patterns, prescribing thresholds, healthcare contact, follow-up intensity, and recording structure [
29,
30,
31,
32]. These variables should therefore be interpreted as care-pathway indicators rather than as pharmacological or biological effect estimands. The same interpretive caution applies to prespecified treatment and care-pathway descriptors in Scenario 02: medication-effect questions require dedicated, temporally ordered pharmaco-epidemiological designs and cannot be resolved by same-window conditional association models [
60,
61].
Their incomplete alignment with exacerbation-defined endpoints is informative rather than contradictory. It supports a multidimensional view of COPD instability, with stronger coherence within the exacerbation hierarchy and weaker, more heterogeneous links between exacerbation and dispensing layers, consistent with multidomain and treatable-traits perspectives [
33,
34,
35,
36].
4.5. Robustness, Missingness, Parsimony, and Latent Instability
The robustness analyses support a parsimonious interpretation. Increasing model complexity did not materially improve out-of-sample reproducibility, suggesting that in sparse EHR cohorts, additional care-pathway variables may enrich endpoint interpretation more than stable predictive structure. The age-interaction scenario produced the best point estimate, but it was not materially distinguishable from the etiological baseline, whereas adding clinical and care-pathway descriptors did not improve out-of-sample adequacy.
The main posterior association structure was also stable under two complementary missingness robustness analyses: the prespecified missingness-coding sensitivity analysis, which changed the numerical placeholder for missing binary predictors while retaining missingness indicators, and the high-missingness exclusion sensitivity analysis, which removed smoking status, obesity/BMI-related information, and their corresponding missingness-indicator terms. These analyses do not identify the missing-data mechanism, but they make it unlikely that the principal structural conclusions were driven by either placeholder coding or the most incomplete descriptors. The full high-missingness stability summary is shown in
Supplementary Figure S4-9.
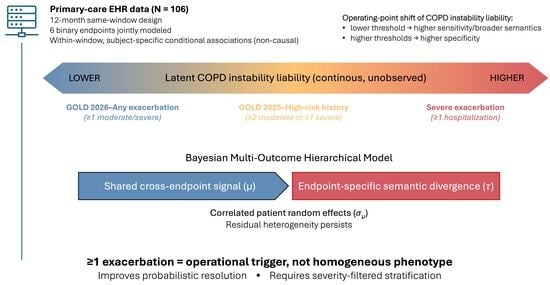
Substantial residual between-patient heterogeneity persisted after adjustment, indicating that routinely recorded descriptors captured only part of the vulnerability landscape. COPD instability therefore appears better conceptualized as a graded, partly latent liability than as a discrete state defined by a single threshold within the broader conceptual framework summarized in
Figure 4 and consistent with multidimensional COPD models [
33,
34,
35,
36].
The Bayesian multi-outcome model helped characterize that structure by combining patient-level random effects with cross-endpoint partial pooling. It stabilized estimation, quantified uncertainty, and distinguished shared directionality from endpoint-specific behavior, but it did not overcome the intrinsic information limits of the pilot sample [
40,
41,
42,
43,
50].
4.6. Limitations and Future Directions
This study has several limitations. First, it was based on a manually audited pilot cohort rather than a population-level analysis of the full COPD registry. Although 3989 potentially eligible patients were identified in the source EHR systems, detailed clinical, comorbidity, treatment, dispensing, and healthcare-utilization variables were not fully extracted, harmonized, and clinically audited for the full denominator. Formal representativeness of the 106-patient analytic cohort therefore cannot be assumed or directly tested. The pilot cohort was suitable for endpoint construction, recording-quality assessment, and Bayesian structural modeling under sparse-event conditions but not for definitive population-level estimation.
Second, the same-window design precludes temporal ordering and does not allow for inference on causality or prediction. It was chosen to align predictors and endpoints with the prior-year operational logic of COPD instability, but it cannot determine whether a descriptor preceded, caused, or predicted an endpoint. Within-window feedback between symptoms, healthcare contact, treatment escalation, dispensing, and recording may occur.
Third, exacerbation definitions remain vulnerable to misclassification and to variability in routine-care operationalization, documentation, and hospitalization linkage [
1,
15,
21,
31,
49]. Smoking and BMI/obesity recording were incomplete; although missingness was modeled explicitly, missingness indicators do not recover unobserved values or identify the missing-data mechanism.
Fourth, some visually prominent estimates were supported by sparse cells. Environmental allergy, recorded in only five patients, illustrates this limitation. Partial pooling can regularize sparse estimates, but it cannot compensate for a lack of exposed observations. Ranked forest plots should therefore be interpreted as uncertainty-focused summaries, not as hierarchies of definitive predictor importance.
Finally, no external validation was performed. Future studies should use larger, independently extracted and clinically audited cohorts, temporally separated baseline and follow-up windows, richer physiological severity measures, and standardized, measurement-aware exacerbation definitions before prognostic or implementation-oriented claims are made [
37,
38,
39,
62,
63].
4.7. Clinical Interpretation: Take-Home Points
These points should be read as interpretive guidance for EHR-based reassessment, not as a validated clinical decision rule. Within the constraints of this pilot same-window EHR design, the findings support the following clinical interpretation:
Interpret GOLD 2026 “any exacerbation” as a high-sensitivity operational signal in an endpoint-operating-point sense, prompting structured reassessment, not as a stand-alone homogeneous high-risk phenotype [
1,
14,
15,
16,
17,
18,
19,
20].
Restore specificity by integrating severity-filtered exacerbation history, particularly recurrent exacerbations and hospitalization-defined events [
1,
21,
49,
51,
52,
53].
Profile systemic vulnerability, especially cardiovascular comorbidity, while recognizing cardio–respiratory diagnostic overlap and EHR-recording effects [
54,
55,
56,
57,
58,
59].
Treat reliever dispensing as a mixed clinical–operational care-pathway indicator shaped by symptoms, access, refill/adherence behavior, prescribing thresholds, healthcare contact, and recording structure—not as a medication-effect estimand [
29,
30,
31,
32,
60,
61].
Recognize residual heterogeneity: Routinely recorded EHR descriptors capture only part of the COPD instability, and external validation in larger cohorts with temporally separated baseline and follow-up windows is required before prognostic deployment or implementation-oriented claims [
37,
38,
39,
62,
63].

 ,
, 


