
Repeatability Study of Flash-Pulse Thermographic Inspection of CFRP Samples †
by
 , ,
, ,
Michal Švantner
1,* ,
,
Lukáš Muzika
1, 
Alexey Moskovchenko
1,2 ,
,
Celeste M. C. Pereira
3 and
Shumit Das
4 1
New Technologies—Research Centre, University of West Bohemia, 301 00 Plzeň, Czech Republic
2
School of Nondestructive Testing, Tomsk Polytechnic University, 30 Lenin Avenue, 634050 Tomsk, Russia
3
Optimal Structural Solutions Lda, Rua do Moinho Vermelho 50, 2645-449 Cascais, Portugal
4
European Space Research and Technology Centre (ESA–ESTEC), Keplerlaan 1, 2200 AG Noordijk, The Netherlands
*
Author to whom correspondence should be addressed.
†
Presented at the 16th International Workshop on Advanced Infrared Technology & Applications, 26–28 October 2021; Available online: https://aita2021.sciforum.net/ .
Eng. Proc. 2021, 8(1), 1; https://doi.org/10.3390/engproc2021008001
Published: 17 November 2021
(This article belongs to the Proceedings of The 16th International Workshop on Advanced Infrared Technology & Applications)
Abstract
:Thermographic flash-pulse inspection is one of popular methods of non-destructive testing (NDT) of materials. Despite the automation of the NDT methods, most of them are based on visual inspections and results of these inspections are influenced by the skills of operators. The repeatability and reproducibility (R&R) of these inspections are therefore more important compared to exact gauge-type methods. This study was focused on the statistical evaluation of flash pulse inspection. Space hardware representative carbon-fiber composite samples with 50 artificial defects were used as reference samples, which were independently inspected by three operators in two independent runs. A Gage R&R study was performed based on contrast to noise ratio defects identification. It was determined that at certain conditions, a total R&R variability 29% can be achieved, which can be assumed as acceptable for this application.
1. Introduction
Infrared nondestructive testing (IRNDT) is a popular method for near-surface defect and discontinuity detection. It is based on an external excitation, which induces a thermal process inside an inspected object. The defects under the surface affect the thermal process and can thus be detected by a thermographic measurement of a thermal response at the surface. The affection manifests itself by differences of the response between defective and non-defective regions, whose contrast is mostly increased by special data-processing procedures. IRNDT can be performed using various excitation methods and evaluation procedures. These methods are described, e.g., in [1] or [2].
This contribution is focused on flash-pulse thermography [3,4], which uses a short flash-lamp-induced pulse for an excitation of an inspected object. Standard thermal response processing methods for this inspection are signal derivation or Fourier transform based methods. Flash-pulse thermography, as well as many other NDT methods, is basically a contrast-based method. Results of an inspection are regions of different contrast (indications), which are detected visually and indicate the possible occurrence of defects.
As some kind of rating is often required, different quantification procedures of the indications have been developed. One of the basic approaches is an evaluation of their visibility, which is usually evaluated based on their contrast to a background, e.g., signal-to-background contrast [5] or contrast-to-noise ratio (CNR) [6]. Despite advances in automation of the inspection process, experimental design and parameter settings are mostly made by an operator. A decision about an indication occurrence is also mostly made by the operator, although it can be supported by a definition of some detectability limit criterion. There is some influence of the operator on the final results of the inspection. Thus, statistical analyses can be a good tool to evaluate the inspection procedures. These methods include, for example, probability of detection analysis, described in [7] for NDE in general or in [8] for lock-in thermography. These methods are, however, often time- and cost-demanding, because many measurements are required.
This contribution is focused on reproducibility and repeatability analysis of flash-pulse thermographic inspection of carbon-fiber composite samples. Defects in the samples were simulated by Teflon patches and inspection results were statistically analyzed by help of Gage R&R tools. The goal of the study is to propose a statistical evaluation procedure, which provides some statistical outputs about R&R of the thermographic inspection procedures using limited experiments.
2. Measurement and Evaluation Procedure
The flash-pulse thermographic inspection was performed on carbon fiber reinforced polymer (CFRP) samples, which represented a piece of hardware used in the space industry. The samples contained artificial defects made by Teflon patches, which were included to the samples during their production. The samples were two panels of dimension 200 × 200 mm and thickness 2.69 mm. Each sample contained 25 Teflon patches of thickness 30, 60, 90, 120, and 150 um and diameter 1, 3, 5, 10, and 15 mm. The Teflon patches were placed at a depth 0.112 and 1.3 mm in the first and second sample, respectively. The surface to be inspected was black and glossy (as produced, no surface treatment was applied).
The flash-pulse thermographic inspection was performed using excitation by a flash lamp with a pulse length of about 6 ms and a maximum power of 6 kJ. A thermal response was recorded by a high-speed cooled InSb-based detector thermographic camera with a sensitivity about 20 mK and an integration time 1.4 ms. Measured responses (raw thermographic time sequences) were processed by Time Derivation of Thermographic Signal (TDTS) [6] and Fourier Transform (FT) methods. The contrast-to-noise ratio (CNR), expressed in dB [6], was evaluated for each indication detected.
The experiment was designed and evaluated in Minitab statistical software [9]. The Gage R&R study design was generated in such a way that each defect (a total of 50 defects) was assumed as an individual object, which should be measured by three operators in two replicates (i.e., two independent measurements), which was, in total, 300 runs (evaluation of possible indications). Each of the operators was free to set the geometrical configuration, inspection procedure (one or more flash pulses for each sample), and inspection parameters (framerate, record length). The responses were evaluated by both TDTS and FT methods in such a way that each found indication was selected (bounded) by an operator and evaluated separately in different time and/or phase positions based on the highest CNR. As a result, all operators indicated for both measurements and evaluation methods for each of the 50 defects, if it was detected (visible) and, if detected, its CNR. Finally, a detectability of the found defects was specified based on the criterion CNR > 3 dB.
These results, obtained based on the Gage R&R design, were subsequently evaluated by means of Minitab software using descriptive statistics, effects screener, attribute agreement analysis, and Gage R&R evaluation tools.
3. Results
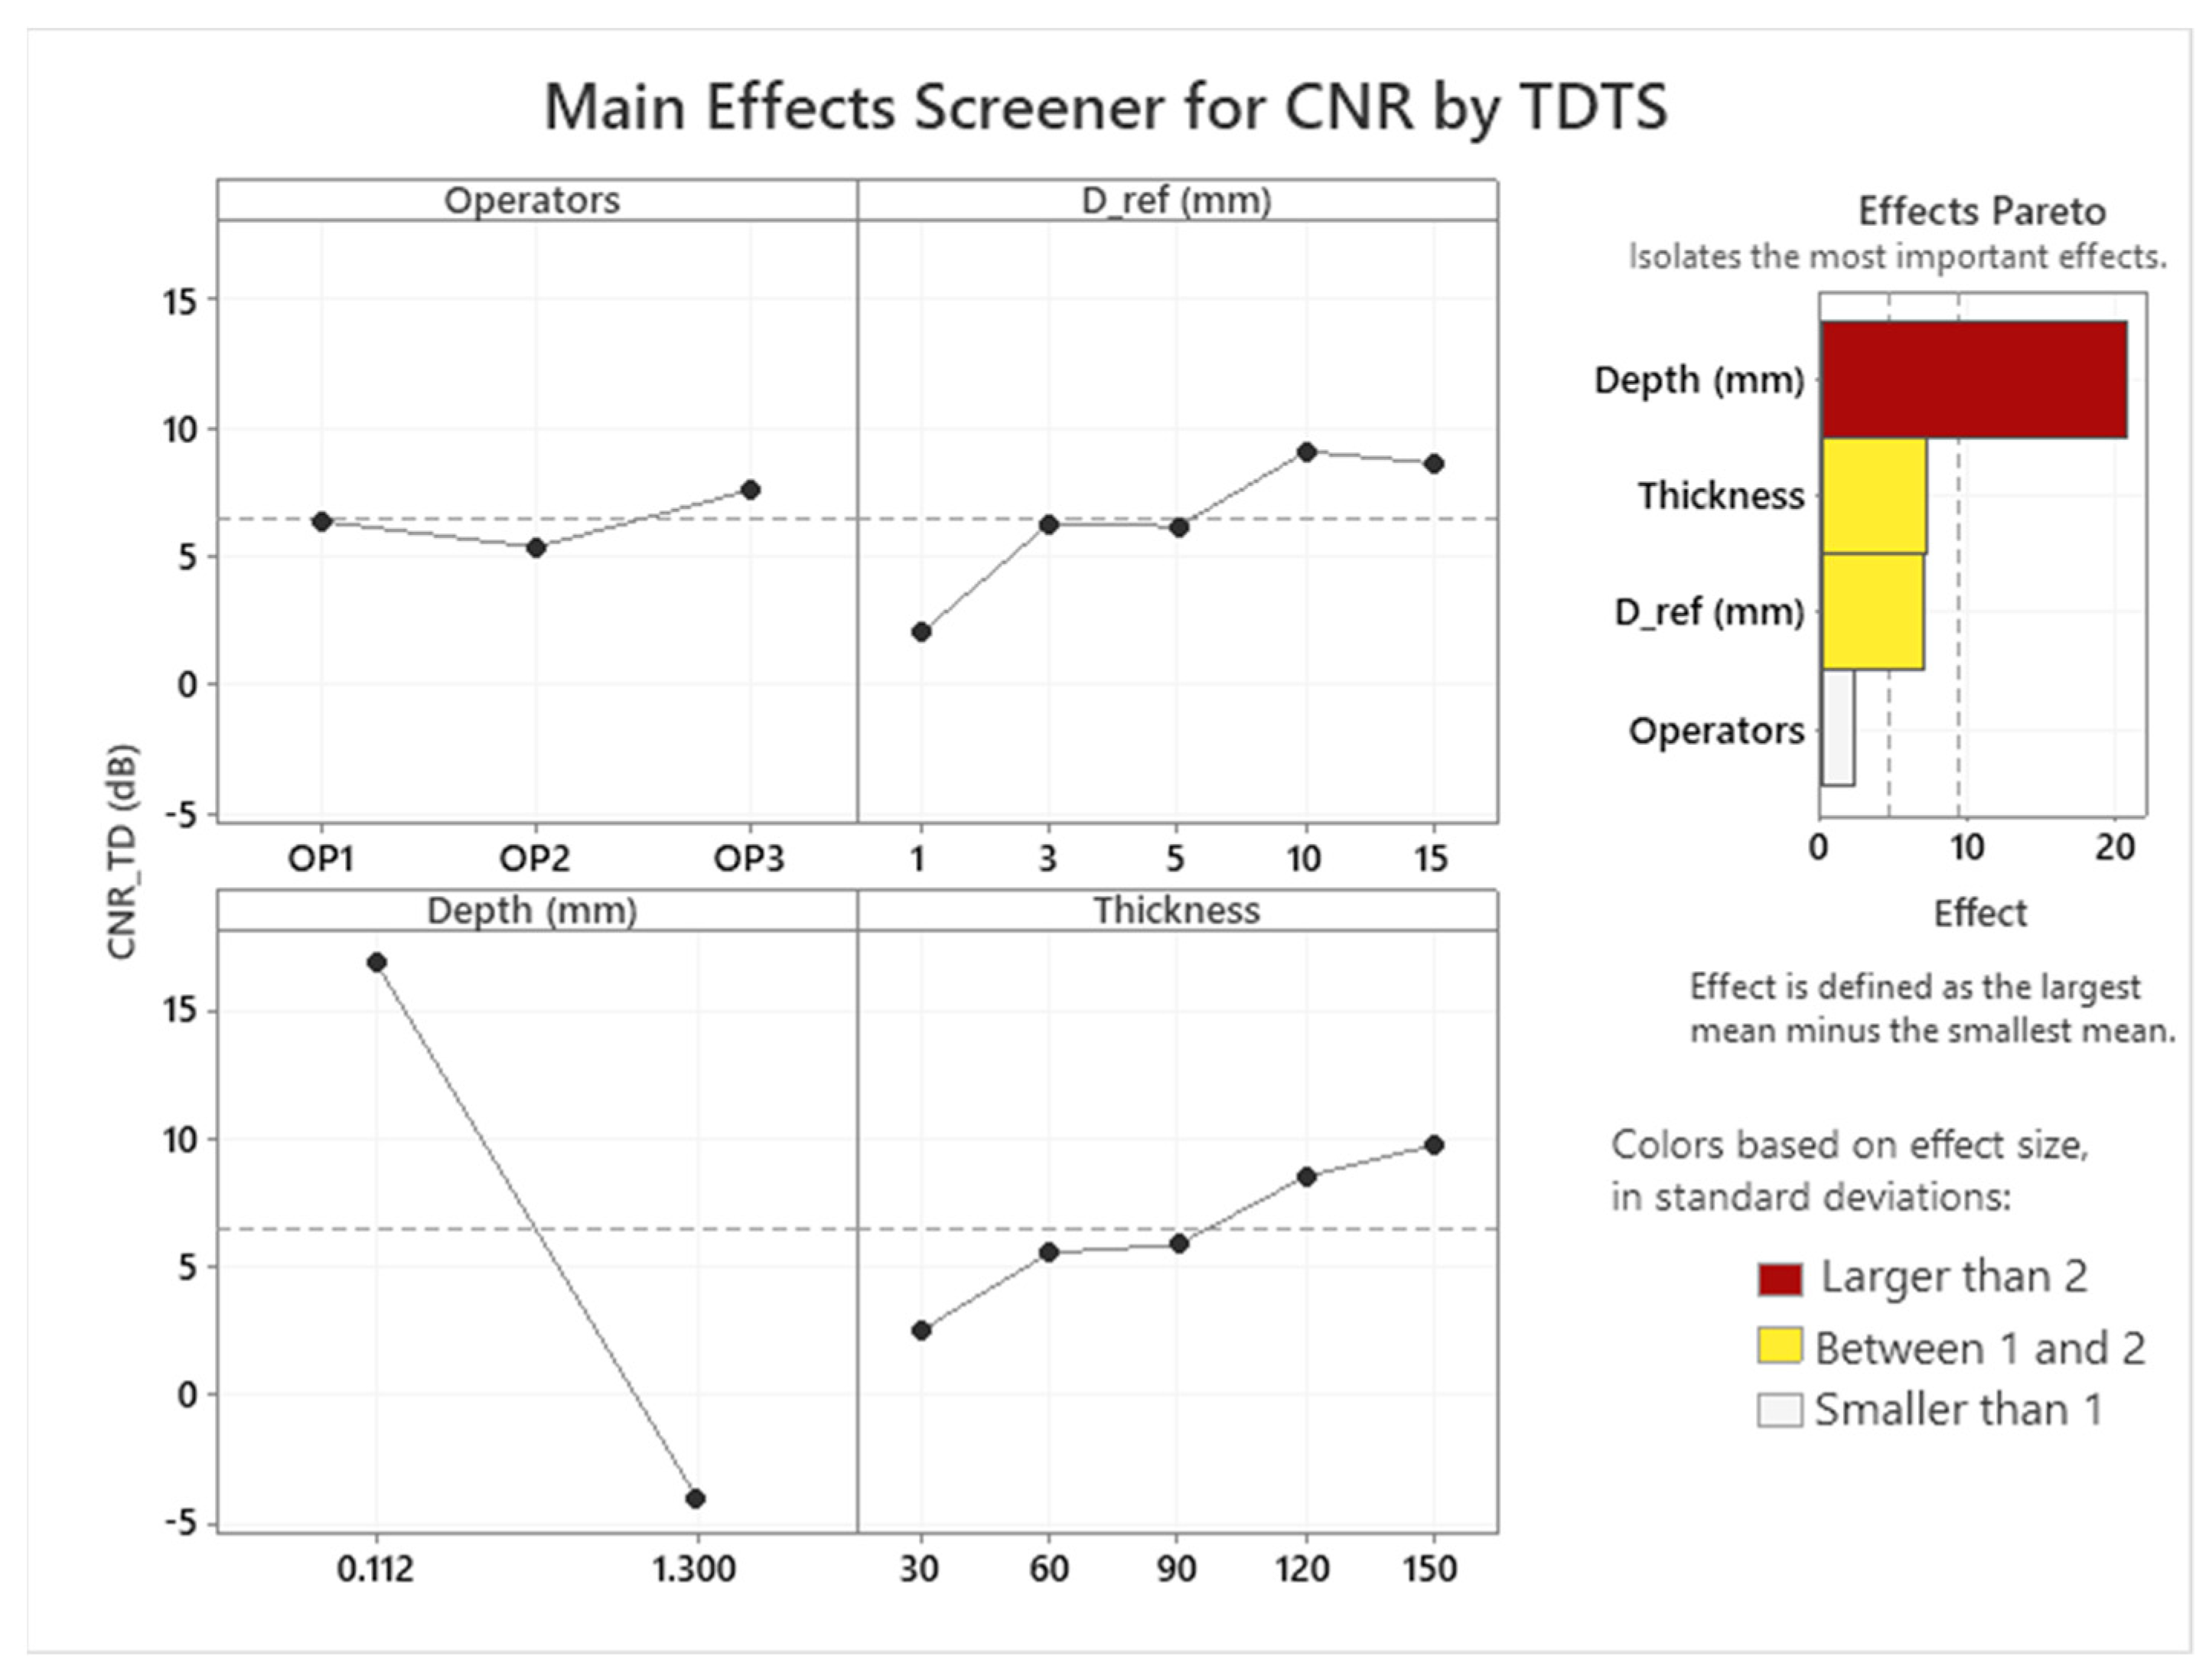
The operators visually indicated between 66 and 78 defects from the performed 100 inspections (50 defects, 2 rounds) with a mean CNR in the range 12.5–14.0 dB and 8.2–11.7 dB for TDTS and FT evaluations, respectively. The operators knew the assumed position of defects; thus, some of the defects indicated had very small or negative CNR (CNR range for TDTS was −7.7–24.2 dB). After the criterion CNR > 3 was applied, the number of indicated defects was 58–73 and 58–66 for TDTS and FT evaluations, respectively. The main effect screening diagram in Figure 1 confirms that the effects of operators to CNR is small compared to effects of diameter, thickness, and depth of the defects, when the depth has the greatest influence on the CNR.
Attribute agreement analysis (AAA) [9] allows to determine the consistency of operators in the rating of defects with themselves and with one another. The agreement within operators was 96–100% for TDTS and 88–94% for FT. The kappa statistics values were 0.92–1.00 and 0.73–0.87 for TDTS and FT, respectively. As AIAG [10] suggests that a kappa value of at least 0.75 indicates good agreement, these results are quite good. The assessment agreement between operators (consistency between the operator’s ratings) was 76% with a kappa value of 0.72 for TDTS (68%/0.67 for FT). Although the agreement between operators is, as expected, worse than with themselves, the agreement can be considered acceptable.
Gage R&R (GR&R) analysis [9] can be used to evaluate variations of the measurement when every operator measures every defect in the study. GR&R, which is basically suited to an evaluation of systems for an exact values measurement, analyses a measured quantity in contrast to AAA, which can analyze a binary rating (e.g., if detected or not). Thus, the determined CNR values for each defect by each operator/measurement was considered. The total GR&R variation for the study was 28.6% for TDTS (43.0% for FT). Based on the AIAG suggested rating [10], as the inspection results variation using TDTS is between 10 and 30%, the system can be assumed to be “acceptable depending on the application”. This conclusion can be considered satisfactory, taking into account that the analysis was applied to CNR evaluation, which can be strongly influenced by several steps made by individual operators during the experiment as well as during the evaluation.
4. Conclusions
The main effect screener tool showed that the CNR variation is not significantly affected by operators compared to the influence of thickness, diameter, and depth of the Teflon patches simulating defects. Due to little variation in CNR, each operator was practically able to detect the same defects. As expected, the biggest influence of the depth was confirmed. These basic statistical results summarizing number of detected indications and mean CNR values indicated that TDTS evaluation provided better results than FT processing for this application. This conclusion was further confirmed by AAA and GR&R analyses, where the TDTS evaluation mostly provided better results than FT. The assessment agreement between operators was 76% and the total GR&R variation for the study was 28.6% (for TDTS). These results are acceptable, especially taking into account a significant human factor influence on the measurement and evaluation procedure.
The attribute agreement analysis as well as the Gage R&R analysis were not performed absolutely rigorously from the statistical point of view in terms of the experimental procedure. For example, the operators had some information about positions of the defects. Thus, the obtained results could be influenced by this, and some quantities could not be evaluated (e.g., “false-positive”/“false-negative” values completing a receiver operating characteristic (ROC) or probability of detection (POD) statistical evaluations).
However, despite this, it was confirmed that the suggested evaluation procedure can bring some additional statistical information about variations and main effects influencing the inspection and results obtained. The big advantage of this evaluation is that it allows including effects of operators and provide standard statistical and comparable results. Thus, although the validity of the results is limited to the application and the used variables range, it can be a useful tool for analyses of such inspection procedures.
Funding
The work was supported by Ministry of Education, Youth and Sports of the Czech Republic within the ERDF project “LABIR-PAV/Pre-application research of infrared technologies” Reg. No. CZ.02.1.01/0.0/0.0/18_069/0010018 and by the project “NCNDI-Non-contact NDI for Polymeric Composite Structures”, contract ESA AO/1-9843/19/NL/GLC, funded by the European Space Agency.
Conflicts of Interest
The authors declare no conflict of interest.
References
- Vavilov, V. Thermal NDT: Historical milestones, state-of-the-art and trends. Quant. InfraRed Thermogr. J. 2014, 11, 66–83. [Google Scholar] [CrossRef]
- Usamentiaga, R.; Venegas, P.; Guerediaga, J.; Vega, L.; Molleda, J.; Bulnes, F.G. Infrared Thermography for Temperature Measurement and Non-Destructive Testing. Sensors 2014, 14, 12305–12348. [Google Scholar] [CrossRef] [PubMed] [Green Version]
- Balageas, D.L. Defense and illustration of time-resolved pulsed thermography for NDE. Quant. InfraRed Thermogr. J. 2012, 9, 3–32. [Google Scholar] [CrossRef]
- Maldague, X.; Galmiche, F.; Ziadi, A. Advances in pulsed phase thermography. Infrared Phys. Technol. 2002, 43, 175–181. [Google Scholar] [CrossRef] [Green Version]
- D’Accardi, E.; Palumbo, D.; Tamborrino, R.; Galietti, U. A Quantitative Comparison among Different Algorithms for Defects Detection on Aluminum with the Pulsed Thermography Technique. Metals 2018, 8, 859. [Google Scholar] [CrossRef] [Green Version]
- Švantner, M.; Muzika, L.; Chmelík, T.; Skála, J. Quantitative evaluation of active thermography using contrast-to-noise ratio. Appl. Opt. 2018, 57, D49–D55. [Google Scholar] [CrossRef] [PubMed]
- Keprate, A.; Ratnayake, R.M.C. Probability of Detection as a Metric for Quantifying NDE Reliability: The State of The Art. J. Pipeline Eng. 2015, 14, 199–209. [Google Scholar]
- Junyan, L.; Yang, L.; Fei, W.; Yang, W. Study on probability of detection (POD) determination using lock-in thermography for nondestructive inspection (NDI) of CFRP composite materials. Infrared Phys. Technol. 2015, 71, 448–456. [Google Scholar] [CrossRef]
- Minitab, L. Minitab 19 Statistical Software. 2020. Available online: https://www.minitab.com (accessed on 5 June 2019).
- Automotive Industry Action Group (AIAG). Measurement Systems Analysis: Reference Manual, 4th ed.; AIAG: Southfield, MI, USA, 2010. [Google Scholar]
Figure 1.
Main effects: screener effects of operators influence, diameter of defects (D_ref), depth of defects, and thickness of defects on CNR evaluated by TDTS.
Figure 1.
Main effects: screener effects of operators influence, diameter of defects (D_ref), depth of defects, and thickness of defects on CNR evaluated by TDTS.

Publisher’s Note: MDPI stays neutral with regard to jurisdictional claims in published maps and institutional affiliations. |
© 2021 by the authors. Licensee MDPI, Basel, Switzerland. This article is an open access article distributed under the terms and conditions of the Creative Commons Attribution (CC BY) license (https://creativecommons.org/licenses/by/4.0/).
Share and Cite
MDPI and ACS Style
Švantner, M.; Muzika, L.; Moskovchenko, A.; Pereira, C.M.C.; Das, S. Repeatability Study of Flash-Pulse Thermographic Inspection of CFRP Samples. Eng. Proc. 2021, 8, 1. https://doi.org/10.3390/engproc2021008001
AMA Style
Švantner M, Muzika L, Moskovchenko A, Pereira CMC, Das S. Repeatability Study of Flash-Pulse Thermographic Inspection of CFRP Samples. Engineering Proceedings. 2021; 8(1):1. https://doi.org/10.3390/engproc2021008001
Chicago/Turabian StyleŠvantner, Michal, Lukáš Muzika, Alexey Moskovchenko, Celeste M. C. Pereira, and Shumit Das. 2021. "Repeatability Study of Flash-Pulse Thermographic Inspection of CFRP Samples" Engineering Proceedings 8, no. 1: 1. https://doi.org/10.3390/engproc2021008001