1. Introduction
Having a reliable and stable braking system in vehicles is important, as it must adapt to different scenarios, from usual braking to emergency braking at high speeds. The search to improve braking systems for trains has led to the exploration of alternative materials for brake discs, as well as the positioning and shape of the friction blocks in the brake pads [
1,
2,
3]. Another challenge to the safety and durability of railway systems is thermomechanical fatigue, as it directly affects the brake discs [
4]. A recent study has proven that traditional uniaxial models underestimate fatigue damage in these components by 14%, ignoring the multiaxial effects and out-of-phase failure. It also revealed that 19% of total brake disc damage is specifically attributed to the out-of-phase component [
5]. Temperature is a critical factor, as it influences the system’s behavior due to its effects on the properties of the materials [
6,
7,
8].
In this context, it is relevant to analyze how these challenges are presented in the national railway system, particularly considering its growth and the reported accidents [
9,
10].
The use of the railway system has shown growth in Mexico, having, in 2023, a register of mobilizing 131.48 million tons [
9]. However, this increase in activity has been accompanied by an increase in railway accidents.
According to the Mexican Government, in September 2024, 120 accident reports were recorded, representing a 17.65% increase compared to the same month of the previous year. In the category of accident related to railway equipment, infrastructures, and operations, a total of 35 cases were reported, along with a 10.53% increase in derailments [
10].
One factor that may be related to these accidents is the impact of thermal conditions on the braking system. For example, a study analyzed temperature variation over braking time, as well as thermal stresses in the bolt holes, demonstrating that the longer the braking time, the higher the temperature reached by the brake ring [
11]. There are also studies in which the temperature variation in the rails is measured under heavy load operations, with the aim of detecting defects in the rail foot [
12].
Furthermore, it is crucial to consider the Mexican climate context, where extreme temperatures can exacerbate these thermal effects. Studies indicate that daily maximum air temperatures in Mexico have ranged from less than 1 °C to nearly 39 °C in recent years, with average maximum temperatures between 34 °C and 38 °C in some regions. However, surface materials, such as rails, can reach much higher temperatures, exceeding 70 °C, due to direct exposure to sunlight, especially during heatwaves [
13,
14].
Previous studies have shown that low temperatures (below 4 °C) result in longer braking times than usual due to a reduction in the coefficient of friction (COF) [
15]. On the other hand, at high temperatures (40 °C) and high relative humidity (70%), the COF increases [
16]. In another study, which analyzed the performance of the railway friction block using a multimodal braking performance test bench, it was found that the COF increases after 170 °C, reaches its peak at 240 °C, and decreases drastically after 400 °C [
17].
Other studies directly demonstrate the problems caused by temperature in various train components. For example, when analyzing the wheel temperature, results show that the increase in the load applied to the wheel-rail contact is 2.2 times greater [
18]. Another study concluded that, at high temperatures in braking friction pairs, an unstable COF is generated, resulting in prolonged braking distances [
19]. In general, there is a lack of precise understanding of how the thermal conditions of the rails affect braking performance.
This work presents an analysis of the impact that rail temperature has on braking and energy efficiency in a railway system. The work was carried out using a 1:20 scale model of a railway vehicle and railway track. Due to this scale, Nichrome wire was chosen for the experiments, as it adapts well to the size of the rail and is easy to install.
The objective of this research was to demonstrate the importance of temperature, not only in the components of the train but also in the rails. This was achieved by subjecting the rails to four different temperatures (28.5 °C, 40.0 °C, 49.9 °C, and 71.0 °C) and braking the train at three different speeds (1.30 m/s, 1.00 m/s, and 0.75 m/s). The results obtained allow us to understand the impact that rail temperature has on the train’s braking system.
2. Materials and Methods
2.1. Experimental Site and Train Specifications
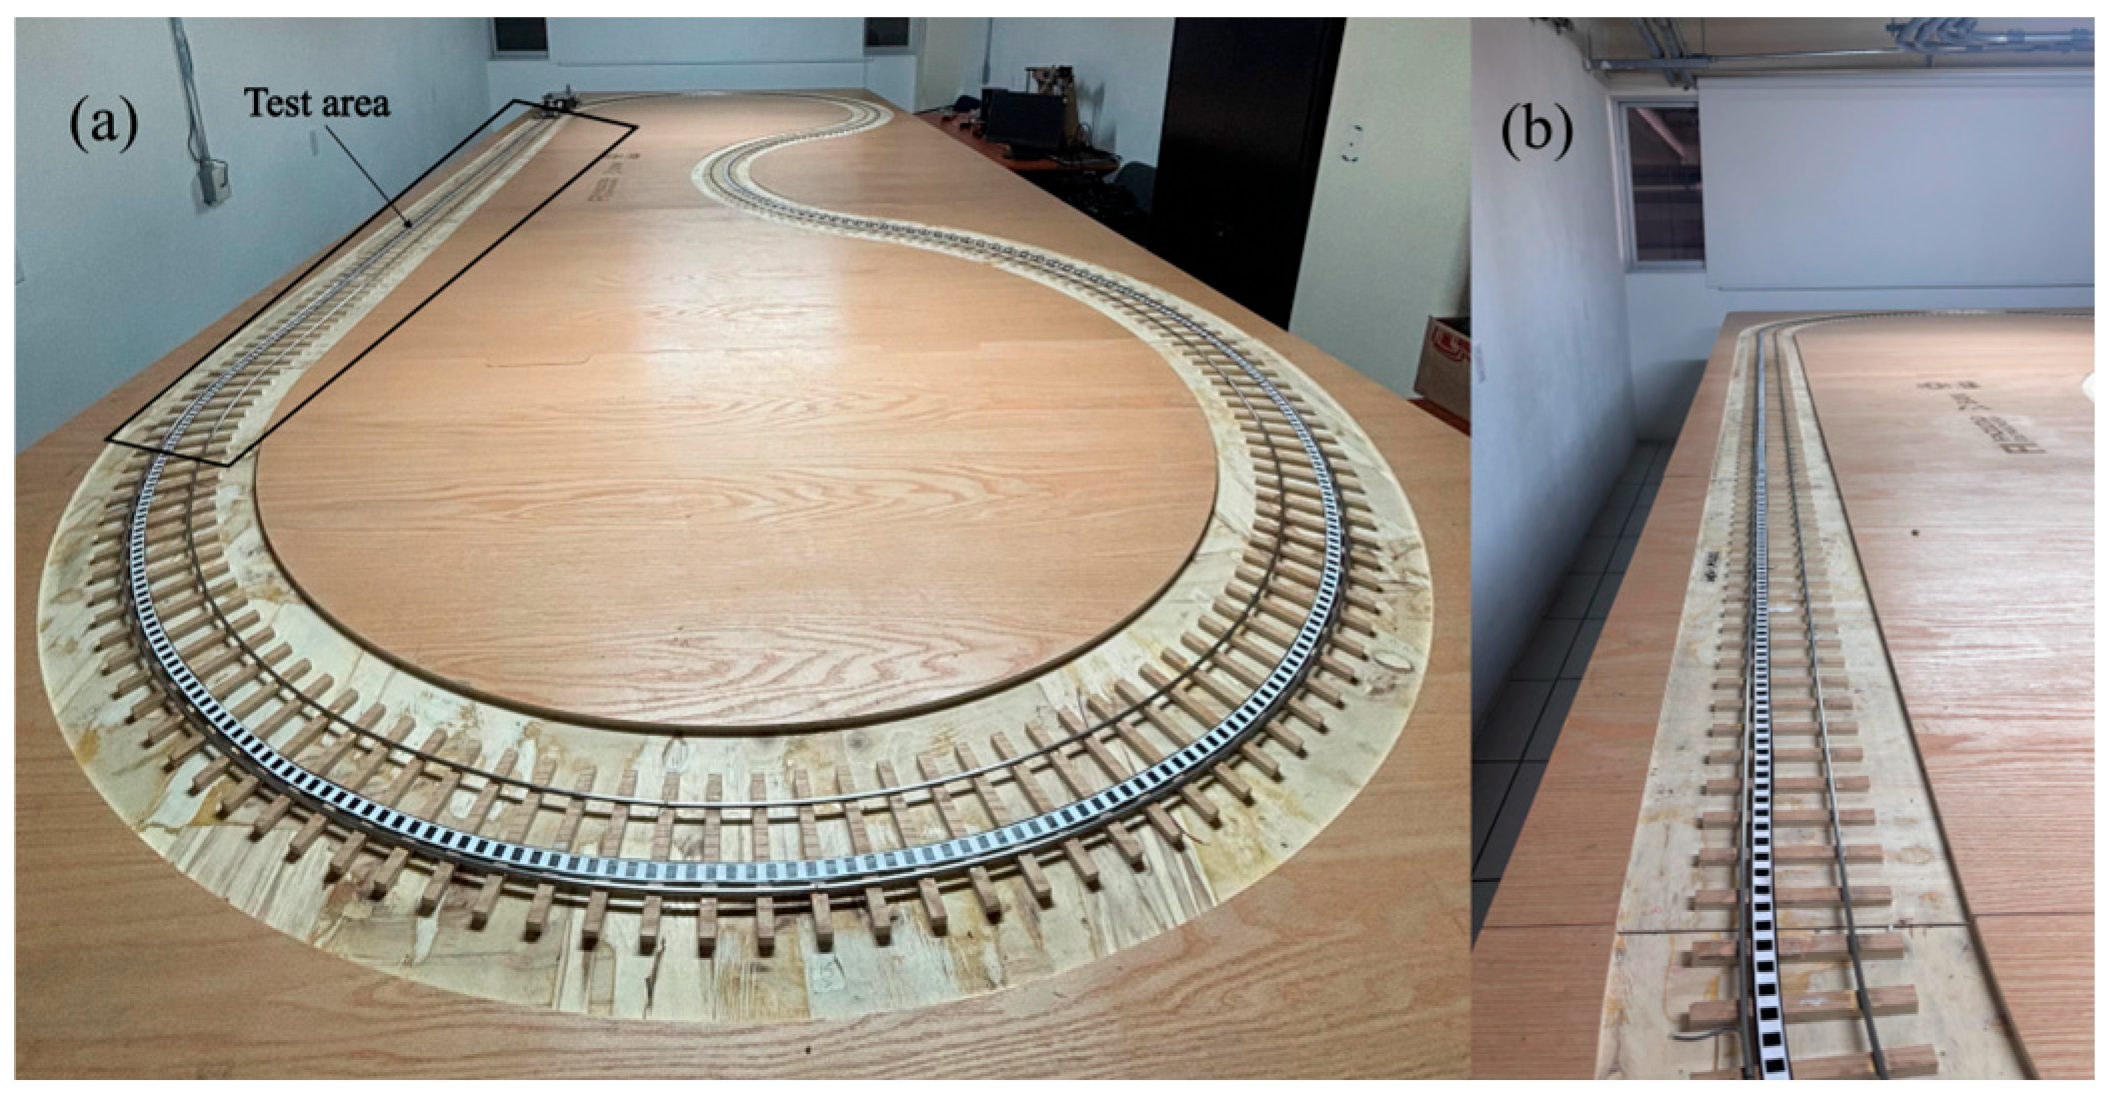
The tests were conducted using a 1:20 scale model of a railway vehicle and railway track, installed in the Dynamics and Vibrations Laboratory at the Universidad Autónoma de Querétaro (UAQ). The track was a closed-loop circuit of a β. It was built on a Steel table 920 mm high, with a Surface made of four plywood sheets, covering an area of 2360 mm × 5680 mm. The Steel rails, with a diameter of 5 mm, were glued with epoxy resin. The curves of the track measured 1940 mm each, and the total length of the track installed in the Laboratory was 12,524 mm.
Figure 1a shows the complete track, as well as the section used for the experiments.
The section of the track used for the tests is a total of 3.0 m. It is the straight section of the track, so that the railway vehicle’s braking moment to be more easily controlled, facilitating the analysis of the results.
Figure 1b shows this section of the track.
The railway vehicle consists of various control and data acquisition modules, including a Bluetooth module, an accelerometer, a gyroscope, an optical sensor, a rotary encoder, an SD card port, a current sensor, an H-bridge, a direct current (DC) motor, and the component that enables the entire system to operate: a SPARTAN FPGA. All of these components are powered by a LiPo battery, as shown in the schematic in
Figure 2. The main parameters of the railway vehicle are presented in
Table 1.
2.2. Instrumentation and Railway Conditioning
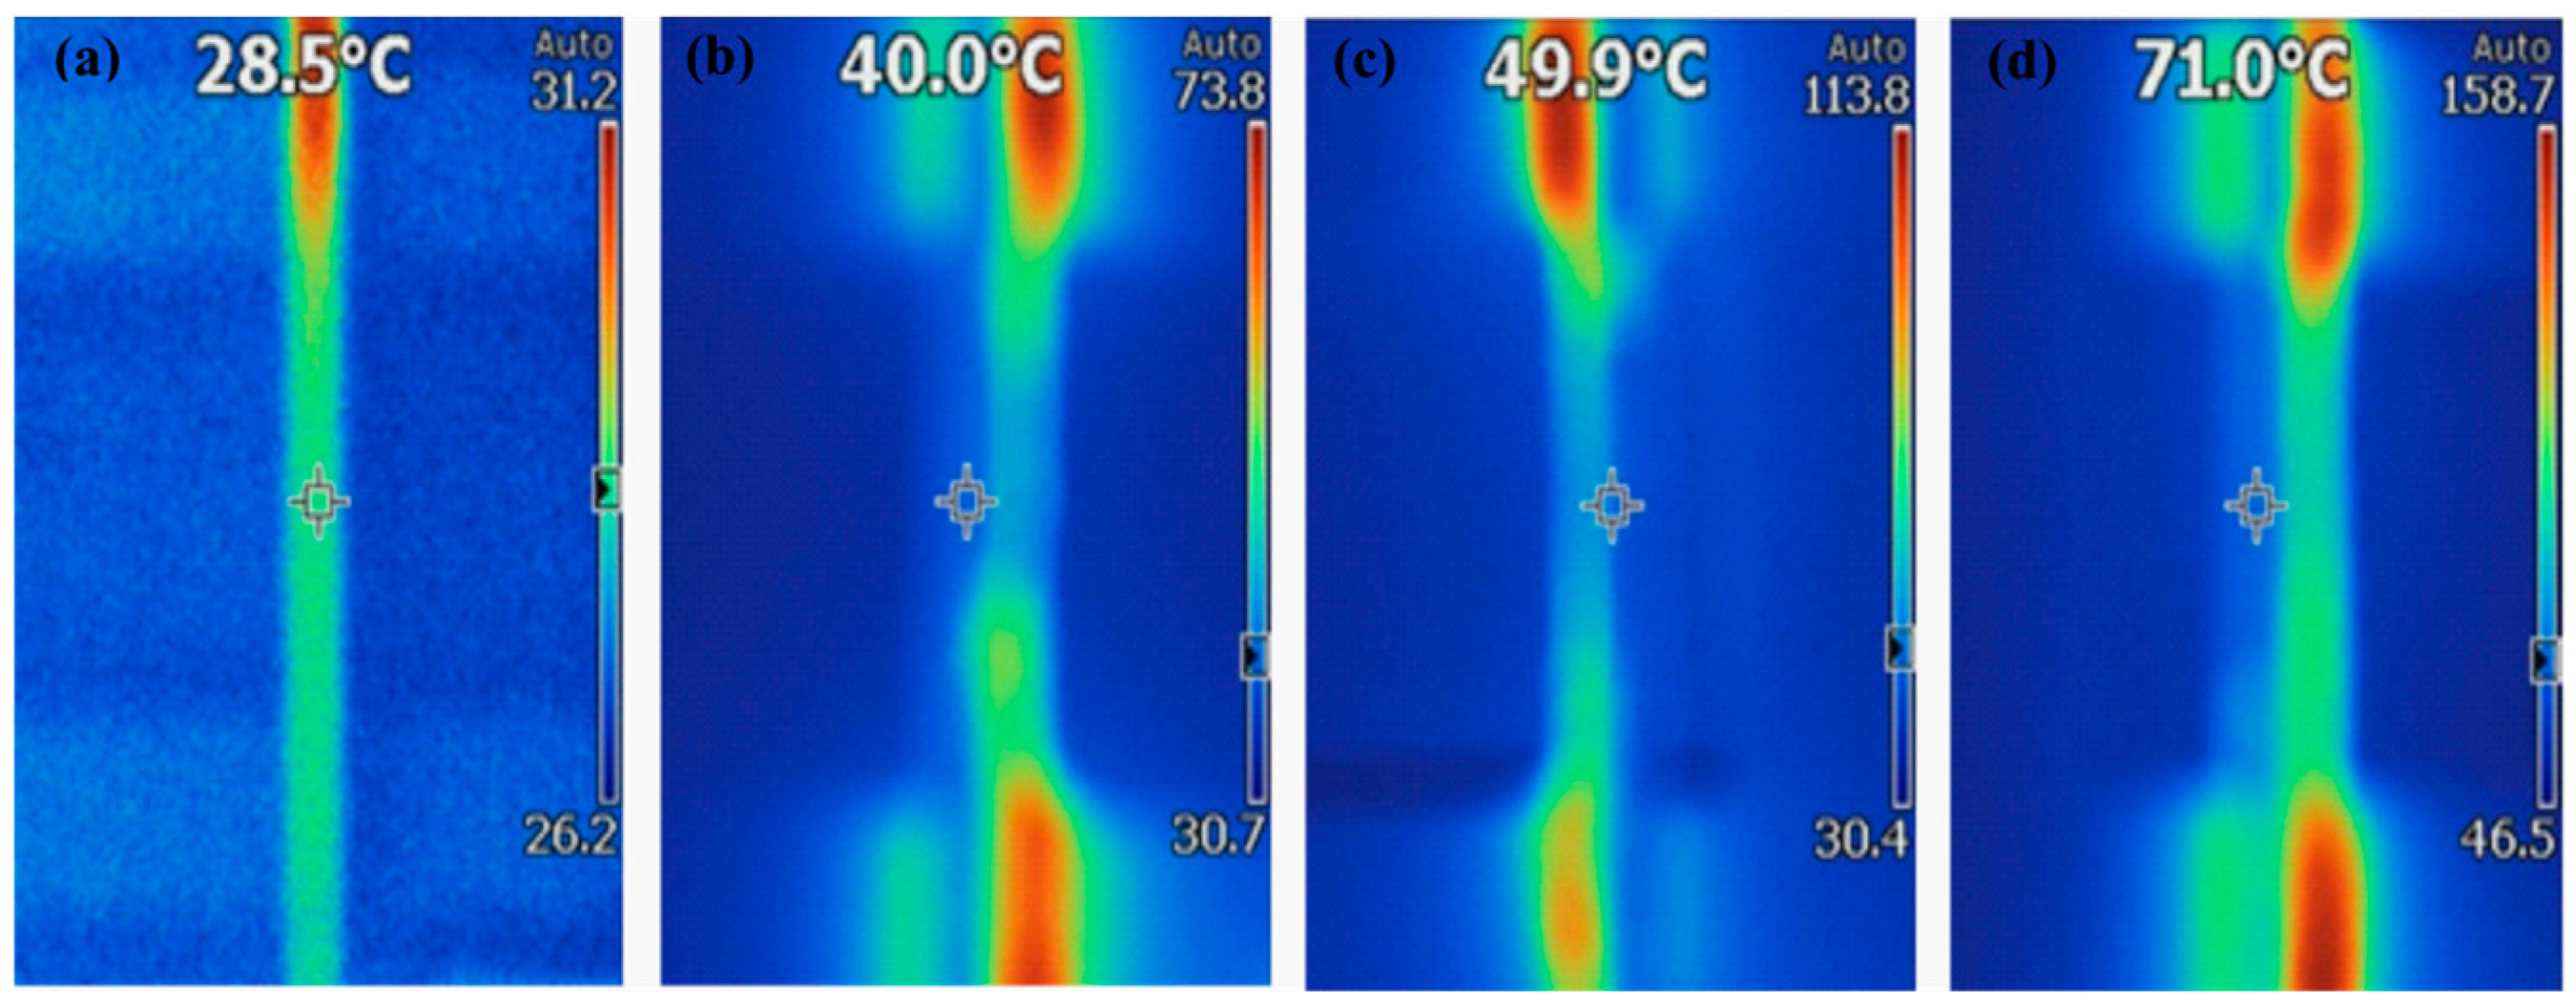
The temperatures to which the rails were subjected were 28.5 °C, 40.0 °C, 49.9 °C, and 71.0 °C, as shown in
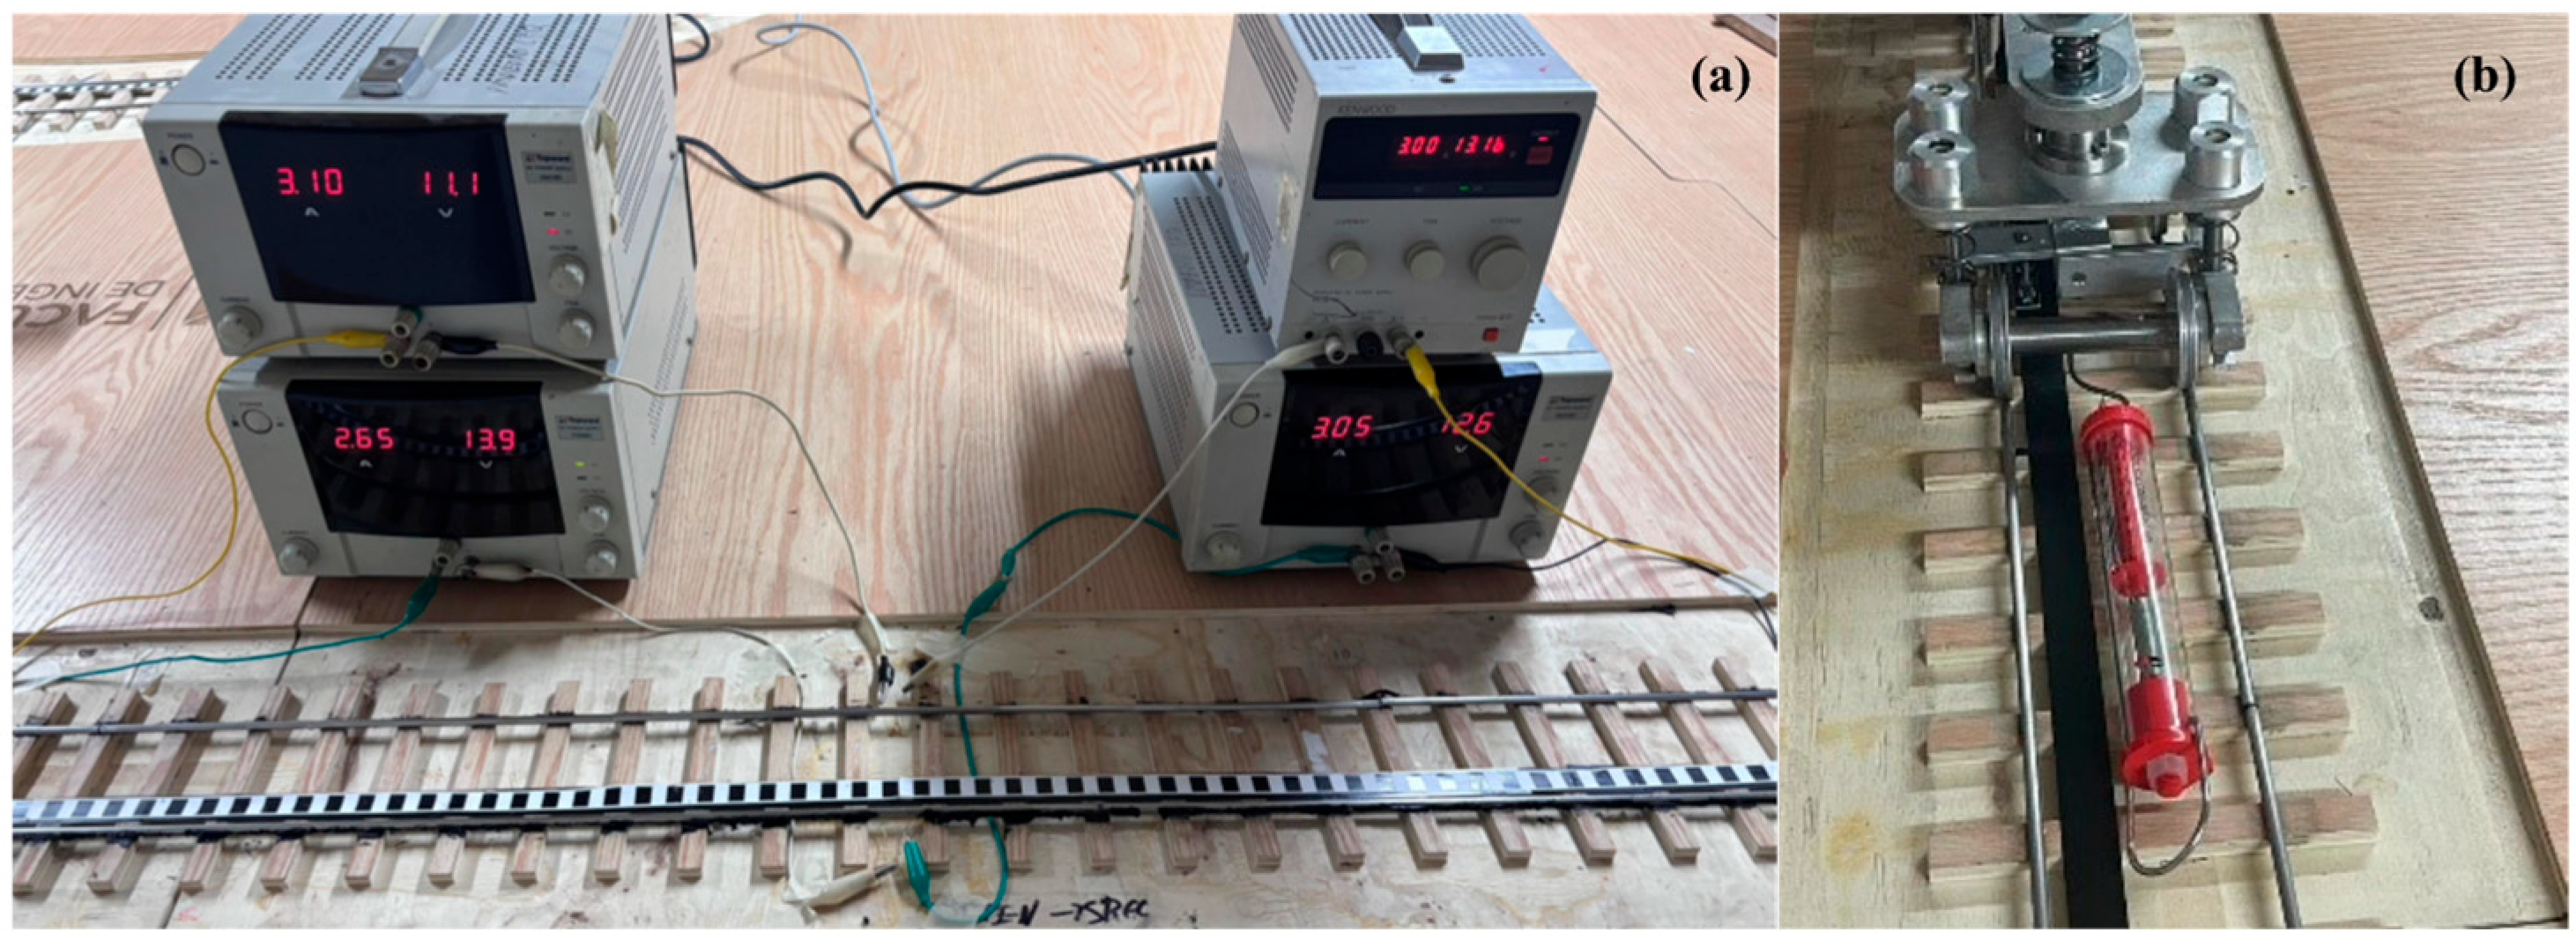
Figure 3. The temperature of 28.5 °C was the one recorded at room temperature. While the higher temperatures were achieved using a DC power source, adjusting the voltage supplied to the Nichrome wire glued to the outer sides of the rail (
Figure 4a) resulted in a different amperage: specifically, to reach 40.0 °C, approximately 1.6 A; for 49.9 °C, approximately 2.4 A; and for 71.0 °C, approximately 4.0 A. Using the infrared camera, it was verified for each experiment that the temperature remained constant throughout the entire test section. The DC power sources connected to the Nichrome wire were not turned off at any time, maintaining the same output current and, therefore, the same temperature on the rails.
These temperatures were selected based on the historically recorded minimum temperature in Mexico (−25 °C) [
20] and the highest temperature recorded over the past 28 years (35.3 °C) [
21], as well as direct solar radiation. The experiments were carried out at three different speeds (1.30 m/s, 1.00 m/s, and 0.75 m/s). The railway vehicle started 10 cm before the straight section of the track, and once it reached the last 115 cm of the straight segment, braking was initiated, as this section was the one that had heated up.
To measure the temperatures, a Kit Fluke Ti105 a3001 FC iFlex® infrared camera (Fluke, Everett, WA, USA) was used. The energy consumption data were obtained using the ACS712 Hall-effect current sensor (Allegro MicroSystems, Manchester, NH, USA), connected to the output power line of the railway vehicle’s motor. The braking time and maximum wheel slip were measured directly from the data provided by the DC5-24V rotary encoder model, which had 600 pulses per revolution and was coupled to the drive wheel via a toothed transmission belt.
2.3. Experimentation
Studies employ the static coefficient of friction (COF) in laboratory tests and scale models to evaluate the influence of variables such as temperature, roughness, and contaminants on wheel-rail adhesion [
22,
23]. This methodological approach is well established in the literature for comparative analyses under controlled conditions. The COF was calculated using a dynamometer and the equation:
where
is the total weight of the vehicle and
is the static friction force measured using the dynamometer. The factor of 4 represents the load shared by the four axles of the railway vehicle. This static COF value provides a baseline for evaluating the effect of temperature on the adhesion behavior at the wheel–rail interface.
The dynamometer was calibrated with standardized weights of 100 g and 200 g. The COF was then measured at each of the test temperatures, as shown in
Figure 4b.
For the COF calculation, the value of
was taken as (9.81 m/s2) (4.4 kg) = (43.16 N). The drag forces in each case were 2.4 N at 28.5 °C, 2.5 N at 40.0 °C, 2.6 N at 49.9 °C, and 2.8 N at 71.0 °C. Therefore, the COF at 28.5 °C was 0.222, at 40.0 °C it was 0.232, at 49.9 °C it was 0.241, and at 71.0 °C it was 0.259.
The static COF, measured under controlled conditions on the 1:20 scale model, allows for a reproducible comparison of the relative effect of temperature on the fundamental adhesive properties at the wheel-rail interface. While this value does not fully reflect the dynamic behavior during braking under real operating conditions, it provides a reliable indicator for evaluating trends and relative changes induced by thermal variations, which is the central objective of this research.
2.4. Data Processing
The railway vehicle featured three output signals that enabled the study of wheel and vehicle dynamics during braking. These signals were the wheel speed, the railway vehicle speed, and the current consumed by the motor. The data obtained were processed using the technique presented in a previous study [
24]. Before calculating creepage, digital filtering and segmentation were applied. This technique utilizes Empirical Mode Decomposition (EMD) to process the encoder and optical sensor signals, thereby eliminating noise and rigid body components. To automatically detect the start and finish of the deceleration phase, the first and last pulses from the optical speed sensor were used. Depending on the friction conditions, fixed-time windows, ranging from 0.5 to 1.5 s, were used to examine the data. This method enabled a coherent interpretation of the signals and their relationship to the system’s dynamic behavior.
The wheel and railway vehicle speed readings revealed the wheels slipping on the rail, as well as their oscillations during braking. The key information, directly measured from these signals, included the braking time, maximum creep, braking distance, slipping time, and the peak braking current.
The maximum creep was calculated using the formula:
where
is the forward speed of the railway vehicle and
is the tangential speed of the wheel. The convention used in the formula ensures that positive values correspond to braking conditions and negative values to traction.
Braking distance was calculated by discrete integration of the recorded velocity:
where
is the velocity of the railway vehicle at the moment of each pulse. Since each encoder pulse corresponds to 1 ms, the incremental distance was computed for each pulse, and all increments were summed to obtain the total braking distance.
The dominant random contribution to the uncertainty in D arises from the quantization of the encoder coupled to the wheel. For a wheel radius, the linear displacement per pulse is:
and the standard deviation of the quantization error (uniform distribution) is:
this yields a velocity-sampling uncertainty:
and a corresponding contribution to the distance uncertainty:
Using the previous equations, and N as 2304 (number of samples in every experiment), the uncertainty is ±3.34 mm in the total braking distance. This uncertainty represents a relative error between 0.2% and 0.6%, which is excellent for scale experiments.
2.5. Uncertainty Analysis
To address the reliability of measurements obtained under single-test conditions, a quantitative analysis of experimental uncertainty was performed on key parameters. This approach is supported by the Guide to the Expression of Uncertainty in Measurement (GUM), an international standard for evaluating uncertainty in measurements, which is especially useful when experimental repeatability is not feasible [
25,
26].
2.5.1. Braking Distance Uncertainty
The braking distance uncertainty (D) was derived from the resolution of the encoder coupled to the wheel. For a wheel radius of 23 mm and 600 pulses per revolution, the standard uncertainty was calculated as ±3.34 mm. Considering the measured braking distances (which range from 0.560 m to 1.590 m), this represents a relative error between 0.2% and 0.6%. This low value indicates that the braking distance measurement is accurate and that the observed differences between conditions are orders of magnitude larger than the instrumental uncertainty.
2.5.2. Uncertainty in Speed
The vehicle speed is calculated from the encoder readings. The uncertainty in the instantaneous speed is derived from the uncertainty in position and the time between pulses (Δt = 1 ms). Using Formula (6) from
Section 2.4:
Given that the test speeds are 0.75, 1.00, and 1.30 m/s, the relative uncertainty in speed ranges from 5.5% to 9.2%. Although higher than for distance, this uncertainty is systematic and applies equally to all conditions, so it does not mask comparative trends.
2.5.3. Uncertainty in Maximum Creep
Creep is calculated as
, where
is the tangential speed of the wheel. Assuming that the uncertainty in
is similar to that of
(since both are measured with encoders), and applying uncertainty propagation for a ratio [
27].
Using the maximum value of
, we obtain:
However, uncertainty exists in an instantaneous measurement. The reported “maximum creep” is the peak value of a time series, and its absolute uncertainty is comparable to the resolution of the data acquisition system. The observed differences in maximum creep between conditions (e.g., 55.37% vs. 75.83%) are significantly greater than 13%, indicating robust trends.
2.5.4. Current Uncertainty
The ACS712 current sensor has a typical accuracy of ±1.5% according to its datasheet [
28]. For the measured currents (in the range of −0.903 A to −1.935 A), the absolute uncertainty is approximately ±0.015 A to ±0.029 A, which is negligible compared to the observed differences between conditions (e.g., −0.903 A vs. −1.935 A).
3. Results
This section presents the results obtained from the experiments described previously.
Table 2 presents the data in a general format, while the subsections that follow present and discuss the plots obtained for each thermal and speed condition. Finally, a general comparison of the observed effects is provided.
Before presenting the results, it is crucial to discuss the sensitivity of the measurement system to possible sources of error. With the encoder used and a 23 mm wheel radius, the linear resolution is approximately 0.24 mm per pulse, adequate to detect creep trends but potentially limiting during fast transients. The belt transmission introduces slight torsional compliance, which may cause small phase shifts and smooth the measured signal. In addition, during large slip events, high angular accelerations can lead to missed pulses, resulting in a slight overestimation of the calculated creep.
Using the previous equations, and
as 2304 (number of samples in every experiment), the uncertainty is ±3.34 mm in the total braking distance. This uncertainty represents a relative error between 0.2% and 0.6%, which is excellent for scale experiments.
For a better understanding of the data presented in
Table 2 and the following subsections, it is important to clarify the meaning of the evaluated parameters. The braking time refers to the time interval between the activation of the railway vehicle and its complete stop, while the braking distance is the distance traveled during that time.
The creepage period corresponds to the period during which there is a considerable difference between the wheel speed and the vehicle speed, indicating a partial loss of adhesion. The maximum creep value represents the highest percentage of relative slip between the wheel and the rail, suggesting the effectiveness of the braking system. Finally, the measured current represents the electrical behavior of the vehicle during braking, where the maximum current will be negative because the motor works as a generator, reversing the electrical current through the source, which is a crucial factor in braking performance.
3.1. Rail at 28.5 Degrees Celsius
Figure 5 presents the plots obtained from the cases carried out at 28.5 °C.
Figure 5a shows the results at a speed of 1.30 m/s. A braking time of 2144 ms was observed, of which 1855 ms (86.52%) corresponds to the creepage period. Additionally, a negative current peak of −1.935 A is observed. According to the data in
Table 2, the braking distance was 1.531 m, and the maximum creep observed was 75.281%.
Figure 5b presents the results obtained at a speed of 0.75 m/s, showing a braking duration of 1470 ms, of which 1079 ms (73.401%) corresponded to the creepage period. A maximum current of −1.354 A was also recorded. Meanwhile, the data in
Table 2 show a braking distance of 0.623 m and a maximum creep of 61.575%.
Figure 5c shows the results obtained at a speed of 1.0 m/s. The braking time was 1534 ms, of which 1290 ms corresponded to the creepage period, representing 84.094% of the total time. Additionally, a current peak of −1.741 A was recorded. According to the data in
Table 2, the braking distance was 0.908 m, and the maximum creep value was 67.276%.
3.2. Rail at 40.0 Degrees Celsius
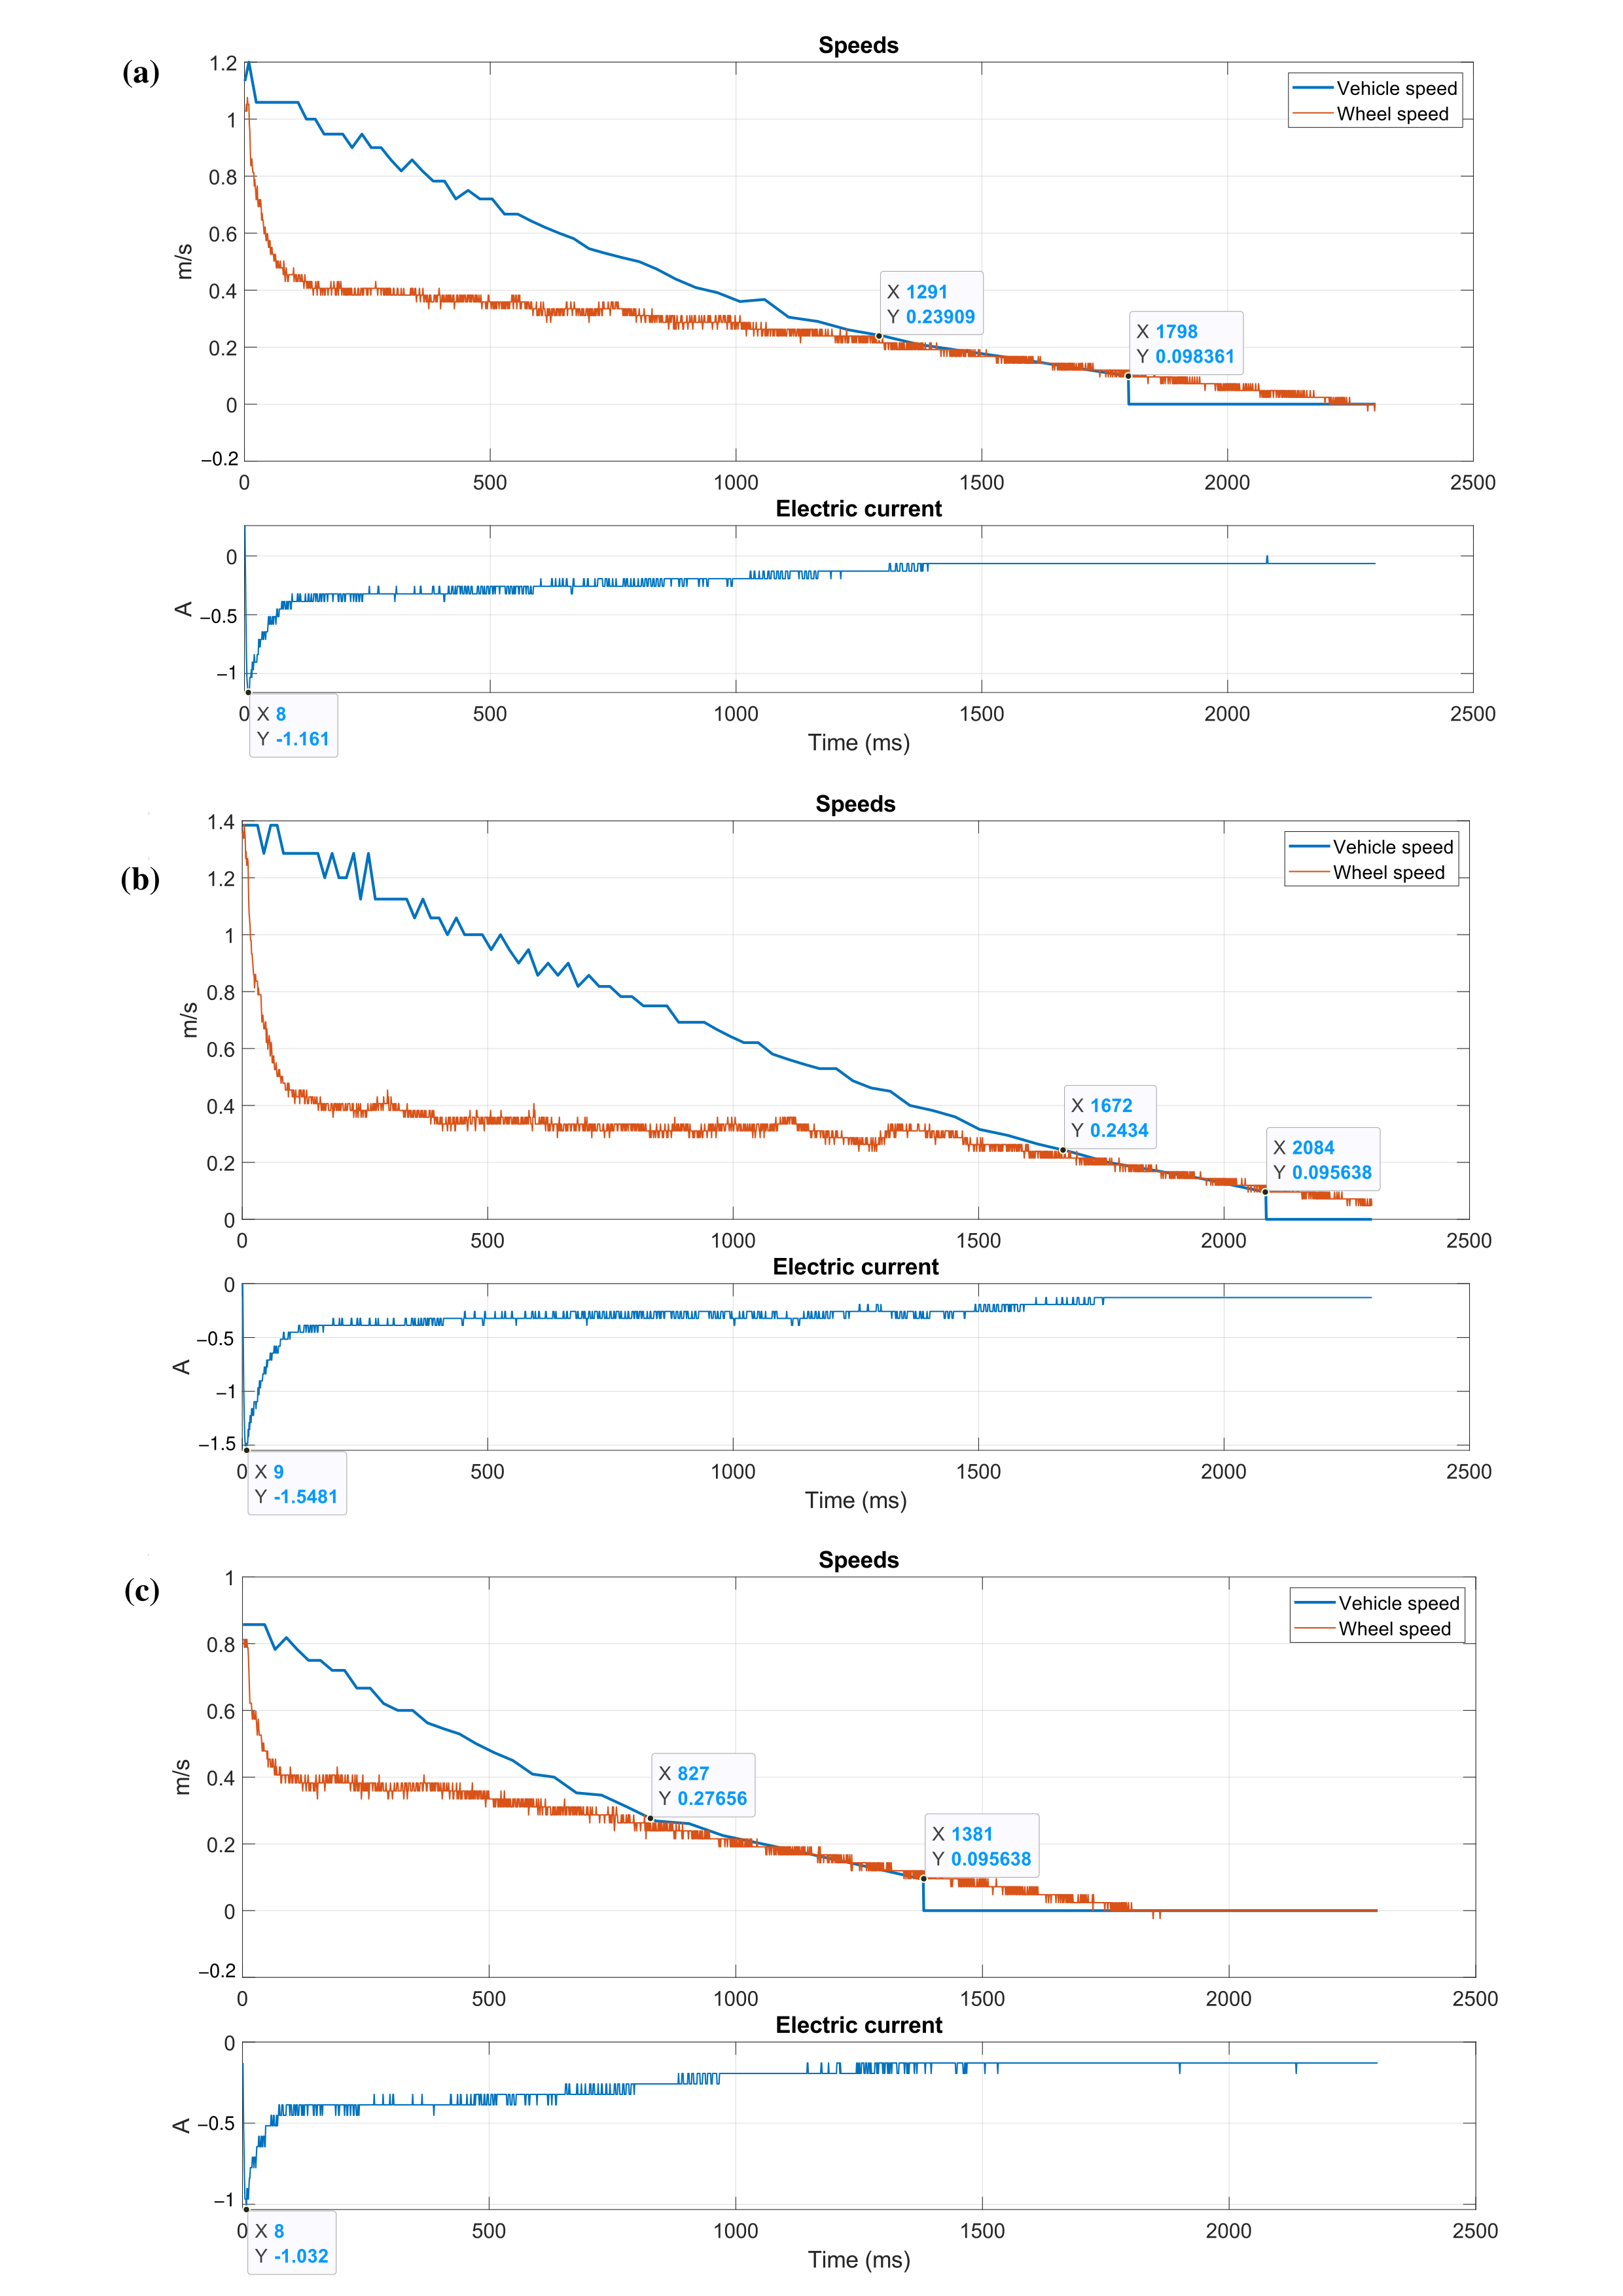
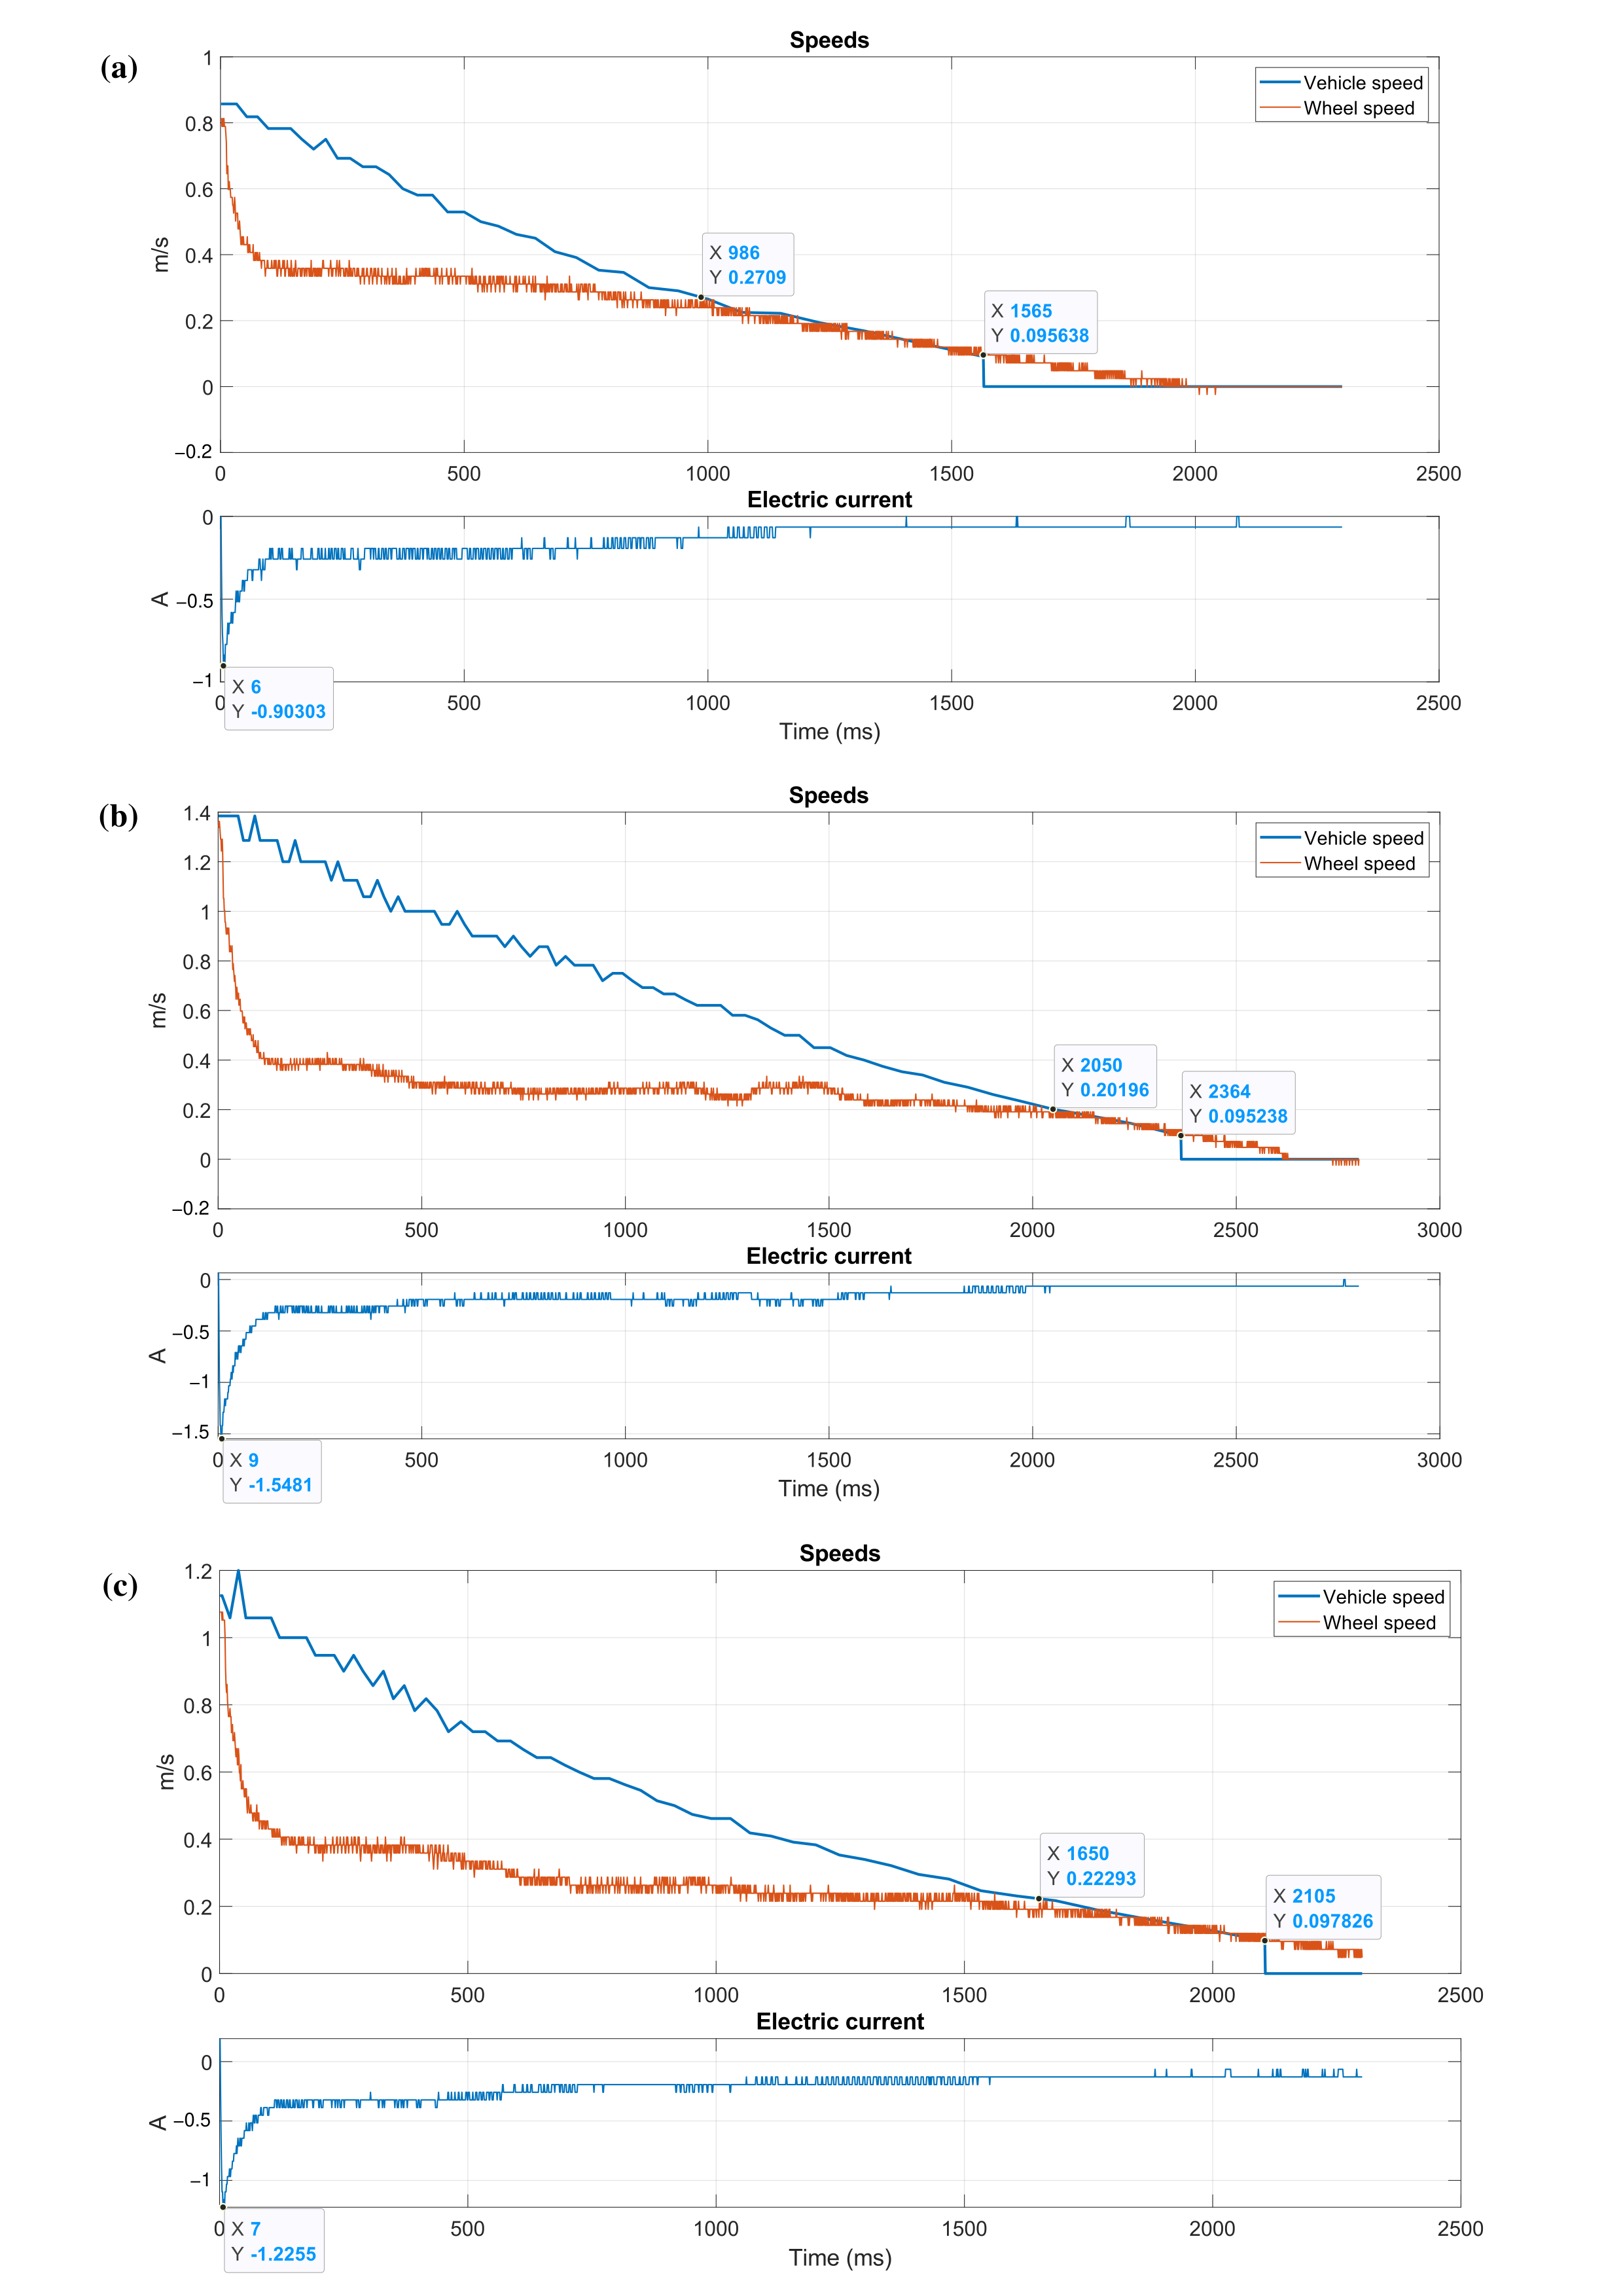
The braking performance at a temperature of 40.0 °C is shown in
Figure 6. For the case at a speed of 1.0 m/s (
Figure 6a), the braking duration was 1798 ms, of which 71.802% (1291 ms) corresponded to the creepage period. A current of −1.161 A was recorded. According to the data in
Table 2, the braking distance was 0.889 m and the maximum creep was 61.745%.
From the results shown in
Figure 6b, at a speed of 1.30 m/s, the braking time was 2084 ms, with 80.23% (1672 ms) corresponding to the creepage period. A peak current of −1.548 A was recorded. The data in
Table 2 shows a braking distance of 1.352 m and a maximum creep of 72.105%.
The results for the case conducted at a speed of 0.75 m/s are presented in both
Figure 6c and
Table 2.
Figure 6c shows a braking time of 1381 ms, with a creepage period of 827 ms (59.884%). A maximum current of −1.032 A was also recorded. The data calculated in
Table 2 indicate a braking distance of 0.560 m and a maximum creep of 55.369%.
3.3. Rail at 49.9 Degrees Celsius
The results from the cases conducted at a temperature of 49.9 °C are shown in the plots presented in
Figure 7.
Figure 7a displays the outcome at a speed of 0.75 m/s. It shows a braking time of 1565 ms, of which 986 ms (63.003%) corresponded to the creepage period. Additionally, the maximum current recorded was −0.903 A. On the other hand, the calculated data in
Table 2 indicate a braking distance of 0.639 m and a maximum creep of 57.752%.
Figure 7b presents the data obtained at a speed of 1.30 m/s. It shows a braking time of 2364 ms, with 86.717 (2050 ms) corresponding to the creepage period. The peak current recorded was −1.548 A. According to the data in
Table 2, the braking distance was 1.532 m, and the maximum creep was 73.70%.
Finally,
Figure 7c displays the results at a speed of 1.0 m/s. The braking time was 2105 ms, of which 1650 ms (78.385%) corresponded to the creepage period. The peak current recorded was −1.225 A. The calculated data in
Table 2 show a braking distance of 1.047 m and a maximum creep of 64.668%.
3.4. Rail at 71.0 Degrees Celsius
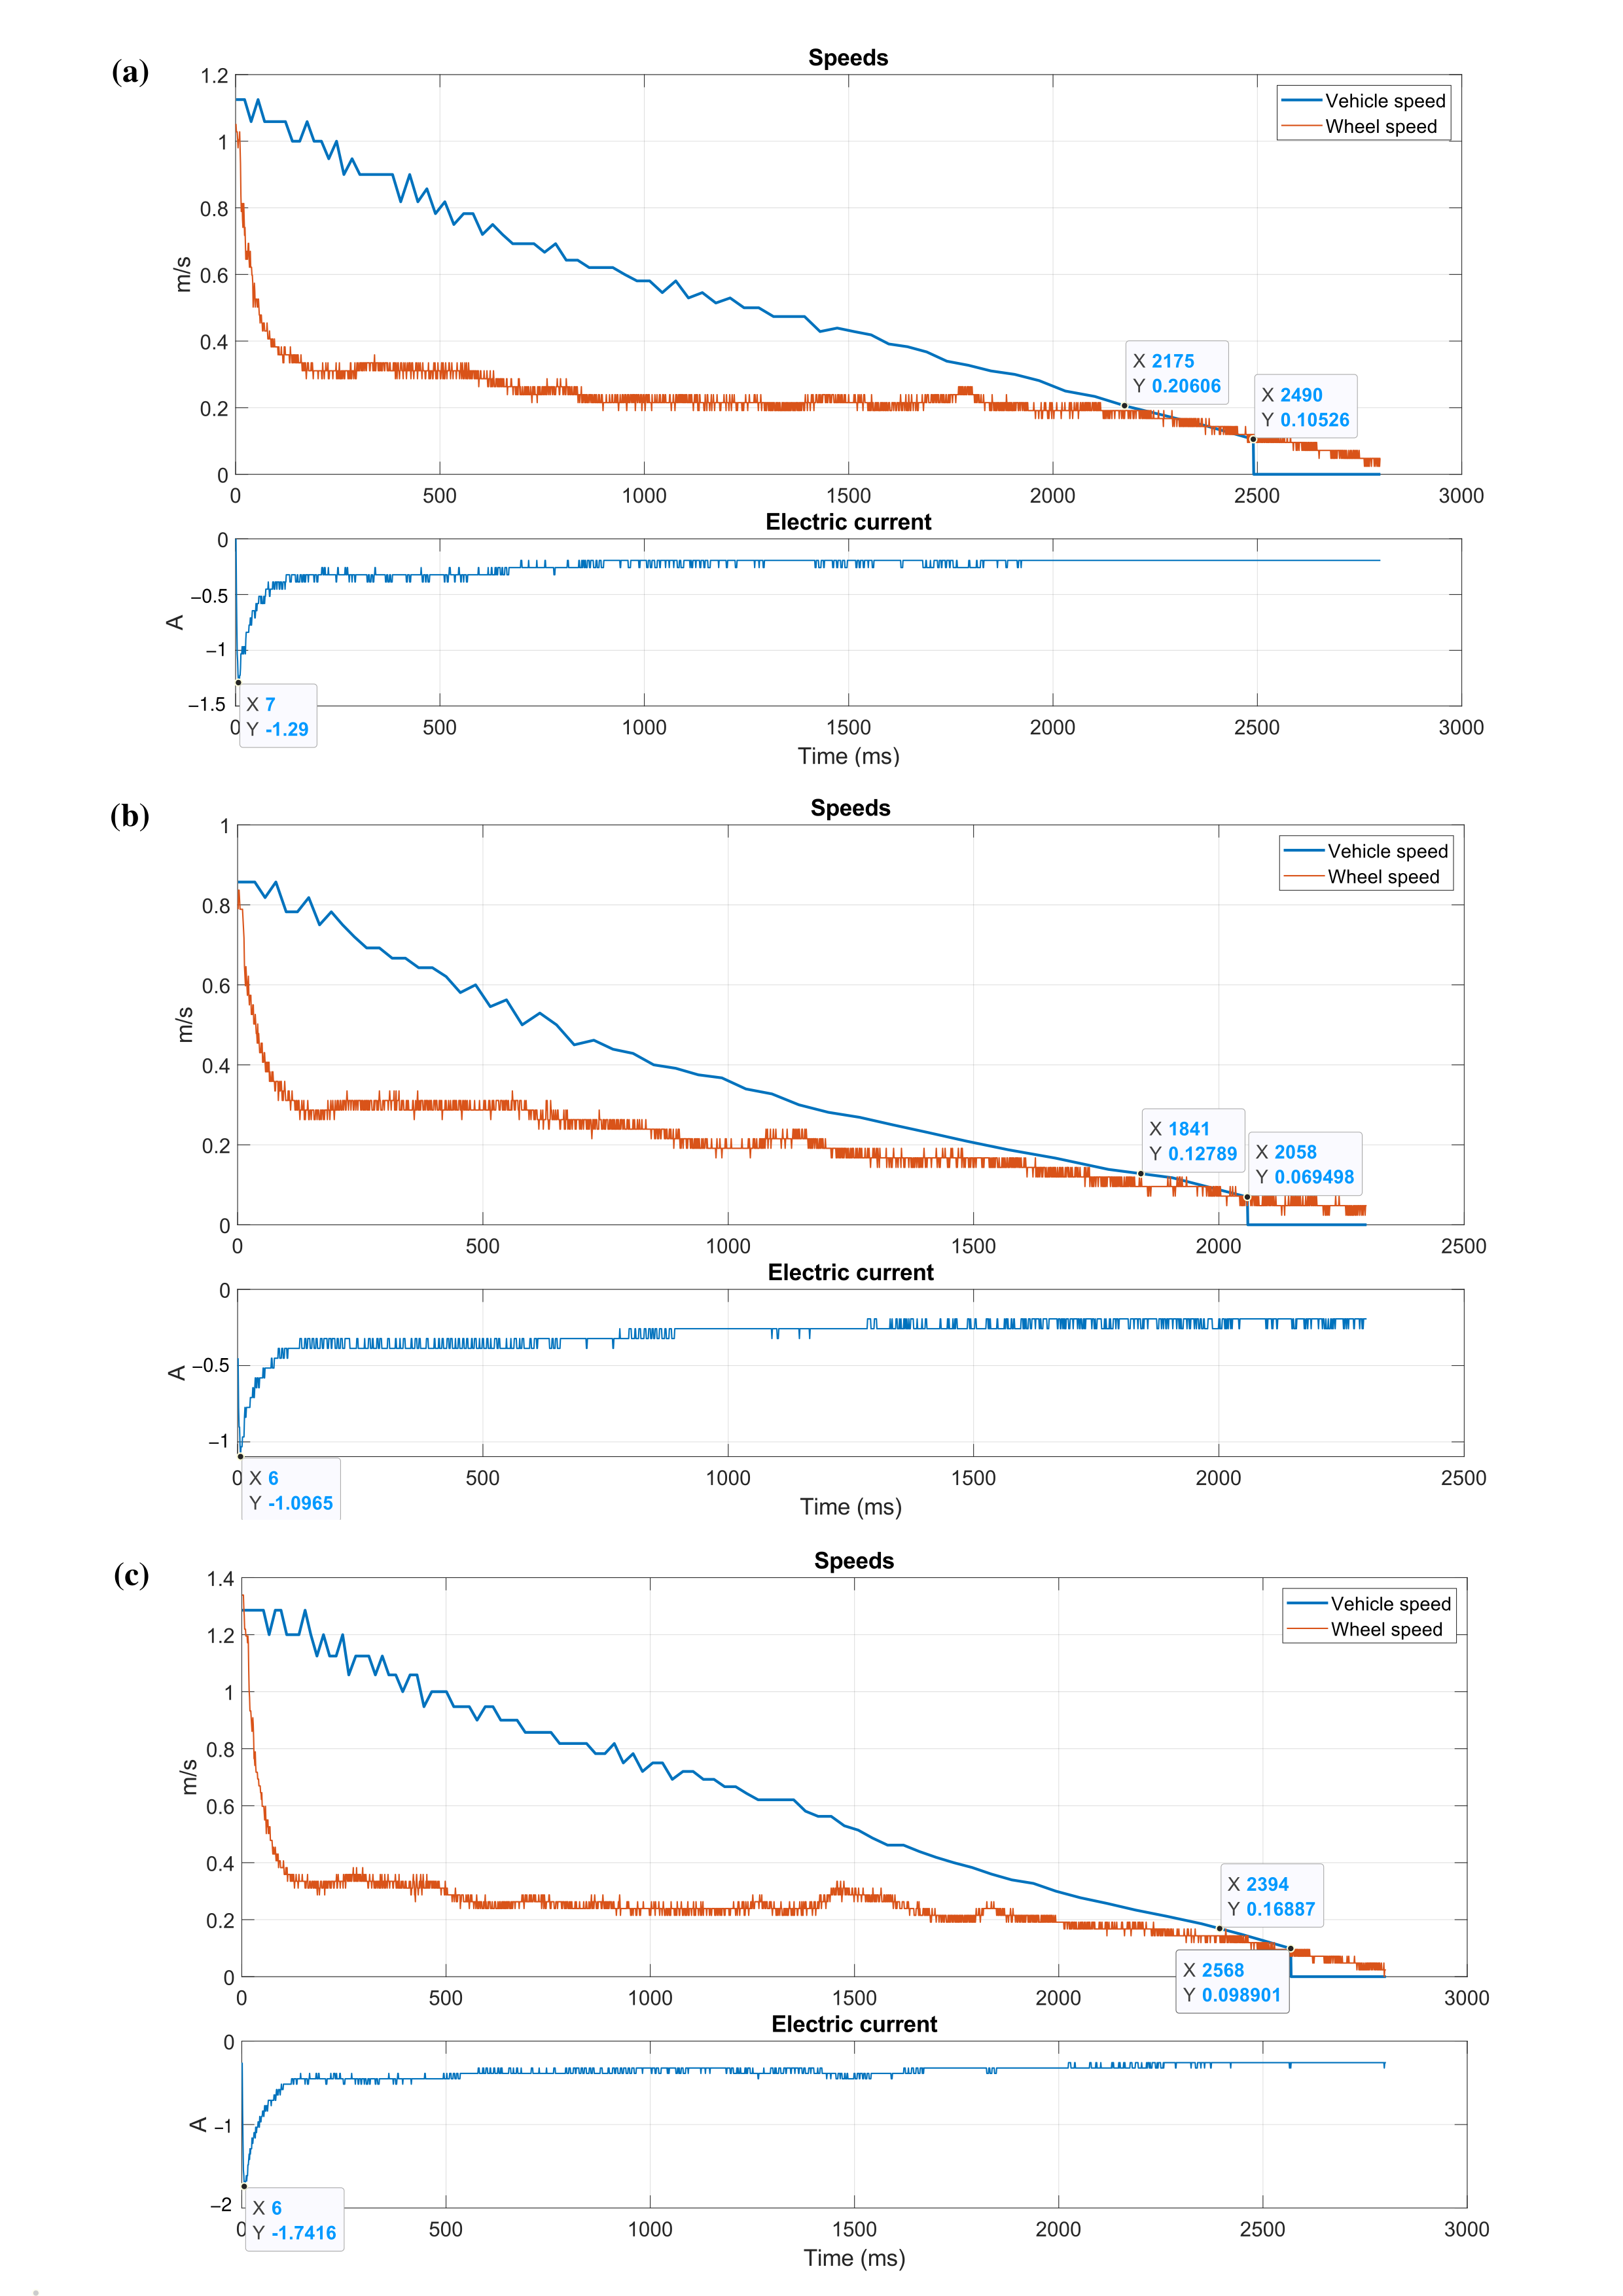
For the temperature of 71.0 °C, the results are presented in
Figure 8.
Figure 8a shows the outcome at a speed of 1.0 m/s, where a braking time of 2490 ms was recorded, with 87.349% (2175 ms) corresponding to the creepage period. The peak current registered was −1.29 A.
Table 2 indicates that the braking distance was 1.311 m and the maximum creep was 72.735%.
The results at a speed of 0.75 m/s are shown in
Figure 8b. It shows a braking time of 2058 ms and a creepage period of 1841 ms (89.456%). The peak current recorded was −1.096 A.
Table 2 shows a braking distance of 0.801 m and a maximum creep of 67.856%.
Finally,
Figure 8c presents the results at a speed of 1.30 m/s. The braking time was 2568 ms and the creepage period was 2394 ms (93.224%) with a peak current of −1.742 A. The data in
Table 2 indicate a braking distance of 1.590 m and a maximum creep of 75.825%.
To fully understand the implications of rail temperature on braking performance, a comprehensive comparison of the experimental data across all tested temperatures and speeds is essential. This comparative analysis will elucidate the non-linear thermal responses observed and highlight the critical role of rail temperature in wheel-rail adhesion and overall braking efficiency.
4. Discussion
The COF is a factor that shows a significant change, increasing as the temperature rises, an effect previously observed in earlier studies [
17,
18]. This variation alters the adhesion between the railway vehicle and the rail, which in turn affects the braking distance and time, as well as the current used by the railway vehicle during braking.
The cases corresponding to a temperature of 40.0 °C are those that have a greater braking efficiency than those obtained in the other cases. This suggests that, at this temperature, the wheel-rail contact has a more favorable friction condition, possibly due to the evaporation of surface moisture achieved at this temperature. This has been demonstrated in previous studies, which concluded that lower humidity levels result in higher COF values [
15,
16]. In fact, Case 6 recorded a maximum creep of 55.369%, the weakest among all the cases, indicating the least loss of wheel-rail adhesion. In contrast, Case 12 showed the most significant adhesion loss, with a maximum creep of 75.825%.
The previously mentioned behavior is reflected in the braking distances, which tend to decrease as the temperature increases. An exception to this trend is found in the cases conducted at 71.0 °C, where the braking distances are greater than those observed in the other cases, with the longest distance recorded in Case 12 (1.590 m). This behavior was observed in a previous study on brake discs, where braking distances increased with increasing temperature [
19].
Another critical factor is the current used during braking. In Cases 4 and 5, the lowest current peaks were recorded at speeds of 1.0 and 1.3 m/s, respectively. The weakest of all is Case 7, which was carried out at 49.9 °C and a speed of 0.75 m/s. In this case, a current of −0.903 A was recorded. Despite this, the braking distance was greater than the one recorded at 40.0 °C at the same speed. The temperature of 49.9 °C may have induced unfavorable conditions, reducing braking effectiveness despite the lower current demand.
Comparing the results obtained at 71.0 °C, it can be observed that, despite having lower current peaks than those recorded at 28.5 °C, the current peaks increase as the temperature rises, approaching the values seen in the first three cases. This suggests a behavior similar to that reported in previous studies, where COF increases with rising temperature [
16], but beyond a certain point, it begins to decrease [
17].
Limitations of the Scaled Model and Thermal and Mechanical Similarity Analysis
It is important to recognize that using a 1:20 scale model, even though useful for controlled laboratory studies, introduces significant differences in thermal mass, heat conduction, and contact mechanics compared to a full-scale railway system. This represents a limitation inherent to any physical modeling approach.
For the purely mechanical aspects of braking dynamics, such as inertia and slip, a similarity based on the Froude number was sought, as this dimensionless number governs phenomena where inertial and gravitational forces are dominant. For this reason, a speed range of 0.75–1.30 m/s was selected in order to qualitatively simulate the dynamic behavior at higher scales, as has been applied in other scaling contexts [
29]. As discussed in that work, the scaling process often requires a compromise between different dimensionless numbers, and in this exploratory phase, mechanical similarity was prioritized.
Although the mechanical similarity based on the Froude number provides a first approximation, a quantitative extrapolation of the thermal behavior to the full-scale system is more complex, as it requires matching additional dimensionless parameters. The Biot number in this model is significantly lower, indicating a more uniform temperature distribution compared with the steep gradients of a real rail [
30]. The Fourier number scales with the square of length, making heat conduction faster in the scaled model and limiting the capture of transient heat accumulation. Moreover, the Péclet number is much smaller, underestimating the thermal drag effect that dominates at high real speeds [
31].
5. Conclusions
This study examines the impact of temperature on the braking system. Unlike other studies, this one focuses specifically on the effects caused by rail temperature, allowing us to understand how factors external to the rail vehicle can affect performance and safety. The results are compared, where possible, with the general findings of test results published in the literature. The following conclusions can be drawn from the presented study:
Rail temperature has a significant impact on braking behavior; as the temperature increases, so does the coefficient of friction (COF) and, therefore, the adhesion between the wheel and the rail.
At a temperature of 40.0 °C, the system showed the best braking results: the lowest loss of adhesion (maximum creep of 55.37%) and the shortest braking distances. The temperature improved the friction by reducing moisture in the rail.
While the increased temperature resulted in lower current peaks, this did not translate into greater braking efficiency, suggesting that a lower electrical load does not necessarily imply better adhesion or a shorter braking distance.
These points reflect a non-linear behavior of the system. There is an optimal thermal zone, followed by a loss of efficiency due to overheating. The rail temperature is influenced by both the environment and the train itself.
This work has inherent limitations associated with the use of a 1:20 scale model. The most significant is the impossibility of achieving complete thermomechanical similarity with a real railway system. Differences in the Biot, Fourier, and Péclet numbers mean that heat distribution, transient thermal conduction, and energy dissipation are not accurately scaled.
The nichrome wire heating system used in the 1:20 scale model does not perfectly reproduce the complex thermal distributions that occur in real-world situations (such as those generated by solar radiation or wheel-rail friction heating). This research provides a controlled and reproducible method for establishing a clear cause-and-effect relationship between rail temperature and braking performance. The methodology successfully maintained uniform and consistent temperature profiles along the rail, enabling the systematic investigation of thermal effects under laboratory conditions.
The contribution of this work lies in its qualitative and methodological findings. Experiments with the scale model demonstrated, in isolation, that rail temperature influences braking effectiveness, exhibiting non-linear behavior and the existence of an optimal adhesion point. These qualitative results remain consistent and transcend the limitations of the scale, thus providing robust experimental verification of a phenomenon that had not been sufficiently studied. In this way, the research lays the methodological groundwork and establishes physical premises for the subsequent development of advanced numerical models, aimed at achieving reliable quantitative extrapolations to full-scale railway systems.
