Article

Analysis of Grid Disturbances Caused by Massive Integration of Utility Level Solar Power Systems

1
Purdue Polytechnic Institute, Purdue University, West Lafayette, IN 47907, USA
2
Department of Engineering, Colorado State University–Pueblo, Pueblo, CO 81001, USA
*
Author to whom correspondence should be addressed.
Eng 2022, 3(2), 236-253; https://doi.org/10.3390/eng3020018
Submission received: 7 March 2022 / Revised: 14 April 2022 / Accepted: 18 April 2022 / Published: 29 April 2022
(This article belongs to the Special Issue Feature Papers in Eng 2022)

Abstract

:
Solar generation has increased rapidly worldwide in recent years and it is projected to continue to grow exponentially. A problem exists in that the increase in solar energy generation will increase the probability of grid disturbances. This study focuses on analyzing the grid disturbances caused by the massive integration to the transmission line of utility-scale solar energy loaded to the balancing authority high-voltage transmission lines in four regions of the United States electrical system: (1) California, (2) Southwest, (3) New England, and (4) New York. Statistical analysis of equality of means was carried out to detect changes in the energy balance and peak power. Results show that when comparing the difference between hourly net generation and demand, energy imbalance occurs in the regions with the highest solar generation: California and Southwest. No significant difference was found in any of the four regions in relation to the energy peaks. The results imply that regions with greater utility-level solar energy adoption must conduct greater energy exchanges with other regions to reduce potential disturbances to the grid. It is essential to bear in mind that as the installed solar generation capacity increases, the potential energy imbalances created in the grid increase.

Graphical Abstract

1. Introduction

1.1. Proposed Solution

In the last decade, solar energy generation has grown enormously around the world. At the end of 2019, the installed capacity in the world of photovoltaic systems was more than 635 GW [1]. By 2050, it is predicted that solar energy will become the second-largest renewable generation source in the world after wind. In 2050, it is also predicted that the installed capacity in the world will exceed 8000 GW [2]. The increase in renewable generation, particularly solar energy, increases the probability of grid disturbances. Due to the above issues, it is necessary to quantify the potential impact of grid disturbances produced by the integration to the transmission line utility-scale solar energy loaded to the balancing authority high-voltage transmission lines (not utility-scale solar powering low voltage local distribution). In this way, electric power companies can size the problem and justify implementing solutions. This study proposes an analysis of the impact on the grid considering integrating solar energy plants to the grid in four regions of the United States electrical system: (1) California (high solar generation), (2) Southwest (moderate solar generation), (3) New England (low solar generation), and (4) New York (null solar generation). These four regions were selected because there is variation between them, ranging from the region with the most solar generation, California, to one with no utility-level solar generation (according to the Energy Information Administration [3]), New York. The impact analysis of the grid was completed using hourly increments, considering net generation changes, net generation error with demand, and energy power peaks. The findings contribute to solving the problem by quantifying the impact on the energy balance and the power peaks caused by the massive integration of solar power plants. This study seeks to answer the following research question.
Research Question: How does the penetration of solar energy utility level affect energy imbalances and the peak of power in the grid?

1.2. Current Approaches to the Problem and Gaps in Current Approaches

Among the current approaches, several technologies support the integration of solar energy into the grid to reduce potential disturbances, including technological advancements of inverters, solar grid protection plants, better forecasts of solar energy generation, net metering policies, and peer-to-peer energy trading [4].
The function of the inverters is to convert the direct current (DC) produced by the solar panels into alternating current (AC) and control its output voltage [5]. These inverter features are validated at the manufacturing stage, where the devices are subjected to loads that simulate their operation and interaction with the network [4]. However, a gap exists in that implementing inverters that allow voltage control to maintain a more stable grid can only be applicable to small-scale and small-sized photovoltaic installations, generally used in solar plants of less than 30 MW. In larger plants, grid and plant protection is required.
Other technologies include grid and plant protections, which are devices that monitor all the critical parameters of the grid and disconnect the plant from the network in the event of a disturbance [4]. Grid plant protection is a solution for today’s grid. However, a gap exists in moving to a smart grid and increasing solar energy penetration, and this technology will need to be adapted for future solutions [6].
Solar forecasting is another technology used to reduce disturbances on the grid; it consists of predicting the behavior of solar generation to react quickly to any problem on the grid. Generally, solar forecasting uses historical data of generation and weather conditions [7]. However, a gap exists in that a few countries have established standards on performing solar forecasting, whereby the methodologies vary from one electrical system to another. Additionally, there are unique local factors in each region that can impact the prediction of solar generation. Also, there is still a gap in the analysis of the integration of solar energy considering the hourly operation of the electricity market at the transmission level.
Another approach is net metering policies which allow users to load excess energy production into the local grid. Some studies have shown that net metering can improve the quality of the power, which would help reduce disturbances in the grid [8,9]. However, a gap exists in that the penetration of solar energy at the residential level is still shallow in the world and most of the states of the United States. As a result of an imminent massive increase in solar generation at the utility level, net metering will not be enough to reduce disturbances in the grid. In addition, it has been reported that net metering is being phased-out [10].
Finally, Peer-to-Peer (P2P) energy trading is another approach that refers to the fact that energy prosumers can sell their electricity surplus to other users in the same grid. P2P has some benefits for the grid, reducing peak demand and improving the grid’s reliability [11,12]. However, a gap exists in that P2P still does not have the technical validation, security levels, and regulations necessary to be implemented on a large scale [11]. Furthermore, there are only a few pilot projects worldwide that have not been fully validated [13,14].
The rest of this paper is organized as follows: the next section (Section 2, Background) presents the concepts relevant to the study: grid disturbances, solar energy integration, and power grid in the US, followed by Section 3, Methods, in which the data collection and data analysis are presented. Section 4, Results, presents the main findings of the study. Subsequently, in Section 5, the results are discussed and compared to other studies. Finally, Section 6, Conclusions, summarizes the article.

2. Background

2.1. Problem Indentification

It is essential to resolve connectivity issues in the grid for a smooth transition to renewable energy [15]. It is also vital to analyze new methods to correctly integrate renewable energies into the grid [16]. Here, a grid disturbance means tripping one or more elements of the grid energy system such as a generator, transmission line, or transformer, ultimately shutting down electricity access from the grid. As an example, in early 2021, Europe suffered a massive disruption on the grid, which caused concern in the energy-intensive industry in Germany [17,18]. The event occurred after a sudden drop in frequency (from 50 Hz to 0.25 Hz), which caused the European interconnected system to split in two. In some regions, sensitive machines automatically stopped working. In addition, the network operators in Italy and France had to disconnect some power plants in an effort to maintain grid stability [17]. While this event has not been linked to an increase in renewable energy, as generation from wind and solar units increases, incidents like this will become more frequent [18,19]. Experts who delivered the report on the incident mentioned that in terms of the transition to renewable energy, a more robust electrical system is required to guarantee a stable supply of power to citizens [18]. Events like this are not limited to Europe. In Australia, there have been problems with integrating renewable energies into the power grid. For example, in 2016, there was a massive blackout because of a wind energy disruption [19]. On the day of the event, Australia experienced an abnormally violent storm, which caused a decrease in the outage of a number of wind farms and the disconnection of several wind towers due to the high wind speed [19]. The increase in the generation of solar energy and its participation in the generation of electricity in the world and the United States is inevitable. With this massive increase in solar generation, it is expected that large amounts of intermittent electricity produced by renewable energies will create huge oscillations in the grid supply. Because of this, when planning the distribution of energy in the energy market, the changes in the supply and demand for energy and the different sources of energy used to meet the users’ needs must be considered. However, little is known about the rate (i.e., quantity of solar energy adoption) or tipping point where the greatest potential impact could occur and its implications for the grid, particularly the potential disruptions created by increased solar power generation at the utility level. The following sections will focus on three relevant areas: First, an explanation of the United States power grid. Second a review of grid disturbances. Finally, the last subsection is dedicated to integrating solar energy into the grid.

2.2. The United States Power Grid

The United States electrical system includes power plants, transmission and distribution lines, sub-stations, and end-users. The system uses a wide variety of energy sources to produce electricity, including coal, natural gas, nuclear power, and renewable energy sources. These components form a complex electrical power grid [20]. The US electricity grid is one of the most complex and technologically demanding systems due to its interconnectivity that requires long-distance power transmission. This long-distance energy transmission has the potential for associated disturbances in the network [21]. In the lower 48 states, the US power system comprises three primary interconnected systems, operating largely independently of each other with a limited interchange of energy between them [22]. The Eastern Interconnection ranges from the east coast to the Rocky Mountains. The Western Interconnection ranges from the Rocky Mountains to the west coast. The third interconnection covers most of the state of Texas, the largest state in the United States [23].
The power grid in the United States has several challenges that are anticipated to arise in the future: first, increase in user demand; second, infrastructure renewal; third, greater risk of a cyberattack; and fourth, greater frequency of grid interruptions [24]. In recent years, the electrical grid has become more fragile and vulnerable to interruptions [25]. Although the US has developed a capacity to protect electrical infrastructure from cyber-attacks, it has been impossible to eliminate risks due to its complexity. Distributed energy resources and more micro-resources are essential to decentralize the electricity grid and thus increase supply security and supply capacity during cyber-attacks [26], yet they can also be problematic when considering grid disturbances. Also, increased solar power generation increases the likelihood of grid disturbances at balancing authority levels in the US electrical systems [27]. Finally, the massive increase in renewable energy generation will also cause interruptions due to intermittent power generation. One of the biggest problems of the massive incorporation of photovoltaic energy is the disturbances that can be created in the grid.

2.3. Grid Disturbances

The variation in the quality of power in the grid due to the presence of disturbances in the voltage wave of the network is an issue that has increased its intensity due to the energy transition. In technical terms, to maintain a stable grid, the voltage waves must be pure sine waves with a constant frequency [28]. However, the grid is generally unstable since the voltage wave exhibits disturbances, such as noise in the differential, electrical impulses, fast or slow voltage variations, flickering, harmonic distortion, and frequency variations [29]. When a massive number of distributed energy sources are connected to the grid, the grid is subjected to various electrical loads, altering the voltage. This phenomenon increases with the intermittent and often unpredictable generation produced by renewable energy, such as solar or wind [30]. The increase in renewable energy can cause severe problems to the grid, such as power fluctuations; imbalances in the grid that can increase overcurrent, thereby affecting energy efficiency; and efficiency decreases in photovoltaic systems [31]. Although solar generation is currently the third most significant renewable energy source, only after hydro and wind, few countries have implemented technical standards or contingency plans to prevent and reduce disturbances in the grid. Yet, grid disturbances are increasingly becoming a problem due to the growth in solar plants around the world [32]. One of the biggest problems resulting from the addition of photovoltaic-generated electricity into electrical systems is the disturbances caused by voltage variations [33]. Mahela et al. analyzed the behavior in common coupling points of the voltage, the current, and the power and the relationship of these variables with the disturbances in the grid [34]. The authors found that the resistive–inductive load disconnection affects the current, the voltage, and the voltage in photovoltaic systems [34]. Purnamaputra and colleagues analyzed the total distortion of solar systems connected to the grid, considering the frequency of disturbances as the primary variable [35]. They found that the disturbances in the voltage are constant at frequencies of 10 kHz and 30 kHz [35]. Most studies have focused on technical aspects and solar plant disturbances on the local grid. Yet, there is a lack of literature that analyzes the integration of photovoltaic installations considering electrical systems or subsystems as a whole.

2.4. Solar Energy Integration

In recent years, the decarbonization of the electrical system in the United States has been promoted to lead a transition to a cleaner energy matrix and reduce polluting emissions [36]. In conjunction with decarbonization, it is necessary to expand renewable resources to meet the increased demand for electricity [37]. Also, renewable energy will significantly reduce carbon emissions and greenhouse gases [38]. There is a broad technical consensus that renewable energy resources need the support of multiple critical actors (generation, transmission, and distribution) in the electrical system to be effectively integrated into the grid [39]. A series of profound changes are necessary for the electrical network architecture, including energy distribution and storage [40]. In addition, it is considered that renewable energy technologies for the production of electricity, such as solar energy, wind energy, geothermal energy, and hydroelectric energy, among others, have great potential to satisfy the demand for electric energy when implemented on a large scale [41]. The integration of wind and solar energy has a negative marginal impact on the reliability of an electrical system at low levels of electricity generation [42]. As the penetration of renewables into the grid increases, the integration challenges will increase. Following an analysis, a mismatch between supply and demand was predicted due to the overproduction of energy at certain times of the day [43]. Solar energy would be a fundamental source when integrating renewable energies into the grid. The supreme competitiveness of solar energy is reflected in the long-term forecast high-penetration levels of solar energy above that of wind and hydro [44]. The increase in solar energy generation is not without its problems. By having greater penetration of solar energy in the grid, higher peaks of generation of gas plants will occur at sunset, which is when solar generation decreases [45]. In this way, the massive integration of solar energy will cause potential disturbances in the electrical system of the United States. Thus, it is necessary to study the potential impacts of the massive integration of solar generation in the US electrical grid.

3. Methods

3.1. Study Design

This study includes a comparison of four regions of the United States electrical system (California, Southwest, New England, and New York) before and after the massive incorporation to the transmission line of utility-scale solar energy loaded to the balancing authority high voltage transmission lines (not utility-scale solar powering low voltage local distribution). Data from the Energy Information Administration (EIA) and the National Renewable Energy Laboratory (NREL) were used for the comparative analysis. The EIA data include hourly data from energy generation by source and energy demand; the NREL data include hourly generation from hypothetical solar plants. Statistical analysis was performed to compare the mean at different levels of solar energy penetration. Table 1 shows the list of the 13 regions in which the EIA data were divided and their respective codes; additionally, the percentage of solar generation of each region is shown. Four representative regions were selected for this study, the two regions with the highest utility level solar generation (California and Southwest) and the two regions with low solar generation utility levels (New England and New York). Statistical analysis compared net generation, the difference between net generation and demand, and the power peaks before and after incorporating hypothetical solar plants in the four analyzed regions.

3.2. Data Collection

The EIA is the Department of Energy’s statistical and analytical agency in the United States. The EIA provides centralized and complete hourly information on the high voltage electrical power grid in 48 of the contiguous United States (Hawaii and Alaska are excluded). The data (EIA-930) are compiled by the electricity balance authorities and include forecast demand, actual demand, net generation, net interchange, and net generation from the following: coal, natural gas, nuclear energy, all petroleum derivatives, hydroelectric, solar, wind, and other energy sources [3].
For this study, hourly data from actual demand, net generation, and net generation from the following were used between 1 January 2019, and 31 December 2019 [3,46]: coal, natural gas, nuclear, hydropower, solar, wind, and other energy sources. For this study, four regions of the United States electrical system were used: (1) California, (2) New England, (3) New York, and (4) Southwest. These regions were considered to have a broad spectrum of solar generation percentages. According to the EIA data [3], California is the region that generates the most solar energy (16.2%), and New York does not have solar utility generation. Southwest and New England have 3.2% and 0.2% of solar generation between the two extremes.
NREL has decades of leadership focused on clean energy research, development, and implementation. The expertise of NREL is essential for the transition to clean energy [47]. NREL has a hypothetical photovoltaic solar plant database for renewable energy integration studies [48]. The database consists of 1 year (2006) of solar energy generation every 5 min and daily hourly forecasts of about 6000 hypothetical PV plants. For the purpose of this study, the data were aligned by hour. Solar power plant locations were determined based on the capacity expansion plan for renewable energy. The database has three data types: real power output, day-ahead forecast, and 4 h-ahead forecast. For this study, the real data power output and the day-ahead forecast were considered. The number of hypothetical solar plants considered for each analyzed region in the study is shown in Table 2.

3.3. Data Analysis

The EIA-930 data were used as input of a new hourly energy balance (see Equation (1)) [3,46]. For this new energy balance, the new solar energy plants had preference over the existing plants that use fossil fuels to cover the real total net generation. According to the EIA, each fossil fuel produces a different amount of carbon emissions. In decreasing order, the fuels that produce the most carbon dioxide are coal, diesel, gasoline, propane, and natural gas [49]. The selection criteria to replace the fossil fuels with the new solar generation were based on the amount of carbon emissions generated by each fuel. Coal plants are the first to be replaced, followed by petroleum products and natural gas plants. After fossil fuels, nuclear energy was considered along with hydropower and other sources. Solar energy was not selected to replace wind energy. Additionally, different levels of presentation of solar energy, 100%, 75%, 50%, and 25%, were considered when performing the analysis. Data analysis in this study was carried out using the statistical software RStudio Desktop version 1.3.1093 (open-source edition, RStudio, Boston, MA, USA).
Equation (1) represents the energy balance according to the EIA-930 data [3,46].
N G = C O L + N G A + N U C + P E T + W A T + S U N + W N D + O T H
where
  • NG = Net generation
  • COL = Net generation from Coal in MWh
  • NGA = Net generation from Natural Gas in MWh
  • NUC = Net generation from Nuclear Energy in MWh
  • PET = Net generation from Petroleum products in MWh
  • WAT = Net generation from Hydro in MWh
  • SUN = Net generation from Solar Energy in MWh
  • WND = Net generation from Wind in MWh
  • OTH = Net generation from others energy sources in MWh.
Equation (2) describes net generation, including the forecast solar generation of the hypothetical solar plants minus the difference (delta) in generation from the other sources. The delta in coal generation ( Δ C O L F H ), natural gas generation ( Δ N G A F H ), petroleum generation ( Δ P E T F H ), nuclear generation ( Δ N U C F H ), other energy sources ( Δ O T H F H ), and hydro ( Δ W A T F H ) are functions of the forecast generation of the hypothetical solar power plants (note that the FH subscript represents forecast hypothetical). The percentage decrease in coal and natural gas, petroleum, nuclear, and other energy sources is offset by the same percentage increase in solar energy.
N G ( S U N F H ) = Δ C O L F H + Δ N G A F H + Δ N U C F H + Δ P E T F H + Δ W A T F H + S U N + W N D + Δ O T H F H + S U N F H
where S U N F H = F o r e c a s t   n e t   g e n e r a t i o n   f r o m   h y p o t h e t i c a l   s o l a r   p l a n t s   i n   MWh .
The following net-generation balance Equation (3) is a function of the forecast generation of the hypothetical solar plants and the actual generation. The forecast generation of hypothetical solar plants ( S U N F H ) is replaced by the actual generation of the hypothetical solar plants ( S U N H ).
N G ( S U N F H ,   S U N H   ) = Δ C O L F H + Δ N G A F H + Δ N U C + Δ P E T + Δ W A T + S U N + W N D + Δ O T H + S U N H
After establishing the new energy balances Equations (1)–(3), statistical t-tests of two samples means, assuming equal variances, were carried out. The two-sample t-test is a method used to test whether the unknown population means of two groups are equal or not.
The hypotheses tested were the following:
Hypothesis 1.
H 0 : μ N G μ F H , H = 0 H 1 : μ F H μ F H , H 0
where μ N G = m e a n   o f   N G ; μ F H , H = m e a n   o f   N G ( S U N F H ,   S U N H ) .
The null hypothesis is that the mean of the net generation according to the EIA-930 data (denoted by μ N G ) is the same as the mean of the net forecast generation of the hypothetical solar plant and the current generation (represented by μ F H , H ) ,   and   the   alternative is that they are not equal.
Hypothesis 2.
H 0 : μ N G D μ ( F H , H ) D = 0 H 1 : μ F H D μ ( F H , H ) D 0
where μ N G D = m e a n   o f   ( N G D e m a n d ) ; μ ( F H , H ) D = m e a n   o f   ( N G ( S U N F H ,   S U N H   ) D e m a n d ) .
Hypothesis 3.
H 0 : μ | N G D | μ | ( F H , H ) D | = 0 H 1 : μ | N G D | μ | ( F H , H ) D | > 0
where μ | N G D | = m e a n   o f   ( N G D e m a n d )   i n   a b s o l u t e   v a l u e ; μ | ( F H , H ) D | = m e a n   o f   ( N G ( S U N F H ,   S U N H   ) D e m a n d )   i n   a b s o l u t e   v a l u e .
Hypotheses 1–3 were tested using one year-long hourly data.
Hypothesis 4.
H 0 : μ P e a k ,   N G μ P e a k , F H , H = 0 H 1 : μ P e a k ,   N G μ P e a k , F H , H > 0
where μ P e a k , N G = m e a n   o f   d a i l y   p e a k   o f   e n e r g y   f r o m   N G ; μ P e a k , F H , H = m e a n   o f   d a i l y   p e a k   o f   e n e r g y   f r o m   N G ( S U N F H ,   S U N H   ) .
Hypothesis 5.
H 0 : μ P e a k ,   N G D μ P e a k , ( F H , H ) D = 0 H 1 : μ P e a k ,   N G D μ P e a k , ( F H , H ) D > 0
where μ P e a k , N G D = m e a n   o f   d a i l y   p e a k   o f   e n e r g y   f r o m ( N G D e m a n d ) ; μ P e a k , ( F H , H D ) = m e a n   o f   d a i l y   p e a k   o f   e n e r g y   f r o m   ( N G ( S U N F H ,   S U N H   ) D e m a n d ) .
Hypotheses 4 and 5 were tested using a one-year horizon with daily data.

4. Results

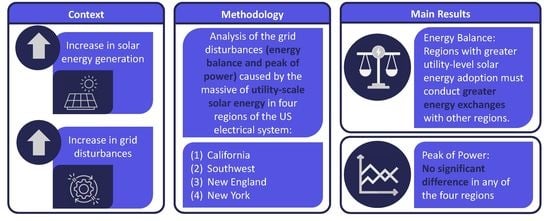
4.1. Results at Different Levels of Solar Energy Penetration

Table 3 shows the before and after of adding hypothetical solar plants, considering a solar energy penetration of 100%. In 
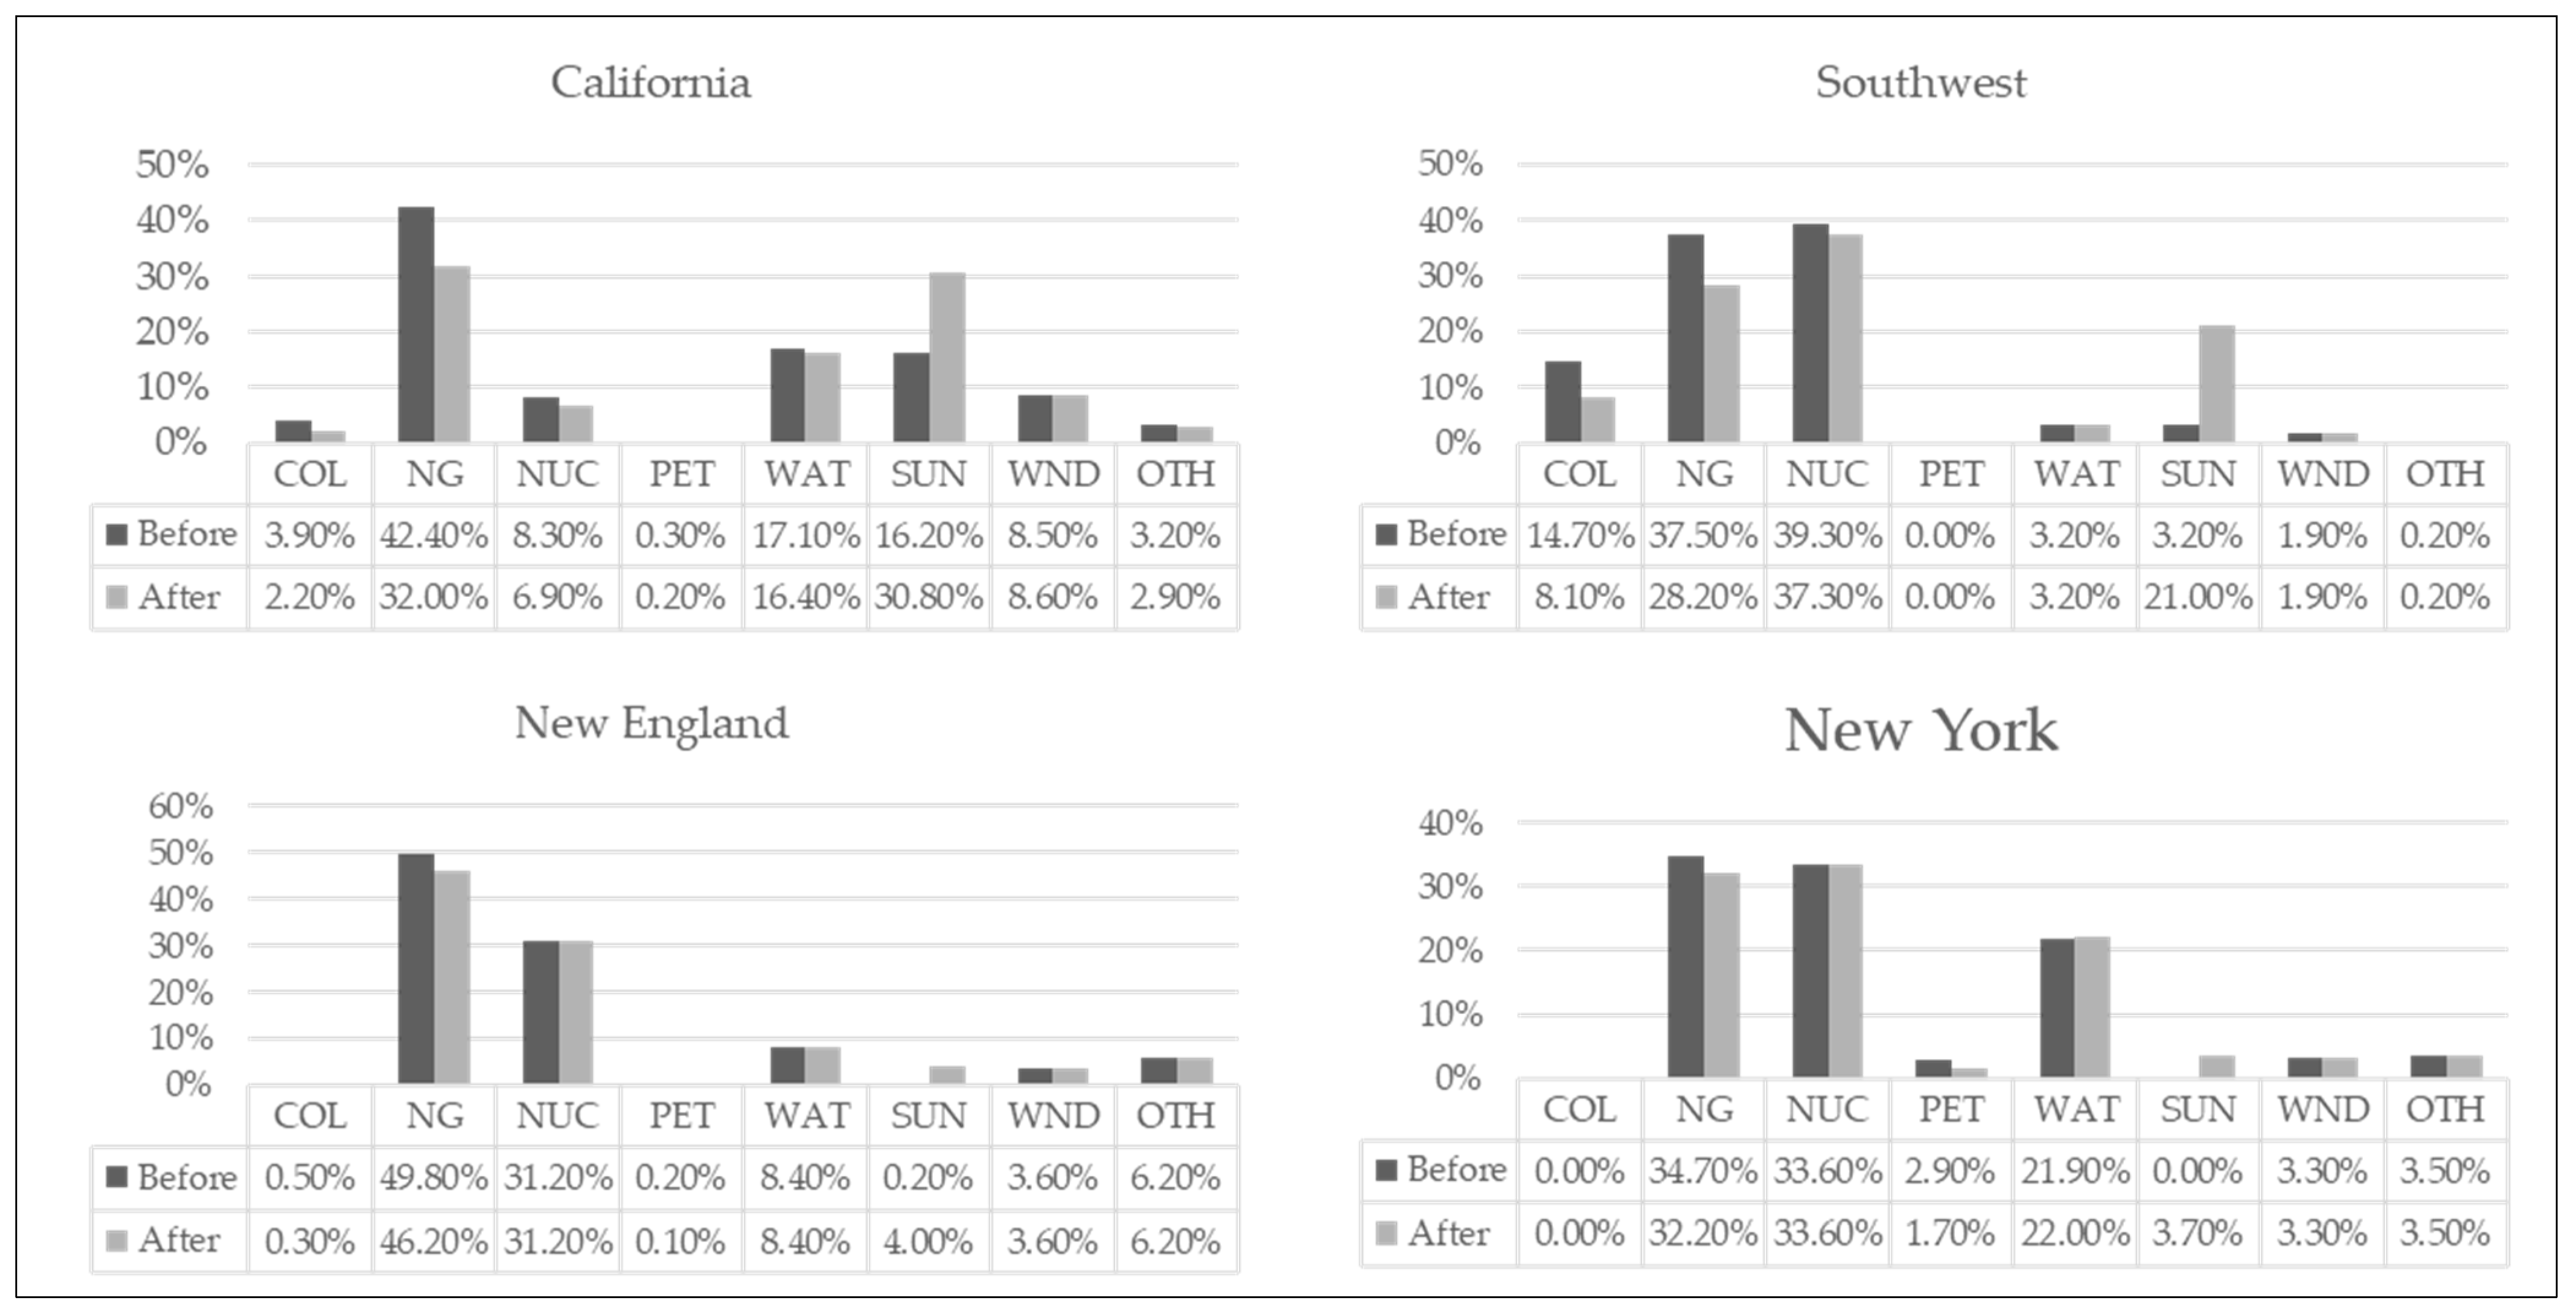
Table 3, it is observed that the California region generates the highest percentage of solar energy with 16.2%, followed by the Southwest region with 3.4%. On the other hand, New England only generates 0.2% of solar energy, and the New York region does not have solar generation. This reflects the different levels of solar generation considered in the study. Also, Table 3 shows that the primary energy source in California, New England, and New York is natural gas, with 42.4%, 49.8%, and 34.7%, respectively. In the Southwest region, the main energy-generation resources are nuclear (39.3%) and natural gas (37.5%). The generation from coal and petroleum products, the largest carbon emitters, are less than 4% in California, less than 1% in New England, and less than 3% in New York. However, in the Southwest, the generation from coal reaches almost 15%, being the third most used source, and the generation from petroleum products is zero. This demonstrates that each region has a different energy matrix, with various levels of fossil fuel use.
Table 3 also shows the results with 100% hypothetical penetration of solar energy. Solar generation almost doubled from 16.2% to more than 30% in the California region. With this increase, solar generation becomes the second source of energy. In the case of New England, where solar generation was only 0.2%, it increased to 4%. This implies that the increase in solar generation helped reduce the consumption of fossil fuels in the New England area. The New York region had no solar generation. However, after the incorporation of 100% of the hypothetical solar plants, it reached a solar generation of 3.7%. The second area with the highest solar generation, the Southwest region, increased from 3.2% to 21%. This implies that Southwest has tremendous potential for solar generation (Arizona, New Mexico, and Southern Nevada).
Table 4 shows the solar generation in each region, and by source, with a penetration of 75%. Even with a 75% penetration of solar energy in the California area, solar energy is the second most used source. Solar energy remains the third most widely used source in the Southwest region. It is essential to mention that even with a 75% penetration, it is still possible to reduce use of fossil fuels significantly. For example, the use of coal in the Southwest decreased from 14.7% to 8.3%. In New England, coal and oil products were cut by almost half. Solar generation becomes the third renewable energy source in the New York region, below hydropower and wind. This implies that even with a 75% penetration of solar energy, a significant reduction in the use of fossil fuels can be achieved in the analyzed regions.
Table 5 shows the results in the energy balances before and after the incorporation of hypothetical solar plants, with a 50% penetration of solar energy. While in California and the Southwest solar power generation remains the leading renewable source, in the New England and New York regions, it is the third-largest renewable source behind hydro and wind power. With 50% solar energy penetration, the New England and New York regions only have 2.1% and 1.8% solar generation, respectively. In the Southwest region, there is still a significant decrease in the generation of coal, from 14.7% to 8.7%. This implies that by reducing the penetration of solar generation to 50%, the impacts on the grid are less significant, particularly in New York and New England.
Table 6 shows the generation by region and source considering a 25% penetration of integration of photovoltaic generation plants. Solar generation in the California area reaches 19.9%, more than 10% less when compared with 100% penetration of solar energy. After hypothetical solar plant integration, solar generation in the New England and New York regions is about 1% higher than baseline. In the Southwest region, solar generation remains the main source of renewable energy, being 7.7% higher than hydropower (3.2%), and wind (1.9%). This implies that the reduction in fossil fuel use is noticeably less than the other scenarios (higher percentage of solar power generation), particularly in New York and New England, which have the smallest percentage increases in solar power generation.

4.2. Results of t-Test for Each Hypothesis

Table 7 shows the results of the equal means t-tests when comparing net generation before and after incorporating the solar plants. Table 7 details the results of Hypothesis 1 by region and solar energy penetration level. Only one p-value in the Southwest region with 100% solar energy penetration is significant (p < 0.05). The rest of the p-values are not significant (using p < 0.05), which means that the null hypothesis is not rejected and that there is no evidence to establish that the means are different. The Southwest region had the most significant increase in solar power generation, from 3.2% to 21.0%. The substantial increase in solar generation resulted in a difference in means when considering 100% penetration of solar energy. However, when reducing the percentage of solar energy penetration, there is not enough evidence to reject the null hypothesis that the means are equal. On the other hand, it is observed that in the four regions, California, New England, New York, and Southwest, as the penetration of solar energy decreases, the p-value of the statistical test increases. This implies that the equality of the means fails to be rejected as the percentage of the solar penetration decreases. Another important insight from the table is that of the regions analyzed, California produces the most energy on average, followed by Southwest, New York, and New England.
Table 8 shows the results of Hypothesis 2 by region and level of solar penetration. This part of the analysis shows that when comparing the difference between net generation and demand before and after incorporating the hypothetical solar plants, there is evidence to reject the null hypothesis in the California and Southwest regions. Particularly in the California area, when considering 100% and 75% solar energy penetration, the p-value is less than 0.05, so there is evidence to establish a significant difference between the means (net generation—demand) when comparing before and after incorporating the hypothetical solar plants. In the Southwest area, when solar penetration levels of 100%, 75%, and 50% are considered, there is evidence to reject the null hypothesis (p < 0.05). This implies that the means of the difference between net generation and demand before and after incorporating solar plants are different. On the other hand, in the New England and New York regions, at all levels of solar energy penetration, none of the p-values is significant (p < 0.05), which means that the null hypothesis is not rejected and that there is no evidence to establish that there is a difference between the means (difference between net generation and demand).
Table 9 shows the results when comparing the absolute error of the difference between net generation and demand before and after incorporating the solar plants into the system. The p-values of the analyses carried out to test Hypothesis 3 of the study indicate a significant difference (using p < 0.05) between the means in the California and Southwest regions. In the California region, for penetration levels of 100% and 75%, a p-value of less than 0.05 was found. This means that the absolute value of the difference between net generation and demand is different when comparing before and after the massive integration of solar plants. In the case of the Southwest area, a significant difference was found in the means (p < 0.05) for penetration levels of 100%, 75%, and 50% of solar energy. In the New England and New York regions, the p-values are greater than 0.05, so the null hypothesis cannot be rejected. This implies that based on the given data, there is no strong evidence to suggest that the absolute value of the difference between the net generation and demand is not different.
Additionally, it is observed that the p-values in each of the regions increase with increasing levels of solar energy penetration. This means that the massive integration of solar energy impacts the absolute value of the difference between net generation and demand. In other words, solar energy affects the energy interexchange between balancing authorities in absolute value.
Table 10 shows the results associated with Hypothesis 4 by region and level of solar energy penetration. Hypothesis 4 analyzes the peak energy, considering net generation as a variable before and after integrating solar plants into the system. As a result, it is recognized that the daily peak of energy does not have a statistically significant difference (at p < 0.05) when analyzing the net generation. However, it can be observed in the table that as the penetration of solar energy decreases, the p-value increases. This implies that the greater the penetration of solar energy, the greater the probability of increasing the power peaks in the balancing authorities.
Finally, Table 11 shows the results when the energy peaks of the difference between net generation and demand are analyzed before and after the integration of solar plants. As a result, the null hypothesis is not rejected in the four analyzed regions, California, New England, New York, and Southwest. This means that the difference between net generation and demand before and after the massive integration of solar plants is not different. These results are explained due to the high mean value in the baseline of the difference between net generation and demand (the exchange of energy between balancing authorities). From Table 8, it can be seen that, for example, in California, there are exchanges of almost 8000 MW, in New England and New York of more than 2500 MW, and in Southwest of nearly 6000 MW on average. This implies, as the difference between net generation and demand is significantly high, the impact of solar energy generation is much smaller.

5. Discussion

This study aimed to analyze how the penetration of solar energy utility levels affects energy imbalances and the peak of power in the grid. Subsequently, in response to the research objective, the study shows the following main results. The difference between before and after (the massive integration of solar power plants) is not statistically significant (p < 0.05) in most of the regions analyzed when including net generation as a variable (see Table 7). The exception is the Southwest, as it had a considerable increase in solar power generation (3.2% to 21.0%). In the case of the New England and New York regions, it may be that the percentage of solar power generation is too low, 4.0% and 3.7%, respectively, to generate a significant impact on the imbalance of the systems. On the other hand, the California area, in the baseline, already had a high percentage of solar energy generation (16.2%), which increased almost the double (30.8%). For this reason, the impact when analyzing the net generation before and after the massive integration of solar plants was not significant in the California region (see Table 7). For massive integration of renewable energies in the grid, it is necessary to maintain a balance [50].
Unlike this study, a study conducted in Texas found significant differences in energy balances and peak power after the massive integration of solar plants [51]. Although this study did not find a significant impact on the energy balance in most regions, one of the solutions suggested to improve the balance in the grid was the implementation of storage systems [50]. The difference between net generation and demand is analyzed as a variable, the total amount of energy that each region must exchange with other balancing authorities. The results show that the difference when analyzing the hourly data is significant between before and after the integration of the hypothetical solar plants in the system in the regions with the highest generation of solar energy, California and Southwest. This implies an imbalance in energy exchanges with other balance authorities due to incorporating more solar generation into the systems. Having to carry out more significant energy exchanges with other external systems could cause disturbances due to voltage and frequency differences. Like this study, NREL studies have shown that cooperation between balancing areas is essential when significantly increasing renewable energy generation [52,53]. Studies have shown that by having greater solar energy penetration, more significant power fluctuations in the network are produced due to the changes in solar irradiance, which impacts the energy balance and energy peaks [54].
Additionally, when analyzing different penetration levels, it is observed that the probability of generating disturbances in the system increases when solar generation increases. However, this depends on the percentage of solar generation of the system. For instance, in the case of New England and New York, it is not significant (the portion in both regions is 4% or less). Also, when analyzing the absolute error of the difference between net generation and demand, the results support an increase in the absolute exchanges of energy with other interconnected systems in the California and Southwest regions. This difference decreases as the level of penetration of solar energy decreases. It has been found that power peaks are generated on the grid, which are produced by large solar systems [55]. However, studies have shown that peaks of power can be minimized by incorporating a large number of small solar plants instead of a few large solar plants [55]. In contrast, regarding the daily peak of energy in the net generation, no significant difference was found (at p < 0.05, see Table 10) in any of the four regions analyzed. Particularly, in the New England and New York regions, the lack of difference in power peaks is due to the low percentage of solar generation (4% or less). In the cases of California and Southwest, although solar generation is much higher (30.8% and 21.0%, respectively), it is still not enough to generate an impact on energy peaks. The highest energy peaks can be produced at midday, which is when a greater amount of electrical energy is generated from solar systems [33]. For this reason, future studies would benefit from an hourly peak-energy analysis. In addition to being physically adjacent systems connected to the same substation, energy imbalances increase [33]. An analysis at the substation level could generate different results on the peak of energy in the grid.
In previous studies, it was found that substituting traditional electricity generation by photovoltaic systems impacts the stability of the electrical network about energy peaks [56]. In this study, fossil fuels plants were substituted by solar generation. However, no significant impact was found in the energy peaks when the peaks of energy in the difference between net generation and demand were analyzed, that is, the exchange of energy with other areas. It was found that power peaks did not increase with the massive incorporation of solar plants into the systems. The four regions analyzed have a high dependence on energy interchanges with the other areas of the United States electrical system. As interchanges occur hourly, which in some cases may exceed 30% of the energy demanded or produced in the area, it would be necessary for the generation of solar energy to be one of the main sources of generation to create an impact on the energy peaks. Finally, like all studies, this study has limitations. Only four regions were analyzed, and not all the interconnected systems in the United States. Hypothetical data from solar plants were used, which may differ from reality. Furthermore, only four levels of solar energy penetration were considered.

6. Conclusions

6.1. Summary

This study provides findings from a comparative analysis considering the massive integration of solar power plants in four regions of the United States electrical system: (1) California, (2) Southwest, (3) New England, and (4) New York. The analysis in the network was carried out per hour, considering the changes in net generation, the net generation error with demand, and the energy power peaks. Figure 1 summarizes the percentages of generation by energy resource before and after the massive incorporation of photovoltaic plants (100% penetration). These plots show that having 100% penetration of solar generation impacts the reduction of the use of fossil fuels. The greatest changes between before and after were found in the region of California and Southwest, as seen in Figure 1, are those that generate the greatest amount of solar energy.
The study sought to verify that there are more significant energy imbalances and higher peak power in the grid at a higher level of solar energy penetration. The findings show that when comparing the difference between net generation and demand before and after the massive integration of solar plants, there is a significant difference in the energy balance in the regions with the highest solar generation, namely California and the Southwest. Additionally, by increasing the penetration levels of solar energy, the results are intensified. On the other hand, no significant difference was found in any of the analyzed regions in relation to the energy peaks. However, the p-value of the statistical analysis decreases with increasing penetration levels of solar energy in each area. This indicates that when considering a higher penetration of solar energy, there is a greater probability that the energy peak will increase.

6.2. Practical Implications

The practical implications of this study are of vital importance for increasing solar energy adoption in different regions of the United States electrical system. It is essential to bear in mind that as the installed solar generation capacity increases, the potential energy imbalances that can be created in the electrical network also increase. By having a greater penetration of solar energy, the probability of generating disturbances in the grid will increase. There are several solutions to this problem. First, problems could be overcome by improving solar grid protection plants. By improving protection systems in solar plants and including them as a requirement for future solar plants installations, disturbances in the grid could be reduced. Second, energy storage systems can significantly help grid disturbances. With the development of new storage technologies, costs should decrease and make their deployment feasible on a large scale in the electrical system. A third solution is to improve and standardize the solar forecasting technologies in each of the balancing authorities in the US electrical system. By increasing the precision of solar generation and demand forecasting, the probability of events expected in the electrical grid will decrease. Fourth, the problem could be overcome with the future implementation of peer-to-peer energy trading at the utility level. However, there are still no regulations and security levels necessary for the massive implementation of P2P models.

6.3. Future Research

Future studies should be carried out in different regions and with different statistical approaches. First, different time horizons may be included. The current study analyzes data hourly; nevertheless, future studies should be extrapolated to an analysis every 10 or 30 minutes. In this way, the energy fluctuations that could cause more significant energy peaks can be detected. Second, future research can include more levels of solar energy penetration and, in this way, achieve a more detailed sensitivity analysis. In addition, studies can be extended to other regions of the United States and other countries to compare and contrast the reality under different conditions of generation and consumption of energy. Fourth, there are several ways to reduce the impacts caused by the massive integration of solar energy. For example, it would be beneficial to incorporate technologies that reduce the adverse impacts on the electrical grid due to solar energy integration. Integrating energy storage in conjunction with solar plants would be an interesting scenario to assess the real impact of energy storage systems in reducing grid disturbances.

Author Contributions

Conceptualization, E.A.S.; methodology, E.A.S.; software, E.A.S.; validation, E.A.S.; formal analysis, E.A.S.; investigation, E.A.S.; resources, E.A.S.; data curation, E.A.S.; writing—original draft preparation, E.A.S.; writing—review and editing, L.B.B., E.W., W.D.L.-S.; visualization, E.A.S.; supervision, L.B.B.; project administration, L.B.B.; funding acquisition, E.A.S. All authors have read and agreed to the published version of the manuscript.

Funding

This work was funded by the National Agency for Research and Development (ANID)/Scholarship Program/DOCTORADO FULBRIGHT BIO/2015-56150019.

Conflicts of Interest

The authors declare no conflict of interest.

Abbreviations

CALCalifornia
SWSouthwest
NENew England
NYNew York
NGNet generation
FHForecast hypothetical
COLNet generation from coal
NGANet generation from natural gas
NUCNet generation from nuclear
PETNet generation from petroleum products
WATNet generation from hydro
SUNNet generation from solar energy
WNDNet generation from wind
OTHNet generation from other energy sources

References

  1. Jäger-Waldau, A. Snapshot of photovoltaics—February 2020. Energies 2020, 13, 930. [Google Scholar] [CrossRef] [Green Version]
  2. IRENA. Future of Solar Photovoltaic—Deployment, Investment, Technology, Grid Integration and Socio-Economic Aspects (A Global Energy Transformation Paper); International Renewable Energy Agency: Abu Dhabi, United Arab Emirates, 2019. [Google Scholar]
  3. EIA. About the EIA-930 Data. Available online: https://www.eia.gov/beta/electricity/gridmonitor/about (accessed on 20 January 2020).
  4. Nwaigwe, K.; Mutabilwa, P.; Dintwa, E. An overview of solar power (PV systems) integration into electricity grids. Mater. Sci. Energy Technol. 2019, 2, 629–633. [Google Scholar] [CrossRef]
  5. Wenham, S.R.; Green, M.A.; Watt, M.E.; Corkish, R.; Sproul, A. Applied Photovoltaics; Routledge: London, UK, 2013. [Google Scholar]
  6. Jafari, M.; Olowu, T.O.; Sarwat, A.I.; Rahman, M.A. Study of smart grid protection challenges with high photovoltaic penetration. In Proceedings of the 2019 North American Power Symposium (NAPS), Wichita, KS, USA, 13–15 October 2019; pp. 1–6. [Google Scholar]
  7. Li, B.; Zhang, J. A review on the integration of probabilistic solar forecasting in power systems. Sol. Energy 2020, 210, 68–86. [Google Scholar] [CrossRef]
  8. Thakur, J.; Chakraborty, B. Smart net metering models for smart grid in India. In Proceedings of the 2015 International Conference on Renewable Energy Research and Applications (ICRERA), Palermo, Italy, 22–25 November 2015; pp. 333–338. [Google Scholar]
  9. Bedi, H.S.; Singh, N.; Singh, M. A technical review on solar-net metering. In Proceedings of the 2016 7th India International Conference on Power Electronics (IICPE), Patiala, India, 17–19 November 2016; pp. 1–5. [Google Scholar]
  10. REN21. Renewables 2020 Global Status Report; REN21 Secretariat: Paris, France, 2020. [Google Scholar]
  11. Soto, E.A.; Bosman, L.B.; Wollega, E.; Leon-Salas, W.D. Peer-to-peer energy trading: A review of the literature. Appl. Energy 2020, 283, 116268. [Google Scholar] [CrossRef]
  12. Zhang, C.; Wu, J.; Zhou, Y.; Cheng, M.; Long, C. Peer-to-Peer energy trading in a Microgrid. Appl. Energy 2018, 220, 1–12. [Google Scholar] [CrossRef]
  13. Zhang, C.; Wu, J.; Long, C.; Cheng, M. Review of existing peer-to-peer energy trading projects. Energy Procedia 2017, 105, 2563–2568. [Google Scholar] [CrossRef]
  14. Park, C.; Yong, T. Comparative review and discussion on P2P electricity trading. Energy Procedia 2017, 128, 3–9. [Google Scholar] [CrossRef]
  15. Ali, M.A.S. LMI-Based State Feedback Control Structure for Resolving Grid Connectivity Issues in DFIG-Based WT Systems. Eng 2021, 2, 562–591. [Google Scholar] [CrossRef]
  16. Nikolaidis, P.; Poullikkas, A. Evolutionary Priority-Based Dynamic Programming for the Adaptive Integration of Intermittent Distributed Energy Resources in Low-Inertia Power Systems. Eng 2021, 2, 643–660. [Google Scholar] [CrossRef]
  17. Appunn, K. European Power Grid Disturbance Has German Energy Intensive Industry Worried. Available online: https://www.cleanenergywire.org/news/european-power-grid-disturbance-has-german-energy-industry-worried (accessed on 20 September 2021).
  18. ICS Investigation Expert Panel. Continental Europe Synchronous Area Separation on 08 January 2021—Final Report; The Expert Panel on the Separation of the Continental Europe Synchronous Area of 08 January 2021, 2021. [Google Scholar]
  19. Starn, J.; Parkin, B.; Vilcu, I. The Day Europe’s Power Grid Came Close to a Massive Blackout. Available online: https://www.bloomberg.com/news/articles/2021-01-27/green-shift-brings-blackout-risk-to-world-s-biggest-power-grid (accessed on 3 January 2022).
  20. EPA. About the U.S. Electricity System and Its Impact on the Environment. Available online: https://www.epa.gov/energy/about-us-electricity-system-and-its-impact-environment#about (accessed on 12 December 2021).
  21. Kinney, R.; Crucitti, P.; Albert, R.; Latora, V. Modeling cascading failures in the North American power grid. Eur. Phys. J. B-Condens. Matter Complex Syst. 2005, 46, 101–107. [Google Scholar] [CrossRef]
  22. EIA. U.S. Electric System Is Made Up of Interconnections and Balancing Authorities. Available online: https://www.eia.gov/todayinenergy/detail.php?id=27152 (accessed on 12 December 2021).
  23. EIA. Electricity Explained—How Electricity Is Delivered to Consumers. Available online: https://www.eia.gov/energyexplained/electricity/delivery-to-consumers.php (accessed on 13 December 2021).
  24. Barrett, J.M. Challenges and Requirements for Tomorrow’s Electrical Power Grid; Lexington Institute: Arlington, VA, USA, 2016. [Google Scholar]
  25. D’Agostino, D.M. Defense Critical Infrastructure: Actions Needed to Improve the Consistency, Reliability, and Usefulness of DoD’s Tier 1 Task Critical Asset List; United States Government Accountability Office: Washington, DC, USA, 2010.
  26. Sullivan, J.E.; Kamensky, D. How cyber-attacks in Ukraine show the vulnerability of the US power grid. Electr. J. 2017, 30, 30–35. [Google Scholar]
  27. Soto, E.A.; Bosman, L.B.; Wollega, E. Quantification of Solar Energy Grid Disturbances in the United States. In Proceedings of the 2021 IEEE Green Technologies Conference (GreenTech), Denver, CO, USA, 7–9 April 2021; pp. 13–18. [Google Scholar]
  28. Liu, L.; Chai, J.; Qi, H.; Liu, Y. Power grid disturbance analysis using frequency information at the distribution level. In Proceedings of the 2014 IEEE International Conference on Smart Grid Communications (SmartGridComm), Venice, Italy, 3–6 November 2014; pp. 523–528. [Google Scholar]
  29. Mariani, E.; Murthy, S.S. Control of Modern Integrated Power Systems; Springer Science & Business Media: Berlin/Heidelberg, Germany, 2012. [Google Scholar]
  30. Santofimia, M.J.; del Toro, X.; Roncero-Sánchez, P.; Moya, F.; Martinez, M.A.; Lopez, J.C. A qualitative agent-based approach to power quality monitoring and diagnosis. Integr. Comput. -Aided Eng. 2010, 17, 305–319. [Google Scholar] [CrossRef]
  31. Al-Shetwi, A.Q.; Hannan, M.; Jern, K.P.; Mansur, M.; Mahlia, T. Grid-connected renewable energy sources: Review of the recent integration requirements and control methods. J. Clean. Prod. 2020, 253, 119831. [Google Scholar] [CrossRef]
  32. Moreno-Munoz, A. Large Scale Grid Integration of Renewable Energy Sources; Institution of Engineering & Technology: London, UK, 2017. [Google Scholar]
  33. Steffel, S.; Caroselli, P.; Dinkel, A.; Liu, J.; Sackey, R.; Vadhar, N. Integrating solar generation on the electric distribution grid. IEEE Trans. Smart Grid 2012, 3, 878–886. [Google Scholar] [CrossRef]
  34. Mahela, O.P.; Ola, S.R. Impact of grid disturbances on the output of grid connected solar photovoltaic system. In Proceedings of the 2016 IEEE Students’ Conference on Electrical, Electronics and Computer Science (SCEECS), Bhopal, India, 5–6 March 2016; pp. 1–6. [Google Scholar]
  35. Purnamaputra, R.; Sudiarto, B. Disturbance Frequency 9–150 kHz Characteristics towards Total Demand Distortion on On-Grid Solar Panel System in the Electrical System of Kuningan Gas Station. In Proceedings of the IOP Conference Series: Earth and Environmental Science, Pangkal Pinang, Indonesia, 3–4 September 2019; p. 012011. [Google Scholar]
  36. Thompson, D.J.; Schoonenberg, W.C.; Farid, A.M. A Hetero-Functional Graph Resilience Analysis of the Future American Electric Power System. IEEE Access 2021, 9, 68837–68848. [Google Scholar] [CrossRef]
  37. Van der Wardt, T.J.; Farid, A.M. A hybrid dynamic system assessment methodology for multi-modal transportation-electrification. Energies 2017, 10, 653. [Google Scholar] [CrossRef] [Green Version]
  38. Doblinger, C.; Soppe, B. Change-actors in the US electric energy system: The role of environmental groups in utility adoption and diffusion of wind power. Energy Policy 2013, 61, 274–284. [Google Scholar] [CrossRef]
  39. Bloom, A.; Townsend, A.; Palchak, D.; Novacheck, J.; King, J.; Barrows, C.; Ibanez, E.; O’Connell, M.; Jordan, G.; Roberts, B. Eastern Renewable Generation Integration Study; National Renewable Energy Laboratory (NREL): Golden, CO, USA, 2016.
  40. Lannoye, E.; Flynn, D.; O’Malley, M. Evaluation of power system flexibility. IEEE Trans. Power Syst. 2012, 27, 922–931. [Google Scholar] [CrossRef]
  41. Neuhoff, K. Large-scale deployment of renewables for electricity generation. Oxf. Rev. Econ. Policy 2005, 21, 88–110. [Google Scholar] [CrossRef] [Green Version]
  42. Steele, A.J.H.; Burnett, J.W.; Bergstrom, J.C. The impact of variable renewable energy resources on power system reliability. Energy Policy 2021, 151, 111947. [Google Scholar] [CrossRef]
  43. Schaber, K.; Steinke, F.; Mühlich, P.; Hamacher, T. Parametric study of variable renewable energy integration in Europe: Advantages and costs of transmission grid extensions. Energy Policy 2012, 42, 498–508. [Google Scholar] [CrossRef] [Green Version]
  44. Ozoegwu, C.; Mgbemene, C.; Ozor, P.A. The status of solar energy integration and policy in Nigeria. Renew. Sustain. Energy Rev. 2017, 70, 457–471. [Google Scholar] [CrossRef]
  45. Badakhshan, S.; Hajibandeh, N.; Shafie-khah, M.; Catalão, J.P. Impact of solar energy on the integrated operation of electricity-gas grids. Energy 2019, 183, 844–853. [Google Scholar] [CrossRef]
  46. EIA. EIA-930 Data Users Guide and Known Issues; U.S. Energy Information Administration: Washington, DC, USA, 2018.
  47. Flores-Espino, F.; Tian, T.; Chernyakhovskiy, I.; Chernyakhovskiy, I.; Miller, M. Competitive Electricity Market Regulation in the United States: A Primer; National Renewable Energy Laboratory (NREL): Golden, CO, USA, 2016.
  48. NREL. Solar Power Data for Integration Studies. Available online: https://www.nrel.gov/grid/solar-power-data.html (accessed on 30 March 2021).
  49. EIA. Carbon Dioxide Emissions Coefficients. Available online: https://www.eia.gov/environment/emissions/co2_vol_mass.php (accessed on 16 September 2021).
  50. Etxeberria, A.; Vechiu, I.; Camblong, H.; Vinassa, J.-M. Hybrid energy storage systems for renewable energy sources integration in microgrids: A review. In Proceedings of the 2010 Conference Proceedings IPEC, Singapore, 27–29 October 2010; pp. 532–537. [Google Scholar]
  51. Soto, E.A.; Bosman, L.B. Grid disturbances caused by massive integration of solar systems at utility level. In Proceedings of the 2021 International Conference on Electrical, Computer and Energy Technologies (ICECET), Cape Town, South Africa, 9–10 December 2021; pp. 1–6. [Google Scholar]
  52. Lew, D.; Piwko, D.; Miller, N.; Jordan, G.; Clark, K.; Freeman, L. How Do High Levels of Wind and Solar Impact the Grid? The Western Wind and Solar Integration Study; National Renewable Energy Laboratory (NREL): Golden, CO, USA, 2010.
  53. Energy, G. Western Wind and Solar Integration Study; NREL/SR-550-47434; National Renewable Energy Laboratory (NREL): Golden, CO, USA, 2010.
  54. Tan, Y.T.; Kirschen, D.S. Impact on the power system of a large penetration of photovoltaic generation. In Proceedings of the 2007 IEEE Power Engineering Society General Meeting, Tampa, FL, USA, 24–28 June 2007; pp. 1–8. [Google Scholar]
  55. Anees, A.S. Grid integration of renewable energy sources: Challenges, issues and possible solutions. In Proceedings of the 2012 IEEE 5th India International Conference on Power Electronics (IICPE), Delhi, India, 6–8 December 2012; pp. 1–6. [Google Scholar]
  56. Hoballah, A. Power system dynamic behavior with large scale solar energy integration. In Proceedings of the 2015 4th International Conference on Electric Power and Energy Conversion Systems (EPECS), Sharjah, United Arab Emirates, 24–26 November 2015; pp. 1–6. [Google Scholar]
Figure 1. 100% Solar Penetration by region before and after.
Eng 03 00018 g001
Table 1. List of regions in the US electric power system.
NCodeName% of Solar Generation
1CALCalifornia16.20%
2SWSouthwest3.20%
3CARCarolinas2.80%
4NWNorthwest1.90%
5FLAFlorida1.50%
6SESoutheast1.10%
7TEXTexas1.00%
8MIDAMid-Atlantic0.30%
9TENTennessee0.30%
10CENTCentral0.20%
11NENew England0.20%
12MIDWMidwest0.10%
13NYNew York0.00%
Table 2. Number of hypothetical utility level solar plants per region included in the study [48].
RegionNumber of Solar Plants
California167
Southwest149
New England68
New York62
Table 3. 100% Solar Penetration—Generation by region and sources before and after adding the hypothetical solar plants.
COLNGANUCPETWATSUNWNDOTH
CaliforniaBefore3.9%42.4%8.3%0.3%17.1%16.2%8.5%3.2%
After2.2%32.0%6.9%0.2%16.4%30.8%8.6%2.9%
New EnglandBefore0.5%49.8%31.2%0.2%8.4%0.2%3.6%6.2%
After0.3%46.2%31.2%0.1%8.4%4.0%3.6%6.2%
New YorkBefore0.0%34.7%33.6%2.9%21.9%0.0%3.3%3.5%
After0.0%32.2%33.6%1.7%22.0%3.7%3.3%3.5%
SouthwestBefore14.7%37.5%39.3%0.0%3.2%3.2%1.9%0.2%
After8.1%28.2%37.3%0.0%3.2%21.0%1.9%0.2%
Table 4. 75% solar penetration—Generation by region and sources before and after adding the hypothetical solar plants.
COLNGANUCPETWATSUNWNDOTH
CaliforniaBefore3.9%42.4%8.3%0.3%17.1%16.2%8.5%3.2%
After2.2%34.2%7.5%0.2%17.1%27.2%8.6%3.0%
New EnglandBefore0.5%49.8%31.2%0.2%8.4%0.2%3.6%6.2%
After0.3%47.1%31.2%0.1%8.4%3.1%3.6%6.2%
New YorkBefore0.0%34.7%33.6%2.9%21.9%0.0%3.3%3.5%
After0.0%33.0%33.6%1.8%22.0%2.8%3.3%3.5%
SouthwestBefore14.7%37.5%39.3%0.0%3.2%3.2%1.9%0.2%
After8.3%30.9%39.0%0.0%3.2%16.6%1.9%0.2%
Table 5. 50% solar penetration—Generation by region and sources before and after adding the hypothetical solar plants.
COLNGANUCPETWATSUNWNDOTH
CaliforniaBefore3.9%42.4%8.3%0.3%17.1%16.2%8.5%3.2%
After2.3%37.0%8.1%0.2%17.2%23.5%8.6%3.2%
New EnglandBefore0.5%49.8%31.2%0.2%8.4%0.2%3.6%6.2%
After0.3%48.0%31.2%0.1%8.4%2.1%3.6%6.2%
New YorkBefore0.0%34.7%33.6%2.9%21.9%0.0%3.3%3.5%
After0.0%33.7%33.6%2.0%22.0%1.8%3.3%3.5%
SouthwestBefore14.7%37.5%39.3%0.0%3.2%3.2%1.9%0.2%
After8.7%34.5%39.5%0.0%3.2%12.1%1.9%0.2%
Table 6. 25% solar penetration—Generation by region and sources before and after adding the hypothetical solar plants.
COLNGANUCPETWATSUNWNDOTH
CaliforniaBefore3.9%42.4%8.3%0.3%17.1%16.2%8.5%3.2%
After2.4%40.4%8.3%0.2%17.2%19.9%8.6%3.2%
New EnglandBefore0.5%49.8%31.2%0.2%8.4%0.2%3.6%6.2%
After0.4%48.9%31.2%0.1%8.4%1.2%3.6%6.2%
New YorkBefore0.0%34.7%33.6%2.9%21.9%0.0%3.3%3.5%
After0.0%34.2%33.6%2.4%22.0%0.9%3.3%3.5%
SouthwestBefore14.7%37.5%39.3%0.0%3.2%3.2%1.9%0.2%
After10.4%37.3%39.4%0.0%3.2%7.7%1.9%0.2%
Table 7. Hypothesis 1—t-test results by region and level of solar penetration.
RegionSolar PenetrationMean 1 [MWh]Mean 2 [MWh]p-Value
California100%22,35022,1850.0575 *
75%22,35022,2260.1532
50%22,35022,2670.3399
25%22,35022,3090.6326
New England100%10,90610,9020.9020
75%10,90610,9030.9264
50%10,90610,9040.9509
25%10,90610,9050.9755
New York100%14,95514,9530.9602
75%14,95514,9540.9701
50%14,95514,9540.9801
25%14,95514,9550.9900
Southwest100%17,76917,6520.0327 **
75%17,76917,6820.1069
50%17,76917,7110.2797
25%17,76917,7400.5871
* <0.1 and ** <0.05.
Table 8. Hypothesis 2—t-test results by region and level of solar penetration.
RegionSolar PenetrationMean 1 [MWh]Mean 2 [MWh]p-Value
California100%−7828−79930.0014 **
75%−7828−79520.0166 **
50%−7828−79110.1108
25%−7828−78690.4264
New England100%−2596−26010.6780
75%−2596−26000.7540
50%−2596−25980.8338
25%−2596−25970.9163
New York100%−2832−28340.8952
75%−2832−28340.9210
50%−2832−28330.9471
25%−2832−28330.9735
Southwest100%58425725<0.05 **
75%58425754<0.05 **
50%584257830.0062 **
25%584258130.1664
** <0.05.
Table 9. Hypothesis 3—t-test results by region and level of solar penetration.
RegionSolar PenetrationMean 1 [MWh]Mean 2 [MWh]p-Value
California100%789680610.0004 **
75%789680170.0072 **
50%789679750.0553 *
25%789679340.2187
New England100%259626010.3438
75%259626000.3823
50%259625980.4212
25%259625970.4604
New York100%283228350.4441
75%283228340.4579
50%283228330.4718
25%283228330.4859
Southwest100%58425727<0.05 **
75%58425754<0.05 **
50%584257830.0031 **
25%584258130.0832 *
* <0.1 and ** <0.05.
Table 10. Hypothesis 4—t-test results by region and level of solar penetration.
RegionSolar PenetrationMean 1 [MWh]Mean 2 [MWh]p-Value
California100%27,73027,8760.3863
75%27,73027,7980.4461
50%27,73027,7460.4876
25%27,73027,7190.4912
New England100%13,31713,3080.4791
75%13,31713,3060.4743
50%13,31713,3080.4782
25%13,31713,3110.4869
New York100%17,46417,4820.4673
75%17,46417,4690.4900
50%17,46417,4620.4966
25%17,46417,4610.4936
Southwest100%20,57920,8500.1803
75%20,57920,7400.2919
50%20,57920,6590.3915
25%20,57920,6020.4685
Table 11. Hypothesis 5—t-test results by region and level of solar penetration.
RegionSolar PenetrationMean 1 [MWh]Mean 2 [MWh]p-Value
California100%−4245−43930.2814
75%−4245−43840.2907
50%−4245−43600.3228
25%−4245−43160.3872
New England100%−2084−20070.0591 *
75%−2084−20400.1809
50%−2084−20650.3447
25%−2084−20810.4709
New York100%−1933−18540.1004
75%−1933−18850.2152
50%−1933−19070.3380
25%−1933−19240.4380
Southwest100%684269680.1060
75%684268870.3260
50%684268370.4829
25%684268230.4245
* <0.1.
Publisher’s Note: MDPI stays neutral with regard to jurisdictional claims in published maps and institutional affiliations.

