
Research of Scattering Properties in Solid-Core Polarization-Maintaining Photonic Crystal Fibers
by
 ,
,
Xueyan Hu
 ,
,
Shengheng Zheng
, 
Xingyuan Song
,
Xiaoxia Huang
,
Huaiwen Guo
,
Bowang Zhao
and
Wei Zhou
* Laser Fusion Research Center, China Academy of Engineering Physics, Mianshan Road No. 64, Youxian District, Mianyang 621900, China
*
Author to whom correspondence should be addressed.
Optics 2021, 2(2), 63-69; https://doi.org/10.3390/opt2020007
Submission received: 17 February 2021
/
Revised: 15 March 2021
/
Accepted: 24 March 2021
/
Published: 26 March 2021
(This article belongs to the Special Issue Fabrication and Applications of Photonic Micro-Devices)
Abstract
:The scattering from air–glass interfaces within solid-core polarization-maintaining photonic crystal fiber (PM–PCF) will increase the fiber attenuation coefficient, which may lead to high transmission loss. Therefore, it is necessary to describe scattering properties to guide research into reducing fiber loss. In this paper, the loss resulting from roughness scattering at multi-hole interfaces within PM–PCF was theoretically and experimentally analyzed. A PM–PCF scattering model was established to explore the scattering distribution. On the other hand, a fully automatic testing device was built to enable the measurement of a three-dimensional scattering sphere. Simulations were in good agreement with experimental measurements. Moreover, this new proposed measurement method could apply to other PCFs and it will be a useful tool for further scattering research.
1. Introduction
Solid-core polarization maintaining photonic crystal fibers (PM–PCFs) have been widely used in optical fiber gyroscopes because of their thermal stability, radiation resistance, design flexibility, and small transverse magnetic field error [1]. However, compared with traditional fibers, the total transmission loss of PM–PCFs is much higher because of their air–glass structure [2]. For example, the loss of a Φ 135 μm, four-layer-structured PM–PCF [3] is 2 dB/km at 1550 nm, while the loss of typical single-mode fiber is 0.18 dB/km, which is an order of magnitude higher than the latter [4]. High loss leads to the decrease of signal-to-noise ratio (SNR), which limits the application of PM–PCF in gyros.
A PM–PCF typically consists of an array of parallel air holes in a glass matrix which surrounds a solid core containing two big symmetrical holes. Due to equilibrium thermodynamics [5,6,7], the scattering loss caused by the inherent roughness of air–glass interfaces in these holes cannot be completely eliminated by technological improvements, and this was proved to be the ultimate low loss of PM–PCFs [8].
At present, the main methods for escape-light measurement in planar waveguides are Total Integrated Scattering (TIS) and Angular Resolution Scattering (ARS). TIS has the advantages of simple instrument structure and stable environment, but it cannot obtain the spatial distribution of scattered light. ARS is usually applied to the measurement of single-mode fiber [9], solid-core non-maintaining photonic crystal fiber [6] and hollow-core photonic crystal fiber [10] through device improvement. A linear array Charge-coupled Device (CCD) is used [10] to receive scattered light at a different azimuth angle in a certain range. However, the range of scattering angle is limited by the length of the CCD, and all the measured scattered light comes from the same plane. Therefore, only the distribution of scattered light in some space can be measured accurately. In addition, ARS also has the disadvantages of a complex instrument structure and unstable environment. In this paper, we reported the measurement of the three-dimensional spatial scattering distribution of a solid-core PM–PCF using a self-made angle-resolved scattering measurement device. The sensitivity, rotation angle resolution and scattering angle measurement range of the device are 1 pW, 1° and 15–165°, respectively. Numerical simulations were also performed based on the PM–PCF scattering model. The simulated results agree well with the experimental observations.
2. Theoretical Modeling and Calculation
Theoretically, the minimum scattering loss of PM–PCFs is determined by the roughness of inner walls among fiber cores. SCWs (Surface Capillary Waves) on rough surfaces are regarded as amounts of irregular glass burrs under microscopic conditions. An arbitrary disturbance deviating from an ideal air–glass interface can be considered as an induced electric dipole [11]. The relationship between the scattering power and scattering angle is analyzed in Ref. [12]. Here, we push the analysis one step further to a 3-D condition. A PM–PCF section of length 2 L was chosen to be analyzed, which was short enough to keep the incident field E0 consistent. As shown in Figure 1a [11], a coordinate system is built with a fiber center as the origin and a fiber axis as z axis. The scattering angle θ and the azimuth angle ϕ were introduced to describe the spatial angle. P(θ,ϕ) is the scattering power of the fiber section at point G(θ,ϕ), that is, the definition of the 3-D scattering angular distribution P(θ,ϕ), and the scattering loss Lsc was calculated according to Equation (1):
where and are vertical unit vectors shown in Figure 1a. E0u and E0ν are two components of E0 in the and directions, respectively. A new y coordinate of the radiating dipole direction is given by y′ = ycos ϕ – xcos ϕ, that is, the scattering field of point G is integrated. The power spectral density (PSD) of inner wall fiber roughness is given by S(β − kcos θ), where β is the mode propagation constant and k is the wavenumber. Johnson et al. [13] calculated that the polarizability of the dipole for air and glass is α0 ≈ 0.715ɛ0, where ɛ0 is the vacuum dielectric constant; ɛ is the material dielectric constant; n is refractive index; c is vacuum light velocity; and dsj is arc infinitesimal.
In order to analyze the scattering distribution law and scattering loss limit of PM–PCFs, a scattering model based on the finite element method was established. As shown in Figure 1b, the effective refractive index of the basic mode () and the electric field distribution on the interface of the fiber section could be simulated. By substituting the two quantities into Equation (1), the scattering distribution P(θ,ϕ) and scattering loss Lsc can be calculated.
The incident power of the fiber was taken to be P0. Figure 2a shows the change of the scattering rate P(θ,ϕ)/P0 with scattering angle θ at different azimuths ϕ ∈ [0°, 90°]. The overall distribution trend increased with the decrease of θ, and the scattering rate increased with the increase of ϕ at the middle of the abscissa. The curve hollow is most obvious at ϕ = 0° and disappears at ϕ = 90°. It indicated that the scattering distribution was related to the two large holes in the fiber core. The weakest scattered light was in the direction of the connection between the centers of the two large holes. The strongest scattering direction was in the mid-perpendicular of the weakest direction, which didn’t pass through the two large holes completely.
Figure 2b shows the distribution of scattering rate P(θ)/P0, where P(θ) = ∑ϕ P(θ,ϕ), which is the sum of power P(θ,ϕ) around the azimuth ϕ direction: the smaller the scattering angle θ, the greater the scattering intensity. When the scattering angle was close to the light emitted from the fiber, the scattering intensity was the strongest. Moreover, there were cutoff angles at both ends, that is, the fiber had no scattered light in the directions close to θ = 0° and θ = 180°. The reason is that when the scattered light on the air–glass interface escaped from the fiber core, light that was at scattering angles that were too large or too small could not be refracted outward due to the total reflection. Summing all the scattering power gave the total scattering loss of the fiber and the scattering loss Lsc of the PM–PCF as 0.18 dB/km.
3. Experimental Method
3.1. Measurement Device
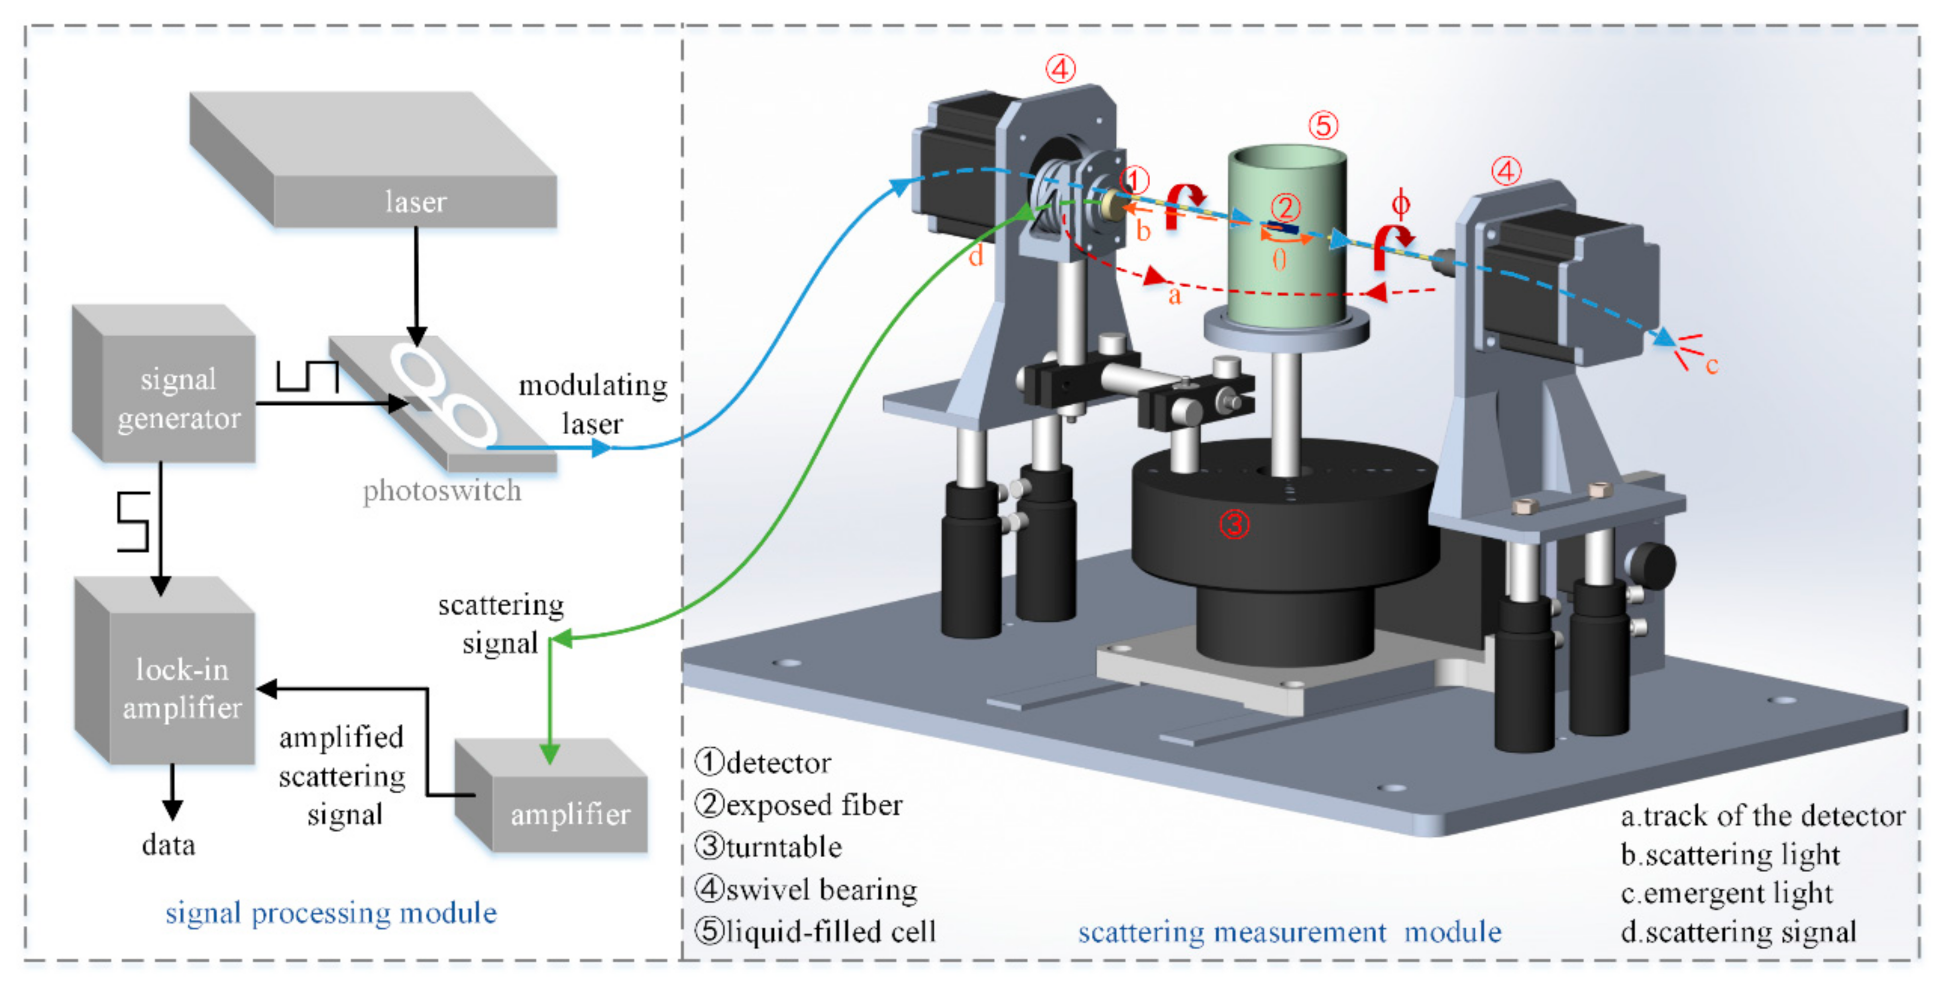
According to the scattering loss calculation method discussed in Section 2, the incidence power P0 and the scattering power distribution P(θ,ϕ) should be measured experimentally. Hence, a measurement device was designed and constructed to achieve a scanning measurement of the PM–PCF in 3-D space, as shown in Figure 3. Compared with the device in Ref. [10], our new device had a larger measurement range, and was able to perform measurement in 3 dimensions, rather than 2. The device contains a fiber measurement module and signal processing module. Firstly, in the measurement module, a photodetector with an effective measuring area of Φ 3 mm was used to receive scattered light, which was fixed on a turntable that rotated around the fiber center. The angle of turntable rotation was scattering angle θ. Then both ends of the fiber were fixed on the rotating bearings of two synchronous stepping motors, which drove the fiber rotation around its own axis. Finally, the liquid with matching refractive index was injected into the glass cylinder from a cylindrical lens, so that the scattered light at the same azimuth angle could be collected to the detector at the focal position of the lens. The outer diameter of the cylinder is 50 mm and the focal length is 80 mm according to the simulation result shown in Figure 4. The detector rotated around the cylinder to receive the focused scattered light. Compared with the experiment device in reference [9], the measurement range of scattering angle θ was greatly improved, reaching 15–165°. The measurement dimension was increased from 2-D to 3-D, which met our requirements for PM–PCF scattering dynamic-ball measurement. The resolution of the azimuth angle was estimated to be 1° to guarantee experimental accuracy. The measurement process was automatically controlled by a preset, self-written software program, making the operation to be simple and convenient.
It was found that although a refrigerated photoelectric detector with low dark-current noise was adopted to receive the scatted light and an electrical amplifier with 107 magnification was applied to boost the weak photoelectric signal, the scattering signal could not be measured directly due to noise jamming. Therefore, a coherent detection method was used in the signal processing module [13] to increase the measuring accuracy and the range of dynamic response. The light source was modulated by an optical switch to generate a scattering signal with the same frequency as the modulation signal of a lock-in amplifier used in the experiment [14]. By adopting this coherent detection method, the weak scattering signal with sensitivity of 1 pW could be measured.
3.2. Experiment Results and Analysis
Based on the scattered power measured at different θ and ϕ in Section 3.1, the total scattered power was obtained by summing these data in two dimensions. The data-fitting formula of the measuring scattering loss Lsc′ of the PM–PCF was given as follows [10]:
where Δθ is the angular interval between two adjacent points measured by the detector in its rotation plane, which could be worked out using the angular velocity of the turntable ω and the sampling interval of the acquisition software ΔTsampling. Δϕ is the rotation azimuth interval of bearings, and Pθϕ is the measured scattered power at one point (θ,ϕ) in space which can be estimated by
where Pdetector(θ,ϕ) is optical power received by the detector, and rdetector is its effective measuring radius. The whole measuring track could be seen as a sphere with radius R as shown in Figure 1a, therefore the total scattered power Pscattering could be obtained by integrating Pθϕ at the whole spherical surface. Surface infinitesimal ds could be estimated by ds ≈ ∆ϕR·∆θR since Δθ and Δϕ are small enough. By summing the power measured each time at the two angular dimensions, the total scattered power Pscattering could be achieved. Lsc′ was simply obtained by Pscattering, P0 and ΔL, where P0 was the incident power coupled into the bare fiber part and ΔL was the length of the bare fiber.
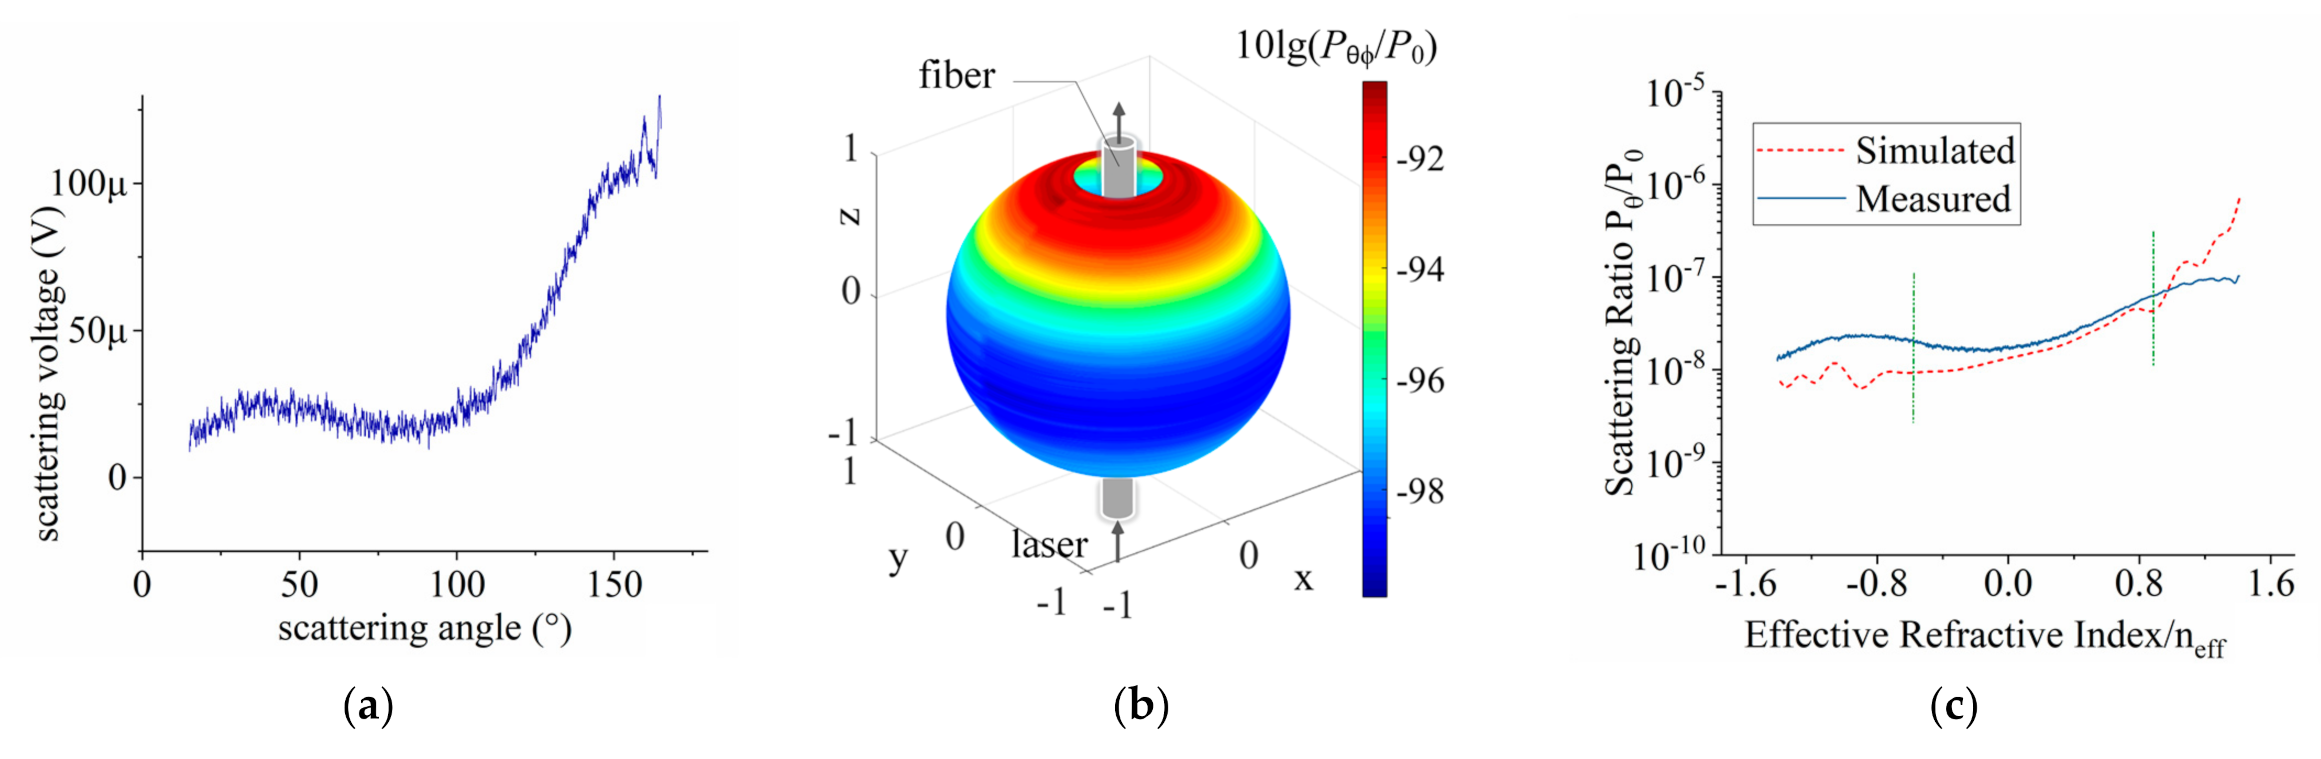
A cross section of PM–PCF with a loss of 2 dB/km [3] was chosen to be measured, and the cross-section was taken by an electron microscope as shown in Figure 5. During the test, the fiber rotated within a range of ϕ (0–180°) stepped by 5°. The average value was achieved by using multiple sets of measurements each time. We randomly chose a scattering distribution at an azimuth angle ϕ, as shown in Figure 6a. The abscissa is the scattering angle θ and the ordinate is the voltage value calculated by coherent detecting method, which corresponded to the scattered intensity.
The scattering power sphere was obtained by combining the tested results of all positions. As shown in Figure 6b, different colors represent the intensity of scattered light, reflecting the spatial distribution of the fiber scattered intensity. The results showed that the scattered light near the incident light direction was the weakest, but the scattered light near the outgoing light direction was the strongest, which was consistent with the simulation results discussed in Section 2. The comparison between the experimental and simulated results of the scattering rate distribution is given in Figure 6c. Obviously, the two sets of results were in good agreement in most cases even though, in some regions, the deviation increased by as much as 30% when the effective refractive index was rather low, which may be ascribed to the additional roughness due to fiber processing.
Table 1 shows the measurement parameters required by calculating the scattering loss.
After substituting the above parameters and experimental data into Equation (2), the scattering loss was 0.23 ± 0.000625 dB/km with a 90% confidence interval of [0.229, 0.231]. The deviation between experimental and simulation results was 0.05 dB/km. Considering that the total transmission loss of the fiber was 2 dB/km, the proportion of scattering loss was about 11.5%. The loss of solid-core single-mode PCF of about 0.3 dB/km [15] was close to the experimental value of the scattering loss, from which it could be deduced that the solid-core PM–PCF may have been influenced by other factors during application. Firstly, the capillary stacking method was used to make performs. Compared with the Modified Chemical Vapor Deposition (MCVD) method, more impurity pollution was imported, which caused impurity absorption. Secondly, the double symmetrical-core structure may have led to the deformation of mode field, which could have increased the non-circular symmetric-mode coupling loss due to factors such as fiber twisting and bending in long-distance transmission. The specific reason needs further research.
4. Conclusions
In this paper, the scattering characteristics of a solid-core PM–PCF were studied numerically and experimentally. The theoretical simulation scattering loss based on the dipole model was 0.179 dB/km, and the experimental measurement result was 0.23 dB/km, which accounted for 11.5% of the total loss. A new method for measuring spatial scattering distribution was put forward. The measurement sensitivity, rotation angle resolution and scattering angle measurement range reached the level of 1 pW, 1° and 15–165°, respectively. A three-dimensional scattering sphere measurement was achieved. The scattering distribution of simulation and measurement was basically consistent, which proved the usability of the device. Moreover, the device is not only suitable for measuring PM–PCFs but also other kinds of PCFs, even photonic crystal fibers, the scattering loss of which cannot be ignored. This study is significant for the research into fiber scattering.
Author Contributions
Conceptualization, data curation, formal analysis, methodology, writing—original draft, X.H. (Xueyan Hu); data curation, software, supervision, S.Z.; investigation, visualization, X.S.; funding acquisition, X.H. (Xiaoxia Huang); validation, H.G.; resources, B.Z.; project administration, validation, writing—review and editing, W.Z. All authors have read and agreed to the published version of the manuscript.
Funding
This research was funded by the National Natural Science Foundation of China, grant number 61805223.
Informed Consent Statement
Not applicable.
Data Availability Statement
The data presented in this study are openly available in FigShare at ORCID, reference number 0000-0002-6134-9316.
Conflicts of Interest
The authors declare no conflict of interest.
References
- Wang, L.; Li, H.; Zhang, J.; Ma, H.; Jin, Z. Optimization of the sinusoidal phase modulation technique in resonant fiber optic gyro. Opt. Commun. 2017, 387, 18–23. [Google Scholar] [CrossRef]
- Koshiba, M.; Saitoh, K. Simple evaluation of confinement losses in holey fibers. Opt. Commun. 2005, 253, 95–98. [Google Scholar] [CrossRef]
- Song, N.; Cai, W.; Song, J.; Jin, J.; Wu, C. Structure optimization of small-diameter polarization-maintaining photonic crystal fiber for mini coil of spaceborne miniature fiber-optic gyroscope. Appl. Opt. 2015, 54, 9831–9838. [Google Scholar] [CrossRef] [PubMed]
- Corning, Additional Resources, SMF-28e+ Optical Fiber Product Information Sheet. Available online: https://www.corning.com/optical-communications/worldwide/en/home/products/fiber/optical-fiber-products/smf-28e-.html (accessed on 25 March 2020).
- Langevin, D.; Meunier, J.; Bouchiat, M.A. Heterodyne spectroscopy at very low frequencies. Opt. Commun. 1972, 6, 427–429. [Google Scholar] [CrossRef]
- Roberts, P.J.; Couny, F.; Sabert, H.; Mangan, B.J.; Birks, T.A.; Knight, J.C.; Russell, P.S.J. Loss in solid-core photonic crystal fibers due to interface roughness scattering. Opt. Express 2005, 13, 7779–7793. [Google Scholar] [CrossRef] [PubMed]
- McCready, M.J. Spectral behavior of capillary waves in gas–liquid flows. Phys. Fluids 1986, 29, 2836–2842. [Google Scholar] [CrossRef]
- Unger, H.-G. Planar Optical Waveguides. Fiber Integr. Opt. 1979, 41, 183–221. [Google Scholar] [CrossRef]
- Lines, M.; Reed, W.; Di Giovanni, D.; Hamblin, J. Explanation of anomalous loss in high delta singlemode fibres. Electron. Lett. 1999, 35, 1009. [Google Scholar] [CrossRef]
- Couny, F.; Sabert, H.; Roberts, P.J.; Williams, D.P.; Tomlinson, A.; Mangan, B.J.; Farr, L.; Knight, J.C.; Birks, T.A.; Russell, P.S.J. Visualizing the photonic band gap in hollow core photonic crystal fibers. Opt. Express 2005, 13, 558–563. [Google Scholar] [CrossRef] [PubMed]
- Numkam, E.; Poletti, F.; Richardson, D.J. Dipole radiation model for surface roughness scattering in hollow-core fibers. In Proceedings of the National Fiber Optic Engineers Conference 2012, Los Angeles, CA, USA, 4–8 March 2012. [Google Scholar] [CrossRef] [Green Version]
- Numkam, E.; Poletti, F.; Richardson, D.J. Analysis of light scattering from surface roughness in hollow-core photonic bandgap fibers. Opt. Express 2012, 20, 20980–20991. [Google Scholar]
- Johnson, S.G.; Povinelli, M.L.; Soljačić, M.; Karalis, A.; Jacobs, S.; Joannopoulos, J.D. Roughness losses and volume-current methods in photonic-crystal waveguides. Appl. Phys. A 2005, 81, 283–293. [Google Scholar] [CrossRef]
- Song, I.; Bae, J.; Kim, S.Y. Advanced Theory of Signal Detection. Signals Commun. Technol. 2010, 6, 2891–2930. [Google Scholar] [CrossRef]
- Knight, J.C.; Birks, T.A.; Russell, P.S.J.; Atkin, D.M. All-silica single-mode optical fiber with photonic crystal cladding. Opt. Lett. 1996, 21, 1547–1549. [Google Scholar] [CrossRef]
Figure 1.
(a) Illustration of scattering of point G on a distant sphere and (b) the scattering simulation model of the solid-core PM–PCF.
Figure 1.
(a) Illustration of scattering of point G on a distant sphere and (b) the scattering simulation model of the solid-core PM–PCF.
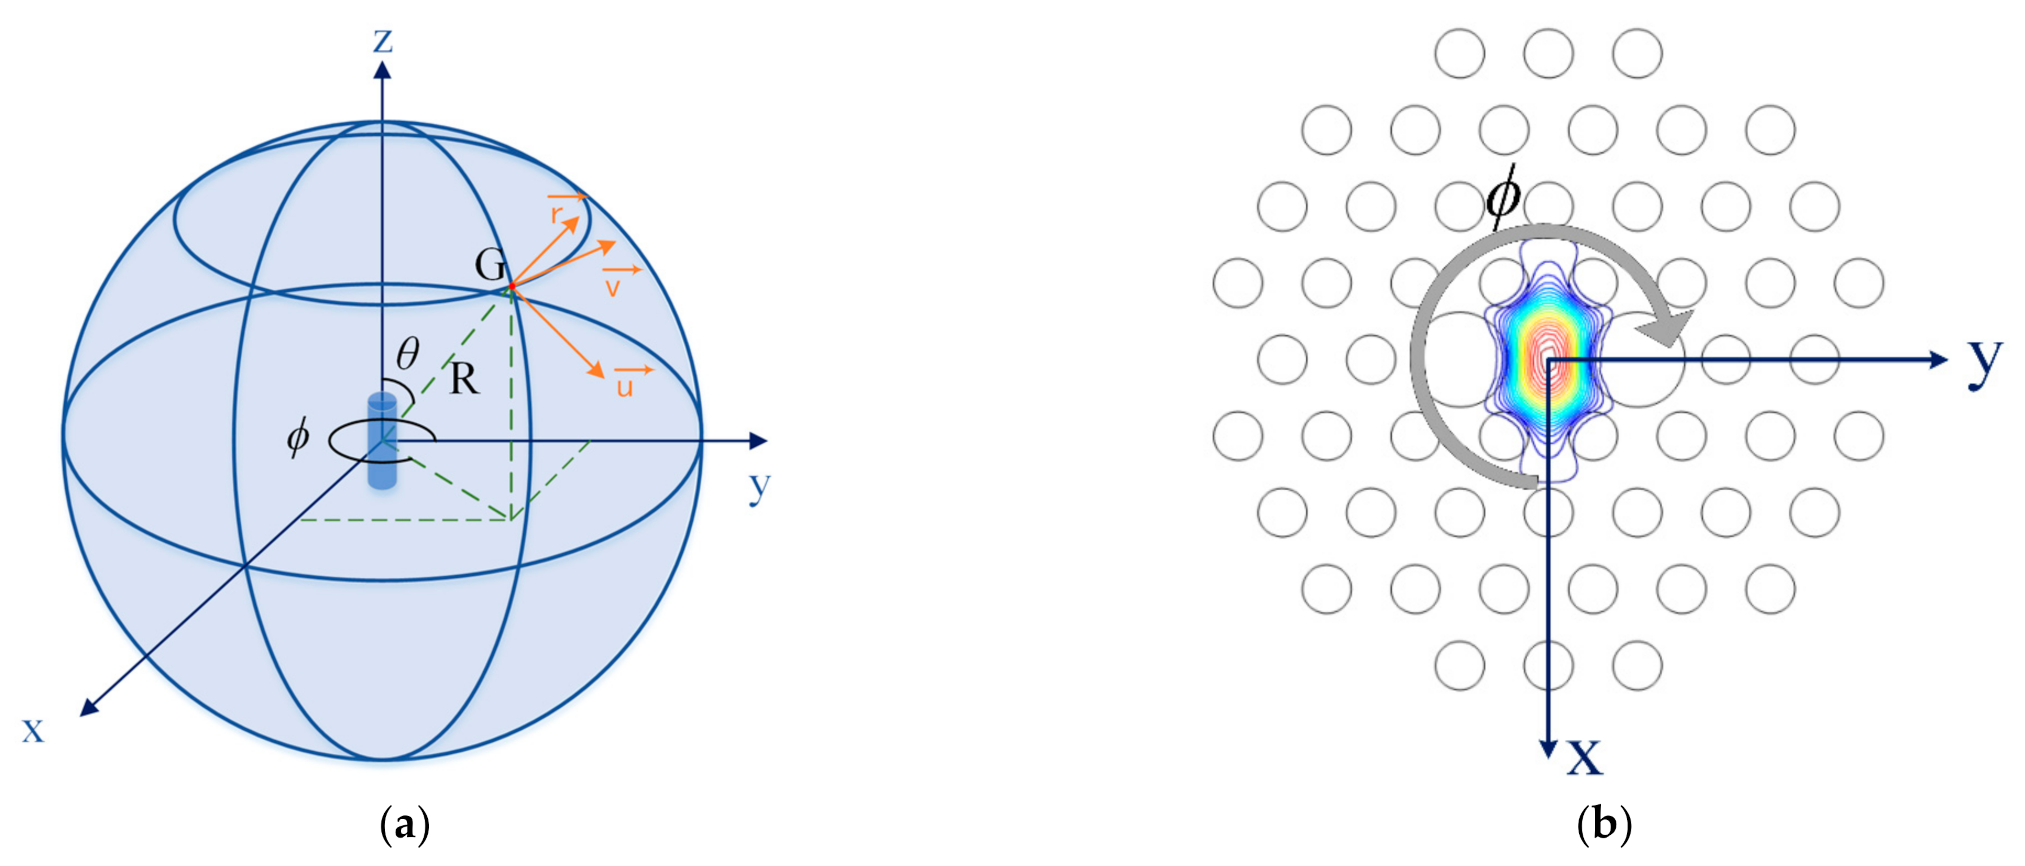
Figure 2.
(a) The scattering ratio distribution P(θ,ϕ)/P0 at different azimuth angles and (b) the total scattering ratio distribution P(θ)/P0.
Figure 2.
(a) The scattering ratio distribution P(θ,ϕ)/P0 at different azimuth angles and (b) the total scattering ratio distribution P(θ)/P0.
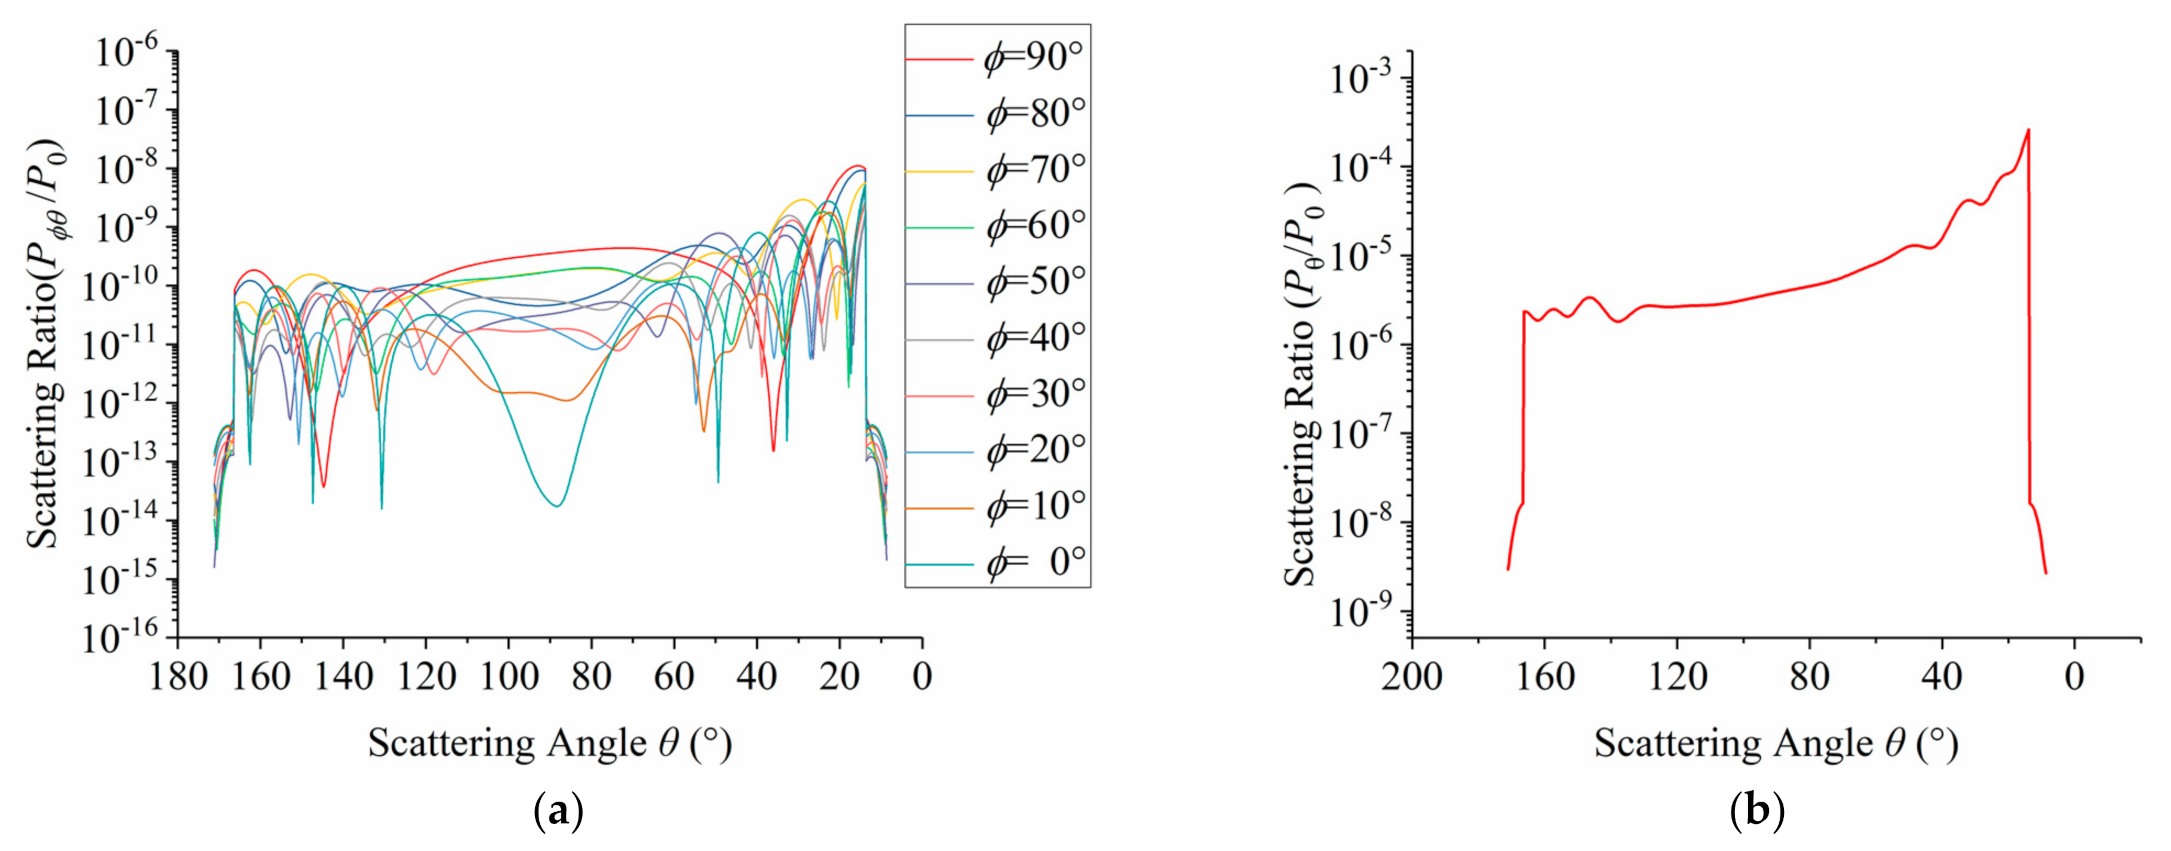
Figure 3.
Fiber scattering measurement equipment.

Figure 4.
Simulation of convergence position of scattered light.

Figure 5.
A section of PM–PCF for gyroscopes.

Figure 6.
(a) The scattering voltage distribution of PM–PCF at one azimuth angle and (b) the spatial scattered power distribution sphere of PM–PCF and (c) the measured scattering distribution compared with simulation results.
Figure 6.
(a) The scattering voltage distribution of PM–PCF at one azimuth angle and (b) the spatial scattered power distribution sphere of PM–PCF and (c) the measured scattering distribution compared with simulation results.

Table 1.
Measurement parameters.
| Parameter | Δϕ | rdetector | ω | ΔTsampling | R |
|---|---|---|---|---|---|
| Value | 5° | 1.5 mm | 1.04°/s | 100 Hz | 80 mm |
Publisher’s Note: MDPI stays neutral with regard to jurisdictional claims in published maps and institutional affiliations. |
© 2021 by the authors. Licensee MDPI, Basel, Switzerland. This article is an open access article distributed under the terms and conditions of the Creative Commons Attribution (CC BY) license (http://creativecommons.org/licenses/by/4.0/).
Share and Cite
MDPI and ACS Style
Hu, X.; Zheng, S.; Song, X.; Huang, X.; Guo, H.; Zhao, B.; Zhou, W. Research of Scattering Properties in Solid-Core Polarization-Maintaining Photonic Crystal Fibers. Optics 2021, 2, 63-69. https://doi.org/10.3390/opt2020007
AMA Style
Hu X, Zheng S, Song X, Huang X, Guo H, Zhao B, Zhou W. Research of Scattering Properties in Solid-Core Polarization-Maintaining Photonic Crystal Fibers. Optics. 2021; 2(2):63-69. https://doi.org/10.3390/opt2020007
Chicago/Turabian StyleHu, Xueyan, Shengheng Zheng, Xingyuan Song, Xiaoxia Huang, Huaiwen Guo, Bowang Zhao, and Wei Zhou. 2021. "Research of Scattering Properties in Solid-Core Polarization-Maintaining Photonic Crystal Fibers" Optics 2, no. 2: 63-69. https://doi.org/10.3390/opt2020007