An Optimized Dynamic Tensile Impact Test for Characterizing the Behavior of Materials


Laboratoire Génie de Production, Ecole Nationale d’Ingénieurs de Tarbes, Institut National Polytechnique, Université de Toulouse, 47 Av d’Azereix, F-65016 Tarbes, France
*
Author to whom correspondence should be addressed.
Appl. Mech. 2022, 3(3), 1107-1122; https://doi.org/10.3390/applmech3030063
Submission received: 24 August 2022
/
Revised: 5 September 2022
/
Accepted: 8 September 2022
/
Published: 11 September 2022
(This article belongs to the Special Issue Impact Mechanics of Materials and Structures)
Abstract
:This paper presents a new dynamic tensile test based on the Taylor impact technique for application on metallic materials. The Taylor impact test is a well-known technique to characterize the behavior of metallic materials in compression because it allows us to reach very high strain rates (). In this dynamic tensile test, we launch a projectile with an initial velocity into a specially designed target in order to generate tensile deformation in its central area. In this paper, the geometry of a tensile target previously published in our laboratory was modified and optimized to achieve higher plastic strains and strain rates without reaching the critical state of target failure. Numerical simulations and experimental tests validate the new geometry. Experimental tests have been performed with this new geometry to show the gains allowed. Numerical simulations by finite elements on Abaqus show the equivalent plastic deformations and elongation of the two versions of the targets and the correlation of these results with the tests.
1. Introduction
The thermomechanical behavior of metallic materials at high strain rates is frequently observed in military and civil applications. Due to the strain rate sensitivity, the deformation processes of metallic materials subjected to high strain rate mechanical stresses can differ significantly from the deformation processes of the same materials in static or quasi-static situations. In the case of quasi-static deformations, we have a situation of static equilibrium, i.e., any element of the body has a sum of forces acting on it close to zero. When a target is hit from the outside with a very high velocity, the stresses must move inside the bodies at specific velocities, and they may involve more complex mechanisms in the deformation processes. To gain knowledge of the dynamic mechanical properties of materials, there has been an increasing interest in high strain rate experimental methods over the past few decades. Among the dynamic stresses that can be applied to a sample (compression, tension, shear), dynamic tension is of particular interest for the mechanical characterization of the behavior of metallic materials.
One method used to characterize the behavior of materials subjected to dynamic tension is the Split Hopkinson Tensile Bar (SHTB) [1,2,3,4,5,6]. This corresponds to a modification of the Split Hopkinson Pressure Bar (SHPB) introduced by Kolsky [7], for which strain rates ranging from to can be achieved [8]. A typical specimen for the SHTB test has a dog-bone geometry with a midsection of a small cross-sectional area and ends with a larger cross-sectional area. A tensile load initially stored at the end section of the incident bar is released to generate the tensile load wave. The stress, strain, and strain rate determined from the recorded waves provide an accurate measure of the material behavior [2]. This method has been improved over the years and recent advances allow specimen heating [6], a wide strain rate loading range [5], or combined tension–torsion or compression–torsion that is capable of loading a specimen with a torsional stress pulse synchronously at high strain rates [9]. The results of SHTB tests with notched specimens combined with numerical simulation on Abaqus also allow Chen et al. [3] to determine the parameters of the Johnson–Cook damage law of a material in addition to the parameters of the flow law.
As an alternative to the SHTB, Sturges et al. [10] of the University of Leeds have proposed a so-called flying wedge test for high strain rate tensile testing, which includes two essential assemblies: a gas gun system to propel the wedge and a sliding mechanism to grip and deform the specimen. The kinetic energy of the flying wedge provides a sudden tensile pulse to the specimen. It can generate strain rates ranging from about to over . The study of the effective strain rate imposed on the specimen showed that the strain rate is not constant due to multiple reflections of the stress waves along the length of the specimen, as reported by Bonora et al. [11]. More recently, Froustey et al. [12] presented a device suitable for medium impact rates up to for performing interrupted and failure tests. This one is based on a flywheel device used to load the specimen. The system is dedicated to displacement measurement and provides qualitative and quantitative information on the stretching mechanism leading to fracture.
Following the same approach as that used for the SHTB method, a technique for characterizing the behavior of materials subjected to dynamic tension was developed in this study by extending the Taylor impact technique [13,14,15]. The first studies were carried out a few years ago in our laboratory and led to the development of a first version of the dynamic tensile test, for which the useful area of the target resembles that currently used by Liu et al. [9] for combined tensile–torsional stress. In this test, the Taylor gas gun device is used to launch a projectile into a specially designed target with different impact velocities, and tensile deformation occurs mainly in the central region of the target. The strain rates of the dynamic tensile test range from to . In this paper, the previously proposed tensile target geometry [16] was modified and optimized to achieve higher strain and elongation without reaching the critical state of target failure. For the present study, we also improved the experimental process and developed a complete numerical model of the test to validate the proposed optimization process.
Section 2 presents the experimental set-up of the device and the alternative version of the target for the dynamic tensile test. Section 3 shows some results of the experimental tests made in our laboratory using the new geometry of the dynamic tensile target. Finally, Section 4 is dedicated to the presentation of a numerical simulation of the dynamic tensile test using the Abaqus Explicit FEM code [17] to validate the proposed new geometry of the specimen.
2. Experimental Set-Up
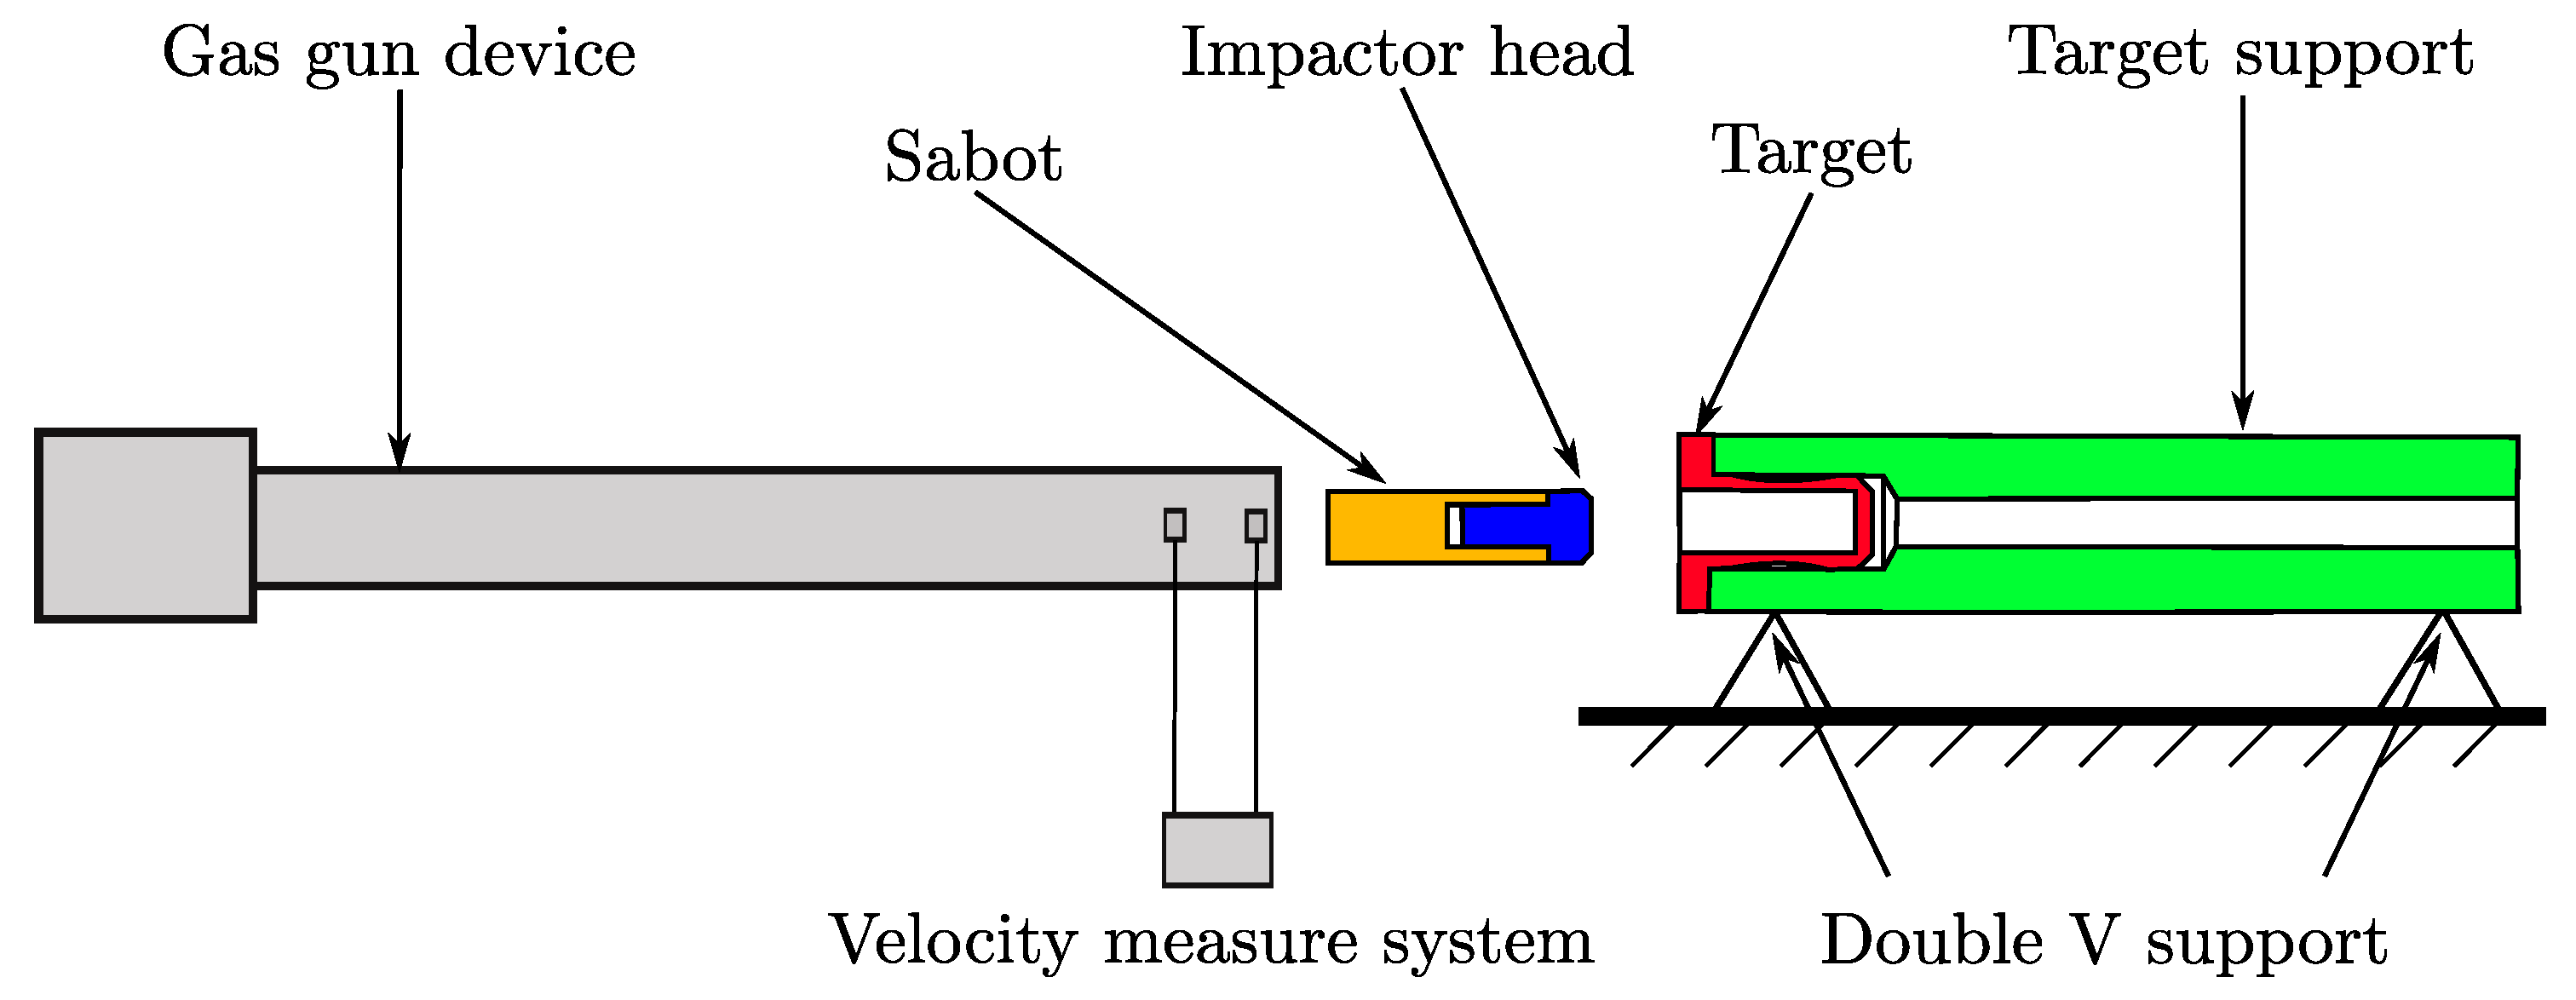
The experimental tensile test device installed in our laboratory consists of five elements: a Taylor gas gun used to launch the projectile in a velocity range of 30 to , a laser light barrier projectile velocity measurement system, the projectile itself consisting of the assembly of a steel impactor head and a polycarbonate sabot, the target, specially designed for this application, and the target holder, which is unattached, used to obtain a perfect alignment of the target and the impactor, as shown in Figure 1 from left to right.
In the Taylor impact technique, the history of stress, strain, and strain rate in the specimen cannot be recorded during impact. Instead, the final deformed shapes of the specimens are used as experimental responses for an inverse flow law parameter identification procedure such as that proposed by some previous work done in our laboratory [18,19,20,21]. Thus, in this type of approach, the identification of the parameters of the constitutive law is based on a post mortem analysis, i.e., on the final deformed shapes of the specimens. Basically, we use a method of identification by experimental/numerical simulation matching for which a numerical model of the experimental test is developed on Abaqus/Explicit. The parameters of the flow law used in the numerical simulation are then optimized in order to match the output of the numerical model in terms of final geometry to the experimental data. This reverse identification procedure is detailed in Ming [20].
2.1. Experimental Device for the Taylor Impact Technique
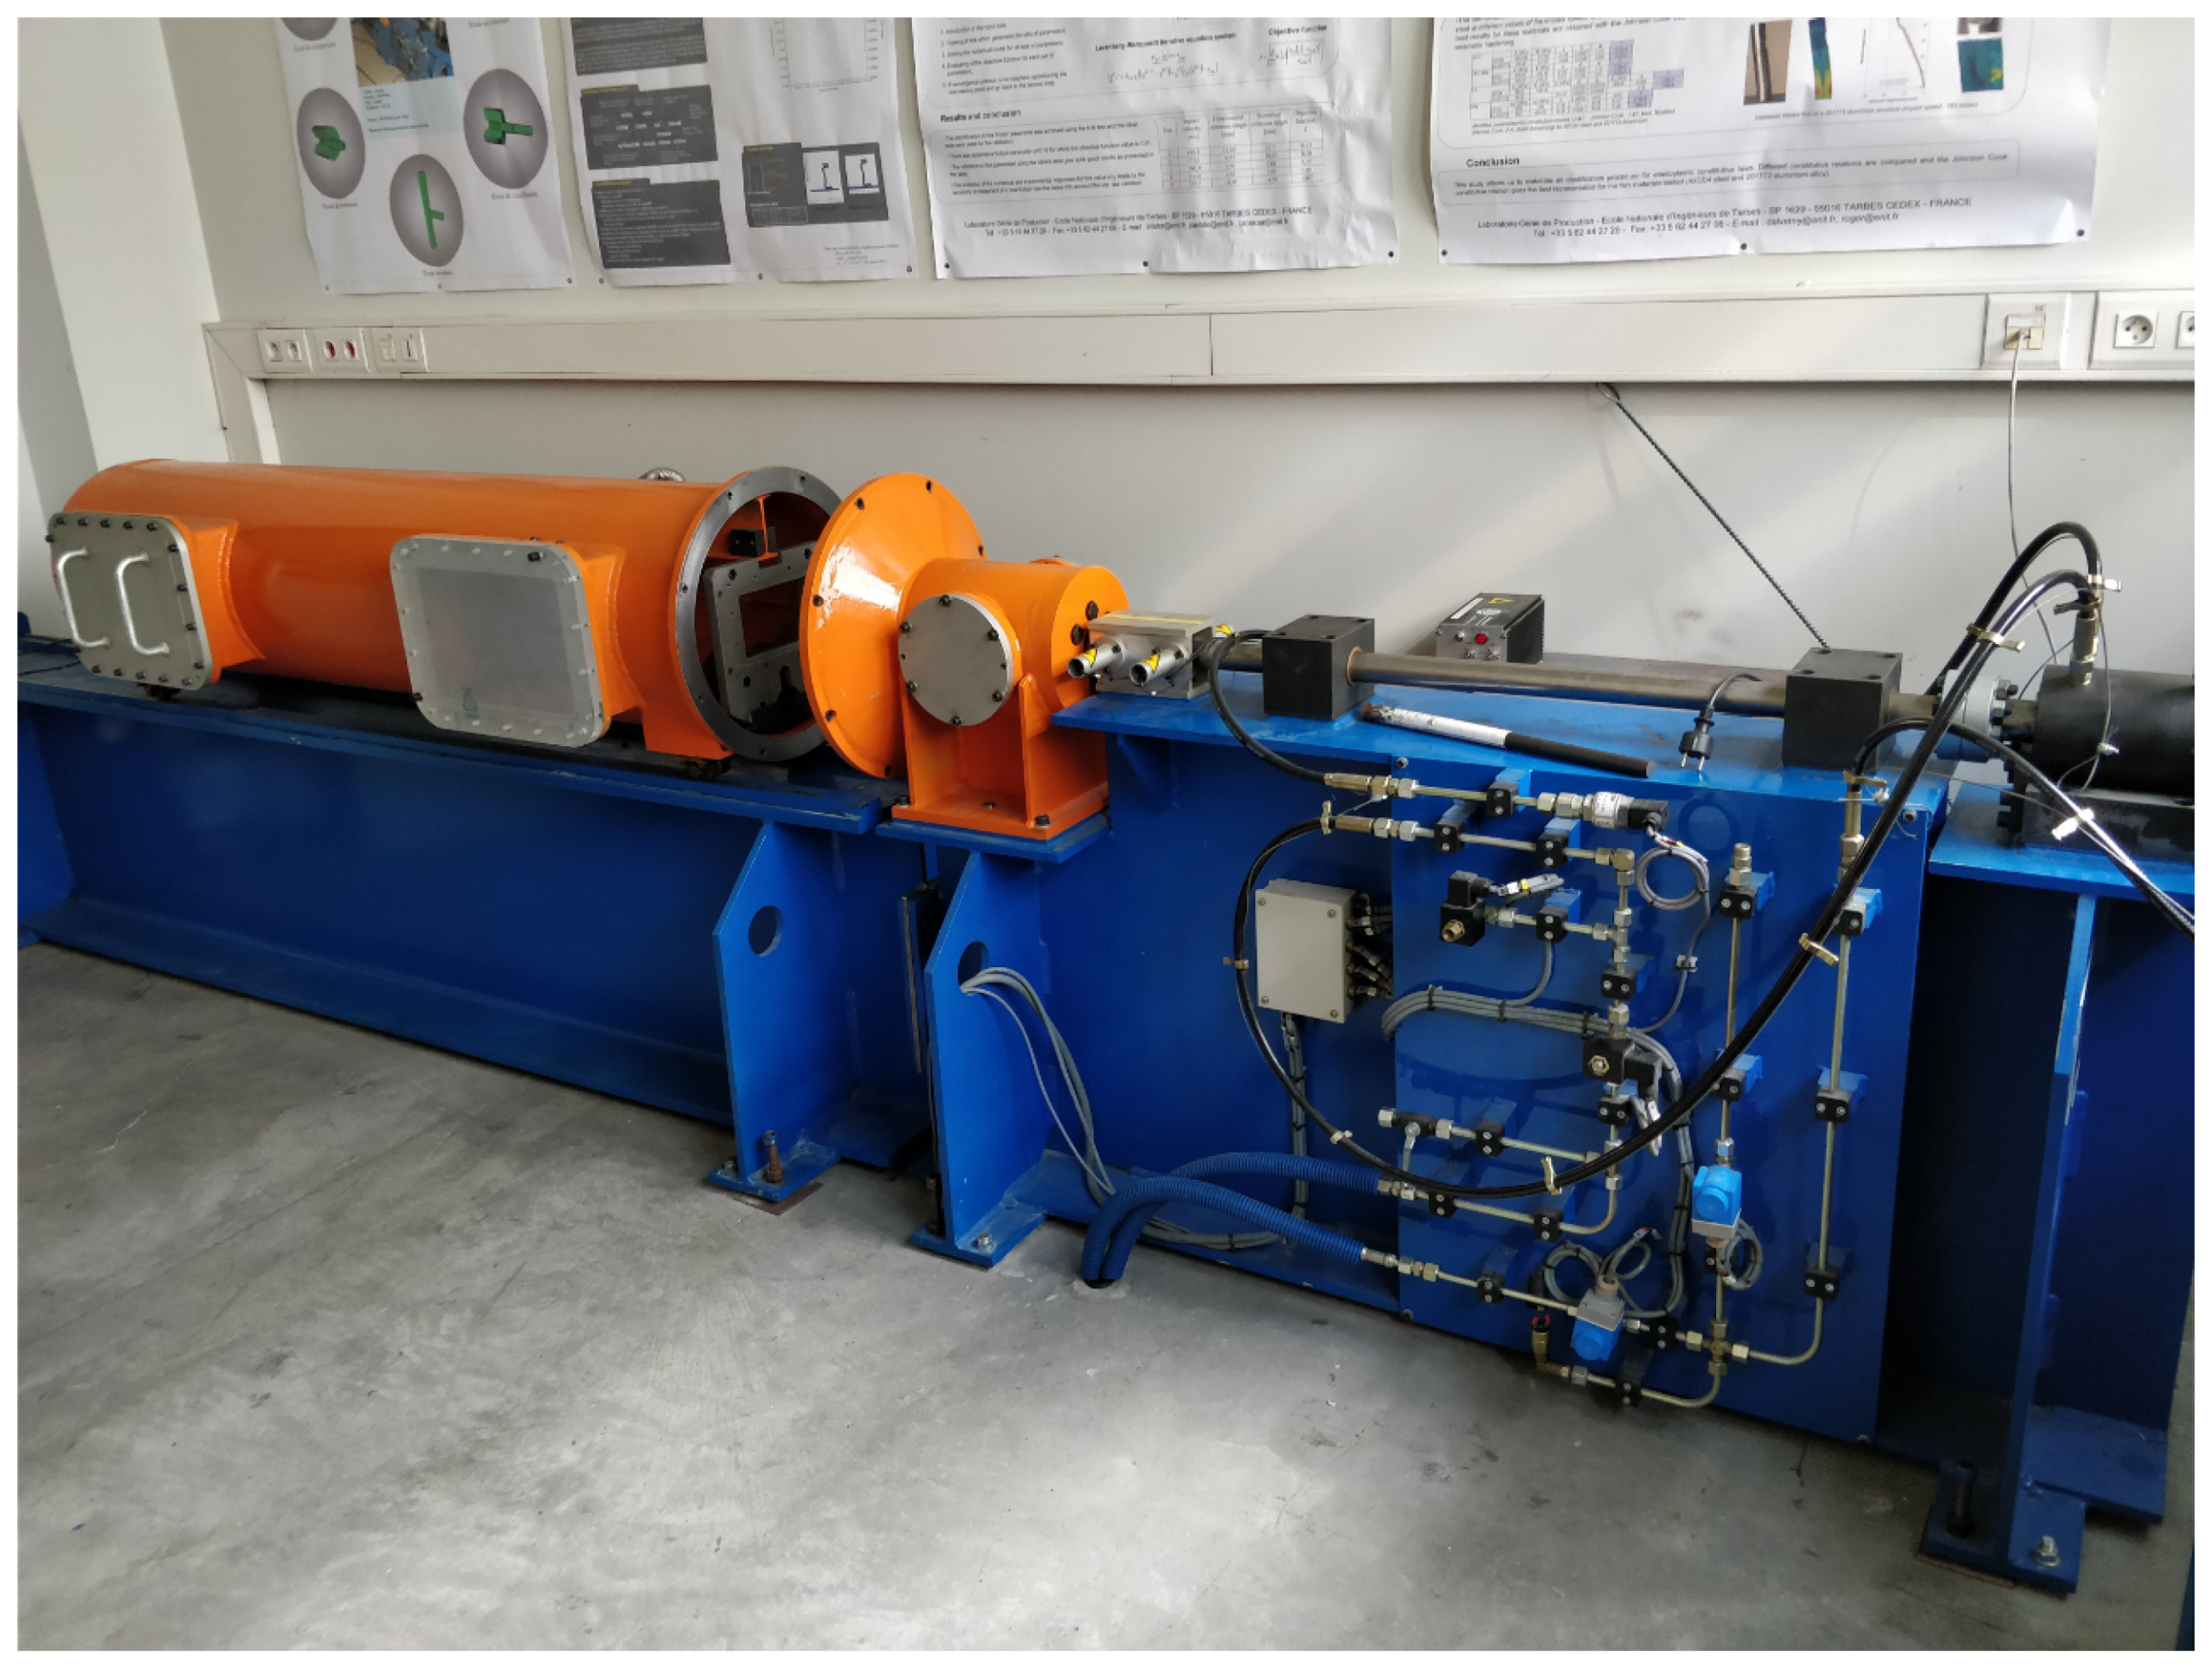
The most important part of the Taylor impact technique is the Taylor gas gun, as shown in Figure 2. It launches a projectile to perform the impact test, of which the propulsion is provided by nitrogen–oxygen compressed gas up to , and the speed of a projectile with weight ranges from 30 up to .
The barrel guides the projectile to the exit of the launch chamber, where the target awaits impact. The choice of the impact speed is made by the value of the pressure in the firing tank and with the help of calibration tables made in the laboratory. Two laser barriers, apart, are placed at the end of the exit to measure the speed of the projectile just before impact, the global precision of this measure is about . The length and caliber of the barrel of our device are, respectively, and . A vacuum pump is used to empty the gun chamber before the test to avoid blast effects on the target.
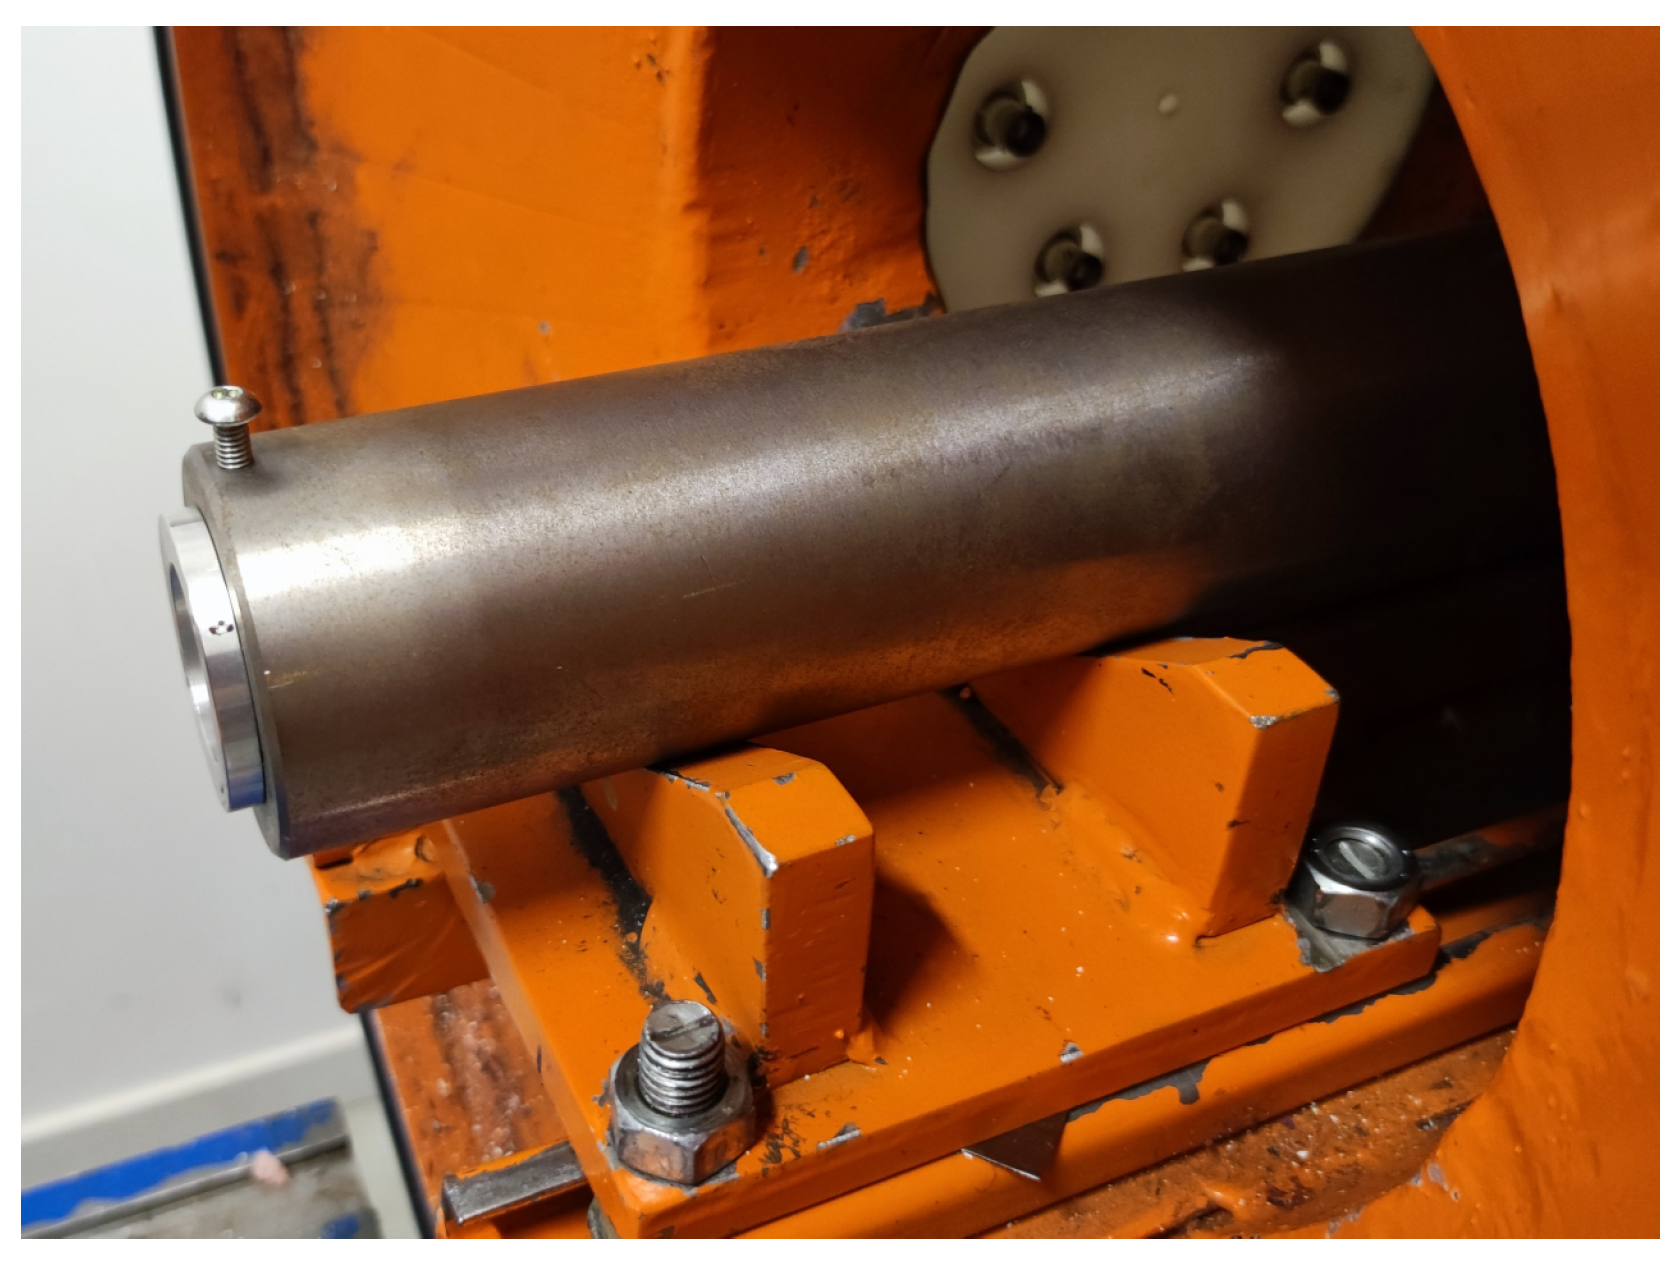
A massive target support, with a mass of m = , shown in Figure 3 and Figure 4, which is not fixed during impact, but rests on a double V, attached to support rails with screws, is used to support the target during impact and ensure proper alignment between the target and the projectile in the gas gun impact chamber. Due to the short distance between the end of the tube and the target, and considering that the target holder is placed on a double V, the same position of the specimen is assured between two consecutive shots.
The distance between the target and the barrel exit is kept as small as possible (about ) to ensure alignment during impact, i.e., the projectile just exits the barrel when it hits the target. This is possible thanks to the fact that the test is carried out in vacuum conditions, therefore without the presence of a blast at the front of the projectile. As we can see in Figure 4, the two ends of the target support have different geometries, which are designed for different tests (dynamic traction test on the left side and Taylor compression test on the right side by adding a quasi-rigid disc inside the diameter hole). The target support can provide the necessary inertial mass difference, allowing the targets to generate tensile deformation in the useful area. This approach was found to be better than using a set of screws to secure the target inside the impact chamber because it avoids shocks and preserves the integrity of the target guide rails. Nevertheless, this approach requires modifying the boundary conditions of the numerical model as proposed by Pantalé et al. [21]. The material used for the target support is 42CrMo4 steel.
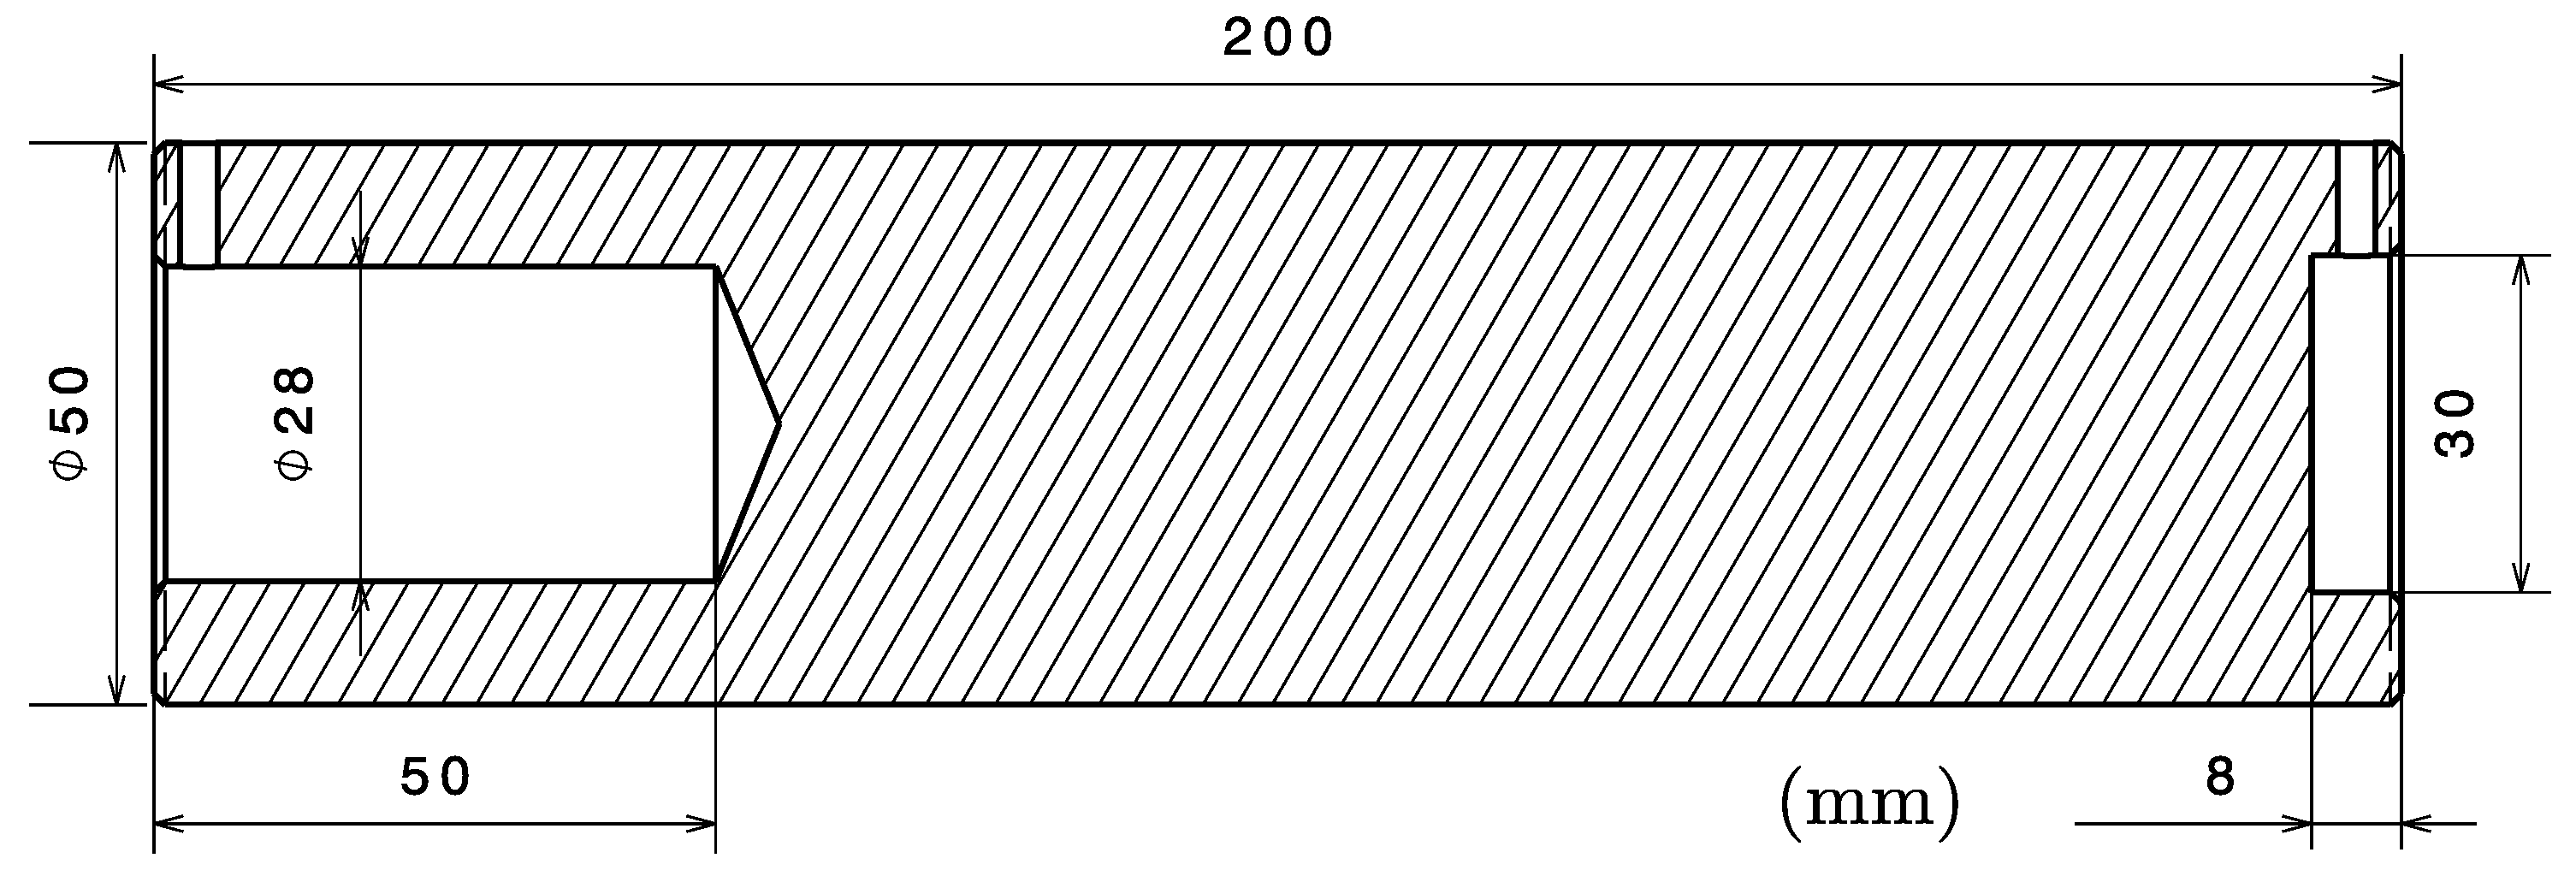
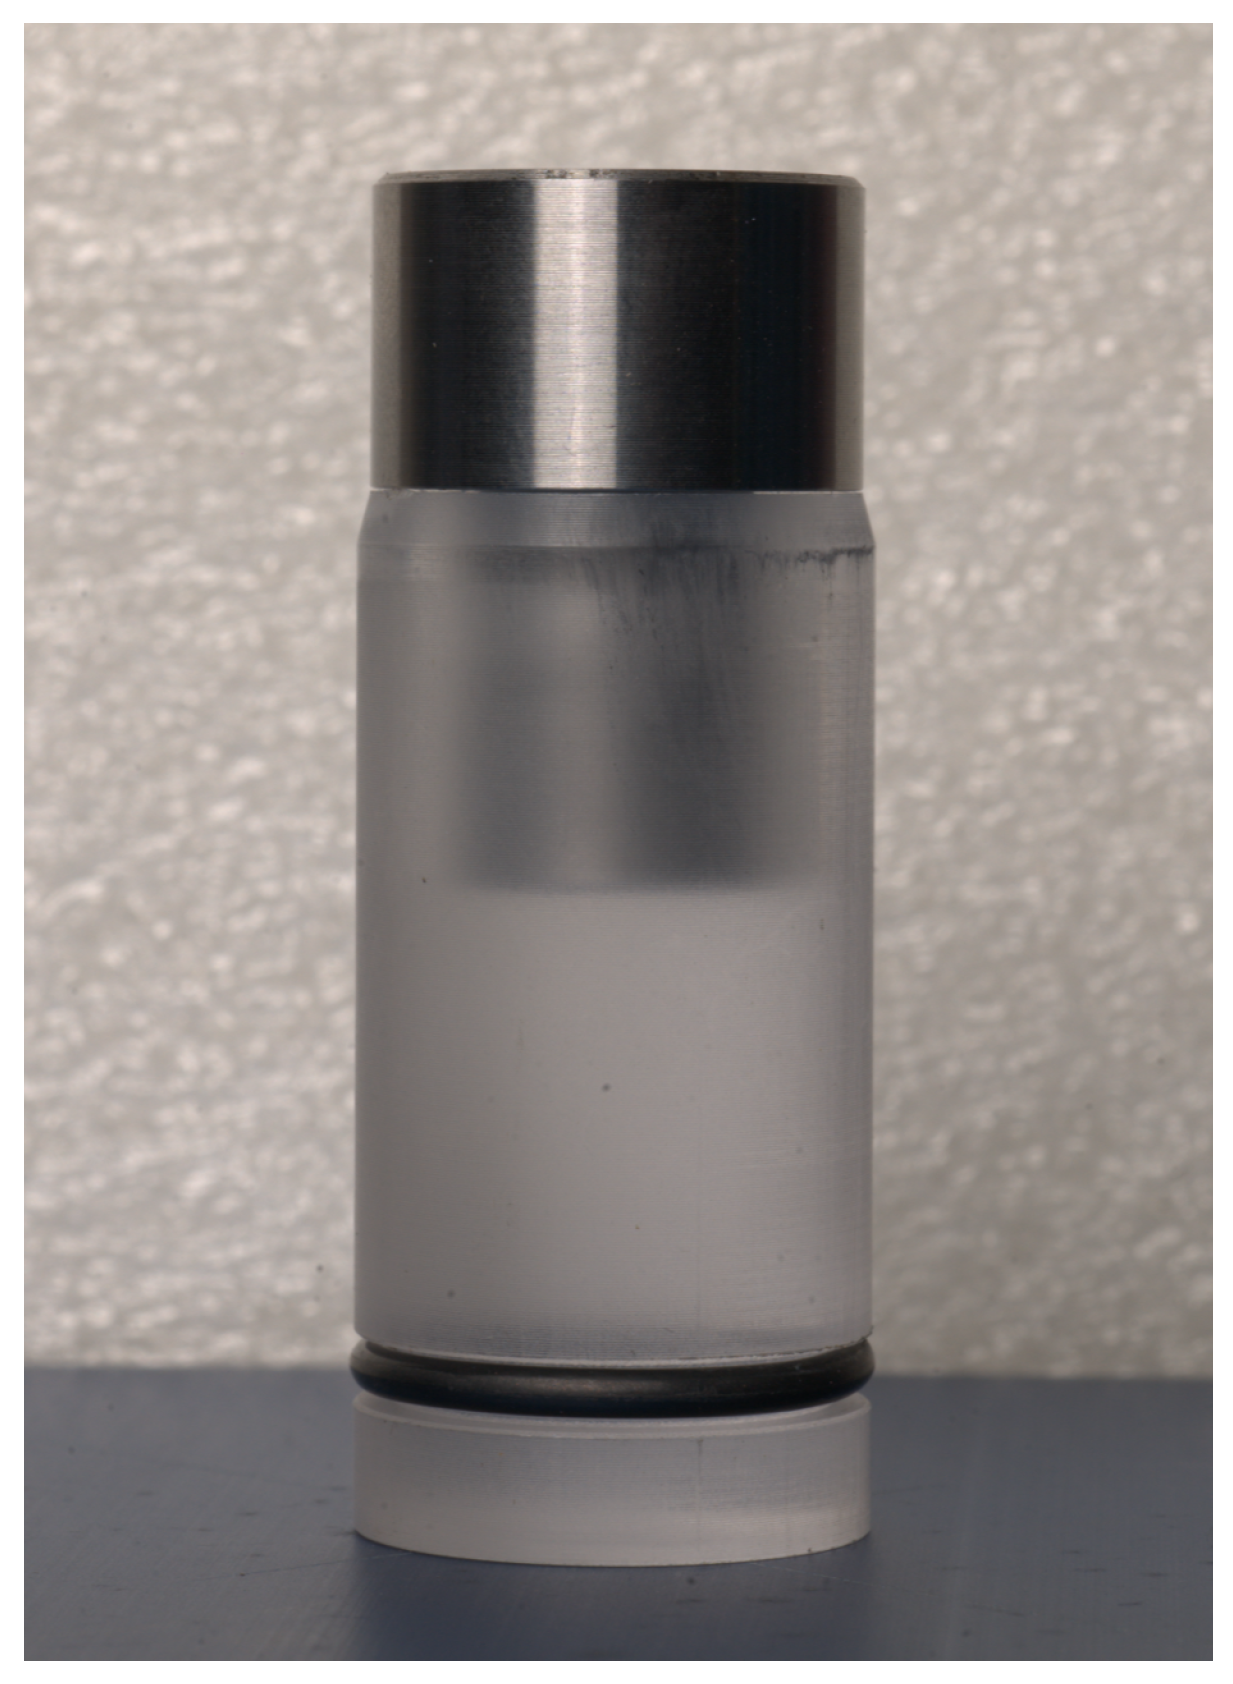
The projectile used in the dynamic tensile test, which is reported in Figure 5, consists of a 42CrMo4 steel head and a polycarbonate sabot with the exact geometry as reported in Figure 6. The sabot can ensure the tightness behind the projectile with an elastic ring and guide the projectile during its movement along the barrel. The total weight of the projectile is m = g.
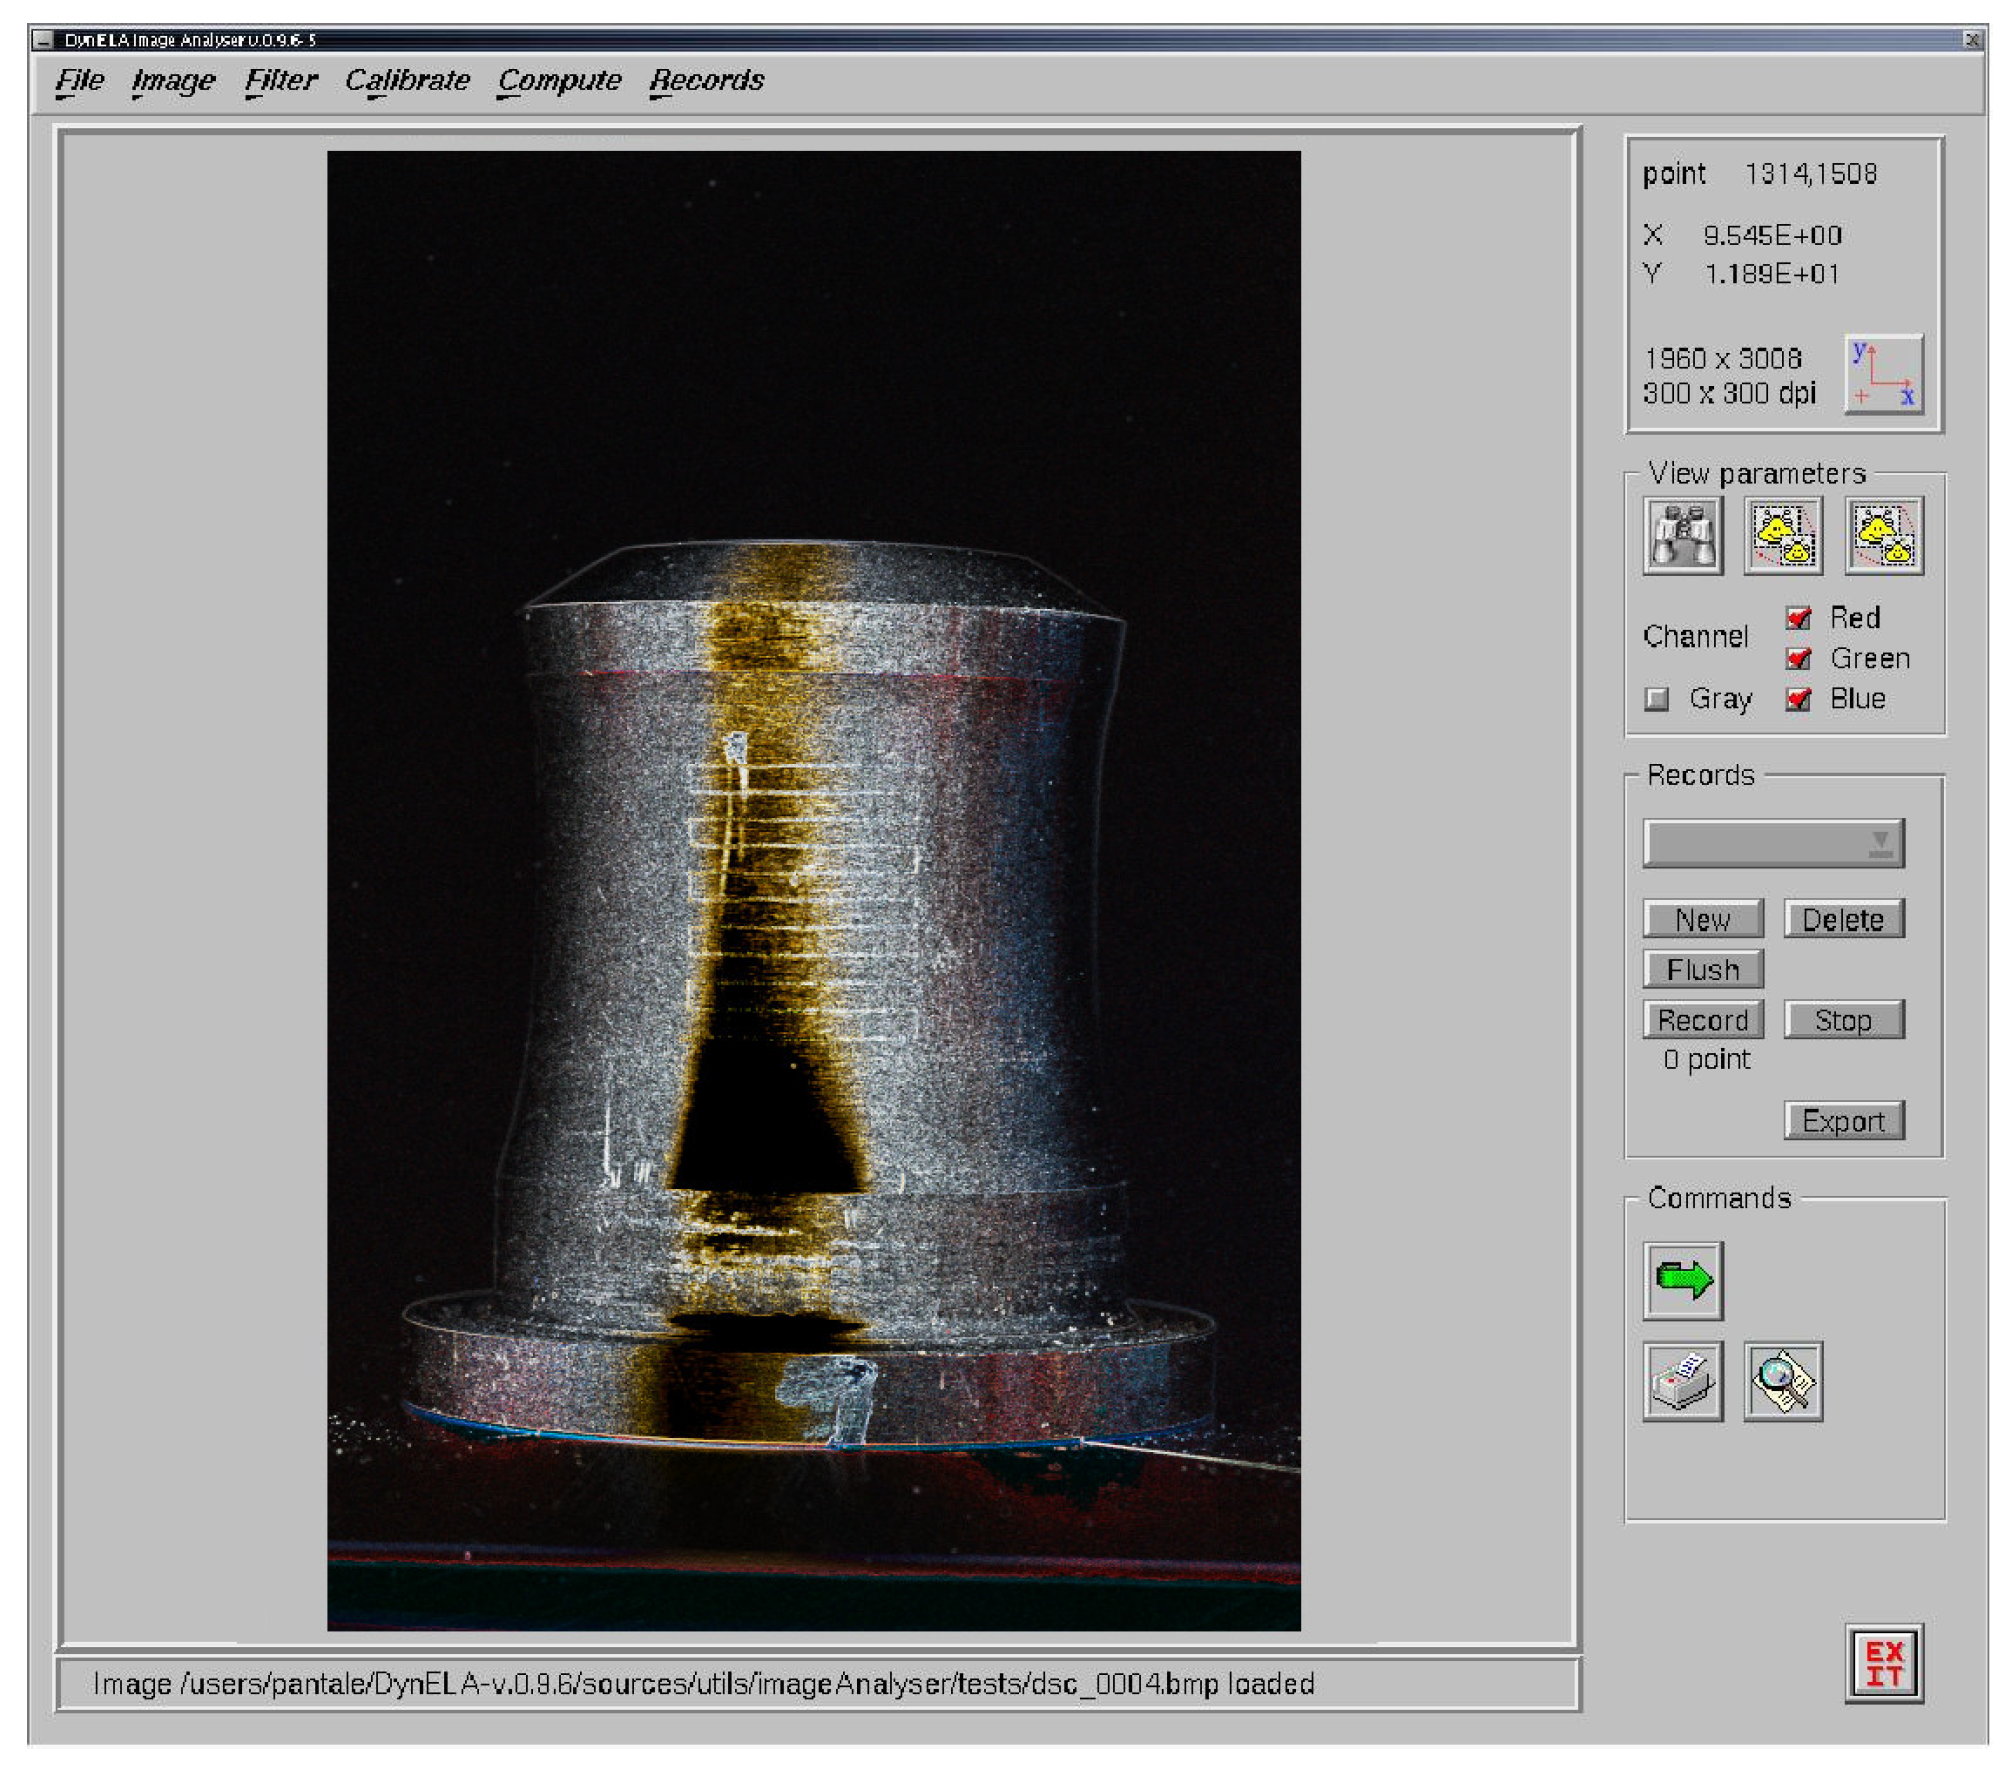
A dimensional measurement is carried out for the deformed specimens, which is mainly realized by a macro-photographic procedure. A digital camera Nikon D1X equipped with a 1:2.8 D macro objective is used to take pictures of the deformed specimens. This camera can obtain a digital image of pixels having spatial resolution for a macro ratio of . The images of the deformed specimens are analyzed by a home-made software called imageAnalyser [22] (see Figure 7 for a screen capture of this software). This software can build a 2D reference system to associate each pixel of the image with the real coordinate in millimeters. The profile of the specimen can be automatically extracted from the image by contour recognition and the coordinates of these points are output to a CVS file for further analysis. In addition to the image analysis system, some conventional techniques using measuring tools, e.g., calipers and inner and outer micrometers, are also employed to measure and confirm the dimensions of deformed specimens.
2.2. Optimization of the Target for the Dynamic Tensile Test
The initial geometry of the target for the previously designed dynamic tensile test, already published some years ago by Abichou et al. [16], is reported in Figure 8.
The thin area of the target is the so-called useful zone where tensile deformation mainly occurs. In the present work, the geometry of the target has been modified with regard to the previous approach and optimized in order to obtain higher strains and higher strain rates without reaching the critical state of the rupture of the specimen. The optimization of the tensile target is mainly based on the following considerations:
- Lighten the zone where the projectile impacts the target (the top zone in Figure 8) in order to reduce the inertia by making a flat top end;
- Make the kinetic energy of the projectile better transferred to the useful cylindrical thin zone of the target and enlarge the connecting radii on either side of the thin area;
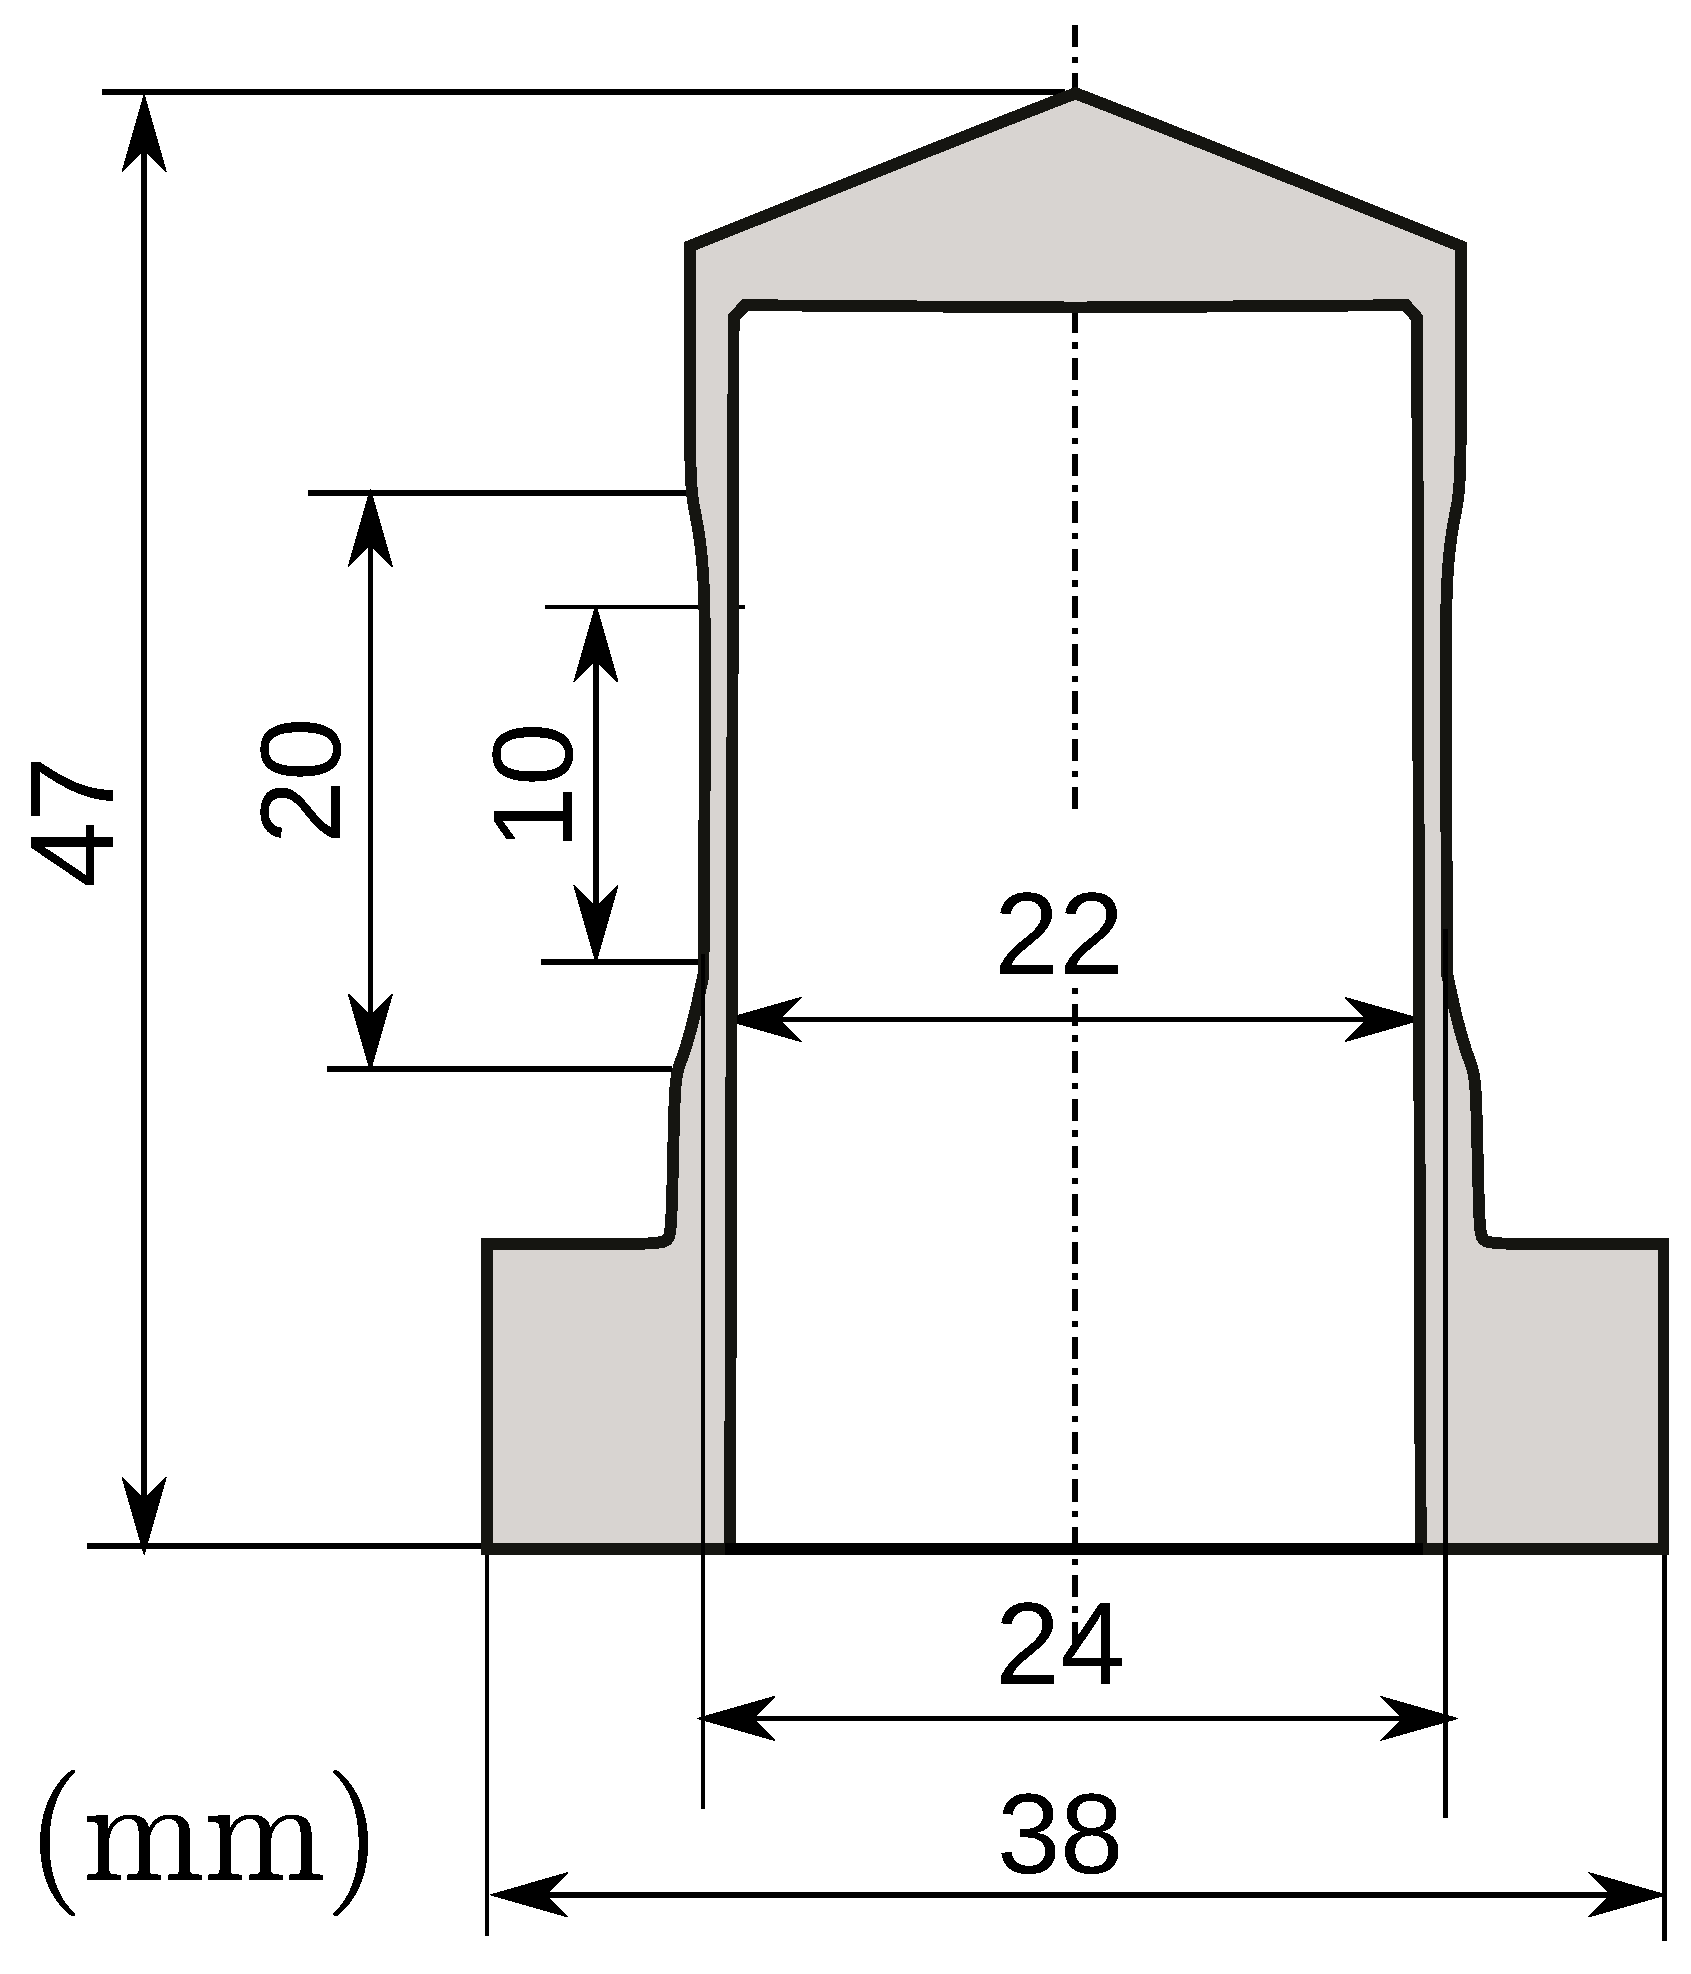
- Increase the inner diameter of the target to to prevent contact between the projectile and the target because of the striction phenomena during the impact and keep the thickness of the wall 24 mm ().
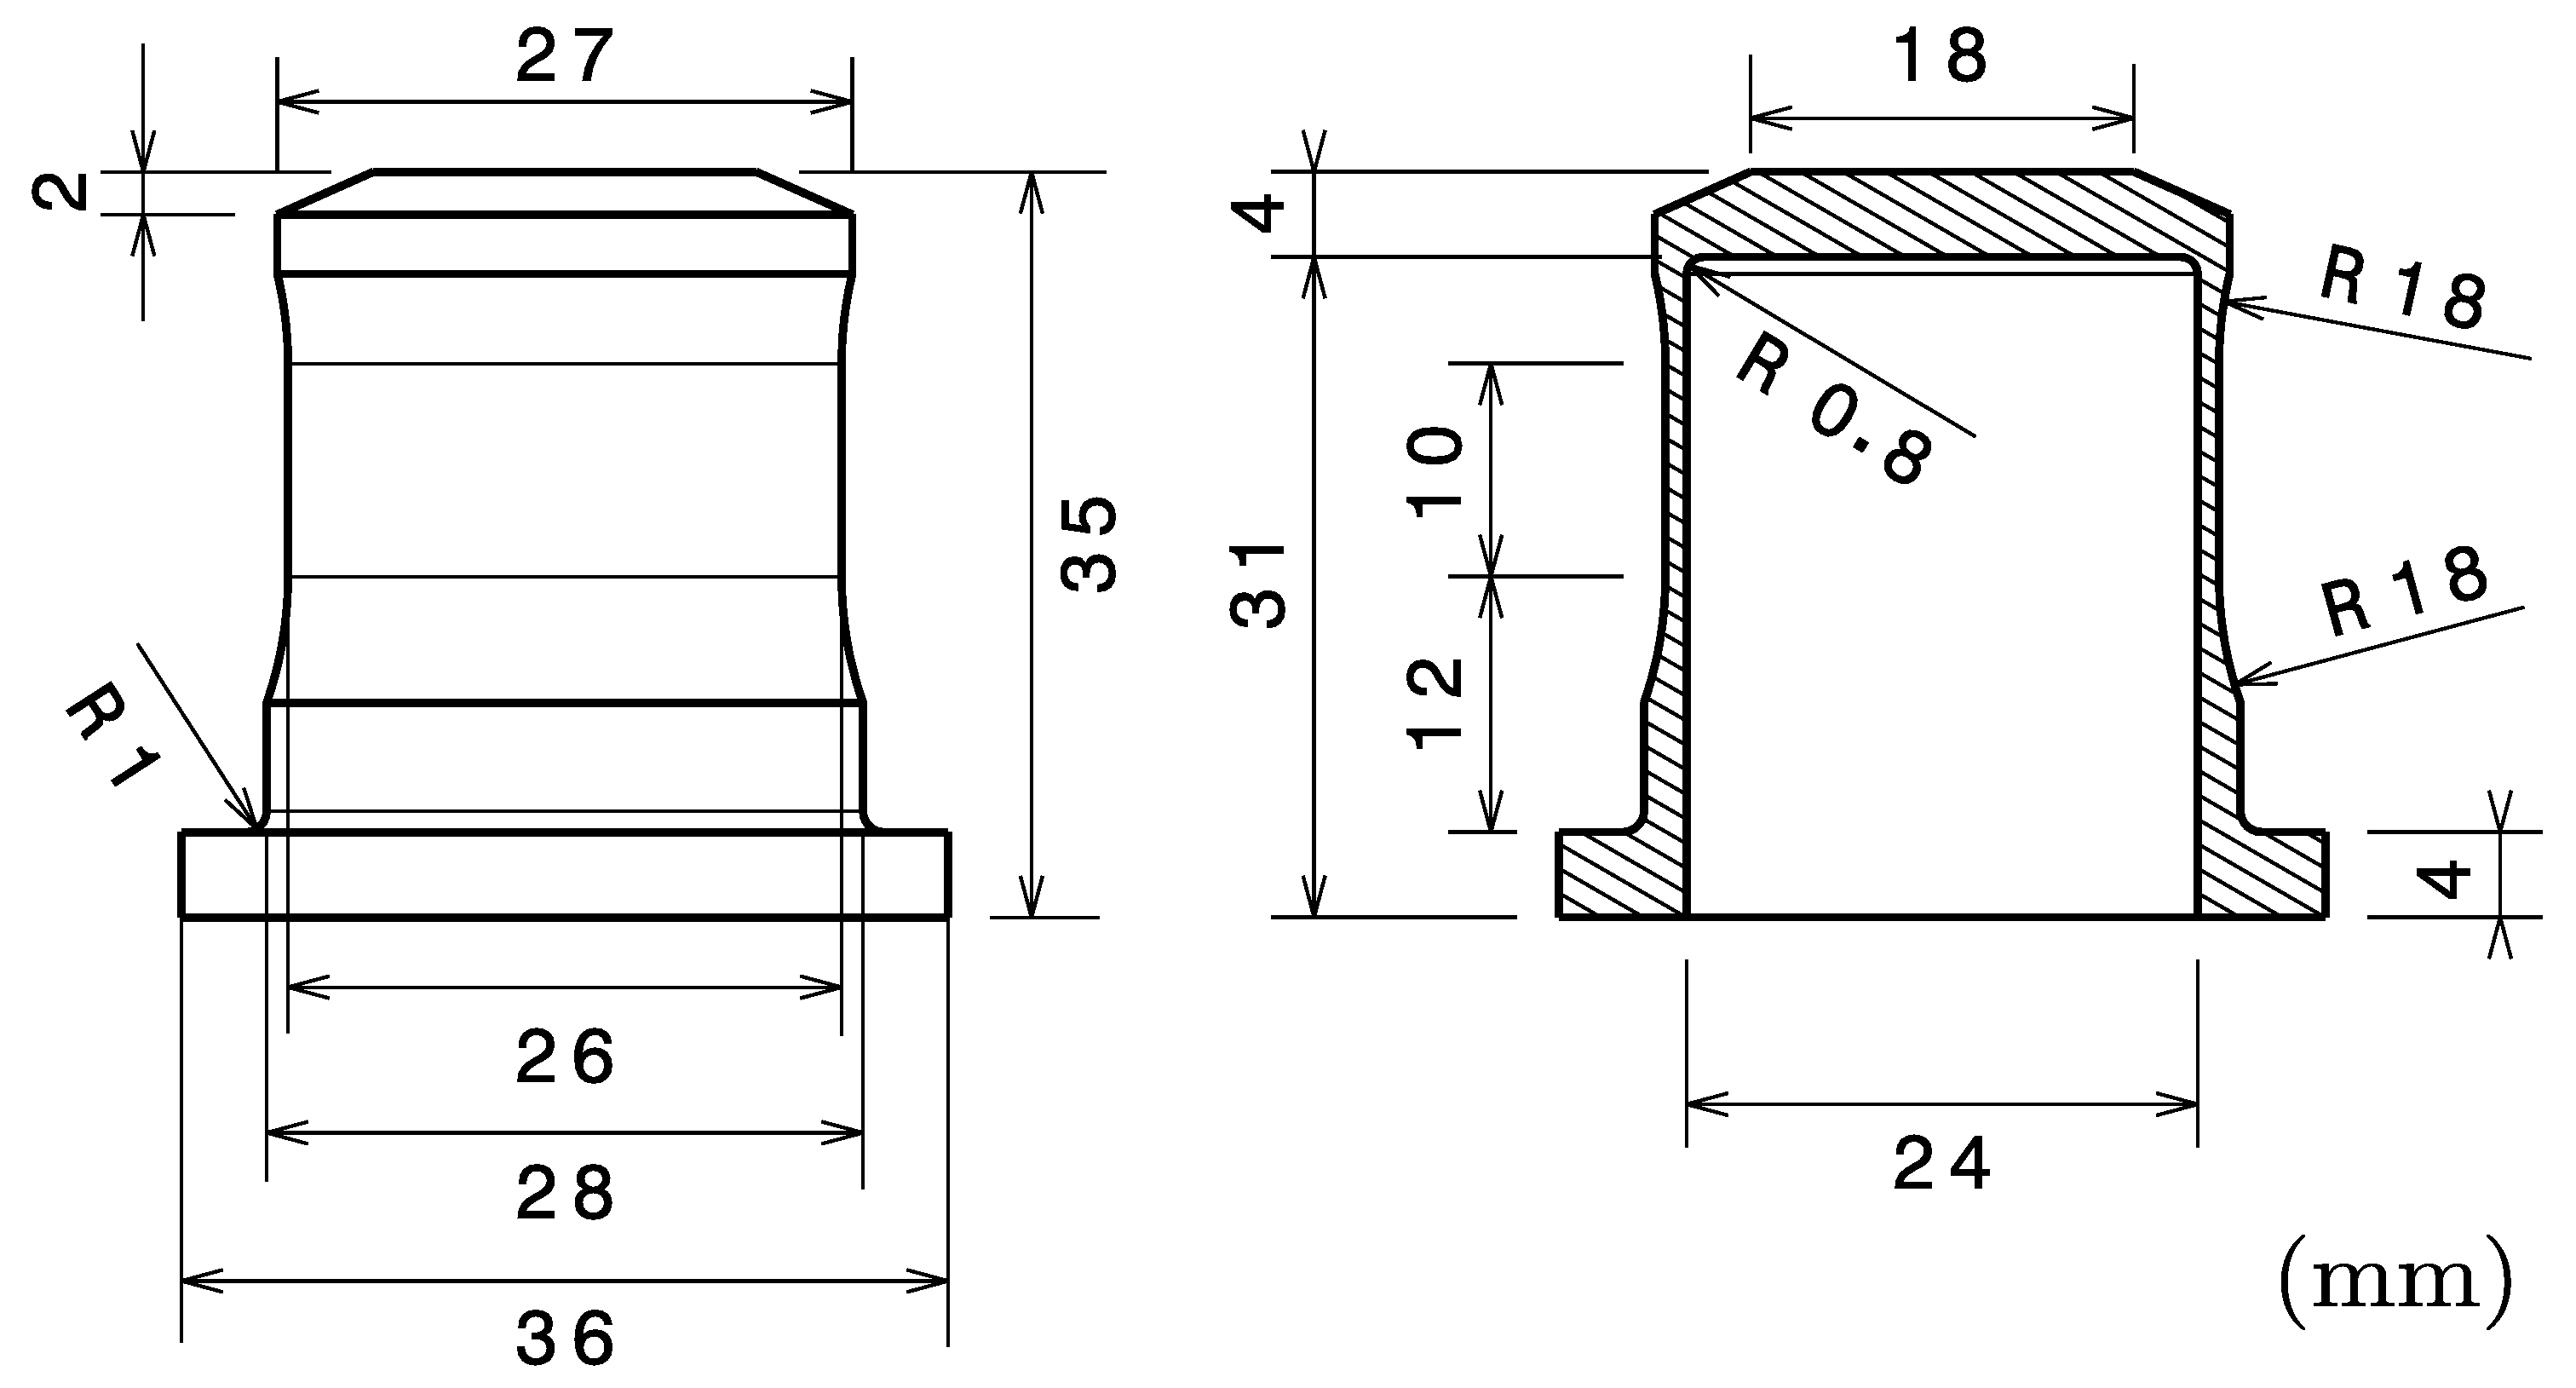
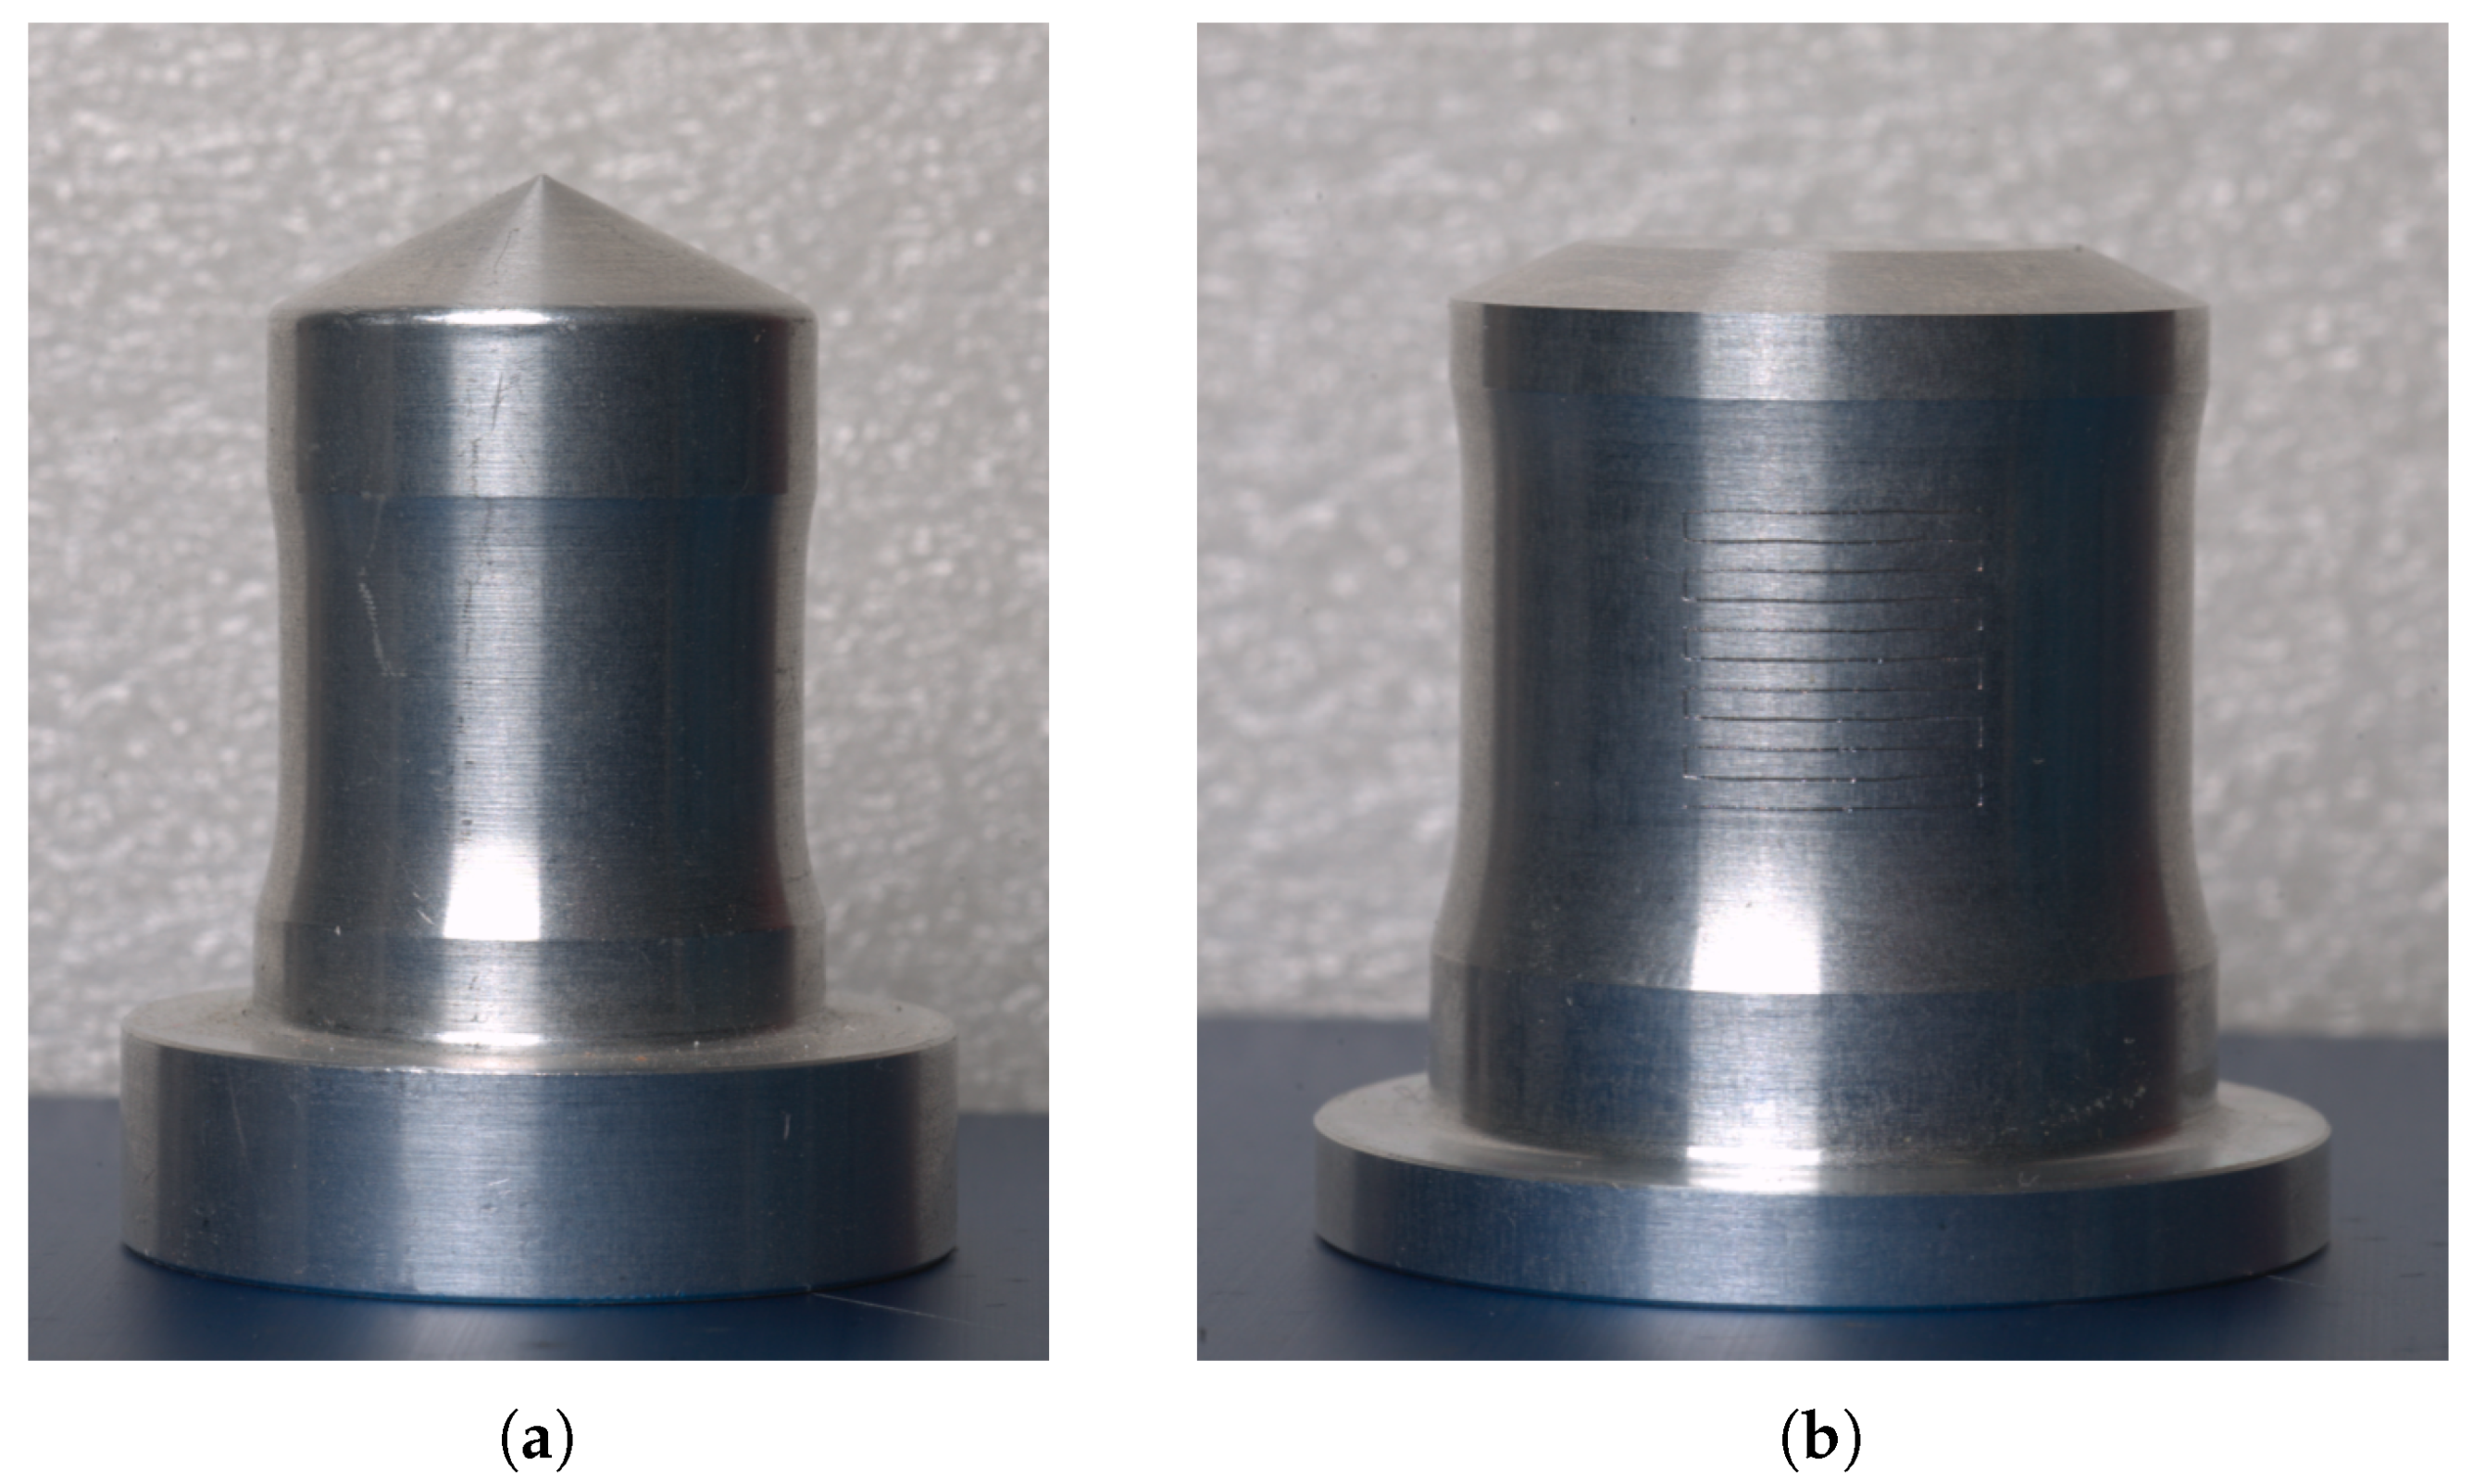
The optimization process used was based on the numerical simulation of the impact test, in which some dimensions of the target were defined as being able to vary within certain limits with an increment of in order to keep full dimensional values and to facilitate machining. The internal optimization software of the laboratory was then used to optimize these dimensions with the objective of decreasing the mass of the projectile, increasing the plastic deformation in the useful zone (within a certain limit in order not to lead to the rupture of the sample), for a fixed impact speed of . The semi-automatic process used in this study is not detailed here, only the final results are indicated. Figure 9 shows the final optimized geometry of the new target with the useful dimensions, while two photos showing a comparison of the external shape of both versions are presented in Figure 10. Target mass was reduced from to for a 2017-T3 aluminum target.
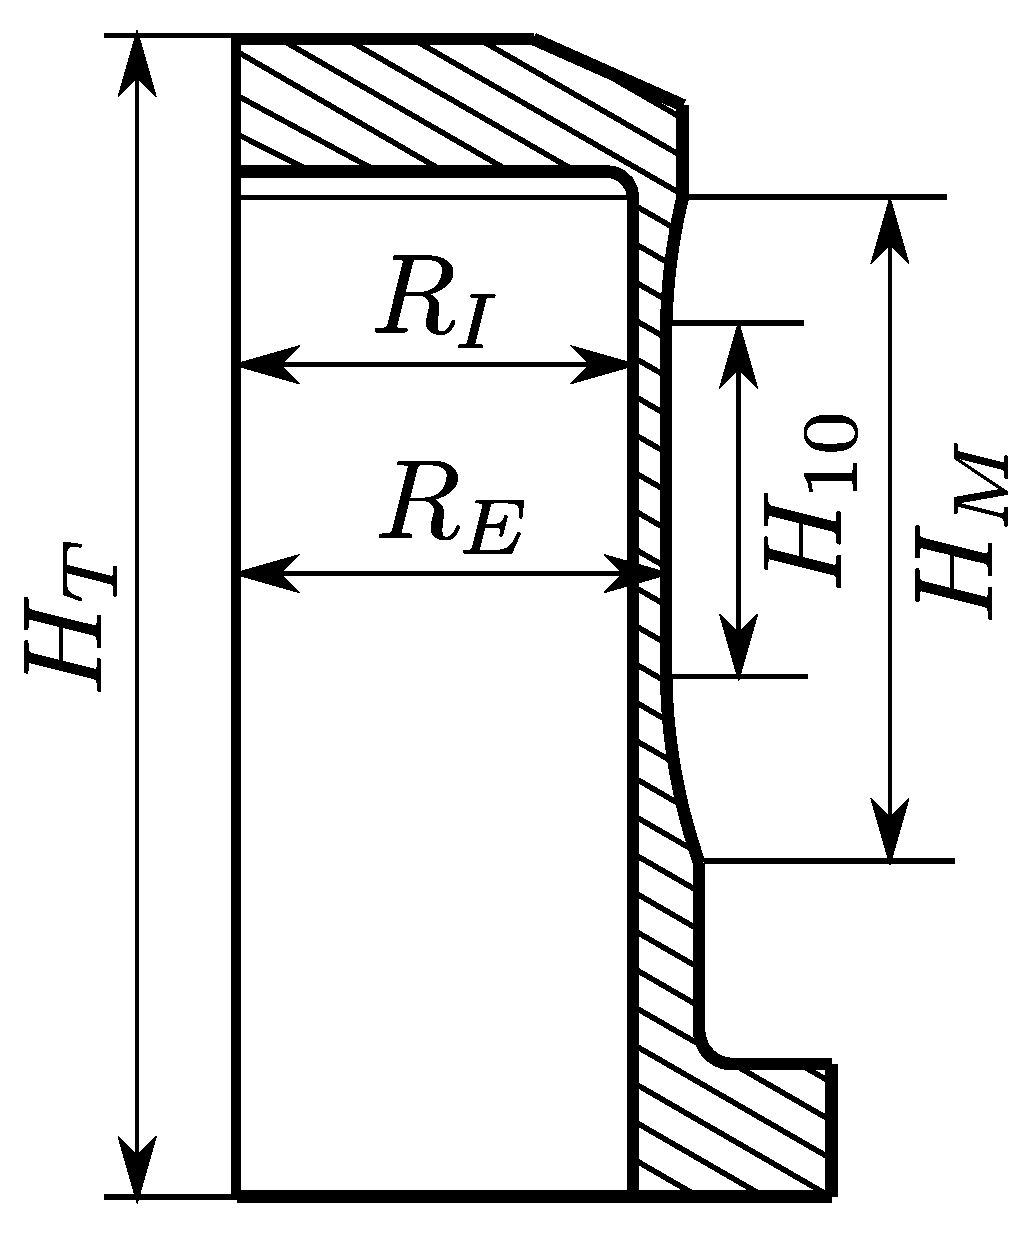
A post mortem measurement, after the impact, is carried out as an evaluation of the deformation where a set of five dimensions of the tensile target are chosen to characterize the final shape of the target, including three dimensions along the axial direction (, , and ) and two dimensions along the radial direction ( and ), as illustrated in Figure 11. is the total height of the specimen (initial value is ), is the distance between the two flat zones of the specimen (theoretical value is but it is hard to measure and precision is low because of tolerances in the machining process), is the initial length of the restricted zone (named after the fact that the initial length is ), and and are the internal and external radius of the specimen (initial values are and , respectively).
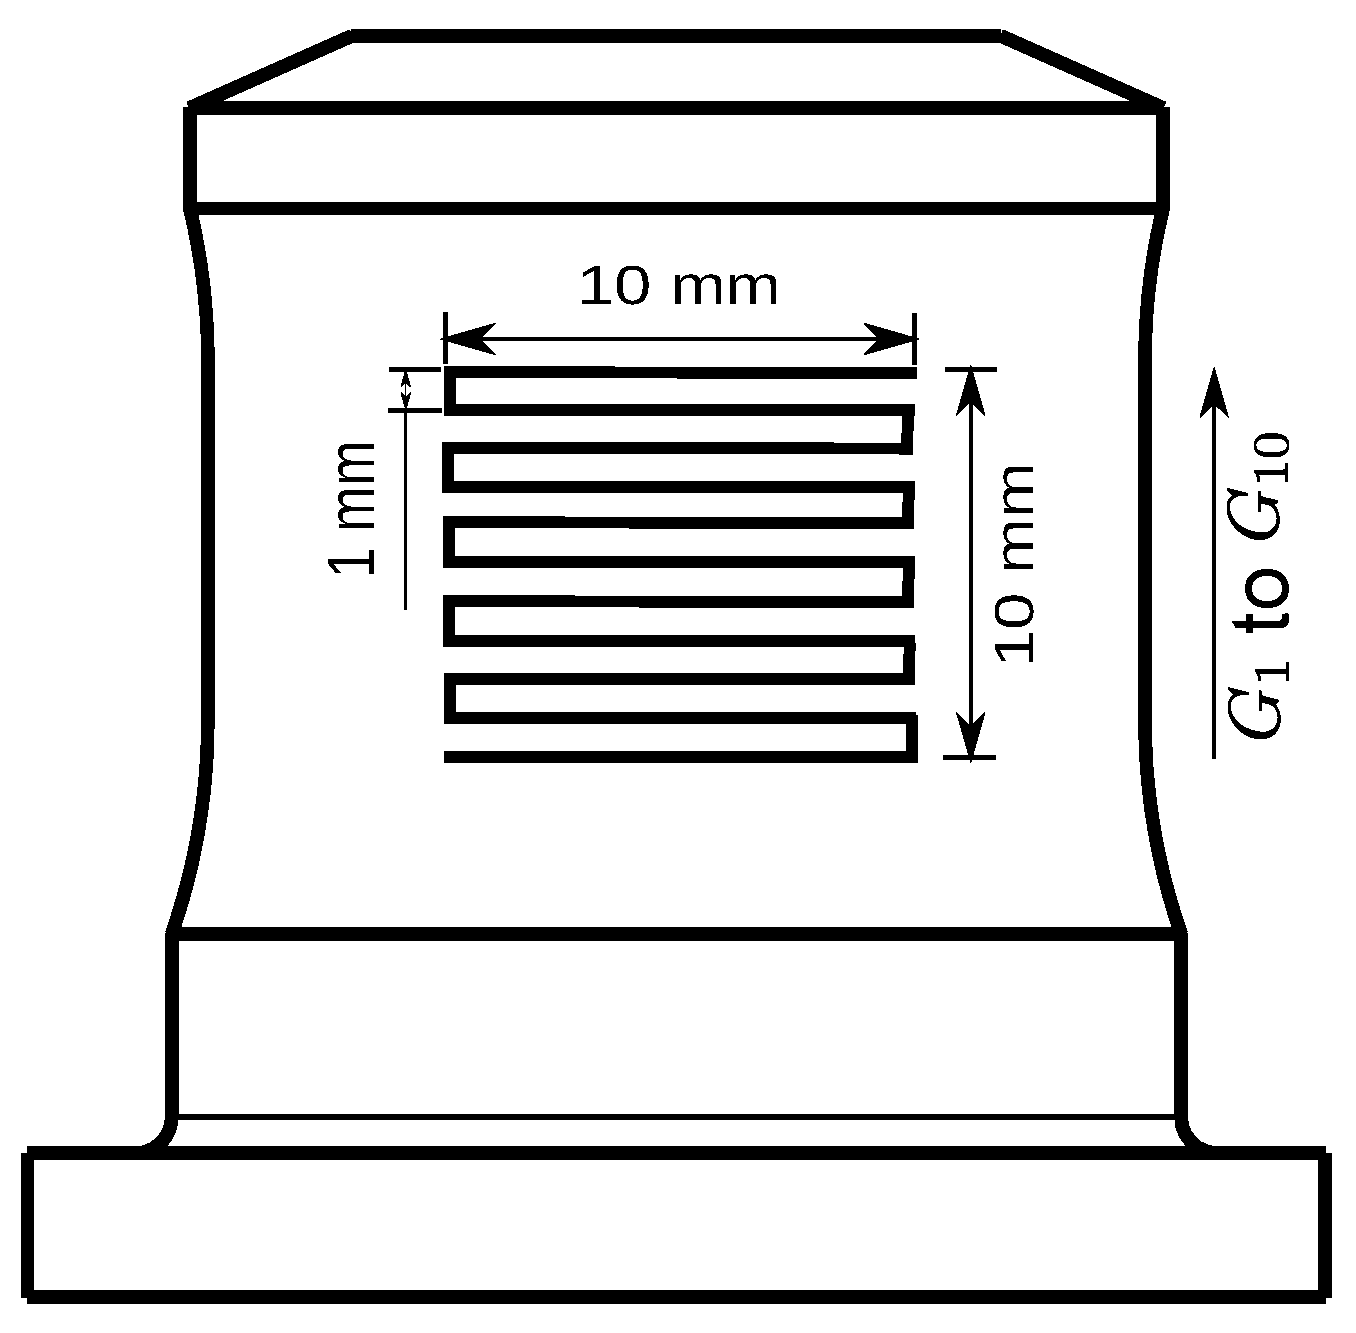
Before carrying out the dynamic tensile experiments, the outer surface of the optimized target, which corresponds to the length of referred to in Figure 11, is engraved by laser, as we can see in Figure 10b. The dimensions and shape of the engraved grid lines are reported in Figure 12. The purpose of this operation is to facilitate the geometrical measurement along the axial direction because without the grid lines there is no visible sign to locate in the center zone of the target before and after the impact due to the large values of the two radii at each end of the useful zone. The laser engraving is conducted by the 5-axis laser machine Trumpf Trulaser Cell 3000, where welding and cutting in two or three dimensions are allowed. The laser output for this engraving operation is , the axis speed is , and the thickness of the engraved line is . All the gaps between the 11 engraved lines are numbered from up to from the bottom to the top of the target, as reported in Figure 12.
3. Experimental Tests
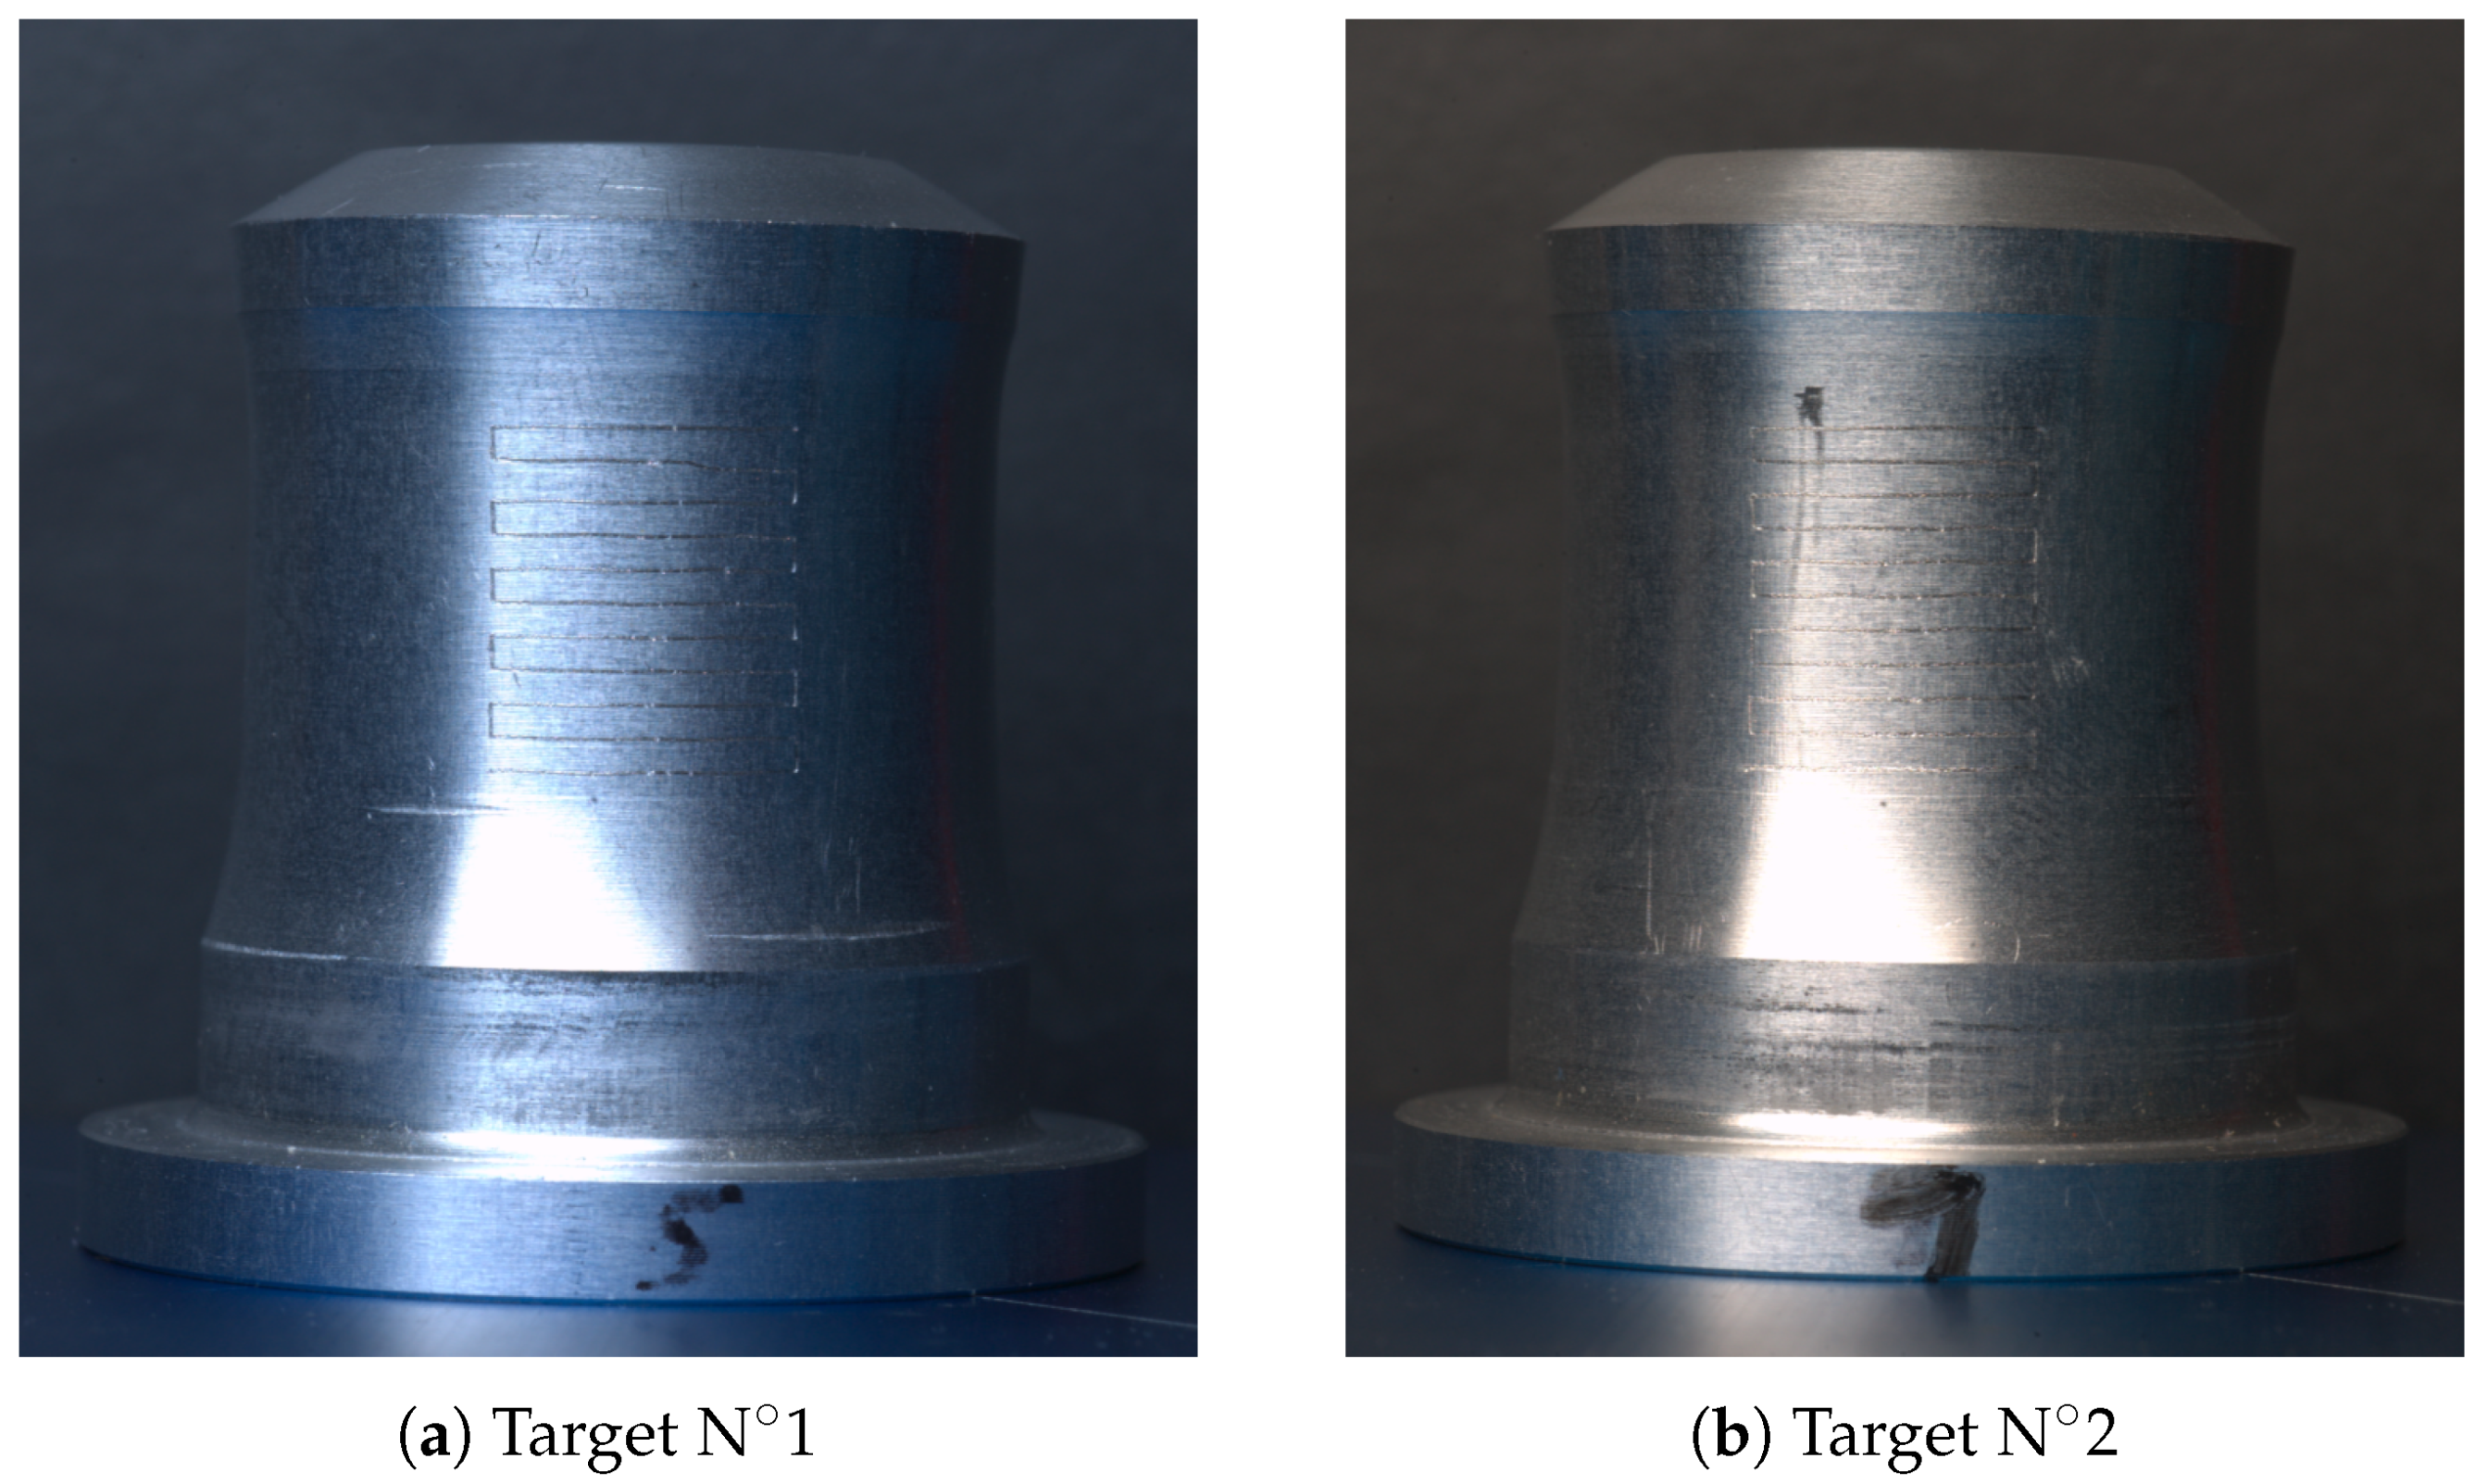
The dynamic tensile tests are conducted under different impact velocities , and three of them have been selected to be discussed in detail because the deformations of these targets are entirely representative. These targets are numbered from to in ascending order of the impact velocity from to . Their geometrical measurement before and after the impact, for the five representative measures defined in Section 2.2, are reported in Table 1. We first consider the results of the targets and . During the impact, they are stretched in the axial direction (, , and ) and shortened in the radial direction ( and ) due to the tensile deformation occurring in the useful zone of the specimen. Figure 13 shows some photos of their deformations and, as we can see from this later, both targets have been axisymmetrically deformed without rupture.
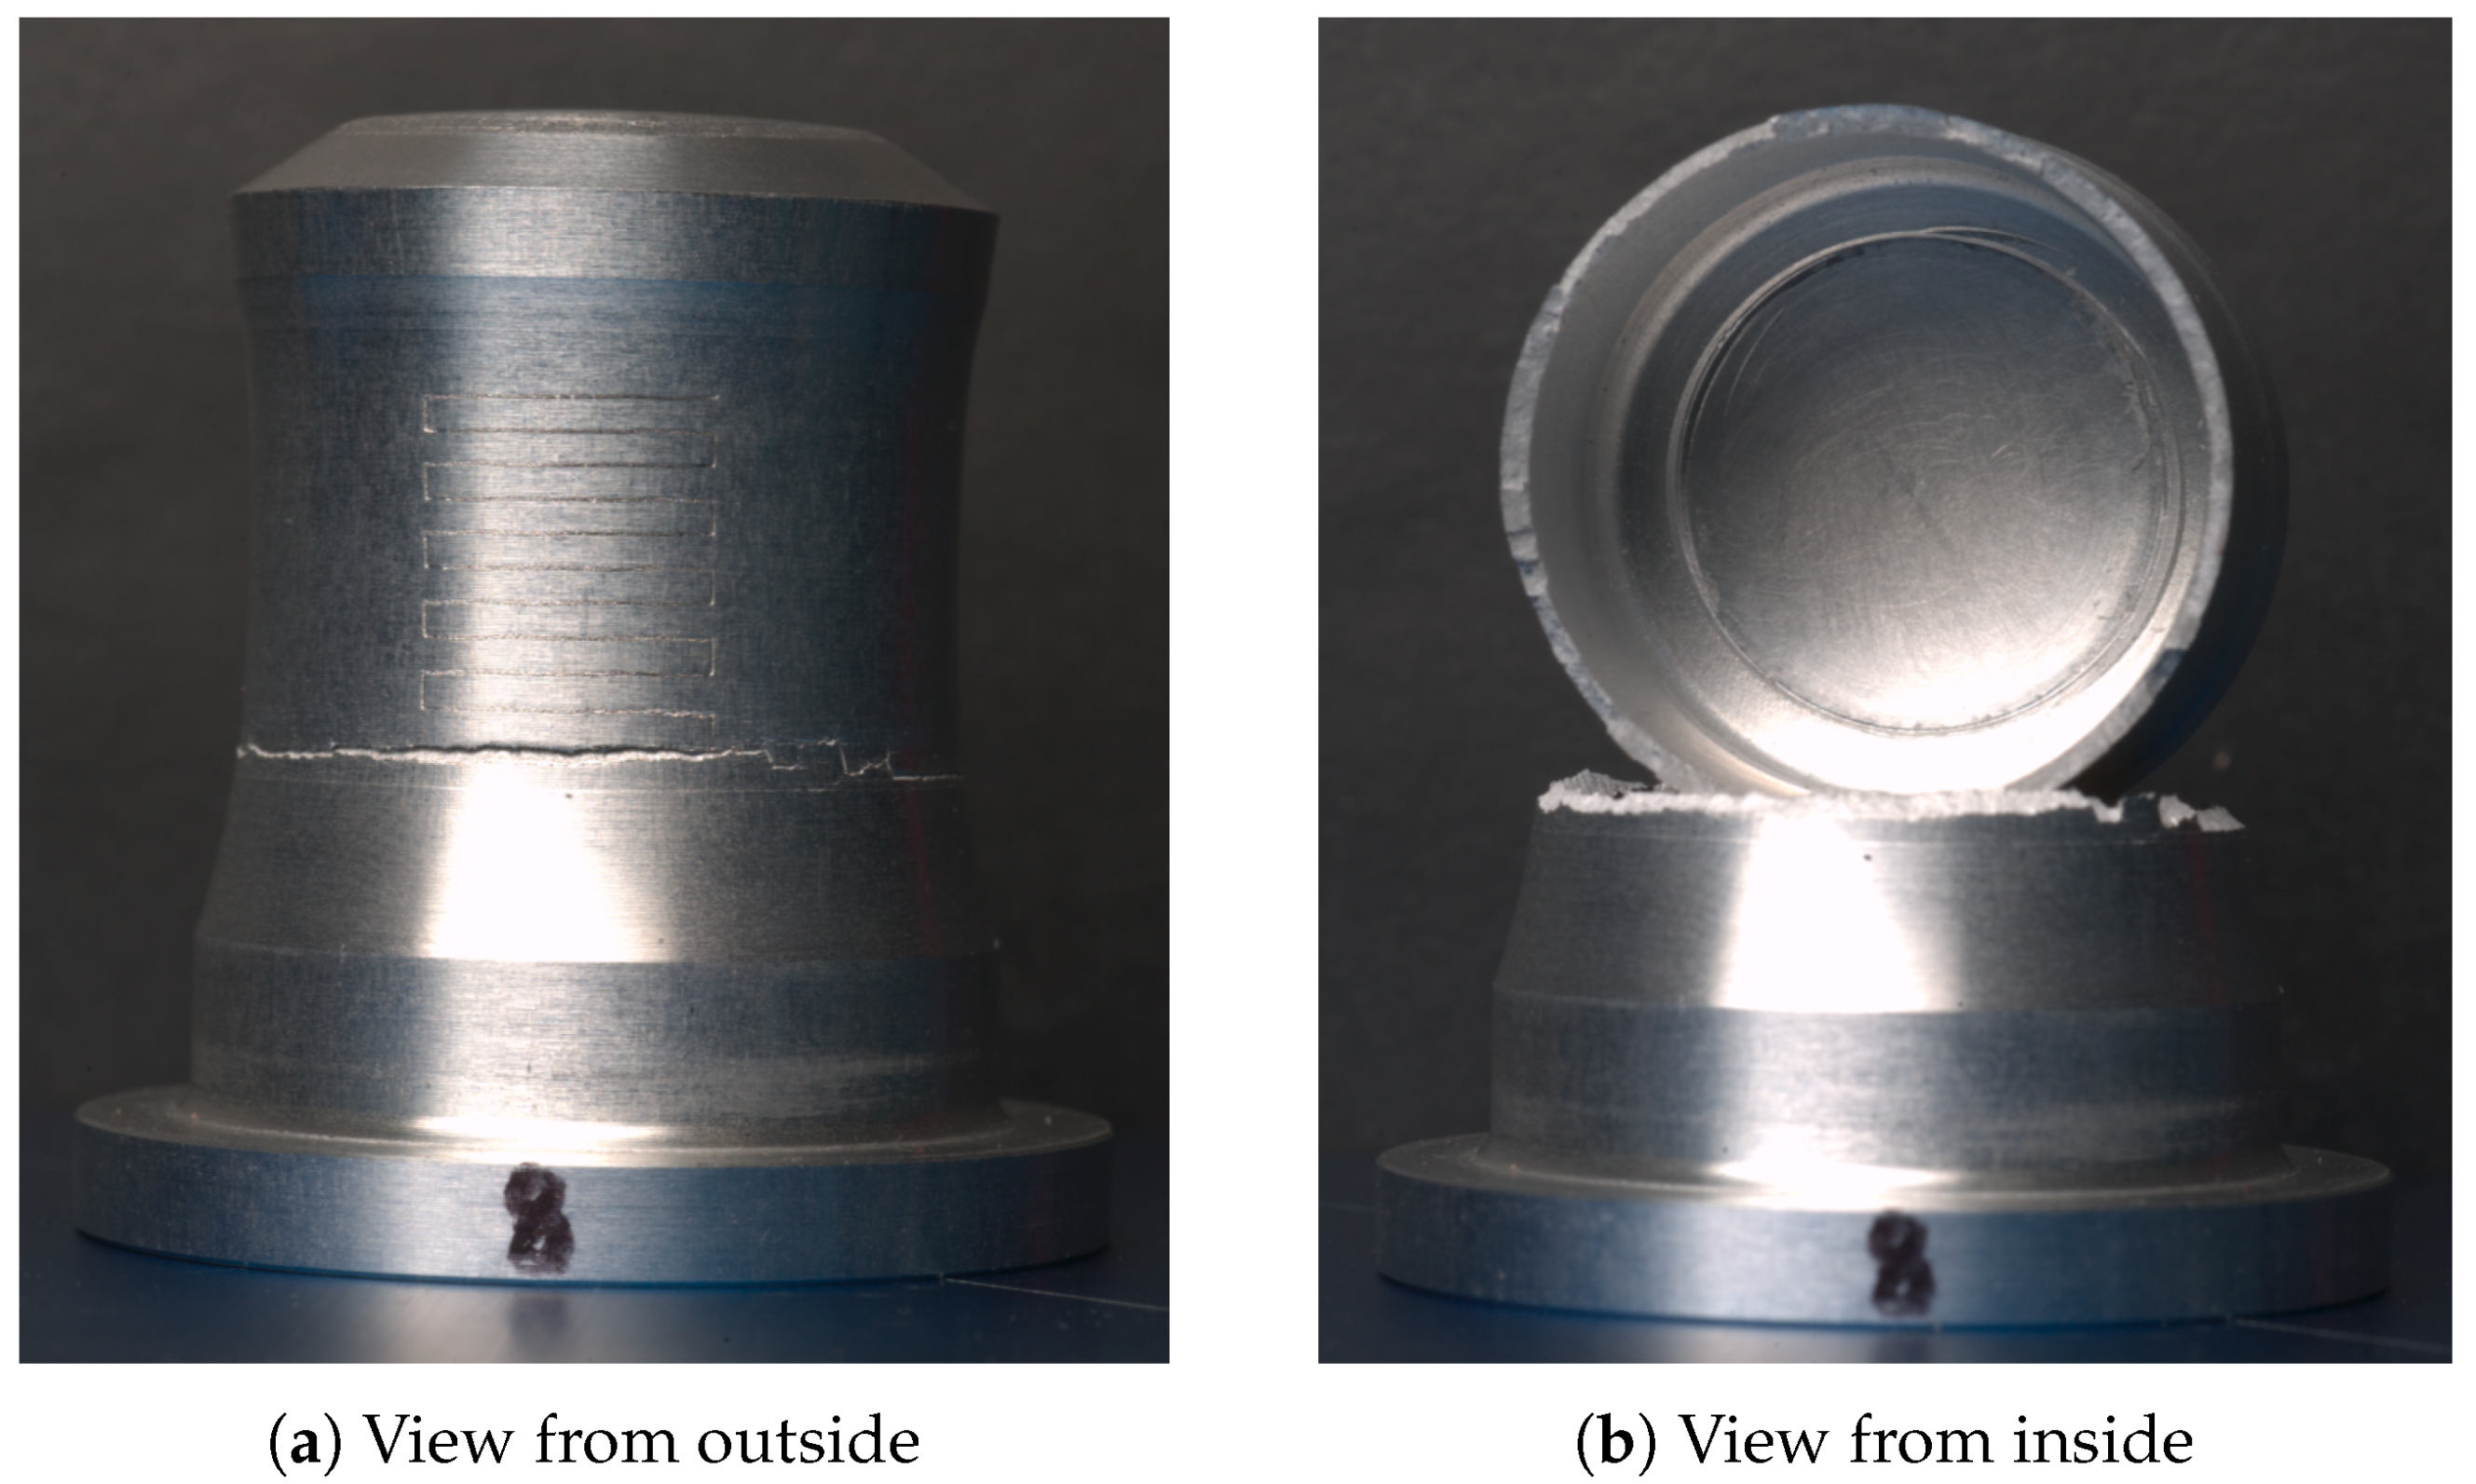
As for the target , there is a crack in the center zone since the impact velocity of exceeds the limit. Therefore, the results of the target in Table 1 are only rough estimates. Nevertheless, the deformation of the target is significant. From Figure 14a, we can see that the target is damaged in the center zone instead of being penetrated from the top zone. It proves that the thickness of the top zone of the optimized target is enough for the damage to occur first in the center zone. Figure 14b illustrates that the target is impacted axisymmetrically, which means the deformation of the target is also axisymmetric.
Moreover, the deformations of the center zone of the targets , , and are studied through the post mortem analysis. That is, the distances between every two grid lines are measured before and after deformation, respectively, using the homemade software imageAnalyser [22], in order to calculate the true strain. As shown in Figure 12, the gaps between the grid lines are marked from to in the order from the bottom to the top of the target. The deformed length of these gaps and the corresponding longitudinal strain are reported in Table 2 for the three targets. The longitudinal strain is calculated from
From the overall point of view, the true strain gradually decreases from to . For target , the longitudinal strain in the zone cannot be evaluated due to the presence of the crack.
4. Numerical Simulation of the Dynamic Tensile Test
In the numerical simulation of the dynamic tensile test section, we first validate the optimization of the tensile target, by comparing a simulation of the old and new versions of the tensile target using the finite element software Abaqus/Explicit [17].
4.1. Validation of the Optimized Design of the Target
The numerical models of the dynamic tensile test with the two targets are built, respectively, using Abaqus/Explicit to compare the deformations of the previous target and the new optimized target version. Due to the geometry of the structure, the 2D axisymmetric models are built separately. Each model consists of four parts: a polycarbonate sabot, a 42CrMo4 steel projectile, a 2017-T3 aluminum target, and a 42CrMo4 steel target holder. Both models are simulated under the same loading conditions. The widely used Johnson–Cook hardening flow law [23] was chosen to simulate the behavior of all materials. The Johnson–Cook hardening flow law is probably the most widely used flow law for the simulation of high strain rate deformation processes considering the effects of plastic strain, plastic strain rate, and temperature. Since many efforts have been made in the past to identify constitutive flow law parameters for many materials, it is implemented in many finite element codes such as Abaqus [17]. The general formulation of the Johnson–Cook yield stress depending of the plastic strain , the plastic strain rate , and the temperature T is given by the following equation:
where is the reference strain rate, and are the reference temperature and the melting temperature of the material, respectively, and A, B, C, n, and m are the five constitutive flow law parameters. The material properties for polycarbonate, 42CrMo4 steel, and 2017-T3 aluminum alloy are reported in Table 3.
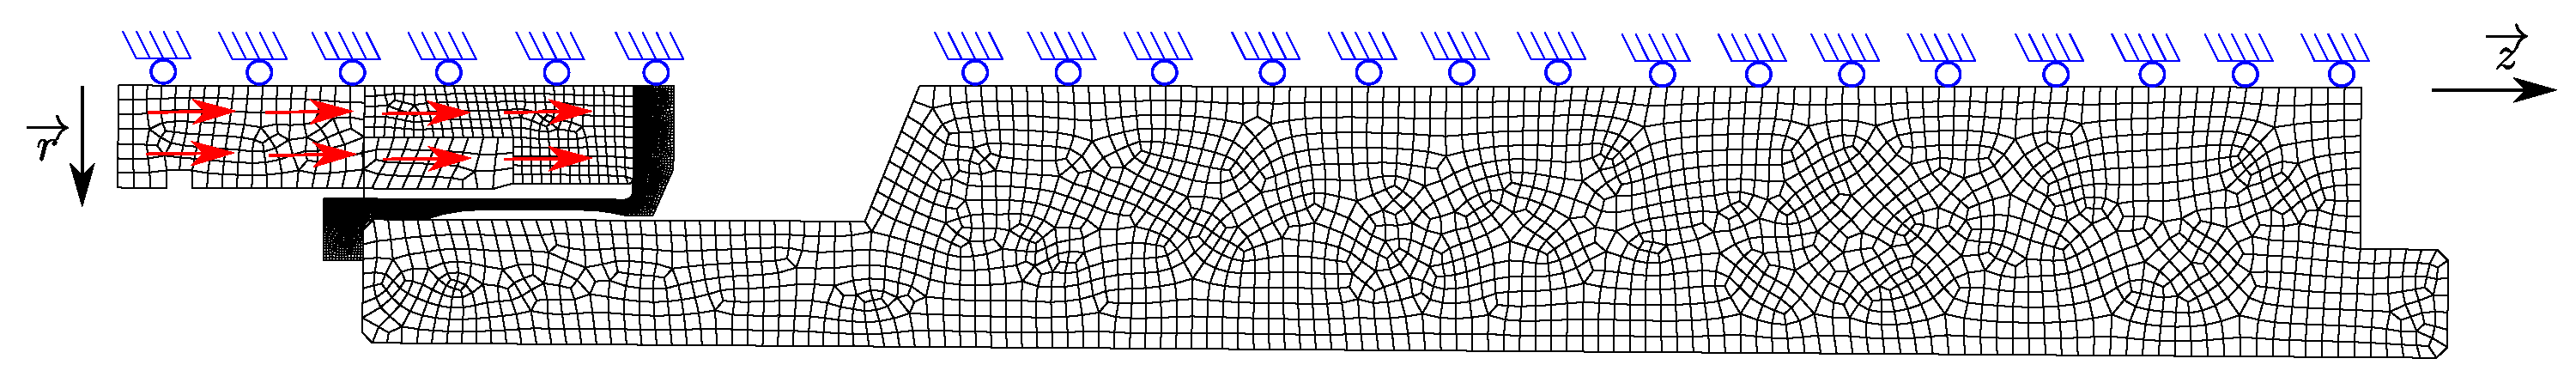
Here we take the complete model with the optimized target for example, as presented in Figure 15. Due to the compatibility of the inner and outer diameters of the target, the only difference between the two numerical models is the target. The three other parts of the model are identical between the two simulations. A predefined initial velocity of along the axis is applied to the projectile and the sabot. To simulate the actual boundary condition, the axial displacement of the target support is free during the impact. The sabot, projectile, tensile target, and target support consist of 169, 240, 3814, and 2190 CAX4RT elements, respectively (the mesh of the previous version of the target consists of 4963 CAX4RT elements). The total simulation time is kept the same for both models with .
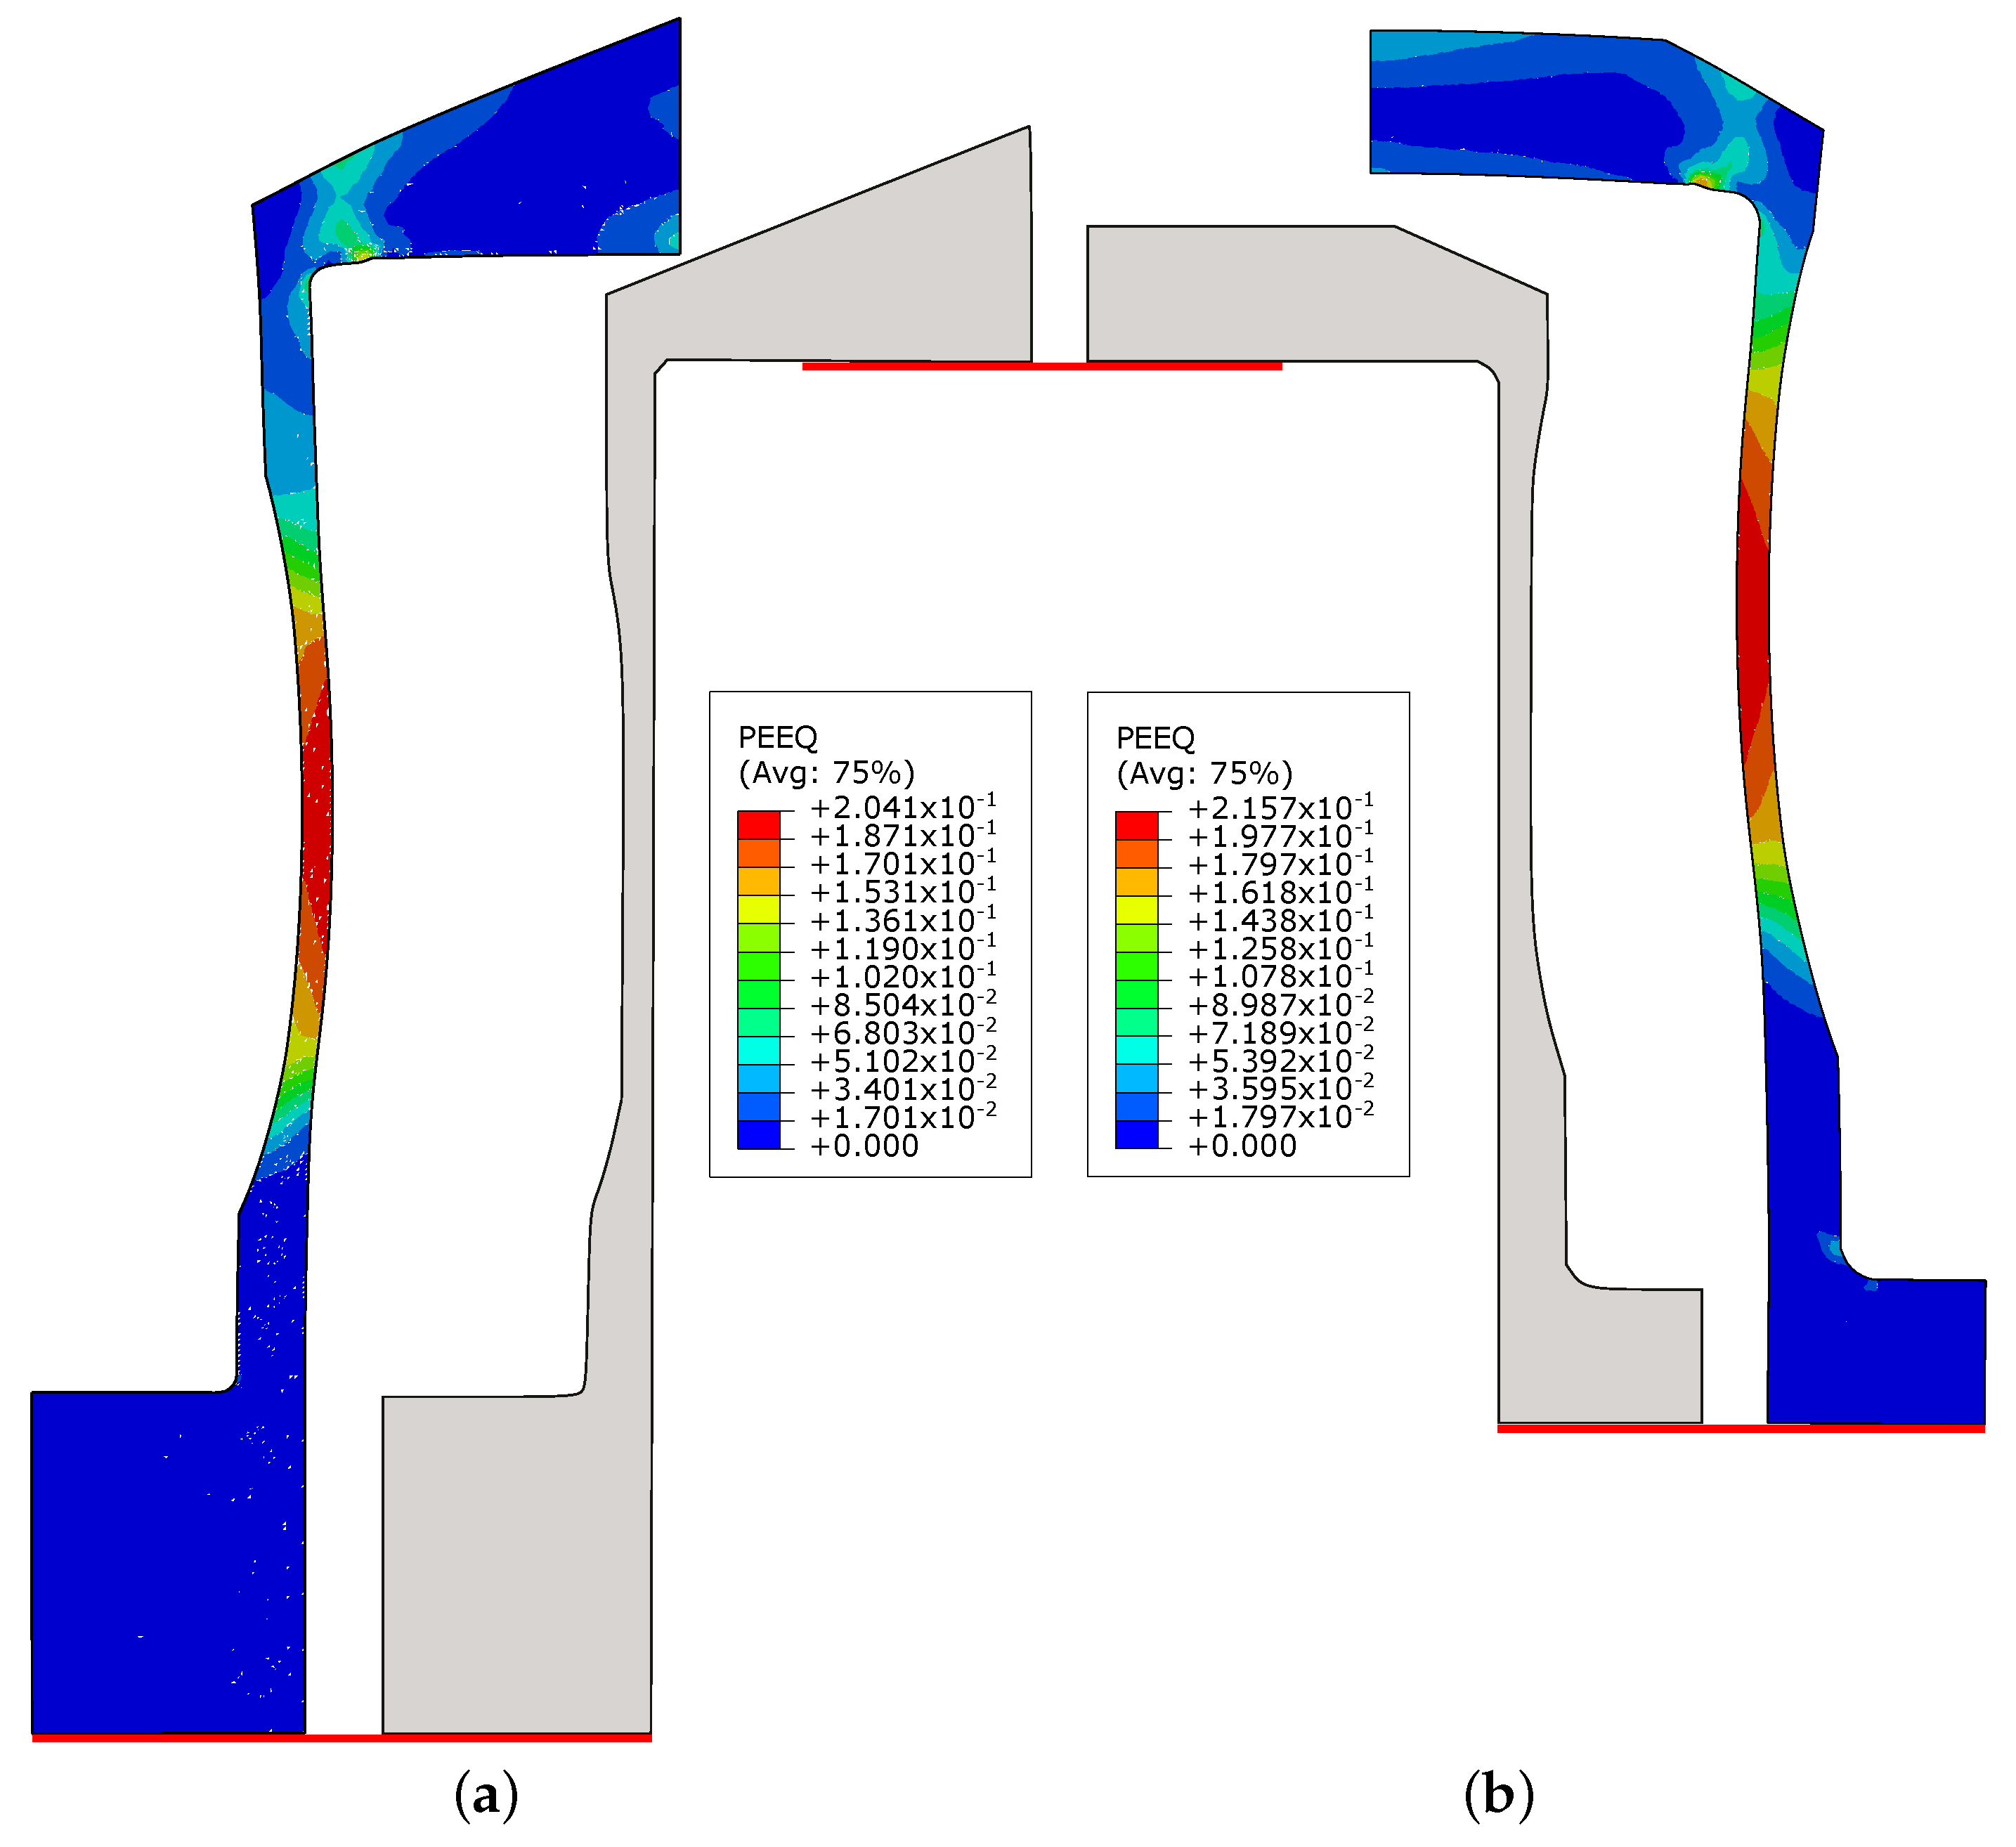
The deformations of the two targets are compared in Figure 16. The undeformed previous target and its equivalent plastic strain contour plot are shown on the left side, while the undeformed optimized target and its equivalent plastic strain contour plot are shown on the right side. The maximum strain rate is more or less the same for both models, its value is around and it decreases during the deformation of the target up to zero for more or less (when the final geometry of the target obtained).
As we can see, plastic deformations mainly occur in the useful zones of the two targets. The maximum equivalent plastic strains of the previous and optimized targets are and separately, which indicates that strain concentration is equivalent while the total elongation of the target has been increased under the same loading conditions. Moreover, in Figure 16, the bottoms of the two undeformed targets, the tops of the two previous targets, and the tops of the two optimized targets are aligned (marked by the red lines in Figure 16), respectively, in order to compare their elongation directly. Since the bottom of the deformed new target is lower than the bottom of the deformed previous one, the optimized target can achieve more elongation. In summary, compared with the previous target, the optimized target can achieve less strain concentration in the useful zone, which can avoid necking, rupture, and large deformation in a shorter distance.
4.2. Alignment of the Target and the Projectile
An important point concerns the alignment of the target with the projectile. Indeed, the axisymmetric character of the test is a critical thing to take into account in order to have the deformation of the target be as homogeneous as possible. A 3D numerical simulation of an impact with a misalignment factor of and an impact speed of was performed to show the effect of a misalignment of the target and the impactor. Results concerning the equivalent plastic strain are reported in Figure 17.
From this, it can be seen that the equivalent plastic strain in the useful zone is not constant and varies with respect to the angular position from a minimum value of up to whereas, the same simulation with a perfect alignment of the projectile and the target gives a constant value for the equivalent plastic strain of . The proposed simulation shows the importance to have a good alignment of the target and the projectile for this kind of test. This alignment is checked a posteriori by verifying that the projectile’s imprint is centered at the level of the specimen’s cap, as shown in Figure 14b.
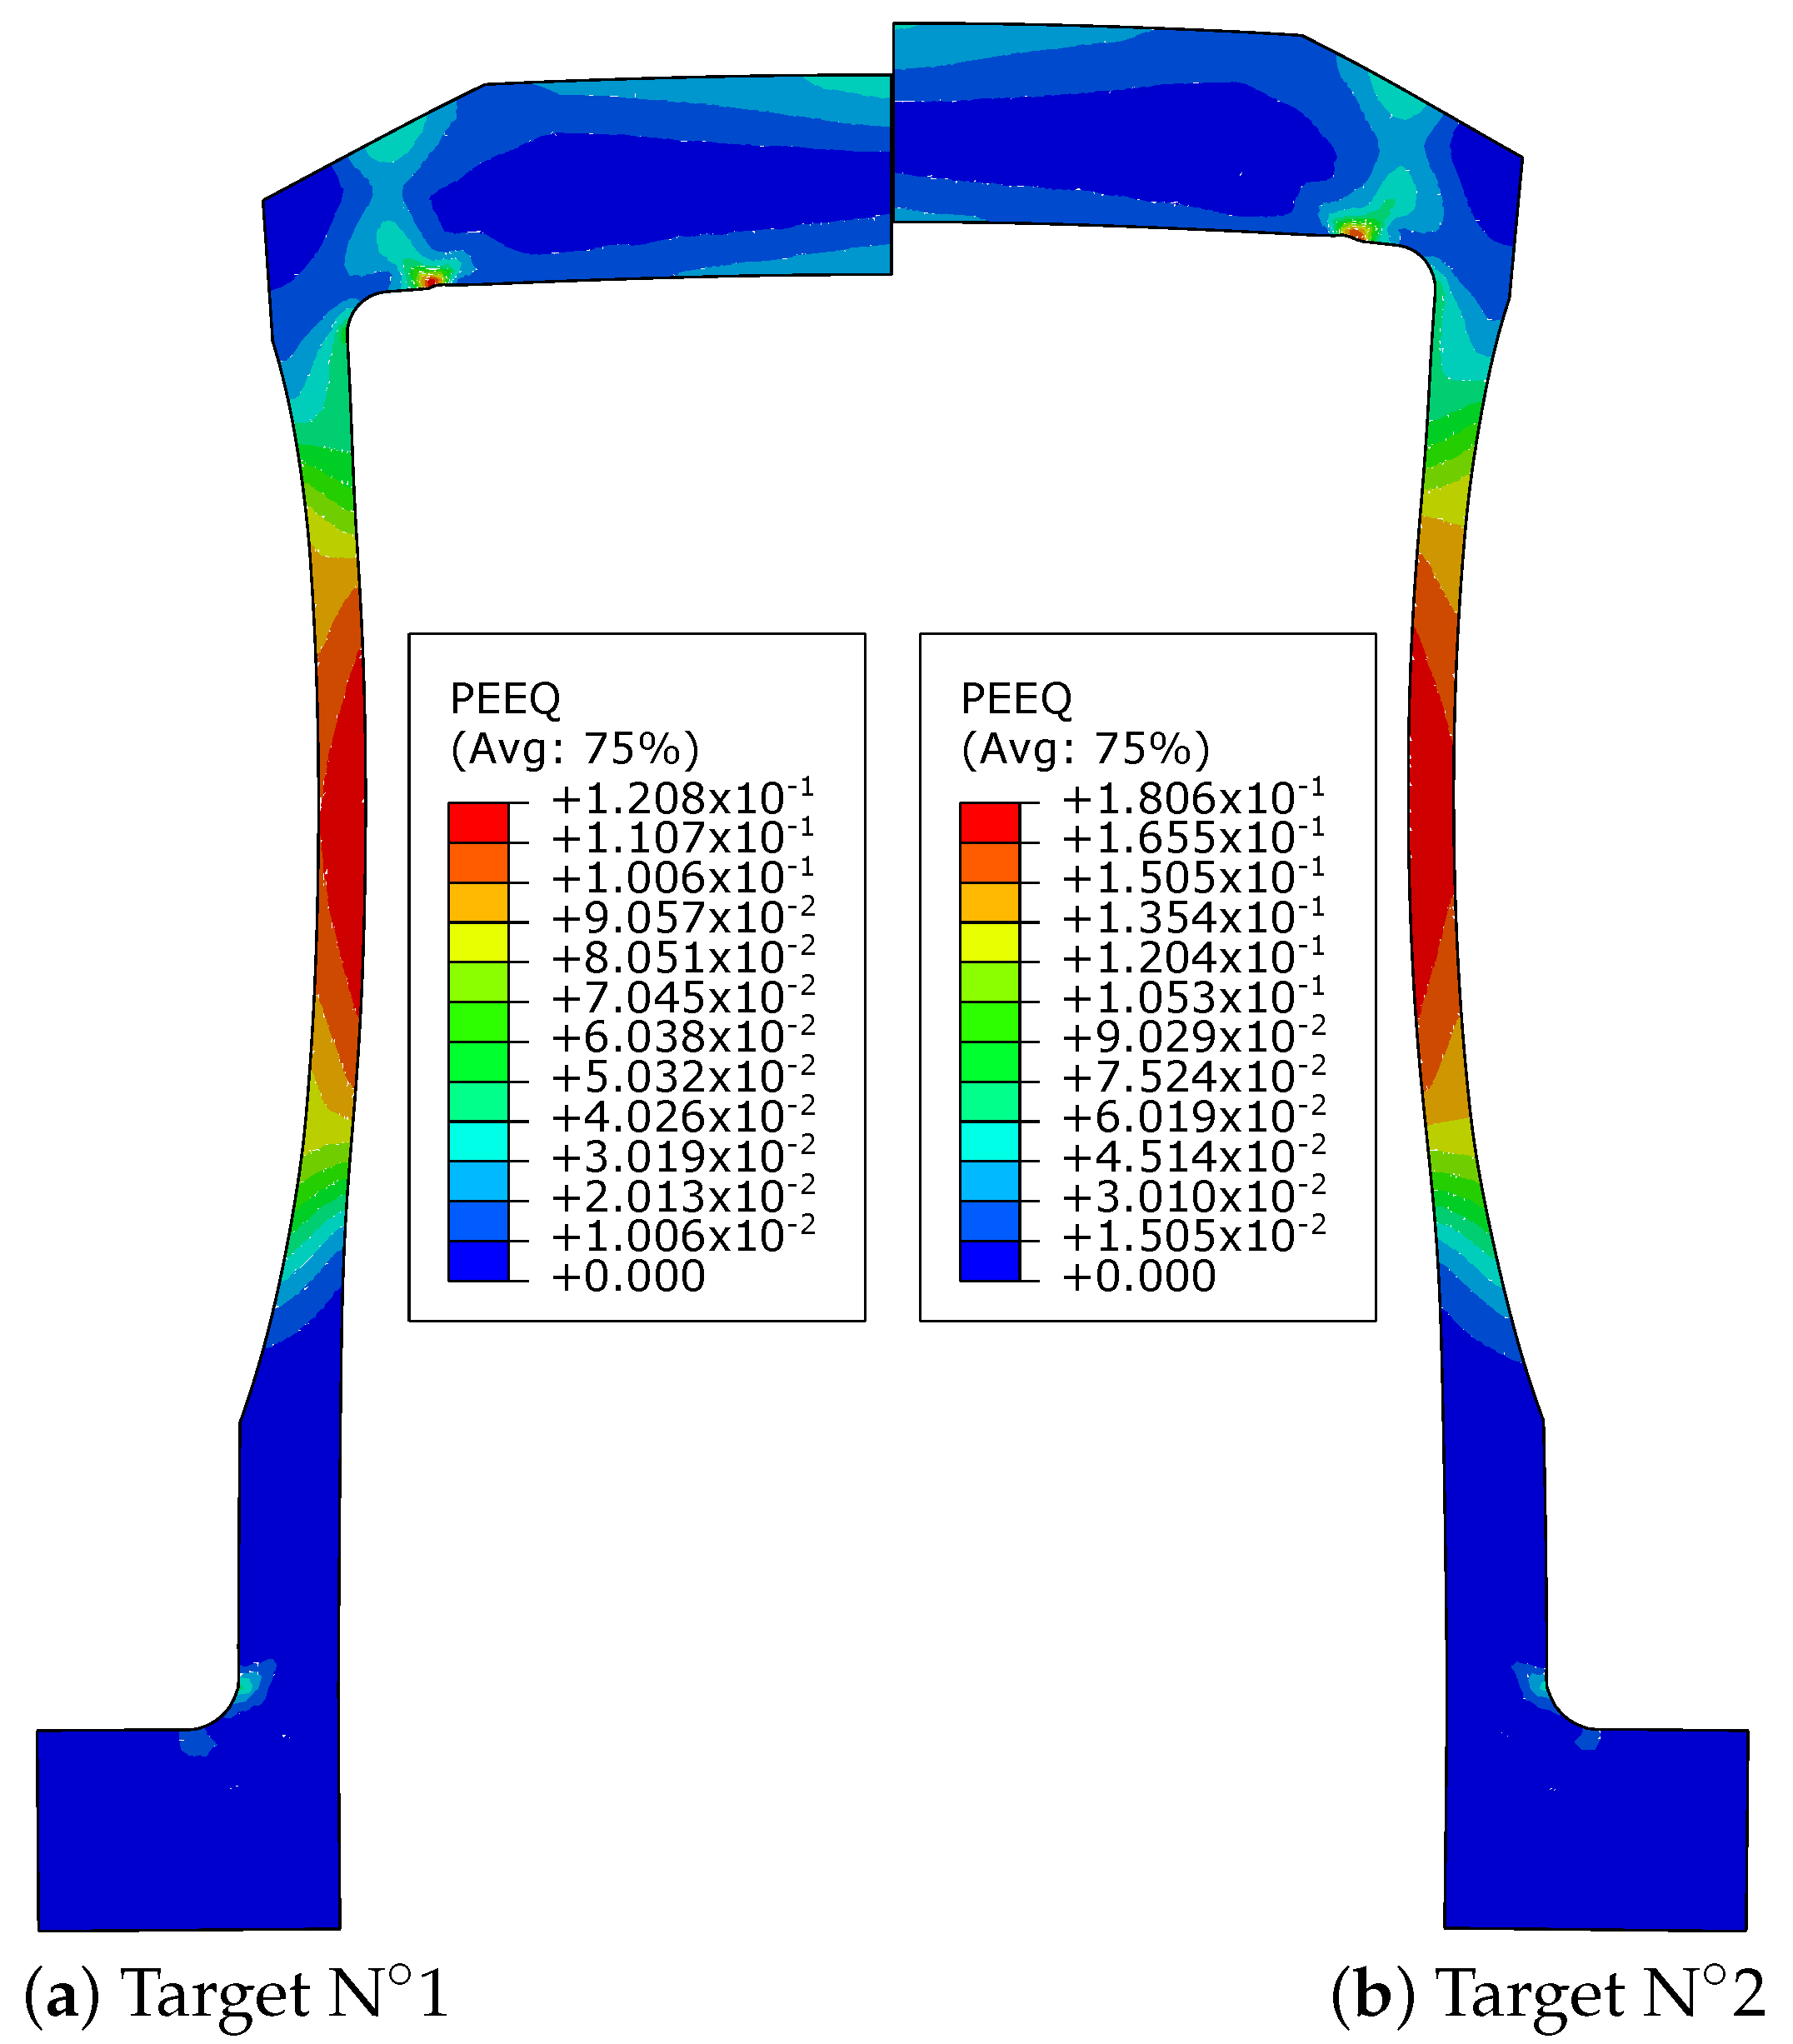
4.3. Numerical Simulation of the Experiments
Figure 18 shows the equivalent plastic strain contour plots for both targets and . The difference in elongation of the specimen is visible in this figure. Table 4 reports a comparison of the experimental results vs. the numerical solution concerning the five measuring dimensions reported in Figure 11. A good agreement of experimental and numerical measures has been found for both targets with a relative error of less than . This error is the accumulation of several factors that are currently not mastered: the tolerance concerning the dimensional measurements of the target after impact, the adequacy of the Johnson–Cook behavior law and its parameters with respect to the material considered, as well as the numerous numerical modeling hypotheses related to the finite element models on Abaqus.
5. Conclusions
The target of the dynamic tensile test proposed for characterizing the behavior of materials subjected to dynamic traction has been optimized. The optimization was validated by the numerical simulations and experimental tests presented in this paper. The complete numerical models of the dynamic tensile test with previous and optimized targets were established, respectively, to compare the equivalent plastic strains and elongation of the two targets. The dynamic tensile experimental tests were conducted under different impact velocities, and the final deformed shapes of three representative targets were discussed. Compared with the previous version, the optimized target can achieve less strain concentration in the useful zone which can avoid necking, rupture, and more substantial deformation in a shorter distance. The optimized geometry can make the target first damaged in the center zone instead of being penetrated from the top zone.
Author Contributions
Conceptualization, O.P.; methodology, O.P.; software, O.P.; validation, O.P. and L.M.; formal analysis, O.P. and L.M.; investigation, O.P. and L.M.; resources, O.P.; data curation, O.P. and L.M.; writing—original draft preparation, L.M.; writing—review and editing, O.P.; visualization, O.P. and L.M.; supervision, O.P.; project administration, O.P.; funding acquisition, O.P. All authors have read and agreed to the published version of the manuscript.
Funding
This research was funded by China Scholarship Council (CSC) under Grant number CSC n°201406290010.
Institutional Review Board Statement
Not applicable.
Informed Consent Statement
Not applicable.
Data Availability Statement
Data are accessible by contacting the corresponding author.
Conflicts of Interest
The authors declare no conflict of interest.
References
- Staab, G.; Gilat, A. A direct-tension split Hopkinson bar for high strain-rate testing. Exp. Mech. 1991, 31, 232–235. [Google Scholar] [CrossRef]
- Gilat, A.; Schmidt, T.; Walker, A. Full field strain measurement in compression and tensile split Hopkinson bar experiments. Exp. Mech. 2009, 49, 291–302. [Google Scholar] [CrossRef]
- Chen, X.; Peng, Y.; Peng, S.; Yao, S.; Chen, C.; Xu, P. Flow and fracture behavior of aluminum alloy 6082-T6 at different tensile strain rates and triaxialities. PLoS ONE 2017, 12, 1–28. [Google Scholar] [CrossRef] [PubMed]
- Anatoly, B.; Alexander, K.; Leopold, K.; Andrey, L.; Andrey, F. Dynamic properties of stainless steel under direct tension loading using a simple gas gun. EPJ Web Conf. 2018, 183, 02035. [Google Scholar] [CrossRef]
- Yan, Z.; Wang, L.; Xu, X.; Zhou, Z.; Liu, A.; Ning, Z. Response of Ti6321 titanium alloy at different strain rates under tensile loading. Mater. Sci. Technol. 2022, 38, 1037–1045. [Google Scholar] [CrossRef]
- Lew, A.; Kingstedt, O.T. A Joule Heated High-Temperature Tensile Split Hopkinson Pressure Bar. Exp. Mech. 2022, 62, 1163–1174. [Google Scholar] [CrossRef]
- Kolsky, H. An investigation of the mechanical properties of materials at very high rates of loading. Proc. Phys. Soc. Sect. B 1949, 62, 676. [Google Scholar] [CrossRef]
- Nicholas, T. Tensile testing of materials at high rates of strain. Exp. Mech. 1981, 21, 177–185. [Google Scholar] [CrossRef]
- Liu, C.; Wang, W.; Suo, T.; Tang, Z.; Guo, Y.; Li, Y. Achieving Combined Tension-Torsion Split Hopkinson Bar test based on electromagnetic loading. Int. J. Impact Eng. 2022, 168, 104287. [Google Scholar] [CrossRef]
- Sturges, J.; Cole, B. The flying wedge: A method for high-strain-rate tensile testing. Part 1. Reasons for its development and general description. Int. J. Impact Eng. 2001, 25, 251–264. [Google Scholar] [CrossRef]
- Bonora, N.; Milella, P. Simulation of Ductile Failure in Metals under Dynamic Loading Conditions Using Advanced Material Damage Modeling; Technical Report; Dipartimento di Meccanica Strutture Ambiente e Territorio, Cassino University: Cassino, Italy, 2004. [Google Scholar]
- Froustey, C.; Lambert, M.; Charles, J.L.; Lataillade, J.L. Design of an Impact Loading Machine Based on a Flywheel Device: Application to the Fatigue Resistance of the High Rate Pre-straining Sensitivity of Aluminium Alloys. Exp. Mech. 2007, 47, 709–721. [Google Scholar] [CrossRef]
- Taylor, G. The use of flat-ended projectiles for determining dynamic yield stress. I. Theoretical considerations. Proc. R. Soc. Lond. A Math. Phys. Eng. Sci. R. Soc. 1948, 194, 289–299. [Google Scholar]
- Anderson, C., Jr.; Nicholls, A.; Chocron, I.; Ryckman, R. Taylor anvil impact. In AIP Conference Proceedings; American Institute of Physics: College Park, MD, USA, 2006; Volume 845, pp. 1367–1370. [Google Scholar] [CrossRef]
- Holt, W.; Mock, W.; Zerilli, F.; Clark, J. Experimental and computational study of the impact deformation of titanium Taylor cylinder specimens. Mech. Mater. 1994, 17, 195–201. [Google Scholar] [CrossRef]
- Abichou, H.; Pantalé, O.; Nistor, I.; Dalverny, O.; Caperaa, S. Identification of metallic material behaviors under high-velocity impact: A new tensile test. In Proceedings of the 15th Technical Meeting DYMAT, Metz, France, 1–2 June 2004; pp. 1–2. [Google Scholar]
- Abaqus. Abaqus v.6.14 User’s Manual; Dassault Systemes Simulia Corporation: Providence, RI, USA, 2014. [Google Scholar]
- Nistor, I.; Pantalé, O.; Caperaa, S.; Sattouf, C. Identification of a dynamic viscoplastic flow law using a combined Levenberg-Marquardt and Monte-Carlo algorithm. In Proceedings of the VII International Conference on Computational Plasticity, COMPLAS, Barcelona, Spain, 7–10 April 2003; Volume 10, pp. 11–17. [Google Scholar]
- Sattouf, C.; Pantalé, O.; Caperaa, S. A methodology for the identification of constitutive and contact laws of metallic materials under High Strain Rates. In Advances in Mechanical Behaviour, Plasticity and Damage; Elsevier: Tours, France, 2000; pp. 621–626. [Google Scholar]
- Ming, L. A Numerical Platform for the Identification of Dynamic Non-Linear Constitutive Laws Using Multiple Impact Tests: Application to Metal Forming and Machining. Ph.D. Thesis, INPT, Toulouse, France, 2018. [Google Scholar]
- Pantalé, O.; Ming, L. An Inverse Identification Procedure for the Evaluation of Equivalent Loading Conditions for Simplified Numerical Models in Abaqus. Appl. Mech. 2022, 3, 663–682. [Google Scholar] [CrossRef]
- Sattouf, C. Caractérisation en Dynamique Rapide du Comportement de Matériaux Utilisés en Aéronautique. Ph.D. Thesis, INPT, Toulouse, France, 2003. [Google Scholar]
- Johnson, G.R.; Cook, W.H. A constitutive model and data for metals subjected to large strains, high strain rates and high temperatures. In Proceedings of the 7th International Symposium on Ballistics, The Hague, The Netherlands, 19–21 April 1983; pp. 541–547. [Google Scholar]
- Sattouf, C.; Dalverny, O.; Rakotomalala, R. Identification and comparison of different constitutive laws for high speed solicitation. In Journal de Physique IV (Proceedings); EDP Sciences: Les Ulis, France, 2003; Volume 110, pp. 201–206. [Google Scholar] [CrossRef]
- Dwivedi, A.; Bradley, J.; Casem, D. Mechanical Response of Polycarbonate with Strength Model Fits; Technical Report; Dynamic Science Inc.: Aberdeen, MD, USA, 2012. [Google Scholar]
Figure 1.
Schematic of the Taylor test set-up.

Figure 2.
The Taylor gas gun device in LGP.

Figure 3.
The target and the massive target support on the double V.

Figure 4.
Geometry of the massive target support.

Figure 5.
Projectile for the dynamic tensile test.

Figure 6.
Dimensions of the complete projectile, i.e., sabot + steel head.

Figure 7.
The home-made imageAnalyser software used to measure specimens.

Figure 8.
Dimensions of the first version of the target for the dynamic tensile test.

Figure 9.
The geometry of the optimized target for the dynamic tensile test.

Figure 10.
First and new target versions for the dynamic tensile test. (a) The previous version of the target. (b) The new version of the target.
Figure 10.
First and new target versions for the dynamic tensile test. (a) The previous version of the target. (b) The new version of the target.

Figure 11.
Dimensions to be measured for the dynamic tensile test.

Figure 12.
Laser engraving of the dynamic tensile target.

Figure 13.
Deformations of the tensile targets and .

Figure 14.
Deformation of the tensile target .

Figure 15.
Complete dynamic tensile model with the new target.

Figure 16.
Equivalent plastic strain contour plots for the previous and new dynamic tensile targets. (a) Equivalent plastic strain contour plot of the previous target. (b) Equivalent plastic strain contour plot of the new target.
Figure 16.
Equivalent plastic strain contour plots for the previous and new dynamic tensile targets. (a) Equivalent plastic strain contour plot of the previous target. (b) Equivalent plastic strain contour plot of the new target.

Figure 17.
Equivalent plastic strain contour plot for a misalignment factor of .
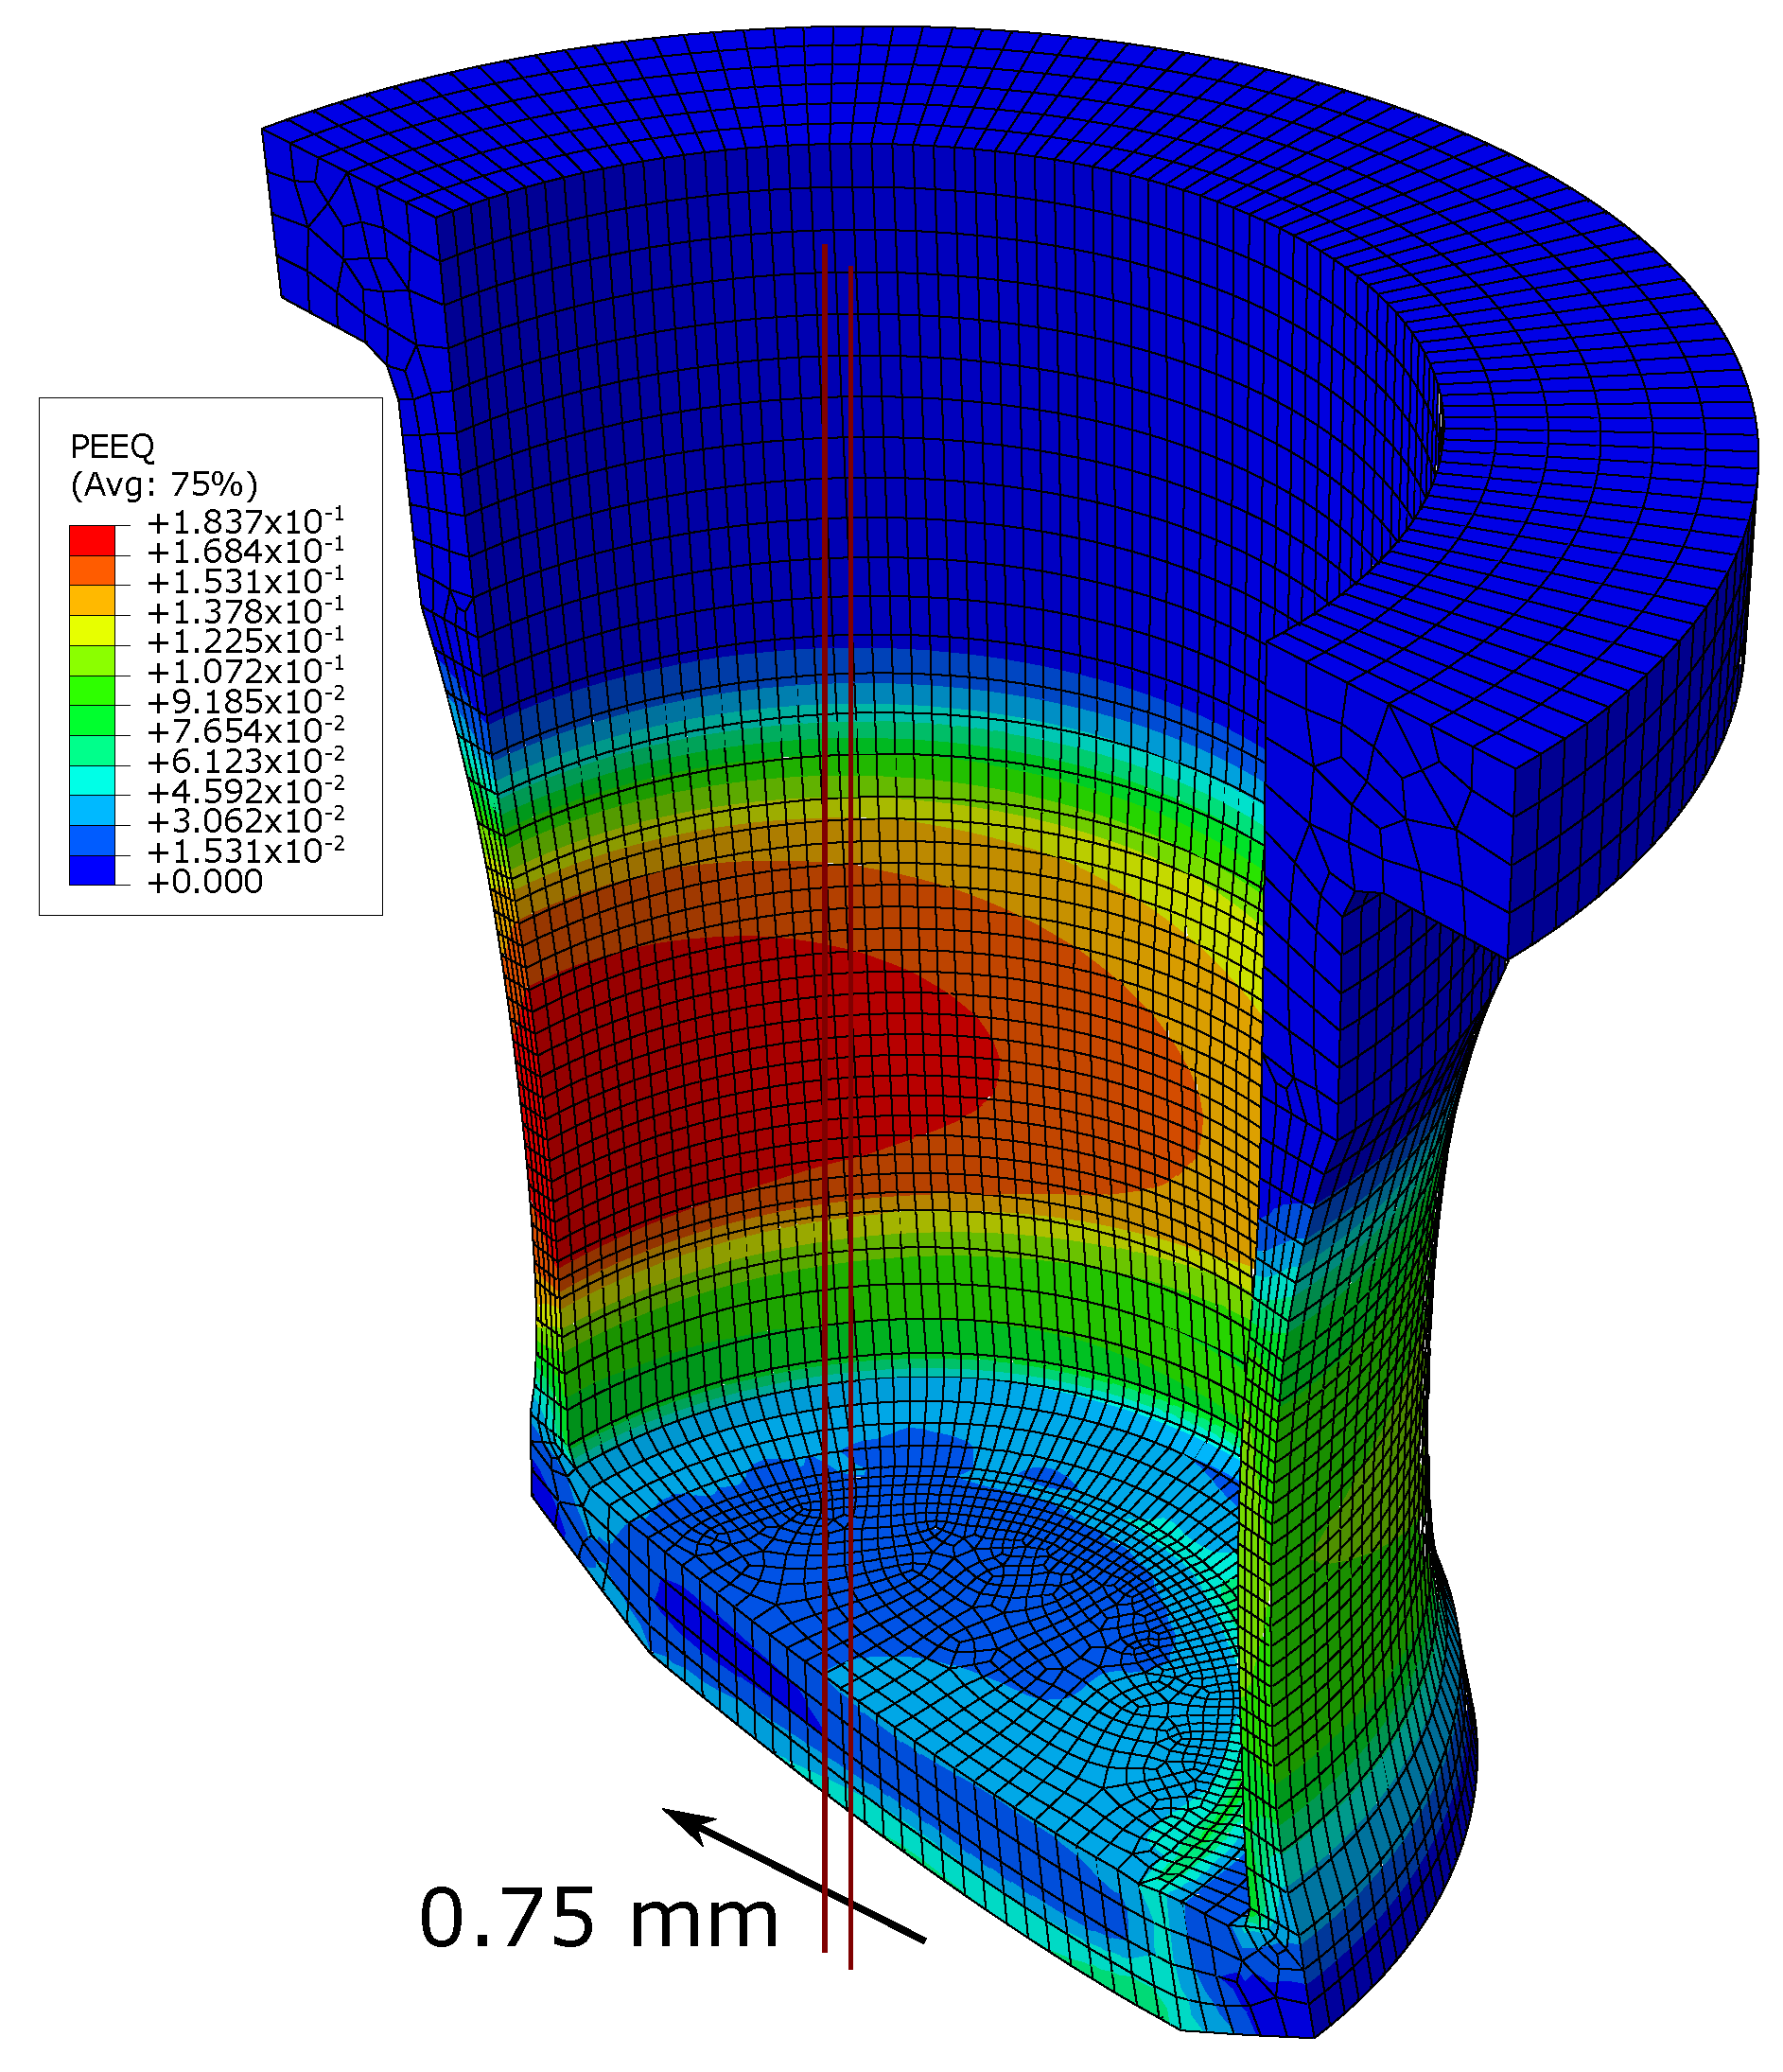
Figure 18.
Equivalent plastic strain contour plots.


Table 1.
Results of the dynamic tensile test.
| Target | |||||||
|---|---|---|---|---|---|---|---|
| (m/s) | (mm) | (mm) | (mm) | (mm) | (mm) | ||
| before test | |||||||
| after test | |||||||
| before test | |||||||
| after test | |||||||
| before test | |||||||
| after test | / |
Table 2.
Deformation of the center zone of the three targets.
| / | / | |||||
Table 3.
Material parameters of the 42CrMo4 steel [24], the 2017-T3 aluminum [20], and the polycarbonate [25].
| 42CrMo4 | 2017-T3 | Polycarbonate | |
|---|---|---|---|
| E (Gpa) | |||
| A (MPa) | 806 | 360 | 80 |
| B (MPa) | 614 | 31 | 75 |
| C | |||
| n | 2 | ||
| m | |||
| (s) | 1 | 1 | 1 |
| (C) | 20 | 20 | 20 |
| (C) | 1540 | 513 | 289 |
| (kg/m) | 7830 | 2790 | 1220 |
| (W/mC) | 134 | ||
| (J/kgC) | 460 | 880 | 1200 |
Table 4.
Comparison of the results for the dynamic tensile test.
| Specimen | ||||||
|---|---|---|---|---|---|---|
| (mm) | (mm) | (mm) | (mm) | (mm) | ||
| exp | ||||||
| num | ||||||
| −0.36% | ||||||
| exp | ||||||
| num | ||||||
Publisher’s Note: MDPI stays neutral with regard to jurisdictional claims in published maps and institutional affiliations. |
© 2022 by the authors. Licensee MDPI, Basel, Switzerland. This article is an open access article distributed under the terms and conditions of the Creative Commons Attribution (CC BY) license (https://creativecommons.org/licenses/by/4.0/).
Share and Cite
MDPI and ACS Style
Pantalé, O.; Ming, L. An Optimized Dynamic Tensile Impact Test for Characterizing the Behavior of Materials. Appl. Mech. 2022, 3, 1107-1122. https://doi.org/10.3390/applmech3030063
AMA Style
Pantalé O, Ming L. An Optimized Dynamic Tensile Impact Test for Characterizing the Behavior of Materials. Applied Mechanics. 2022; 3(3):1107-1122. https://doi.org/10.3390/applmech3030063
Chicago/Turabian StylePantalé, Olivier, and Lu Ming. 2022. "An Optimized Dynamic Tensile Impact Test for Characterizing the Behavior of Materials" Applied Mechanics 3, no. 3: 1107-1122. https://doi.org/10.3390/applmech3030063