Abstract
This study presents a predictive maintenance framework for hybrid electric vehicles (HEVs) based on emissions behaviour under laboratory-simulated driving conditions. Vehicle speed, road gradient, and ambient temperature were selected as the principal input variables affecting emission levels. Using simulated datasets, three machine learning model, specifically Linear Regression, Multilayer Perceptron (MLP), as well as Random Forest, were trained and evaluated. Within that set, the Random Forest model demonstrated the best performance, achieving an R2 score of 0.79, Mean Absolute Error (MAE) of 12.57 g/km, and root mean square error (RMSE) of 15.4 g/km, significantly outperforming both Linear Regression and MLP. A MATLAB-based graphical interface was developed to allow real-time classification of emission severity using defined thresholds (Normal ≤ 150 g/km, Warning ≤ 220 g/km, Critical > 220 g/km) and to provide automatic maintenance recommendations derived from the predicted emissions. Scenario-based validation confirmed the system’s ability to detect emission anomalies, which might function as early indicators of mechanical degradation when interpreted relative to operating conditions. The proposed framework, developed using laboratory-simulated datasets, provides a practical, interpretable, and accurate solution for emissions-based predictive maintenance. Although the results demonstrate feasibility, the framework should be further confirmed with real-world on-road data prior to large-scale use.
1. Introduction
The increasing need for reduced vehicular emissions and greater fuel efficiency has accelerated the global transformation to HEVs designed for sustainable transportation. HEVs combine internal combustion engines with electric propulsions to boost their energy efficiency. External driving conditions, for example, road gradients together with variations in speed and ambient temperature changes, have a significant impact on both emissions output and efficiency in these particular vehicles. The combination of these external variables has a considerable effect on powertrain performance and emissions production as well as fuel economy, which requires improved predictive and service strategies to address the situation. The worldwide carbon dioxide () emission patterns from 2010 to 2024 demonstrate an ever-increasing trend illustrated by Figure 1 [1]. Global emissions experienced a temporary reduction in 2021, achieving 36.3 billion metric tons as a consequence of the economic limitations caused by the pandemic. However, they recovered to 37.4 billion metric tons in 2023 and subsequently climbed sharply to 41.6 billion metric tons in 2024, attaining the highest recorded value. Fossil fuel consumption in conjunction with industrial growth triggered a dramatic increase in emissions which demonstrates the need for optimised emissions control measures within transportation systems, with the intention of combatting environmental consequences.
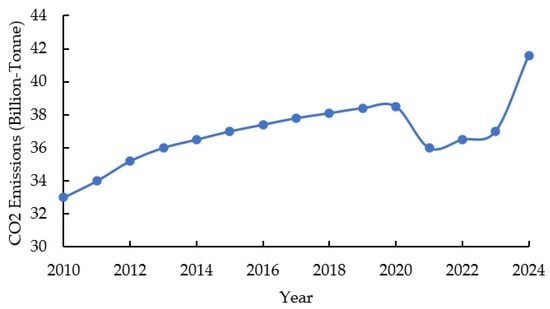
Figure 1.
Global emissions from 2010 to 2024.
Recent international assessments indicate that emissions from road transport continue to rise despite improvements in engine efficiency and fuel quality. According to the International Energy Agency (IEA), road transport accounts for nearly 20% of global energy-related emissions, and transport emissions grew by approximately 3% in 2023, surpassing pre-pandemic levels [1]. Passenger vehicles remain the largest contributor, responsible for about 45% of total transport emissions [2]. These trends highlight the ongoing challenge of decarbonising road transport and reinforce the importance of low-emission technologies such as HEVs, which can substantially reduce fuel consumption and tailpipe emissions relative to conventional internal combustion vehicles.
External driving conditions control the performance and pollutant emissions of HEVs, which require predictive modelling solutions to achieve efficiency and reliable operations. Road gradient has been identified as the principal factor that affects both energy demand and pollutant emissions from HEVs [3]. HEVs experience greater efficiency when travelling downhill, enabling regenerative braking. Nonetheless, uphill driving requires more engine power, which, in turn, increases fuel consumption and emissions [3].
In conventional internal combustion engine (ICE) vehicles, inefficiencies arise primarily from incomplete combustion, thermal losses, and parasitic demands, giving rise to high variability in emissions under changing driving conditions [4]. HEVs alleviate these inefficiencies by dynamically balancing energy flows between the electric drive and the ICE, permitting operation closer to the engine’s optimal torque–speed region. Nevertheless, HEVs are not immune to efficiency losses. When the ICE is active, its performance remains sensitive to external factors; for example, road gradient, ambient temperature and transient load demands. Under these specific conditions, deviations from optimal operation continue to produce measurable variations in emissions, which makes emissions-based diagnostics appropriate for identifying underlying inefficiencies and to direct predictive maintenance [5].
Predictive maintenance is an indispensable HEV reliability tool given that it detects mechanical performance weaknesses prior to the occurrence of significant problems. Persistent powertrain issues can be identified by means of abnormal emissions patterns exhibiting nitrogen oxides () and carbon dioxide () spikes during downhill driving that indicate possible engine braking inefficiencies and gradual emissions increases on flat roads as a result of degraded catalytic converters [6]. A high emissions output whilst driving uphill cautions against potential fuel system problems requiring immediate investigation to preserve optimal vehicle operation [7].
Vehicle architecture is fundamental in relation to determining how HEVs produce emissions and achieve efficiency. The combined operational capability of electric motors and internal combustion engines in parallel HEVs allows these vehicles to surpass conventional ICE efficiency, predominantly in urban environments, according to [8]. Real-world driving conditions continue to be a challenge for powertrain efficiency and emissions output because of external factors, e.g., road gradient and speed variability, as well as temperature fluctuations [9]. Nevertheless, this requires the development of predictive models with advanced capabilities to tackle these conditions. Energy conversion and distribution efficiency in HEVs remain as primary focuses of scientific investigation [10,11]. The correct management of HEV powertrains is paramount on account of their energy distribution sequences. Typical parallel HEV architectures exhibit significant thermal losses in the internal combustion engine and recover a portion of energy through regenerative braking. According to Bai and Liu [12], the ICE experiences high thermal losses which amount to 63–72% of its total energy, whereas electric drive losses are between 5 and 20%. Irrespective of these inefficiencies, 27–38% of total energy is successfully transmitted to the wheels, with regenerative braking recovering 5–9% of the lost energy. The energy flow pattern emphasises the requirement for innovative energy management techniques which attempt to reduce losses and maximise power transmission [13].
The results specify that improved hybrid control technologies should be developed to minimise emissions surges. Bartolome et al. [14] demonstrated that electric and HEVs operating in urban environments exhibit different efficiency levels compared to manufacturer specifications, whereas stop-and-go traffic causes increased fuel use and pollutant emissions. According to the latter, real-world tests should be conducted to develop the existing HEV energy management approaches [14]. Skuza et al. [15] reported that HEVs reduce emissions. However, traffic congestion generates significant amounts of emissions, which is comparable to traditional vehicles. Hence, adaptive energy management systems are required. Research undertaken by Fernandes et al. [16] indicates that HEV exhaust emissions exhibit variations according to driving volatility, even when operating under hot-stabilised conditions. This demonstrates the need for data-driven approaches to achieve optimal emissions control. Wang et al. [17] examined HEV bus energy management data. They demonstrated how driving conditions directly affect system efficiency, thus requiring predictive strategies that adapt to conditions. Liu et al. [18] established that detecting driving conditions improves HEV energy management by adapting power allocations for improved fuel efficiency and system performance. Masri et al. [19] revealed that analysing standard driving cycles improves electric vehicle (EV) energy management by linking power flow, thermal behaviour, and control strategies, giving rise to greater efficiency and system-level insight.
Advances in real driving emissions (RDE) research have increasingly concentrated on methods to attain variability and identify anomalous events in real-world data. Liu et al. [20] applied density-based clustering to RDE calibration datasets, demonstrating improved detection of emission spikes under dynamic conditions. At the regulatory level, Euro VII standards are projected to cut road transport emissions by up to 98% by 2050, underlining the significance of robust emissions control and diagnostic strategies [21]. Complementary methodological developments have also been reported: Wasserburger et al. [22] introduced a stochastic optimisation approach for powertrain calibration that reduced expected emissions and fuel consumption by explicitly modelling operating uncertainties, while Krysmon et al. [23] proposed a data-driven calibration framework for hybrid powertrains that combines statistical analysis with virtual platforms to better manage RDE performance. Further studies have stressed the diversity of emissions behaviour in vehicle technologies. Kim et al. [24] investigated particulate number, , and regulated gaseous emissions from a gasoline direct injection vehicle amongst multiple driving modes, whereas Kontses et al. [25] compared particle number emissions within gasoline, diesel, LPG, CNG, and HEVs, both displaying strong variability under real-world conditions. Similarly, Chong [26] analysed light-duty diesel vehicles, determining significant fluctuations in fuel consumption and gaseous emissions throughout driving scenarios, underpinning the need for predictive emissions models that describe real-world variability.
Although previous studies have examined the impact of driving conditions on HEV emissions and energy efficiency, limited research has integrated predictive emissions modelling with maintenance strategies in real-world driving environments. Most existing models focus either on energy efficiency optimisation or fault detection, without a comprehensive framework that connects emissions prediction to proactive maintenance. This study addresses this gap by developing a data-driven emissions prediction model that explains road gradient, speed variations, and the effects of ambient temperature, whilst also identifying early maintenance indicators formulated on emissions anomalies. By establishing a predictive framework, this research provides beneficial information to boost HEV performance, implementing proactive maintenance strategies and reducing environmental impact. The findings support the development of sustainable HEV technologies, guaranteeing increased efficiency, reduced emissions, and improved reliability in real-world driving conditions.
While emissions modelling and ML-based estimation have been widely investigated in HEV research, most existing studies address these aspects independently and do not translate emissions behaviour into interpretable, condition-based maintenance actions. The novelty of this work is therefore not the ML model itself but the creation of an integrated framework that links emissions predictions to diagnosable mechanical causes through scenario-specific rules and implements this logic in a real-time MATLAB tool capable of providing maintenance recommendations. This emissions-driven diagnostic layer, combined with a practical GUI and driving-condition-normalised anomaly mapping, differentiates the present study from the prior HEV modelling literature.
2. Data Collection
The emissions data for this study were collected using the DL AM22, a specialised laboratory-based hybrid powertrain simulation platform developed by De Lorenzo. The DL AM22, which is shown in Figure 2, emulates a parallel-type hybrid configuration for instructional and testing purposes, providing a simplified and controlled representation of hybrid power flow suitable for repeatable emissions measurements [27]. It should be noted that commercially available HEVs such as the Toyota Prius and Honda Insight employ a series–parallel (power-split) architecture rather than a purely parallel configuration.
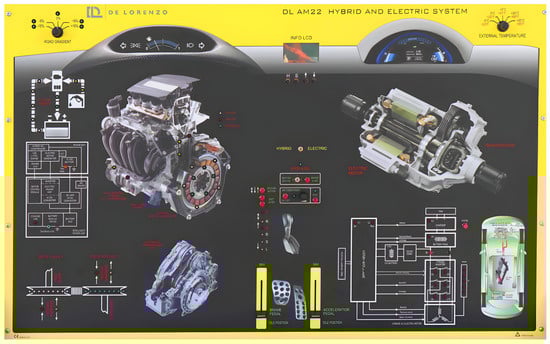
Figure 2.
De Lorenzo DL AM22 hybrid and electric system training panel.
This system was chosen owing to its ability to replicate real-world HEV behaviour under controlled conditions. Unlike data obtained via on-road tests that is subject to environmental variability, traffic conditions, and driver behaviour, the DL AM22 delivers a controlled and consistent testing platform with emission measurements protected from external uncertainties. Speed, road gradient, and temperature can be accurately controlled while considering the influence of these parameters on emissions trends without interference from inconsistencies in real-world driving. The accuracy of the DL AM22 system in simulating powertrain transitions, regenerative braking, and load variations assures that the data is consistent with real-world HEV performance. However, certain limitations exist, as the system does not consider driver inputs, aggressive acceleration, aerodynamic drag or rolling resistance, which could alter emissions outputs in real traffic scenarios. Nevertheless, its ability to closely mimic HEV performance characteristics, for instance, energy distribution mechanisms and emissions patterns, makes it a reliable data collection method for this study.
By systematically adjusting the speed from 10 km/h to 90 km/h, road gradient from −15 to 15%, and temperature from −5 °C to 20 °C, the system provided a comprehensive dataset denoting the effects of driving conditions on emissions production. The recorded emissions values of carbon dioxide () continue to be critical measurements to assess fuel efficiency and the combustion quality essential for entailing predictive maintenance and emissions prediction modelling. The precise DL AM22 measuring capabilities enable the significant identification of significant patterns that can develop predictive optimisation strategies concerning emissions management and vehicle servicing procedures. Table 1 presents the key parameters measured during data collection, guaranteeing a structured assessment of how external conditions affect emissions.

Table 1.
Explanation of the evaluated performance metrics.
In total, the experimental design generated 81 distinct operating points (9 speeds × 3 gradients × 3 temperatures). Each test condition was repeated three times to corroborate measurement consistency, resulting in 243 data samples. The raw measured variables, specifically vehicle speed, road gradient, ambient temperature, and emissions, were employed directly as model inputs without additional feature engineering. The dataset was then divided into 80% for training and 20% for testing, with the aim of supporting model development and validation.
The selected road gradients (−15%, 0% and +15%) were chosen to represent extreme but realistic terrain conditions encountered in HEV operation. Downhill slopes of approximately −15% provide maximum regenerative braking opportunities, whereas +15% gradients represent high-load uphill conditions that significantly increase fuel demand and emissions. Similarly, the ambient temperature range (−5 °C, 5 °C, and 20 °C) was selected to attain cold-start sensitivity (−5 °C) and mild cold conditions (5 °C), together with a moderate reference temperature (20 °C), where both the ICE and battery performance are optimal. The DL AM22 test bench is limited to simulating temperatures up to 20 °C. Consequently, high-temperature effects (>20 °C), which are acknowledged to impact battery efficiency and after-treatment systems, were not included. This is recognised as a limitation of the present study. Hence, future work will enlarge the dataset to incorporate raised-temperature scenarios.
Vehicle speed, road gradient, and ambient temperature were selected as the primary variables because they directly influence engine load, combustion efficiency, and emissions behaviour. Additional factors such as acceleration intensity, road surface quality, aerodynamic drag, and rolling resistance are also important but could not be represented within the DL AM22 platform, which was designed to provide controlled and repeatable testing. Their exclusion is acknowledged as a limitation that might reduce predictive accuracy under real-world conditions. Accordingly, the existing results should be regarded as a proof-of-concept demonstration as opposed to a replication of real driving. Future work will incorporate these additional factors by means of on-road experiments and OBD-II telematics to validate and extend the framework.
Heatmaps were generated (Figure 3, Figure 4 and Figure 5) for each ambient temperature condition (20, 5, and −5 °C) to assess how speed, road gradient, and ambient temperature affect the behaviour of emissions. These visualisations provide a comprehensive view of emissions intensity and show how and emissions fluctuate in different driving conditions. These heatmaps are a fundamental part of data collection in the form of a complete view of real-world emissions behaviour, essential to create an effective model to understand predictive emissions. Mapping the emissions values against different speed and gradient combinations visibly demonstrates conspicuous patterns of behaviour, providing data pertaining to fuel efficiency, combustion performance, and system inefficiencies in different environmental conditions. The construction of these heatmaps also allows the detection of anomalies that could imply maintenance requirements which would aid in the development of proactive maintenance strategies to improve the efficiency of HEVs, reduce fuel consumption, and lessen the ecological footprint.
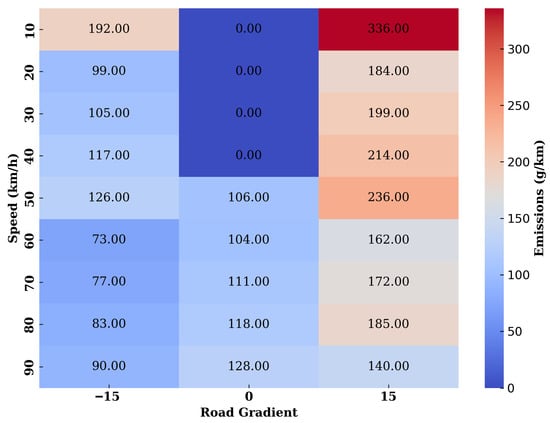
Figure 3.
Emissions heatmap at 20 °C.
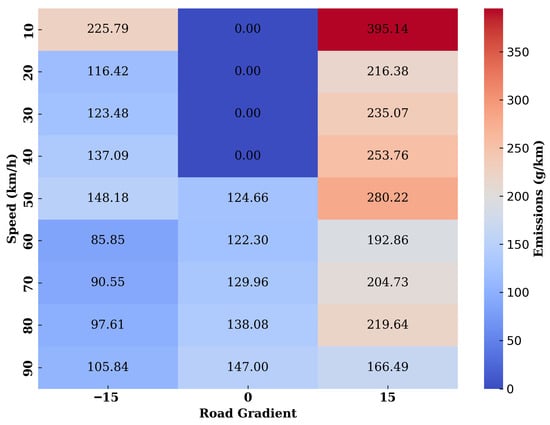
Figure 4.
Emissions heatmap at 5 °C.
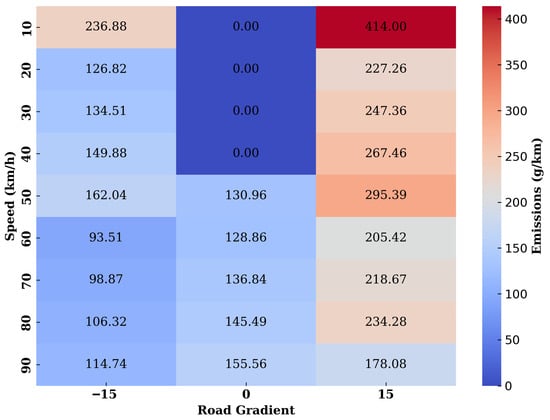
Figure 5.
Emissions heatmap at −5 °C.
Statistical analysis of emissions under separate gradients and temperatures illustrates several trends:
- Mean emissions exhibited a reverse trend as the ambient temperature decreased for gradients of −15%, 0%, and 15%. Hence, the mean emissions for an ambient temperature of −5 °C recorded 44.23 g/km for the −15% gradient, 73.95 g/km for the 0% gradient, and 68.93 g/km for the 15% gradient, corroborating the effect of cold temperatures on ICE performance.
- Emissions differences were also more prominent at lower temperatures, signifying the extreme sensitivity of hybrid powertrains to cold weather.
- Emissions registered at slower speeds at a gradient of 15% were the highest, whereas emissions at a gradient of −15% at moderate speeds were observed to be the lowest, underlining the effect of road inclination and speed selection on HEV performance.
3. Random Forest Regression Model Development
Accurate emissions prediction is essential to optimise HEV performance, reducing fuel consumption and decreasing the environmental impact. This study employs a Random Forest regression model to predict emissions derived from critical driving parameters, comprising vehicle speed, road gradient, and ambient temperature. Unlike traditional Linear Regression models, which assume a fixed relationship between input and output variables, Random Forest is a non-parametric machine learning technique that effectively records the nonlinear dependencies and interactions between variables [28]. The predictive model was trained using three independent variables that significantly influence HEV emissions:
- Vehicle Speed (km/h): Directly impacts fuel combustion rate, engine load, and aerodynamic drag, establishing it as a primary determinant of emissions.
- Road Gradient (%): Affects energy demand and powertrain load, giving rise to variations in emissions based on terrain conditions.
- Ambient Temperature (°C): Influences the air–fuel mixture properties, catalytic converter efficiency, and fuel system performance, indirectly affecting emissions output.
- The dependent variable, emissions (g/km), represents the vehicle’s exhaust emissions under different operating conditions. The dataset was separated into the following:
- 80% to train the Random Forest model to understand emissions patterns.
- 20% for testing, so as to validate its predictive accuracy.
Random Forest regression creates a set of decision trees and retrieves a prediction using their estimations. Contrary to a single decision tree that might experience overfitting, Random Forest makes several weak learners and thus makes a prediction based on the combination of their results, which is more stable and generalised than a single decision tree [29]. Given that Random Forest models require numerical inputs, categorical data encoding was unnecessary. In addition, feature normalisation was not employed because decision trees are resistant to variations in feature scales. The Random Forest model has several decision trees that are trained on a random subset of the data using bootstrap aggregation, which is also known as bagging. The bagging technique reduces variance and over fitting by way of ensuring that the trees learn new patterns within the data [30]. The resulting output is obtained by averaging the predictions for each of the decree trees. Mathematically, the Random Forest regression function can be written as follows:
where represents the predicted emissions, is the prediction from the decision tree, is the total number of decision trees, and represents the input feature vector (speed, gradient, temperature).
3.1. The Random Forest Model Training Process
The Random Forest was trained on a linearly modularised supervised learning pipeline, guaranteeing that it effectively attended the nonlinear dependencies between vehicle speed, road gradient, ambient temperature, and emissions. Training data contained actual emissions data. This information was collected under various operating conditions to deliver the maximum number of scenarios. The training dataset comprised 80% of the available data, while the remaining 20% was reserved for testing to evaluate model performance. The Random Forest model was implemented in MATLAB R2022b using the TreeBagger function, which constructs a group of decision trees via bootstrap aggregation, allowing robust and accurate regression for emissions prediction.
Each decision tree in the model was constructed under the classification and regression tree (CART) paradigm, carrying out data split recursively with the selection of the most informative feature at a given step in the sequence. Trees were developed independently. Subsequently, their decisions were averaged to deliver the final output, making predictions resilient in the presence of noise or irregular emission patterns. To further boost model stability, the out-of-bag (OOB) error estimation technique was employed. It exploits the fact that samples omitted from the bootstrap training process function as an internal validation set. This permitted early detection of possible overfitting and provided an unbiased error estimate without requiring additional validation data.
3.2. Hyperparameter Tuning Strategy
To optimise the Random Forest model in relation to emissions prediction, an extensive hyperparameter tuning process was conducted. Five key hyperparameters were adjusted to assure a suitable balance between prediction accuracy and computational efficiency:
- Number of Trees (N): Increasing the number of trees improves predictive accuracy but increases computation time. A grid search was conducted over N = {50, 100, 150, 200, 300}, with 100 trees providing the best balance in relation to accuracy and efficiency.
- Maximum Tree Depth: Deeper trees attain more complex relationships but may result in overfitting. Trees were tested with depths between 10 and 30, with 15 as the optimal depth, assuring appropriate learning without excessive complexity.
- Minimum Leaf Size: A smaller leaf size increases granularity but may capture noise. Experiments with leaf sizes from 1 to 10 determined that a minimum leaf size of 5 produced the lowest validation error.
- Feature Subsampling (Number of Predictors per Split): Randomly selecting a subset of features for each split prevents trees from focusing on the same dominant variables. The model was tested with feature subsets of {1, 2, 3}, where selecting two features per split provided the best predictive performance.
- Bootstrap Sampling Strategy: Standard bootstrap resampling was employed to train each tree on a different dataset subset. This method reduced the effect of data anomalies and improved model generalisation.
After fine-tuning these parameters, the final model configuration was set as follows:
- 100 trees;
- Max tree depth of 15;
- Minimum leaf size of 5;
- Two features randomly selected per split;
- Bootstrap sampling enabled.
3.3. Model Performance Evaluation
After training the Random Forest regression model on the emissions dataset, its performance was evaluated with several statistical metrics to substantiate prediction accuracy, reliability, and generalisability. The main metrics used as evaluation criteria consisted of Root Mean Squared Error (RMSE), Coefficient of Determination ( score), and Mean Absolute Error (MAE) to examine the accuracy and the interpretive ability of the model to predict emissions under different driving conditions.
3.3.1. Root Mean Square Error (RMSE)
The RMSE calculates the average deviation between actual emissions values and predicted emissions values in the dataset. It is given by the following equation:
where is the total number of test samples, represents the actual emissions values, and represents the predicted emissions values. A lower RMSE value indicates higher prediction accuracy. The trained model achieved an RMSE of 15.4 g/km, implying that the average deviation between the actual and predicted emissions was approximately 15.4 g/km. Given the variability in real-world HEV emissions, this level of accuracy is acceptable with respect to predictive maintenance applications.
3.3.2. Coefficient of Determination ( Score)
The score determines how well the model explains the variability in CO2 emissions. It is calculated using the following:
where is the mean of the actual emissions values, represents actual emissions, represents predicted emissions, and the denominator represents the variance in the actual emissions data.
An score close to 1 indicates that the model achieves a significant proportion of the variability in emissions. The trained Random Forest model achieved an R2 score of 0.79, suggesting that 79% of the variation in emissions can be explained by vehicle speed, road gradient, and ambient temperature. This high explanatory power confirms the effectiveness of the model in portraying emissions behaviour under different driving conditions.
3.3.3. Mean Absolute Error (MAE)
The Mean Absolute Error (MAE) was computed to evaluate the model’s robustness in predicting emissions under different operating conditions, signifying the absolute average deviation between actual and predicted emissions. The MAE is calculated as follows:
where is the total number of data points (samples), is the actual emissions, and is the predicted emissions. The model achieved an MAE of 12.57 g/km, indicating that, on average, the emissions predictions differed by approximately 12.57 g/km. Compared to RMSE, which penalises large errors more significantly, the MAE confirms that the model performs consistently across the dataset without extreme deviations.
3.4. Comparison with Alternative Models
To substantiate the superiority of the Random Forest model, its performance was compared to traditional regression-based approaches comprising Linear Regression [31,32] and Multilayer Perceptron (MLP) Neural Networks [33]. Dissimilar to Linear Regression, which overfits the training data, in addition to Neural Networks, which require more training data and hyperparameter tuning, Random Forest provides a balance between accuracy and computational feasibility. It can develop dynamically with changes in speed, gradient, and temperature, encouraging greater confidence in its ability to provide a real-time energy management strategy considering HEVs. A comparison between the real-world strengths, weaknesses, and applicability of each prediction model is given in Table 2.
Table 2.
Strengths, weaknesses, and real-world applicability of prediction models.
Table 3 emphasises that Random Forest is more effective at predicting the emissions of the HEV than Linear Regression and Neural Networks. Linear Regression demonstrates signs of overfitting. Similarly, Neural Networks cannot be used because of a lack of accuracy with limited data, whereas Random Forest delivers the best accuracy ratio, robustness, and generalisation, which is why it is the most accurate model to deal with real-world emissions predictions.
Table 3.
Performance metrics of predictive models for HEV emissions.
4. Emission Trend Analysis
Table 4 provides a summary of the key trends discovered in the emissions data in conjunction with data pertaining to the speed-related effects and gradient and temperature-induced changes.
Table 4.
Emission trends by speed, gradient, and temperature with key data relating to efficiency.
5. Predictive Maintenance
This section presents a predictive maintenance framework which makes use of emissions trends to identify early signs of mechanical inefficiencies in HEVs. By correlating emissions behaviour with varying speed, road gradient, and ambient temperature, the approach detects abnormal operating conditions that are indicative of component degradation. The framework permits real-time, condition-based maintenance recommendations, supporting improved vehicle reliability, reduced downtime, and optimal energy management in hybrid powertrains.
5.1. Emissions-Based Fault Detection
This section introduces a data-driven predictive maintenance framework originating from emissions trends in HEVs. The approach correlates emissions behaviour with driving conditions, specifically vehicle speed, road gradient, and ambient temperature, so as to identify patterns that denote underlying mechanical inefficiencies. Unlike conventional mileage-based servicing, this method supports condition-based maintenance by way of detecting early signs of system degradation from real-time emissions data. By defining threshold-based rules, the framework classifies abnormal emissions into practical categories. These anomalies are linked to specific components, allowing targeted diagnostics and minimising unnecessary inspections. The classification logic is summarised in Table 5. It should be noted that raised emissions do not directly denote faults. Instead, abnormal deviations with respect to the expected values under specific speed–gradient–temperature conditions are explained as potential inefficiency indicators.
Table 5.
Emissions-based maintenance classification rules.
The classification rules summarised in Table 5 were derived from both evidence documented in the literature and scenario-based validation on the DL AM22 platform. Previous studies [20,21,22,23,24,25] have ascertained that abnormal spikes or sustained increases in emissions under specific driving conditions (e.g., downhill braking or uphill load) correlate with identifiable component inefficiencies, for example, EGR malfunctions, catalytic converter clogging or injector fouling. The proposed rules therefore represent an interpretable mapping of emissions anomalies to mechanical causes consistent with reported diagnostic signatures.
Similarly, the severity thresholds applied in the GUI (normal ≤ 150 g/km, warning ≤ 220 g/km, critical > 220 g/km) were established using baseline emissions distributions obtained in the present dataset and cross-referenced against regulatory benchmarks for hybrid passenger vehicles under Euro 6 and WLTP driving conditions. Normal operation was defined by typical emissions levels recorded under moderate speed and flat gradient at 20 °C, averaging below 150 g/km. Warning-level emissions between 150 and 220 g/km were associated with intermediate degradation signatures, for instance, catalytic inefficiency, whereas values above 220 g/km consistently exhibited high-load or fault-induced anomalies. These thresholds are dataset-specific and are acknowledged as initial calibration values. Further improvement with extended on-road measurements is planned in relation to future work.
The emission severity thresholds were statistically derived from the empirical distribution of values across all 243 operating points. The Normal threshold (≤150 g/km) corresponds to the upper bound of the main efficiency zone (approximately the 65th percentile under 0% gradient and 20 °C). The Warning range (150–220 g/km) reflects the mid-to-upper spread observed under increased load but without fault signatures. The Critical threshold (>220 g/km) represents the upper 10–12% tail where emissions consistently rose during high-gradient or low-temperature conditions. These thresholds are robust within the laboratory dataset but will require recalibration for real-world driving. In addition, the emission-severity thresholds were derived from the empirical CO2 distribution across all 243 operating points. The Normal threshold (≤150 g/km) corresponds to the upper bound of the primary efficiency zone observed under reference conditions (0% gradient and 20 °C). The Warning range (150–220 g/km) reflects the mid-to-upper spread of values occurring under increased load but without fault signatures. The Critical threshold (>220 g/km) represents the upper tail where emissions consistently rose during high-gradient or low-temperature scenarios. These thresholds are dataset-specific and will require recalibration when larger on-road datasets become available.
5.2. Real-Time Implementation via MATLAB GUI
To operationalise the proposed emissions-based maintenance framework, a MATLAB-based graphical user interface (GUI) was developed. This tool enables real-time assessment of emissions severity and promotes useful decisions established on current vehicle operating conditions. The GUI comprises four basic functions:
- Input of operating parameters: The user enters the vehicle speed (km/h), road gradient (%), ambient temperature (°C), and observed emissions (g/km). These inputs exhibit typical real-world data points available from on-board diagnostics or test platforms.
- Emissions classification engine: The GUI processes inputs using threshold-based logic and classifies the emissions severity into three individual stages:
- Normal operation ( ≤ 150 g/km): No immediate action required.
- Warning level (150 < ≤ 220 g/km): Inspection recommended; potential early-stage degradation.
- Critical level ( > 220 g/km): Immediate maintenance required; possibly a performance-affecting fault.
- Maintenance recommendation module: Formulated on the classified emissions stage and the input driving scenario, the system cross-references Table 5 to generate a customised recommendation. These entail component-level actions, e.g., injector cleaning, sensor replacement or EGR valve inspection.
- Visual feedback and status indicator: A colour-coded emissions risk bar illustrates the severity: green for normal, yellow for warning, and red for critical. This visualisation augments usability and decision-making concerning technicians and operators. An example of the developed interface is shown in Figure 6, illustrating the input fields, emissions classification output, and visual risk indicator used to support real-time maintenance decisions.
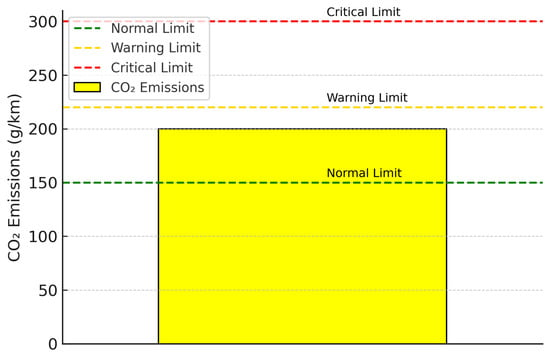 Figure 6. MATLAB GUI for emissions bar with threshold indicators for maintenance alerts.
5.3. Scenario-Based Validation and Diagnostics Accuracy
The predictive maintenance framework was evaluated using a number of simulated scenarios that reproduce typical real-world degradation patterns in HEVs. These tests assessed whether the GUI correctly identified abnormal emissions behaviour and issued appropriate maintenance recommendations. The emissions severity patterns and corresponding fault classifications concerning key driving conditions are summarised in Figure 7.
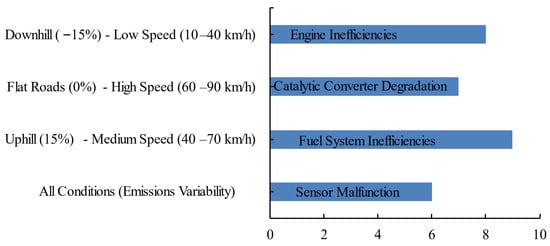
Figure 7.
Emissions severity using driving condition and associated mechanical faults.
Four representative scenarios were used for validation:
- Downhill driving at low speeds (−15% gradient, 20–40 km/h): Simulated engine braking inefficiencies led to localised spikes. The GUI correctly classified the case as critical and recommended an examination of the engine system.
- High-speed driving on flat terrain (0% gradient, 60–90 km/h): A gradual rise in emissions was used to replicate catalytic converter clogging. The system flagged this as a warning sign and advised inspection of the exhaust treatment components.
- Uphill driving under moderate load (15% gradient, 40–70 km/h): A sharp increase in was introduced to simulate injector fouling. The GUI classified this as critical and proposed fuel system diagnostics.
- Stable driving with fluctuating emissions: This scenario simulated a malfunctioning sensor or miscalibration of the ECU. The system accurately identified the irregular pattern and flagged it as a sensor-related issue.
Essentially, the system demonstrated superior consistency with expected failure signatures and correctly mapped emissions anomalies in relation to specific maintenance actions. These results corroborate the GUI’s applicability as a diagnostic aid and confirm the feasibility of emissions-based predictive maintenance in HEVs.
It should be noted that the validation conducted in this study primarily assessed the correct implementation of classification logic in the MATLAB GUI by introducing simulated emissions patterns representing fault signatures. Although this confirmed the internal consistency of the framework, it does not establish full diagnostic confirmation of the rules. A more comprehensive verification requires testing with real vehicles exhibiting recognised mechanical faults, such as clogged injectors, degraded catalytic converters or malfunctioning sensors, and subsequently evaluating whether the framework can correctly identify them by way of using the emissions data. Owing to the use of a laboratory-simulated platform, the deliberate creation of a real-world fault in the system to see how it behaves was not possible in the current study. This is acknowledged to be a limitation. As a result, future work will incorporate experimental fault data and real-world OBD-II datasets to rigorously validate the diagnostic capability of the proposed framework.
6. Key Findings
This section explains the emission behaviour of HEVs under different driving conditions, revealing key dynamic signatures that can be implemented for system-level diagnostics and condition-based maintenance strategies.
6.1. Speed-Induced Emission Patterns: Dynamic Load Signatures
emissions explained a distinct non-monotonic profile with respect to speed. At low speeds (10–30 km/h), emissions were disproportionately high, predominantly under cold-start conditions. This is attributed to the suboptimal engine temperatures, reduced hybrid engagement, and low regenerative braking efficiency. These conditions create a diagnostic fingerprint concerning inefficient combustion or delayed catalytic converter activation. Moderate cruising speeds (40–60 km/h) produced the most stable and lowest emissions, identifying them as a baseline efficiency zone for hybrid operation. Conversely, high-speed driving (70–90 km/h) exhibited a gradual increase in emissions, primarily when paired with positive gradients, pinpointing increased engine strain and potential energy losses when the vehicle combines power from different energy sources. These dynamic shifts propose that speed-dependent emissions data, when normalised against terrain, can be applied to isolate fuel inefficiency caused by powertrain miscalibration, gear ratio faults or battery underperformance.
6.2. Gradient Influence: Emissions as a Load Stress Sensor
Emissions were exceedingly sensitive to gradient changes, effectively functioning as an alternative for drivetrain load response. During downhill motion (−15%), emissions repeatedly dropped below 100 g/km, a result of regenerative braking dominance and near-zero ICE load. Flat terrain exhibited moderate emissions (~140–160 g/km), although this baseline was controlled by ambient temperature. Notably, uphill gradients (+15%) caused a nonlinear increase in emissions, commonly exceeding 250 g/km. This gradient–emission coupling can reveal torque delivery inefficiencies and suggest battery capacity fade when electric assistance is inadequate during inclines. The asymmetry between downhill and uphill conditions also affords a dual-mode diagnostic: excessive emissions in either case can signal braking energy recovery issues or ICE overcompensation as the vehicle’s control system is incapable of correctly coordinating the engine and the electric motor.
6.3. Temperature Sensitivity: Thermal Efficiency as a Diagnostic Lens
Ambient temperature was a critical modifier of emission behaviour, illustrating the dependence of the hybrid system on thermal conditions for optimal combustion and electric propulsion. At −5 °C, emission spikes were observed even under low-load conditions, driven by increased fuel enrichment, reduced catalyst activity, and limited battery discharge efficiency. In contrast, near-optimal emissions (≤150 g/km) were recorded at 20 °C, suggesting this is the most favourable condition regarding system-wide energy conversion. This temperature–emissions coupling provides a route to identify latent thermal management faults: at mild temperatures, emissions remain higher than expected for a prolonged period instead of returning to their normal levels. This might signify cooling system leaks, sensor drift or ageing battery thermal insulation. Monitoring how emissions change with temperature therefore provides early detection of the thermal health of the hybrid platform. Notwithstanding that the analysis in this study concentrated on combustion-related temperature sensitivity, it is important to stress that in HEVs, the dominant impact of ambient temperature arises from auxiliary loads, particularly heating and cooling of the passenger cabin. The DL AM22 platform simulates these HVAC loads; however, the current discussion was restricted to examining the effects of combustion efficiency. Further research will incorporate a more meticulous analysis of the contribution of HVAC in order to determine the significance of auxiliary energy demand under extreme climate conditions.
6.4. Implications for Real-World Use
The identified emission trends, strongly influenced by speed, gradient, and ambient temperature, emphasise practical opportunities to integrate emissions-based diagnostics into real-world HEV systems. These examples can be embedded into on-board diagnostics (OBD-II) to allow real-time fault detection and the monitoring of fuel efficiency. Emission anomalies under specific conditions (e.g., high emissions at low speeds during cold starts) may function as early indicators of catalytic inefficiency, hybrid control imbalance or regenerative braking underperformance. Considering fleet operators, this beneficial information allows predictive maintenance scheduling to minimise downtime and operational costs. Moreover, emissions tracking under real driving conditions supports compliance with environmental regulations, e.g., EURO 6 and WLTP, particularly when employed in adaptive powertrain control. The information not only supports the predictive model’s practical value but also underlines its potential to support sustainable, cost-effective operations in next-generation hybrid platforms.
In practical terms, sustained levels above critical thresholds during uphill driving can signal catalytic converter degradation and the need for investigation or replacement, while irregular emission spikes during downhill operation might indicate injector or EGR valve malfunctions requiring targeted servicing. Gradual increases in emissions at moderate load conditions are consistent with sensor deterioration, suggesting recalibration or oxygen sensor replacement. These examples illustrate how the proposed framework can translate emissions anomalies into practical maintenance recommendations.
Compared to existing predictive maintenance approaches pertaining to low-emission vehicles, which typically depend on vibration monitoring, component-level sensor data or OBD fault codes, the current framework demonstrates the viability of using emissions signatures as diagnostic indicators. Despite the fact that conventional methods are effective as regards detecting mechanical faults, they do not directly describe efficiency losses or abnormal emissions patterns that exhibit energy management issues in hybrid systems. The proposed approach therefore complements the existing diagnostic strategies by linking emissions anomalies to useful maintenance decisions, broadening the scope of predictive maintenance solutions with respect to low-emission vehicles.
6.5. Strengths and Limitations of the Laboratory-Based Approach
The DL AM22 platform provided a controlled and repeatable environment for studying the influence of speed, gradient, and ambient temperature on CO2 emissions, enabling consistent data collection and reliable Random Forest model training. However, it does not capture real-world effects such as transient driver behaviour, aerodynamic drag, rolling resistance, and payload variation. Consequently, the results should be interpreted as a proof-of-concept demonstration rather than a fully generalisable emissions model. Future work will incorporate on-road telematics and controlled fault-injection experiments to establish causal links between emissions anomalies and component degradation under diverse conditions.
The platform also offers only three discrete gradient settings and three temperature levels, which constrained the number of operating points. Although this ensured experimental repeatability, expanding the operating space with additional gradients, temperatures, and continuous ramp profiles will generate a richer dataset suitable for testing more data-intensive models and for deeper comparison with ensemble methods such as Random Forest.
From an implementation perspective, the framework is lightweight and suitable for real-time deployment. The required inputs—speed, gradient, ambient temperature, and CO2 emissions—are measurable with standard on-board sensors, and the Random Forest model can run on typical ECU-level processors. Full deployment will require integration with OBD-II and telematics data streams and validation under real driving conditions.
Finally, the framework is specific to conventional HEVs that operate with frequent engine–motor interaction. Plug-in hybrid electric vehicles (PHEVs) exhibit extended all-electric operation and intermittent engine engagement, resulting in different emissions and degradation behaviour. Applying the method to PHEVs will require collecting PHEV-specific datasets and recalibrating the diagnostic thresholds.
7. Conclusions
This work proposed an emissions-based predictive maintenance framework for HEVs, using behaviour as a diagnostic signal under varying driving conditions. By analysing the impact of speed, gradient, and ambient temperature on emission levels, three models were trained and evaluated. The Random Forest model achieved the highest predictive accuracy, with an R2 score of 0.79 and MAE of 12.57 g/km, outperforming Linear Regression and Multilayer Perceptron. A rule-based classification scheme was developed to modify predicted emissions into valuable maintenance alerts predicated on defined thresholds. This logic was implemented in a MATLAB-based interface that allows real-time input and the visualisation of system outputs. Scenario-based validation confirmed the system’s ability to detect early signs of component degradation and associate them with possible mechanical faults. The framework demonstrates that emissions are an effective alternative in relation to condition monitoring, presenting a low-cost and interpretable tool for onboard diagnostics. However, as the present study is entirely based on laboratory-simulated data from the DL AM22 platform, the findings should be considered proof-of-concept. In practical terms, the framework requires only modest computational resources and standard onboard sensor inputs, which supports its practicality for real-time in-vehicle implementation once validated under real driving conditions.
In future, emissions-based predictive maintenance could be incorporated into telematics and vehicular edge-computing frameworks [34]. Equally, further research could target incorporating real-world telematics and OBD-II datasets to corroborate and extend the framework under varied and dynamic driving environments. Incorporating additional emissions indicators, for instance, nitrogen oxides () and hydrocarbons, () will increase fault coverage, particularly with respect to after-treatment systems. Similarly, using online learning to adapt to vehicle ageing and driving style, the system can automatically change its warning or limit values (thresholds) gradually. Application in embedded hardware and testing in real-time in-vehicle environments are also planned, assisting closed-loop energy management and maintenance scheduling directly within the vehicle’s control architecture.
Author Contributions
Conceptualisation, A.O., J.M. and M.I.; methodology, J.M.; software, M.I. and A.O.; validation, M.I. and A.O.; formal analysis, J.M.; investigation, J.M.; resources, M.I. and A.O.; data curation, M.I.; writing—original draft preparation, J.M.; writing—review and editing, M.I.; visualisation, A.O.; supervision, J.M.; project administration, J.M. All authors have read and agreed to the published version of the manuscript.
Funding
This research received no external funding.
Data Availability Statement
The original contributions presented in this study are included in the article. Further inquiries can be directed to the corresponding author.
Acknowledgments
The authors acknowledge Palestine Technical University—Kadoorie (PTUK) for providing access to the computing resources and software necessary for this work. Appreciation is also extended to Amman Arab University and Abdullah Al Salem University for their academic collaboration and support during the course of the research.
Conflicts of Interest
The authors declare no conflicts of interest.
Abbreviations
The following abbreviations are used in this manuscript:
| OBD | On-board diagnostics |
| ICE | Internal combustion engine |
| EGR | Exhaust gas recirculation |
| GUI | Graphical user interface |
| MLP | Multilayer Perceptron |
| MAE | Mean Absolute Error |
| RMSE | Root Mean Square Error |
| HEV | Hybrid electric vehicle |
| PHEV | Plug-in hybrid electric vehicle |
| EV | Electric vehicle |
| ESS | Energy storage system |
| PTUK | Palestine Technical University—Kadoorie |
References
- Statista. Global Carbon Dioxide (CO2) Emissions from Fossil Fuels and Industry from 1960 to 2024. 2024. Available online: https://www.statista.com/statistics/276629/global-co2-emissions/ (accessed on 18 February 2025).
- Munsi, M.S.; Chaoui, H. Energy Management Systems for Electric Vehicles: A Comprehensive Review of Technologies and Trends. IEEE Access 2024, 12, 60385–60403. [Google Scholar] [CrossRef]
- Liu, T.; Tan, W.; Tang, X.; Zhang, J.; Xing, Y.; Cao, D. Driving Conditions-Driven Energy Management Strategies for Hybrid Electric Vehicles: A Review. Renew. Sustain. Energy Rev. 2021, 151, 111521. [Google Scholar] [CrossRef]
- Wang, Z.; Shuai, S.; Li, Z.; Yu, W. A Review of Energy Loss Reduction Technologies for Internal Combustion Engines to Improve Brake Thermal Efficiency. Energies 2021, 14, 6656. [Google Scholar] [CrossRef]
- Yao, Y.; Li, J.; He, C.; Chen, Y.; Yu, H.; Wang, J.; Yang, N.; Zhao, L. Research on Particle Emissions of Light-Duty Hybrid Electric Vehicles in Real Driving. Atmos. Pollut. Res. 2024, 16, 102332. [Google Scholar] [CrossRef]
- Choudhary, A.; Fatima, S.; Panigrahi, B.K. State-of-the-Art Technologies in Fault Diagnosis of Electric Vehicles: A Component-Based Review. IEEE Trans. Transp. Electrif. 2022, 9, 2324–2347. [Google Scholar] [CrossRef]
- López, I.; Ibarra, E.; Matallana, A.; Andreu, J.; Kortabarria, I. Next Generation Electric Drives for HEV/EV Propulsion Systems: Technology, Trends and Challenges. Renew. Sustain. Energy Rev. 2019, 114, 109336. [Google Scholar] [CrossRef]
- Giechaskiel, B.; Komnos, D.; Fontaras, G. Impacts of Extreme Ambient Temperatures and Road Gradient on Energy Consumption and CO2 Emissions of a Euro 6d-Temp Gasoline Vehicle. Energies 2021, 14, 6195. [Google Scholar] [CrossRef]
- Senol, M.; Bayram, I.S.; Naderi, Y.; Galloway, S. Electric Vehicles under Low Temperatures: A Review on Battery Performance, Charging Needs and Power Grid Impacts. IEEE Access 2023, 11, 39879–39912. [Google Scholar] [CrossRef]
- Dong, H.; Zhuang, W.; Chen, B.; Wang, Y.; Lu, Y.; Liu, Y.; Yin, G. A Comparative Study of Energy-Efficient Driving Strategy for Connected Internal Combustion Engine and Electric Vehicles at Signalized Intersections. Appl. Energy 2022, 310, 118524. [Google Scholar] [CrossRef]
- Amer, M.; Masri, J.; Sajjad, U.; Hamid, K. Electric Vehicles: Battery Technologies, Charging Standards, AI Communications, Challenges, and Future Directions. Energy Convers. Manag. X 2024, 24, 100751. [Google Scholar] [CrossRef]
- Bai, S.; Liu, C. Overview of Energy Harvesting and Emission Reduction Technologies in Hybrid Electric Vehicles. Renew. Sustain. Energy Rev. 2021, 147, 111188. [Google Scholar] [CrossRef]
- Choi, Y.; Hwang, J.; Park, S. Effect of Driving Characteristics and Ambient Temperature on the Particle Emissions during Engine Restart of Spark Ignition Hybrid Electric Vehicle. Sci. Rep. 2023, 13, 17330. [Google Scholar] [CrossRef]
- Bartolome, G.J.C.; Santos, A.G.; Alano, L.M., II.; Ardina, A.A.; Polinga, C.A. Assessment of the On-Road Performance of Hybrid Electric Vehicles (HEVs) and Electric Vehicles (EVs) in Urban Road Conditions in the Philippines. World Electr. Veh. J. 2023, 14, 333. [Google Scholar] [CrossRef]
- Skuza, A.; Szumska, E.; Jurecki, R. Fuel Consumption and CO2 Emission Analysis of Hybrid and Conventional Vehicles in Urban Driving Conditions. Combust. Engines 2023, 62, 29–34. [Google Scholar] [CrossRef]
- Fernandes, P.; Macedo, E.; Tomás, R.; Coelho, M.C. Hybrid Electric Vehicle Data-Driven Insights on Hot-Stabilized Exhaust Emissions and Driving Volatility. Int. J. Sustain. Transp. 2024, 18, 84–102. [Google Scholar] [CrossRef]
- Wang, Y.; Li, K.; Zeng, X.; Gao, B.; Hong, J. Energy Consumption Characteristics Based Driving Conditions Construction and Prediction for Hybrid Electric Buses Energy Management. Energy 2022, 245, 123189. [Google Scholar] [CrossRef]
- Liu, T.; Tang, X.; Chen, J.; Wang, H.; Tan, W.; Yang, Y. Transferred Energy Management Strategies for Hybrid Electric Vehicles Based on Driving Conditions Recognition. In Proceedings of the 2020 IEEE Vehicle Power and Propulsion Conference (VPPC), Hanoi, Vietnam, 18–20 November 2020; pp. 1–6. [Google Scholar] [CrossRef]
- Masri, J.; Ismail, M.; Obaid, A. Power Flow Simulation and Thermal Performance Analysis of Electric Vehicles Under Standard Driving Cycles. Energies 2025, 18, 3737. [Google Scholar] [CrossRef]
- Liu, X.; Zhang, Y.; Chen, H. Applying Density-Based Clustering for the Analysis of Emission Events in Real Driving Emissions Calibration. Future Transp. 2024, 4, 4. [Google Scholar] [CrossRef]
- Mulholland, E.; Miller, J.; Bernard, Y.; Lee, K.; Rodríguez, F. The Role of NOx Emission Reductions in Euro 7/VII Vehicle Emission Standards to Reduce Adverse Health Impacts in the EU27 through 2050. Transp. Eng. 2022, 9, 100133. [Google Scholar] [CrossRef]
- Wasserburger, A.; Didcock, N.; Hametner, C. Efficient Real Driving Emissions Calibration of Automotive Powertrains under Operating Uncertainties. Eng. Optim. 2021, 1, 140–157. [Google Scholar] [CrossRef]
- Krysmon, S.; Dorscheidt, F.; Claßen, J.; Düzgün, M.; Pischinger, S. Real Driving Emissions—Conception of a Data-Driven Calibration Methodology for Hybrid Powertrains Combining Statistical Analysis and Virtual Calibration Platforms. Energies 2021, 14, 4747. [Google Scholar] [CrossRef]
- Kim, K.; Chung, W.; Kim, M.; Kim, C.; Myung, C.-L.; Park, S. Inspection of PN, CO2, and Regulated Gaseous Emissions Characteristics from a GDI Vehicle under Various Real-World Vehicle Test Modes. Energies 2020, 13, 2581. [Google Scholar] [CrossRef]
- Kontses, D.; Rossetti, M.D.; Mason, S. Particle number (PN) emissions from gasoline, diesel, LPG, CNG and hybrid-electric light-duty vehicles under real-world driving conditions. Atmos. Environ. 2020, 222, 117–126. [Google Scholar] [CrossRef]
- Chong, H.S. Real-World Fuel Consumption, Gaseous Pollutants, and CO2 Emission of Light-Duty Diesel Vehicles. Sustain. Cities Soc. 2020, 53, 101925. [Google Scholar] [CrossRef]
- De Lorenzo. Hybrid and Electric Systems. Available online: https://delorenzoglobal.com/en/product/hybrid-and-electric-systems/ (accessed on 17 March 2025).
- Shingala, B.; Panchal, P.; Thakor, S.; Jain, P.; Joshi, A.; Vaja, C.R.; Siddharth, R.K.; Rana, V.A. Random Forest Regression Analysis for Estimating Dielectric Properties in Epoxy Composites Doped with Hybrid Nano Fillers. J. Macromol. Sci. B 2024, 63, 1297–1311. [Google Scholar] [CrossRef]
- Fu, H.; Yang, D.; Wang, S.; Wang, L.; Wang, D. A Novel Online Energy Management Strategy for Fuel Cell Vehicles Based on Improved Random Forest Regression in Multi Road Modes. Energy Convers. Manag. 2024, 305, 118261. [Google Scholar] [CrossRef]
- Wekalao, J.; Patel, S.K.; Kumar, A.U.; Armghan, A.; Kraiem, H.; Said, Y. Detection of Proteins in a Surface Plasmon Resonance Biosensor Based on Hybrid Metasurface Architecture and Behaviour Prediction Using Random Forest Regression. Plasmonics 2024, 19, 5165–5185. [Google Scholar] [CrossRef]
- Zhou, W.; Yan, Z.; Zhang, L. A Comparative Study of 11 Non-Linear Regression Models Highlighting Autoencoder, DBN, and SVR, Enhanced by SHAP Importance Analysis in Soybean Branching Prediction. Sci. Rep. 2024, 14, 5905. [Google Scholar] [CrossRef] [PubMed]
- Knights, V.; Prchkovska, M. From Equations to Predictions: Understanding the Mathematics and Machine Learning of Multiple Linear Regression. J. Math. Comput. Appl. 2024, 3, 1–8. [Google Scholar] [CrossRef]
- Tashakkori, A.; Talebzadeh, M.; Salboukh, F.; Deshmukh, L. Forecasting Gold Prices with MLP Neural Networks: A Machine Learning Approach. Int. J. Sci. Eng. Appl. 2024, 13, 13–20. [Google Scholar] [CrossRef]
- Cao, Y.; Zhao, C.; Zhang, Y.; Jin, Y. Optimizing Resource Allocation and Energy Efficiency in Vehicle Mobile Edge Computing with Blockchain Integration. IEEE Internet Things J. 2025, 12, 36807–36818. [Google Scholar] [CrossRef]
Disclaimer/Publisher’s Note: The statements, opinions and data contained in all publications are solely those of the individual author(s) and contributor(s) and not of MDPI and/or the editor(s). MDPI and/or the editor(s) disclaim responsibility for any injury to people or property resulting from any ideas, methods, instructions or products referred to in the content. |
© 2025 by the authors. Licensee MDPI, Basel, Switzerland. This article is an open access article distributed under the terms and conditions of the Creative Commons Attribution (CC BY) license (https://creativecommons.org/licenses/by/4.0/).