
Suitability Assessment of NOx Emissions Measurements with PTI Equipment

1
Escuela de Ingeniería y Arquitectura, University of Zaragoza, 50018 Zaragoza, Spain
2
Research Centre for Energy Resources and Consumption (CIRCE), Universidad de Zaragoza, 50018 Zaragoza, Spain
3
New Technologies in Vehicles and Road Safety (VEHIVIAL), Universidad de Zaragoza, I+D+i Building-Campus Río Ebro, Mariano Esquillor Gómez s/n, 50018 Zaragoza, Spain
*
Author to whom correspondence should be addressed.
Vehicles 2022, 4(4), 917-941; https://doi.org/10.3390/vehicles4040050
Submission received: 29 July 2022
/
Revised: 17 September 2022
/
Accepted: 18 September 2022
/
Published: 21 September 2022
(This article belongs to the Special Issue Feature Papers in Vehicles)
Abstract
:The measurement of NOx emissions in vehicles has so far been exclusively carried out during the type-approval process. For this purpose, high-precision gas measurement laboratory equipment and Portable Emission Measurement Systems (PEMS) are used. Both types of equipment are costly in terms of price, maintenance, complexity, and time of use (calibration and maintenance requirements). Currently, NOx emissions measurements in Periodic Technical Inspections (PTIs) are being considered, but PEMS or laboratory equipment is unsuitable for this function, and PTI-grade equipment has to be used. Although CO and O2 are currently being reliably measured with this equipment, there is not enough information about its accuracy for NOx measurements. Accordingly, in this paper, simultaneous measures have been performed over the same engine in a test cell, with a laboratory and a PTI gas analyser to assess the accuracy of the latter. When performing the test with the most similar conditions found in PTI, our results show that the PTI gas analyser shows an average deviation of 2.6 ppm and 9% rel. with respect to high-precision laboratory equipment for concentrations below 700 ppm NOx, which can be considered acceptable for periodic technical inspections.
1. Introduction
The European Environmental Agency [1] has considered air pollution in urban areas the most significant environmental health risk in Europe. NOx emissions are a leading and harmful factor in air pollution [2] since they were directly responsible for 46,150 premature deaths in 2021 [2]. If NOx-derived pollutants, such as tropospheric ozone (O3) and Particulate Matter (PM) [3], are accounted for, this figure would increase to 403,930 premature deaths in 2019. This means that in EU-27, the 2019 mortality related to NOx emissions was 16.5 times higher than mortality caused by traffic accidents (24,508 causalities in 2019, according to Eurostat https://ec.europa.eu/eurostat/data/database (accessed on 22 February 2022)).
Worldwide, 40–70% of NOx emissions originate from road transport [4,5], and specifically for the EU-27, 39% of NOx emissions are generated by road vehicles with combustion engines [6]. Of this amount, diesel engine vehicles are responsible for approximately 85% [7,8,9]. This is particularly problematic in the EU since around 70% of diesel passenger cars and vans worldwide are registered in this region [10].
Long aware of the importance of reducing emissions from road transport, EU authorities have, over the last 20 years, introduced legislation to restrict pollutant emissions from vehicles, including NOx emissions. For instance, the creation of Low-Emission Zones (LEZ) in cities is being promoted across the EU, to reduce the population’s exposure to high concentrations of pollutants in these areas. Similarly, restrictions on vehicle emissions have strengthened over the years [10,11], lowering the emission thresholds for pollutants from combustion engines (Euro emission levels). Type-approval processes have become more demanding, introducing a new homologation cycle (WLTP) and new tests (RDE) to approximate the emission levels of the type-approval processes with the actual emissions of the vehicles on the road. These requirements have led to more efficient vehicle Exhaust After-Treatment Systems (EATS), so newer vehicles appear to have lower emissions.
That said, the lack of a system to control NOx emissions along the life cycle of the vehicles has meant that NOx emissions in the air are higher than expected from the theoretical level of emissions of vehicles [10,11,12]. Therefore, controlling and measuring NOx emissions at PTI is being discussed to detect the vehicles with the highest NOx emissions due to tampering and/or malfunction.
The measurement of NOx in PTI has faced significant problems, since the NOx emissions of diesel engines are intricately linked to the power demand generated in the engine, something that is difficult to evaluate in a simple inspection such as the PTI.
Therefore, several studies have been carried out over the last few years, trying to define the most suitable method for NOx measurement in PTI. So far, no single method suitable for implementation in the European PTI system has yet been adopted.
One of the most recent proposals was made by the International Motor Vehicle Inspection Committee (CITA) in 2022, which presented a position paper [13] about this issue. CITA concluded that measuring NOx at idling following a specific cycle under different internal vehicle loads [14] as presented in Section 3 is the most suitable method to quickly test actual Euro 5 and Euro 6 vehicles.
However, the method’s suitability also depends on the quality of the NOx measurement equipment available at PTI in terms of reliability and accuracy.
In 2011, CITA published the TEDDIE study [15,16], which analysed the various technologies existing at that time for NOx measurement, trying to determine which was most suitable for use in PTI. The recommendation was that the most appropriate technologies for PTI in terms of accuracy and stability were an electrochemical cell or Non-Dispersive Ultra Violet (NDUV) spectroscopy, the latter being more expensive. The NDUV analysers highly correlated with Chemiluminescence Detectors (CLD), but no studies have yet compared electrochemical cell analysers with other instruments. The study showed that electrochemical cells need to improve but it was expected that they would meet PTI requirements.
Currently, there are no defined requirements or specifications for NOx measurement equipment in the inspection and/or maintenance of in-use vehicles, as observed in OIML publications [17].
To verify that the equipment currently available at PTI is adequate for the task, the measurement capacity of the equipment must be analysed and compared to a reference value, obtained from the measurement of laboratory equipment used in the analysis and homologation processes of the engines, vehicles, and components. Using this laboratory equipment as a reference, it is possible to assess the accuracy and reliability of the measurements obtained with PTI-grade equipment. Reliability has to be understood as the ability of the equipment to be trustworthy or perform consistently well, taking into account that the main objective of the equipment is to measure in PTI. The accuracy level needs to be also consistent with PTI activities.
This paper aimed to assess the suitability of the mentioned equipment for measuring NOx emissions by comparing its performance with precise laboratory equipment, following the method proposed by CITA. Deviations of less than 10% rel. and/or 10 ppm in absolute terms were considered acceptable.
Once a suitable method and the related equipment for NOx measurement at PTI have been defined, it could be possible to implement a NOx measurement system at PTI to periodically monitor the level of NOx emissions from the fleet of diesel passenger cars and Light-Duty Vehicles (LDV). Accordingly, vehicles with the highest NOx emissions in urban areas (where these emissions are most harmful) would be detected. Moreover, valuable information on the emissions of all vehicles would be provided. This, in turn, would allow, for example, a validation of the effectiveness of the new LEZs, comparing the air quality measurement data with the NOx emissions of vehicles authorised to circulate in those areas.
2. Materials and Methods
To compare the accuracy of a PTI-grade gas analyser with a Laboratory-grade gas analyser, facilities of the CMT-Motores Térmicos of Universitat Politècnica de Valencia, a prestigious research and postgraduate educational centre involved in the R + D of Applied Thermo-Fluid Science, were used. These facilities are widely used for advanced research publications [18,19,20].
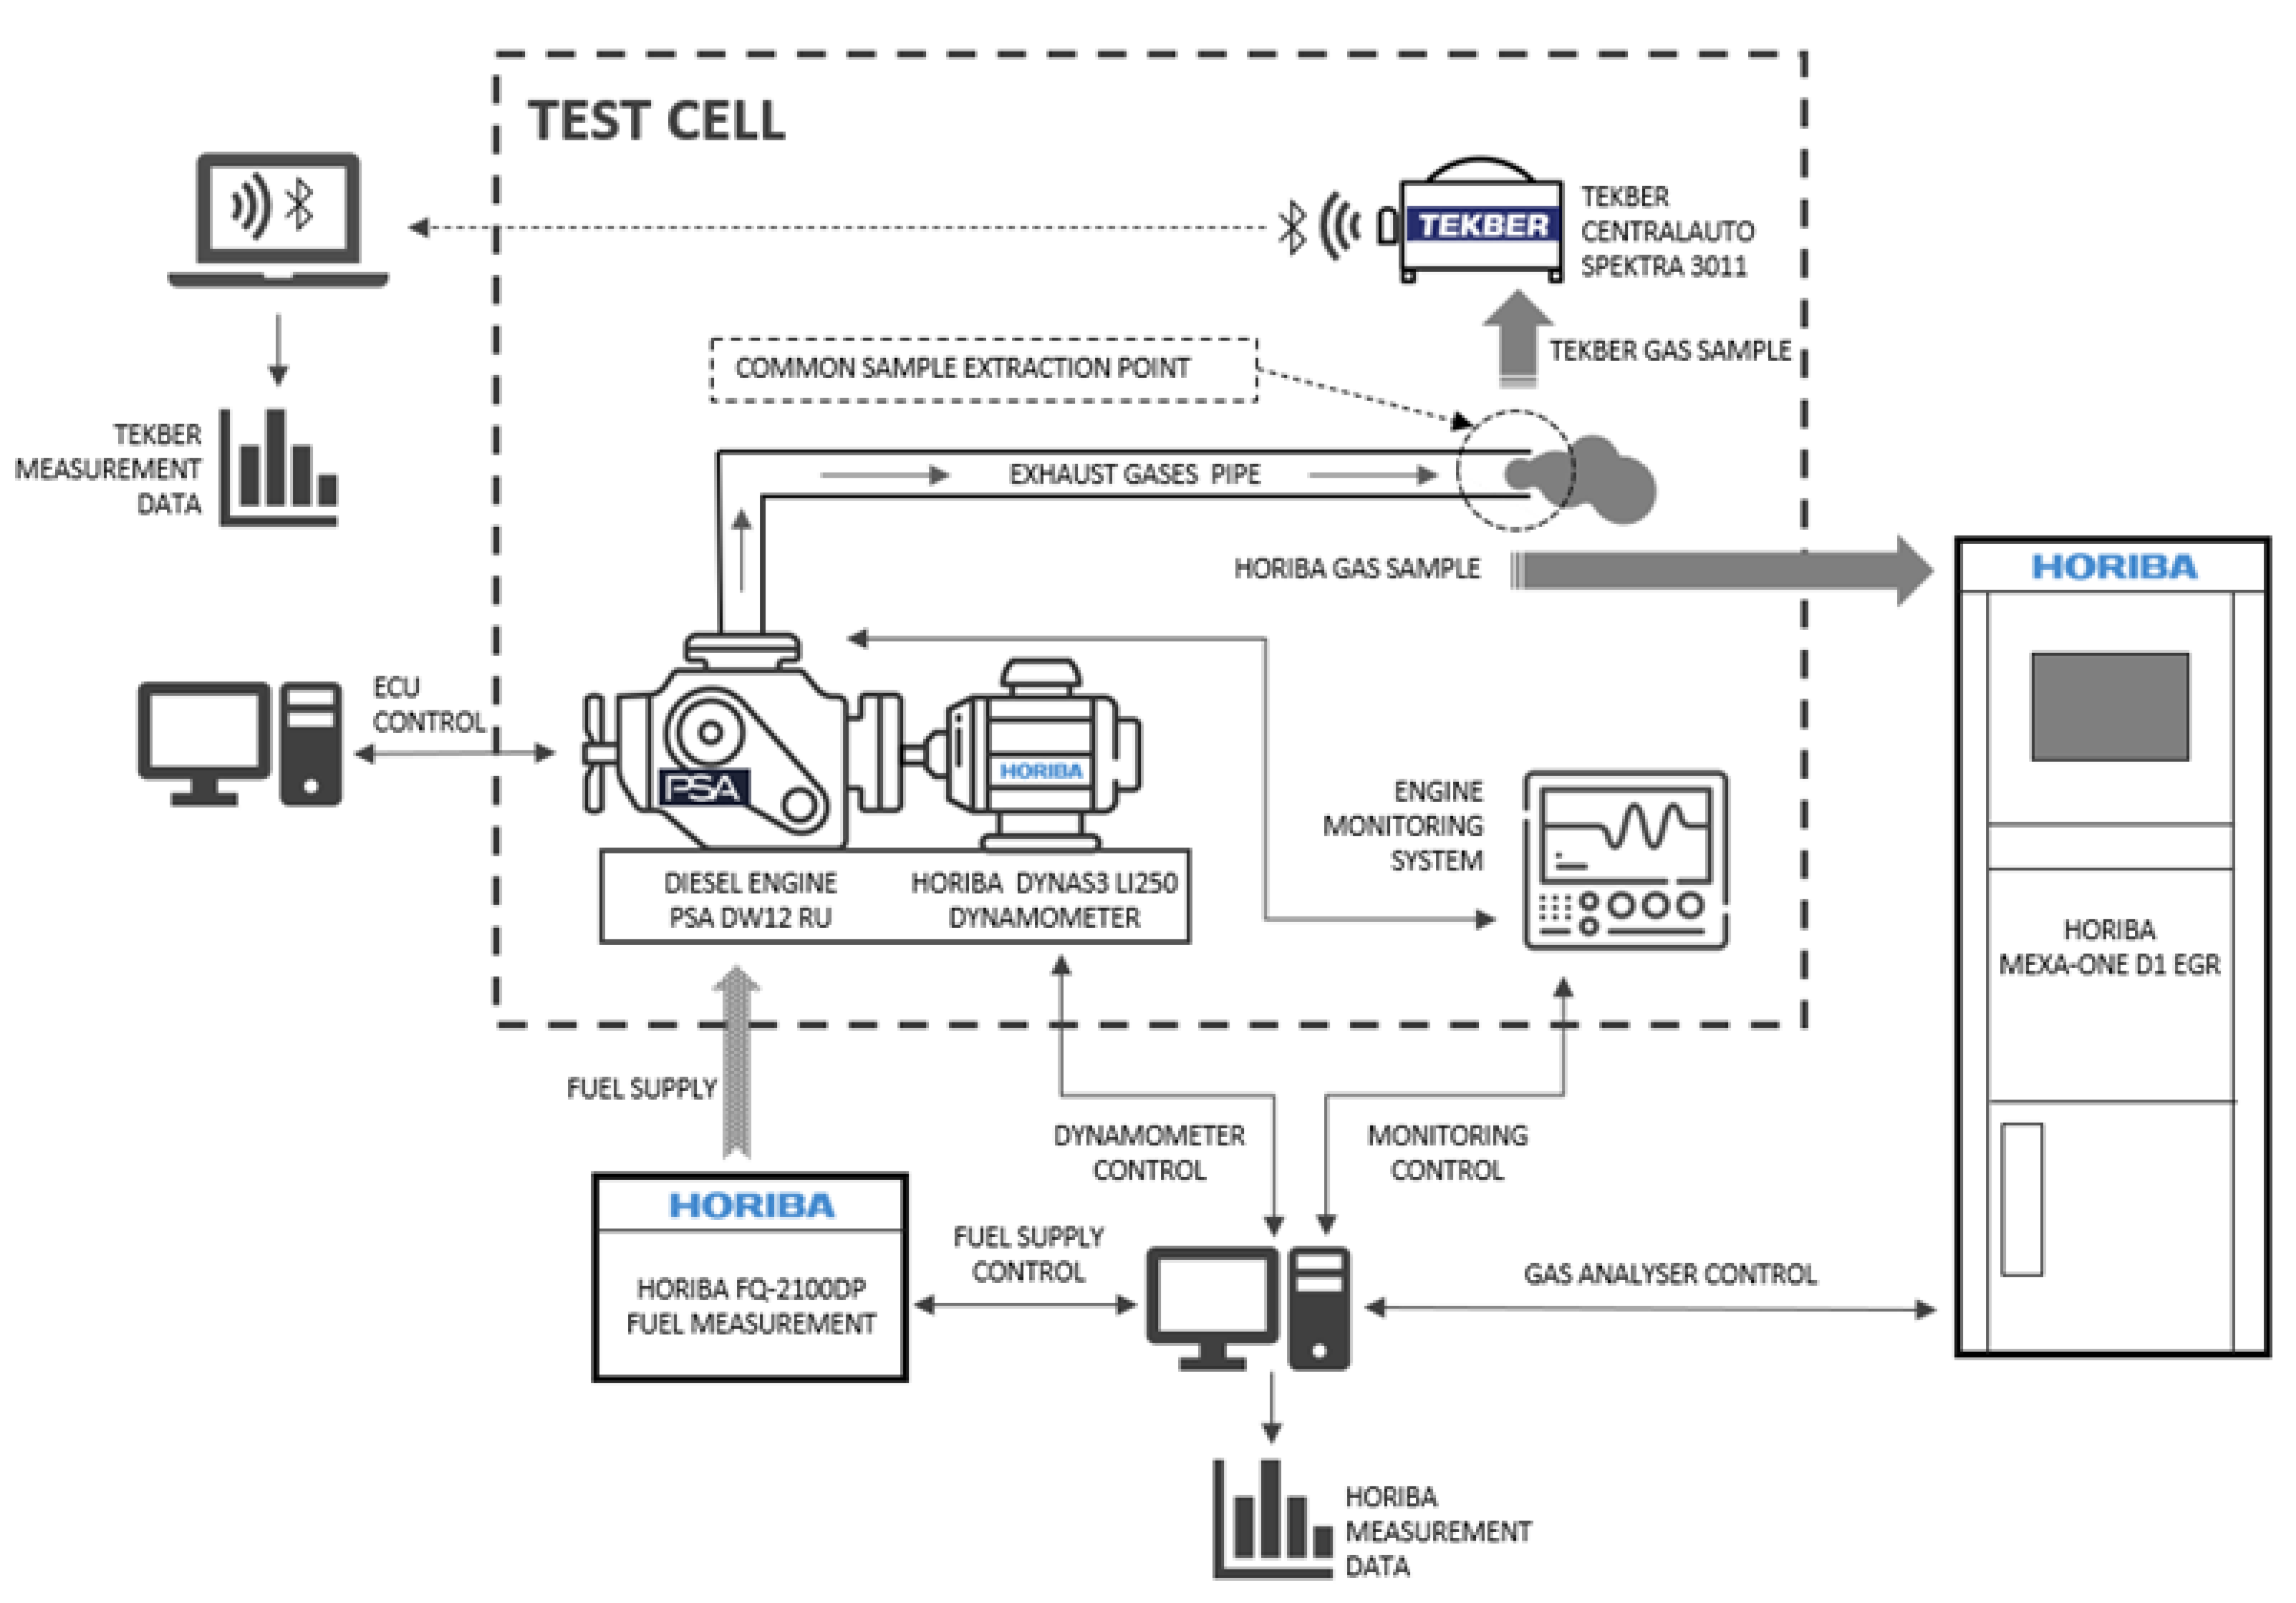
In this facility, a test cell with a diesel engine connected to an electric dynamometer allows for modifying the behaviour of the load demand of the engine. A complex monitoring system provides detailed information about the working conditions of the engine and a laboratory gas analyser measures the gaseous emissions from the exhaust. The test installation is shown in Figure 1.
A PTI gas analyser connected to the engine’s exhaust pipe, at the same point where the laboratory gas analyser collects exhaust gases, allows measuring the gas emissions from the engine simultaneously. In this way, NOx concentrations in engine exhaust gases can be measured with both pieces of equipment to compare the results. Data obtained with the laboratory equipment were taken as the reference values.
Different engine situations were evaluated to compare the results from both pieces of measuring equipment in a wide range of engine working conditions, thereby checking the suitability of the PTI gas analyser to measure NOx emissions.
2.1. Diesel Engine
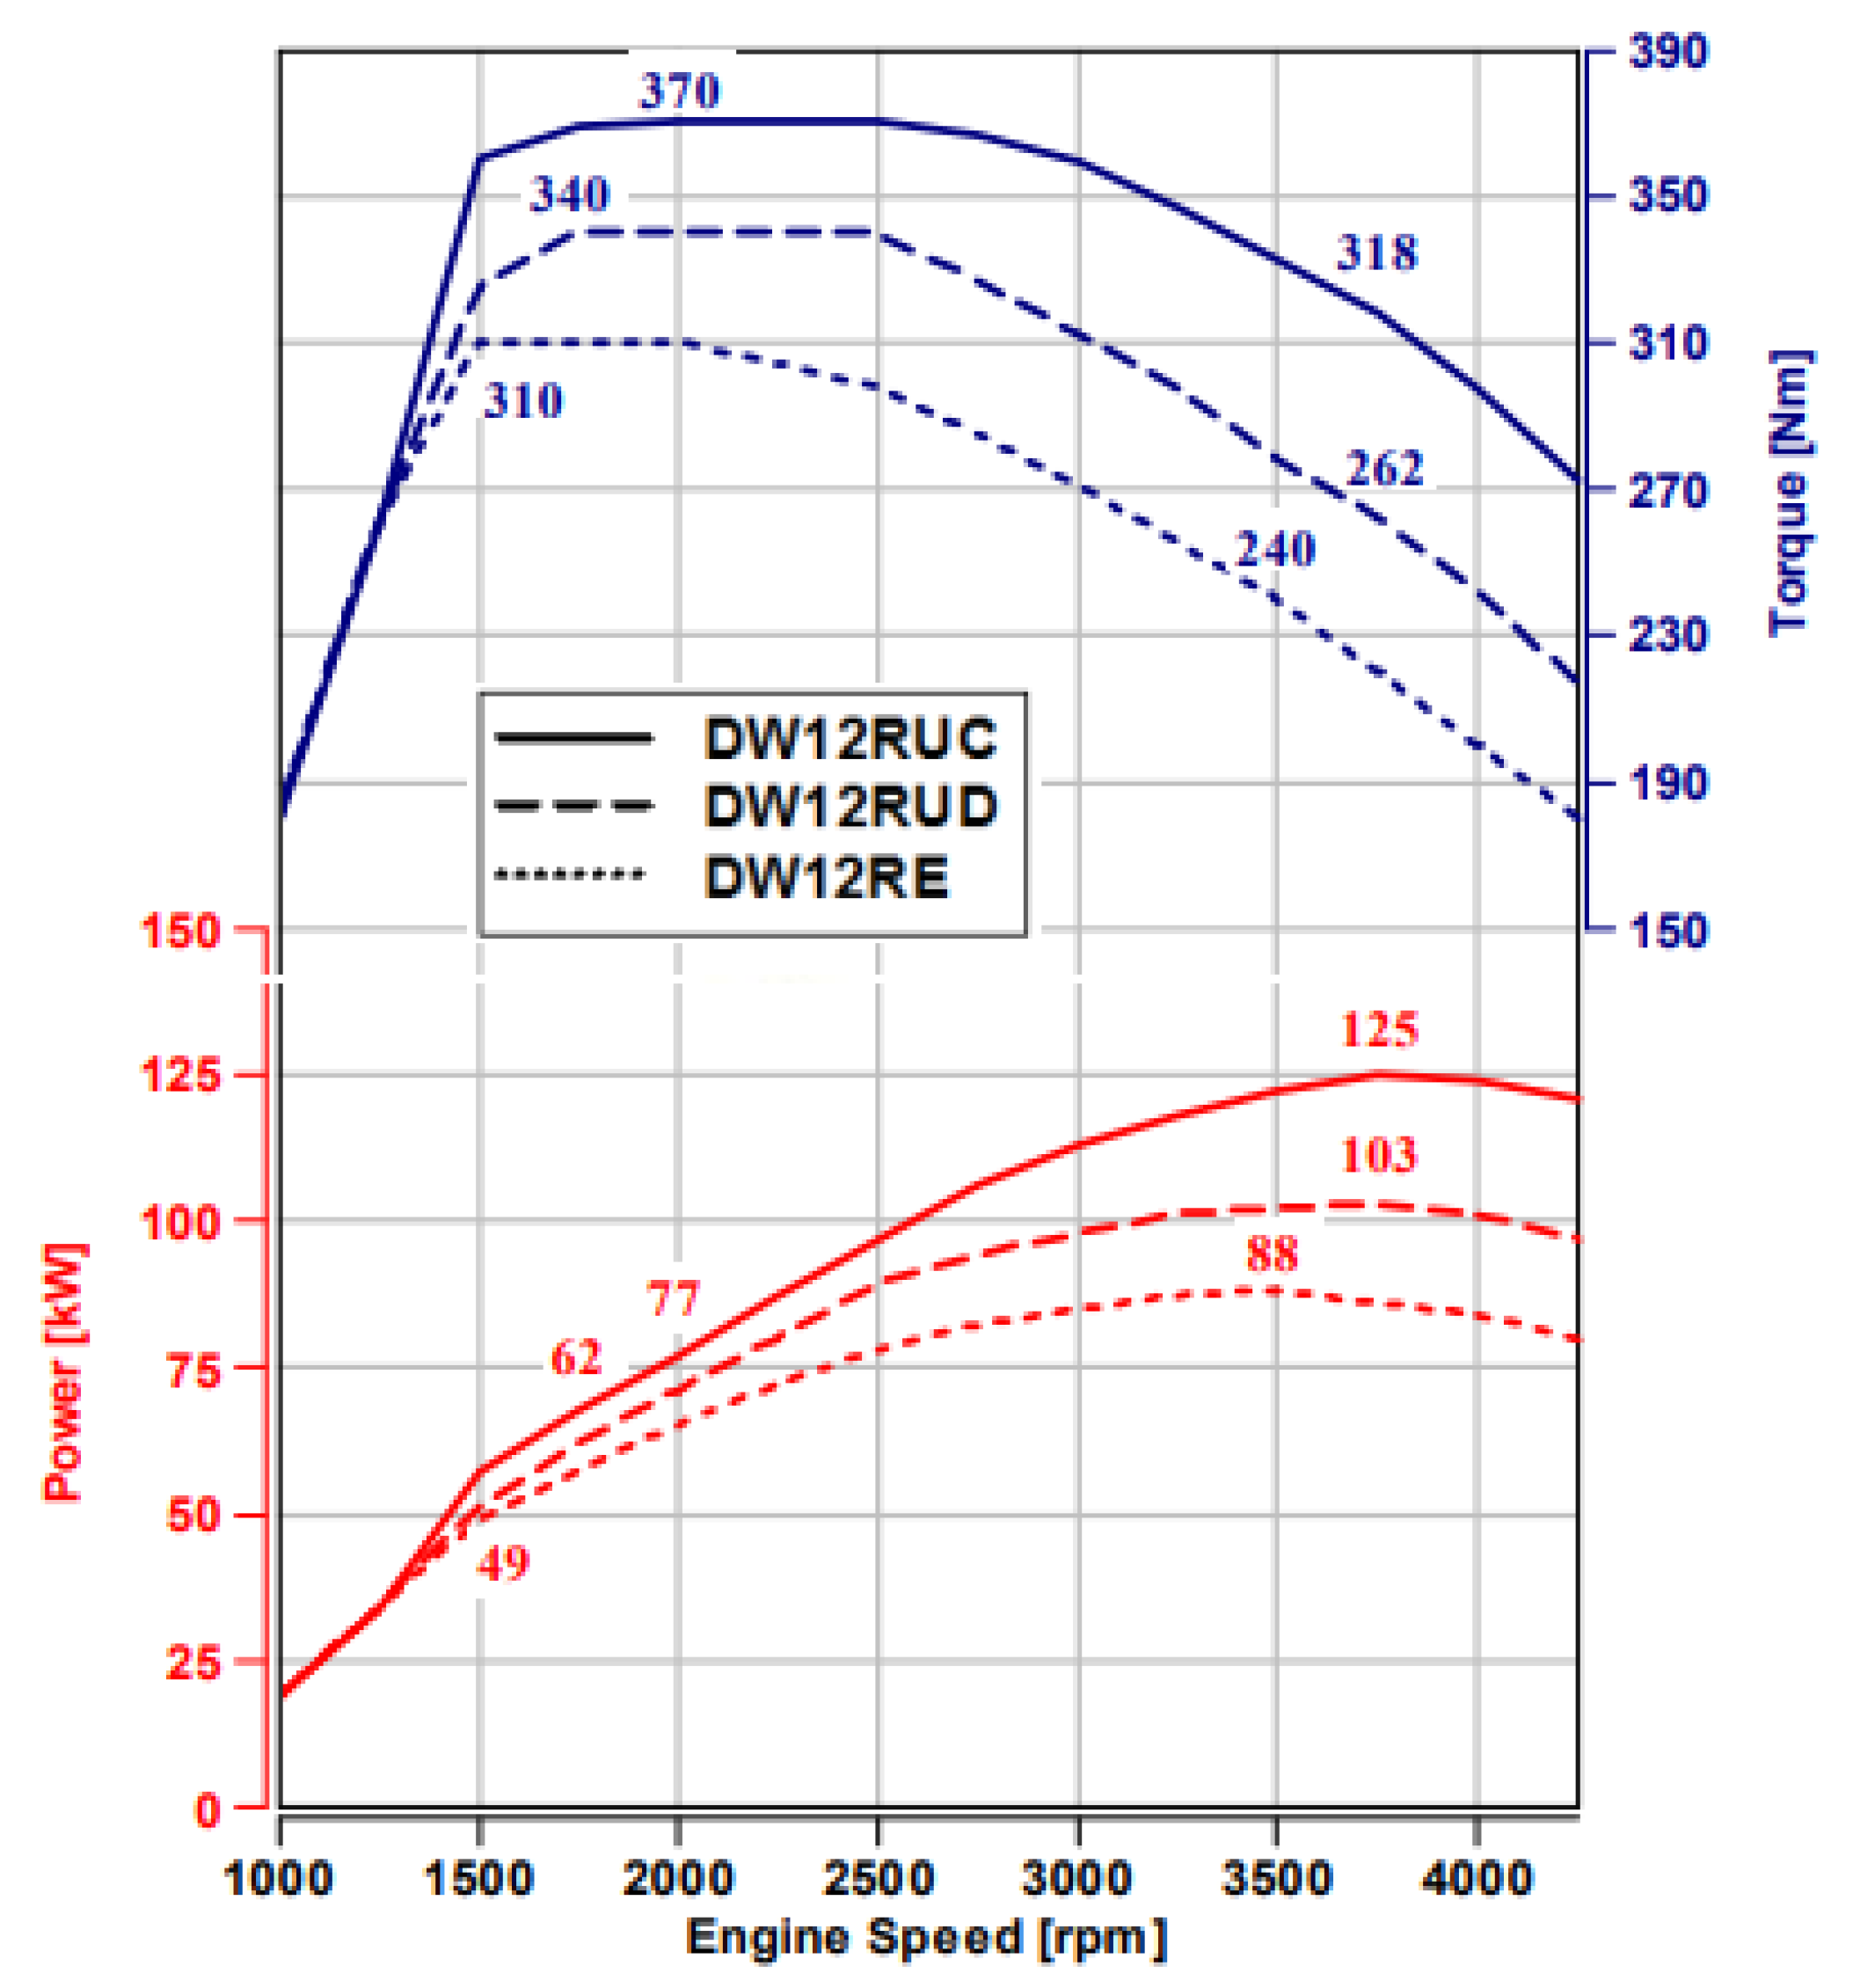
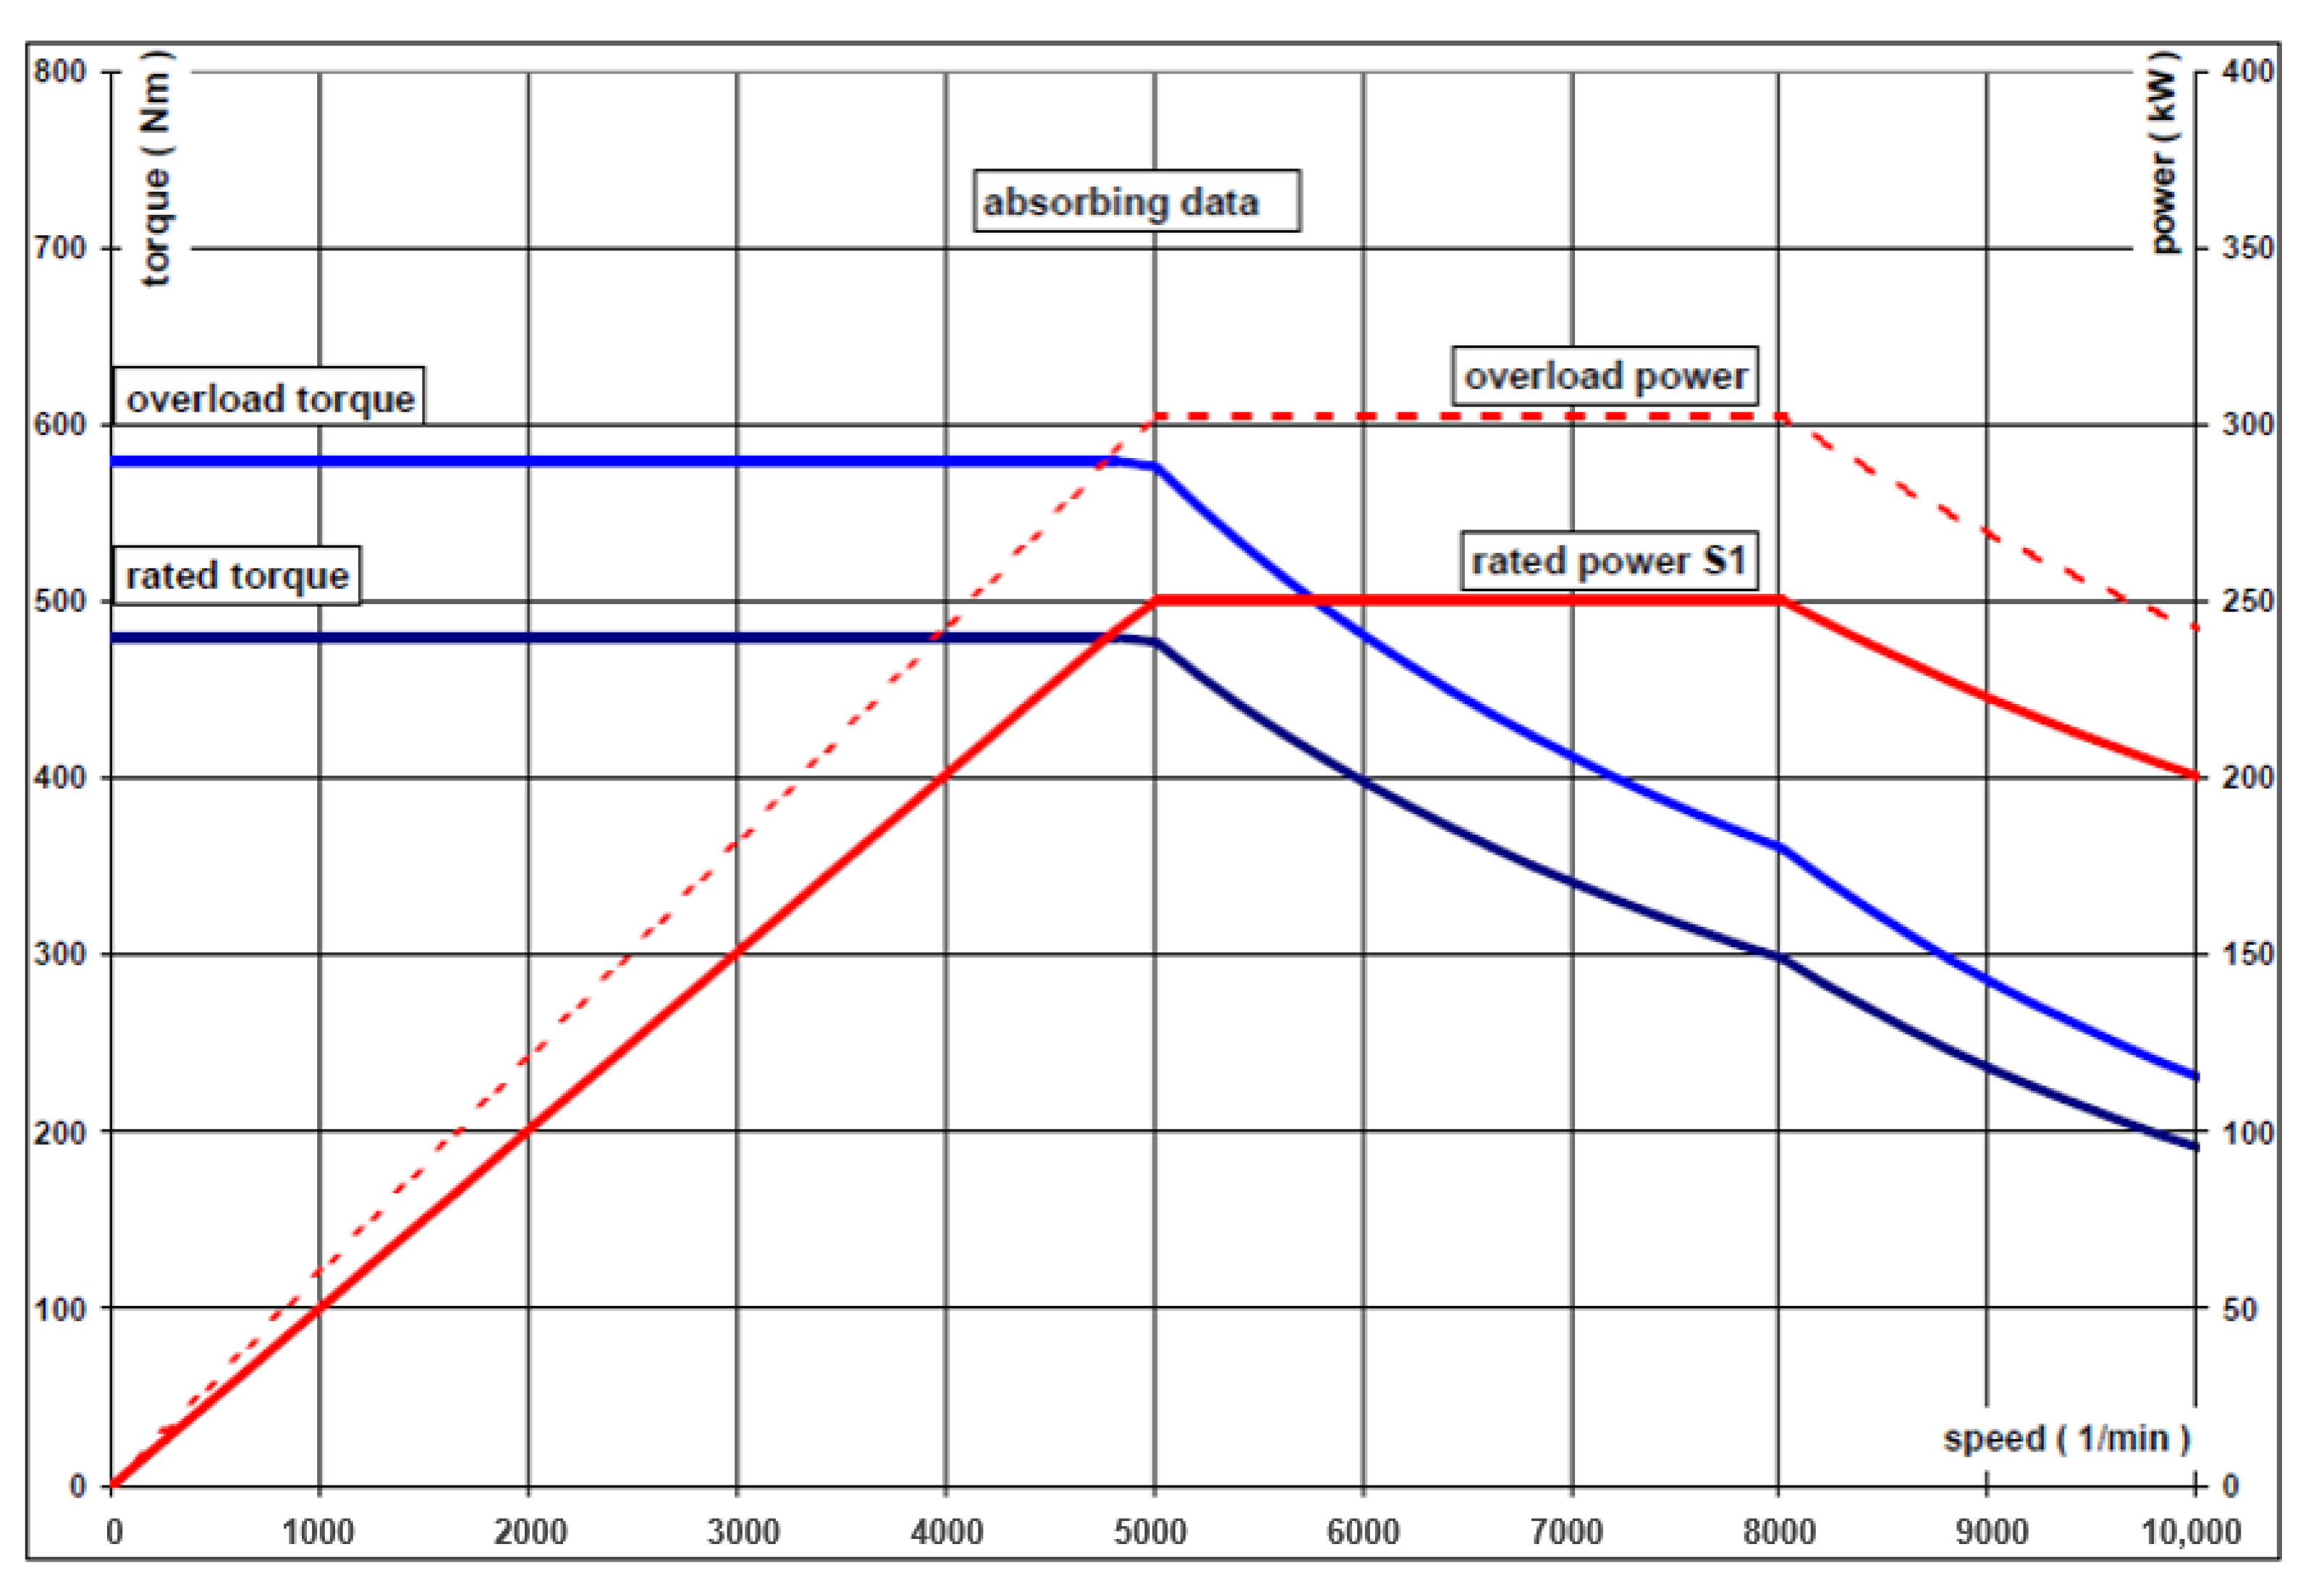
A commercial diesel engine from the PSA group (PSA DW12 RU) was used, with the technical characteristics indicated in Appendix A, Table A1. Specifically, it is a turbocharged 16-valve diesel engine from the DW12 family of PSAs, with 2179 cm3 of engine size, updated to meet the Euro 6d-TEMP emission standard. It has been commonly used in LDVs such as the Citroën Jumper and Peugeot Boxer since 2019. The version of the engine analysed was the 121 kW CEE power and 370 N·m torque, with its performance curve shown in Appendix A, Figure A1.
The only difference between it and the standard engine is the necessary modifications to install it into the test cell, where a wide variety of variables and conditions can be measured and controlled.
Since the primary goal of the test was to compare NOx measures from the two gas analysers, the Selective Catalytic Reduction (SCR) system of the engine was disconnected, to avoid the NOx reduction by this system and to ensure a minimum amount of NOx emissions. The Exhaust Gas Recirculation system (EGR) was connected and disconnected in different tests to provide a variety of NOx emission behaviours. When connected, the EGR was commanded by the Electronic Control Unit (ECU) of the engine, according to the engine manufacturer program. The rest of the equipment of the engine (injection system, turbocharger, …) was also controlled by the ECU.
The engine fuel supply was provided through a Horiba FQ-2100DP Fuel Consumption Measurement System to control the mass and volumetric flow rate continuously. This equipment allows for accurately measuring the fuel consumption of combustion engines on chassis, engine and powertrain test stands, or even altitude simulations on chassis dynamometers. Technical characteristics for the fuel consumption system can be found in Appendix A, Table A2.
The load demand on the engine was generated and regulated through a Horiba Dynas3-LI250 air-cooled dynamometer connected to the engine power output. In this way, the torque demanded by the engine could be controlled with high precision. Technical characteristics for the dynamometer can be found in Appendix A, Table A3.
With full control of the engine’s ECU, multiple engine operating parameters can be known in real-time. In addition, a complete engine monitoring system (such as intake air of the engine) allows for measuring temperatures and pressures in several components of the engine (such as turbocharging system, admission system, exhaust system, EGR system…), providing a wide range of working data on the engine. Moreover, the test cell conditions were measured to control the air temperature and pressure in the test cell at any point.
2.2. PTI Gas Analyzer
PTI has strict requirements that must be satisfied regarding the inspection time and cost of the process. Most of the equipment typically used is of “PTI-grade”, specifically designed to be used in PTI with intensive use, minimum maintenance costs, ensured metrological control, and without intervention over the vehicle to perform the inspection. Accordingly, equipment from mechanical workshops or homologation laboratories cannot be used.
Some of the leading PTI emissions equipment can measure NOx. In this case, our choice was the gas analyser TEKBER CENTRALAUTO model SPEKTRA 3011, commonly used in PTI stations in Spain. It is used to measure CO emissions and lambda values in the exhaust gases of gasoline engine vehicles. The equipment used has Model Test (Class I) No. 370-B-57/12-M and follows the UNE 82501 (equivalent to ISO 3930:2000 [21]). For the tests, it was equipped with an electrochemical NOx sensor, which is included in the Model Test approval of the equipment. The cross-sensitivity of the NOx sensor, as well as the rest of the technical characteristics, are detailed in Appendix A, Table A4). The gas analyser is based on the Andros 6900 subsystem, which complies with worldwide gas-measurement performance specifications for automotive emissions, including EPA ASM, ASM/BAR-97, OIML Class 0, and OIML Class 1.
2.3. Laboratory Gas Analyzer
The diesel engine’s test cell is equipped with a motor exhaust gas analyser Horiba MEXA-ONE D1 EGR vers. 1.12.5 HGS 4CW5MT9, and NOx analysers, specifically model CLA-02OV-3-RBYNCY6M. This complex equipment allows for the simultaneous measurement of several pollutants in the exhaust gas stream, being a flexible measurement system for a wide range of applications.
Technical specifications of the pollutants measured by the equipment are listed in Appendix A, Table A5, with the complete set of possibilities listed in Appendix A, Table A6.
The NOx measurement technology in this equipment (CLD) is commonly used in emission certifications and compliance testing and is regulated by UN/ECE R83 [22] and EPA CFR Part 1065 [23] and Part 1066 [24]. CLD technique is characterised by a wide linear dynamic range, high accuracy (this technique can detect parts per trillion concentrations of NO), and fast response time. Specifically, optimal nitrogen compound measurements comprise one of the main capabilities of the equipment, even when performing multi-point sampling. The Dual-CLD method used by the equipment detects NOx and NO simultaneously, calculating the NO2 concentration by subtracting the NO from the NOx concentration.
According to the manufacturer, this type of motor exhaust gas analyser can be used for RDE tests on a chassis dynamometer, catalyst testing in automobiles and components, engine testing in automobiles and components, and measuring vehicle emissions on a chassis dynamometer.
For these applications of validation and verification of vehicles, components, and subsystems, equipment with high measurement accuracy and reliability is required. The equipment calibration is optimised with a Gas Divider Controller (GDC-one) to ensure the accuracy of measurements and a fixed installation to supply certified calibration gases to the equipment.
2.4. Tests Performed
Diverse types of measurements were performed to assess the measurement capability of the PTI equipment under the broadest possible range of operating conditions:
- By modifying the load demand to which the engine is subjected, acting through the dynamometer over the engine.
- By modifying engine operating parameters such as engine speed and allowing or not allowing the EGR to be commanded by the ECU programming (by accessing directly through the ECU).
With the variation of these parameters, two different types of tests have been performed to compare the gas analysers. Technical descriptions of the test are included in Section 3.
The value of NOx concentration was simultaneously measured with both gas analysers to compare results, assuming the value measured from the Horiba gas analyser as the reference value.
2.5. Equipment Calibration
Both types of equipment were calibrated daily, according to the respective manufacturer’s instructions, to ensure measurement accuracy.
The Tekber gas analyser, which has a span calibration gas range from 100 to 5000 ppm NOx was calibrated with a span calibration-Certified gas bottle with a concentration of 2002.9 ppm of NOx (according to ISO/IEC 17025:2005 [25]). For the calibration process, the gas must be supplied with a flow rate of 1 litre/min, and pressure must be regulated to 5 PSIG. Before the span calibration, a Zero calibration is required [26].
The Horiba gas analyser was calibrated according to the manufacturer’s protocol through a fixed installation connected to the certified calibration gas for the several calibration gases needed.
The first step for the NOx calibration process is to use Zero gas calibration (nitrogen) in the minimal calibration range (10 ppm). The following step is to perform the span calibration in the certified gas bottle range. In this case, the span calibration-certified gas bottle’s concentration was 853 ppm, and the range for calibration was 1000 ppm. Finally, Zero gas is used again in the range of the span calibration-certified gas bottle (1000 ppm). This process can be performed manually or in an automated way.
3. Results
This section shows results from the set of tests performed. Although the Horiba equipment can provide NO, NO2, and NOx values, the Tekber equipment only provides NOx concentration values, so the comparison was made exclusively with the NOx concentration.
Another difference between the equipment is the data acquisition frequency. The Horiba gas analyser can measure with a 10 Hz frequency, while the Tekber gas analyser can only measure with a 1 Hz frequency. This difference can be significant when analysing the behaviour of both devices, because the Tekber equipment could not detect some fast variations in NOx concentration (e.g., instantaneous peak values).
The Horiba gas analyser provides results of NOx concentration on a dry basis, while the Tekber gas analyser provides results on a wet basis. For the same sample, the dry basis concentration value is higher than the wet basis concentration value.
No correction has been made in the results of either equipment (dry basis to wet basis, or vice versa), because the objective of the analysis was to compare the direct result obtained by the PTI equipment (the value that was obtained when measuring during the vehicle inspection) with the real concentration value (the reference value, the most accurate possible measurement provided by laboratory equipment). Hence, the aim was not to validate or reproduce the homologation process of vehicles by applying corrections to the measurements from this process [22].
Currently, the gas emission measurements in PTI are always on a wet basis since the equipment must be as economical as possible. Consequently, the cost of installing (and maintaining) the necessary means for an accurate dry basis measurement is not justified by the advantage provided by the increase in accuracy. Converting the dry measurement obtained by the Horiba to a wet basis measurement would imply introducing uncertainty to the results obtained by the equipment. Moreover, it does not provide significant additional information to the objective of the analysis (which is to assess the suitability of the equipment for measuring NOx in PTI) that would justify the increase of uncertainty.
3.1. Results of Static Idling Internal Load Tests
The Static Idling Internal Load Test is a method designed to measure NOx emissions from vehicles in PTI in static conditions. This method is based on the variation of NOx concentration in the exhaust pipe of a vehicle and its relation with the variation of the load demand applied to the engine, and was identified by CITA as an effective way for current NOx measurements in Euro 5 and Euro 6 diesel vehicles [13].
An extensive description of the method can be found in [14]. In summary, it consists of a measurement of NOx concentration, while the engine is at idle speed, starting with all vehicle internal consumption switched off, i.e., starting with the lowest possible torque demand in the engine. The torque demand is increased by switching on various items of vehicle equipment (mainly the air-conditioning system, lighting system, and rear-window-heating system), which generates a variation in the load demand over the engine and, because of this, a variation in the NOx concentration in the exhaust pipe.
The NOx concentration in the pipe exhaust stream is measured with a gas analyser, and the load demand on the engine is controlled through the OBD system, with the value of “% engine load” provided by the ECU of the vehicle (PID $04 according to SAE J1979/ISO 15031-5) [27].
The test is a five-stage measurement process as shown in Figure 2, according to the instructions in Table 1. The time duration of each stage is associated with obtaining enough data to get a representative average value. Typically, at least 20 s of stable engine load data are recorded. Therefore, the duration of the stages may not be exactly the same between the several stages because it depends on the vehicle’s behaviour along the measurement process.
Tests were carried out in four different conditions for a wide range of results:
- Static Idling Internal Load Test with EGR, low load condition;
- Static Idling Internal Load Test with EGR, high load condition;
- Static Idling Internal Load Test without EGR, low load condition;
- Static Idling Internal Load Test without EGR, high load condition.
As explained, the method is designed to be performed on diesel vehicles in PTI. However, the test carried out in the test cell procedure cannot be exactly the same because there was no vehicle but only its engine. Therefore, it was necessary to simulate the variations of load demand generated over the engine by connecting and disconnecting the vehicle’s auxiliary equipment. In this way, load demand over the vehicle has been modified through the dynamometer connected to the engine’s power output.
If engine speed follows the instructions in Table 1, and load demand behaviour is similar to the profile observed in Figure 2, the measurement test can be performed in the test cell.
Sequences of 20 consecutive cycles were programmed to optimise the timing of the tests. Since a computer program commands the implementation of the test, the duration of every stage was the same for every cycle.
At the same time, the NOx concentration was measured simultaneously by the two gas analysers. The blue-dotted square in Figure 3 shows the five stages described in Figure 2 that correspond to one single Static Idling Internal Load Test.
Figure 3 shows one of the tests performed with activated EGR. The purple line represents the load demand on the engine generated by the dynamometer, the red line is the engine speed, the green dotted line is the EGR aperture percentage, and the red and blue dotted lines are the exhaust gas temperature and engine oil temperature, respectively. Finally, the continuous orange line is the NOx concentration (ppm) from the Horiba gas analyser, and the continuous blue line is the NOx concentration (ppm) from the Tekber gas analyser.
When the Static Idling Internal Load Test was performed at low load conditions for the unloaded stages, the dynamometer demand was set at a 24% level (torque demand in the range 10–12 Nm), increasing to 33% in the loaded stages (torque demand in the range 37–40 Nm). When the Static Idling Internal Load Test was carried out at high load conditions, in the unloaded stages the engine brake demand was set at a 27% level (torque demand in the range of 19–22 Nm), increasing to 46% in the loaded stages (torque demand in the range 72–75 Nm).
Performing the test with and without EGR had two goals:
- To check the Tekber gas analyser behaviour in two different situations;
- To check if the Tekber gas analyser can detect that the EGR is not working through the NOx concentration measurements.
Every test conducted shows that the results of both analysers have the same trend and performance in each measurement section.
For the tests with the EGR activated and commanded by the engine’s ECU, the NOx concentration in the exhaust gas stream was reduced, usually in the interval of 30 to 70 ppm, although some peaks of higher concentration until 120 ppm could be detected. For this range of concentration, the behaviour of the Tekber gas analyser is similar to the Horiba gas analyser.
Figure 3 shows a sample of the tests performed, where it can be observed that the measured concentrations from Tekber and Horiba gas analysers are similar, without significant differences. Only for the peak values can differences of 10 ppm abs. and 11% rel. be found. The difference in the acquisition frequency (10 Hz for the Horiba vs. 1 Hz for the Tekber) can be responsible for the discrepancy between both measures. The average difference for this set of cycles between values of both devices was 1.7 ppm, which is an average of 3% rel. difference, in the sample shown. A similar behaviour was observed when the test was repeated in the same conditions and when the engine load demand was increased.
A summary of results from the tests performed with the EGR activated is shown in Table 2.
The average absolute differences measured between the two devices with the activated EGR are 2.6 ppm for the low load tests and 8.6 ppm for the high load test, which, for the purpose of NOx measurement in PTI, are not significant.
When the same tests were carried out with deactivated EGR, the NOx concentration in the exhaust gas stream was up to seven times higher than in the first tests when the EGR was correctly working. In this situation, the NOx concentration usually varied between 150 ppm in the minimum point and more than 500 ppm, with only a few peak emissions over 600 ppm.
As seen in the idling test without EGR and low load conditions in Figure 4, the NOx concentrations from the Tekber gas analyser and the Horiba gas analyser were quite similar. The concentration values were 150 ppm in the lower zones, and between 300 ppm and 350 ppm for the upper zones. When the test was repeated with high load demand, the average concentration measured and the concentration values for the lower and upper zones increased.
A summary of results from the tests performed with a deactivated EGR is shown in Table 3. The values of the absolute and relative differences between the results of both devices were low enough to evaluate the performance of the Tekber analyser as adequate for measuring NOx emissions in PTI.
From the point of view of PTI measurement, the behavior of both devices was similar for the EGR activated and deactivated, as can be observed in Figure 5.
For the Static Idling Internal Load Test, the average relative differences that are lower than 8% in the tests with the EGR deactivated, when the NOx concentration is higher, can be considered correct enough for PTI purposes. Absolute differences lower than 9 ppm for the EGR-activated tests when the NOx concentration is lower are also correct enough to get the same test result in PTI: assuring the roadworthiness of the vehicle.
From this point of view, the performance of the Tekber device can be considered satisfactory, increasing or decreasing the value measured of NOx concentration with a similar response to the Horiba device, even though the frequency is different: 1 Hz for the Tekber device and 10 Hz for the Horiba system. Although the PTI test is stationary, this is an important equipment feature.
The accuracy of the measurements may be the most important issue when analysing the suitability of this type of equipment. From the results of the measurements reproducing the Static Idling Internal Load Tests, the performance of the Tekber equipment, in the measurement range covered by the Static Idling Internal Load Test, is satisfactory.
In the test with the EGR activated, the average difference of the measurements was 8.6 ppm for the high load tests and only 2.6 ppm for the low load tests. These differences are not significant for determining the level of emissions of the vehicle.
When the engine was tested with the EGR deactivated, the average difference between measurements from both devices was 20.8 ppm for the low load test and 29.1 ppm for the high load test. The relative difference for the high load test was 7.1%, and even lower for the low load test, with a relative difference of 5.9%.
To summarise, the slight differences between both pieces of equipment when the Static Idling Internal Load Test was performed did not affect the test result because the concentration values obtained from both devices gave similar results.
3.2. Results for Fixed Engine Speed and Increasing Load Tests
Another kind of test was performed to check the performance of the Tekber measurements compared to the Horiba equipment: the engine was subjected to gradual increases in power demand while maintaining a fixed engine speed in two different conditions:
- Fixed engine speed, increasing the load demand, with EGR;
- Fixed engine speed, increasing the load demand, without EGR.
In this way, the variation profile of the engine NOx concentration could be analysed with changing torque demand. The wide variety of conditions (engine speed, load demand, EGR aperture, the temperature of exhaust gases, …) provides crucial information about the behaviour of the Tekber gas analyser.
These tests were conducted for 800 rpm, and from 1000 rpm to 3000 rpm with 500 rpm increments. The engine was subjected to an increase in torque demand for each of these speed conditions through the dynamometer coupled to the engine power output. The increase in torque demand was performed in 10% increments of the demand capacity of the dynamometer. Due to the system’s technical requirements, measurements were started with a demand of 20%.
All the tests carried out with the EGR activated and commanded by the ECU show a similar behaviour. When load demand is low or medium, the %EGR opening is higher. It gradually closes as the power demand increases until it reaches the minimum value defined by the ECU at these conditions.
It can also be observed that the %EGR aperture is lower as engine speed increases. If at 1000 rpm and 20% of load demand the EGR value is 40%, with the same 20% of load demand at 3000 rpm the EGR value is 20%.
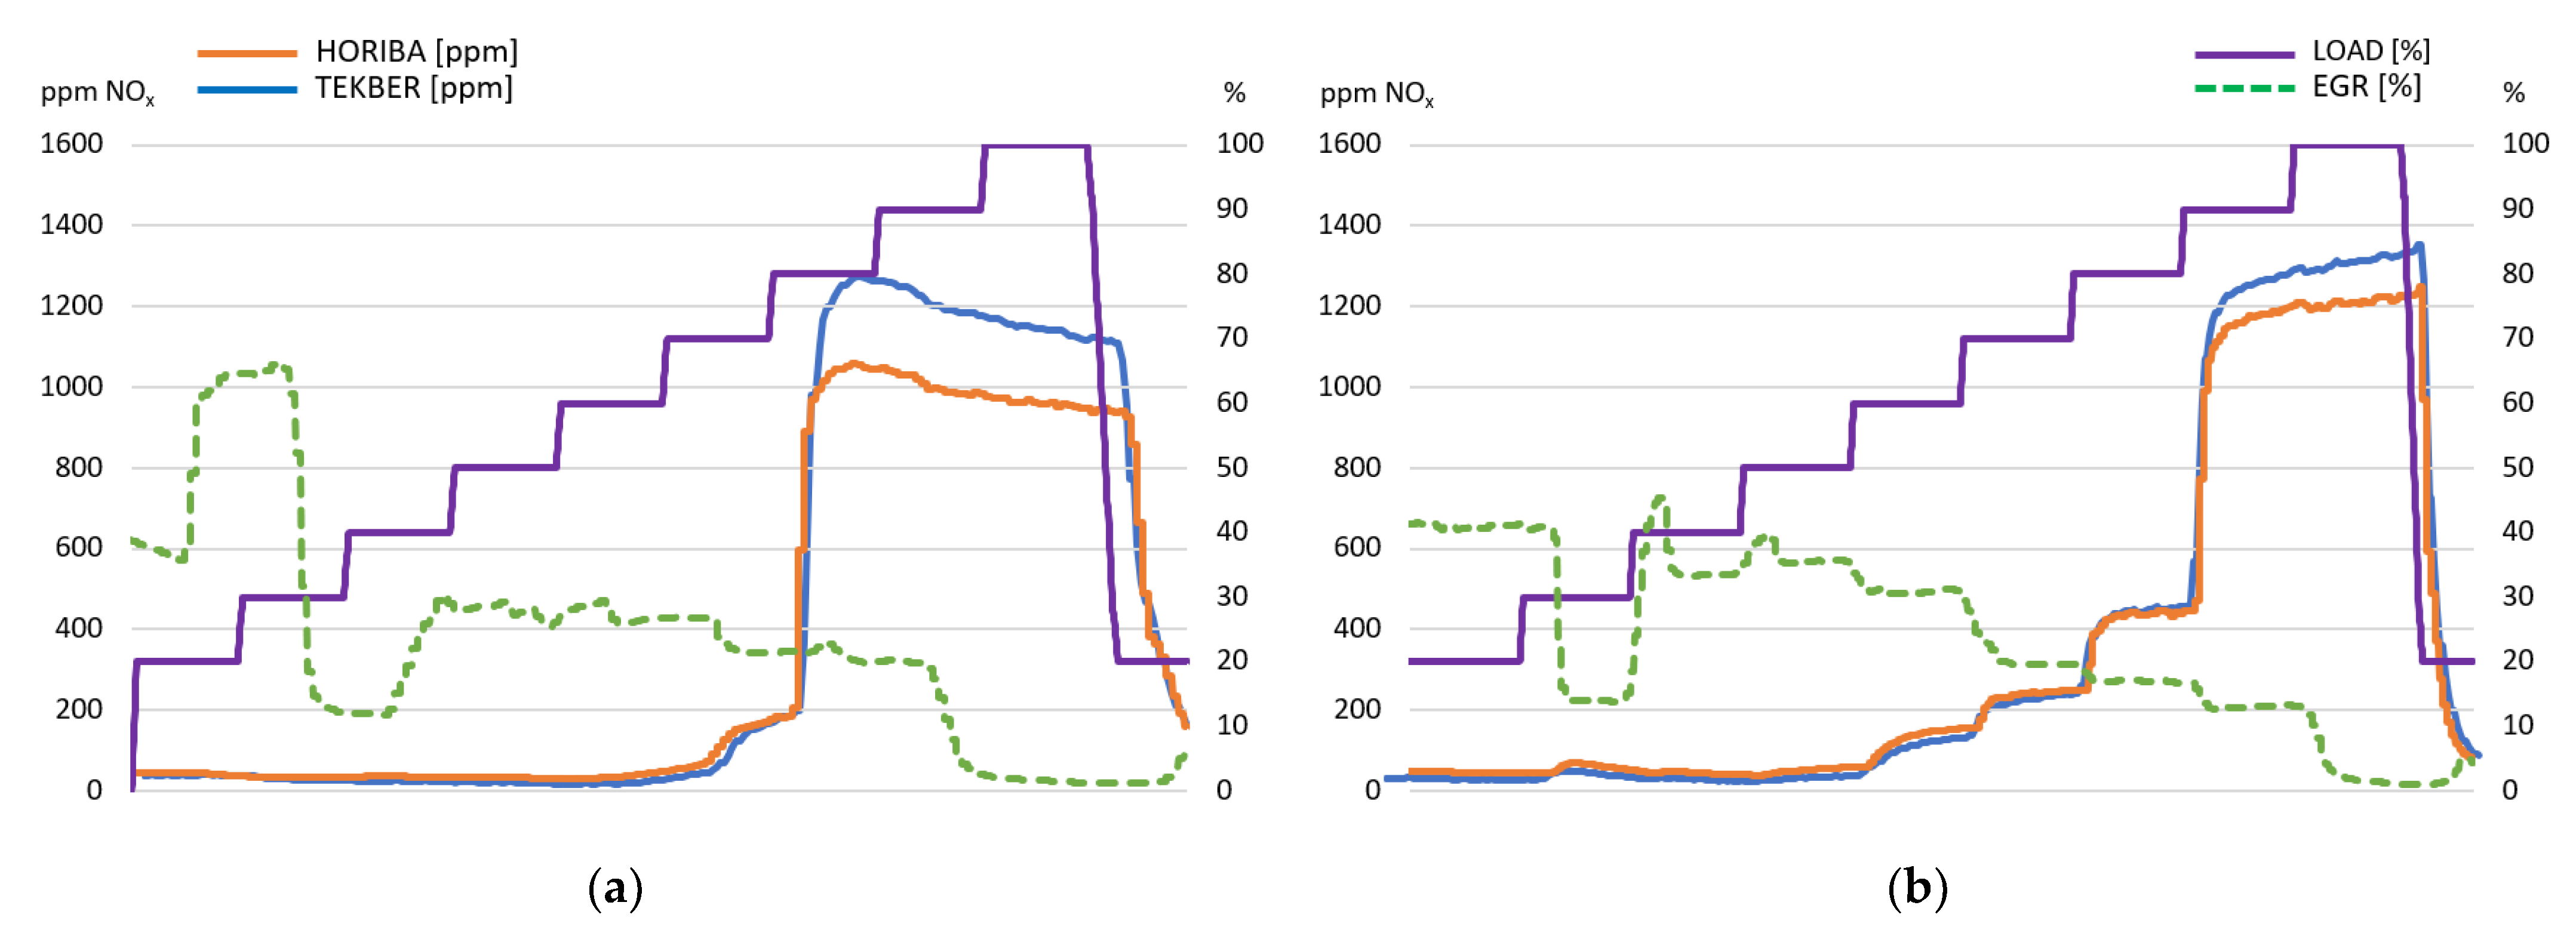
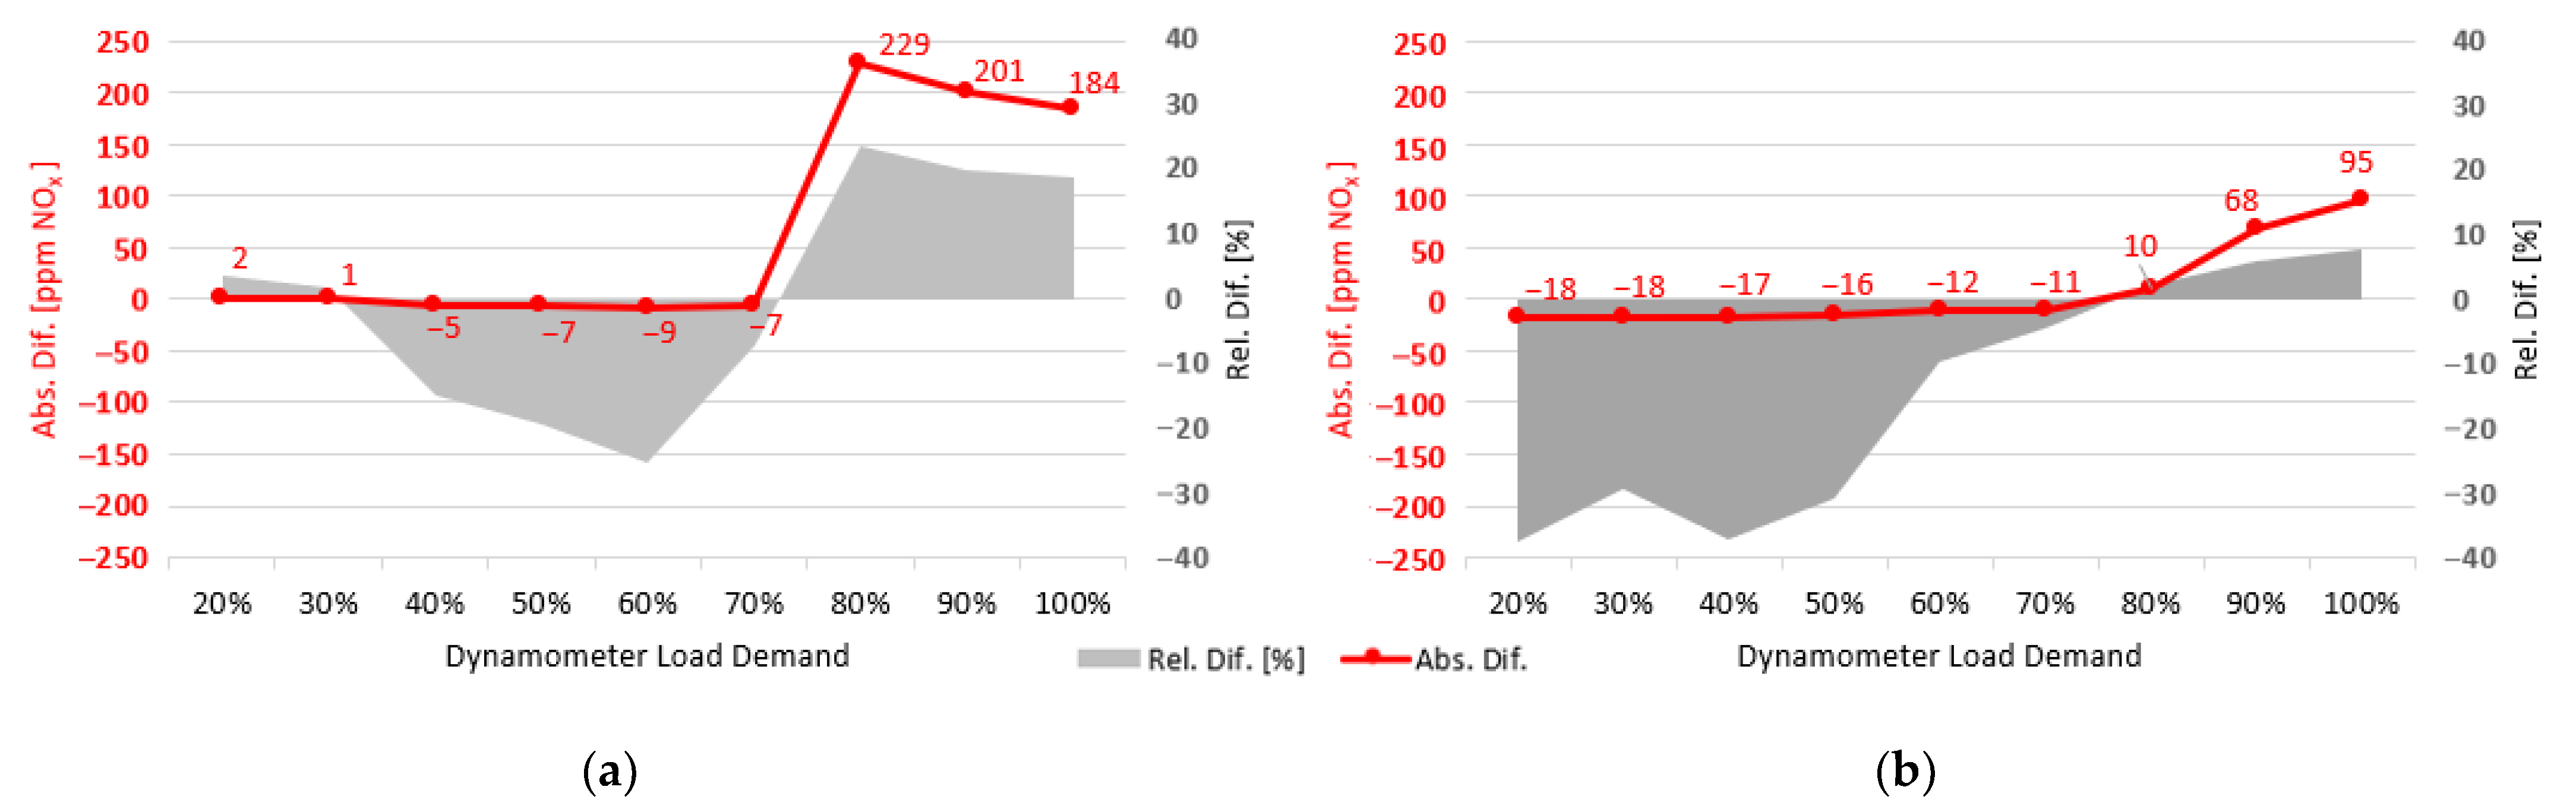
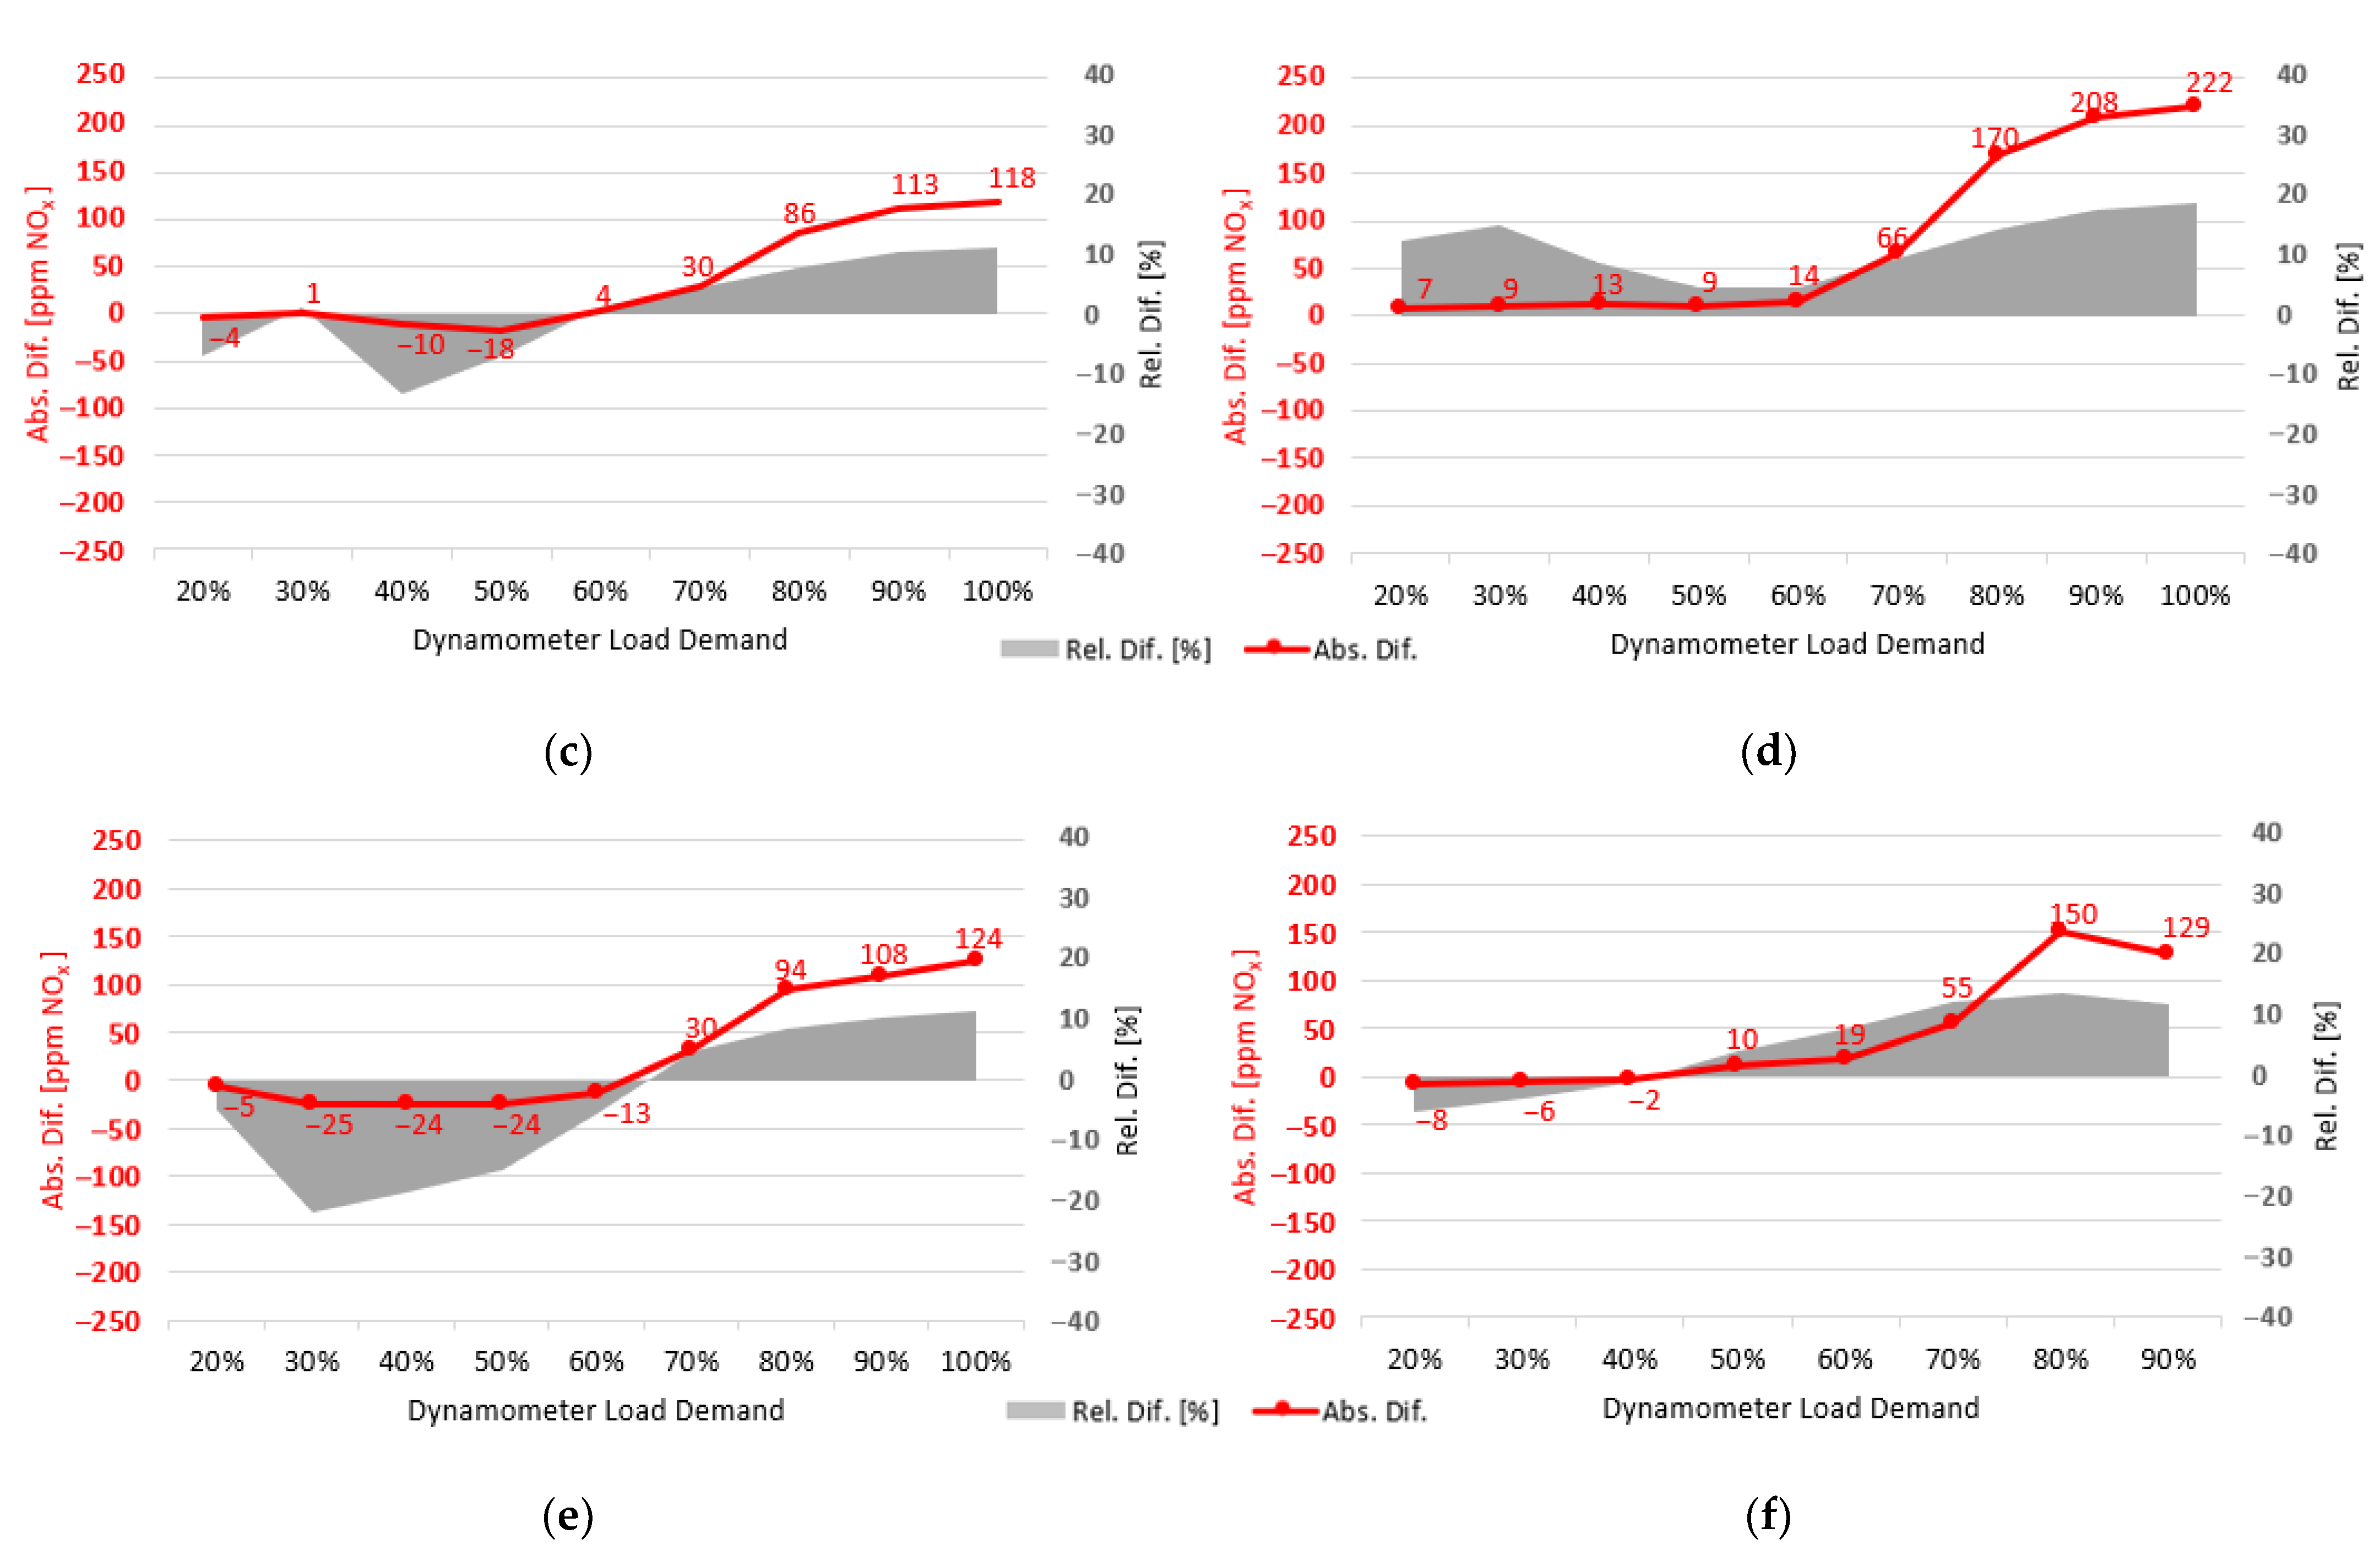
Figure 6 shows how the behaviour of the Tekber results is similar to Horiba’s measurements for every engine speed. For the first test at 800 rpm with an activated EGR and at a dynamometer load demand of 80%, the difference in the NOx concentration values from both types of equipment was lower than 10 ppm abs., until the concentration increased to 900 ppm (Figure 6a). From this concentration, the discrepancies increased until a maximum difference of 229 ppm abs. These average differences are represented in Figure 7 for every engine speed. Although the relative differences are over 20%, this value corresponds to a NOx concentration of 9 ppm, which can be considered to be a low deviation.
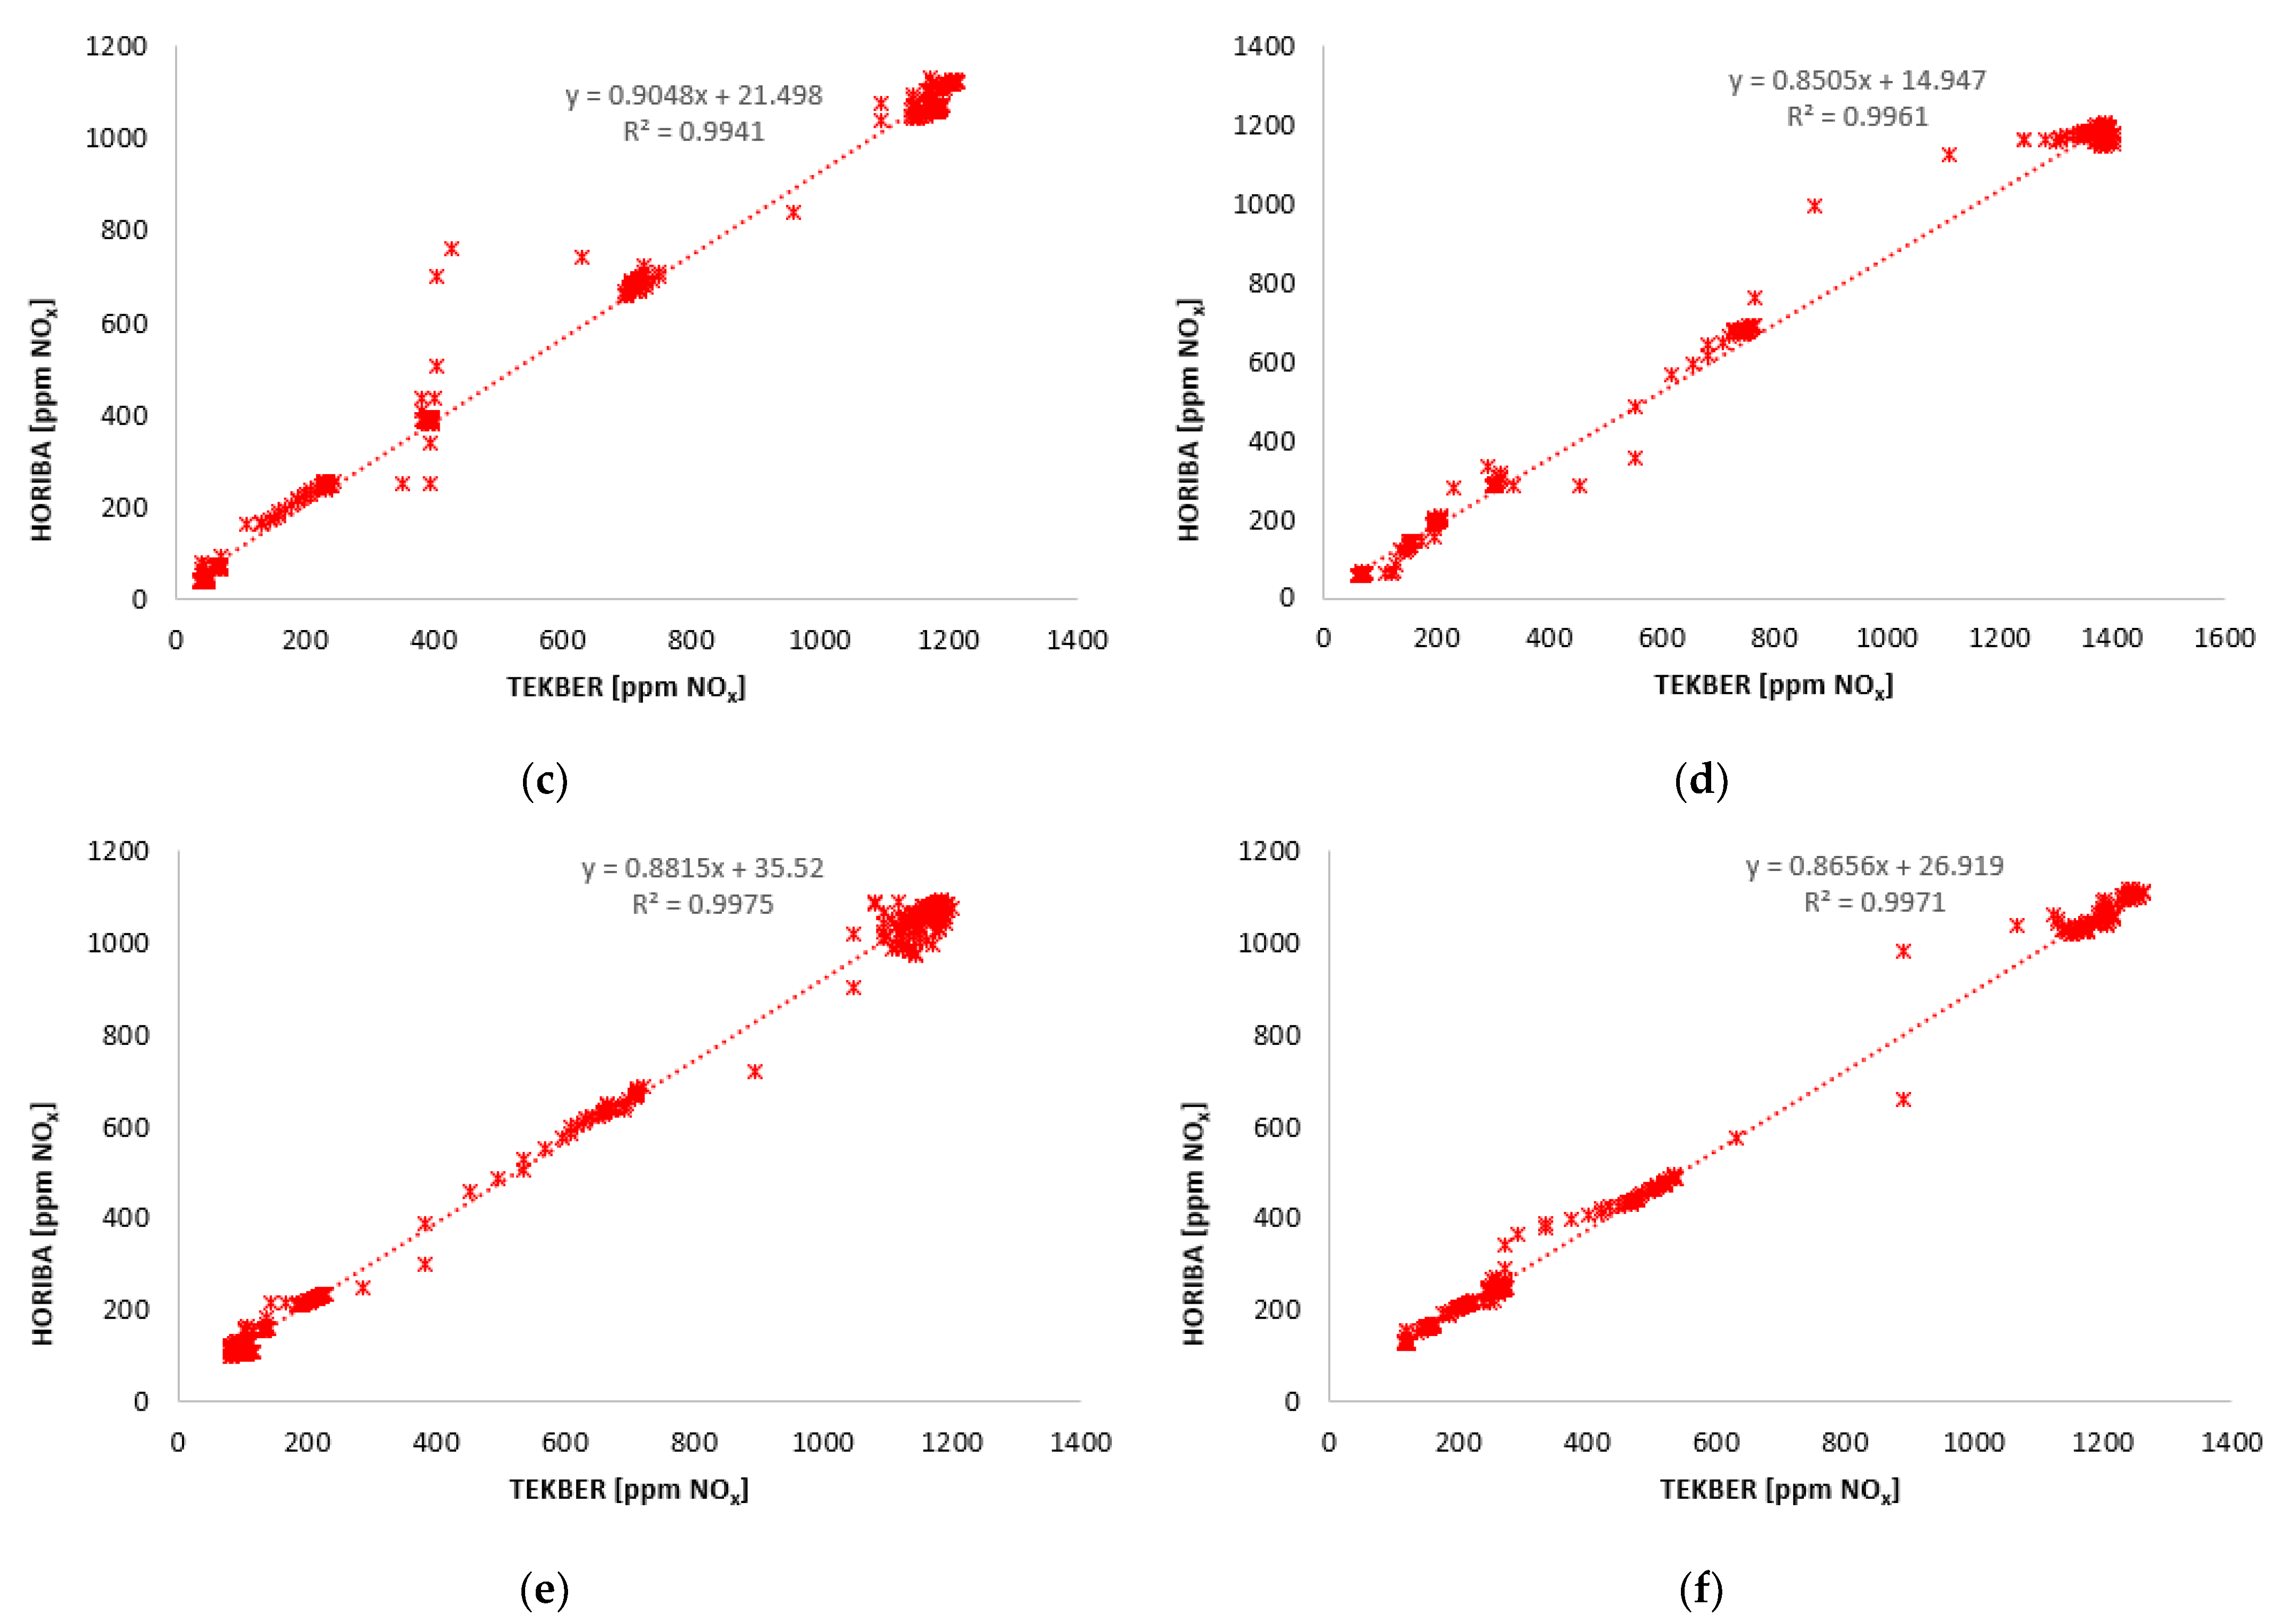
Regarding the emissions behaviour, it can be observed how the action of the EGR makes NOx emissions decrease (to below 100 ppm) until demand rises to 70%. At this point, an increase in NOx concentration to 200 ppm occurs. Above 90% load demand, the EGR closes, leading to the values included in Appendix A, Table A7, where average results for the whole set of tests are summarised. Figure 8 shows the correlation between results from Tekber equipment and Horiba, with R2 > 0.98 for every engine speed.
The same situation could be observed for the test at 1000 rpm with EGR, Figure 6b, where the difference between values from both types of equipment was close until reaching 1000 ppm (when load demand is at 90%). Until this point, the average difference between Horiba and Tekber devices was in the range of 10–18 ppm abs. From this point upwards, the difference increased but was lower than 100 ppm abs, and less than 8% rel.
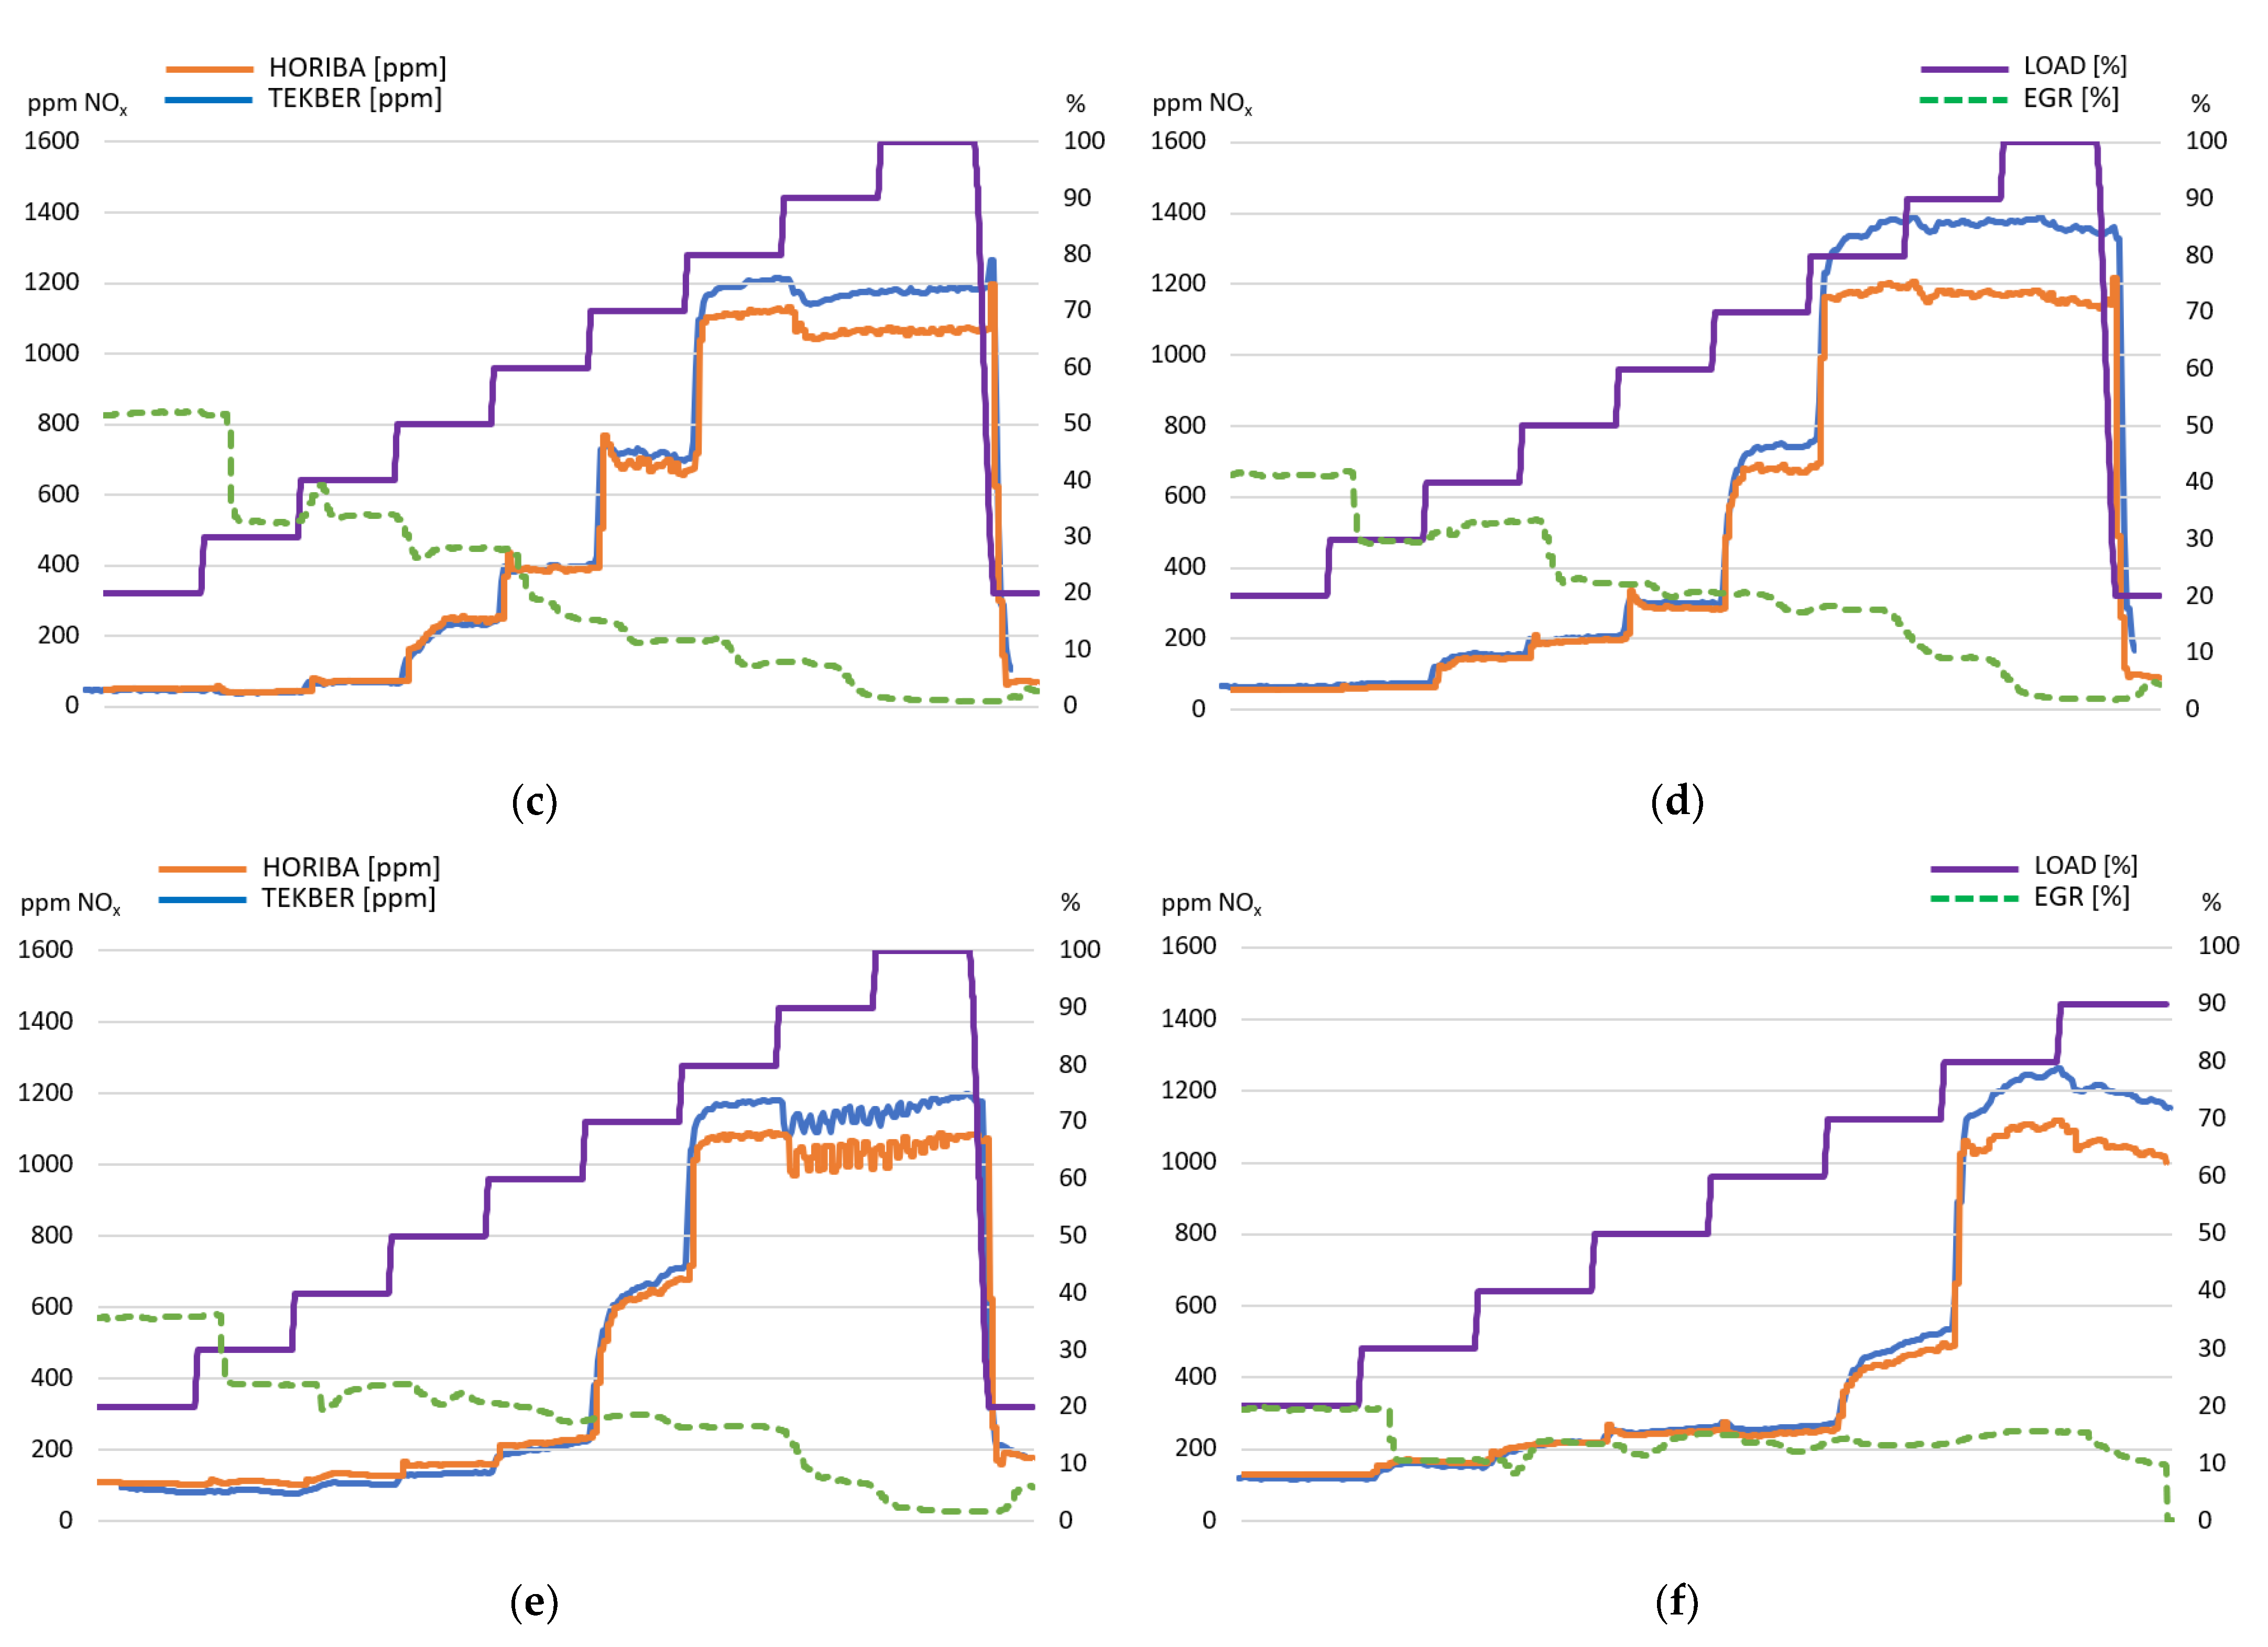
For the test carried out at @1500 rpm, as shown in Figure 6c, it was again observed how the Tekber analyser accurately reproduced the behaviour of the Horiba analyser. From 20% to 40% of load demand, the average difference was lower than 10 ppm. Once the concentration was stabilised, the section of 50% of load demand showed an average difference of 18 ppm, and for the 60% section, the average difference was lower than 4 ppm. When reaching 70% of demanded load and NOx concentrations reached 700 ppm level, the average difference increased to 30 ppm. From this power demand value onwards, the absolute value of the measurement difference increased up to 120 ppm, although the relative difference stabilised at values of 11% rel.
The test at 2000 rpm shows again how the Tekber results reproduce the behaviour of the Horiba measures (as seen in Figure 6d). Until reaching 70% load demand, the average absolute difference between them was lower than 15 ppm. Figure 7d shows that the difference between both devices is small for NOx concentrations under 600 ppm (that is until 60% load demand). With higher load demands and NOx concentrations exceeding 600 ppm, the difference between the Tekber equipment and Horiba increases (in absolute and relative values). This behaviour could be observed in this kind of test every time it was carried out.
In the test at 2500 rpm, as can be observed in Figure 6e, not only was the same profile of concentration obtained, but the behaviour of NOx concentration in the sections of 90% and 100% was faithfully reproduced by both devices, with the only difference being the measured value. Again, the sections with concentrations below 600 ppm showed a reduced difference between both devices, with 25 ppm and 11% rel. being the highest average difference for these sections, as shown in Figure 7e.
Another issue to be mentioned is that the exhaust gas temperature for the sections with higher concentrations reached between 600 °C and 700 °C. The Horiba equipment is designed to work under such conditions. However, the Tekber equipment is focused on another kind of measurement, where the time duration of the measurement is shorter. Moreover, the gas temperature of the sample is usually much lower than 300 °C. In the Static Idling Internal Load Test, the engine at 2500 rpm is not subjected to any load, so the gas temperature is below 300 °C.
Finally, the last test was carried out at 3000 rpm with the behaviour of NOx concentration shown in Figure 6f and the differences summarised in Figure 7f. As can be seen, the last section of the 100% load demand could not be performed for technical reasons, so no data are available for this situation. The results of this last test were similar to the previous ones. The behaviour of both types of equipment was similar, with an absolute difference between values being lower than 20 ppm (and a relative difference below 8%) until reaching 60% load demand. From 70% of load demand, the relative difference was, on average, around 13% and the absolute difference was at a maximum of 150 ppm.
From this set of six tests, it can be concluded that the behaviour of the Tekber gas analyser faithfully reproduces the behaviour of the Horiba gas analyser. In addition, as can be seen in Figure 8, the coefficient of determination R2 was greater than 0.98 in all cases.
The difference in measurement precision varies depending on the concentration values measured. Still, the variation is typically low when the concentration of NOx in the gas stream is below 600 ppm, with an average value of 15 ppm for this condition.
As with the Static Idling Internal Load Tests for PTI, the same set of tests was conducted with the EGR disconnected, directly resulting in increased NOx concentrations, especially for low load demand slots. In low-demand situations, where the EGR was clearly active, a significant difference in the NOx concentration measured by both devices was observed. Instead, the NOx concentration was similar to the EGR-activated tests for the high load states (when load demand is 80% or higher). This is because, in the EGR-activated tests, EGR was closed or nearly closed when the load demand was high.
As was observed in the first part of the tests, a higher concentration in the exhaust gases increases the discrepancies between both measuring devices. The higher concentrations of NOx with the EGR disconnected shows that the difference observed for the low load states between both devices was higher than for the EGR-activated tests.
Results are summarised from these sets of tests in Appendix A, Table A8, with the same information previously detailed in the EGR-activated case.
Table 4 shows the average differences calculated (in absolute values), from every test performed at the different engine speeds and load demand states, for the Tekber equipment with respect to the Horiba equipment results when the EGR was activated.
The deviation between both devices is lower than 14 ppm from the load demand scenarios below 70%. The relative difference is 13.6% in the situation of 100% of load demand when the NOx concentration is the highest.
Figure 9 shows the average deviation in absolute and relative terms from the Tekber equipment results compared to the average NOx concentration value measured by the Horiba and the Tekber equipment at every load demand slot. After analysing the data from several tests, it can be concluded that the absolute deviation increases when the load demand and the average NOx concentration increase.
Below 700 ppm, the deviation between the two measures stayed below 65 ppm, with an average difference value of less than 15 ppm, in absolute terms, i.e., accumulating the deviations. This translates into differences of 9% in relative terms for these sections. It should be mentioned that there are occasional measurements with larger relative differences, mainly at very low concentrations, of the order of 20–30 ppm, where a small difference in the absolute value of 5 ppm can mean a difference in relative terms of 15–20%.
At 700 ppm NOx and above, the Tekber deviations were significantly larger, with an average difference of 136 ppm in absolute terms or 13% in relative terms.
For measurements performed with EGR deactivated, the results obtained are less homogeneous, due to the absence of the “normalising” performance of the vehicles’ EGR.
In addition, the NOx concentration values in the exhaust gas stream were clearly higher for the low load demand zones than those measured in the tests performed with the EGR system operating.
Table 5 shows a summary of the average differences from every test performed at the different engine speeds and load demand states when the EGR was deactivated.
As for the EGR-activated tests, it can be observed that the absolute values of the difference between the results of both types of equipment are lower from the load demand scenarios below 70%, although the absolute values are significantly higher. That said, the relative difference is similar to the values observed when the EGR was connected. Only for the highest load demand situation, at 90% and 100%, did the relative difference rise to more than 20%.
Figure 10 shows, for every slot of load demand, a comparison between the average concentration deviations in absolute and relative terms for both devices and the average value of NOx concentration as measured by the Horiba and the Tekber equipment at this load demand slot. As mentioned, the behaviour is similar to that shown in Figure 9, although the concentration values are higher, and because of this, the discrepancies increase too. When NOx concentration is below 700 ppm, the deviation is less than 45 ppm, in absolute terms. This translates into differences of 9% in relative terms for these sections. As observed for the EGR-connected tests, when 700 ppm are exceeded, the discrepancies between both devices increase significantly, with an average difference of 142 ppm in absolute terms (14% rel.).
In summary, for NOx concentrations below 700 ppm in the exhaust gas stream, the deviation of Tekber results with respect to Horiba results is small, which makes the Tekber more accurate under these conditions.
In 2019, a measurement campaign was conducted at several PTI stations in Spain, where diesel vehicles were subjected to the Static Idling Internal Load Tests. As was explained in Section 3.1, the engine was subjected to internal load to increase the engine NOx emissions. From the measurements performed during the campaign, out of 1884 vehicles analysed, only 17 exceeded the 700 ppm of NOx concentration values during the emission test’s execution (in the loaded or the unloaded stages). This means that only 0.90% of the vehicles in the analysed sample exceeded the value of 700 ppm during the measurement.
Therefore, at least for the realisation of NOx measurements using the Static Idling Internal Load Test, the usual effective NOx concentration measurement range is between 0–700 ppm, validating the use of the Tekber analyser for PTI purposes.
4. Conclusions
This paper aimed to assess the accuracy of NOx measuring equipment for conducting PTI, for which no regulatory framework has yet been established. To that end, deviations of less than 10% rel. and/or 10 ppm in absolute terms with respect to a reference were considered acceptable. The reference device selected was the Horiba equipment, designed for use in homologation processes.
By the definition of the PTI process, the methods to be used must be both fast and reliable. The equipment used must follow the same principle, adding the need to be robust and suitable to work in a wide variety of environmental conditions. It also needs to have minimal maintenance costs and times (both technical and metrological) and requires the least possible intervention on the vehicle to perform the measurement. The Tekber equipment satisfies such requirements, which is why it was selected for our study over more expensive and complicated to maintain devices such as PEMS-type or other laboratory-grade equipment.
From the set of tests carried out and at least for the measurement range from 0 to 700 ppm, which is the range found for over 99% of current vehicles, we concluded that the Tekber’s performance and accuracy can be considered acceptable for PTI use. For instance, average deviations recorded were 2.6 ppm or 9% rel. (for accumulated differences) for the Static Idling Internal Load Test in low load conditions with EGR, which is the test with the most similar conditions to be found at PTI.
Of course, these differences would not be acceptable for a homologation test. However, they may be suitable for use in PTI, where the aim is not to obtain the exact emissions concentration. Instead, the aim is to have sufficient data to decide whether the vehicle is roadworthy, as well as to detect tampering and high-emitter vehicles and to verify that the anti-pollution systems are working. In this respect, as the order of magnitude of NOx concentrations obtained from both devices was the same, the decision-making process will provide the same result.
The technical improvement in the future would be to increase the accuracy of the measurement for the range up to 700 ppm, since the trend of NOx emissions from new vehicles is expected to be downward. This could be done by incorporating dry-basis measurements, but only as long as the economic and technical requirements are kept within a reasonable range.
In short, the tests have allowed us to verify that the method and equipment used are precise enough to check the level of NOx emissions from a vehicle undergoing a PTI inspection, thereby determining if the EATS are operational or not. Although mobility is migrating towards electrification and there is already a ban date for combustion engines, the circulation of LDVs equipped with combustion engines worldwide will probably go beyond 2050 [28,29]. Therefore, the development of reliable, cost-effective and fast methods, such as the one presented in this paper, to test the performance of anti-pollution systems is essential.
Author Contributions
Conceptualisation, E.F. and A.O.; methodology, E.F.; validation, A.V., A.O. and J.J.A.; formal analysis, E.F.; investigation, E.F.; resources, A.O.; data curation, E.F.; writing—original draft preparation, E.F.; writing—review and editing, AV., A.O. and J.J.A.; supervision, A.V. All authors have read and agreed to the published version of the manuscript.
Funding
This research received no external funding.
Data Availability Statement
Not applicable.
Acknowledgments
We’d like to acknowledge CMT-Motores Térmicos of Universitat Politècnica de Valencia for the help and for making the equipment and personnel available to carry out the measurements.
Conflicts of Interest
The authors declare no conflict of interest.
Abbreviations
| CITA | International Motor Vehicle Inspection Committee |
| CLD | Chemiluminescence Detector |
| DPF | Diesel Particulate Filter |
| EATS | Exhaust After-Treatment Systems |
| ECU | Electronic Control Unit |
| EGR | Exhaust Gas Recirculation |
| FID | Flame Ionization Detector |
| GC-FID | Flame Ionization Detector with Gas Chromatography |
| GDC | Gas Divider Controller |
| LEZ | Low Emissions Zone |
| MPD | Magnetopneumatic Detector |
| NDIR | Non-Dispersive Infrared Detector |
| NDUV | Non-Dispersive Ultra Violet |
| NMC-FID | Flame Ionization Detector with Non-Methane Cutter |
| NOx | Nitrogen Oxides |
| OBD | On-Board Diagnostics |
| PEMS | Portable Emissions Measurement System |
| PTI | Periodic Technical Inspection |
| RDE | Real-driving emissions |
| SCR | Selective catalytic reduction |
| WHO | World Health Organization |
Appendix A
The technical characteristics of the tested engine and the auxiliary equipment installed in the test cell are listed in this Appendix A.
Figure A1.
The performance curves of the PSA DW12 RU engines (Source: PSA).

Table A1.
General Technical Characteristics of the tested engine (Source: PSA).
| PSA DW12 RU General Technical Characteristics | ||
|---|---|---|
| Fuel | Diesel | |
| Bore | 85 | mm |
| Stroke | 96 | mm |
| Piston rod centreline distance | 152 | mm |
| Displacement | 2179 | cm3 |
| Engine architecture | 4 | cylinders in-line |
| Number of camshafts | 2 | |
| Number of valves | 4 | valves per cylinder |
| Compression ratio | 16:1 | |
| Base engine weight | 183 | kg |
| Maximum Power | 121 | kW @ 3775 rpm |
| Maximum Torque | 370 | N·m @ 2000 rpm |
| Injection system | Delphi | |
| High-pressure pump | Delphi DFP 6.1E | |
| Turbocharger | BWTS | |
| EGR valve | Yes | |
| EGR cooler | Yes | |
| Intercooler | Yes | |
| Catalyst | Yes | |
| DPF | Yes | |
| SCR | Yes | |
Table A2.
Horiba Fuel Flow Measurement Specifications (Source: Horiba).
| Horiba FQ-2100DP Fuel Flow Measurement Specifications | |
|---|---|
| Measuring range | 0.2…220 L/h (300 L/h) |
| 0.15…165 kg/h (225 kg/h) | |
| Temperature control range *** | +15 *…+40 °C ** |
| with optional heating module | max. 60 °C |
| Temperature Measurement uncertainty | 0.5 °C |
| Temperature Control stability (steady-state conditions) | 0.05 °C |
| Pressure control range fuel outlet | −0.3…9 bar −0.5…9 bar |
| with option vacuum controller | |
| Fuel return pressure | −0.5…2 bar relative **** |
| Fuel circulation rate adjustable | 60 … 360 L/h |
| (optional up to 940 l/h) | |
| Fuel Supply pressure | 0.5… 1 bar |
| with option inlet pressure Regulator | max. 5 bar |
| Fuel supply temperature | 15…30 °C |
| Fuel supply feed | max. 350 L/h |
| Cooling water supply pressure | 0.2…4 bar |
| Cooling water supply/return temperature | 6…15 °C/12…21 °C |
| Cooling water supply feed | ca. 800 L/h |
| Electrical supply voltage | 230 V |
| Electrical supply frequency | 50/60 Hz |
| Electrical supply current (without heating) | 4 A |
| Overall dimensions W × H × D | 1150 × 1320 × 360 mm |
| Weight | ca. 200 kg |
| Ambient temperature | +5…+40 °C |
| Type of protection (electr. Part) | IP 44 |
| Color | RAL 7035 |
* Depending on cooling water. ** Depending on heat returned by the engine. *** Max. heat transfer from engine: 2 kW. **** Typical −0.1…1.5 bar: the return pressure is depending on the additional pressure loss in the return pipe caused by the circulation volume and the diameter of the pipe. There is the possibility of gas evolution in the fuel if the return pressure is to low adjusted.
Table A3.
Horiba Dynamometer Specifications (Source: Horiba).
| Horiba DYNAS3 Dynamometer Specifications | ||
|---|---|---|
| Rated power (absorbing) | [kW] | 250 |
| Rated speed (absorbing) | [rpm] | 4980 |
| Rated torque (absorbing) | [Nm] | 480 |
| Rated power (driving) | [kW] | 225 |
| Rated speed (driving) | [rpm] | 4860 |
| Rated torque (driving) | [Nm] | 442 |
| Overload factor, absorbing | 1.2 | |
| Maximum speed nmax | [rpm] | 10,000 |
| Power at nmax (absorbing) | [kW] | 200 |
| Moment of inertia, machine without attachments | [kgm2] | 0.33 |
| Max. Speed gradient up to rated speed incl. Overload | [rpm/s] | 16,580 |
Figure A2.
The performance plot from Horiba DYNAS3 LI250 (Source: Horiba).
Appendix B
Technical data of Tekber and Horiba gas analysers are listed in this Appendix B.
Table A4.
Tekber electrochemical NOx sensor Technical Characteristics (Source: Tekber).
| Characteristics | |
|---|---|
| Operating Principle: | Potentiostatic-driven cell backed up by an onboard battery |
| Electrical Connector: | 4-pin Molex |
| Gas Connector: | M 16 × 1 |
| Measurement Range: | 0 to 5000 ppm |
| Output Signal: | 45 to 75 nA/ppm |
| Response Time: | <5 s |
| Drift: | <5% of signal per annum |
| Operating Temperature: | 0 to 50 °C |
| Pressure Range: | 750 to 1750 hPa |
| Linearity Error: | ±3% from 0 to 2000 ppm |
| ±5% over 2000 ppm to full scale | |
| Repeatability: | ±2% of the signal, 20 ppm absolute |
| Recommended Load: | 10 Ohm |
| Interferences: | ±20 ppm NO response to: |
| 16% CO2 balance N2 | |
| 10% CO balance N2 | |
| 100% rare gases | |
| 3000 ppm C3H2 balance N2 | |
| 75 ppm H2S balance N2 | |
| 75 ppm SO2 balance N2 | |
| 1000 ppm Benzene balance N2 | |
| All characteristics are based on conditions at 25 °C RH and 1013 hPa | |
Table A5.
Horiba MEXA-ONE Analyzer Specifications (Source: Horiba).
| Component | Principle | Range |
|---|---|---|
| CO | NDIR | 0–50 to 0–5000 ppm |
| CO | NDIR | 0–0.5 to 0–12 vol% |
| CO | NDIR | 0–3 to 0–20 vol% |
| CO2 | NDIR | 0–0.1 to 0–6 vol% |
| CO2 | NDIR | 0–0.5 to 0–20 vol% |
| CO2 | NDIR | 0–3 to 0–20 vol% |
| HC | NDIR | 0–100 to 0–5000 ppm |
| HC | NDIR | 0–5000 to 0–10,000 ppm |
| N2O | NDIR | 0–100 to 0–5000 ppm |
| O2 | MPD | 0–1 to 0–25 vol% |
| THC | FID | 0–10 to 0–30,000 ppmC |
| NO/NOx | CLD | 0–10 to 0–10,000 ppm |
| NO/NOx | Heated-CLD | 0–10 to 0–10,000 ppm |
| NO, NOx, NO2 | Dual heated-CLD | NO 0–10 to 0–10,000 ppm |
| NOx 0–10 to 0–10,000 ppm | ||
| NO2 is measured by dual detector | ||
| CH4 | GC-FID | 0–10 to 0–3000 ppm |
| THC | Heated-FID | 0–10 to 0–60,000 ppmC |
| THC, CH4, NMHC | Heated-FID NMC-FID | THC 0–50 to 0–60,000 ppmC |
| CH4 0–50 to 0–25,000 ppm | ||
| NMHC is measured by dual detector |
NDIR: Non-Dispersive Infrared Detector. FID: Flame Ionization Detector. GC-FID: Flame Ionization Detector with Gas Chromatography. NMC-FID: Flame Ionization Detector with Non-Methane Cutter. CLD: Chemiluminescence Detector (Type: Wet, Dry, Wet/Dry Switchable). MPD: Magnetopneumatic Detector.
Table A6.
Horiba MEXA-ONE System Specifications (Source: Horiba).
| System Specifications | |
|---|---|
| Dimensions: | |
| Standard 19-inch Rack | 655(W) × 855(D) × 1970(H) mm |
| Oven Type Heated Analyzer | 430(W) × 550(D) × 1100(H) mm |
| Requirements: | |
| Ambient temperature | 5 °C to 40 °C |
| Ambient humidity | 80% or less as relative humidity |
| Ambient pressure | 80 kPa to 102 kPa (abs) |
| Altitude | below 2000 m above sea level |
Appendix C
Results from the measurement of both equipment are listed in this Appendix C.
Table A7.
Summary of the average concentration and differences between Horiba and Tekber equipment with EGR activated.
Table A7.
Summary of the average concentration and differences between Horiba and Tekber equipment with EGR activated.
| Engine Speed | Load Demand | 20% | 30% | 40% | 50% | 60% | 70% | 80% | 90% | 100% |
|---|---|---|---|---|---|---|---|---|---|---|
| 800 rpm | Avg. Horiba [ppm] | 44.0 | 34.8 | 36.1 | 34.0 | 35.6 | 102.9 | 960.4 | 1008.5 | 966.4 |
| Avg. Tekber [ppm] | 45.6 | 35.5 | 30.7 | 27.4 | 26.5 | 95.7 | 1189.6 | 1209.2 | 1150.1 | |
| Avg. dif. Abs. [ppm] | 1.6 | 0.7 | −5.4 | −6.6 | −9.0 | −7.2 | 229.2 | 200.8 | 183.7 | |
| Avg. dif. Rel. [%] | 3.6 | 1.9 | −15.0 | −19.4 | −25.4 | −7.0 | 23.9 | 19.9 | 19.0 | |
| 1000 rpm | Avg. Horiba [ppm] | 46.8 | 59.7 | 45.6 | 51.0 | 122.9 | 241.5 | 435.0 | 1135.9 | 1208.8 |
| Avg. Tekber [ppm] | 29.2 | 42.1 | 28.6 | 35.3 | 111.2 | 230.5 | 444.9 | 1203.8 | 1303.6 | |
| Avg. dif. Abs. [ppm] | −17.5 | −17.6 | −17.0 | −15.7 | −11.7 | −11.0 | 10.0 | 67.8 | 94.8 | |
| Avg. dif. Rel. [%] | −37.5 | −29.5 | −37.2 | −30.8 | −9.6 | −4.5 | 2.3 | 6.0 | 7.8 | |
| 1500 rpm | Avg. Horiba [ppm] | 49.5 | 42.3 | 72.4 | 248.3 | 388.4 | 685.0 | 1110.8 | 1056.5 | 1064.6 |
| Avg. Tekber [ppm] | 46.0 | 42.8 | 62.5 | 230.3 | 392.1 | 715.0 | 1196.6 | 1169.1 | 1182.8 | |
| Avg. dif. Abs. [ppm] | −3.5 | 0.5 | −9.9 | −18.0 | 3.7 | 30.0 | 85.8 | 112.6 | 118.2 | |
| Avg. dif. Rel. [%] | −7.1 | 1.2 | −13.6 | −7.2 | 1.0 | 4.4 | 7.7 | 10.7 | 11.1 | |
| 2000 rpm | Avg. Horiba [ppm] | 56.1 | 61.7 | 141.8 | 193.3 | 287.9 | 681.0 | 1179.9 | 1175.0 | 1162.6 |
| Avg. Tekber [ppm] | 63.2 | 71.2 | 154.5 | 202.6 | 301.7 | 746.6 | 1349.8 | 1382.9 | 1384.2 | |
| Avg. dif. Abs. [ppm] | 7.1 | 9.5 | 12.7 | 9.3 | 13.8 | 65.6 | 170.0 | 207.9 | 221.6 | |
| Avg. dif. Rel. [%] | 12.6 | 15.4 | 9.0 | 4.8 | 4.8 | 9.6 | 14.4 | 17.7 | 19.1 | |
| 2500 rpm | Avg. Horiba [ppm] | 106.1 | 111.0 | 130.8 | 159.4 | 224.0 | 639.1 | 1080.7 | 1025.9 | 1057.1 |
| Avg. Tekber [ppm] | 101.0 | 86.5 | 106.5 | 135.7 | 211.5 | 669.5 | 1174.4 | 1134.0 | 1180.8 | |
| Avg. dif. Abs. [ppm] | −5.1 | −24.5 | −24.4 | −23.7 | −12.5 | 30.4 | 93.7 | 108.1 | 123.7 | |
| Avg. dif. Rel. [%] | −4.8 | −22.1 | −18.6 | −14.8 | −5.6 | 4.8 | 8.7 | 10.5 | 11.7 | |
| 3000 rpm | Avg. Horiba [ppm] | 128.3 | 164.2 | 215.3 | 245.2 | 243.6 | 444.0 | 1080.2 | 1054.5 | n.a.* |
| Avg. Tekber [ppm] | 120.8 | 158.3 | 213.1 | 255.3 | 262.6 | 498.7 | 1230.3 | 1183.1 | n.a.* | |
| Avg. dif. Abs. [ppm] | −7.5 | −5.9 | −2.2 | 10.1 | 19.0 | 54.7 | 150.1 | 128.5 | n.a.* | |
| Avg. dif. Rel. [%] | −5.9 | −3.6 | −1.0 | 4.1 | 7.8 | 12.3 | 13.9 | 12.2 | n.a.* |
* For technical reasons, the 100% load demand section couldn’t be performed, so data are unavailable.
Table A8.
Summary of the average concentration and differences between Horiba and Tekber equipment with EGR deactivated.
Table A8.
Summary of the average concentration and differences between Horiba and Tekber equipment with EGR deactivated.
| Engine Speed | Load Demand | 20% | 30% | 40% | 50% | 60% | 70% | 80% | 90% | 100% |
|---|---|---|---|---|---|---|---|---|---|---|
| 800 rpm | Avg. Horiba [ppm] | 93.8 | 207.3 | 391.0 | 639.7 | 796.4 | 873.0 | 917.7 | 904.1 | 888.5 |
| Avg. Tekber [ppm] | 91.3 | 350.6 | 566.1 | 713.2 | 813.0 | 836.2 | 1042.5 | 1458.0 | 1464.1 | |
| Avg. dif. Abs. [ppm] | −2.5 | 143.3 | 175.1 | 73.5 | 16.6 | −36.8 | 124.8 | 553.9 | 575.6 | |
| Avg. dif. Rel. [%] | −2.7 | 69.1 | 44.8 | 11.5 | 2.1 | −4.2 | 13.6 | 61.3 | 64.8 | |
| 1000 rpm | Avg. Horiba [ppm] | 194.1 | 488.3 | 584.4 | 748.7 | 1007.9 | 1011.5 | 1069.1 | 1180.0 | 1166.5 |
| Avg. Tekber [ppm] | 188.2 | 498.8 | 603.9 | 813.0 | 1106.2 | 1110.4 | 1193.5 | 1311.5 | 1281.1 | |
| Avg. dif. Abs. [ppm] | −5.8 | 10.5 | 19.6 | 64.3 | 98.3 | 98.9 | 124.4 | 131.5 | 114.5 | |
| Avg. dif. Rel. [%] | −3.0 | 2.1 | 3.3 | 8.6 | 9.8 | 9.8 | 11.6 | 11.1 | 9.8 | |
| 1500 rpm | Avg. Horiba [ppm] | 271.9 | 375.9 | 647.5 | 829.5 | 952.5 | 1024.8 | 1106.6 | 1060.2 | 1067.7 |
| Avg. Tekber [ppm] | 236.1 | 322.9 | 600.2 | 846.2 | 1018.7 | 1097.4 | 1189.8 | 1165.3 | 1186.4 | |
| Avg. dif. Abs. [ppm] | −35.8 | −53.0 | −47.3 | 16.7 | 66.1 | 72.6 | 83.2 | 105.1 | 118.7 | |
| Avg. dif. Rel. [%] | −13.2 | −14.1 | −7.3 | 2.0 | 6.9 | 7.1 | 7.5 | 9.9 | 11.1 | |
| 2000 rpm | Avg. Horiba [ppm] | 250.5 | 410.2 | 706.8 | 928.8 | 1070.7 | 1209.7 | 1216.9 | 1181.9 | 1179.7 |
| Avg. Tekber [ppm] | 235.0 | 407.9 | 764.6 | 1079.5 | 1300.3 | 1473.3 | 1459.1 | 1415.5 | 1399.5 | |
| Avg. dif. Abs. [ppm] | −15.5 | −2.2 | 57.8 | 150.7 | 229.6 | 263.6 | 242.2 | 233.6 | 219.9 | |
| Avg. dif. Rel. [%] | −6.2 | −0.5 | 8.2 | 16.2 | 21.4 | 21.8 | 19.9 | 19.8 | 18.6 | |
| 2500 rpm | Avg. Horiba [ppm] | 220.1 | 318.4 | 522.7 | 734.2 | 851.1 | 953.9 | 1060.1 | 957.1 | 955.4 |
| Avg. Tekber [ppm] | 200.5 | 308.5 | 538.6 | 783.5 | 934.8 | 1062.6 | 1166.8 | 1059.0 | 1077.8 | |
| Avg. dif. Abs. [ppm] | −19.6 | −9.8 | 15.9 | 49.3 | 83.7 | 108.7 | 106.6 | 101.9 | 122.5 | |
| Avg. dif. Rel. [%] | −8.9 | −3.1 | 3.0 | 6.7 | 9.8 | 11.4 | 10.1 | 10.6 | 12.8 | |
| 3000 rpm | Avg. Horiba [ppm] | 173.0 | 284.8 | 467.4 | 571.8 | 738.2 | 941.0 | 1085.1 | 1084.6 | 1053.9 |
| Avg. Tekber [ppm] | 148.1 | 284.8 | 446.5 | 574.7 | 775.1 | 1046.3 | 1236.5 | 1241.7 | 1208.4 | |
| Avg. dif. Abs. [ppm] | −24.9 | 0.0 | −20.9 | 2.9 | 37.0 | 105.3 | 151.4 | 157.1 | 154.4 | |
| Avg. dif. Rel. [%] | −14.4 | 0.0 | −4.5 | 0.5 | 5.0 | 11.2 | 13.9 | 14.5 | 14.7 |
References
- EEA. Air Quality in Europe 2021 Key Messages. Available online: https://www.eea.europa.eu/publications/air-quality-in-europe-2021 (accessed on 18 February 2022).
- EEA. Health Impacts of Air Pollution in Europe. 2021. Available online: https://www.eea.europa.eu/publications/air-quality-in-europe-2021/health-impacts-of-air-pollution (accessed on 19 February 2022).
- Tan, J.; Duan, J.; He, K.; Ma, Y.; Duan, F.; Chen, Y.; Fu, J. Chemical Characteristics of PM2.5during a Typical Haze Episode in Guangzhou. J. Environ. Sci. 2009, 21, 774–781. [Google Scholar] [CrossRef]
- Reşitoʇlu, I.A.; Altinişik, K.; Keskin, A. The Pollutant Emissions from Diesel-Engine Vehicles and Exhaust Aftertreatment Systems. Clean Technol. Env. Policy 2015, 17, 15–27. [Google Scholar] [CrossRef]
- Hooftman, N.; Messagie, M.; van Mierlo, J.; Coosemans, T. A Review of the European Passenger Car Regulations–Real Driving Emissions vs Local Air Quality. Renew. Sustain. Energy Rev. 2018, 86, 1–21. [Google Scholar] [CrossRef]
- EEA. Sources and Emissions of Air Pollutants in Europe—European Environment Agency. Available online: https://www.eea.europa.eu/publications/air-quality-in-europe-2021/sources-and-emissions-of-air (accessed on 18 February 2022).
- Lee, T.; Park, J.; Kwon, S.; Lee, J.; Kim, J. Variability in Operation-Based NOx Emission Factors with Different Test Routes, and Its Effects on the Real-Driving Emissions of Light Diesel Vehicles. Sci. Total Environ. 2013, 461–462, 377–385. [Google Scholar] [CrossRef] [PubMed]
- Wang, X.; Westerdahl, D.; Hu, J.; Wu, Y.; Yin, H.; Pan, X.; Max Zhang, K. On-Road Diesel Vehicle Emission Factors for Nitrogen Oxides and Black Carbon in Two Chinese Cities. Atmos. Environ. 2012, 46, 45–55. [Google Scholar] [CrossRef]
- O’Driscoll, R.; Stettler, M.E.J.; Molden, N.; Oxley, T.; ApSimon, H.M. Real World CO2 and NOx Emissions from 149 Euro 5 and 6 Diesel, Gasoline and Hybrid Passenger Cars. Sci. Total Environ. 2018, 621, 282–290. [Google Scholar] [CrossRef] [PubMed]
- Carslaw, D.C.; Beevers, S.D.; Tate, J.E.; Westmoreland, E.J.; Williams, M.L. Recent Evidence Concerning Higher NOx Emissions from Passenger Cars and Light Duty Vehicles. Atmos. Environ. 2011, 45, 7053–7063. [Google Scholar] [CrossRef]
- Williams, M.L.; Carslaw, D.C. New Directions: Science and Policy-Out of Step on NOx and NO2? Atmos. Environ. 2011, 45, 3911–3912. [Google Scholar] [CrossRef]
- Hoekman, S.K.; Robbins, C. Review of the Effects of Biodiesel on NOx Emissions. Fuel Processing Technol. 2012, 96, 237–249. [Google Scholar] [CrossRef]
- CITA. Monitoring of NOx Emissions as Part of the PTI; CITA: Brussels, Belgium, 2022. [Google Scholar]
- Fernández, E.; Valero, A.; Alba, J.J.; Ortego, A. A New Approach for Static NOx Measurement in PTI. Sustainability 2021, 13, 13424. [Google Scholar] [CrossRef]
- Campolo, M.; Sclabi, A.; Molin, D. TEDDIE Project-Final Report; CITA: Brussels, Belgium, 2010; Volume 32. [Google Scholar]
- Boulter, P.; Buekenhoudt, P.; Stricker, P.; Mäurer, H.-J.; Nolte, C.; Ost, T.; Schulz, W.H.; Witz, K.-U.; Afflerbach, G.; Förster, C.; et al. TEDDIE: A New Roadworthiness Emission Test for Diesel Vehicles Involving NO, NO2 and PM Measurements, Final Report. CITA 2011, 105. [Google Scholar] [CrossRef]
- OIML. OIML R99-1 & 2 Edition 2008 (E) Instruments for Measuring Vehicle Exhaust Emissions Part 1: Metrological and Technical Requirements Part 2: Metrological Controls and Performance Tests; OIML: Paris, France, 2008. [Google Scholar]
- Bermúdez, V.; García, A.; Villalta, D.; Soto, L. Assessment on the Consequences of Injection Strategies on Combustion Process and Particle Size Distributions in Euro VI Medium-Duty Diesel Engine. Int. J. Engine Res. 2020, 21, 683–697. [Google Scholar] [CrossRef]
- Fernández-Yáñez, P.; Soriano, J.A.; Mata, C.; Armas, O.; Pla, B.; Bermúdez, V. Simulation of Optimal Driving for Minimization of Fuel Consumption or NOX Emissions in a Diesel Vehicle. Energies 2021, 14, 5513. [Google Scholar] [CrossRef]
- Pla, B.; Piqueras, P.; Bares, P.; Aronis, A. NOx Sensor Cross Sensitivity Model and Simultaneous Prediction of NOx and NH3 Slip from Automotive Catalytic Converters under Real Driving Conditions. Int. J. Engine Res. 2020, 22, 3209–3218. [Google Scholar] [CrossRef]
- ISO 3930:2000(E)/OIML R99:2000(E); Instruments for Measuring Vehicle Exhaust Emissions. ISO: Geneva, Switzerland, 2000.
- The United Nations Economic Commission for Europe (UNECE) Regulation No 83 of the Economic Commission for Europe of the United Nations (UN/ECE)–Uniform Provisions Concerning the Approval of Vehicles with Regard to the Emission of Pollutants According to Engine Fuel Requirements. Off. J. Or Eur. Union 2006, L 375, 223–495.
- United States Environmental Protection Agency (EPA). CFR PART 1065: ENGINE-TESTING PROCEDURES. Code Fed. Regul. (CFR) 2021, 37, 46–293. [Google Scholar]
- United States Environmental Protection Agency (EPA). CFR PART 1066: VEHICLE-TESTING PROCEDURES. Code Fed. Regul. (CFR) 2021, 37, 293–393. [Google Scholar]
- ISO/IEC 17025:2005(E); General Requirements for the Competence of Testing and Calibration Laboratories. ISO: Geneva, Switzerland, 2005.
- Andros Inc. Model 6900 Product Manual (Compact Automotive Gas); Andros Incorporated: Richmond, CA, USA.
- British Standard BS ISO 15031-5:2006; Road Vehicles—Communication between Vehicle and External Equipment for Emissions Related Diagnosis, Part 5: Emissions-Related Diagnostic Services. British Standard: London, UK, 2006; p. 186.
- Dulac, J. Global Transport Outlook to 2050; International Energy Agency: Paris, France, 2012. [Google Scholar]
- Valero, A.; Valero, A.; Calvo, G.; Ortego, A. Material Bottlenecks in the Future Development of Green Technologies. Renew. Sustain. Energy Rev. 2018, 93, 178–200. [Google Scholar] [CrossRef]
Figure 1.
Test cell schema with Tekber and Horiba Gas Analyser installation.

Figure 2.
Sample of stages of the Static Idling Internal Load test for NOx measurements.
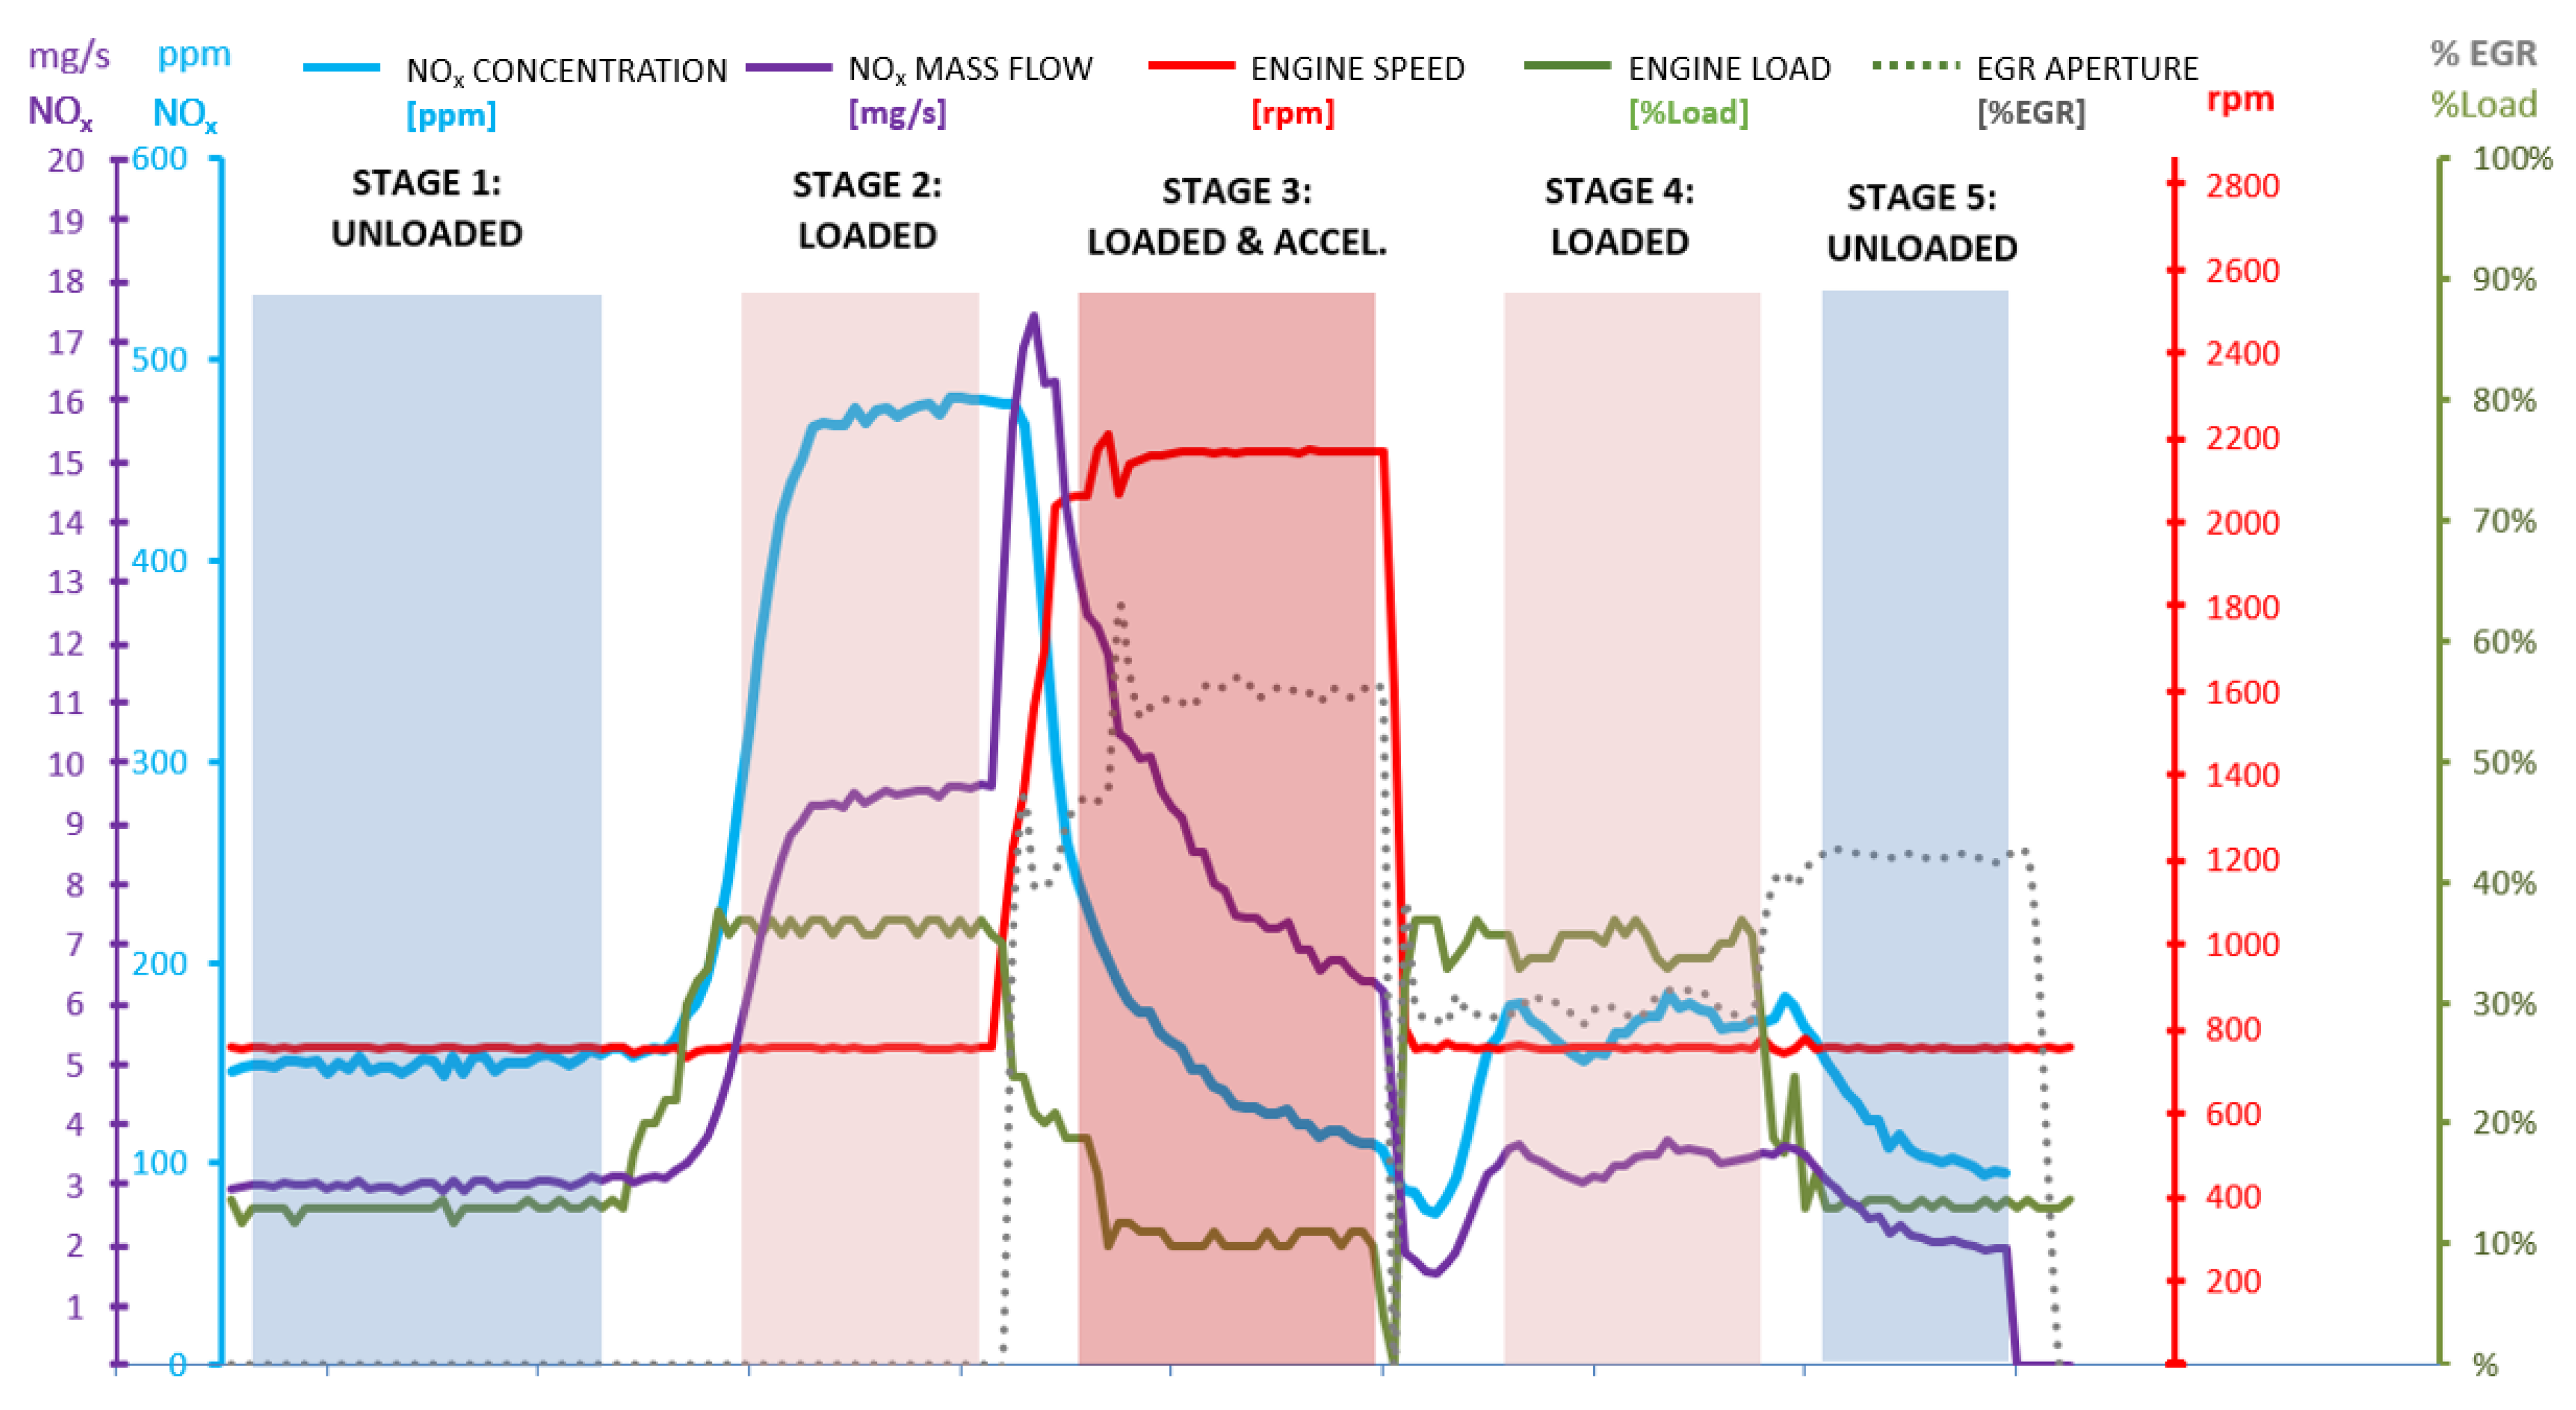
Figure 3.
Sample of the test with EGR and low load conditions.

Figure 4.
Sample of the Test without EGR and low load conditions.

Figure 5.
Comparison of Tests with and without EGR and high load conditions.
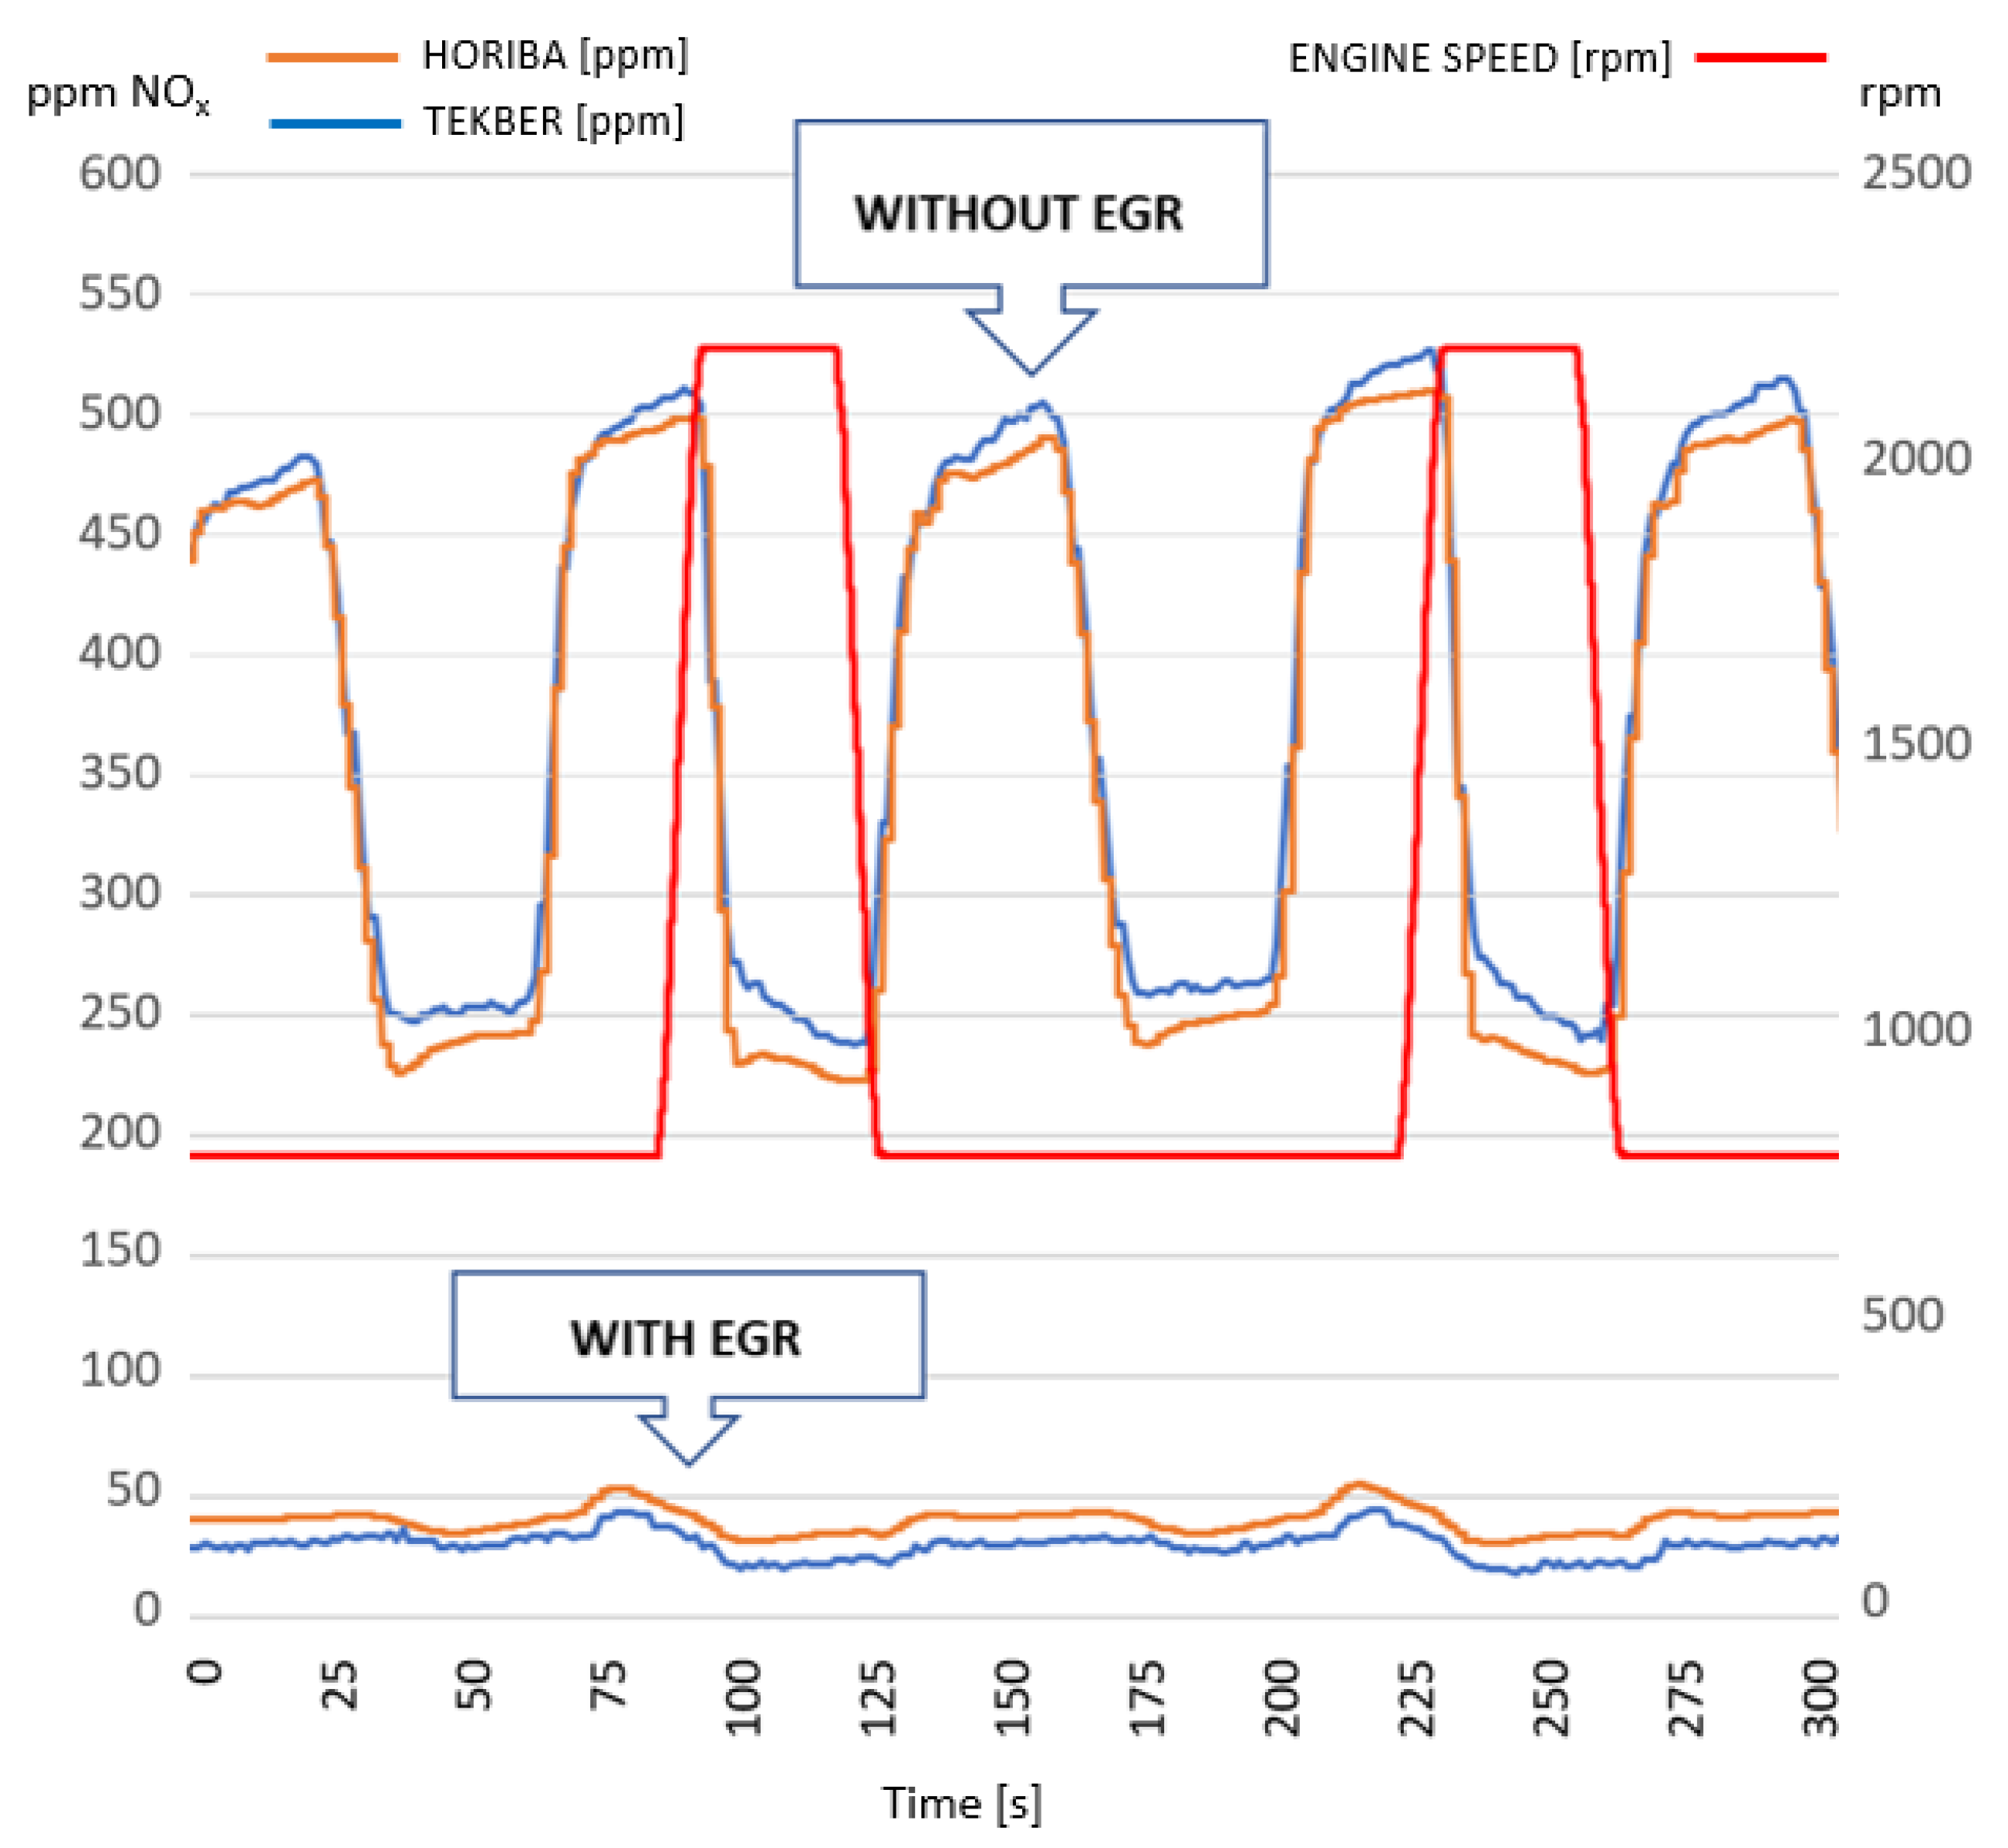
Figure 6.
NOx concentration with EGR activated: (a) @800 rpm, (b) @1000 rpm, (c) @1500 rpm, (d) @2000 rpm, (e) @2500 rpm, (f) @3000 rpm.
Figure 6.
NOx concentration with EGR activated: (a) @800 rpm, (b) @1000 rpm, (c) @1500 rpm, (d) @2000 rpm, (e) @2500 rpm, (f) @3000 rpm.


Figure 7.
Average differences in Absolute and Relative terms according to the load demand with the EGR activated: (a) @800 rpm, (b) @1000 rpm, (c) @1500 rpm, (d) @2000 rpm, (e) @2500 rpm, (f) @3000 rpm.
Figure 7.
Average differences in Absolute and Relative terms according to the load demand with the EGR activated: (a) @800 rpm, (b) @1000 rpm, (c) @1500 rpm, (d) @2000 rpm, (e) @2500 rpm, (f) @3000 rpm.


Figure 8.
Correlation between concentration values from Tekber and Horiba equipment: (a) @800 rpm, (b) @1000 rpm, (c) @1500 rpm, (d) @2000 rpm, (e) @2500 rpm, (f) @3000 rpm.
Figure 8.
Correlation between concentration values from Tekber and Horiba equipment: (a) @800 rpm, (b) @1000 rpm, (c) @1500 rpm, (d) @2000 rpm, (e) @2500 rpm, (f) @3000 rpm.
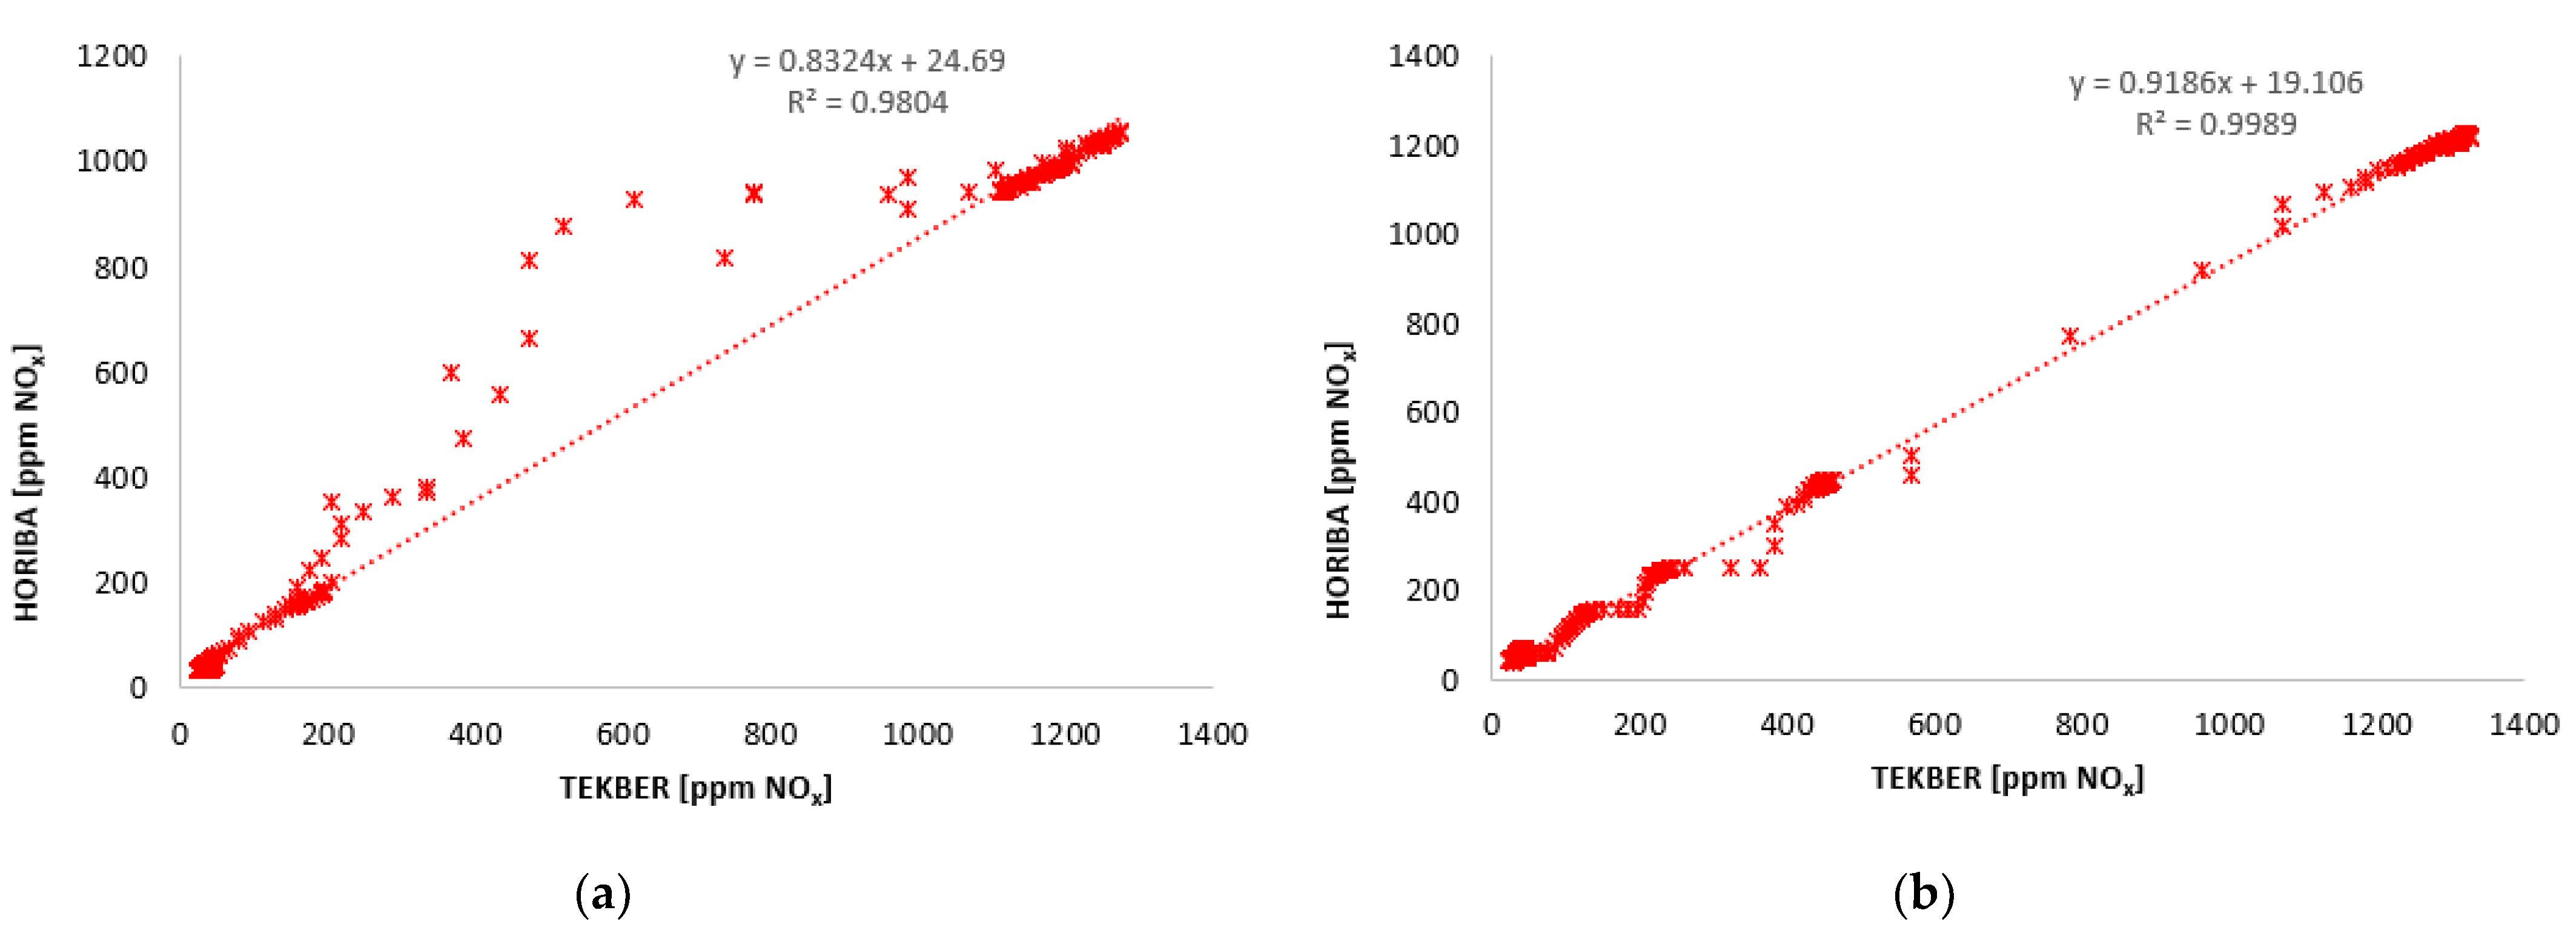

Figure 9.
Differences between Tekber and Horiba results according to the load demand with EGR.

Figure 10.
Differences between Tekber and Horiba results according to the load demand without EGR.
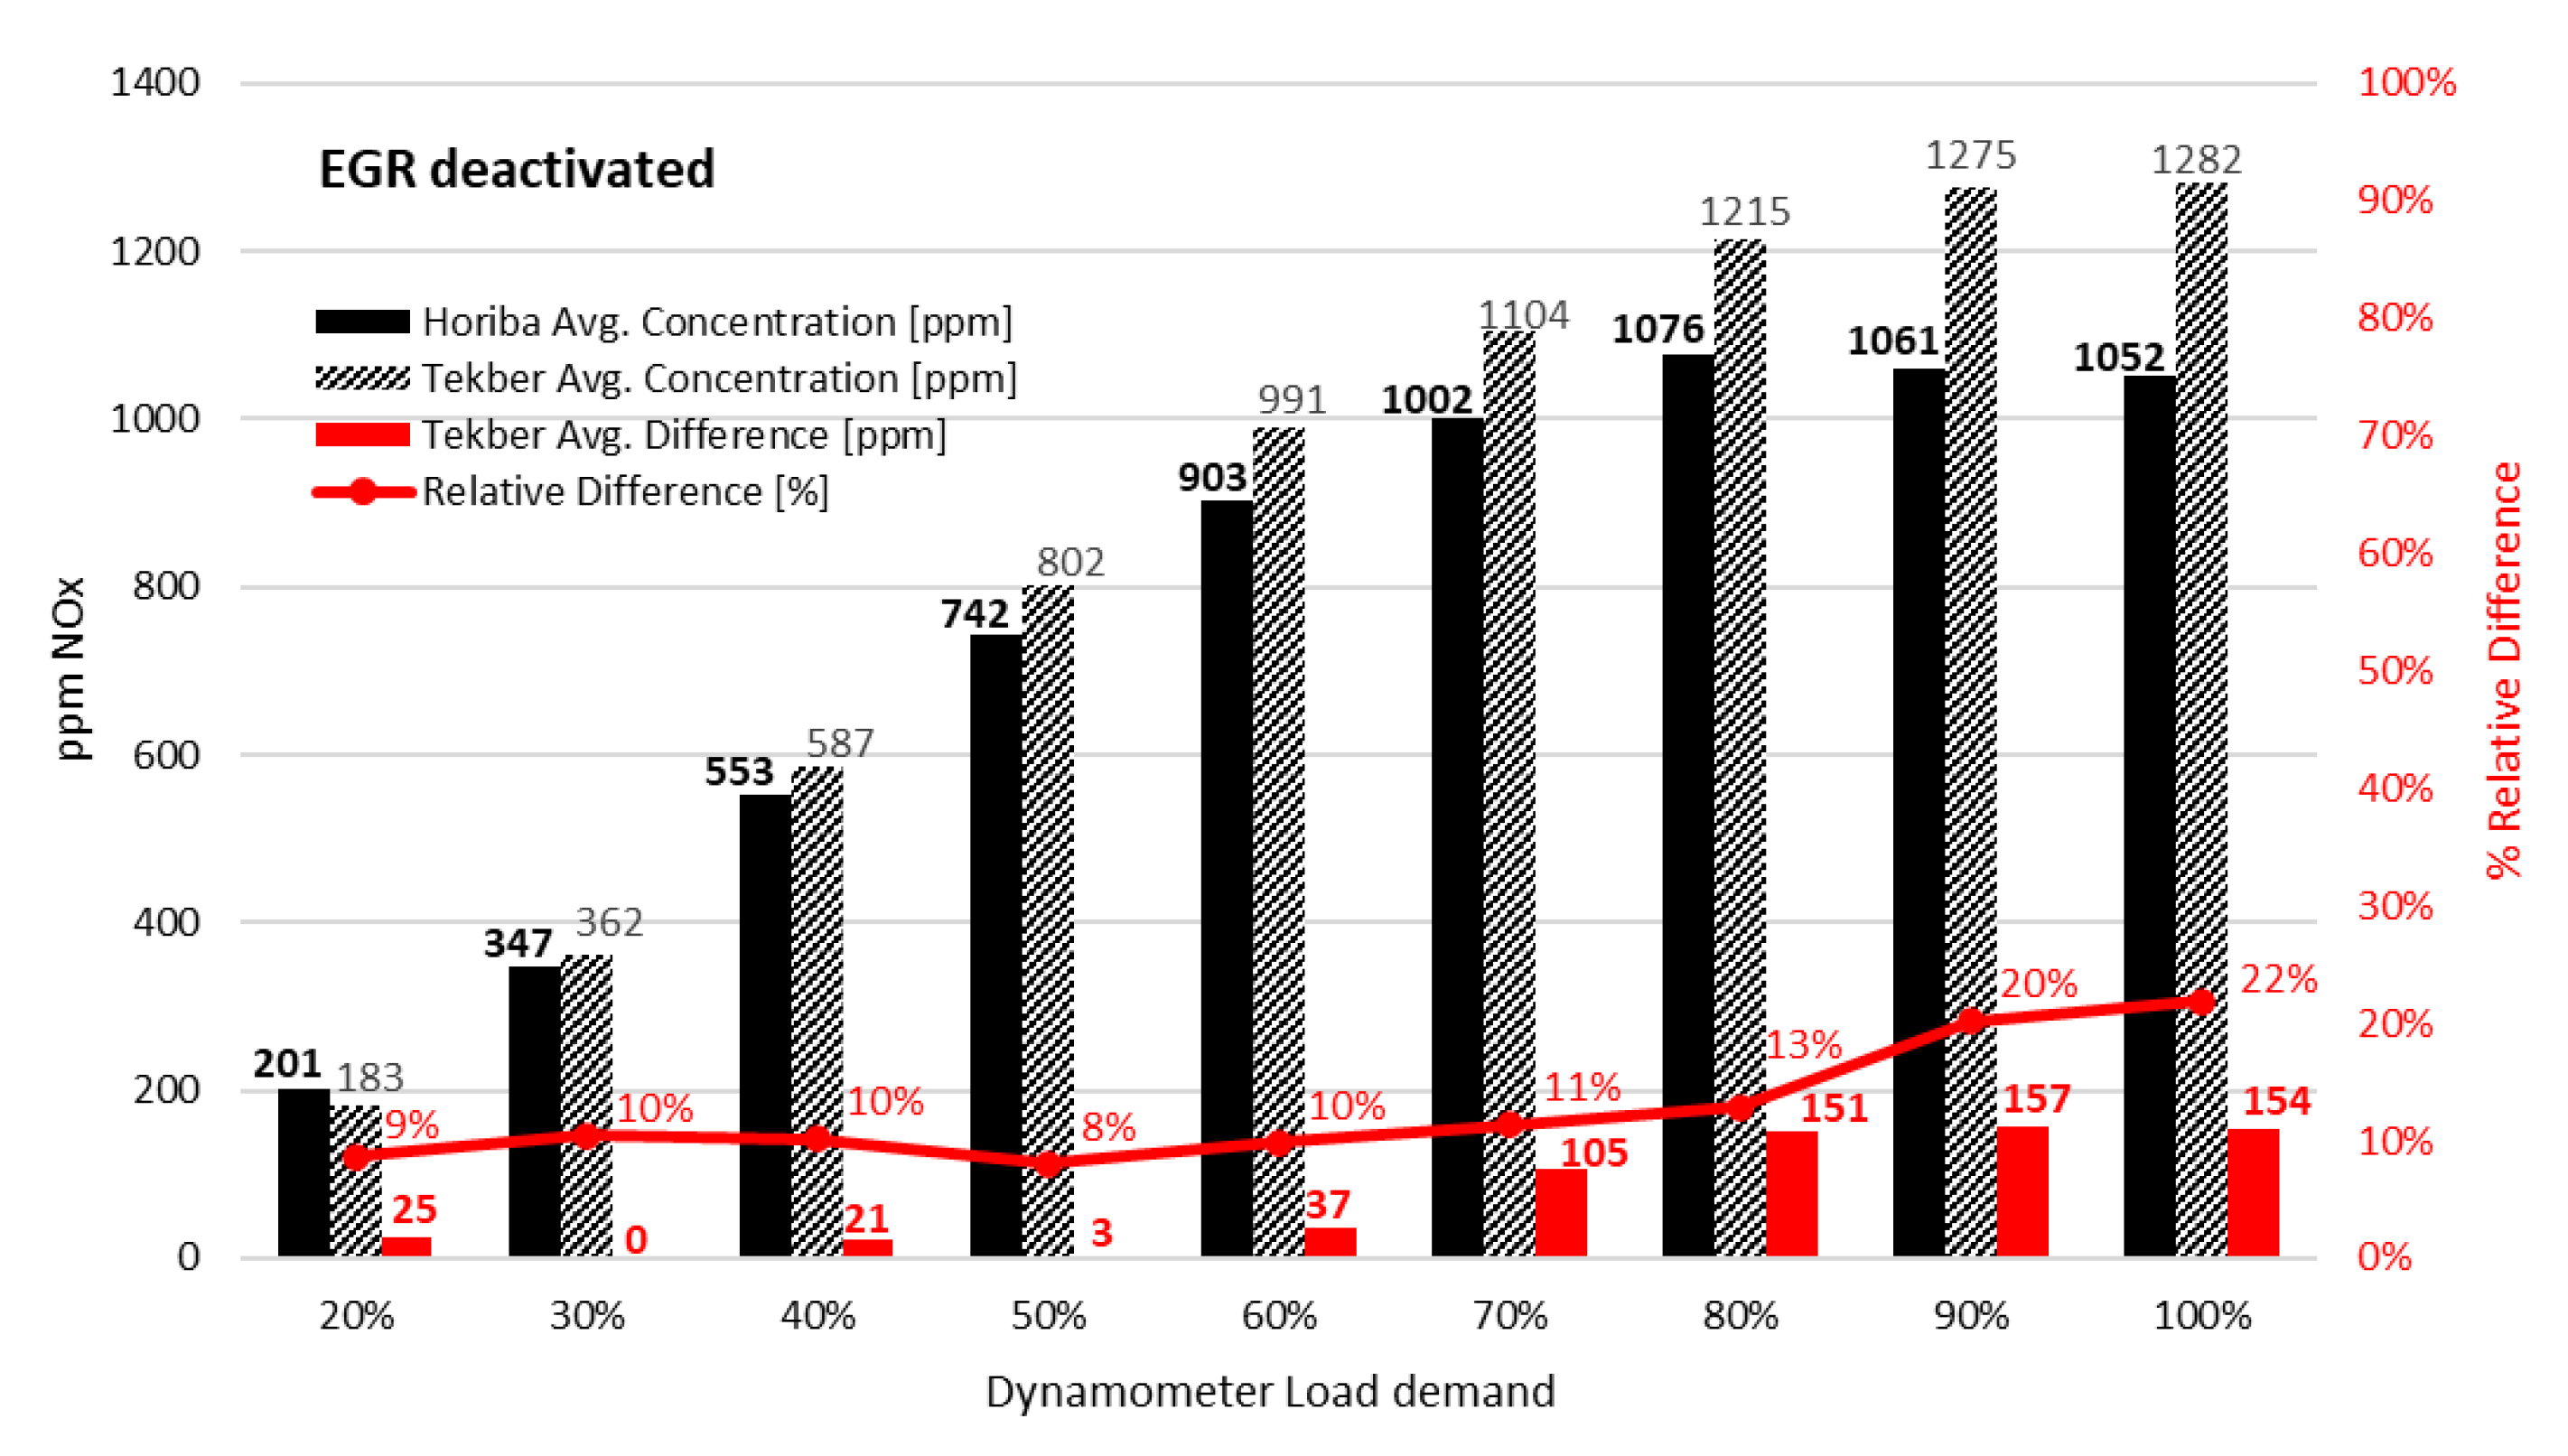
Table 1.
Engine running conditions for the Static Idling Internal Load Test.
| Stage 1: Unloaded | Stage 2: Loaded | Stage 3: Loaded & Accelerated | Stage 4: Loaded | Stage 5: Unloaded | |
|---|---|---|---|---|---|
| Engine state | On | On | On | On | On |
| Engine speed [rpm] | Natural idle speed | Natural idle speed | >2000 rpm <3000 rpm | Natural idle speed | Natural idle speed |
| Vehicle extra load equipment | Disconnected | Connected | Connected | Connected | Disconnected |
| % Engine load [%] | <25% * | >25% * | Irrelevant | >25% * | <25% * |
(*) Reference values, depending on the vehicle.
Table 2.
Summary of average concentrations and differences for the Static Idling Internal Load Test with EGR.
Table 2.
Summary of average concentrations and differences for the Static Idling Internal Load Test with EGR.
| Low Load | High Load | |
|---|---|---|
| HORIBA Average NOx [ppm] | 53.7 | 44.3 |
| TEKBER Average NOx [ppm] | 53.6 | 36.2 |
| Avg. Absolute Diff. [ppm] | 2.6 | 8.6 |
| Avg. Relative Diff. [%] | 4.8% | 20.6% |
Table 3.
Summary of the average concentrations and differences for the Static Idling Internal Load Test without EGR.
Table 3.
Summary of the average concentrations and differences for the Static Idling Internal Load Test without EGR.
| Low Load | High Load | |
|---|---|---|
| HORIBA Average NOx [ppm] | 325.0 | 405.6 |
| TEKBER Average NOx [ppm] | 339.8 | 430.2 |
| Avg. Absolute Diff. [ppm] | 20.8 | 29.1 |
| Avg. Relative Diff. [%] | 5.9% | 7.1% |
Table 4.
Summary of average absolute differences (ppm NOx) between Tekber and Horiba equipment with EGR.
Table 4.
Summary of average absolute differences (ppm NOx) between Tekber and Horiba equipment with EGR.
| Load Demand | |||||||||
|---|---|---|---|---|---|---|---|---|---|
| Engine Speed | 20% | 30% | 40% | 50% | 60% | 70% | 80% | 90% | 100% |
| 800 rpm | 1.6 | 0.7 | 5.4 | 6.6 | 9.0 | 7.2 | 229.2 | 200.8 | 183.7 |
| 1000 rpm | 17.5 | 17.6 | 17.0 | 15.7 | 11.7 | 11.0 | 10.0 | 67.8 | 94.8 |
| 1500 rpm | 3.5 | 0.5 | 9.9 | 18.0 | 3.7 | 30.0 | 85.8 | 112.6 | 118.2 |
| 2000 rpm | 7.1 | 9.5 | 12.7 | 9.3 | 13.8 | 65.6 | 170.0 | 207.9 | 221.6 |
| 2500 rpm | 5.1 | 24.5 | 24.4 | 23.7 | 12.5 | 30.4 | 93.7 | 108.1 | 123.7 |
| 3000 rpm | 7.5 | 5.9 | 2.2 | 10.1 | 19.0 | 54.7 | 150.1 | 128.5 | n.d. |
| Avg. Diff. [ppm] | 7.1 | 9.8 | 11.9 | 13.9 | 11.6 | 33.2 | 123.1 | 137.6 | 148.4 |
| Rel. Diff. [%] | 9.8% | 12.4% | 11.1% | 8.9% | 5.4% | 7.1% | 12.6% | 12.8% | 13.6% |
Table 5.
Summary of the average absolute differences (ppm NOx) between Tekber and Horiba equipment without EGR.
Table 5.
Summary of the average absolute differences (ppm NOx) between Tekber and Horiba equipment without EGR.
| Load Demand | |||||||||
|---|---|---|---|---|---|---|---|---|---|
| Engine Speed | 20% | 30% | 40% | 50% | 60% | 70% | 80% | 90% | 100% |
| 800 | 2.5 | 143.3 | 175.1 | 73.5 | 16.6 | 36.8 | 124.8 | 553.9 | 575.6 |
| 1000 | 5.8 | 10.5 | 19.6 | 64.3 | 98.3 | 98.9 | 124.4 | 131.5 | 114.5 |
| 1500 | 35.8 | 53.0 | 47.3 | 16.7 | 66.1 | 72.6 | 83.2 | 105.1 | 118.7 |
| 2000 | 15.5 | 2.2 | 57.8 | 150.7 | 229.6 | 263.6 | 242.2 | 233.6 | 219.9 |
| 2500 | 19.6 | 9.8 | 15.9 | 49.3 | 83.7 | 108.7 | 106.6 | 101.9 | 122.5 |
| 3000 | 24.9 | 0.0 | 20.9 | 2.9 | 37.0 | 105.3 | 151.4 | 157.1 | 154.4 |
| Avg. Diff. [ppm] | 17.4 | 36.5 | 56.1 | 59.6 | 88.5 | 114.3 | 138.8 | 213.9 | 230.2 |
| Rel. Diff. [%] | 8.7% | 10.5% | 10.1% | 8.0% | 9.8% | 11.4% | 12.9% | 20.1% | 21.9% |
Publisher’s Note: MDPI stays neutral with regard to jurisdictional claims in published maps and institutional affiliations. |
© 2022 by the authors. Licensee MDPI, Basel, Switzerland. This article is an open access article distributed under the terms and conditions of the Creative Commons Attribution (CC BY) license (https://creativecommons.org/licenses/by/4.0/).
Share and Cite
MDPI and ACS Style
Fernández, E.; Ortego, A.; Valero, A.; Alba, J.J. Suitability Assessment of NOx Emissions Measurements with PTI Equipment. Vehicles 2022, 4, 917-941. https://doi.org/10.3390/vehicles4040050
AMA Style
Fernández E, Ortego A, Valero A, Alba JJ. Suitability Assessment of NOx Emissions Measurements with PTI Equipment. Vehicles. 2022; 4(4):917-941. https://doi.org/10.3390/vehicles4040050
Chicago/Turabian StyleFernández, Eugenio, Abel Ortego, Alicia Valero, and Juan J. Alba. 2022. "Suitability Assessment of NOx Emissions Measurements with PTI Equipment" Vehicles 4, no. 4: 917-941. https://doi.org/10.3390/vehicles4040050