Communication

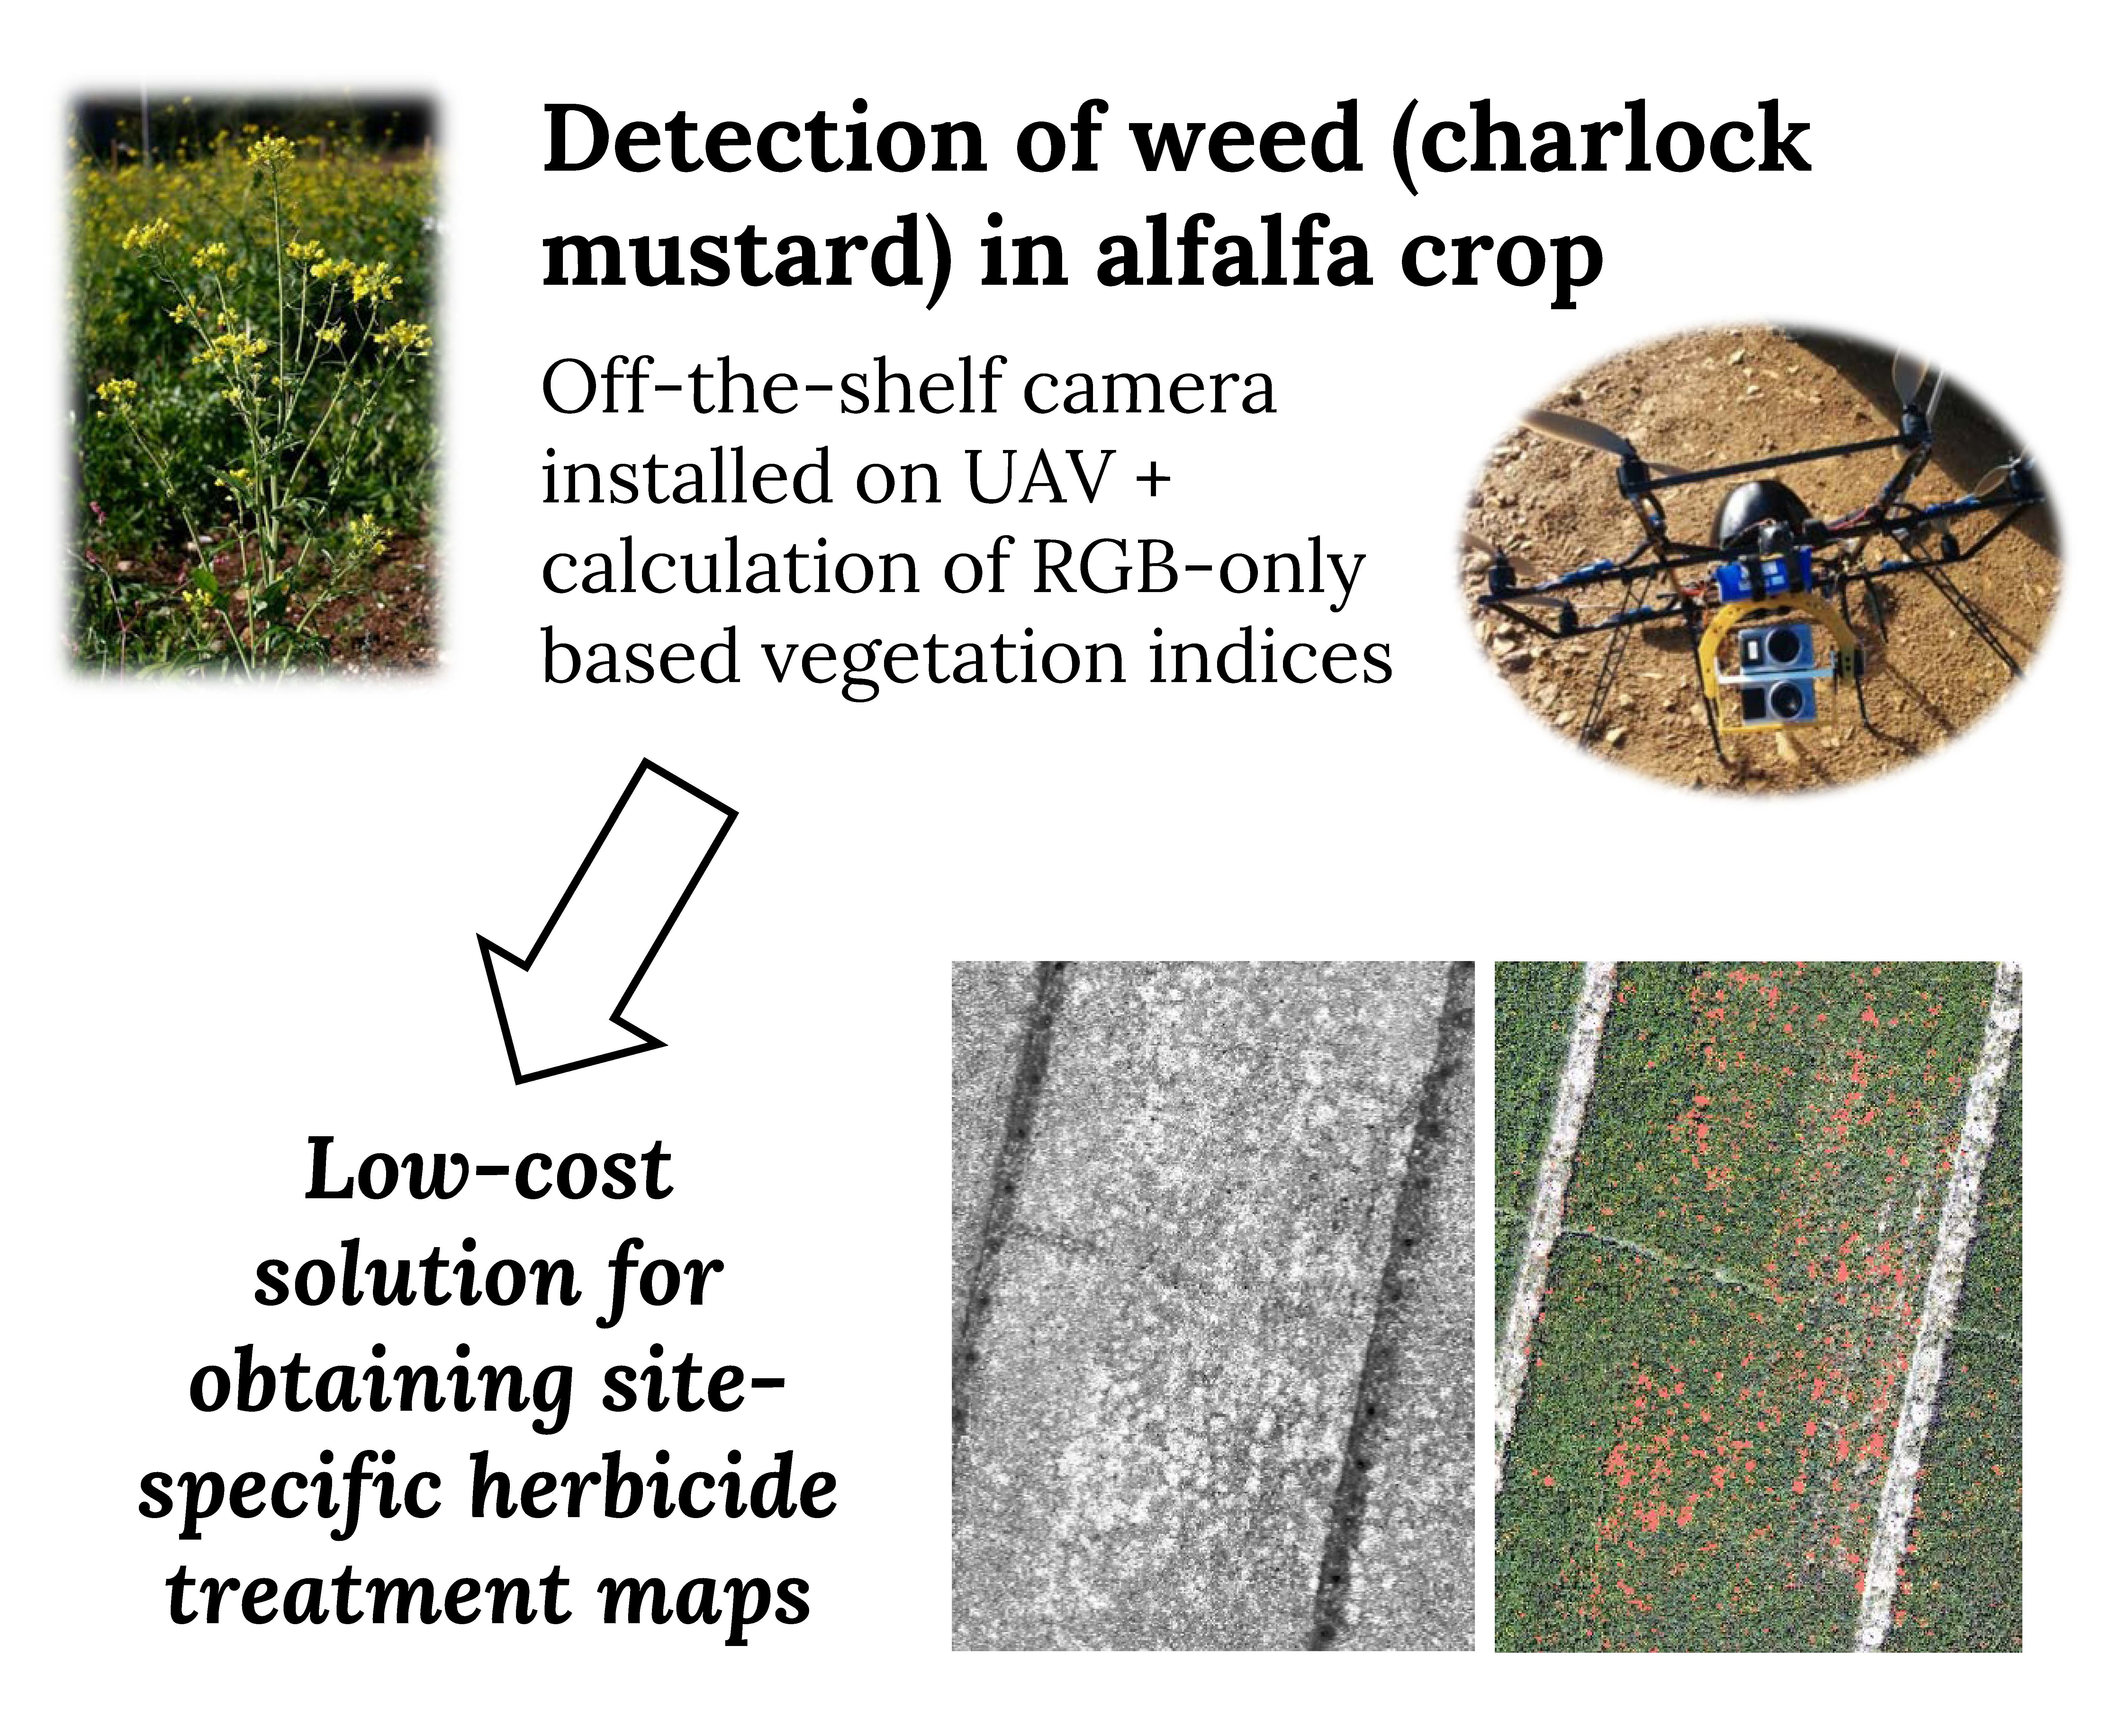
UAV Detection of Sinapis arvensis Infestation in Alfalfa Plots Using Simple Vegetation Indices from Conventional Digital Cameras

by
Luis Fernando Sánchez-Sastre
1,
Mª Auxiliadora Casterad
2,
Mónica Guillén
2,
Norlan Miguel Ruiz-Potosme
3,
Nuno M. S. Alte da Veiga
4,5,
Luis Manuel Navas-Gracia
1 and
Pablo Martín-Ramos
6,*
1
Department of Agricultural and Forestry Engineering, ETSIIAA, Universidad de Valladolid, 34004 Palencia, Spain
2
Unidad de Suelos y Riegos (asociada a EEAD-CISC), Centro de Investigación y Tecnología Agroalimentaria de Aragón (CITA), 50059 Zaragoza, Spain
3
Department of Technical Education. European University Miguel de Cervantes, 47012 Valladolid, Spain
4
Departamento de Ciências da Terra, Universidade de Coimbra, Rua Sílvio Lima, 3030-790 Coimbra, Portugal
5
CITEUC—Centro de Investigação da Terra e do Espaço, Universidade de Coimbra, Rua do Observatório, 3040-004 Coimbra, Portugal
6
Instituto Universitario de Investigación en Ciencias Ambientales de Aragón (IUCA), EPS, Universidad de Zaragoza, 22071 Huesca, Spain
*
Author to whom correspondence should be addressed.
AgriEngineering 2020, 2(2), 206-212; https://doi.org/10.3390/agriengineering2020012
Submission received: 13 February 2020 / Revised: 27 March 2020 / Accepted: 30 March 2020 / Published: 31 March 2020
(This article belongs to the Special Issue Selected Papers from 10th Iberian Agroengineering Congress)

Abstract

:
Unmanned Aerial Vehicles (UAVs) offer excellent survey capabilities at low cost to provide farmers with information about the type and distribution of weeds in their fields. In this study, the problem of detecting the infestation of a typical weed (charlock mustard) in an alfalfa crop has been addressed using conventional digital cameras installed on a lightweight UAV to compare RGB-based indices with the widely used Normalized Difference Vegetation Index (NDVI) index. The simple (R−B)/(R+B) and (R−B)/(R+B+G) vegetation indices allowed one to easily discern the yellow weed from the green crop. Moreover, they avoided the potential confusion of weeds with soil observed for the NDVI index. The small overestimation detected in the weed identification when the RGB indices were used could be easily reduced by using them in conjunction with NDVI. The proposed methodology may be used in the generation of weed cover maps for alfalfa, which may then be translated into site-specific herbicide treatment maps.

Graphical Abstract

1. Introduction

Unmanned Aerial Vehicles (UAVs) are being increasingly used for farming applications as a remote sensing platform. These aerial platforms allow one to raise different data gathering sensors or devices [1], including commercial digital cameras [2], and even to view these data in real time [3,4]. UAVs, in a similar fashion to other low-altitude remote-sensing platforms, can be used to obtain high-resolution images of continuous areas below cloud cover and near the field [5], allowing one to collect data when it is required and at a relatively low cost.
Traditionally, remote sensors used in canopy detection may be classified into active and passive types [6]. Most systems based on passive remote sensing, as the ones discussed herein, depend on the variability of spectral responses of vegetation in the visible and near infrared (NIR) regions. These responses can be used to calculate indices related to vegetation cover and chlorophyll content, which have found applications in the detection of nitrogen deficiencies [7], in the continuous monitoring of crop status [8], in disease detection [9], as vegetation phenology and ecosystem indicators [10], and in weed detection [11,12], among other areas.
With regard to this latter application, it should be taken into consideration that weeds are responsible for approximately 35% reduction in global crop yields [13,14]. To avoid the over-application of herbicides, the use of patch spraying makes it possible to conduct site-specific weed management based on weed coverage. Precise and timely weed maps, taking advantage of the high spatial resolution provided by UAVs, are thus essential. Successful application of UAVs has been demonstrated for weed mapping in sunflower [15,16,17,18], wheat [19,20], cotton and soybean [21], maize [22], rice [23,24], or sugar beet [25], but not in alfalfa, as in the present study.
The methods proposed for the discrimination of weeds with RGB or multispectral images are based on spectral information (color differences, vegetation indices), geometric information (shape, texture, plant arrangement), or combinations of both spectral and spatial data. Firstly, vegetation is usually separated from the soil by means of vegetation indices, after which shape or texture-based methods are generally applied to discriminate between crop and weeds. Weed detection between crop rows frequently involves their identification by analysis techniques and/or image segmentation, such as Hough Transform or Object-Based Image Analysis (OBIA). Supervised classifiers (e.g., Decision Tree, Support Vector Machine, or Random Forest) are the most popular image-processing techniques, although unsupervised classification algorithms [26] and new classifiers based on a Bag of Visual Words (BoVW) model [27] have also been recently tested.
In relation to the vegetation indices, the calculation of the indices used in most of aforementioned studies (e.g., the normalized difference vegetation index, NDVI; the perpendicular vegetation index, PVI; the ratio vegetation index, RVI; and the soil-adjusted vegetation index, SAVI) involves multispectral sensors. Nonetheless, other indices (e.g., the excess green index, ExG; the normalized green–red difference index, NGRDI; the color index of vegetation extraction, CIVE; the excess green minus excess red index, ExGR; and the normalized difference photosynthetic vigor ratio index, NDPVR) can also be calculated from images captured with conventional digital cameras, which are cheaper than multispectral cameras and may also feature a good performance [28]. For instance, Kawashima et al. [29] successfully demonstrated the calculation of chlorophyll content in rice leaves using a video camera and indices based only on the visible spectrum.
In the study presented herein, two of these simple visible spectrum indices ((R−B)/(R+B) and (R−B)/(R+G+B)), calculated from photographs taken with a conventional digital camera, have been tested for the detection of charlock mustard (Sinapis arvensis L.) weed infestation in alfalfa (Medicago sativa L.) plots and their performance has been compared with that of the well-established NDVI index.

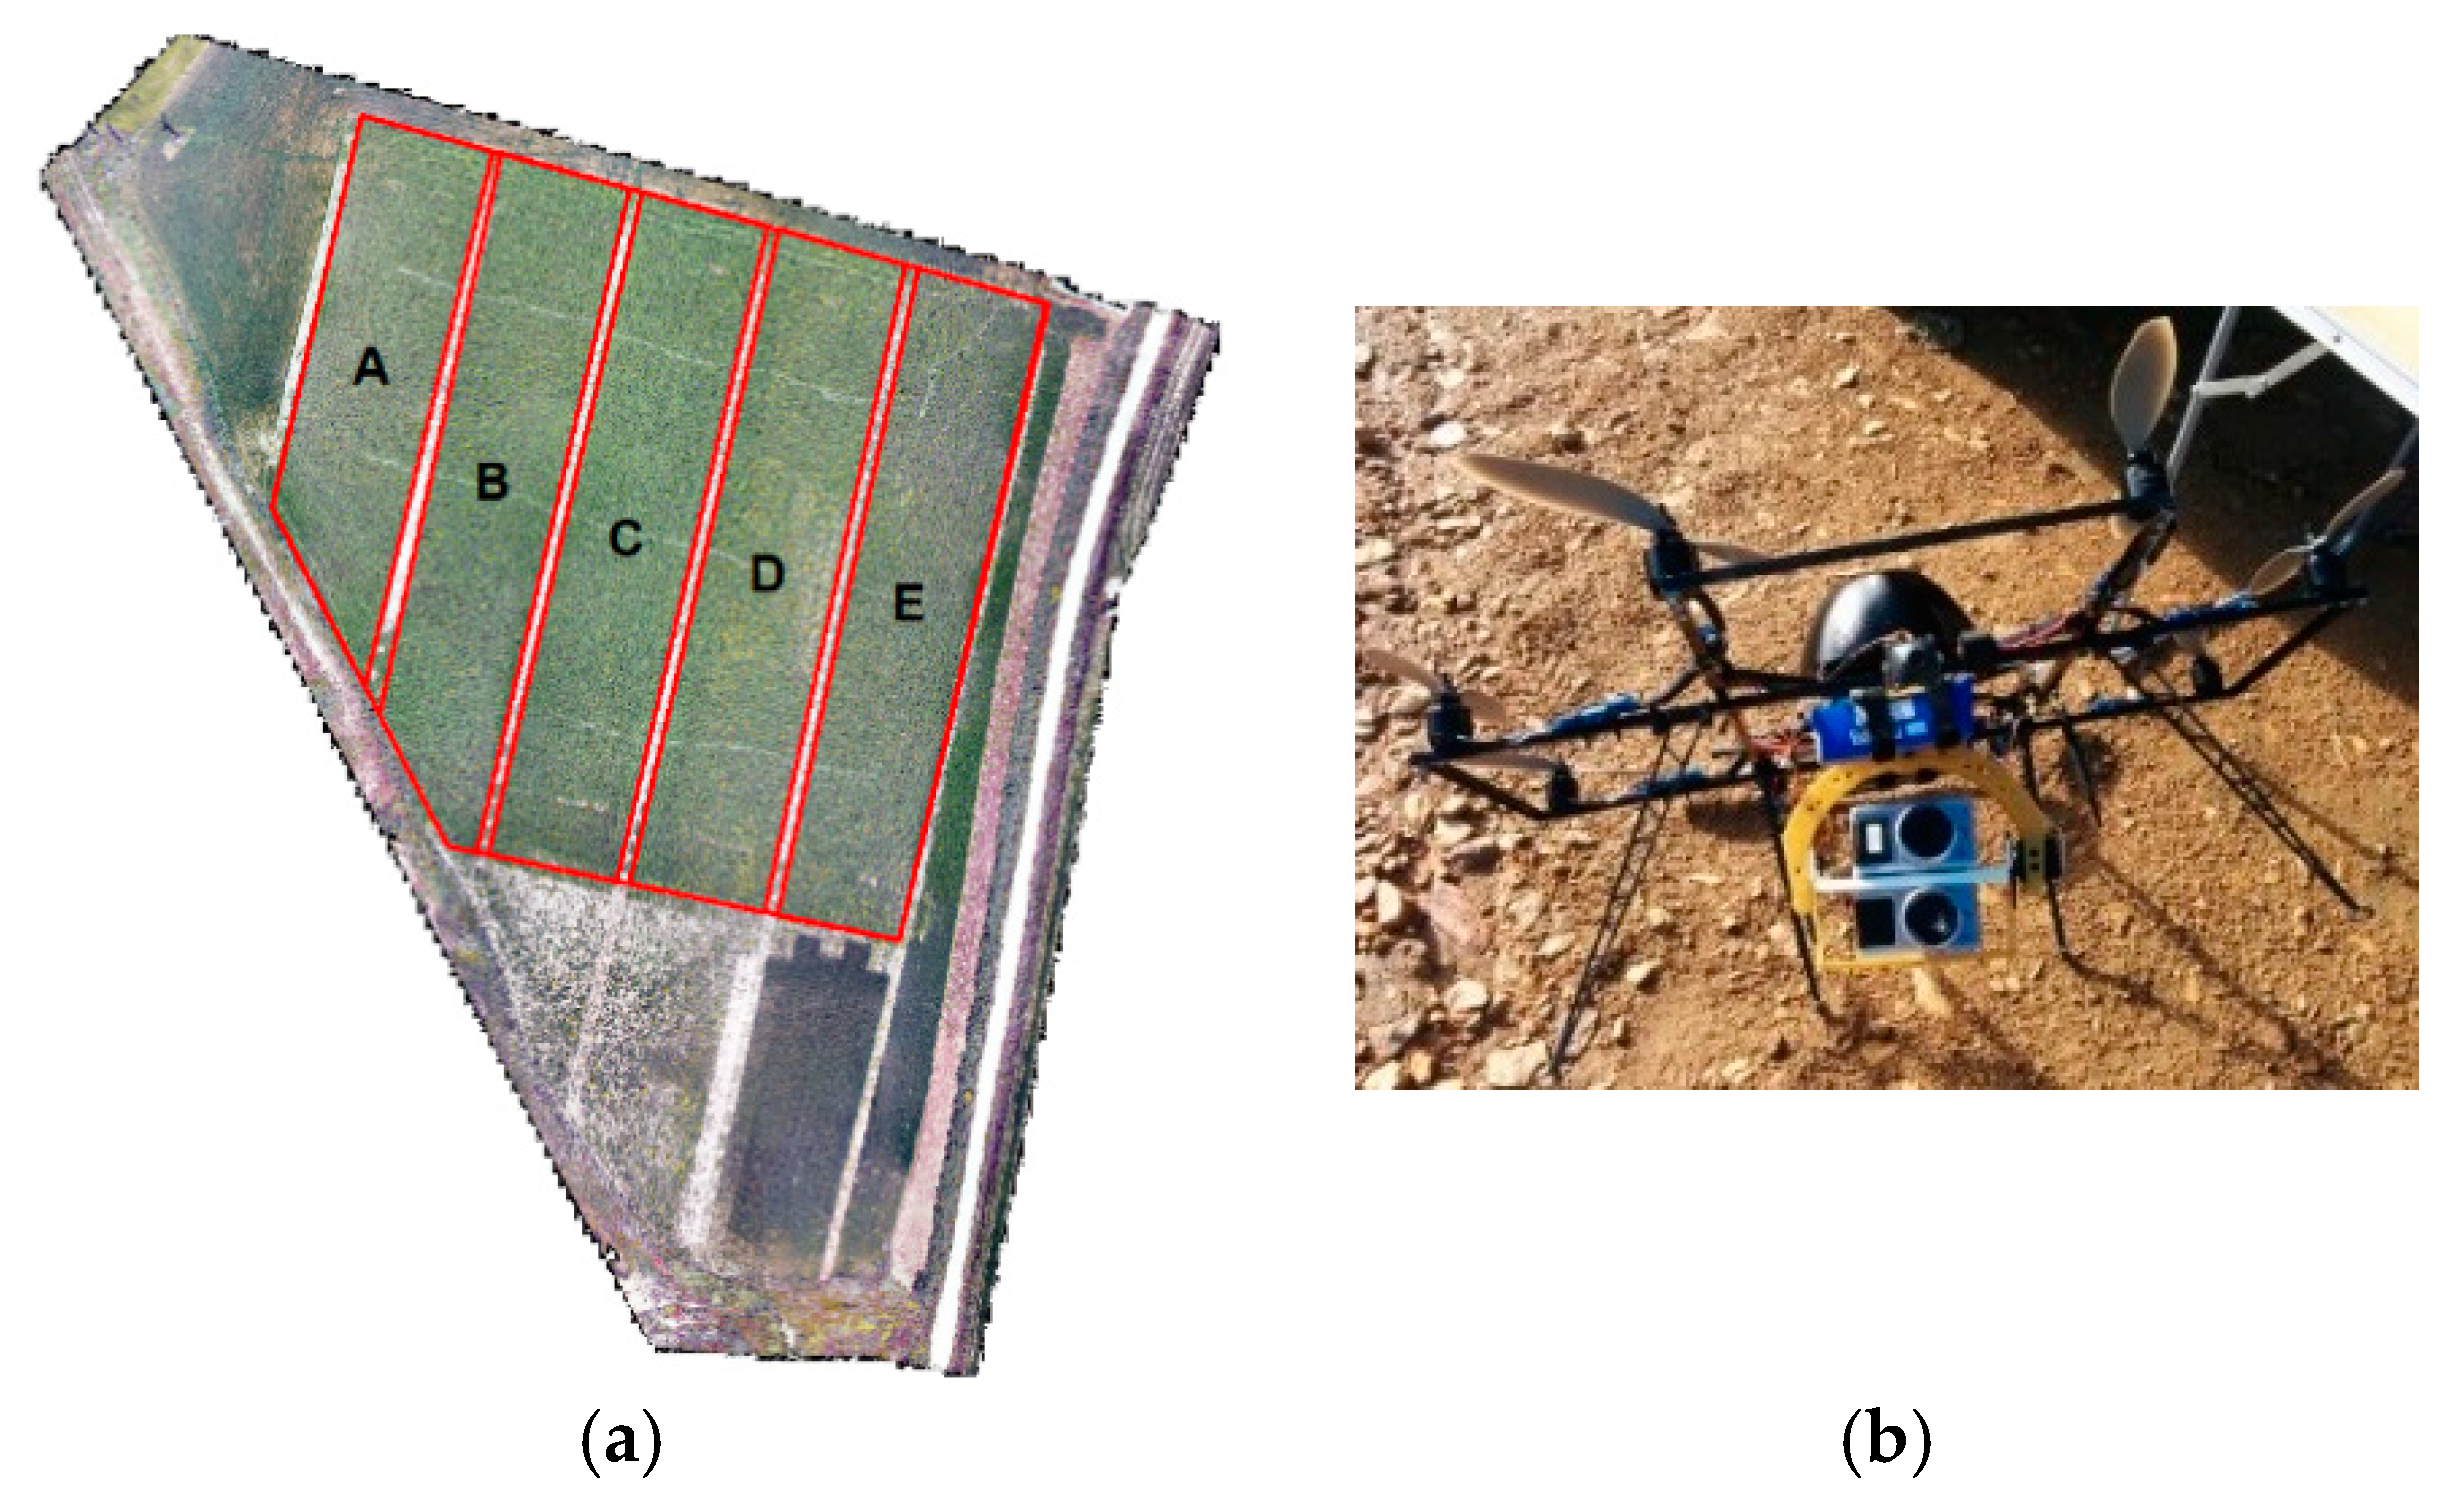
2. Materials and Methods

The alfalfa plot (2.8 ha) under study (Figure 1a) was located in Soto de Cerrato, Palencia, Spain (41°56′53″ N, 4°25′29″ W, 725 m.a.s.l.).
Images were captured on a single date (13 May, when S. arvensis was in the flowering stage) with two conventional digital cameras set on a Mikrokopter UfocamXXL8 V3 octocopter (Figure 1b): an Olympus (Shinjuku, Tokyo, Japan) Pen E-PM1 semireflex digital camera for the RGB pictures and a customized Olympus Pen E-P1 camera for the NIR band. In this latter camera, the IR low pass filter was removed and a 720 nm high pass IR filter was installed to block the visible part of the spectrum.
Before the flights, 10 control points of known coordinates were marked on the ground for geometrical corrections and for georeferencing of the mosaics. The path trajectory was defined using Mikrokopter Tool software. Flight height was set at 60 m, and the minimum longitudinal and transverse overlap for imagery acquisition were 70% and 40%, respectively, in order to guarantee the correct generation of the mosaics. The flight took 8 min.
Pictures were processed with Agisoft PhotoScan (PS) (Agisoft LLC, Saint Petersburg, Russia). From each images set, i.e., visible and NIR, a georeferenced image was produced in PhotoScan by different routines in a semiautomatic process in which the camera positions were calculated and control points were added. The pixel size of the images was 10 cm × 10 cm. The pixel values were generated in a range from 0 to 255 (“digital number”, DN) for the Red (R), Green (G), Blue (B), and Near-Infrared (NIR) channels. It should be taken into consideration that the relative contributions of red, green, and blue were automatically modified depending on the lightning conditions and the color of the target, given that the off-the-shelf camera’s automatic white balance was used [30]. The two georeferenced images (visible and NIR) overlapped perfectly, sharing the same control points. Both images were then imported to PCI-Geomatica 9.1 (PCI-Geomatics, Markham, Canada) and the four channels (NIR-R-G-B) were combined.
Two vegetation indices based on the visible spectrum region were selected from the work by Kawashima et al. [29]. Specifically, the two indices that showed the highest correlation with chlorophyll content under different meteorological conditions were chosen. In addition, the most common vegetation index, NDVI, was chosen for comparison purposes. The three indices (Table 1) were finally calculated on the mosaic.

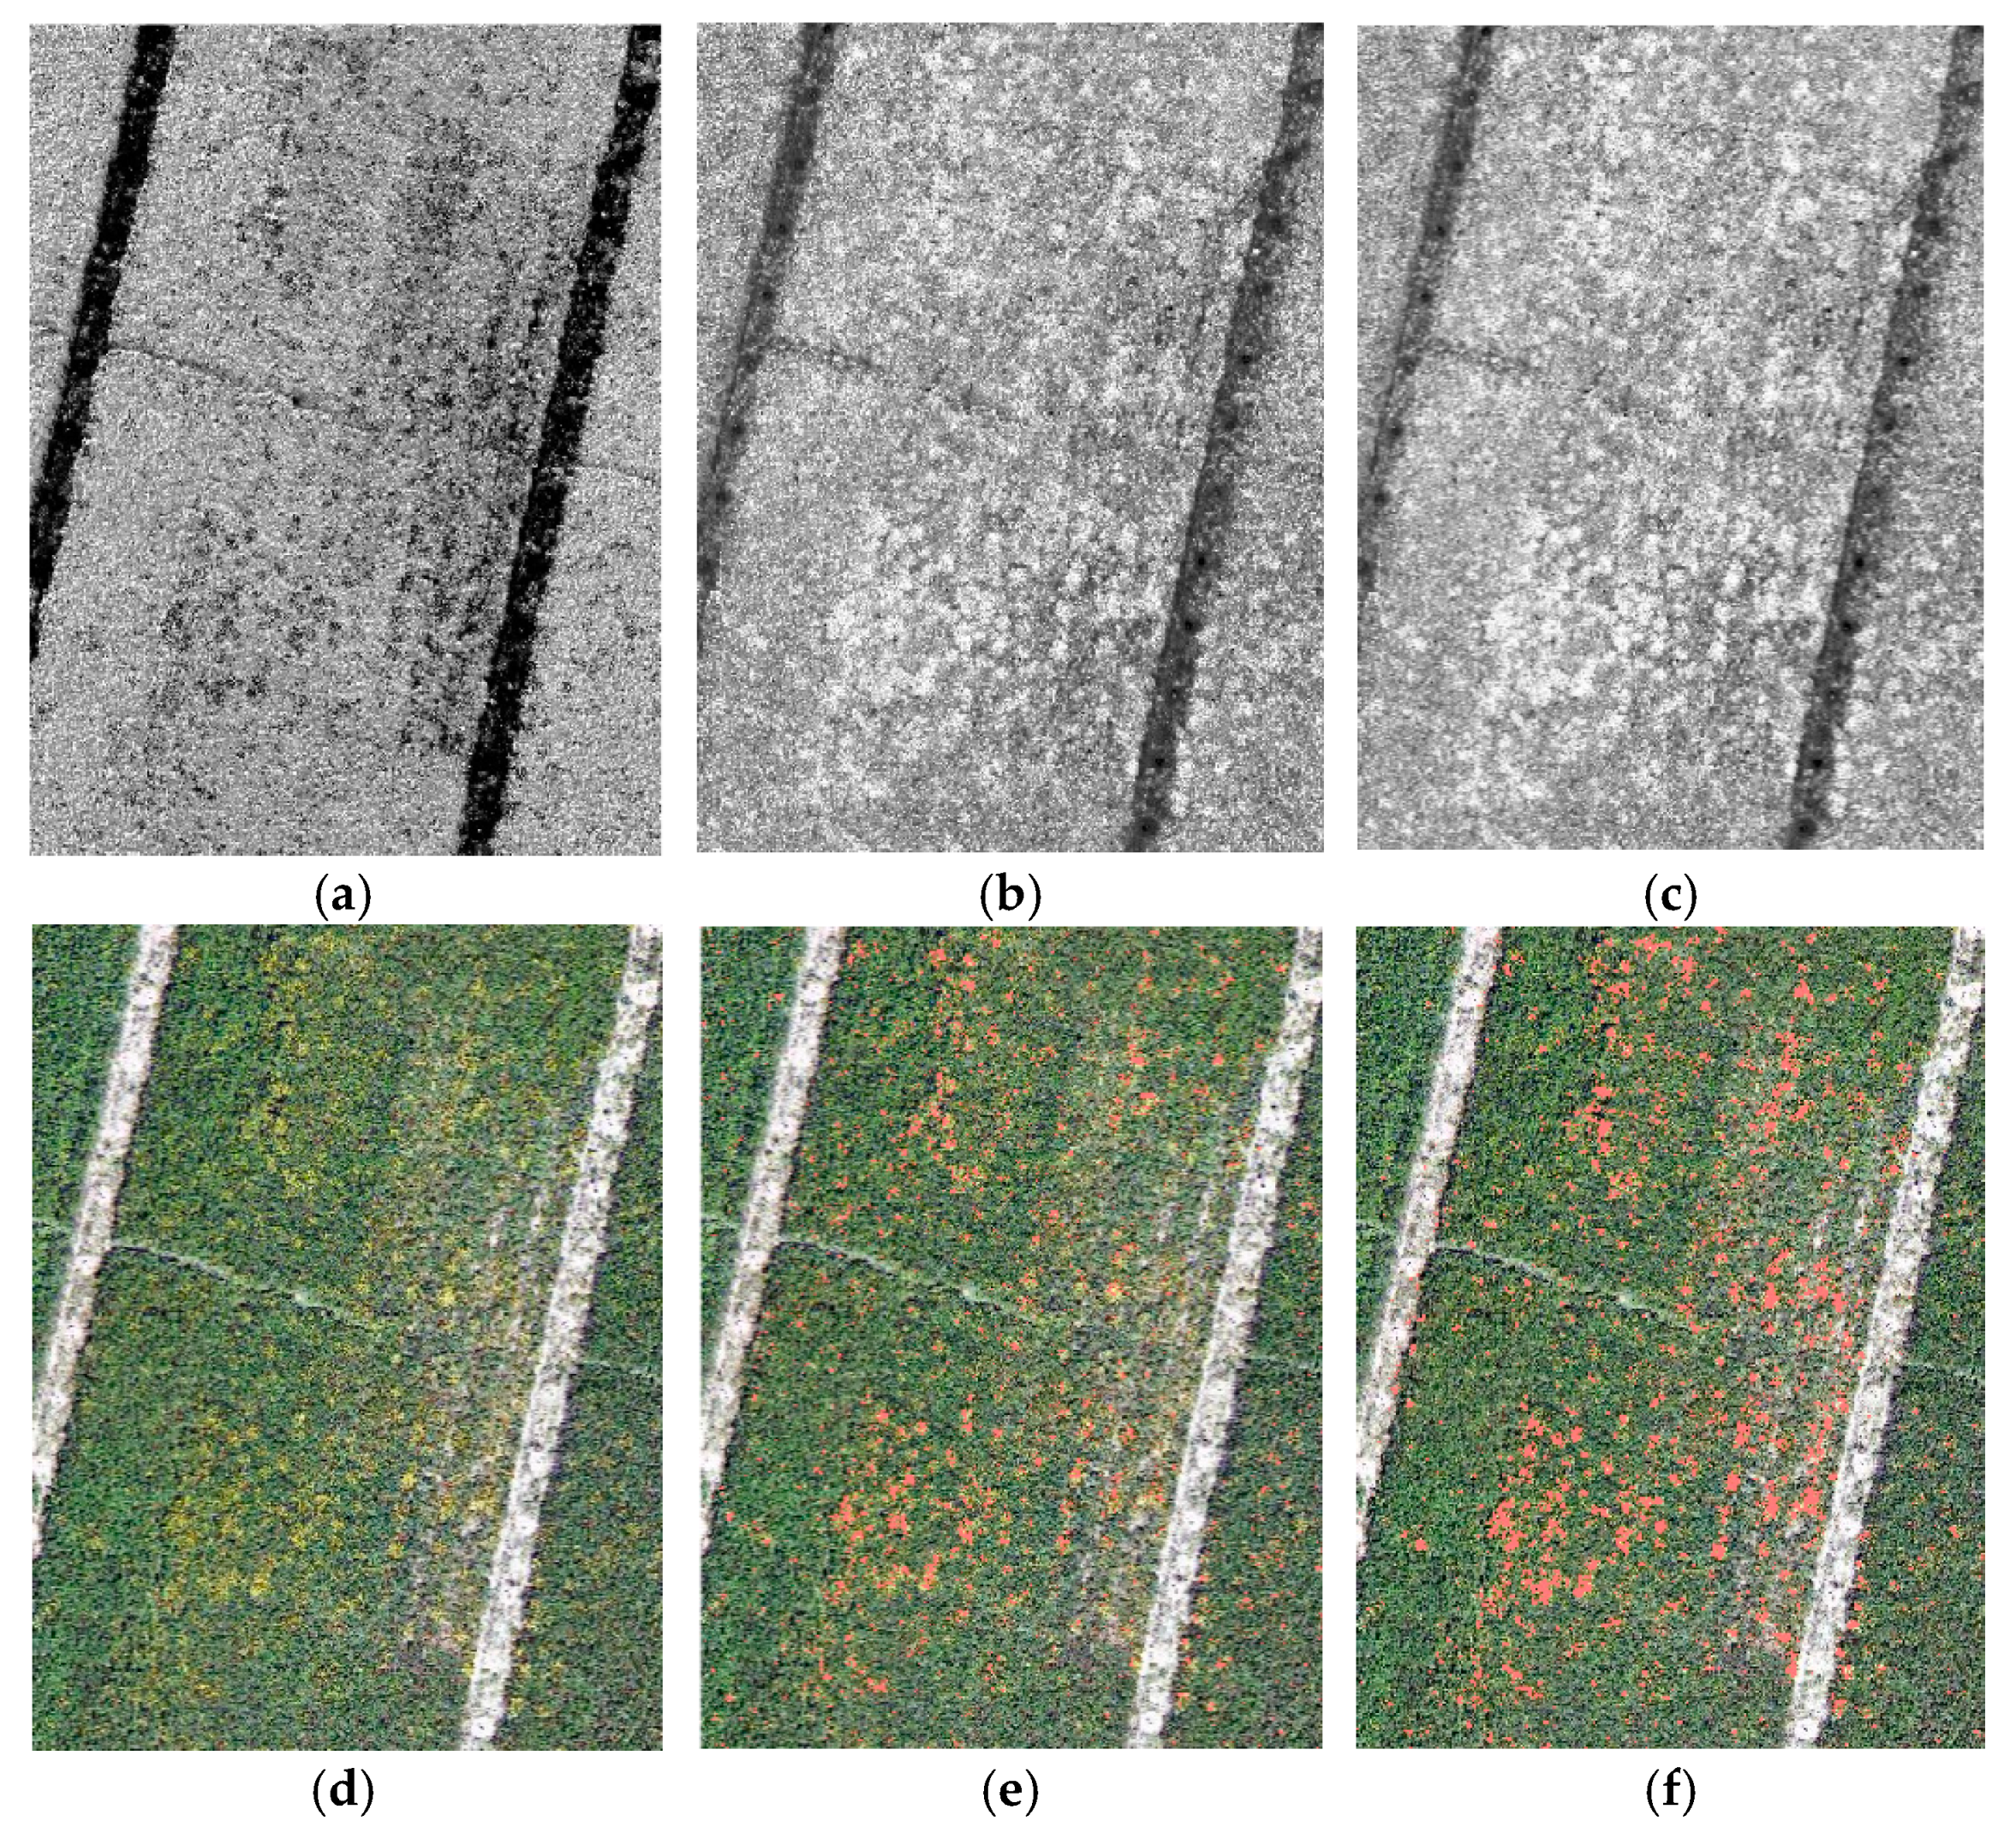
3. Results and Discussion

A comparison between the RGB captured image and the NDVI, (R−B)/(R+B), and (R−B)/(R+B+G) images is shown in Figure 2. In the RGB image (Figure 2d), Sinapsis arvensis could be distinguished in yellow or yellow-green hues, while alfalfa was green and the soil showed grey shades.
The use of the NDVI index (Figure 2a) differentiated soil from vegetation and allowed one to discern yellow weeds, but these could easily be confused with soil, given that both were shown with dark hues. On the other hand, (R−B)/(R+B) and (R−B)/(R+B+G) indices (Figure 2b,c) were found to be more sensitive to yellow spots, highlighting them with whitish hues. This avoided potential confusion of the weeds with soil, solving the problem associated with the use of NDVI. However, with these two indices some confusion between weeds and alfalfa was detected, which could lead to an overestimation of the infestation, discussed below. The marked difference observed for Sinapis arvensis between the low NDVI values and the very high values of the other two chosen indices allowed one to improve its identification when these indices were combined. A simple tree decision rule based on these differences was used as a first approximation to obtain the weed infestation map. An example of the results of the identification of the weed patterns with the indicated procedure is shown in Figure 2e,f. In both cases, a filter was applied to reduce nonrepresentative isolated pixels and to improve the result.
The two best maps (based on a visual interpretation of the imagery, comparing the RGB image in Figure 2d with the weed maps in Figure 2b,c and Figure 2e,f) resulted from the combination of NDVI with each of the other indices and were similar both in the spatial distribution of the condition and in its quantification. An estimation of the weed-infested surface in each subplot is presented in Table 2. It may be observed that the surfaces obtained from the two RGB-only indices were generally higher than those obtained from their combinations with NDVI.
These preliminary results should be expanded by analyzing in greater depth the separability of the different classes (cultivation, weeds, and soil), by applying more complex classification methods, and by validating the results with fieldwork, but the ability of the simple vegetation indices obtained from conventional cameras to identify sectors with a proliferation of Synapis arvensis in alfalfa may be deemed as promising.
Other studies, such as those conducted by Fuentes-Peailillo et al. [33] or by López-Granados et al. [22], have also demonstrated the possibility of obtaining spatial patterns with vegetation indexes calculated from RGB images taken with conventional cameras. In these studies, the distribution of the crop in rows facilitated weed discrimination, given that one could focus the identification only on the soil surface between the rows of the crop. The uniqueness of the study presented herein resides in the complete coverage of the land with alfalfa, which entailed particular difficulty for the location of the area affected by weeds.
The use of RGB sensors suggested in this work, in line with the approach proposed by Hassanein et al. [34], would provide an advantage to the system since such sensors are low-cost compared to multispectral ones.

4. Conclusions

An off-the-shelf camera mounted on an UAV, in combination with simple vegetation indices, can be a cheap and effective solution for weed detection, avoiding expensive multispectral imagery sensors. In this work, (R−B)/(R+B) and (R−B)/(R+B+G) indices were successfully applied to the detection of Sinapis arvensis in an alfalfa crop. These two simple indices from RGB sensors were as sensitive as NDVI for the detection of yellow weeds, with the additional advantage of avoiding potential confusion of the weeds with soil. The small overestimation detected in the weed identification when these indices were used could be easily reduced by using them in conjunction with NDVI. Since both RGB indices had high sensitivity to slight variations of colors from green to yellow, they may find application in the early detection of other yellow weeds as soon as they show up, and may be used as the first step to generate a weed map, providing alfalfa farmers with the positions of the detected weed patches for site-specific weed management.

Author Contributions

Conceptualization, L.F.S.-S.; methodology, N.M.R.-P., M.A.C., and N.M.S.A.d.V.; software, L.F.S.-S., M.G.; validation, N.M.R.-P., N.M.S.A.d.V.; formal analysis, L.F.S.-S., M.G., M.A.C., and P.M.-R.; investigation, L.F.S.-S.; resources, L.M.N.-G.; supervision: L.M.N.-G.; visualization, M.G.; writing—original draft preparation, L.F.S.-S., M.A.C., and P.M.-R.; writing—review and editing, L.F.S.-S., M.A.C., and P.M.-R. All authors have read and agreed to the published version of the manuscript.

Funding

This research was funded by the European Union LIFE+ Programme, under project “CO2 Operation: Integrated agroforestry practices and nature conservation against climate change” (ref. LIFE11 ENV/ES/000535).

Acknowledgments

To Shigeto Kawashima, for his guidance and advice. To Paula Carrión-Prieto, for her support with the visualization.

Conflicts of Interest

The authors declare no conflict of interest.

References

  1. Eisenbeiß, H. UAV Photogrammetry; ETH Zurich: Zurich, Switzerland, 2009. [Google Scholar]
  2. Teoh, C.; Hassan, D.A.; Radzali, M.M.; Jafni, J. Prediction of SPAD chlorophyll meter readings using remote sensing technique. J. Trop. Agric. Food Sci 2012, 40, 127–136. [Google Scholar]
  3. Kerle, N.; Heuel, S.; Pfeifer, N. Real-time data collection and information generation using airborne sensors. In Geospatial Information Technology for Emergency Response; Li, J., Zlatanova, S., Eds.; CRC Press: London, UK, 2008; pp. 59–90. [Google Scholar]
  4. Hunt, E.R.; Cavigelli, M.; Daughtry, C.S.T.; McMurtrey, J.E.; Walthall, C.L. Evaluation of Digital Photography from Model Aircraft for Remote Sensing of Crop Biomass and Nitrogen Status. Precis. Agric. 2005, 6, 359–378. [Google Scholar] [CrossRef]
  5. Saberioon, M.M.; Amin, M.S.M.; Anuar, A.R.; Gholizadeh, A.; Wayayok, A.; Khairunniza-Bejo, S. Assessment of rice leaf chlorophyll content using visible bands at different growth stages at both the leaf and canopy scale. Int. J. Appl. Earth Obs. Geoinf. 2014, 32, 35–45. [Google Scholar] [CrossRef]
  6. Moorthy, I.; Miller, J.R.; Berni, J.A.J.; Zarco-Tejada, P.; Hu, B.; Chen, J. Field characterization of olive (Olea europaea L.) tree crown architecture using terrestrial laser scanning data. Agric. For. Meteorol. 2011, 151, 204–214. [Google Scholar] [CrossRef]
  7. Mercado-Luna, A.; Rico-García, E.; Lara-Herrera, A.; Soto-Zarazúa, G.; Ocampo-Velázquez, R.; Guevara-González, R.; Herrera-Ruiz, G.; Torres-Pacheco, I. Nitrogen determination on tomato (Lycopersicon esculentum Mill.) seedlings by color image analysis (RGB). Afr. J. Biotechnol. 2010, 9, 5326–5332. [Google Scholar]
  8. Sakamoto, T.; Gitelson, A.A.; Nguy-Robertson, A.L.; Arkebauer, T.J.; Wardlow, B.D.; Suyker, A.E.; Verma, S.B.; Shibayama, M. An alternative method using digital cameras for continuous monitoring of crop status. Agric. For. Meteorol. 2012, 154–155, 113–126. [Google Scholar] [CrossRef] [Green Version]
  9. Hillnhütter, C.; Mahlein, A.K.; Sikora, R.A.; Oerke, E.C. Remote sensing to detect plant stress induced by Heterodera schachtii and Rhizoctonia solani in sugar beet fields. Field Crops Res. 2011, 122, 70–77. [Google Scholar] [CrossRef]
  10. Motohka, T.; Nasahara, K.N.; Oguma, H.; Tsuchida, S. Applicability of Green-Red Vegetation Index for Remote Sensing of Vegetation Phenology. Remote Sens. 2010, 2, 2369–2387. [Google Scholar] [CrossRef] [Green Version]
  11. Kazmi, W.; Garcia-Ruiz, F.J.; Nielsen, J.; Rasmussen, J.; Jørgen Andersen, H. Detecting creeping thistle in sugar beet fields using vegetation indices. Comput. Electron. Agric. 2015, 112, 10–19. [Google Scholar] [CrossRef] [Green Version]
  12. Garcia-Ruiz, F.J.; Wulfsohn, D.; Rasmussen, J. Sugar beet (Beta vulgaris L.) and thistle (Cirsium arvensis L.) discrimination based on field spectral data. Biosys. Eng. 2015, 139, 1–15. [Google Scholar] [CrossRef]
  13. Bunce, J.A.; Ziska, L.H. Crop ecosystem responses to climatic change: Crop/weed interactions. In Climate Change and Global Crop Productivity; Reddy, K.R., Hodges, H., Eds.; CABI Pub: Wallingford, Oxon, UK, 2000; pp. 333–352. [Google Scholar]
  14. Oerke, E.C. Crop losses to pests. J. Agric. Sci. 2005, 144, 31–43. [Google Scholar] [CrossRef]
  15. Pérez-Ortiz, M.; Peña, J.M.; Gutiérrez, P.A.; Torres-Sánchez, J.; Hervás-Martínez, C.; López-Granados, F. A semi-supervised system for weed mapping in sunflower crops using unmanned aerial vehicles and a crop row detection method. Appl. Soft Comput. 2015, 37, 533–544. [Google Scholar] [CrossRef]
  16. Abbott, D.; Torres-Sánchez, J.; López-Granados, F.; De Castro, A.I.; Peña-Barragán, J.M. Configuration and specifications of an unmanned aerial vehicle (UAV) for early site specific weed management. PLoS ONE 2013, 8, e58210. [Google Scholar]
  17. López-Granados, F.; Torres-Sánchez, J.; Serrano-Pérez, A.; de Castro, A.I.; Mesas-Carrascosa, F.J.; Peña, J.-M. Early season weed mapping in sunflower using UAV technology: Variability of herbicide treatment maps against weed thresholds. Precis. Agric. 2015, 17, 183–199. [Google Scholar] [CrossRef]
  18. De Castro, A.; Torres-Sánchez, J.; Peña, J.; Jiménez-Brenes, F.; Csillik, O.; López-Granados, F. An automatic random forest-OBIA algorithm for early weed mapping between and within crop rows using UAV imagery. Remote Sens. 2018, 10, 285. [Google Scholar] [CrossRef] [Green Version]
  19. Mateen, A.; Zhu, Q. Weed detection in wheat crop using UAV for precision agriculture. Pak. J. Agric. Sci 2019, 56, 809–817. [Google Scholar]
  20. Hameed, S.; Amin, I. Detection of weed and wheat using image processing. In Proceedings of the 2018 IEEE 5th International Conference on Engineering Technologies and Applied Sciences (ICETAS), Bangkok, Thailand, 22–23 November 2018; pp. 1–5. [Google Scholar]
  21. Huang, Y.; Reddy, K.N.; Fletcher, R.S.; Pennington, D. UAV low-altitude remote sensing for precision weed management. Weed Technol. 2017, 32, 2–6. [Google Scholar] [CrossRef]
  22. López-Granados, F.; Torres-Sánchez, J.; De Castro, A.-I.; Serrano-Pérez, A.; Mesas-Carrascosa, F.-J.; Peña, J.-M. Object-based early monitoring of a grass weed in a grass crop using high resolution UAV imagery. Agron. Sustain. Dev. 2016, 36, 67. [Google Scholar] [CrossRef]
  23. Barrero, O.; Perdomo, S.A. RGB and multispectral UAV image fusion for Gramineae weed detection in rice fields. Precis. Agric. 2018, 19, 809–822. [Google Scholar] [CrossRef]
  24. Stroppiana, D.; Villa, P.; Sona, G.; Ronchetti, G.; Candiani, G.; Pepe, M.; Busetto, L.; Migliazzi, M.; Boschetti, M. Early season weed mapping in rice crops using multi-spectral UAV data. Int. J. Remote Sens. 2018, 39, 5432–5452. [Google Scholar] [CrossRef]
  25. Lottes, P.; Khanna, R.; Pfeifer, J.; Siegwart, R.; Stachniss, C. UAV-based crop and weed classification for smart farming. In Proceedings of the 2017 IEEE International Conference on Robotics and Automation (ICRA), Singapore, 29 May–3 June 2017; pp. 3024–3031. [Google Scholar]
  26. Louargant, M.; Jones, G.; Faroux, R.; Paoli, J.-N.; Maillot, T.; Gée, C.; Villette, S. Unsupervised classification algorithm for early weed detection in row-crops by combining spatial and spectral information. Remote Sens. 2018, 10, 761. [Google Scholar] [CrossRef] [Green Version]
  27. Pflanz, M.; Nordmeyer, H.; Schirrmann, M. Weed mapping with UAS imagery and a Bag of Visual Words based image classifier. Remote Sens. 2018, 10, 1530. [Google Scholar] [CrossRef] [Green Version]
  28. Sánchez-Sastre, L.F.; Alte da Veiga, N.M.S.; Ruiz-Potosme, N.M.; Carrión-Prieto, P.; Marcos-Robles, J.L.; Navas-Gracia, L.M.; Martín-Ramos, P. Assessment of RGB vegetation indices to estimate chlorophyll content in sugar beet leaves in the final cultivation stage. AgriEngineering 2020, 2, 128–149. [Google Scholar]
  29. Kawashima, S.; Nakatani, M. An Algorithm for Estimating Chlorophyll Content in Leaves Using a Video Camera. Ann. Bot. 1998, 81, 49–54. [Google Scholar] [CrossRef] [Green Version]
  30. Murphy, R.J.; Underwood, A.J.; Jackson, A.C. Field-based remote sensing of intertidal epilithic chlorophyll: Techniques using specialized and conventional digital cameras. J. Exp. Mar. Biol. Ecol. 2009, 380, 68–76. [Google Scholar] [CrossRef]
  31. Penuelas, J.; Gamon, J.A.; Griffin, K.L.; Field, C.B. Assessing community type, plant biomass, pigment composition, and photosynthetic efficiency of aquatic vegetation from spectral reflectance. Remote Sens. Environ. 1993, 46, 110–118. [Google Scholar] [CrossRef]
  32. Rouse, J.; Haas, R.; Schell, J.; Deering, D. Monitoring vegetation systems in the Great Plains with ERTS. NASA Spec. Publ. 1974, 351, 309. [Google Scholar]
  33. Fuentes-Peailillo, F.; Ortega-Farias, S.; Rivera, M.; Bardeen, M.; Moreno, M. Comparison of vegetation indices acquired from RGB and multispectral sensors placed on UAV. In Proceedings of the 2018 IEEE International Conference on Automation/XXIII Congress of the Chilean Association of Automatic Control (ICA-ACCA), Concepcion, Chile, 17–19 October 2018; pp. 1–6. [Google Scholar]
  34. Hassanein, M.; El-Sheimy, N. An efficient weed detection procedure using low-cost UAV imagery system for precision agriculture applications. In Proceedings of the ISPRS TC I Mid-Term Symposium “Innovative Sensing—From Sensors to Methods and Applications”, Karlsruhe, Germany, 10–12 October 2018; pp. 181–187. [Google Scholar]
Figure 1. (a) Alfalfa plot and subplot study areas (delimited with red lines); (b) the two Olympus cameras mounted on the octocopter.
Agriengineering 02 00012 g001
Figure 2. Comparison among (a) Normalized Difference Vegetation Index (NDVI); (b) (R−B)/(R+B) and (c) (R−B)/(R+B+G) indices calculated on a weed-infested part (2000 m2) of the alfalfa plot; (d) RGB image of the same area; (e,f) corresponding weed classification results (orange) from the models based on NDVI and (R−B)/(R+B) indices, and on NDVI and (R−B)/(R+B+G) indices, respectively, shown on top of the RGB image.
Agriengineering 02 00012 g002
Table 1. Vegetation indices evaluated in this study.
NameEquationReference
Normalized Pigment Chlorophyll Ratio (NPCI)(R−B)/(R+B)[31]
(R−B)/(R+G+B)[29]
Normalized Difference Vegetation Index (NDVI)(NIR-R)/(NIR+R)[32]
R: red; G: green; B: blue; NIR: near-infrared.
Table 2. Estimation of surface infected with Synapis arvensis in each of the alfalfa subplots for the two RGB vegetation indices and for their combinations with the Normalized Difference Vegetation Index (NDVI).
Obtained fromSubplot
ABCDE
m2%m2%m2%m2%m2%
(R−B)/(R+B+G)291.1541.6601.61584.3681.9
NDVI and (R−B)/(R+B+G)291.1421.2270.81584.3461.3
(R−B)/(R+B)281.1551.6772.11313.5541.5
NDVI and (R−B)/(R+B)251.0381.1210.61423.8401.1

