1. Introduction
The increasing adoption of Internet of Things (IoT) devices is reshaping smart city operations by enabling large-scale data collection and continuous monitoring of urban systems, including traffic networks, buildings, stormwater infrastructure, and local weather [
1]. These IoT-enabled systems underpin a wide range of smart city applications, such as water and weather sensing for climate resilience [
2,
3,
4], smart parking [
5,
6,
7], traffic management [
8,
9,
10], and building automation [
11,
12,
13]. As these deployments mature, researchers increasingly leverage the resulting data streams to develop digital twin (DT) applications and other IoT-enabled cyber–physical systems (CPSs), where virtual representations of physical assets or processes are continuously updated using operational data [
14,
15]. Nevertheless, developing DTs and CPSs remains challenging because real deployments must integrate heterogeneous subsystems such as sensor networks, communication stacks, data management platforms, and analytics/modeling components, while satisfying reliability and timeliness constraints [
14,
16].
To manage this complexity, IoT and CPS research commonly adopts layered abstractions that separate subsystems and enable interchangeable implementations behind stable interfaces [
17,
18]. While many IoT abstractions emphasize perception/physical sensing, networking/communication, and application layers [
17,
18], recent DT and data-intensive smart city workloads have motivated treating data management as a distinct architectural abstraction [
19]. In this work, we define the data layer as the set of services to ingest, store, and retrieve IoT data for downstream CPS/DT applications. Although surveys and bibliometric analyses emphasize the importance of data management and middleware to DT-enabled smart city systems, they also highlight a persistent lack of real-world and comparative evaluation evidence (particularly around performance, scalability, and operational constraints), making it difficult to select among competing data-service designs [
1,
14,
17]. In this context, we identify an important gap in the literature: the limited availability of cost-, latency-, and reliability-focused comparative studies for practical IoT data layer architectures that can directly inform CPS design decisions.
To address this gap, we present an experimental study that designs, evaluates, and compares serverless data layer architectures, where ingestion and storage are fully managed and require no always-on compute [
20,
21]. Our motivating scenario is a smart city flood monitoring application with nine IoT sensors (six pressure water-level sensors, two ultrasonic level sensors, and one weather station) that periodically report measurements. We evaluate seven serverless data layer architectures over a 21-day deployment using four metrics: (1) successful ingestion rate, defined as the share of messages received by the sensor network server that are present in persistent storage (duplicates are not considered failures); (2) median end-to-end latency, measured from the sensor network server received-timestamp to the data storage insertion timestamp; (3) average daily cost, capturing all cloud charges attributable to ingestion and storage during the 21-day experiment (excluding extensive egress testing); and (4) solution complexity, referenced as lines of Python (version 3.12) code required to implement the serverless ingestion functions as a proxy for implementation effort, complemented by a description of the managed cloud services used by each architecture.
The primary contribution of this work is an experimentally grounded, reproducible architecture decision-making guide for smart city IoT data layers. By holding the application workload, cloud platform, and persistence contract constant (TTN + Azure-managed ingestion + analytics-ready tables in Delta Lake format on object storage), we quantify how realistic serverless designs trade off ingestion completeness, timeliness, cloud cost (within stated boundaries), and implementation/operational complexity proxies. The resulting evidence supports practical selection among common ingestion patterns (webhook, queue/topic decoupling, event streaming, managed IoT platform export, and scheduled backfill) under explicit assumptions.
In the following
Section 2, we synthesize relevant prior work on IoT data services and identify where comparative evidence remains limited. We then present our methodology and evaluated architectures, report experimental results, and discuss implications for designing data layers that balance reliability, latency, operational effort, and cost in smart city IoT CPS.
3. Methodology
To perform our experimental evaluation and compare data layer architectures, we take as an example a reference data layer application that ingests and stores sensor readings from an IoT network server. The data layer also makes historical data accessible to users through a standard format and interface across data layer implementations. In
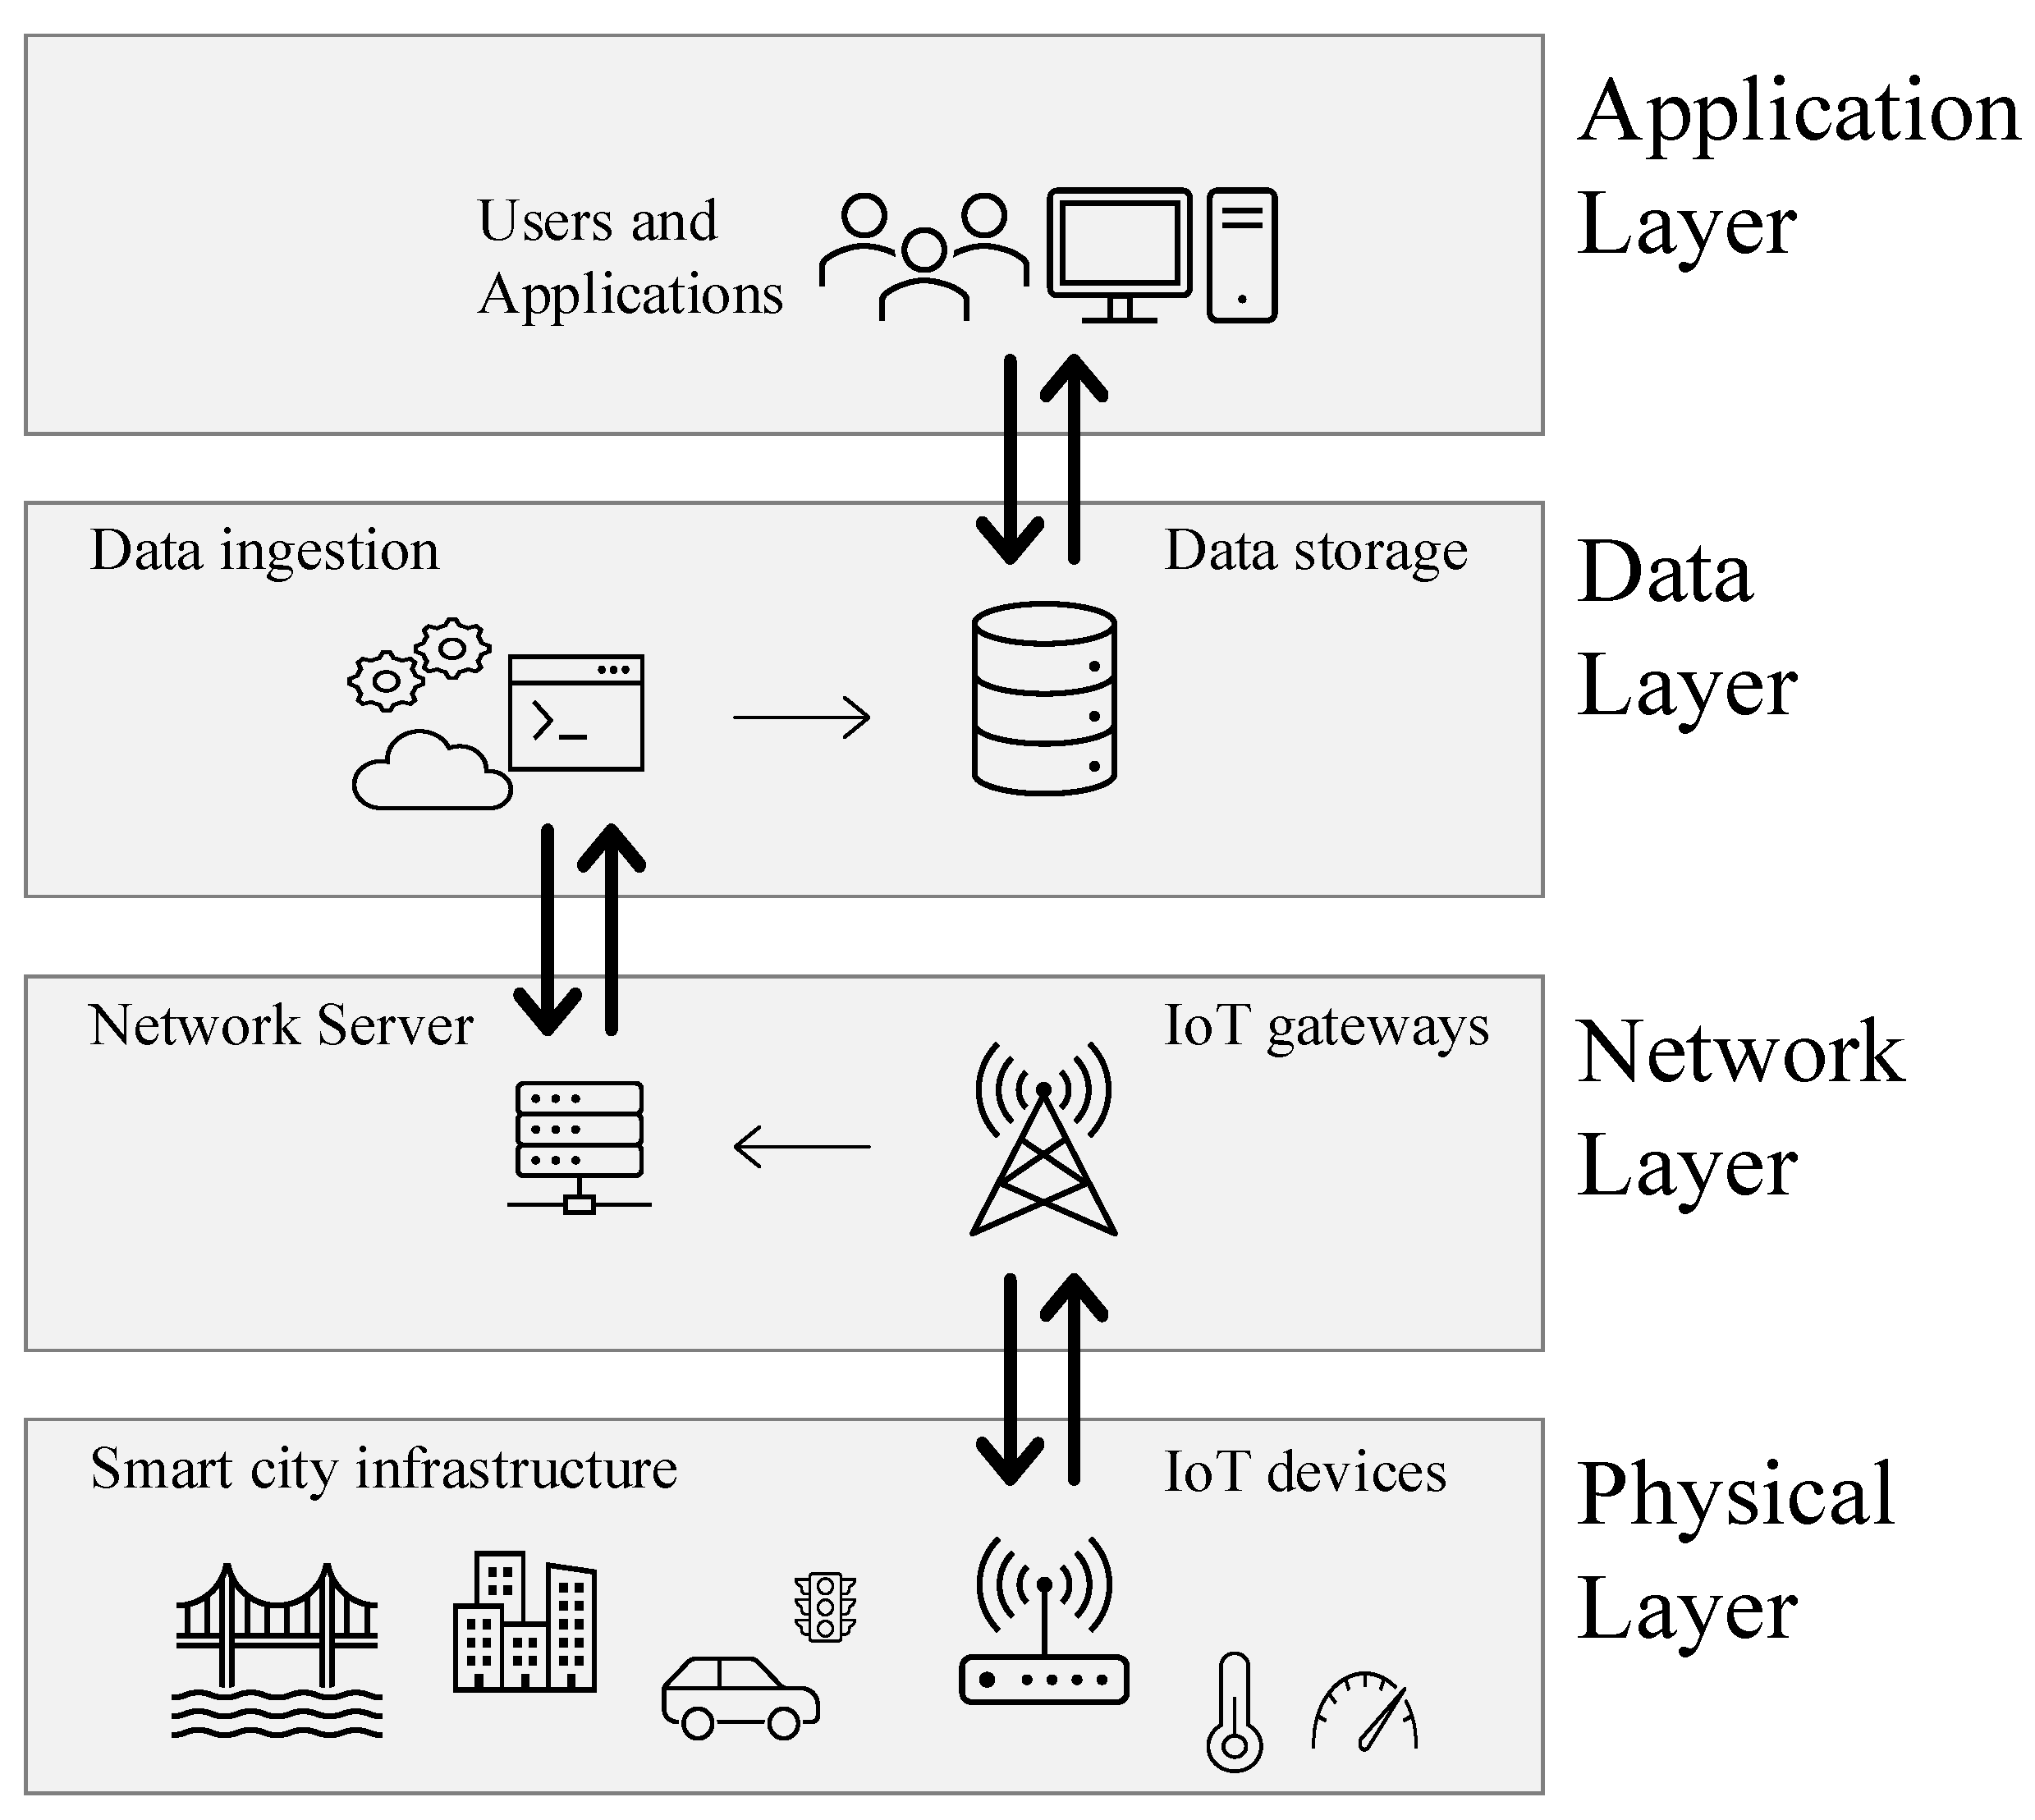
Figure 1, we show a diagram of the sensor data flow of the CPS application, from the IoT devices to users, and applications. While the deployment scale is intentionally modest, it reflects realistic pilot-scale smart city IoT deployments and enables controlled, reproducible comparison across data layer architectures under identical assumptions.
In the following subsections, we define the requirements for our reference data layer application, and then, we describe the cloud service components used to implement our data layer architectures. We also define the evaluation metrics and measurement boundaries used to compare architectures, addressing known sources of uncertainty (e.g., cross-service timestamps), so the results are interpreted appropriately.
3.1. Data Layer Application Requirements
Our first requirement for the reference data layer application is that all implementations should only use serverless services. We assume that adopting a serverless architecture reduces the system design effort and maintenance burden of the application by minimizing the need to develop code and adopting managed services from cloud providers. We assume that relying on serverless services also reduces the developer’s concern with software updates and potential security vulnerabilities.
To standardize the data storage access interface across data layer implementations, we assume as another requirement that historical sensor data should be made available to users in an object storage service, such as Azure Blob Storage [
42], Amazon S3 [
43], or Google Cloud Storage [
44]. We chose object storage because it is a low-cost, serverless data storage service widely offered by cloud providers.
As for the data format, we assume historical data should be stored as a Delta Lake [
39,
40], an open-source table storage layer framework that supports ACID (atomicity, consistency, isolation, durability) transactions. In this framework, data is stored in Parquet files, while metadata is stored as JSON text files in a log transaction folder. We chose this framework because its structure allows efficient read operations in object store services, transaction logging, and straightforward data access through the delta-rs Python module [
41].
We assume as an additional requirement that the Delta Lake should be periodically optimized [
45], consolidating sensor data entries spread across many small Parquet files into a few optimally sized Parquet files. This optimization step reduces the number of files that users need to download from the object storage when performing queries containing many sensor readings. Because Delta Lake commit semantics and small-file behavior can influence observed ingestion performance, we treat ingestion and persistence as coupled components of the evaluated data layer rather than independent subsystems.
3.2. Internet of Things Cyber–Physical System Components
We assume that our reference data layer will be part of a flood monitoring smart city Internet of Things (IoT) cyber–physical system (CPS), ingesting data from a sensor network server and storing it in an object store service in the cloud. All results should be interpreted within the specific service boundaries defined by this CPS configuration (TTN network server interface, Azure-managed ingestion services, and Delta Lake persistence).
3.2.1. Sensor Devices and Network Server
For our IoT CPS application example, we consider a set of sensor devices using the LoRaWAN wireless protocol to transmit measurements. We chose LoRaWAN as it is widely used in smart city applications due to its long-range communication capabilities. We use nine LoRaWAN sensors from the manufacturer Decentlab: six pressure water-level sensors [
46], two ultrasonic level sensors [
47], and one weather station [
48]. As the network server, we assume the use of The Things Stack Sandbox [
49], a free LoRaWAN server available to the The Things Network (TTN) community for non-commercial, small-scale testing and experimentation. We chose this network server due to its popularity, ease of use, and the availability of extensive gateway coverage provided by its community members. From this point forward, we refer to this sensor network server interchangeably as “TTN” or “TTN server”.
The TTN server offers a set of integration interfaces to retrieve sensor data, such as webhook API, Message Queuing Telemetry Transport (MQTT) server, a short-term data storage service with an HTTP API (TTN Storage Integration), and recommended integrations with Azure Cloud and AWS IoT [
50]. We assume that our data layer has access to any of the available interfaces to retrieve sensor data from the network server.
3.2.2. Cloud Provider
We selected Microsoft’s Azure to host our data layer implementations, as an example of a popular cloud platform for which our sensor network server provides two suggested integration solutions: IoT Central [
51] and IoT Hub [
52]. In addition to the suggested integrations, the Azure platform offers many serverless services that can interface with the TTN server, namely triggering serverless functions, event handling services, and MQTT servers. We use a combination of available cloud serverless services and sensor network server interfaces to design examples of data layer implementations. Our goal is not to claim generality across providers, but to provide controlled evidence for architecture selection within this common smart city deployment context (TTN + Azure + Delta Lake).
3.3. Evaluation Metrics and Measurement Boundaries
To enable consistent comparison across architectures, we evaluate each pipeline using four metrics and fixed measurement boundaries: (1) successful ingestion rate, (2) ingestion latency, (3) cloud cost, and (4) implementation/operational complexity proxies. The system boundary begins when TTN records an uplink as received and ends when the corresponding record becomes durable in the Delta Lake table (i.e., represented by a committed Delta transaction).
For a successful ingestion rate, we compare the set of unique messages observed across experiments and compute the fraction of TTN-received messages that are present in persistent storage. Duplicate messages are treated as non-failures, consistent with typical at-least-once delivery semantics in IoT telemetry pathways.
For ingestion latency, we estimate the time from the TTN “received” timestamp to the time of persistence in Delta Lake. Because timestamps originate from different systems, this latency is an optimistic estimate rather than a definitive end-to-end measurement. Specifically, for each message we match the TTN timestamp to the nearest Delta Lake write/commit operation recorded in the Delta transaction log. This matching can introduce error when multiple messages are committed in a short window or when clocks are not perfectly synchronized. We therefore report median latency values to reduce the influence of outliers. More accurate latency measurement could be obtained by end-to-end instrumentation, such as propagating a single monotonic timestamp through the pipeline, or embedding a message identifier and recording function-level receipt timestamps. However, such instrumentation may require additional pipeline stages (e.g., buffering, coordinated batching, or synchronized logging) that can add overhead and increase latency.
For cost, we use Azure Cost Management at the resource group level to attribute ingestion and storage charges to each architecture over the same experiment window. When relevant, we separately discuss cost factors that are workload-dependent or may not be fully captured in portal summaries (e.g., egress charges for frequent downloads).
For complexity, we report proxy metrics intended to approximate implementation and operational burden: number of Azure service types, total number of deployed services, and number of lines of Python code in serverless scripts. These proxies do not fully capture configuration dependencies, maintenance complexity, or operational expertise required; these limitations are discussed in
Section 4.
3.4. Data Layer Implementations
To evaluate practical data layer performance, we designed and implemented seven serverless data layer architectures that move sensor data from the TTN server to the Azure cloud, storing all ingested data as Delta Lake. We refer to each data layer architecture implementation and evaluation as an independent experiment, with the identifiers Experiment (or “Exp.” for short) A to G. We include the integration methods suggested by the The Things Stack network server in the data layer architecture introduced in
Section 3.4.6 (Experiment F) and
Section 3.4.7 (Experiment G).
3.4.1. Data Ingestion Through a Single Serverless Function (Exp. A)
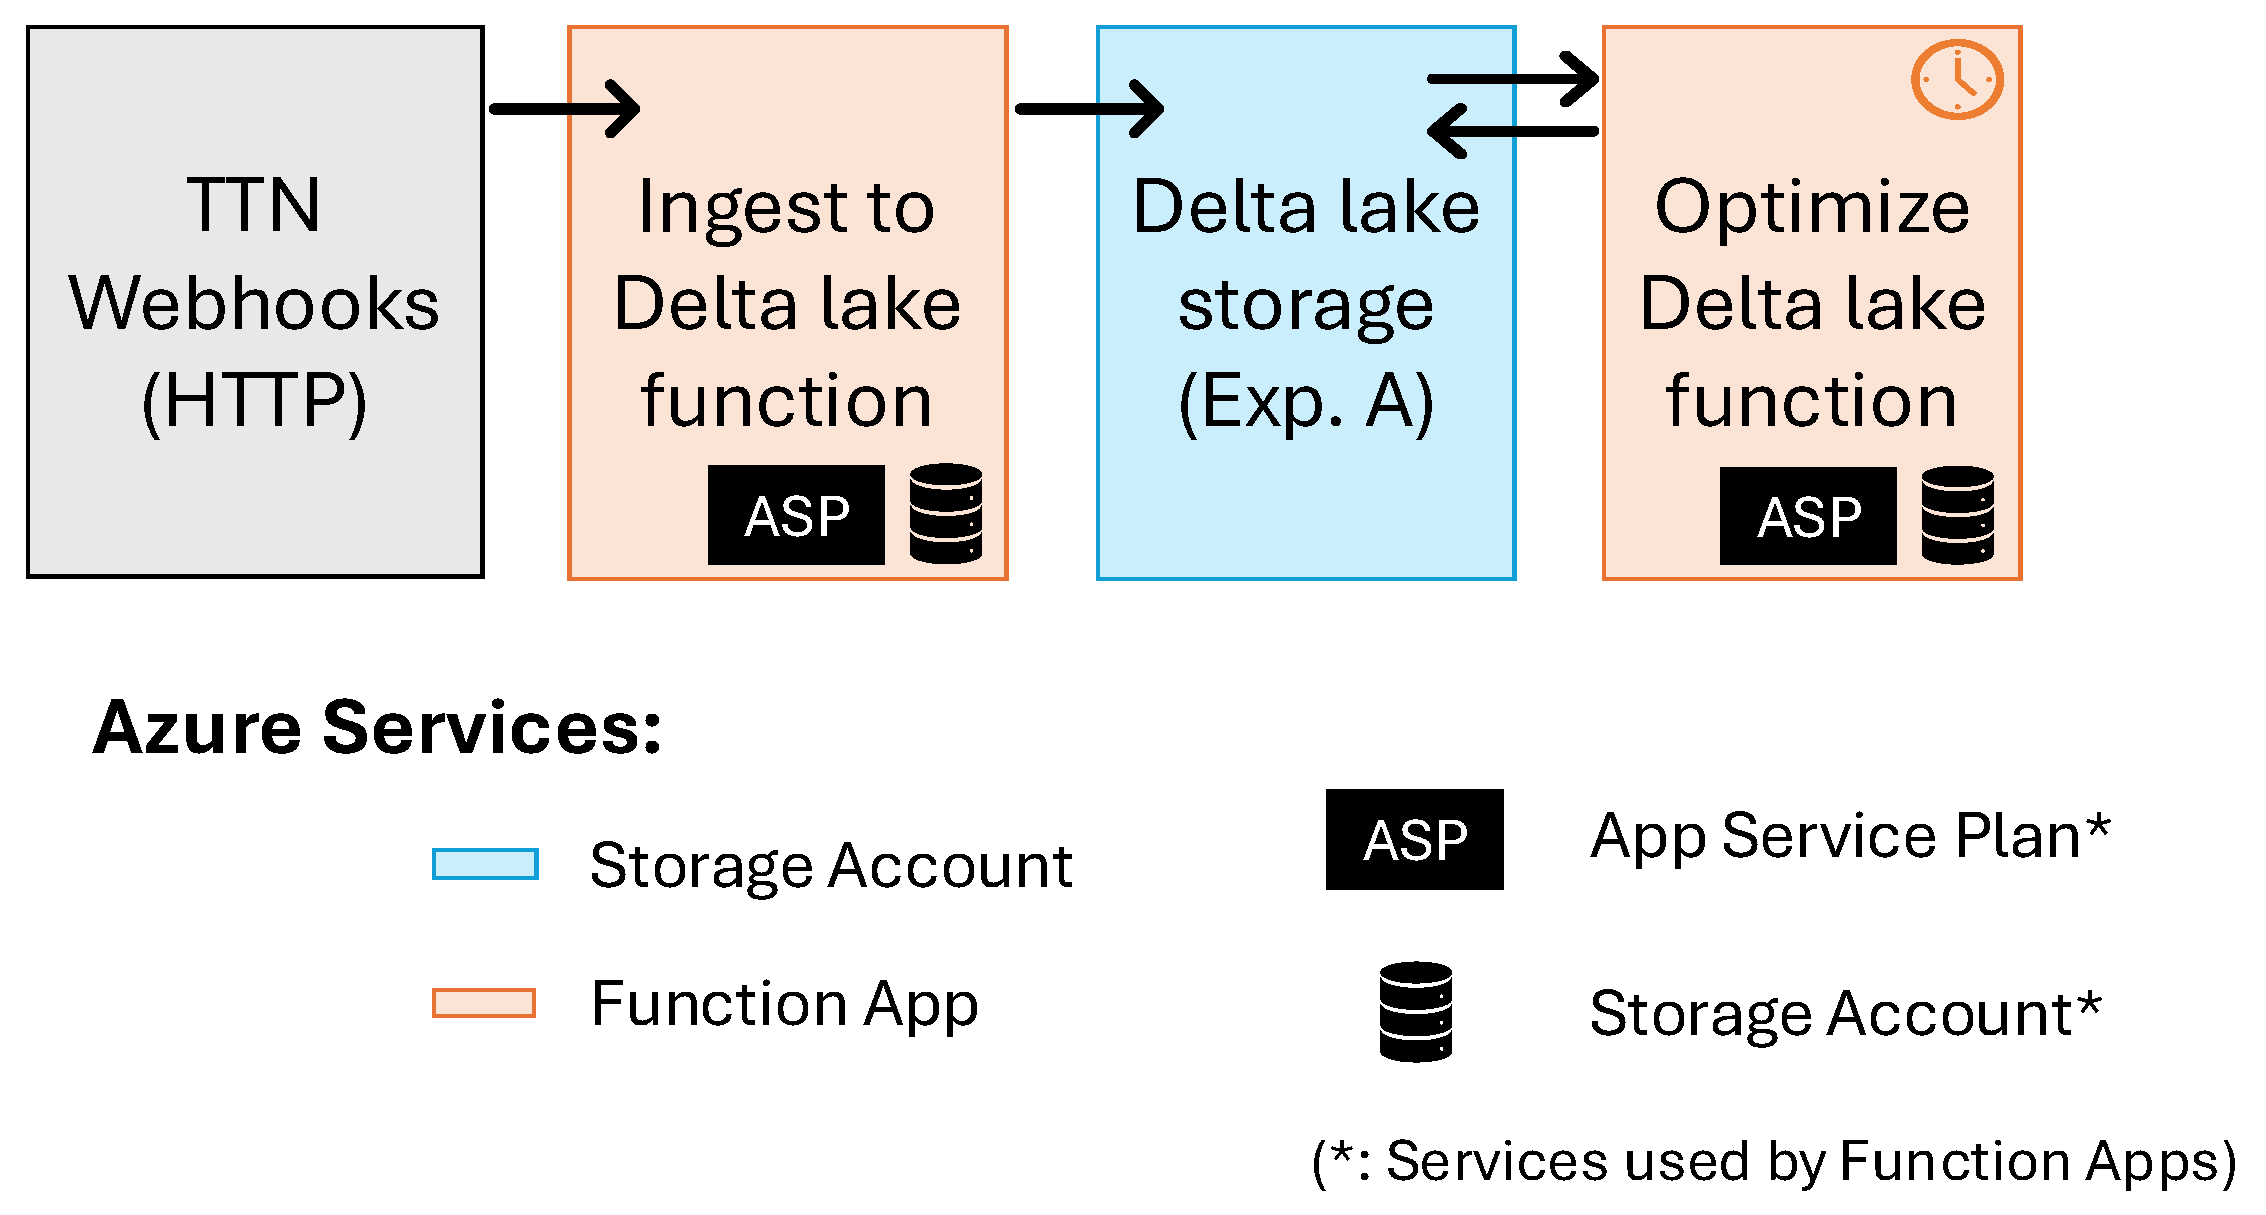
For experiment A, we adopted a straightforward solution to move data out of the TTN server by using their webhook integration, configuring it to perform a HTTP POST request for each sensor’s uplink message event. On the Azure cloud side, a straightforward way of processing this event and storing the sensor data is using a HTTP-triggered serverless function that processes and stores the data content of the HTTP POST request. For this data pipeline architecture, we created a single serverless function to directly process and store sensor uplink data received from the TTN server. We also created a storage account to save the sensor data as delta tables. We used a periodically triggered function to optimize all delta tables, consolidating small Parquet files into size-optimal Parquet files. We summarize this data layer architecture in
Figure 2.
3.4.2. Data Ingestion Through Two Serverless Functions and Queue Storage (Exp. B)
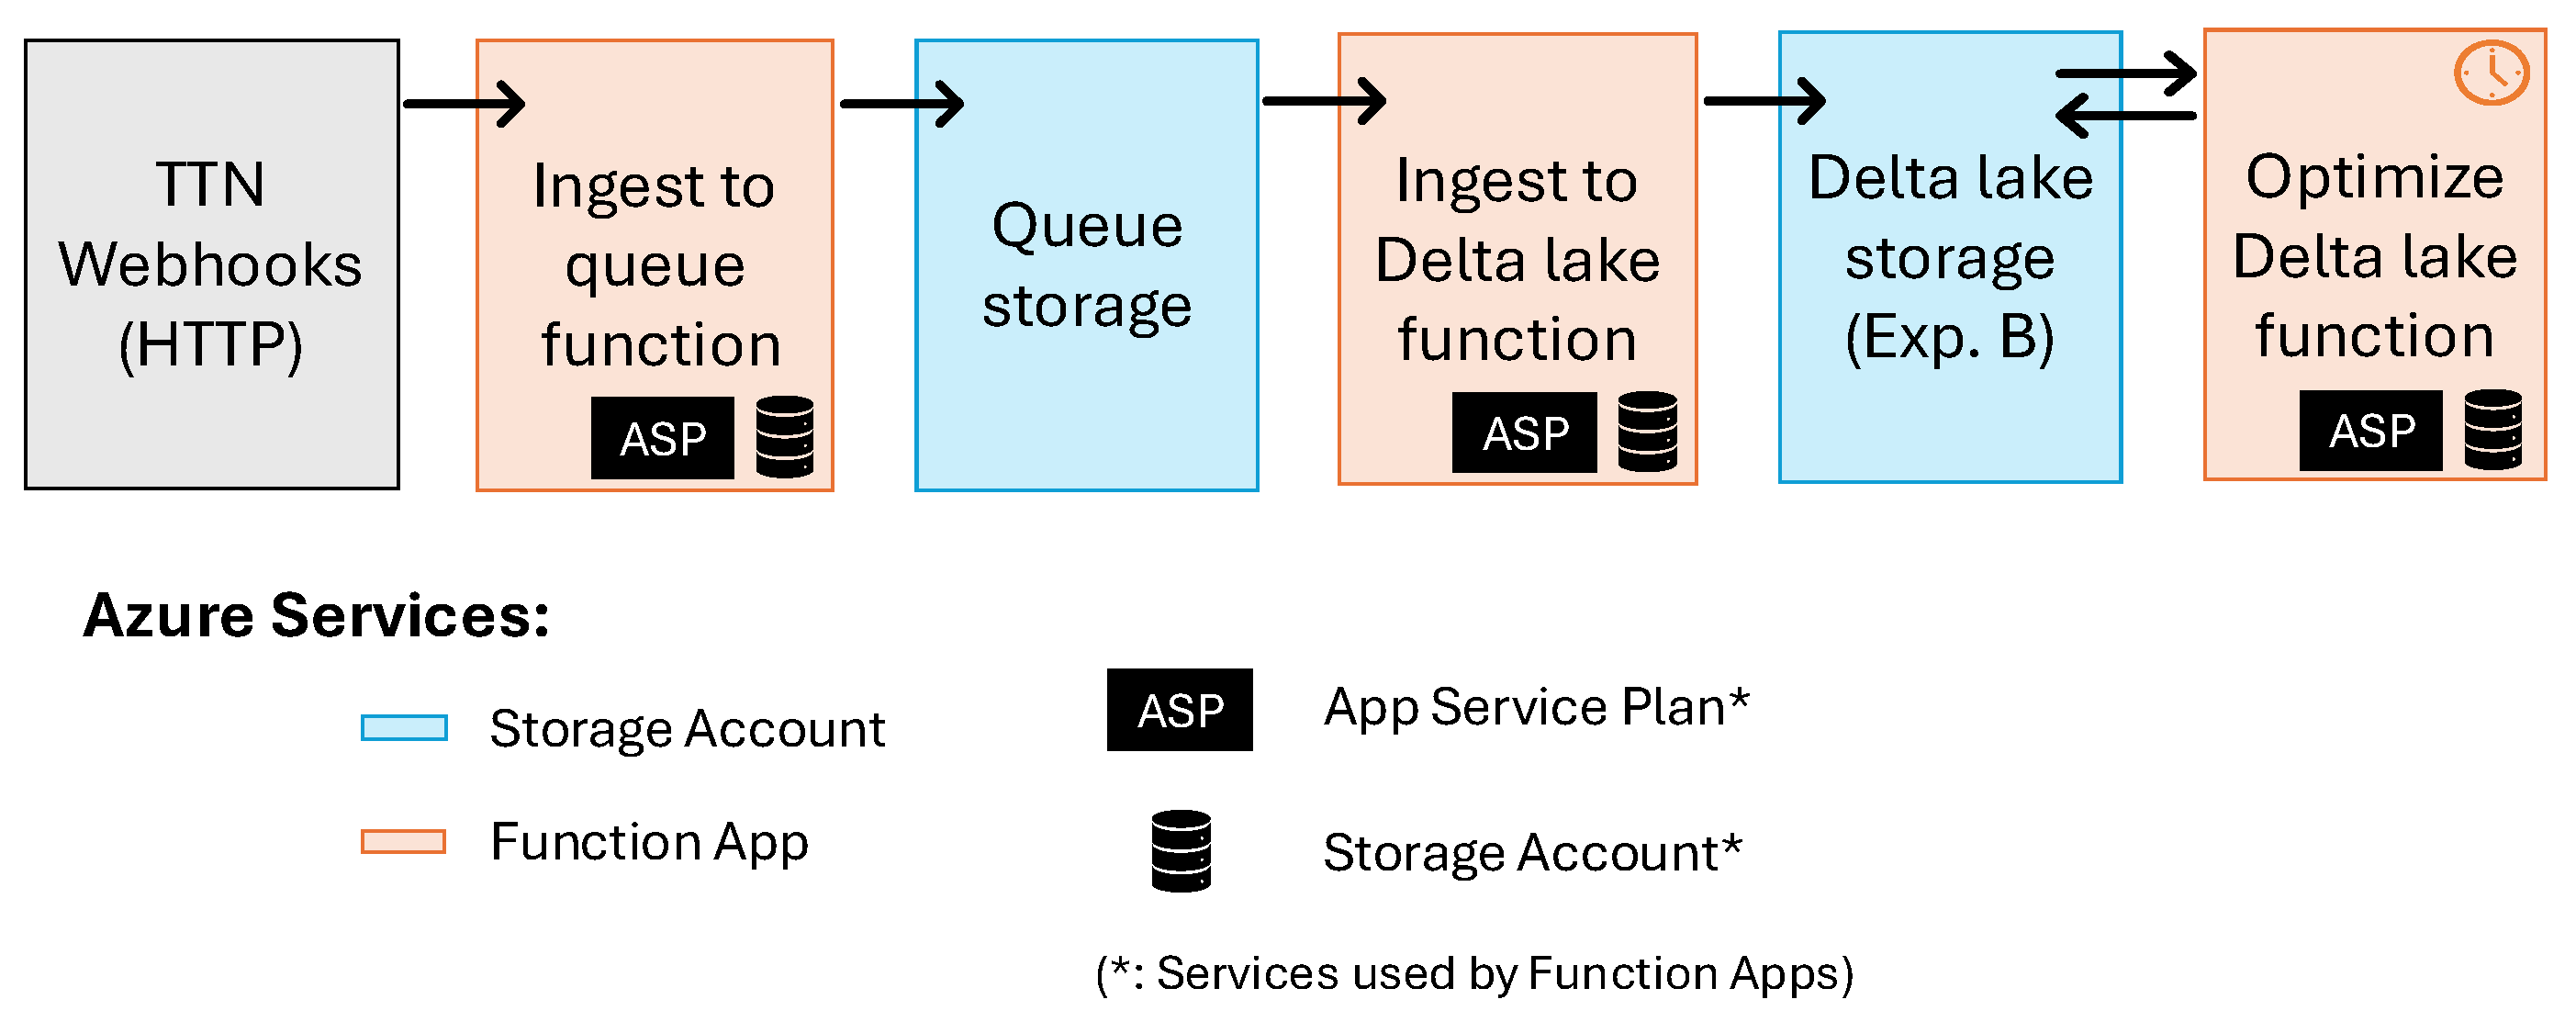
For the second data ingestion architecture in experiment B, we improved the serverless function response latency by using a HTTP-triggered serverless function that only receives HTTP POST events and pushes the incoming data to a queue storage service. Then another serverless function is triggered by each added item in the storage queue, reads its data content, and stores it in a delta table. The latency reduction created by using an additional queue storage step allows the TTN webhook API to receive the HTTP POST reply in a timely manner, avoid timeout errors, and correctly assess the webhook’s health status. This application also uses a periodically triggered serverless function to optimize the delta tables. We summarize the data layer architecture of experiment B in
Figure 3.
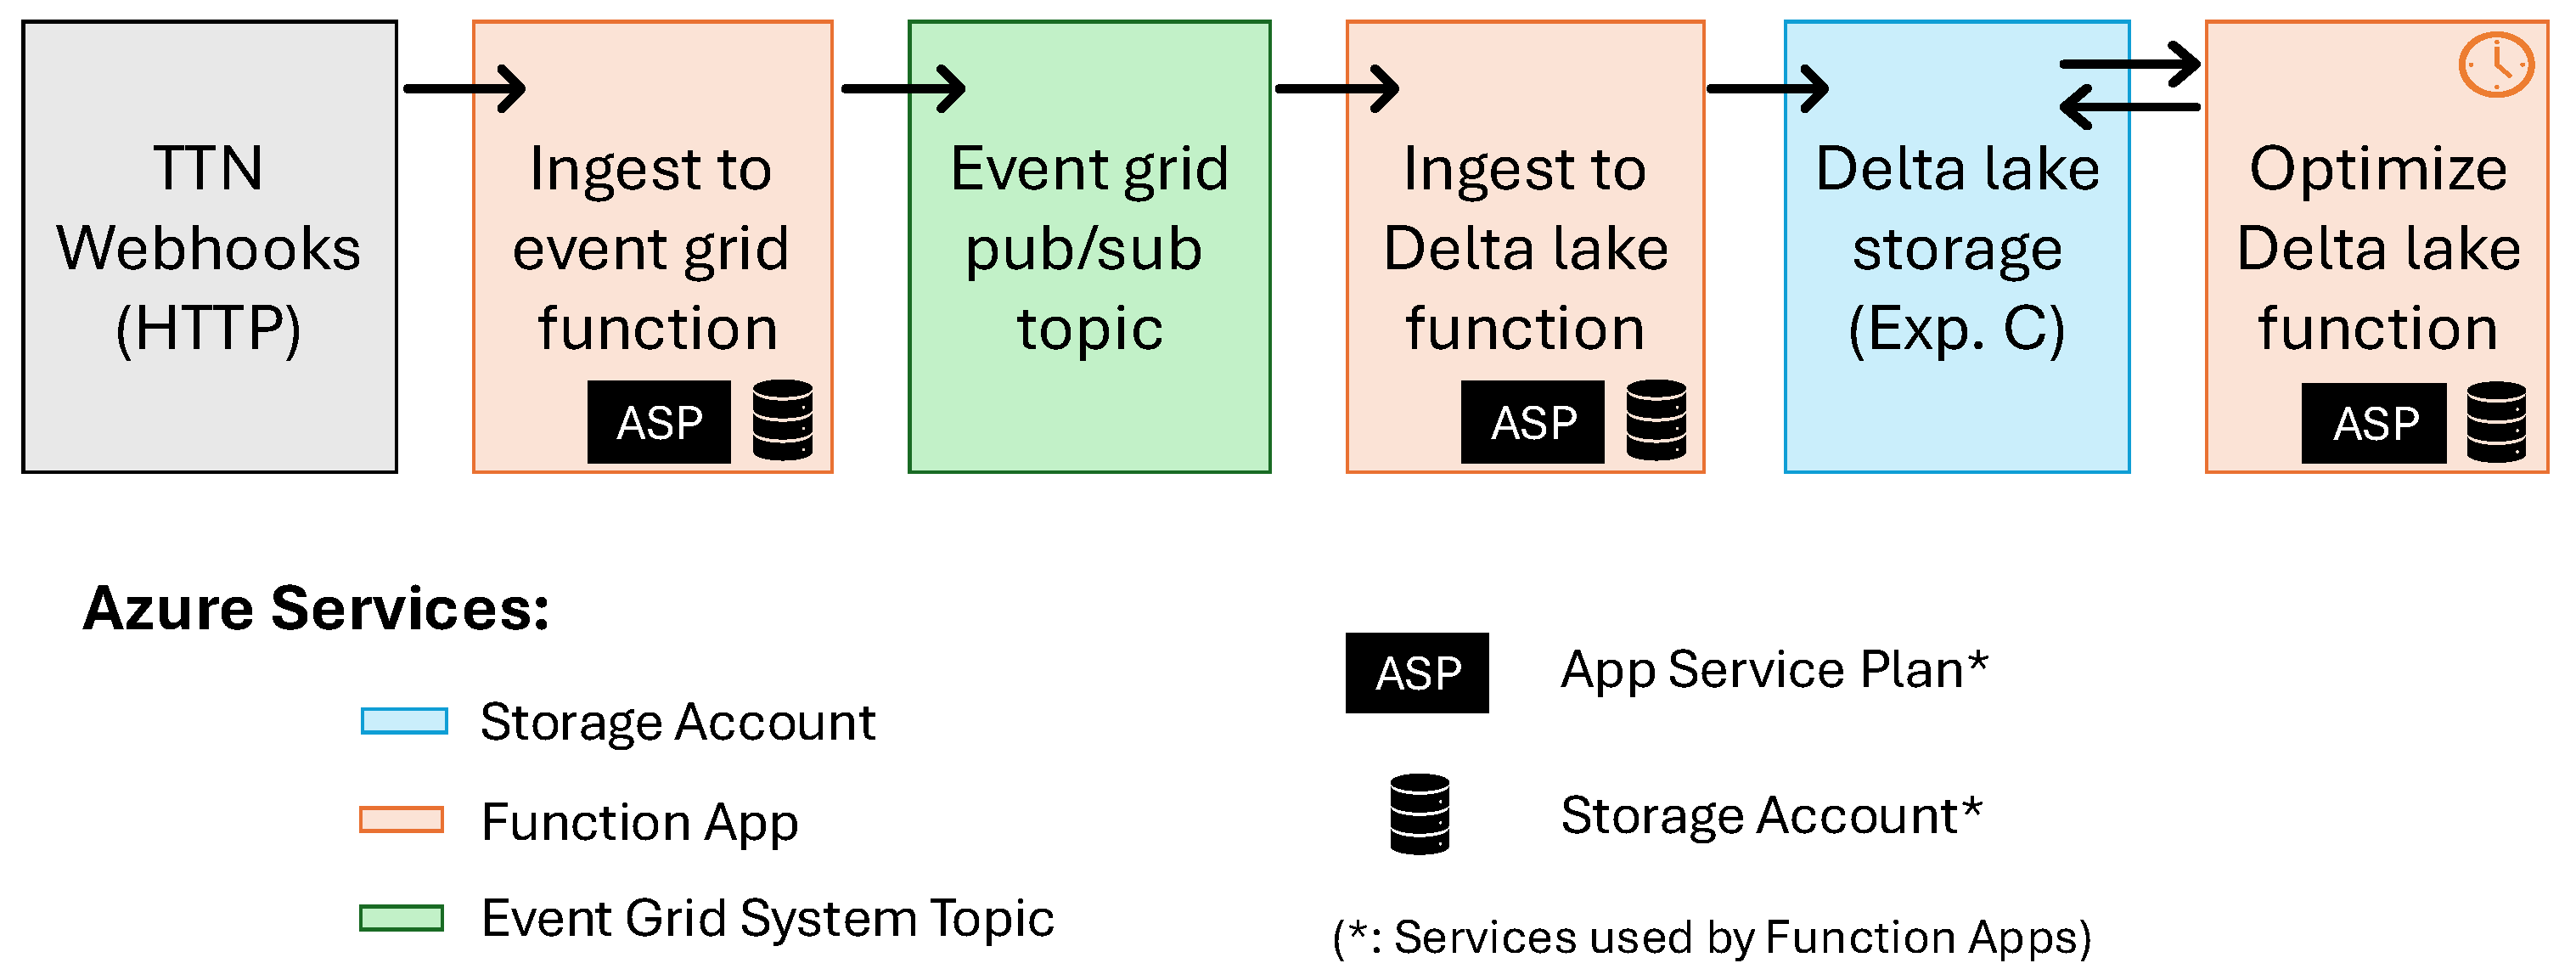
3.4.3. Data Ingestion Through Two Serverless Functions and Event Grid Topic (Exp. C)
Receiving and buffering HTTP POST requests is a common task in web applications, and some cloud provider pub/sub services are well equipped to support such tasks. An example of a pub/sub product in Azure is the Event Grid Topic [
53], which provides services to route events from publishing to consuming applications. In our data pipeline case, sensor uplink messages can be published in an Event Grid Topic that would then publish this event data to a subscribed serverless function to format and write the sensor data to a delta table storage solution. Although Azure Event Grid Topic API can accept event publishing through HTTP POST requests, it only accepts a specific data formatting scheme that the TTN webhook integration does not support (JSON message body enclosed by square brackets). Therefore, for experiment C, we designed this data ingestion pipeline with a similar architecture to the previous queue storage solution, replacing the queue storage with the event grid topic service. This architecture also contains a periodically triggered Python function to optimize the delta table. We depict the experiment C data layer architecture in
Figure 4.
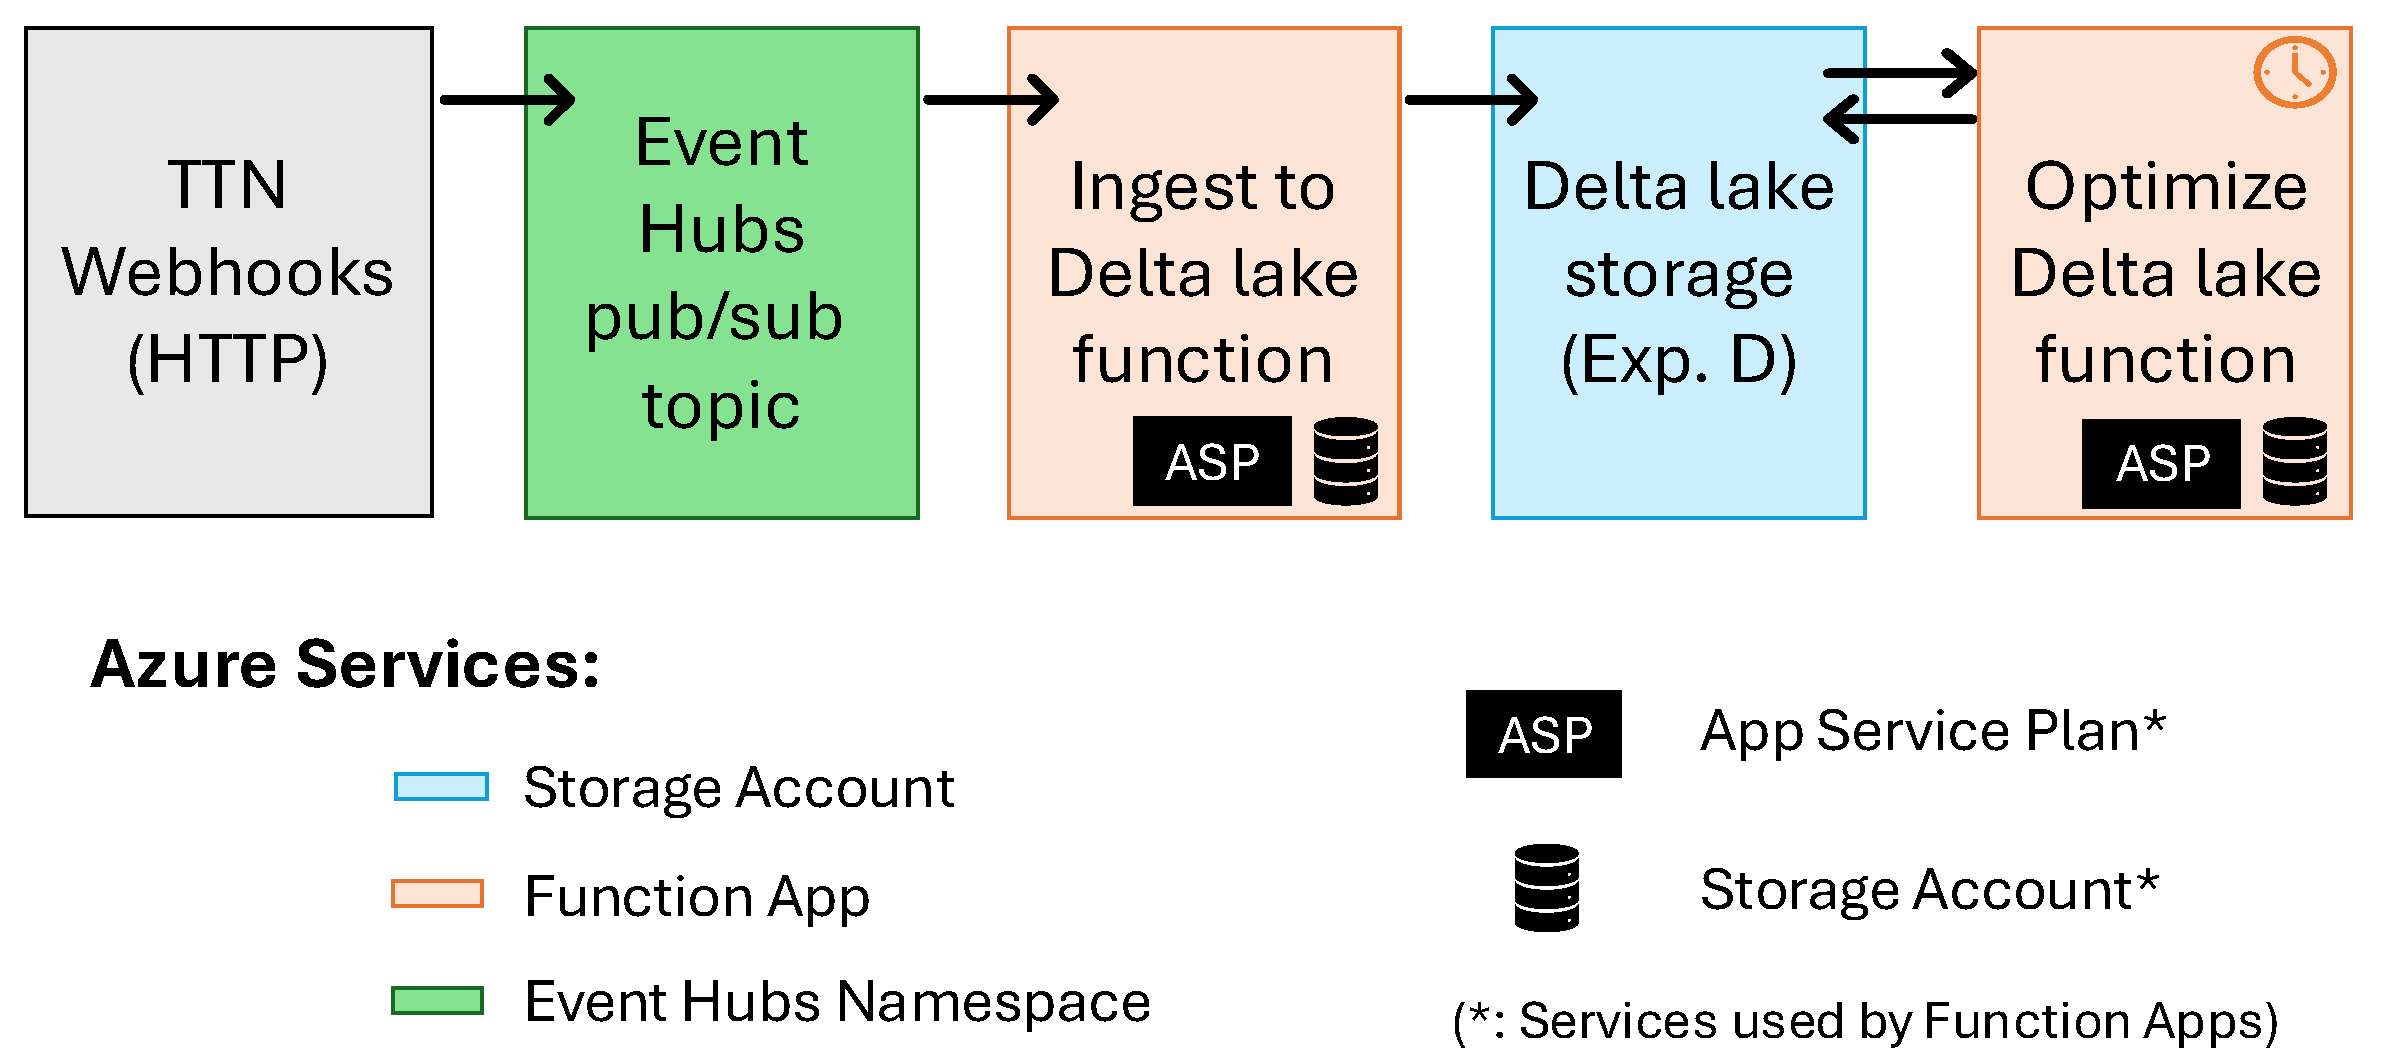
3.4.4. Data Ingestion Through a Serverless Function and Event Hubs (Exp. D)
Azure cloud also offers a pub/sub service named Event Hubs [
54] with resources permanently allocated to route events, which is well suited for data streaming applications. This service also offers an API that is flexible enough to accept event data payloads in the format used by the TTN webhook API. This enables the creation of a more direct data ingestion pipeline where HTTP POST requests are directly consumed by the Event Hubs API. For experiment D, we configured a serverless function subscribed to the Event hubs that is triggered by new sensor data events, processes, and stores the sensor data in a Delta Lake storage solution. Similarly to the other data pipeline solutions, a periodically triggered function performs the delta table optimization. We depict the data layer architecture of experiment D in
Figure 5.
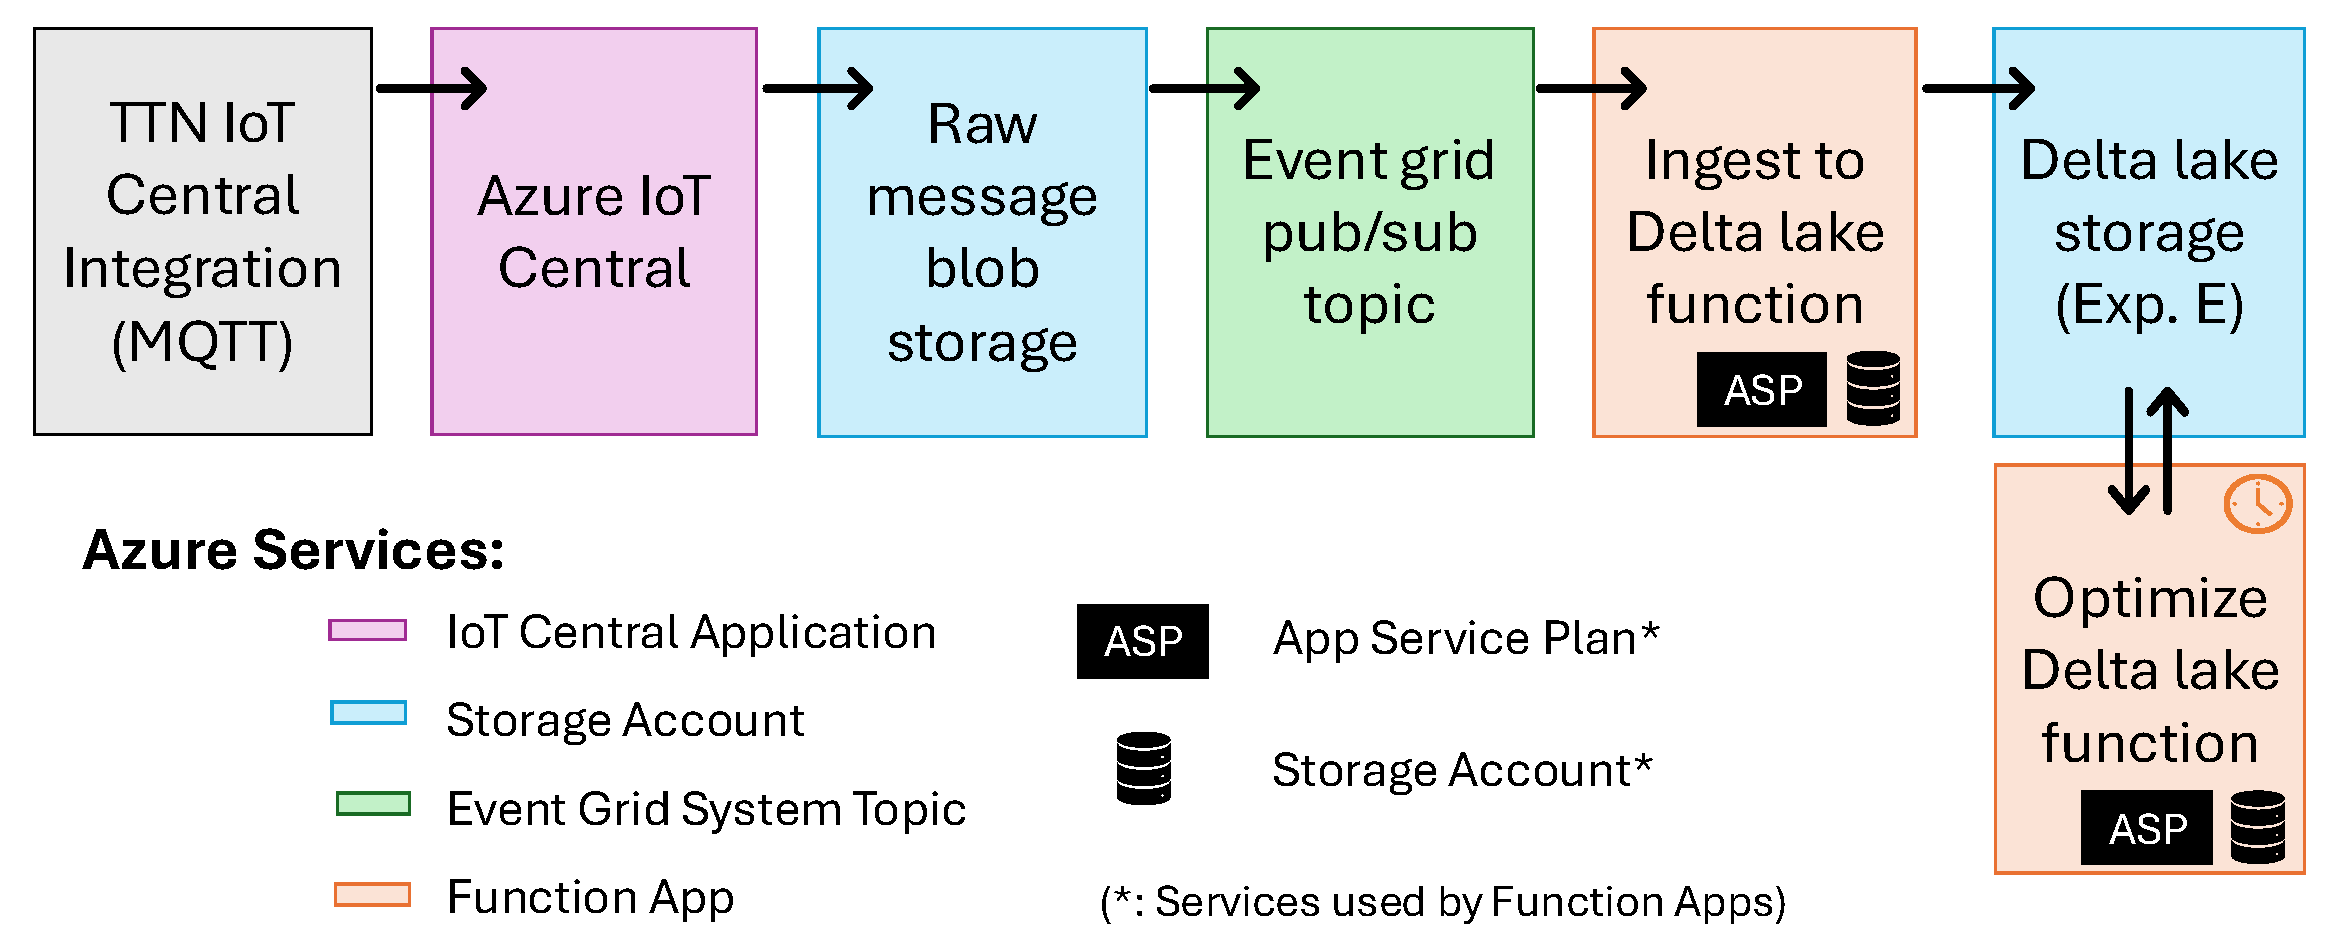
3.4.5. Data Ingestion Through TTN—Azure IoT Central Integration (Exp. E)
The Things Network recommends two integration solutions with Azure cloud services: a software as a service solution called Azure IoT Central [
51] and a template for a set of cloud services called IoT Hub Integration [
52] that adds more flexibility to adapt the data pipeline to the client’s needs. For the data pipeline architecture of experiment E, we adopt the IoT Central solution as the interface between TTN and Azure, and then, we add the necessary components to save the sensor data to a delta table format as we have done previously. We chose IoT Central Standard Tier 1 as our service level. After configuring each TTN application in IoT Central, we use a built-in option to export sensor data from IoT Central that automatically saves sensor uplink event data as text blobs in an Azure storage account once per minute. Then we configure a serverless function to be triggered by an event grid topic monitoring new blob creation, reading each new sensor data blob created, processing it, and saving it in the delta table format. This data pipeline solution also requires a periodically triggered delta table optimization function to improve the performance of the delta table. We depict the data layer architecture of experiment E in
Figure 6.
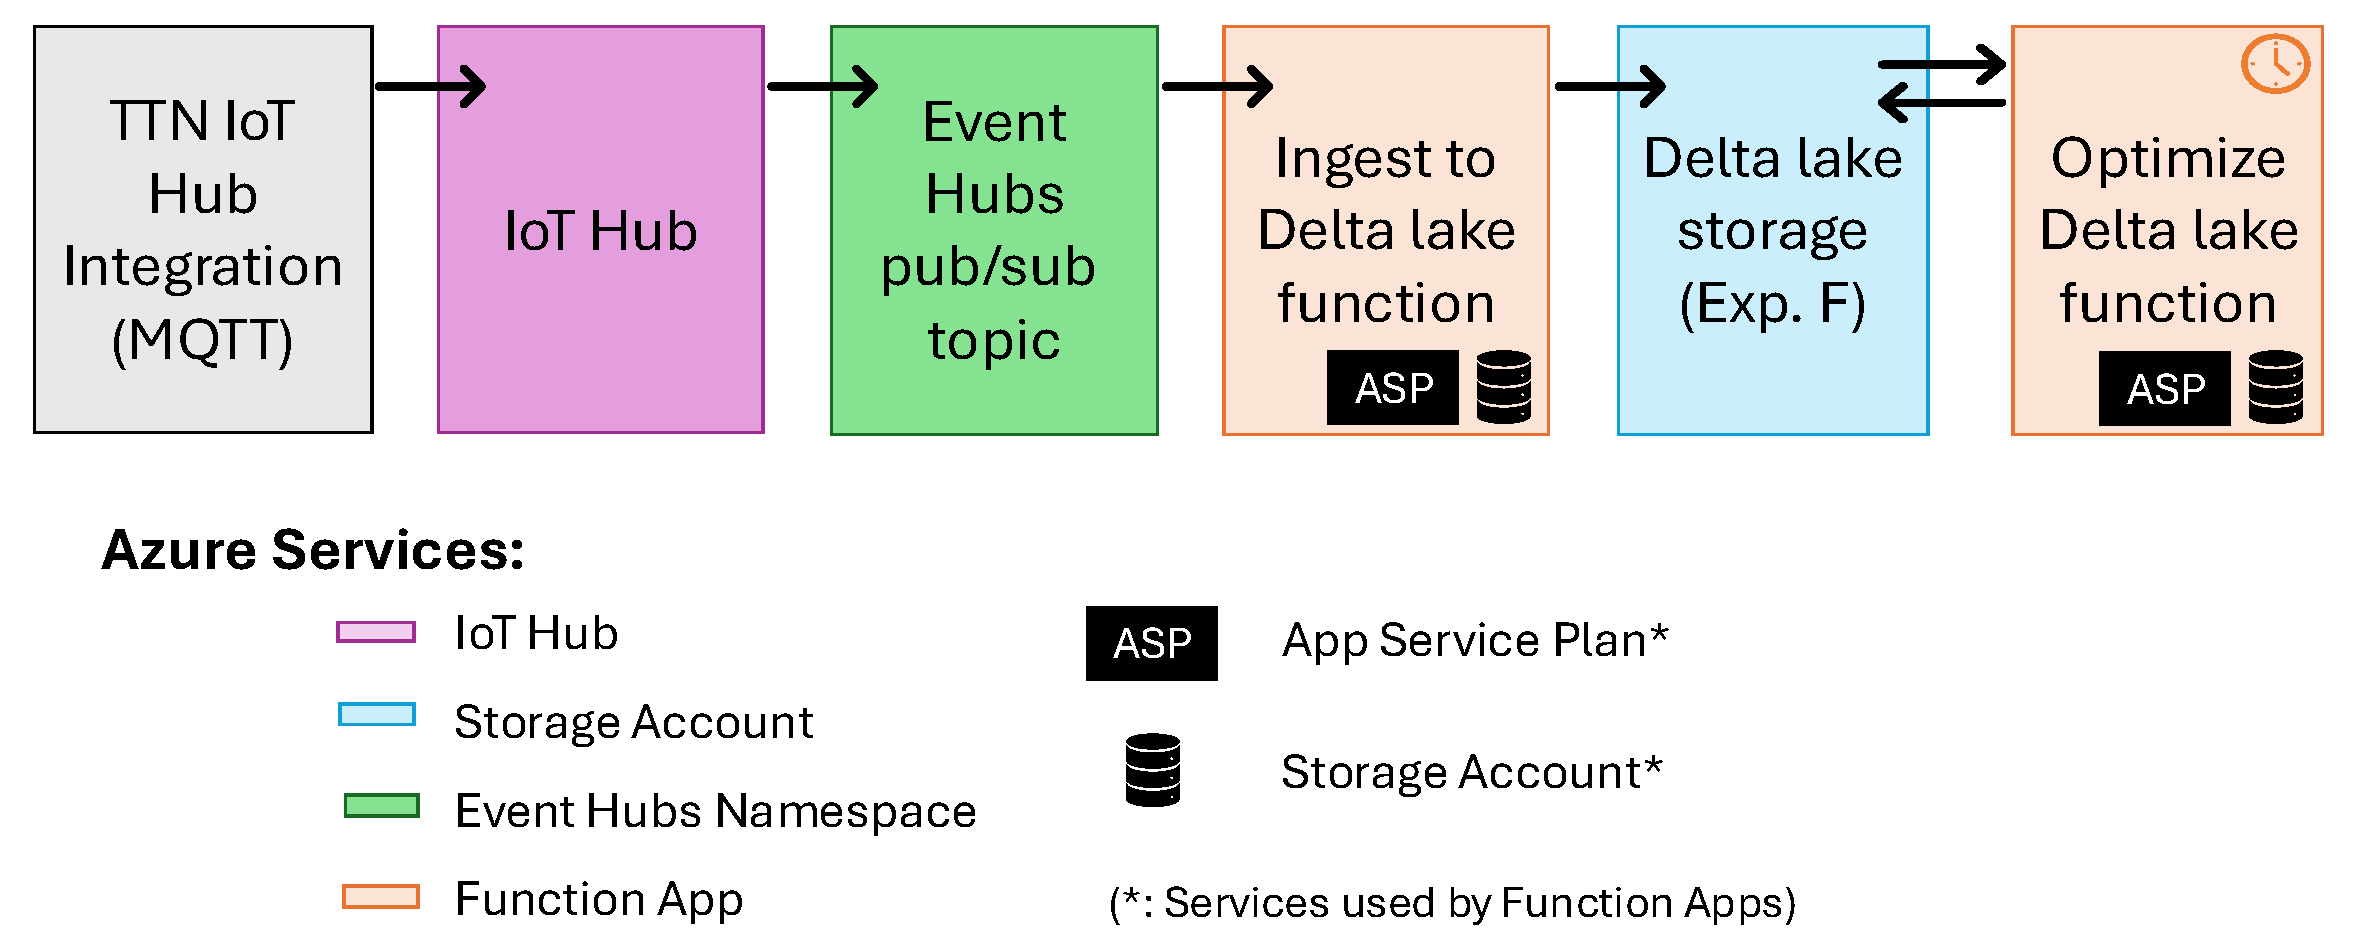
3.4.6. Data Ingestion Through TTN—Azure IoT Hub Integration (Exp. F)
For the data pipeline architecture of experiment F, we used the IoT Hub integration solution recommended by TTN to interface with the Azure cloud. The IoT Hubs integration is a template for Azure cloud services that interfaces with TTN, using the IoT Hubs Standard Tier 1 as the default service level. We keep all template components as is, including services that are not strictly necessary to perform data ingestion and storage. To retrieve sensor data, we configure the IoT hub event hub interface to trigger a serverless function that reads sensor data events, processes them, and stores them in a delta table storage solution. We also configure a periodically triggered serverless function to optimize the delta table, as in previous pipelines. We depict the data layer architecture of experiment F in
Figure 7.
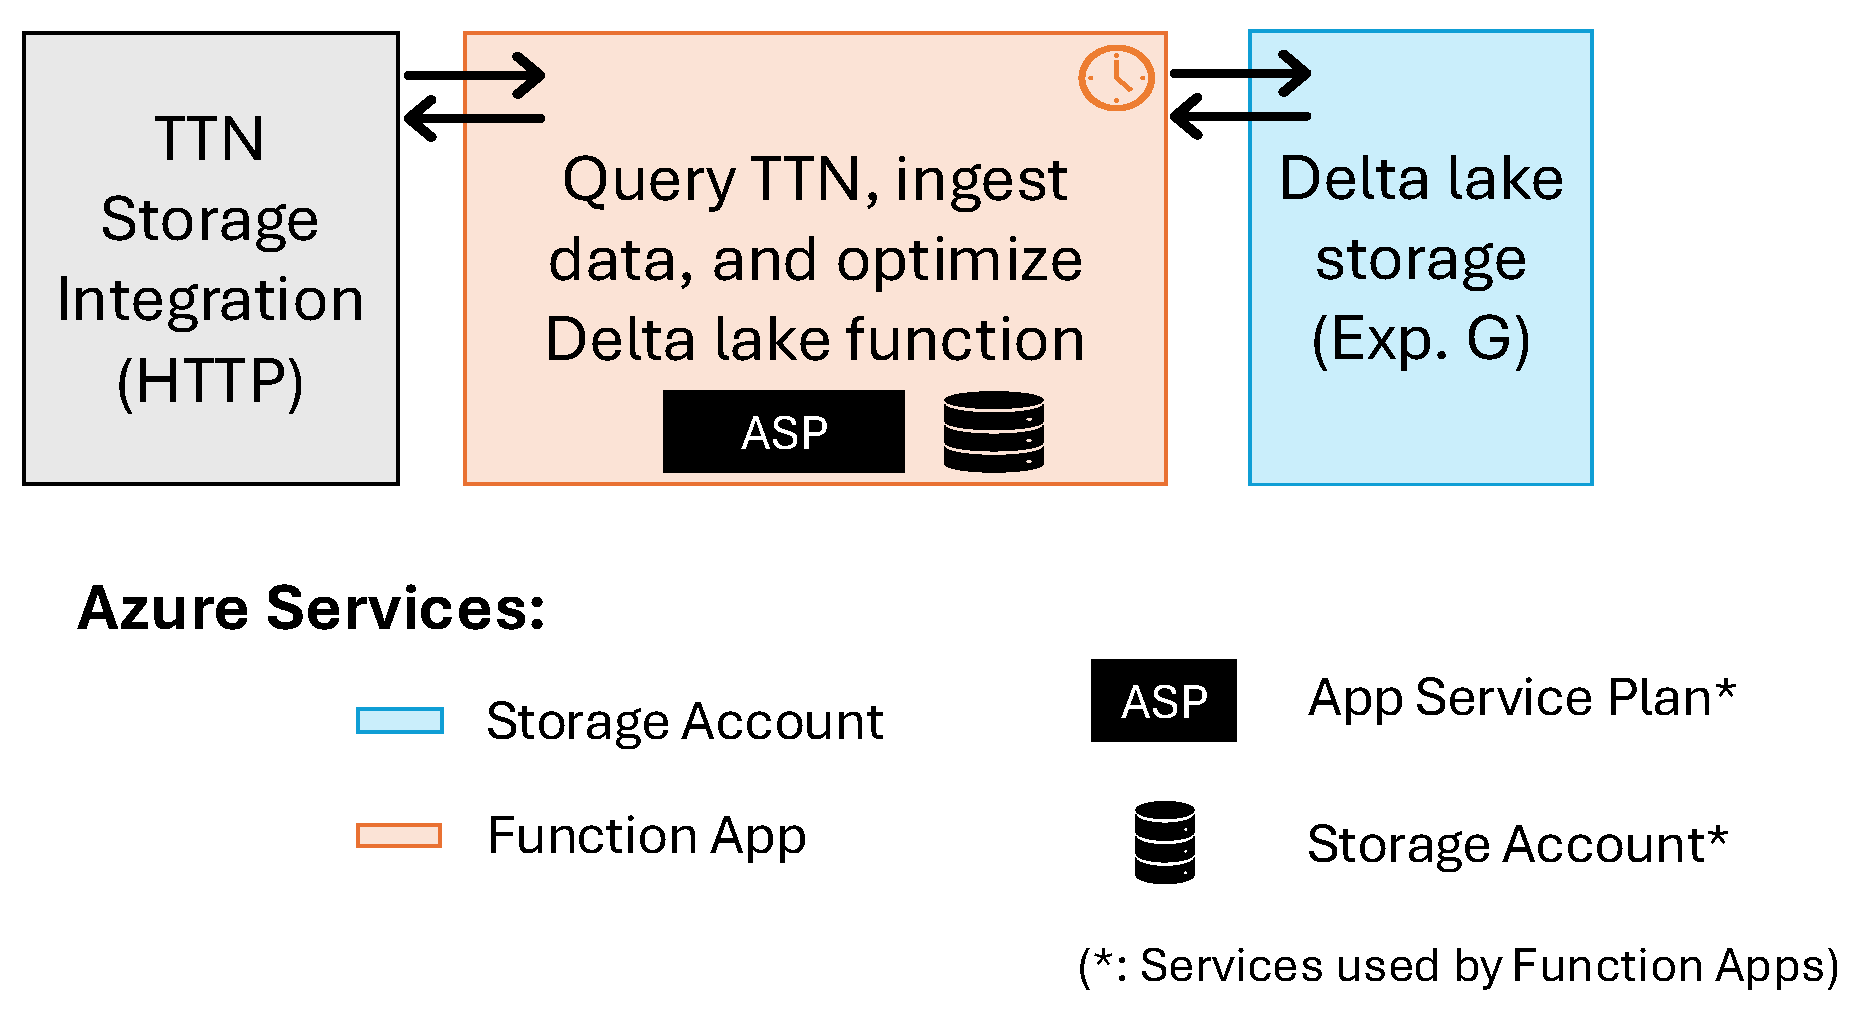
3.4.7. Data Ingestion Through TTN Storage API and a Serverless Function (Exp. G)
The Things Network offers a data storage service with an API that enables applications to query recent sensor data [
34]. This service is meant to be used to recover missing data in the case of a communication failure or an application server downtime. For this data pipeline in experiment G, we periodically run a serverless function that queries the TTN data storage API a few times a day (every 6 h), processes the sensor data, saves it in a delta table storage solution, and performs the delta table optimization. We depict the data layer architecture of experiment G in
Figure 8.
4. Results
We implemented all seven TTN to Azure data pipelines described in the previous section and generated one dataset for each data pipeline, containing all the successfully ingested sensor messages. We used three TTN applications with a total of nine active sensors. Our experiment lasted 21 days (3 weeks), resulting in 61,464 messages, which corresponds to an average of 2926.86 messages per day. All results below are reported for this same 21-day experiment window.
We evaluated (1) what percentage of messages were successfully ingested by each data pipeline, using the dataset with the largest number of unique samples as the reference for completeness; we compared (2) the daily costs of each data pipeline solution as provided by the Azure portal; we estimated (3) the median latency between sensor data being received by TTN and recorded in the stored Delta-table transaction log; and (4) we compared the complexity of solutions using proxy metrics (number of services/service types and lines of code). Definitions and measurement boundaries for these metrics are described in
Section 3.
4.1. Successful Message Ingestion Rate
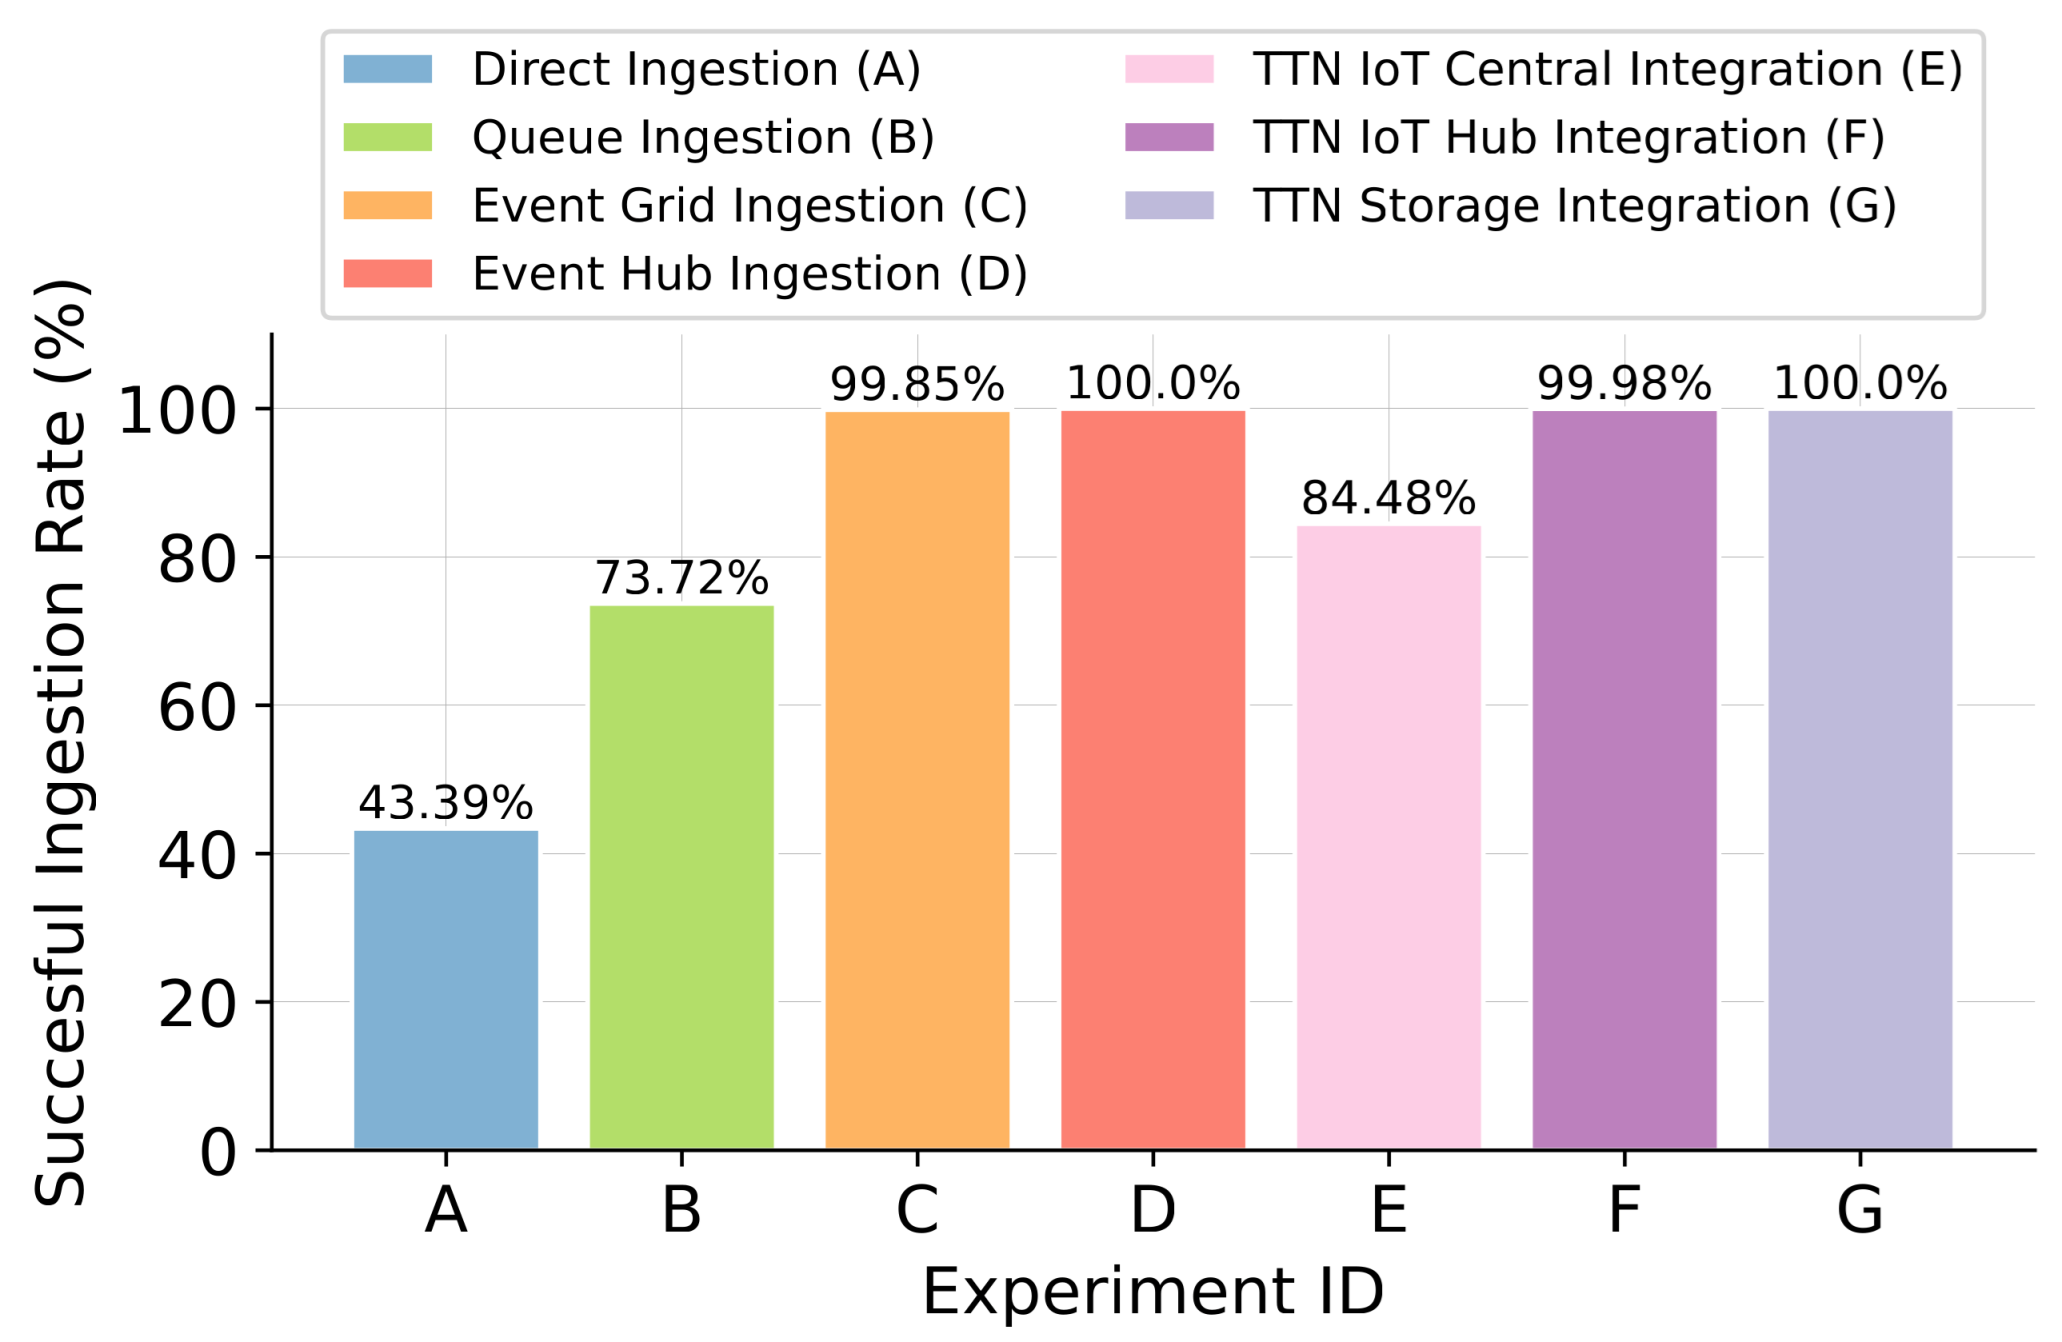
After running all seven data pipelines for 21 days (3 weeks), we compared the contents of each generated delta table to evaluate the share of sensor data messages that were successfully ingested by each pipeline. We used the dataset with the largest number of unique messages as the reference set and computed the fraction of those messages present in each experiment’s Delta tables. Duplicate messages were not counted as failures; in our experiment, duplicates were rare and occurred only in two pipelines at very low frequency (only six duplicates for experiment B, and 10 duplicates for experiment E). We show in
Figure 9 that four data ingestion pipelines (C, D, F, and G) achieved successful ingestion rates of more than 99%. The worst performance was found to be from data pipeline architecture A due to frequent timeout failures while receiving TTN HTTP POST requests. Additionally, TTN webhook integration can temporarily suspend integrations that are failing frequently, resulting in increased missing data for the data layer architecture of experiment A. Experiments D and G achieved 100% successful ingestion rate, while C and F achieved above 99%, indicating reliable ingestion under the tested workload. We show the successful message ingestion rate for all experiments in
Figure 9.
4.2. Cost Analysis
To evaluate the costs of each data pipeline and data storage, we used the cost management resources on the Azure portal. We organized each data pipeline into a different resource group, and we selected cost data from 21 days (3 weeks) of the experiment from 8 September to 28 September 2025. The selected experiment days skip the initial days of the month to reduce the influence of any free Azure functions quota. Unless stated otherwise, reported costs include ingestion, compute, and storage charges; estimated egress costs are discussed separately in
Section 5.5.
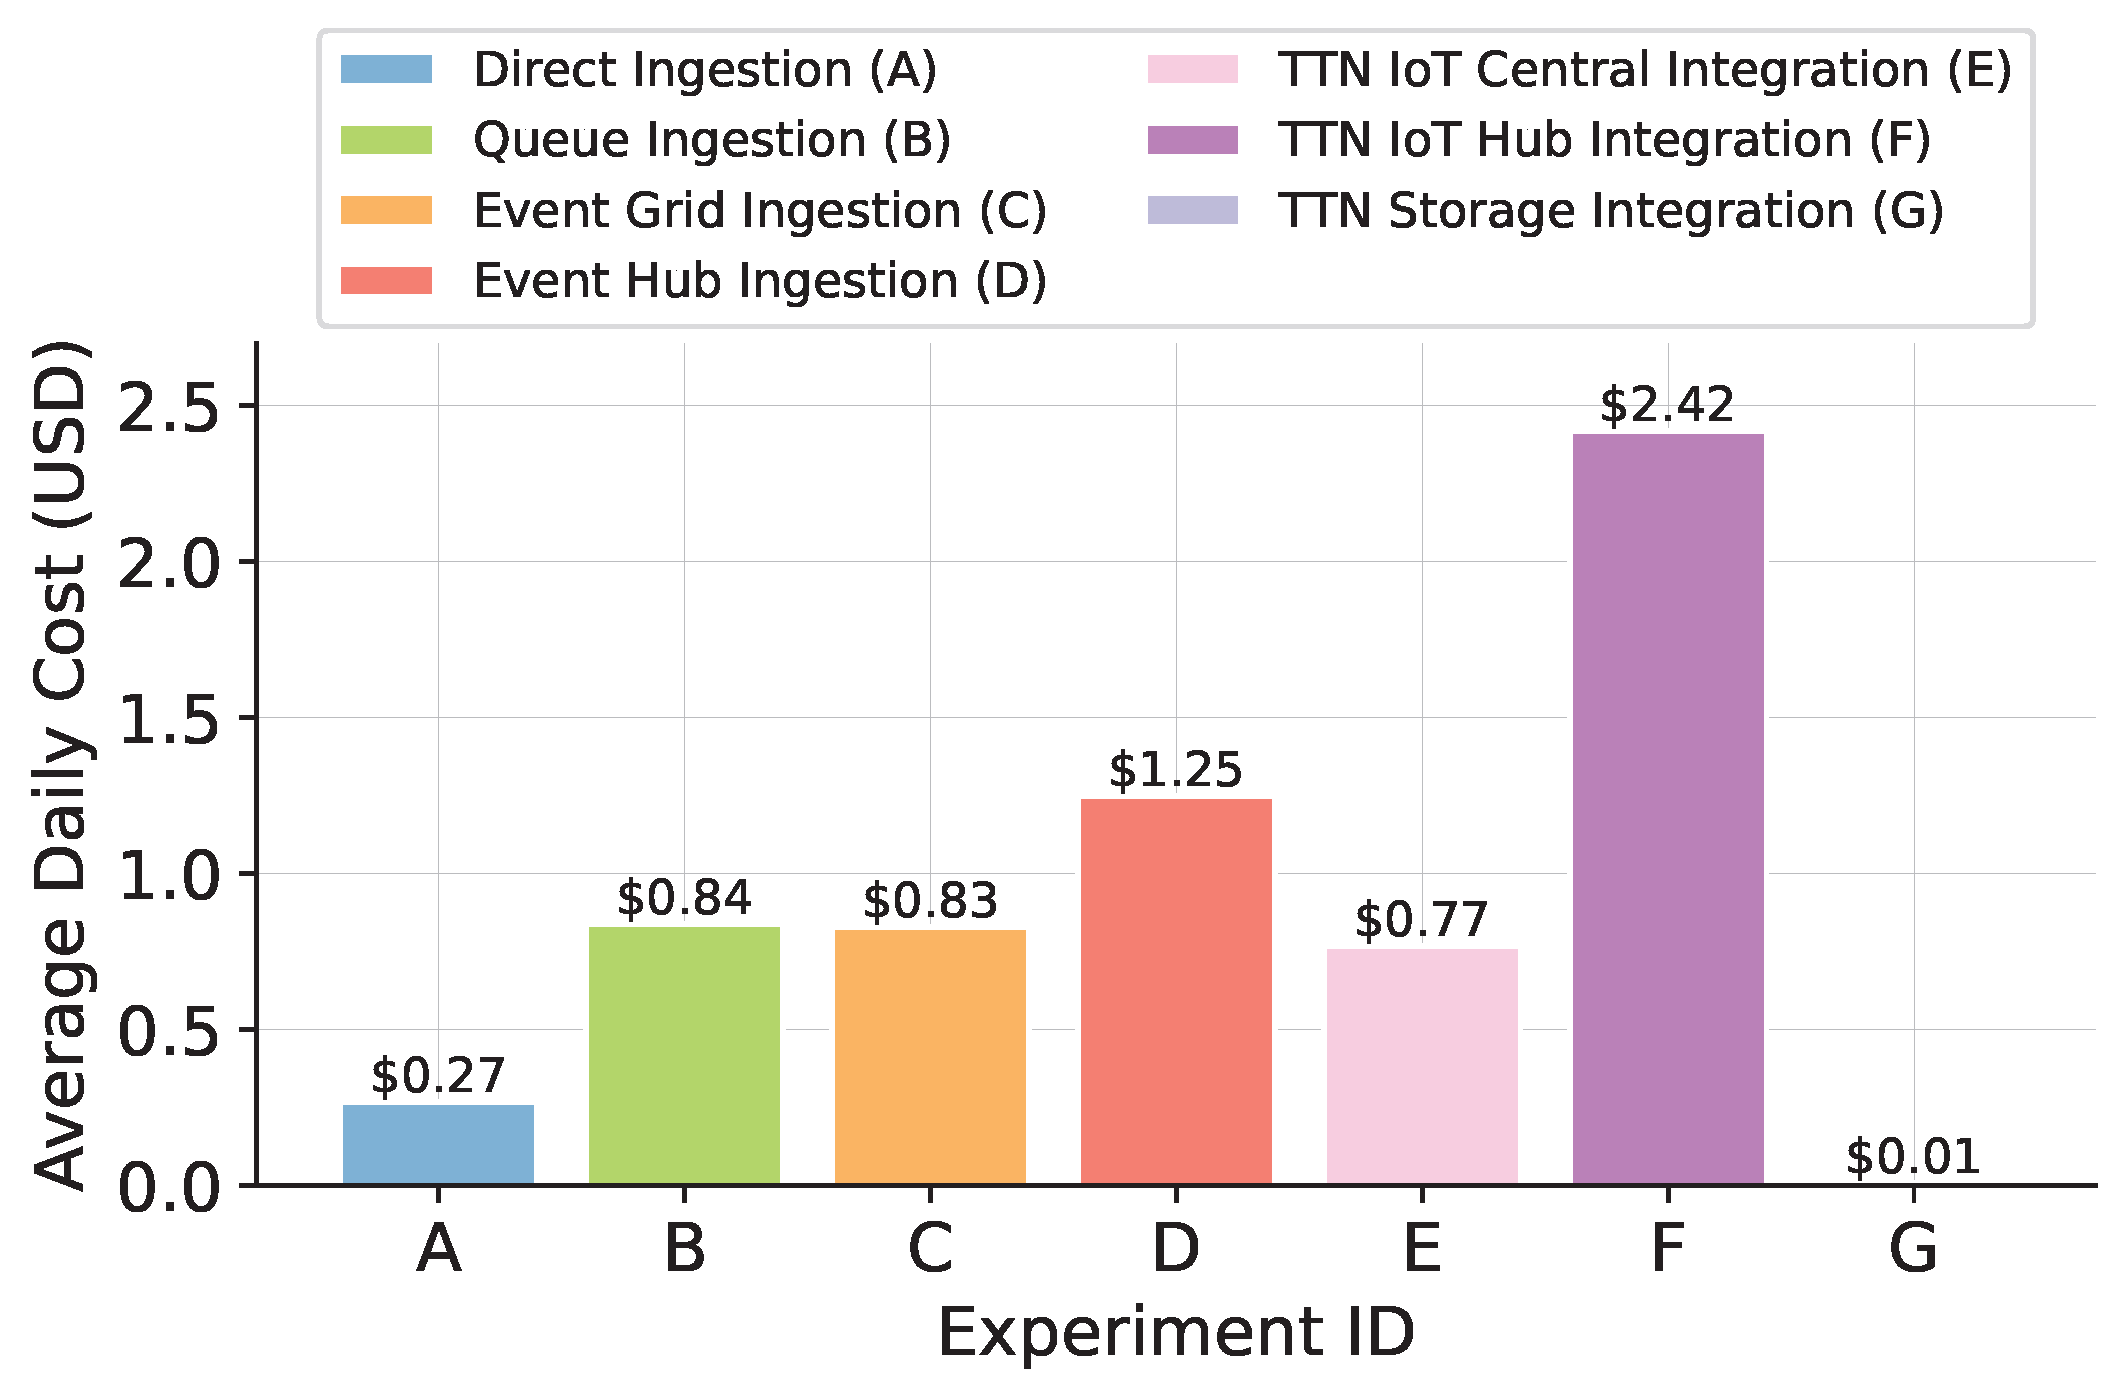
We find experiment F (IoT Hub integration) to be the most expensive, reaching a $50.78 total cost for the 21-day period, an average of $2.42 per day. Experiment F’s cost is dominated by IoT Hub and Event Hubs service costs, at $17.64 and $15.88 for the selected period. We find that the data pipeline of experiment G (TTN Storage API integration) has the lowest cost for the evaluation period, with a total cost of $0.13, an average of $0.01 per day. Experiment A (single serverless function) has the second lowest cost for the evaluation period due to the reduced number of serverless functions executed and the smaller dataset of successfully ingested sensor messages.
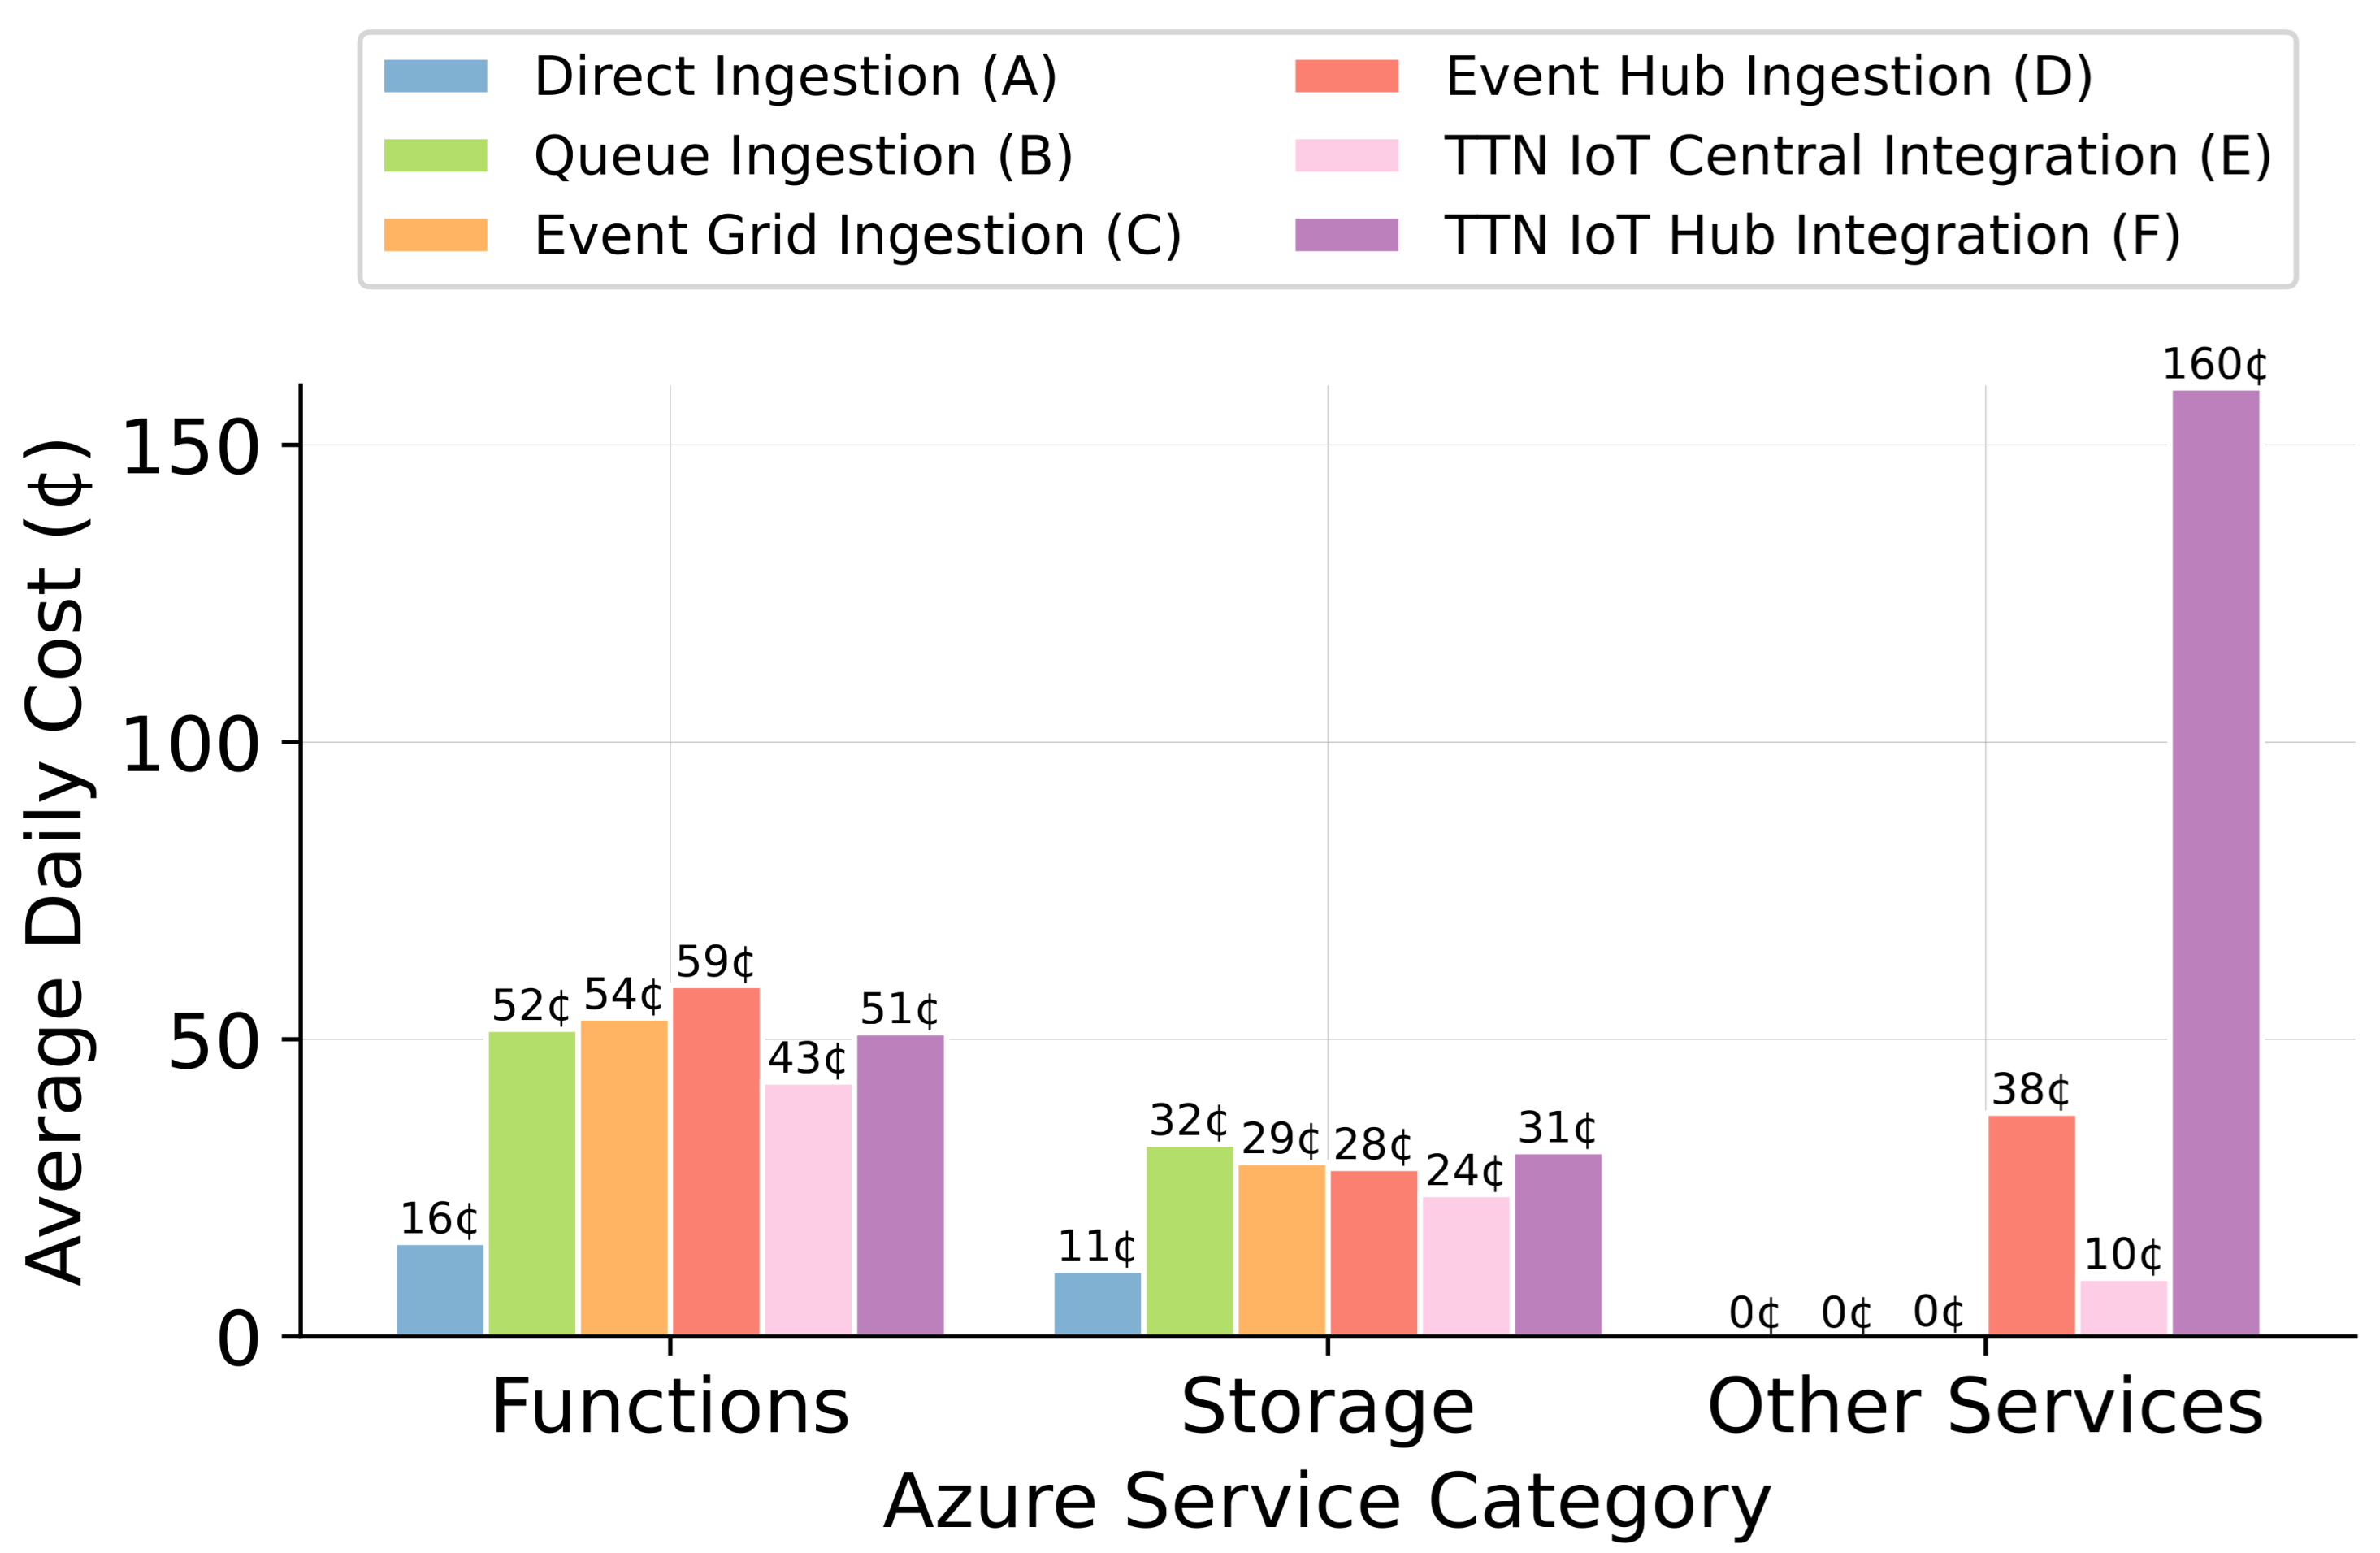
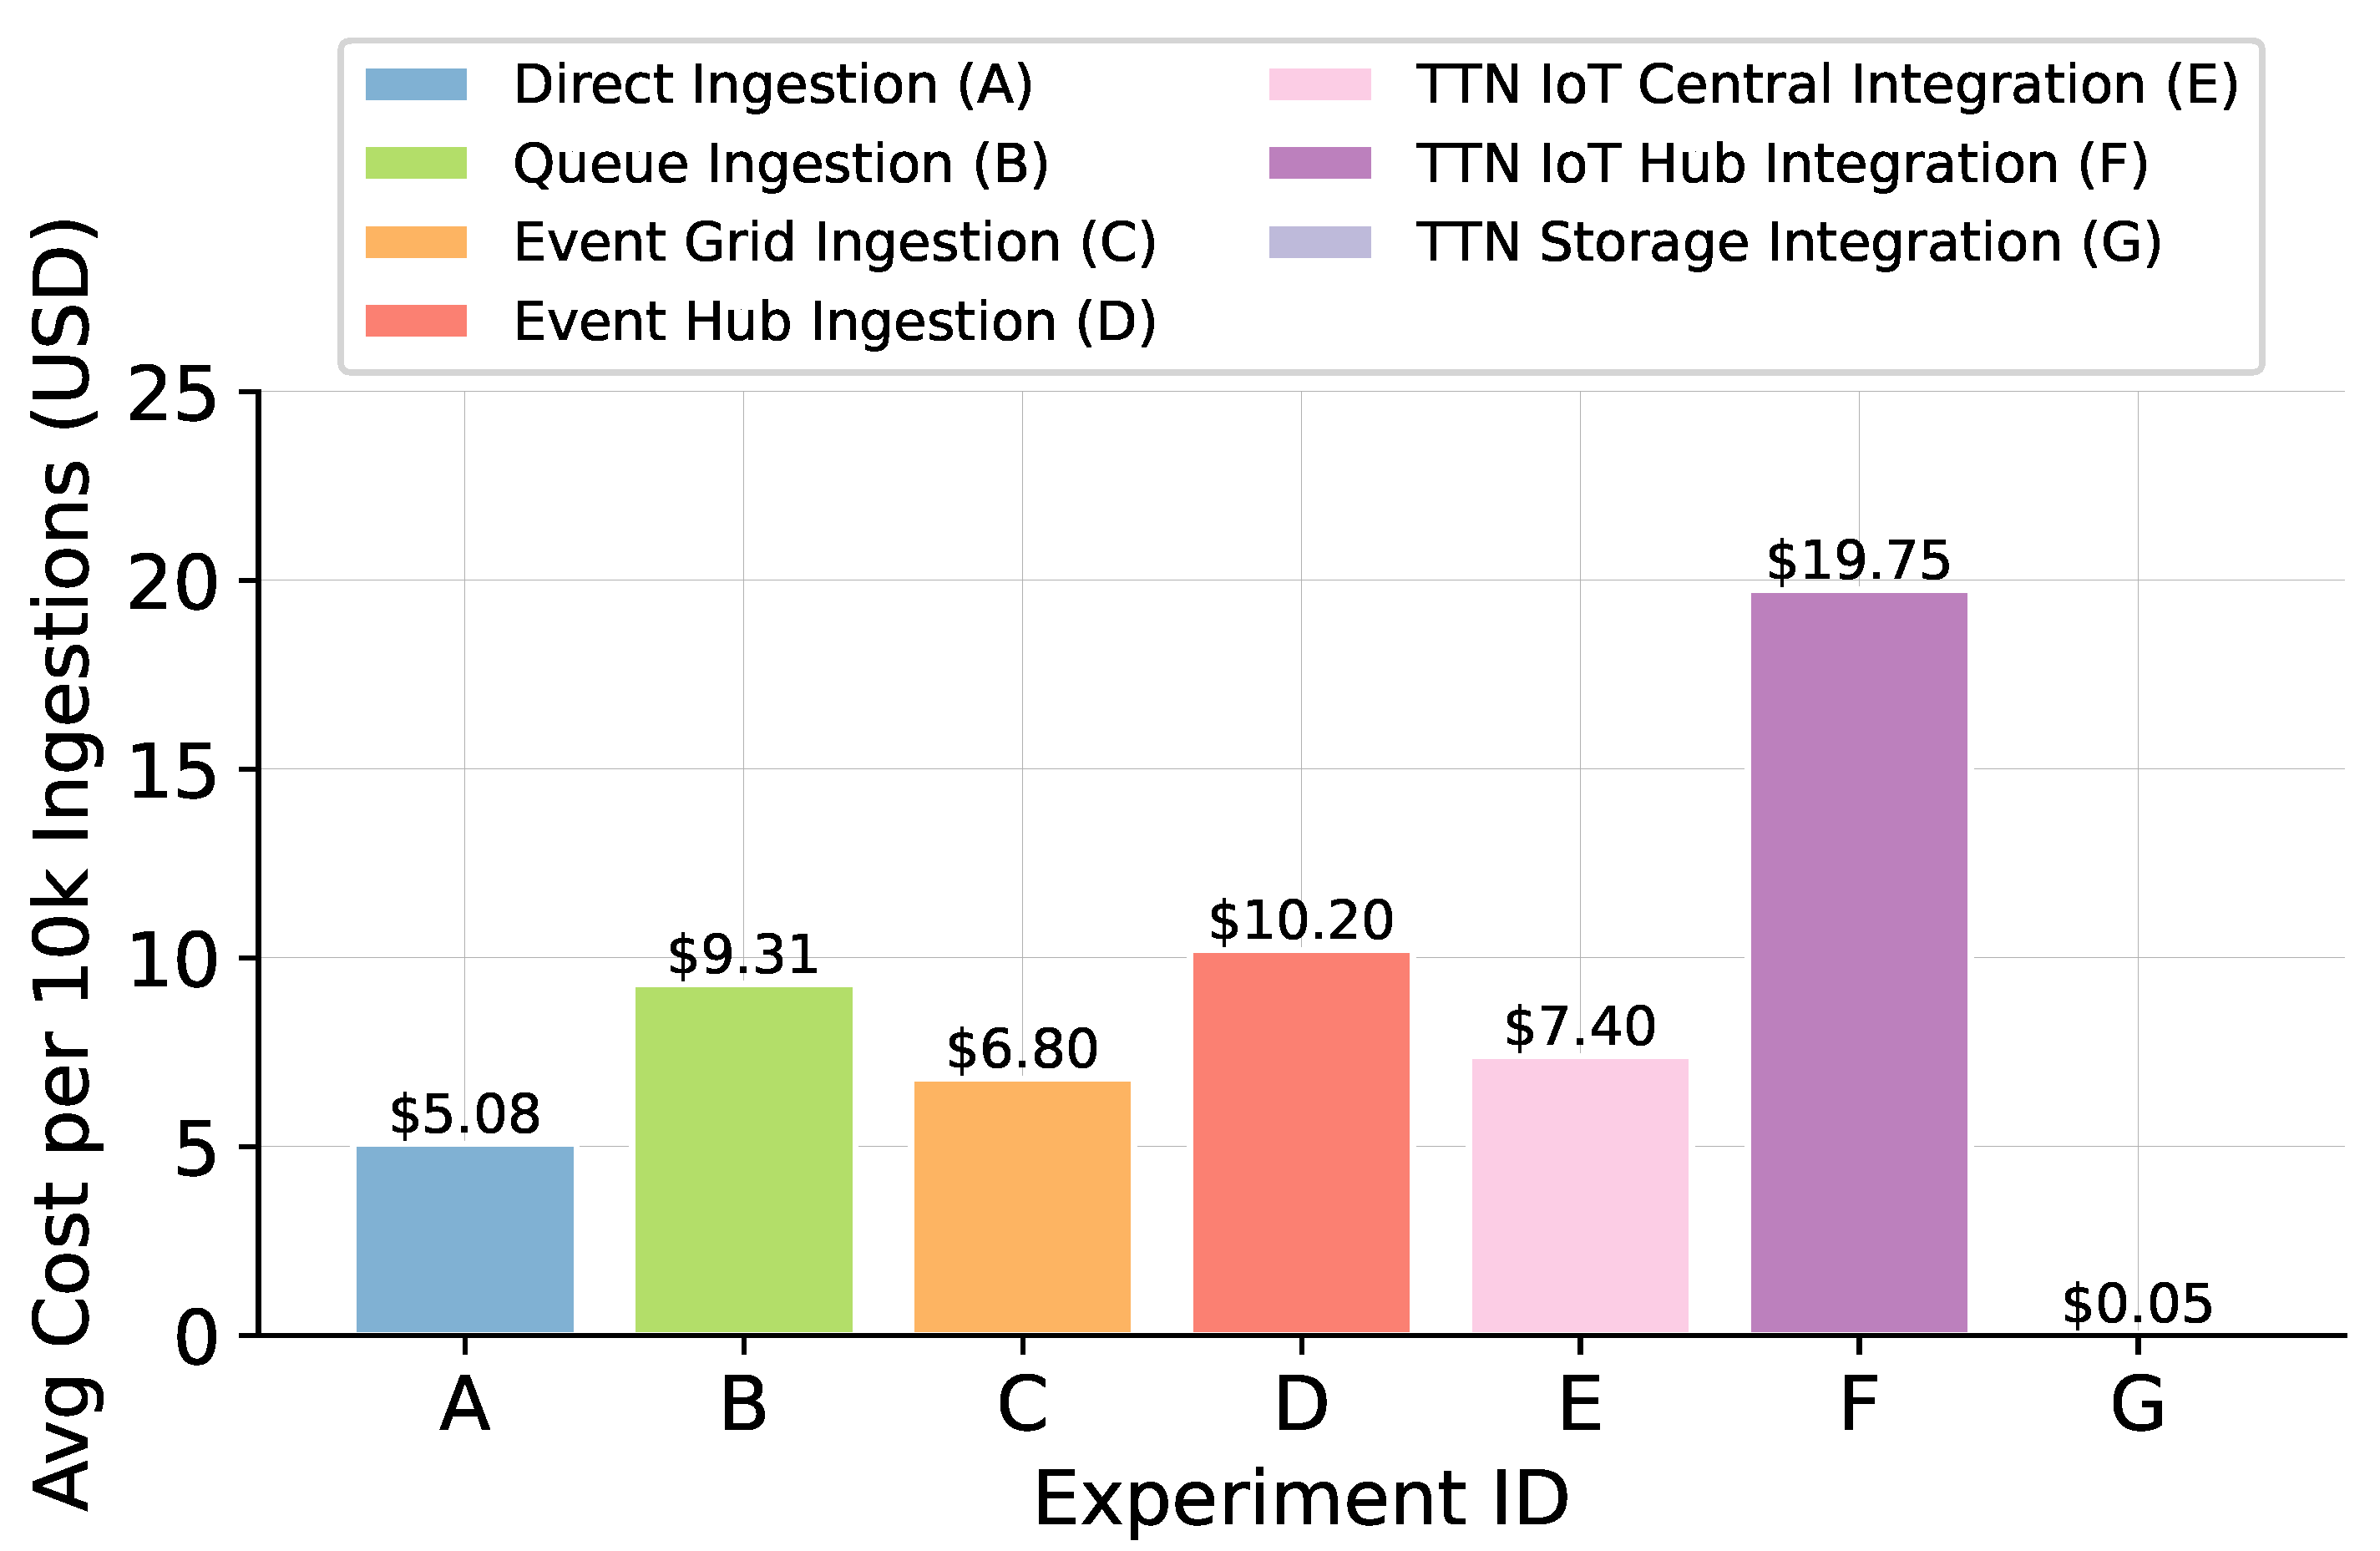
Total costs for experiments B, C, and E were around $0.80 per day, with experiment C (Event Grid Ingestion) having the highest successful ingestion rate (99.85%) among these three data layer solutions. Experiment D (Event Hub Ingestion) was the second most costly data pipeline, reaching a total cost of $26.24 for the evaluation period, an average of $1.25 per day. We show in the cost breakdown by service category that functions and storage costs for experiments B to F are comparable, while experiments D, E, and F have extra service costs. Experiment A shows lower function and storage costs as expected, since it demands fewer serverless function executions, and it has a lower number of successfully ingested messages. Among data layer solutions with high reliability (above a 99% successful ingestion rate), experiment C (Event Grid Ingestion) had the cheapest cost per 10,000 successfully ingested messages. Among the near-real-time pipelines with ingestion success above 99%, experiment C provides the lowest cost per 10,000 successful ingestions.
We show in
Figure 10 the average daily cost of all data layer experiments. In
Figure 11, we show the average daily cost breakdown for experiments A to F. In
Figure 12, we show the average cost per 10,000 successful ingestion messages for all experiments.
4.3. Latency Analysis
To estimate the latency between sensor messages being received at TTN and stored at the delta table, we compared the timestamps added by TTN with the write operation logs of the delta table of each data pipeline. As described in
Section 3, this is an optimistic latency estimate based on matching each TTN timestamp to the nearest Delta Lake commit operation, and it should be interpreted as a comparative indicator rather than a definitive end-to-end measurement.
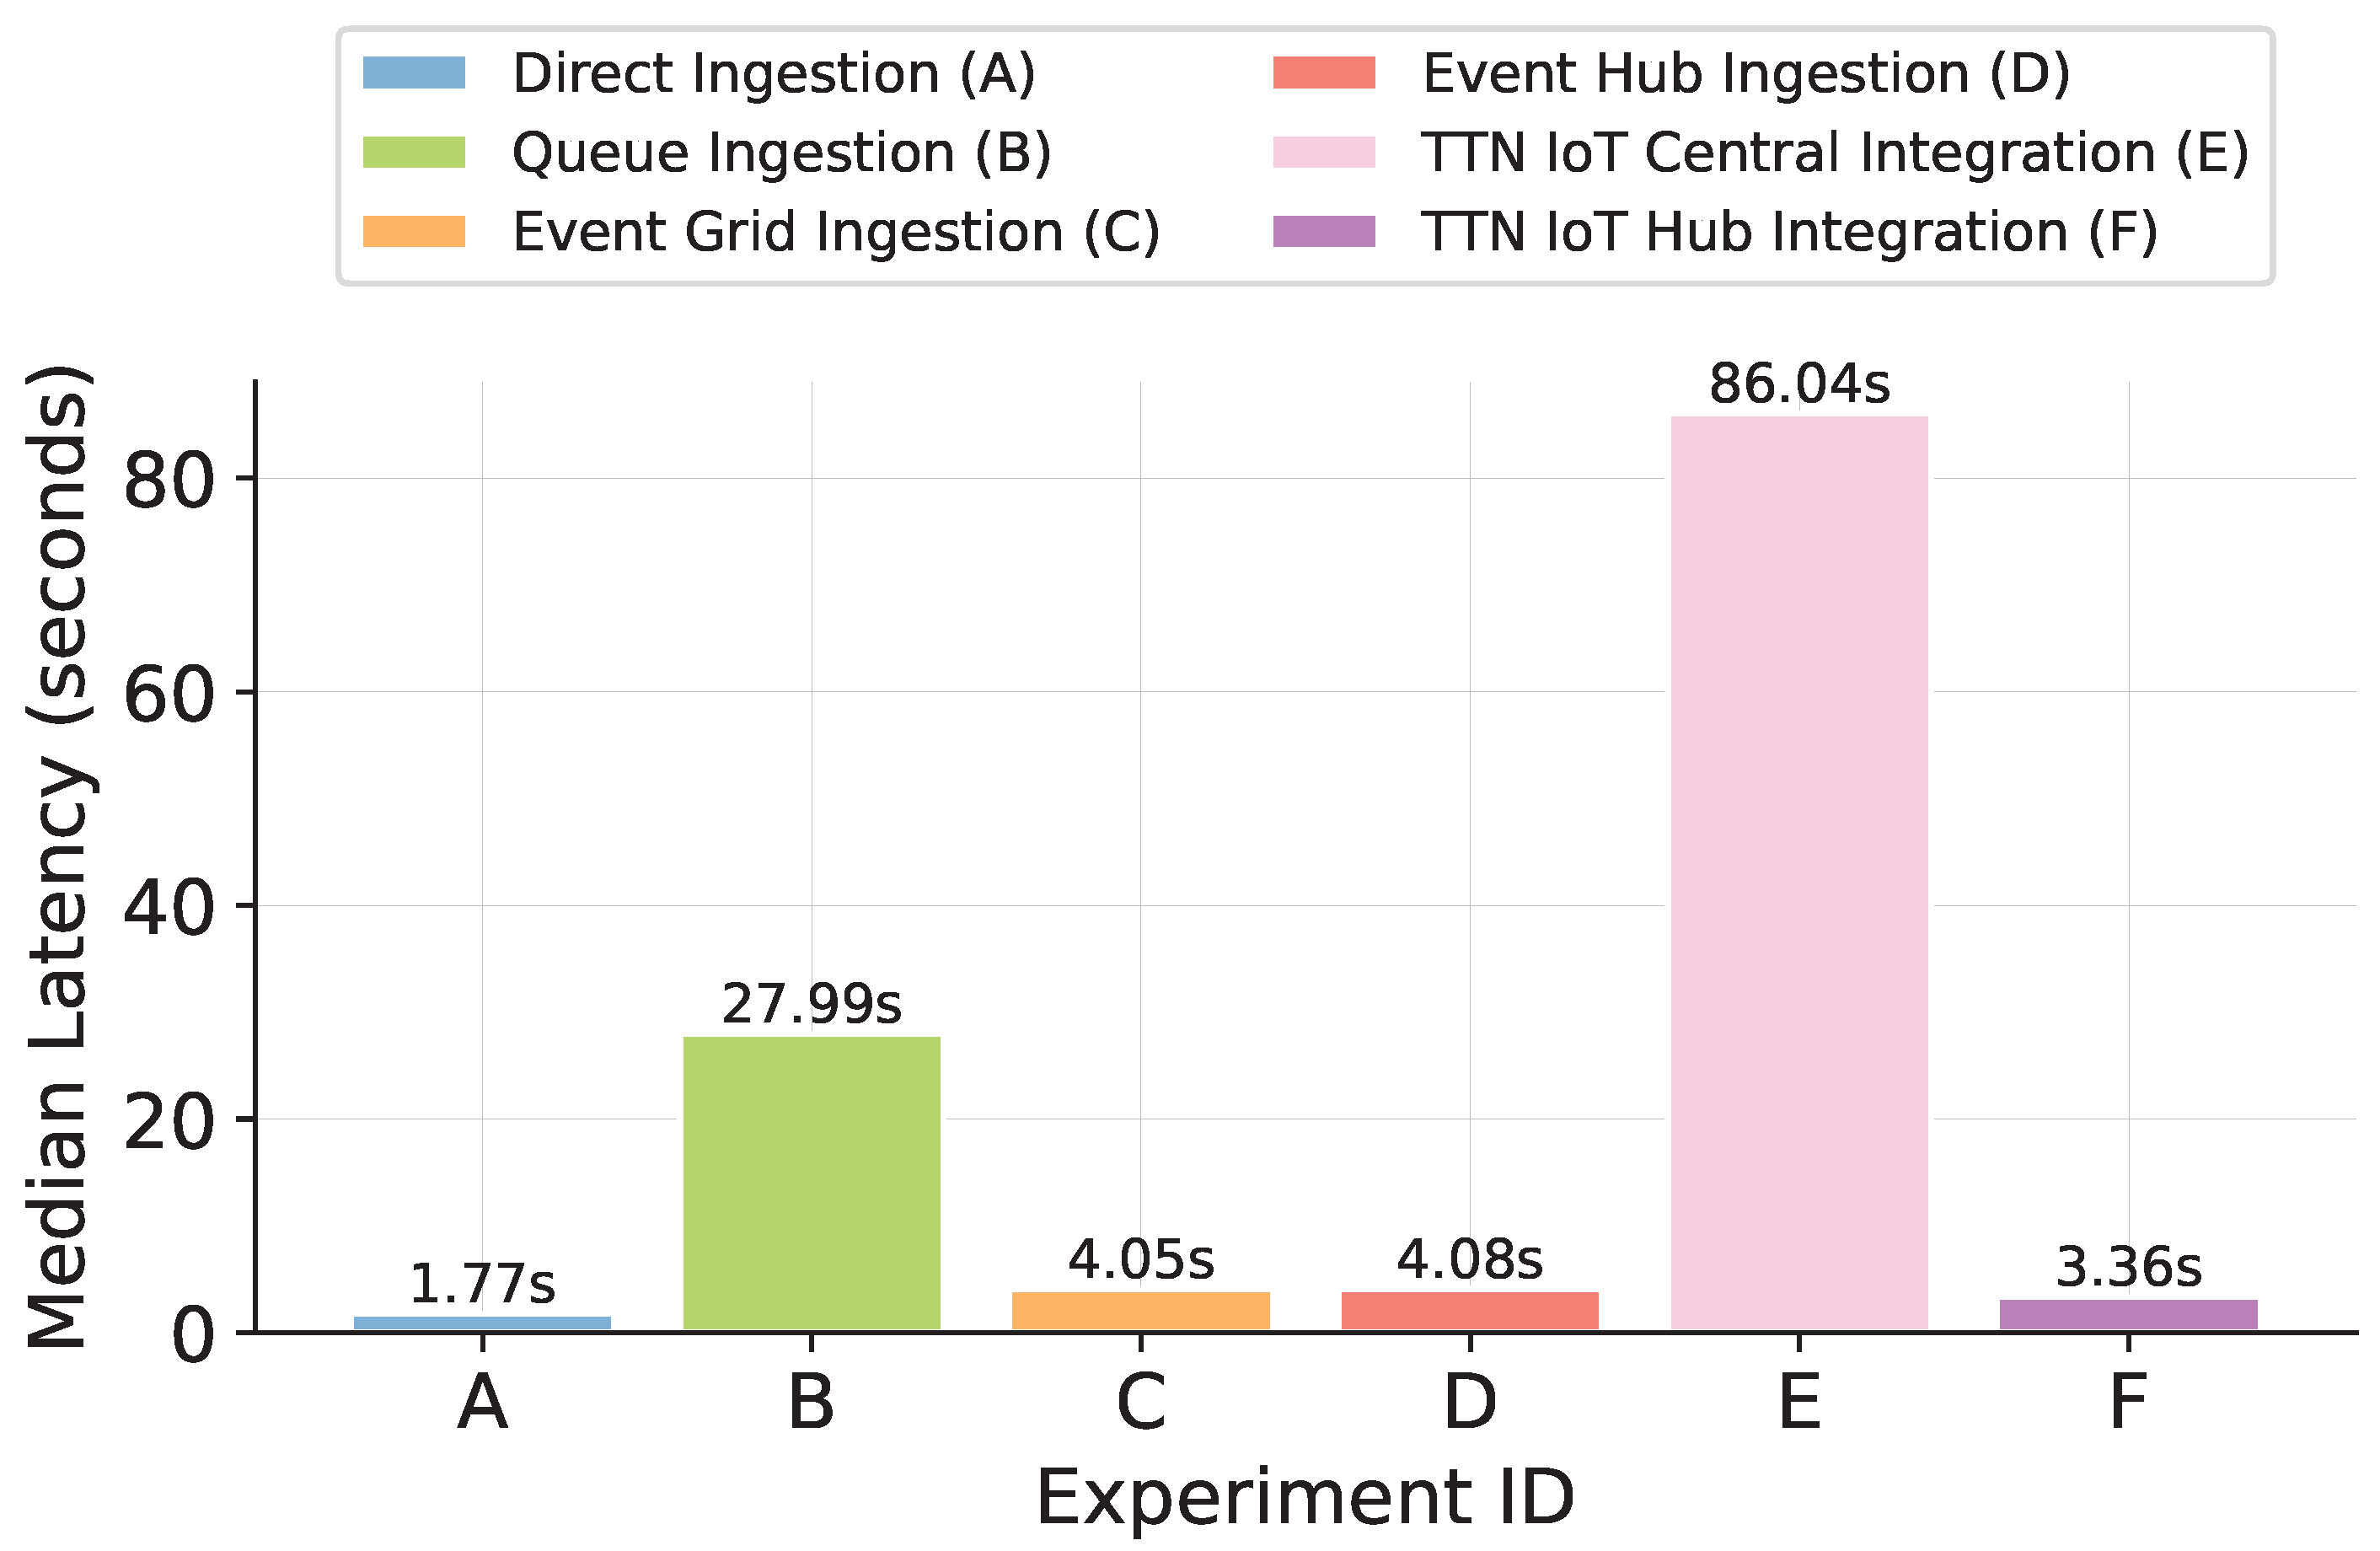
First, we assume that this data pipeline latency is on the order of seconds, while our sensors transmit data at least every 5 min. For each sensor message, we match its timestamp to the nearest delta-table write operation, generating an optimistic estimate of latency. Then we use median latency values to avoid outlier estimates that can occur when data is missing or when multiple sensor messages are received over a few seconds. Another potential source of error is that the timestamps used were generated on different servers, which might result in synchronization issues. Due to the limitations mentioned, this latency estimate is intended for rough comparison with our data layer experiments, not as a definitive benchmark. Experiment G (TTN Storage Integration) is excluded because it is not a real-time pipeline and its latency is dominated by the 6-hour polling schedule.
Our median latency estimates show that experiment E (IoT Central) takes the longest time to save sensor data in its delta table. This result is expected since, for this data pipeline, sensor messages are first stored in batches as text blobs (every minute), then read, processed, and saved in a delta table, resulting in a significant delay. Experiment B (Queue storage) has the second-highest latency because read and write operations to queues are slower than in Event Grid and Event Hub solutions. Experiments C, D, and F have similar median latency values, with experiment A having the lowest latency due to its single-step serverless function architecture. The results show reasonable latency for real-time applications, with the data pipelines taking under 2 min from the time sensor data is received at TTN to when it is saved in the delta tables, with five of the data pipeline solutions (A, C, D, and F) having median latency under 5 s. In
Figure 13, we show the median latency results from our data layer experiments.
4.4. Solution Complexity (Proxy Metrics)
Designing the proposed serverless data pipelines requires the setup and integration of cloud provider services, as well as writing custom code to process, store, and manage data. To compare complexity consistently across architectures, we report the following proxy metrics: number of different service types, total number of services, and number of lines of Python code. Although these proxies do not fully capture configuration dependencies, maintenance costs, or operational complexity, providing such proxies is still valuable as quantifiable parameters that describe data layer implementation characteristics.
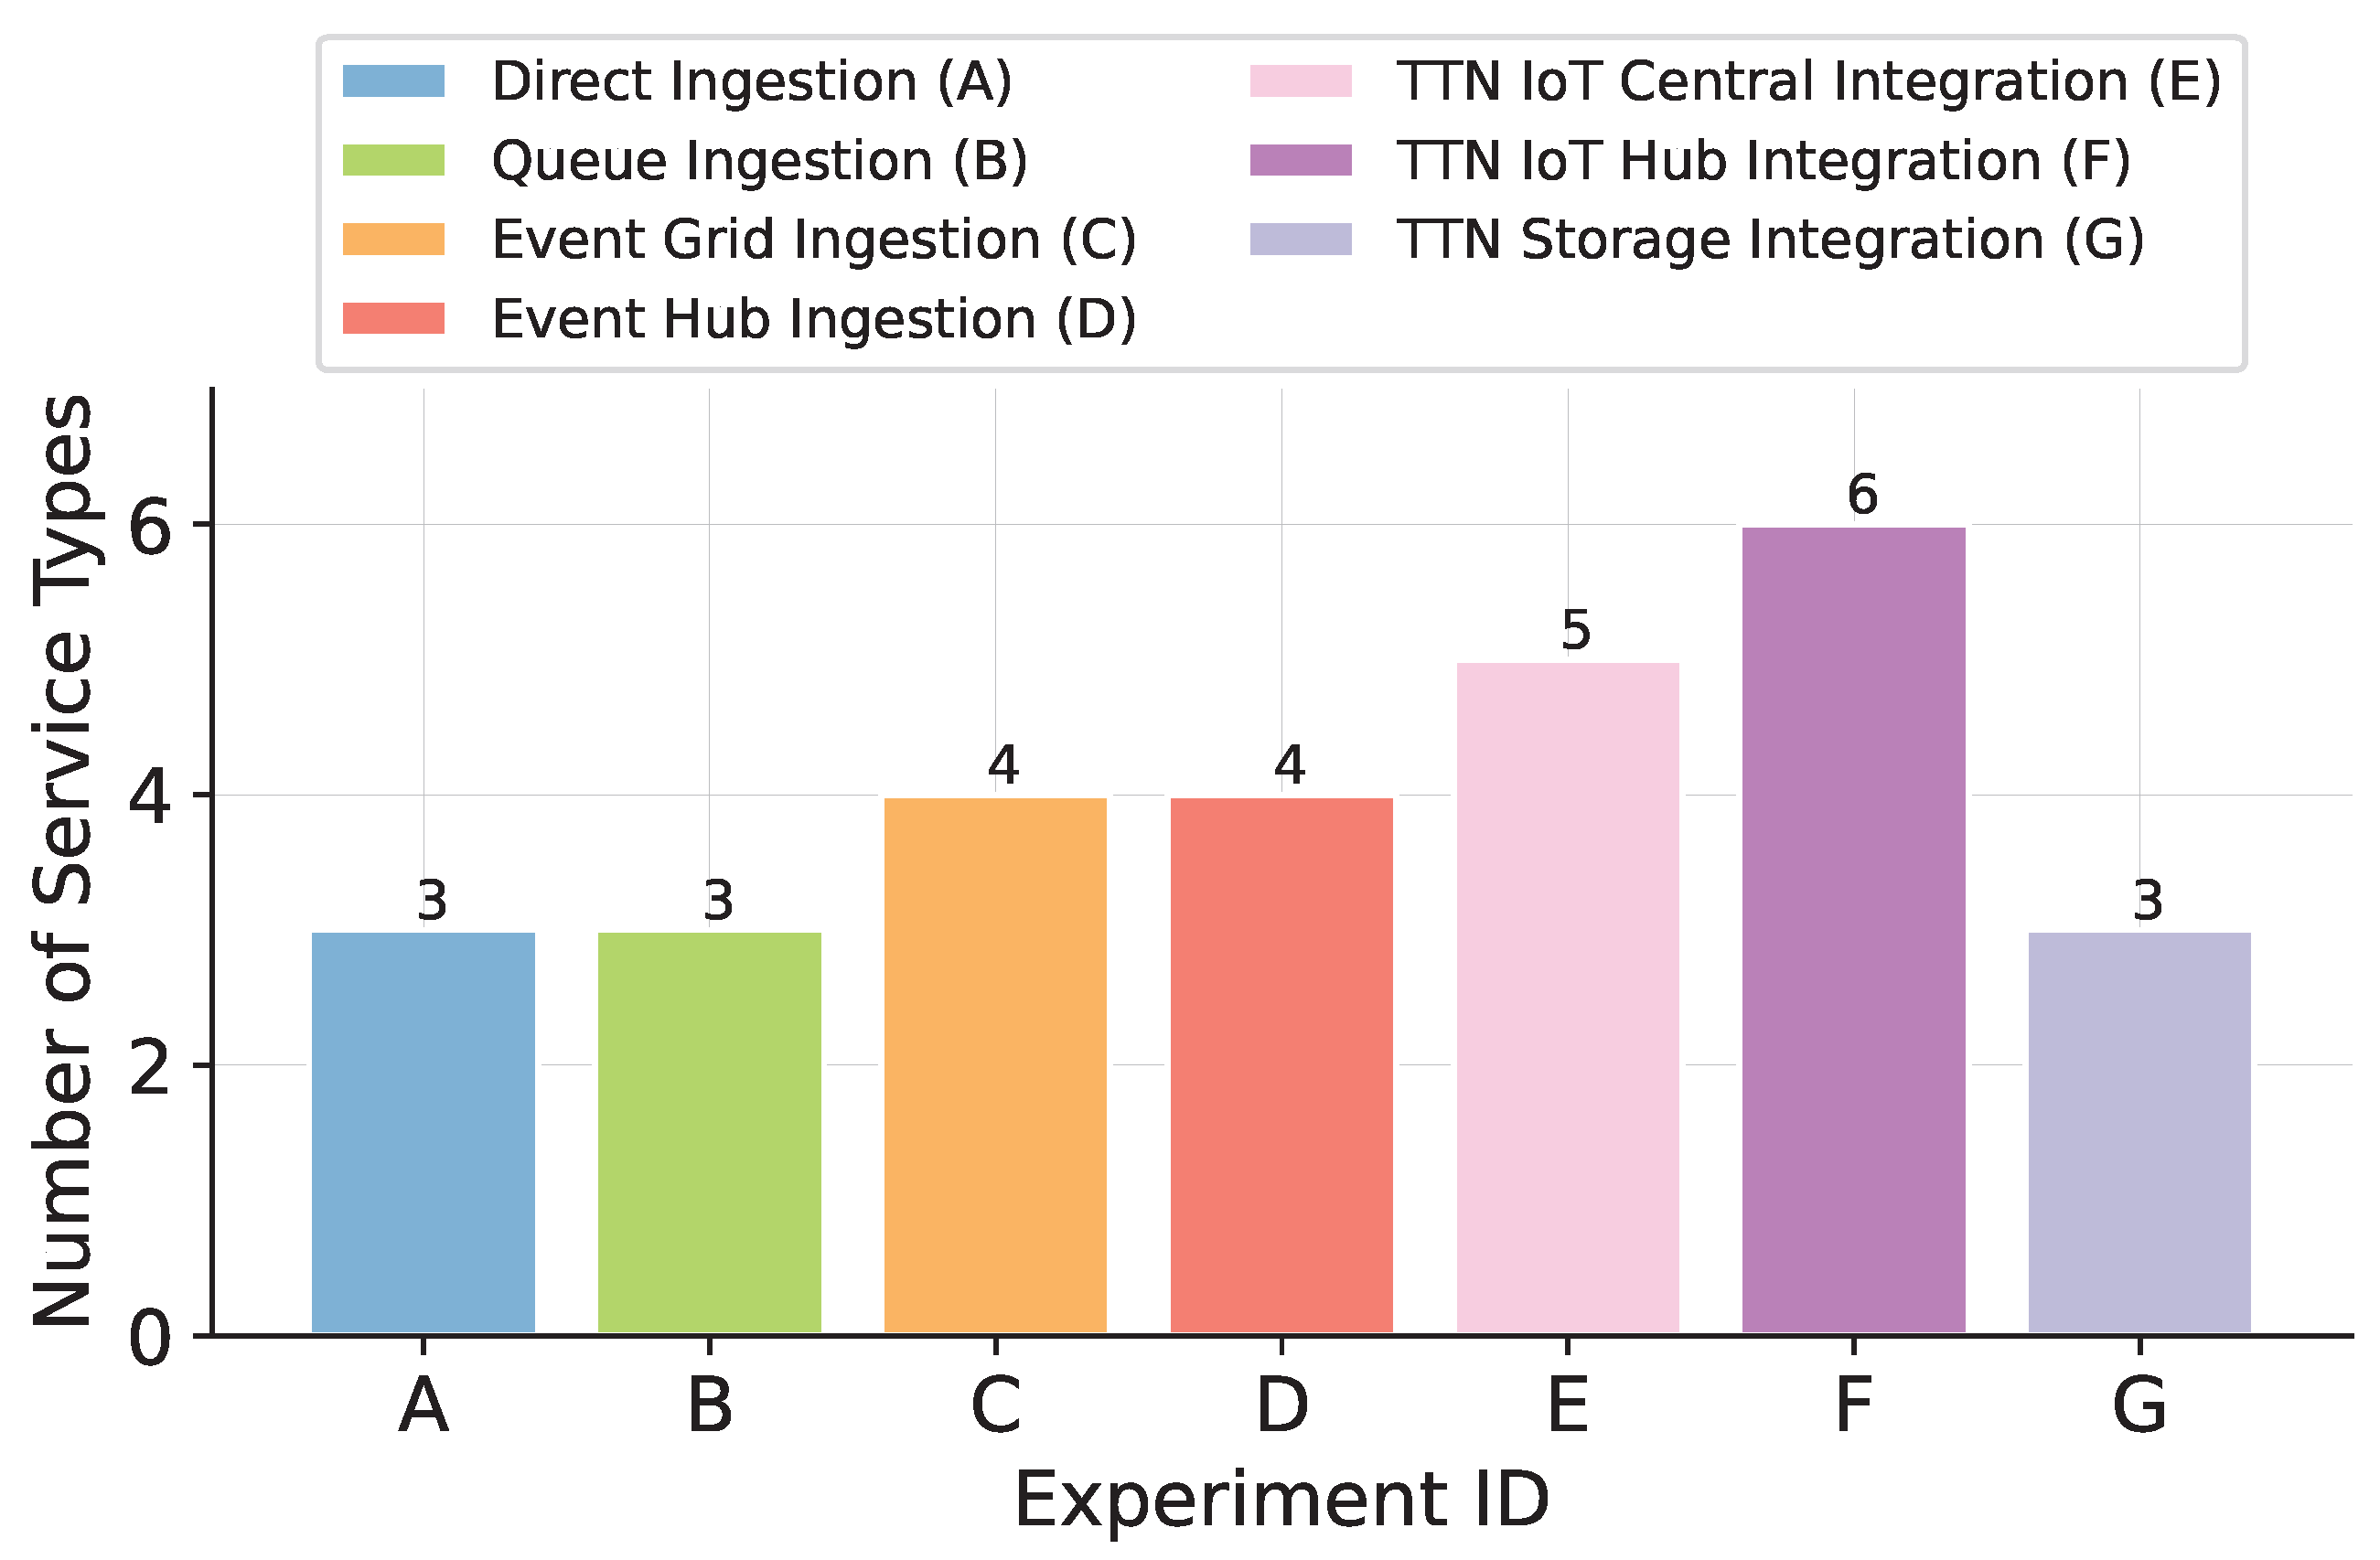
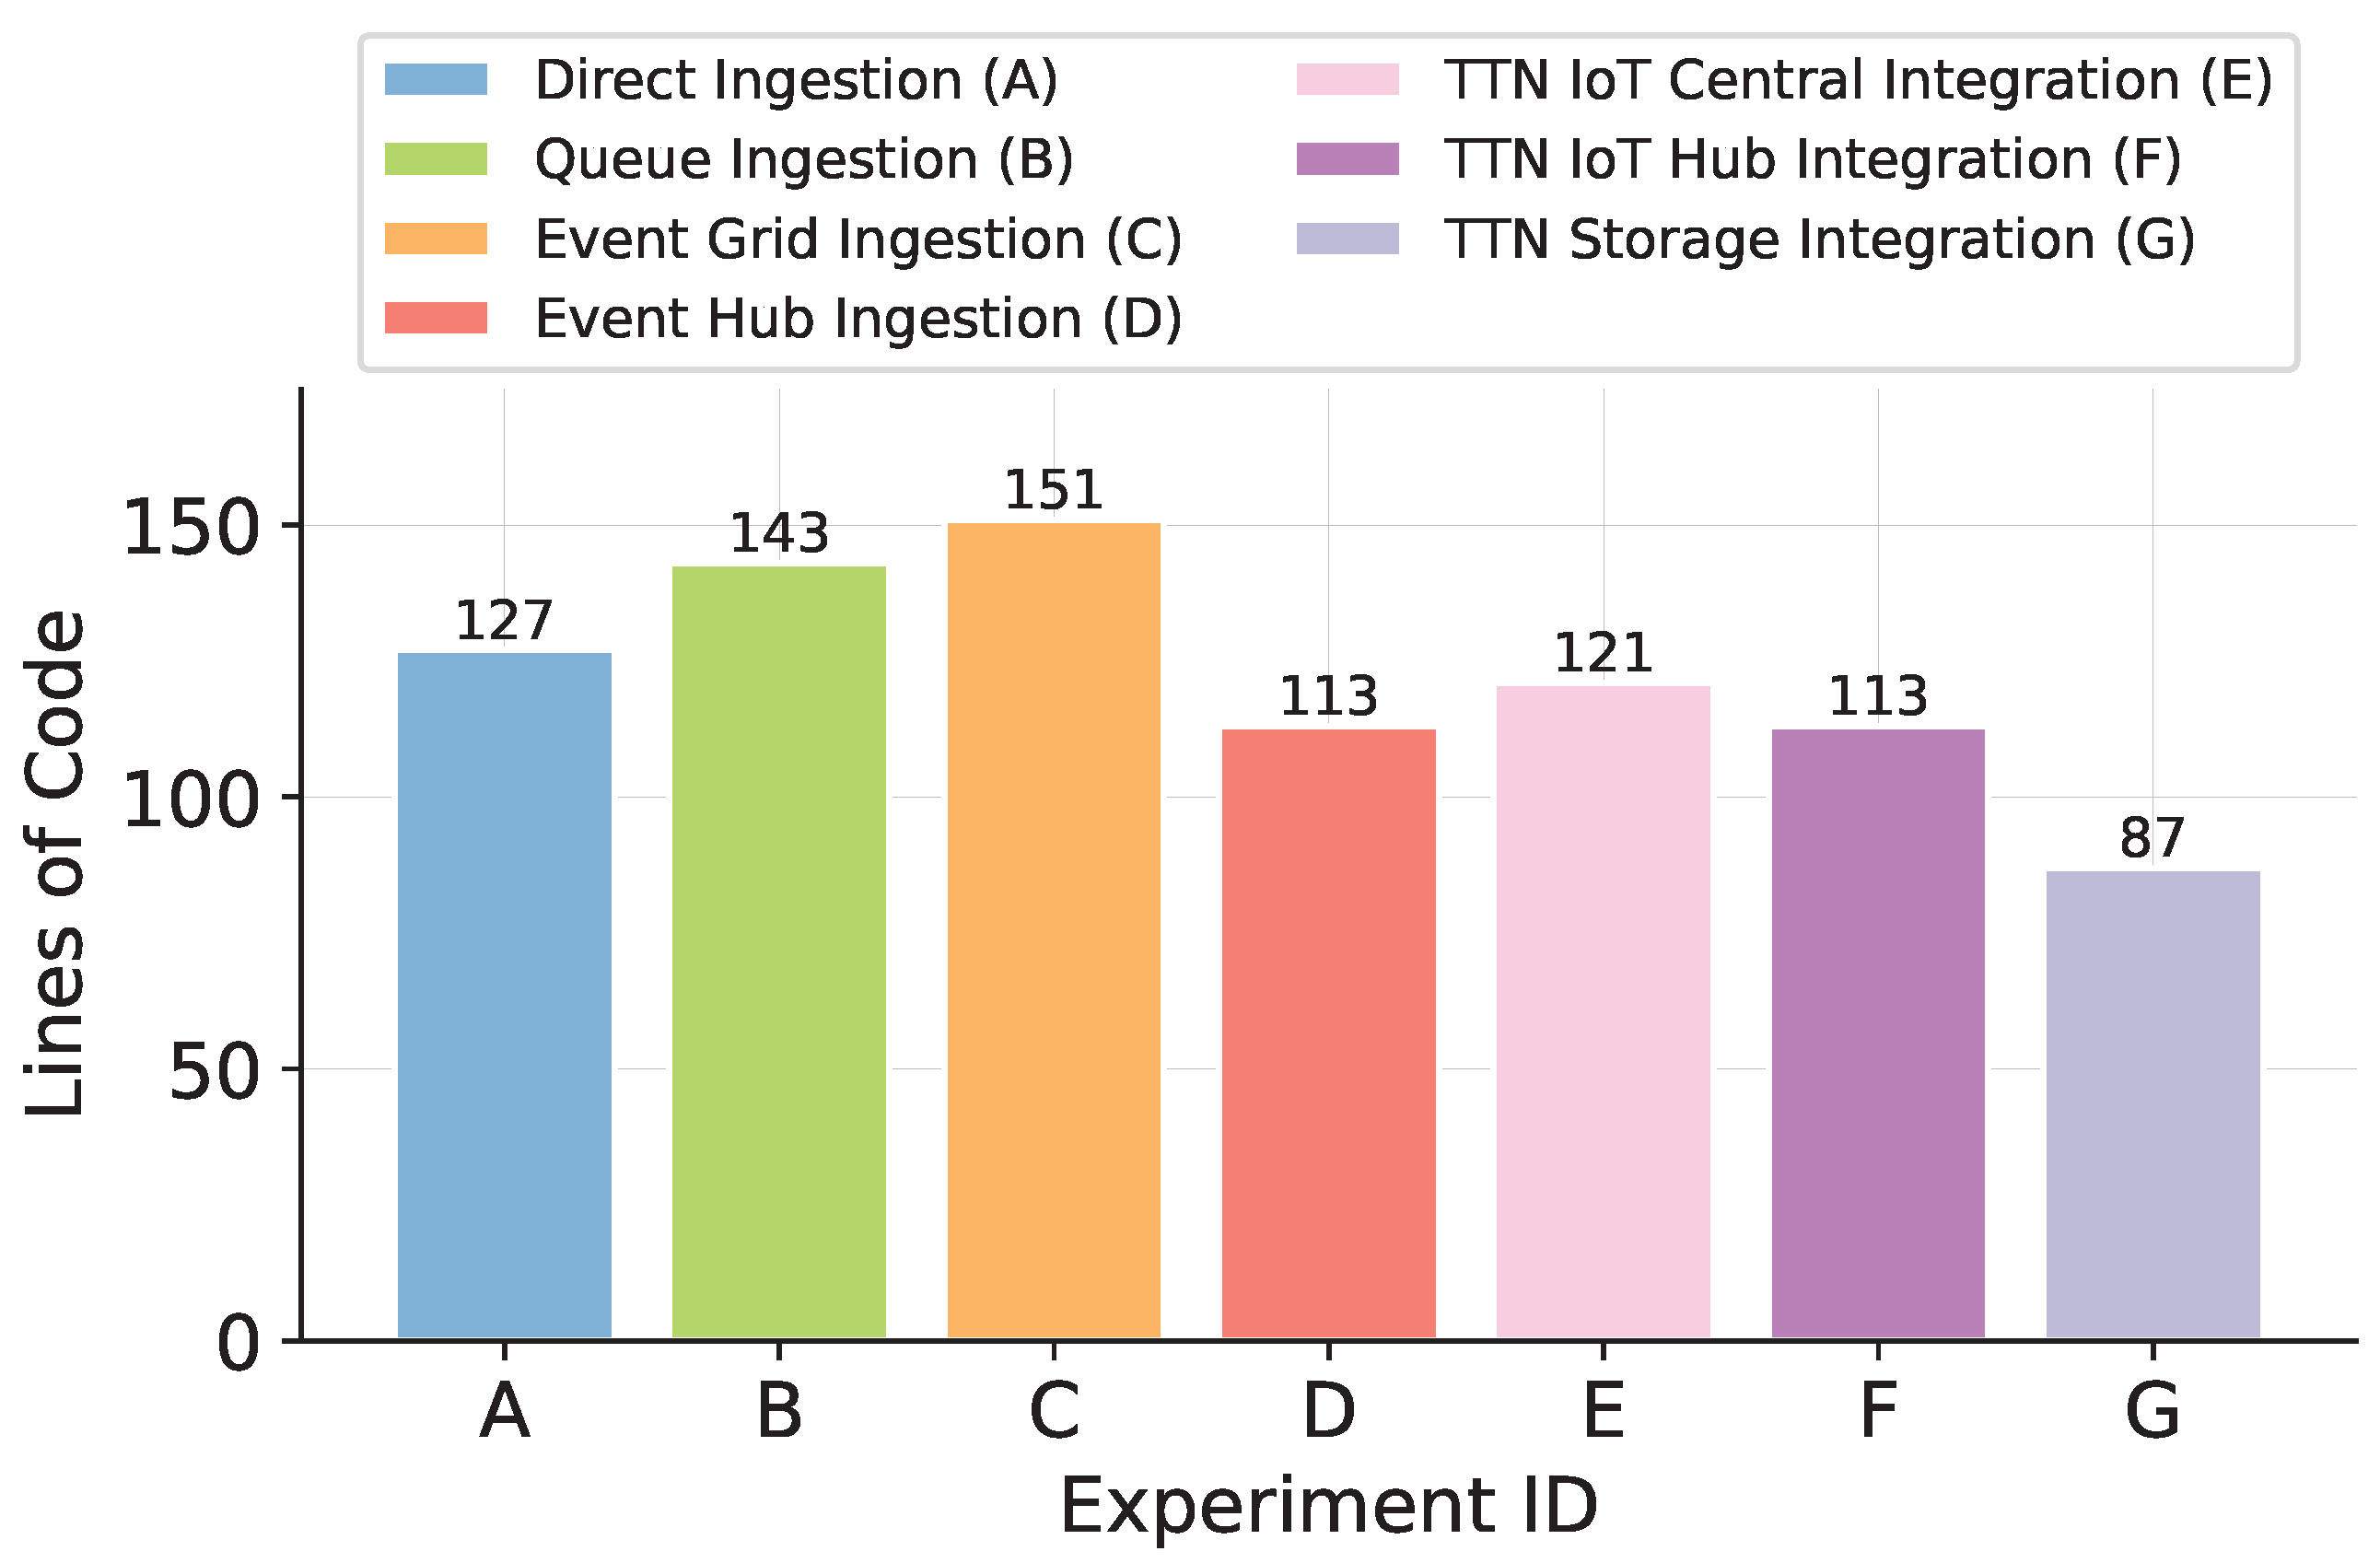
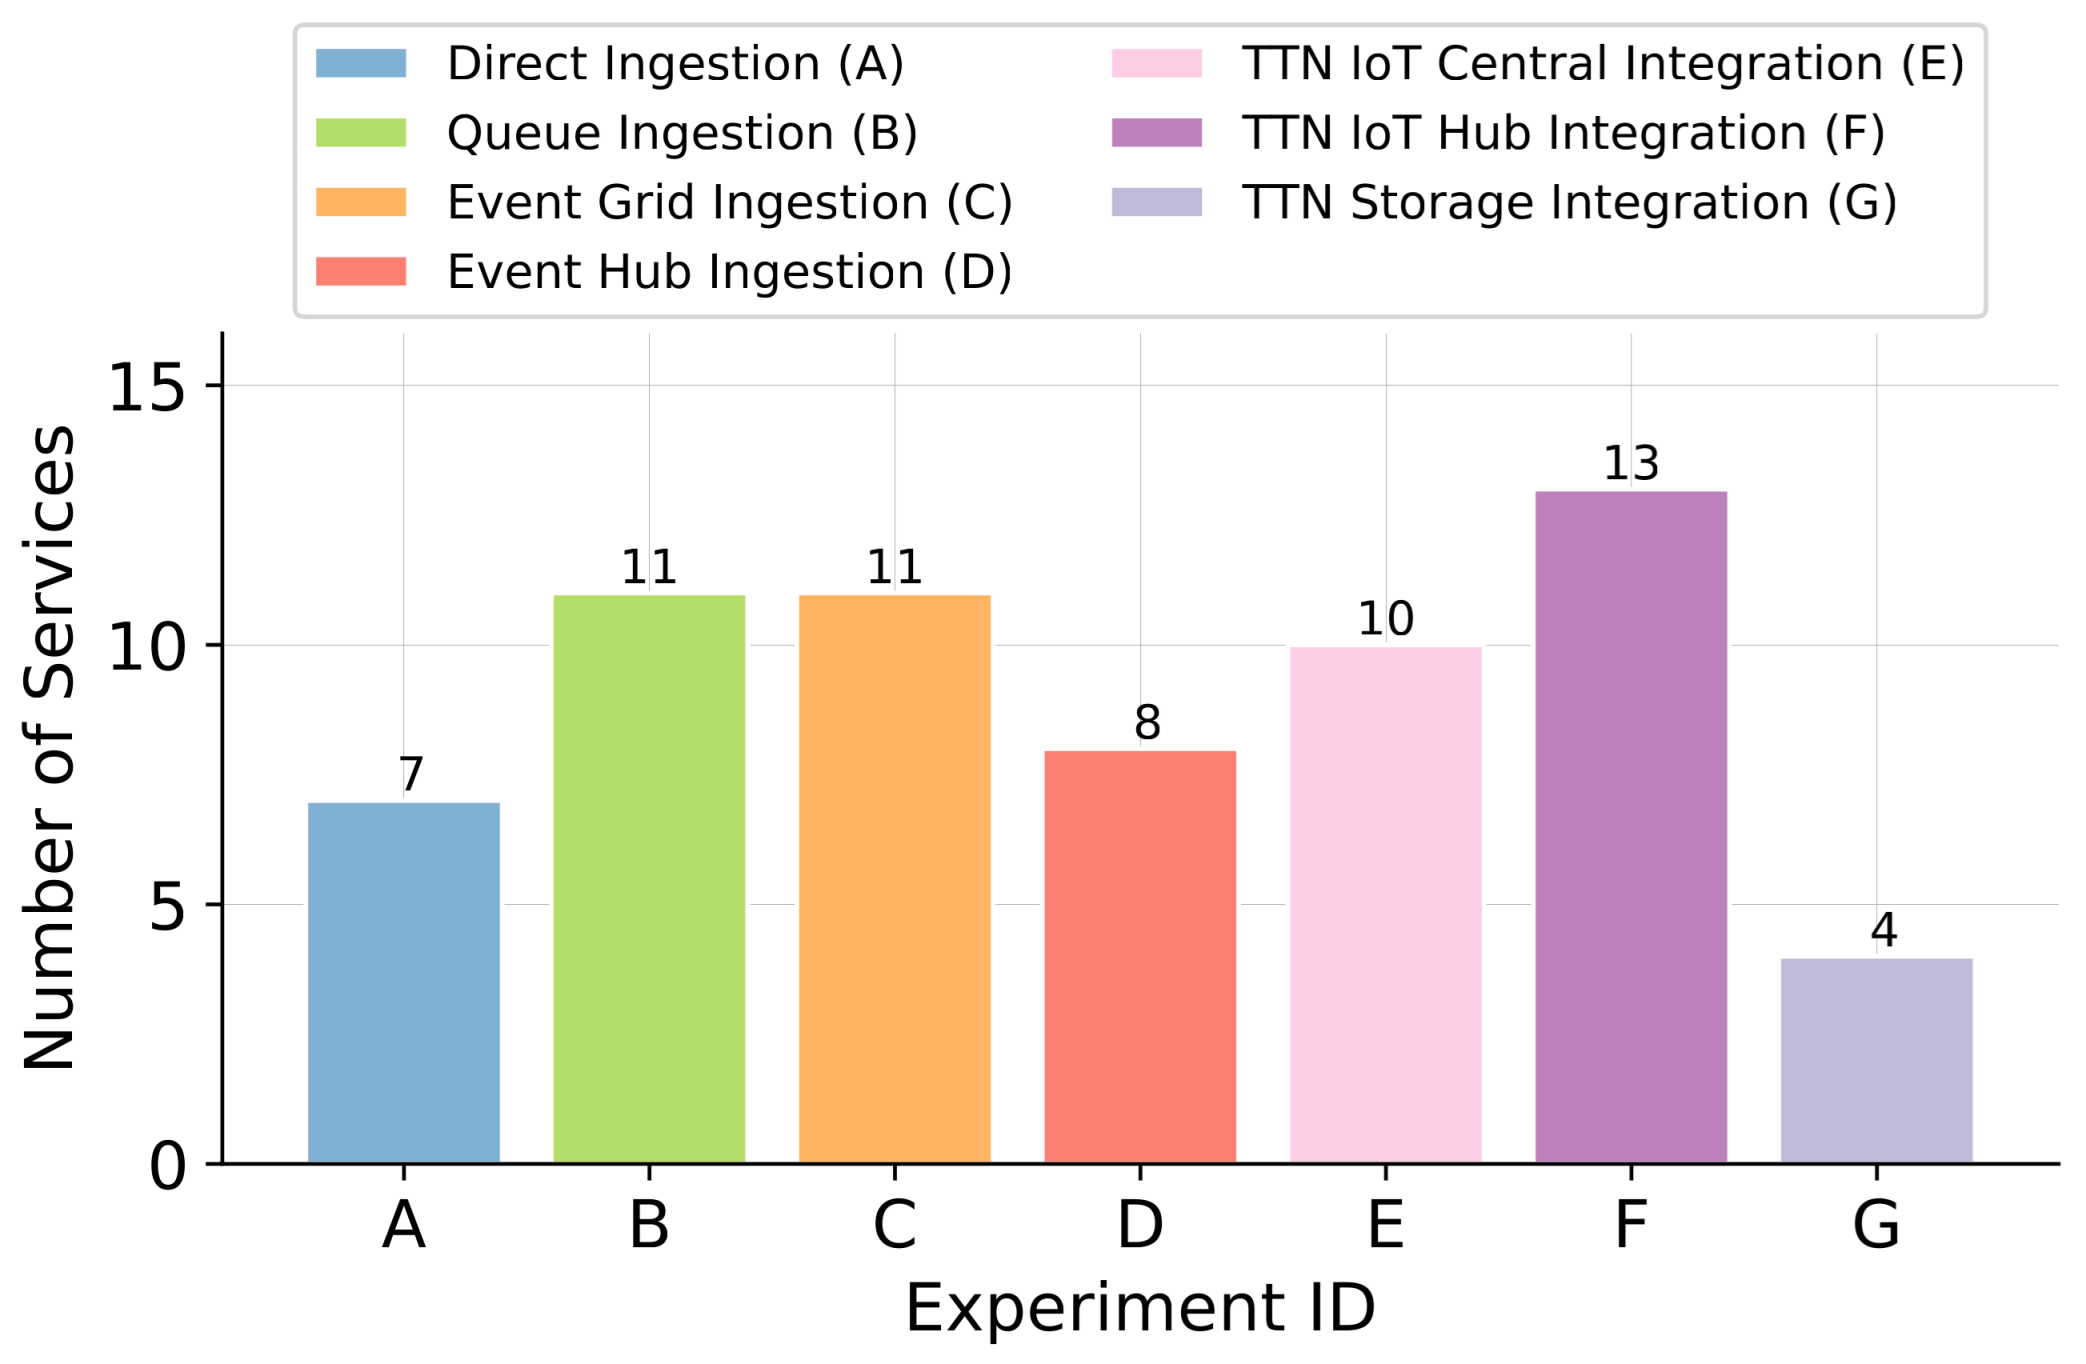
Data pipeline solutions with fewer services and lines of custom code are easier to design and maintain, and therefore preferable when compared with solutions with similar performance. We find that experiment G has the lowest number of lines of code (87), and experiment C has the highest number of lines of code (151). Experiment G also has the lowest number of service types (3), and total number of services (4). Experiment F was the data pipeline experiment with the highest number of service types (6) and total number of services (13). In
Figure 14, we show the total number of lines of Python code used in our data layer experiments as a proxy for design and maintenance effort. We show in
Figure 15 how many different service types each data layer architecture makes use of and in
Figure 16 what the total number of services of each data layer is.
5. Discussion
In our design and evaluation of serverless data layers, we found important tradeoffs in terms of successful ingestion rate (43.39% to 100%), average daily cost ($0.01/day to $2.42/day), median ingestion latency (1.77 s to 86.04 s), and solution complexity (87 to 151 lines of code, three to six Azure service types, and four to 13 total Azure services). These conclusions are specific to this experimental context (TTN network server interface, Azure-managed ingestion services, and Delta Lake persistence), where provider semantics and persistence behavior jointly shape observed outcomes.
To support designers navigating these tradeoffs, we discuss in this section: (1) the state-of-the-art context and comparability constraints; (2) approaches to reduce data loss and improve operational robustness; (3) downstream handling of duplicate messages; (4) scaling considerations with explicit separation of theoretical limits from demonstrated performance; (5) estimating object storage data egress costs; (6) key management and security considerations at the interface level; (7) factors that influence data layer selection for different application requirements; (8) an architecture design guide for data layers with similar characteristics to our study; and (9) the limitations and challenges of the present work.
5.1. State of the Art
A consistent theme across DT/CPS and IoT platform surveys is that data layer quality (latency, reliability, interoperability, operational effort) strongly influences whether deployments succeed outside the lab, yet comparative evidence across alternative data layer architectures remains limited. Prior studies often evaluate components (e.g., a messaging service or an IoT gateway) or evaluate end applications (dashboards, alerts, models) w ith platform-specific persistence choices, which makes controlled cross-architecture comparison difficult.
In our study, we attempted to reduce this comparability barrier by holding the persistence contract constant (Delta Lake on object storage) and comparing multiple serverless ingestion pathways under identical workload and metric definitions. However, direct numerical comparison with specific prior systems is still not possible because (i) benchmarking datasets for smart city IoT data layers are not standardized; (ii) service boundaries (what “counts” as ingestion completion) differ across studies; and (iii) different deployments use different network servers, buffering semantics, and storage layers. Therefore, we do not claim direct superiority over any single existing system. Instead, the value of the results is that they provide reproducible, application-grounded evidence for architecture selection within a realistic smart city deployment context, and they illustrate how designers can compare architectures using clearly defined layer interfaces and evaluation metrics.
5.2. Reducing Data Loss
We found that real-time, straightforward data pipelines, such as experiment A, using serverless functions might result in a poor successful ingestion rate if serverless functions take too long to execute (due to heavier computational tasks or cold start delays). In practice, webhook-based ingestion is sensitive to end-to-end acknowledgment timing: when the HTTP-triggered function does not respond within TTN’s expected window, TTN may flag the endpoint as unhealthy and can suspend delivery, amplifying missing data beyond individual timeout events. A way to improve the performance of serverless functions is to enable always-ready instances and increase the computing resources available to the function. Serverless functions can also face regional cloud services issues or downtime; therefore, enabling multi-region solutions can also increase the successful sensor data ingestion rate. However, enabling such features also increases the cost of the solution, and more experimental evaluations are required to verify the level of successful ingestion rate that can be achieved with this data layer architecture. A complementary design pattern is to decouple ingestion acknowledgment from persistence by introducing a durable buffer (queue/topic/stream) so that the webhook handler can acknowledge quickly while persistence occurs asynchronously.
For experiment B, we use a storage queue to reduce the execution time of the HTTP-triggered serverless function, resulting in lower data loss from 56.61% to 26.58% when compared to experiment A. However, a queue alone does not guarantee completeness unless retry policies, poison-message handling, and backpressure are configured to match bursty workloads. As in experiment A, using always-ready serverless function instances, increasing its computing resources, and enabling multi-region support can further reduce the data loss. Another way to reduce data loss in experiment B is to reduce queue writing latency by adopting the premium storage tier for the Azure Storage Account of the queue. Enabling such features also increases the cost of the experiment B data layer, and more experimental evaluations are required to measure their impact on successful ingestion rate.
In another outcome of our analysis, the IoT Central software as a service solution had a substantial number of sensor data messages lost during the evaluation period. We believe that our choice for the IoT Central service level as Standard Tier 1 was not sufficient to handle the sensor message rates, especially when messages are received within a brief time window. Choosing the Standard Tier 2 service level should improve the successful ingestion rate, but it would also result in higher costs for this data layer architecture.
For applications with a successful ingestion rate above 99%, but below 100%, data loss could have happened due to rare network or cloud provider issues that caused failed ingestions. Investigating these issues is out of the scope of this work, and we consider data layers with an above 99% successful ingestion rate as reliable solutions. When end-to-end completeness is mission-critical, designers may need additional reconciliation mechanisms (e.g., periodic backfill via TTN Storage Integration, idempotent upserts keyed by message identifiers, or audit-style completeness checks) to detect and recover missing events.
5.3. Downstream Handling of Duplicate Messages
IoT ingestion pipelines built on webhooks, pub/sub services, and event-streaming platforms typically provide at-least-once delivery semantics. Duplicate messages are therefore an expected operational condition rather than a failure mode. In our experiments, duplicates were explicitly quantified and observed only at very low frequency (
Section 4.1). Accordingly, duplicate messages were not treated as ingestion failures, as the successful ingestion rate is defined at the persistence boundary—whether a TTN-received message is durably stored—rather than at the application or analytics boundary.
Although duplication was negligible under the observed workload, it remains relevant for downstream analytics and cyber–physical system logic. In practice, correctness is commonly enforced downstream through idempotent processing, rather than by attempting to eliminate duplicates during ingestion. Idempotency is typically achieved by associating each message with a stable unique identifier (e.g., device identifier combined with a sequence number or network server message identifier) and ensuring that repeated processing of the same identifier does not alter the final system state.
When analytics-ready persistence is implemented using Delta Lake, de-duplication can be applied either at write time (e.g., conditional upserts keyed by message identifiers) or as a periodic reconciliation step using merge or window-based filtering operations. These approaches allow ingestion architectures to prioritize reliability and simplicity—accepting retries and occasional duplication—while preserving downstream correctness. Such a separation of concerns is well aligned with smart city IoT deployments, where data loss is often more detrimental than redundant data and where downstream batch or micro-batch processing can efficiently reconcile duplicates at scale.
5.4. Scaling the Number of Sensors
One relevant criterion for choosing a data pipeline is how it scales as new sensors and applications are added to the system. Data layer experiments A, B, and C use Azure serverless functions to interface with TTN, enabling them to spin up multiple function instances simultaneously. The discussion below focuses on theoretical scalability based on provider service limits and architectural reasoning; our experiments do not empirically validate performance beyond the deployed sensor scale. In general, function-triggered designs scale with (i) the concurrency the platform allows, (ii) the mean execution time per event, and (iii) how bursty events are in time. A simple back-of-the-envelope bound is that if a handler requires t seconds per message and the platform allows c concurrent instances, then the sustained throughput bound is on the order of messages per second, subject to trigger and downstream limits.
The total number of sensors that a serverless function can handle depends on the time that the function takes to run, and how sensor message events are spread in time. For instance, if it takes one minute to process a sensor message and sensors are programmed to send messages every 10 min, a total of 10 sensors can be in operation without ever having overlapped serverless function executions. While such reasoning is helpful for planning, it should not be interpreted as experimentally demonstrated capacity; real-world performance depends on trigger delivery semantics, cold starts, retry behavior, and downstream commit behavior (including Delta Lake commit/optimization effects).
In this previous example, a single serverless function interface service could handle up to 10,000 sensors. However, if the peak sensor data traffic is expected to surpass the maximum data handling limits of a single serverless function service, creating copies of the ingestion serverless function to serve groups of sensors is a straightforward solution to scale the infrastructure and support more sensor devices.
Architectures that include a dedicated event ingestion service (e.g., event streams) can provide more predictable buffering under bursts, but may introduce stepwise cost increases (throughput units, partitions, or reserved capacity) and can shift bottlenecks to the persistence layer. This coupling further motivates measuring ingestion and persistence together rather than assuming the storage layer is neutral.
Although each data layer architecture has built-in service capabilities to scale and handle data from multiple sensors, real-world, long-term evaluations are crucial to reveal practical limitations and complex system effects involving networking, cloud providers, and sensor network servers. The cost scaling also varies by application, with solutions that offer reserved bandwidth (Event Hubs, IoT Central, IoT Hub) having a step cost increase for each new service tier that allocates more bandwidth. Serverless function cost scales with the number of received messages, growing linearly with the number of executions when execution time and computational resources are kept constant.
5.5. Estimating Object Storage Egress Costs (Retrieval Workloads)
Our cost analysis attributes ingestion, compute, and storage charges to each architecture over the experiment window using Azure Cost Management, within an explicit boundary that excludes extensive egress benchmarking. In production, however, retrieval and egress can dominate total cost when applications frequently export data from object storage (e.g., dashboards, recurring analytics, model training, or cross-organization sharing). Because retrieval patterns are highly deployment-specific, we provide a transparent estimator that practitioners can apply using region- and tier-specific pricing.
Let
be the monthly data volume transferred out of Azure Blob Storage (GB/month) to the public Internet or to another cloud. Let
be the applicable egress unit price (USD/GB) for the deployment region and destination. A first-order monthly estimate is:
If an application performs q exports per month and each export transfers GB, then . For lakehouse-style Parquet tables, depends on (i) the time window retrieved, (ii) file/partition layout, and (iii) whether compaction/optimization reduces small-file overhead. In addition to egress, some deployments may incur request-based charges (e.g., per-read/list transactions) that depend on query frequency and file counts.
A practical estimation workflow is: (1) run representative queries/exports and record exported bytes (GB/query) from application telemetry or download logs; (2) multiply by expected frequency (queries/month) to estimate ; (3) apply region-/tier-specific to estimate ; and (4) optionally add request-based charges by estimating object reads/list operations per query.
This estimator highlights that architectures with similar ingestion costs can differ materially in total cost once retrieval dominates. For query-heavy deployments, ingestion and retrieval should be evaluated together (including table optimization cadence and file layout) when selecting an IoT data layer architecture.
5.6. Key Management for Communication Security
As security features, serverless functions offer service keys that are generated at the deployment time and are then used to validate execution requests. For our data pipeline evaluations using serverless functions, we used the generated Function keys in the TTN webhook integration, so the serverless functions could be triggered by TTN. For the event hub service, an ID token was generated and used in TTN’s webhook integration. IoT Central and IoT hub integrations followed TTN’s guidance steps, sharing keys between Azure and TTN. For TTN Storage API, an API key is generated in TTN and used in the serverless function that periodically queries stored data. Keeping keys private and periodically generating new keys is important to keep the communication between the sensor network server and the cloud application secure.
Operationally, this suggests two best practices for production deployments: (i) store secrets in a managed secret store (e.g., a cloud key vault) and avoid embedding keys in function code or configuration files and (ii) implement key rotation procedures and least-privilege policies for tokens used to publish events or write to storage. While a full security analysis is out of this study’s scope, these practices reduce the risk that compromised credentials enable unauthorized event injection or data exfiltration.
5.7. Data Layer Selection
For the seven architectures that we analyzed, the lowest cost solution with the best rate of successfully ingested sensor data was experiment G using the TTN storage integration. This data pipeline executes a serverless function every six hours that queries sensor data in TTN and updates a stored delta table in Azure. The significantly lower rate of computing and storage operations results in cloud infrastructure costs below one cent per day. This method is ideal for moving historical data, as it is reliable and cost-effective. However, experiment G is not suited for time-critical applications, since TTN only loads data to its storage integration in batches, and frequently querying the storage integration service can cause overhead on their servers, being subject to higher latencies with service throttling.
For applications where sensor data ingestion delay is critical, the data pipelines of experiments C, D, and F are indicated, since the successfully ingested data rate is above 99%. Among these three data pipeline architectures, experiment C is the best cost–benefit for a real-time data pipeline solution with the lowest cost per successful ingested message, and experiment D is the best choice for maximum reliability. In applications where downstream analytics require frequent data export or interactive querying, designers should additionally consider egress charges and retrieval workload, which can change the effective cost ranking even when ingestion costs are similar.
For many applications, the ideal architecture could be two parallel serverless data pipelines: a first solution acquiring historical data with low cost and high reliability and a second data pipeline to be activated only when real-time data is required. This combined solution can reduce costs while providing a reliable data layer service for CPS IoT applications. A practical implementation of this idea is to operate a low-cost periodic backfill (e.g., TTN Storage Integration) alongside a real-time stream, using message identifiers to reconcile and de-duplicate events in the persistence layer when needed.
Beyond data ingestion, the suggested TTN integrations (Exp. E, IoT Central; Exp. F, IoT Hub) also offer device management, state tracking, and downlink messaging. These features might justify a higher data layer cost if a smart city IoT application requires adding or removing sensors, monitoring and updating device states, or sending downlink messages to devices. Similarly, platform portability may influence selection: architectures built from widely available primitives (HTTP endpoints, queues, pub/sub, object storage, open table formats) are typically easier to migrate across providers than managed IoT SaaS offerings, although migration still incurs configuration and operational cost.
5.8. Architecture Decision Guide (Synthesis)
A key goal of this study is to support engineering-style selection among realistic serverless IoT data layer architectures under a clearly defined service boundary. Based on the observed tradeoffs in successful ingestion rates (
Section 4.1), median ingestion latencies (
Section 4.3), costs within the stated boundary (
Section 4.2), and implementation/operational complexity proxies (
Section 4.4), we summarize practical selection guidance in
Table 1.
These recommendations are contingent on the pilot-scale workload and should be re-evaluated for deployments with higher message rates, greater burstiness, stricter real-time constraints, or different payload characteristics using the same metric definitions and measurement boundaries.
5.9. Limitations
We identify several limitations that constrain the generalization of the reported results:
Platform and service-boundary specificity: All experiments were conducted using TTN as the network server and Microsoft Azure services for ingestion and persistence. Service semantics (timeouts, trigger delivery, buffering), regional availability, and pricing differ across providers, so absolute cost and latency values may not transfer directly to other cloud providers.
Experimental scale: The workload reflects a pilot-scale deployment (nine sensors, three TTN applications, 21 days). While representative of many early smart city deployments, behavior may change under higher message rates, burstier traffic, different payload sizes, or stricter real-time constraints.
Latency measurement uncertainty: Ingestion latency is reported as an optimistic estimate derived from matching TTN timestamps with Delta Lake commit times. Because clocks originate from different systems, synchronization error and commit coalescing can introduce bias.
Persistence coupling (Delta Lake is not neutral): Although Delta Lake standardizes the persistence interface, its transaction/commit behavior, small-file dynamics, and optimization cadence influence observed ingestion performance and cost. Therefore, ingestion and persistence should be interpreted as a coupled system rather than separable components.
Cost completeness: The cost analysis focuses on ingestion, compute, and storage charges attributable to each resource group. Egress costs can dominate in query-heavy applications; we discuss this factor qualitatively and provide estimates in
Section 5, but extensive egress benchmarking was out of scope.
Failure mode attribution: When data loss occurs, multiple causes are plausible (webhook timeout, cold start, transient regional issues, TTN suspension policy, service throttling). We report outcomes at the architecture level, but do not claim a complete root–cause analysis for each missing message.
Complexity metrics limitations: The proxy metrics used to assess solution complexity (number of service types, total services, and number of lines of Python code; see
Section 4.4) enable consistent comparison across architectures but do not capture configuration dependencies between services, ongoing maintenance effort, or the operational complexity of deploying, monitoring, and evolving cloud-based data layer architectures.
6. Conclusions
We show in our experiments that a simple data layer architecture using a serverless function to interface with a data buffer (experiment G, using TTN storage integration) can provide the lowest cost for batched data ingestion every 6 h ($0.05 per 10,000 successful message ingestion), roughly 100 times cheaper than the lowest cost live data ingestion data layer (experiment A, using a single serverless function and costing $5.08 per 10,000 successful message ingestion). This result implies that IoT systems that buffer data at the edge (or at the network server) can support much more cost-effective data layers for applications not requiring live data. However, the batching interval dominates timeliness in this architecture, so it is most appropriate for archival and non-time-critical use cases.
For smart city IoT solutions demanding live data ingestion, we find that some of our evaluated data layer architectures show significant data loss (experiments A, B, and E), with only one data layer solution reaching a 100% successful ingestion rate (experiment D) at the cost of ($10.20 per 10,000 successful ingestion operations). If ingesting each IoT message is critically important for the application, the data layer architecture of Experiment D (Azure Event Hubs ingestion) can provide the best chances of successfully ingesting messages. If ingesting each data message is important, but not critical for the application, the data layer of experiment C (Azure Event Trigger service) can provide the most cost-effective solution ($6.80 per 10,000 successful ingestion operations) while still achieving a 99.85% successful ingestion rate. These examples show a tradeoff between cost and performance, where choosing a data layer with a less strict successful message ingestion rate (experiment C) represents a cost reduction of roughly 33% when compared to the cost of the data layer with the highest successful ingestion rate (experiment D). These comparisons should be interpreted within the specific service boundaries of this study (TTN + Azure-managed ingestion + Delta Lake persistence) and under the observed pilot-scale workload.
Finally, we acknowledge that designing or selecting data layers is a challenging task for smart city IoT application developers due to the vast number of services, solutions, and integration possibilities. Our approach to this challenge was to define a set of requirements for our data layer, narrowing it down to managed services of a cloud provider (Azure) with a clear data source (TTN) and a standard data storage format (Delta Lake on object storage). This way, data layer implementations could be directly compared on objective metrics that consider effects of the complete system. The primary contribution of this work is therefore an experimentally grounded architecture decision-making guide, rather than a novel benchmarking methodology. We believe that future work can use this same approach to analyze data layer solutions with new architectures or hosted on other cloud platforms. Future evaluations should extend to larger deployments, more explicit failure mode attribution, more accurate end-to-end latency instrumentation, and deeper cost analysis under query/egress-heavy retrieval workloads. We envision a near future where designers can choose between thoroughly tested data layer solutions that fit their application requirements and constraints, enabling quick development of successful smart city IoT applications.