Auditory Countermeasures for Sleep Inertia: Exploring the Effect of Melody and Rhythm in an Ecological Context


Abstract
:1. Introduction
2. Results
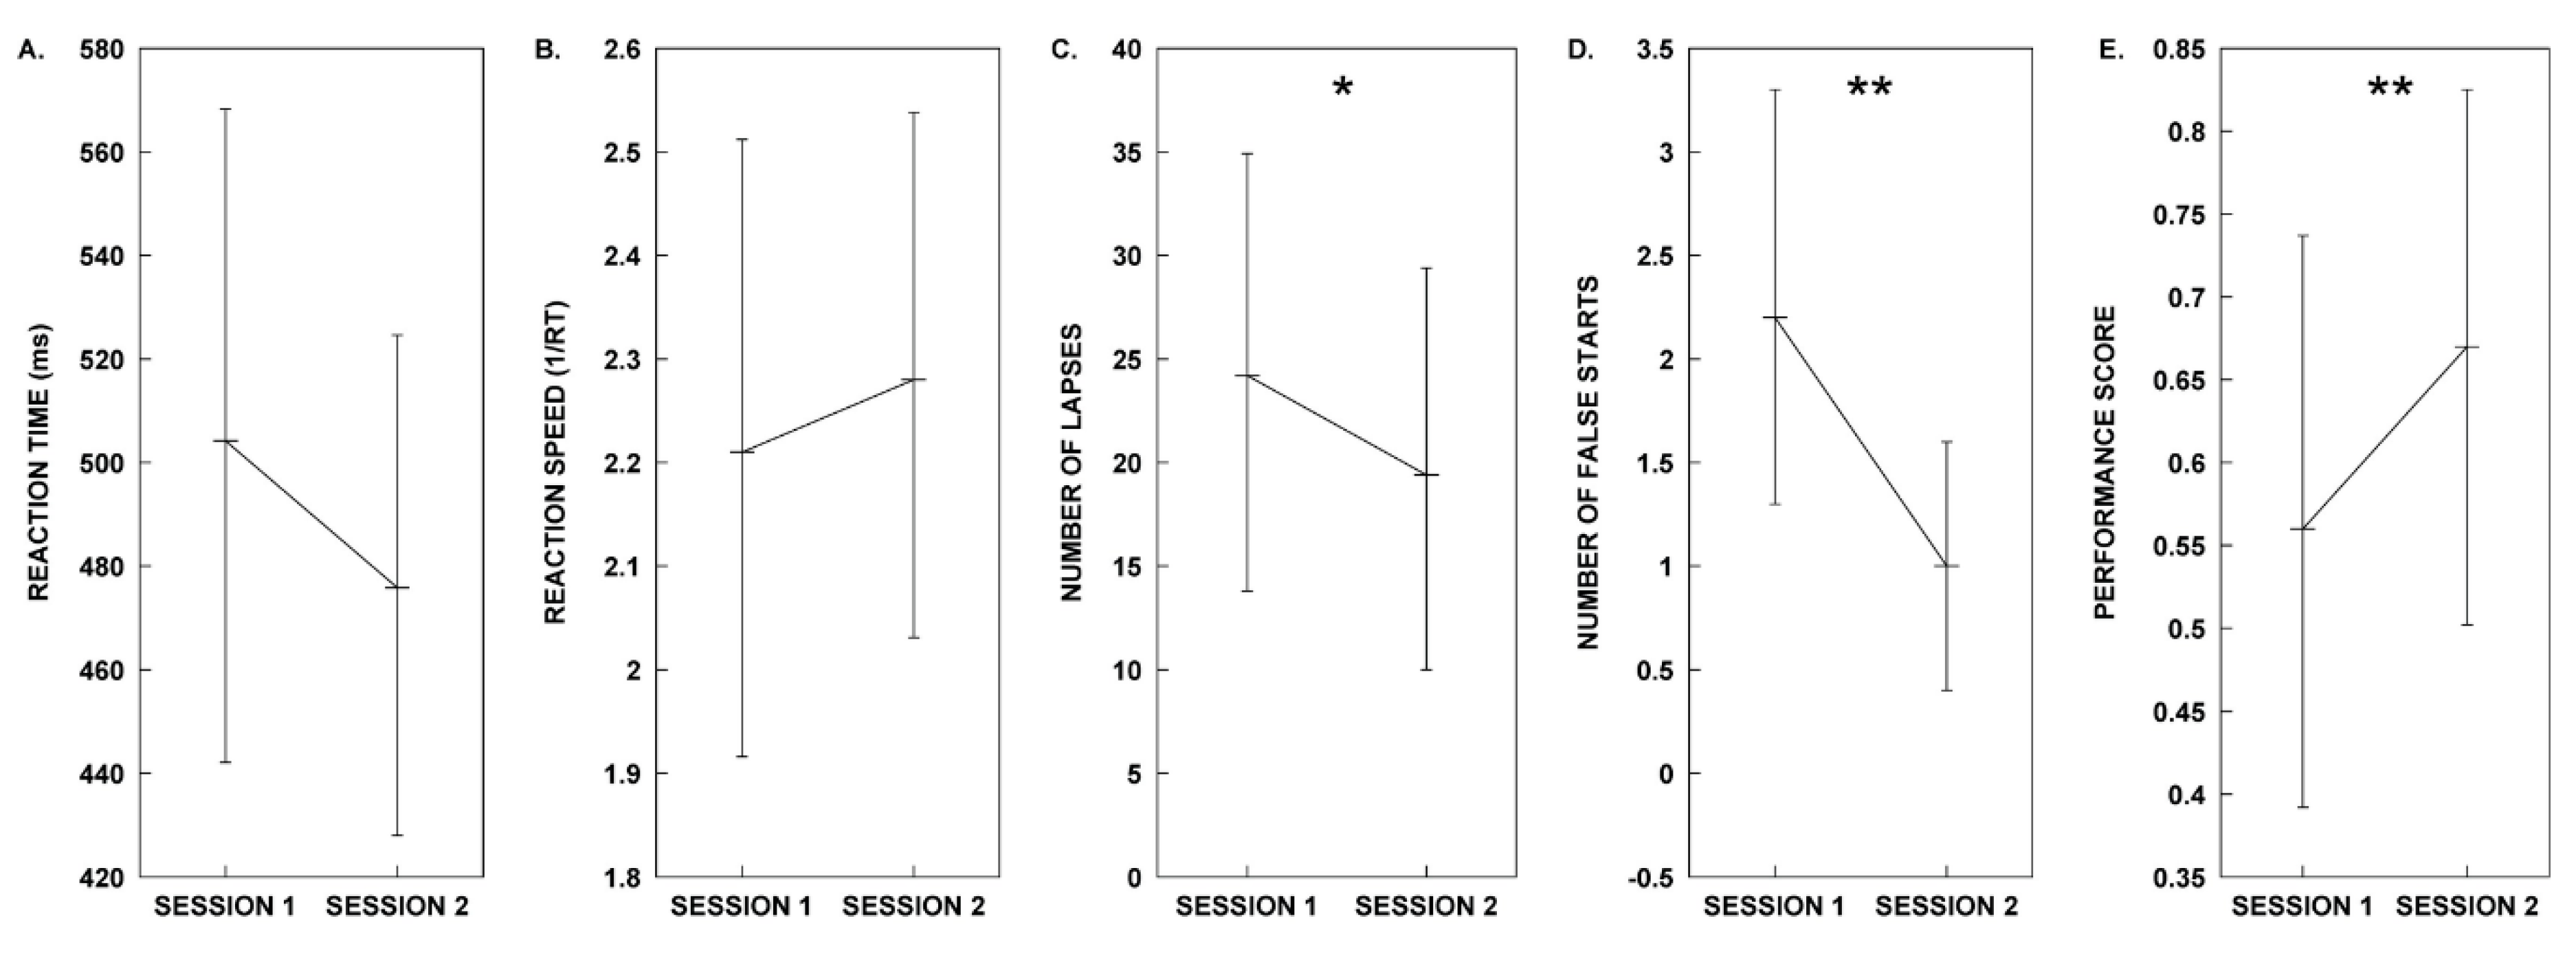
2.1. Test Group A: Melody Stimulus
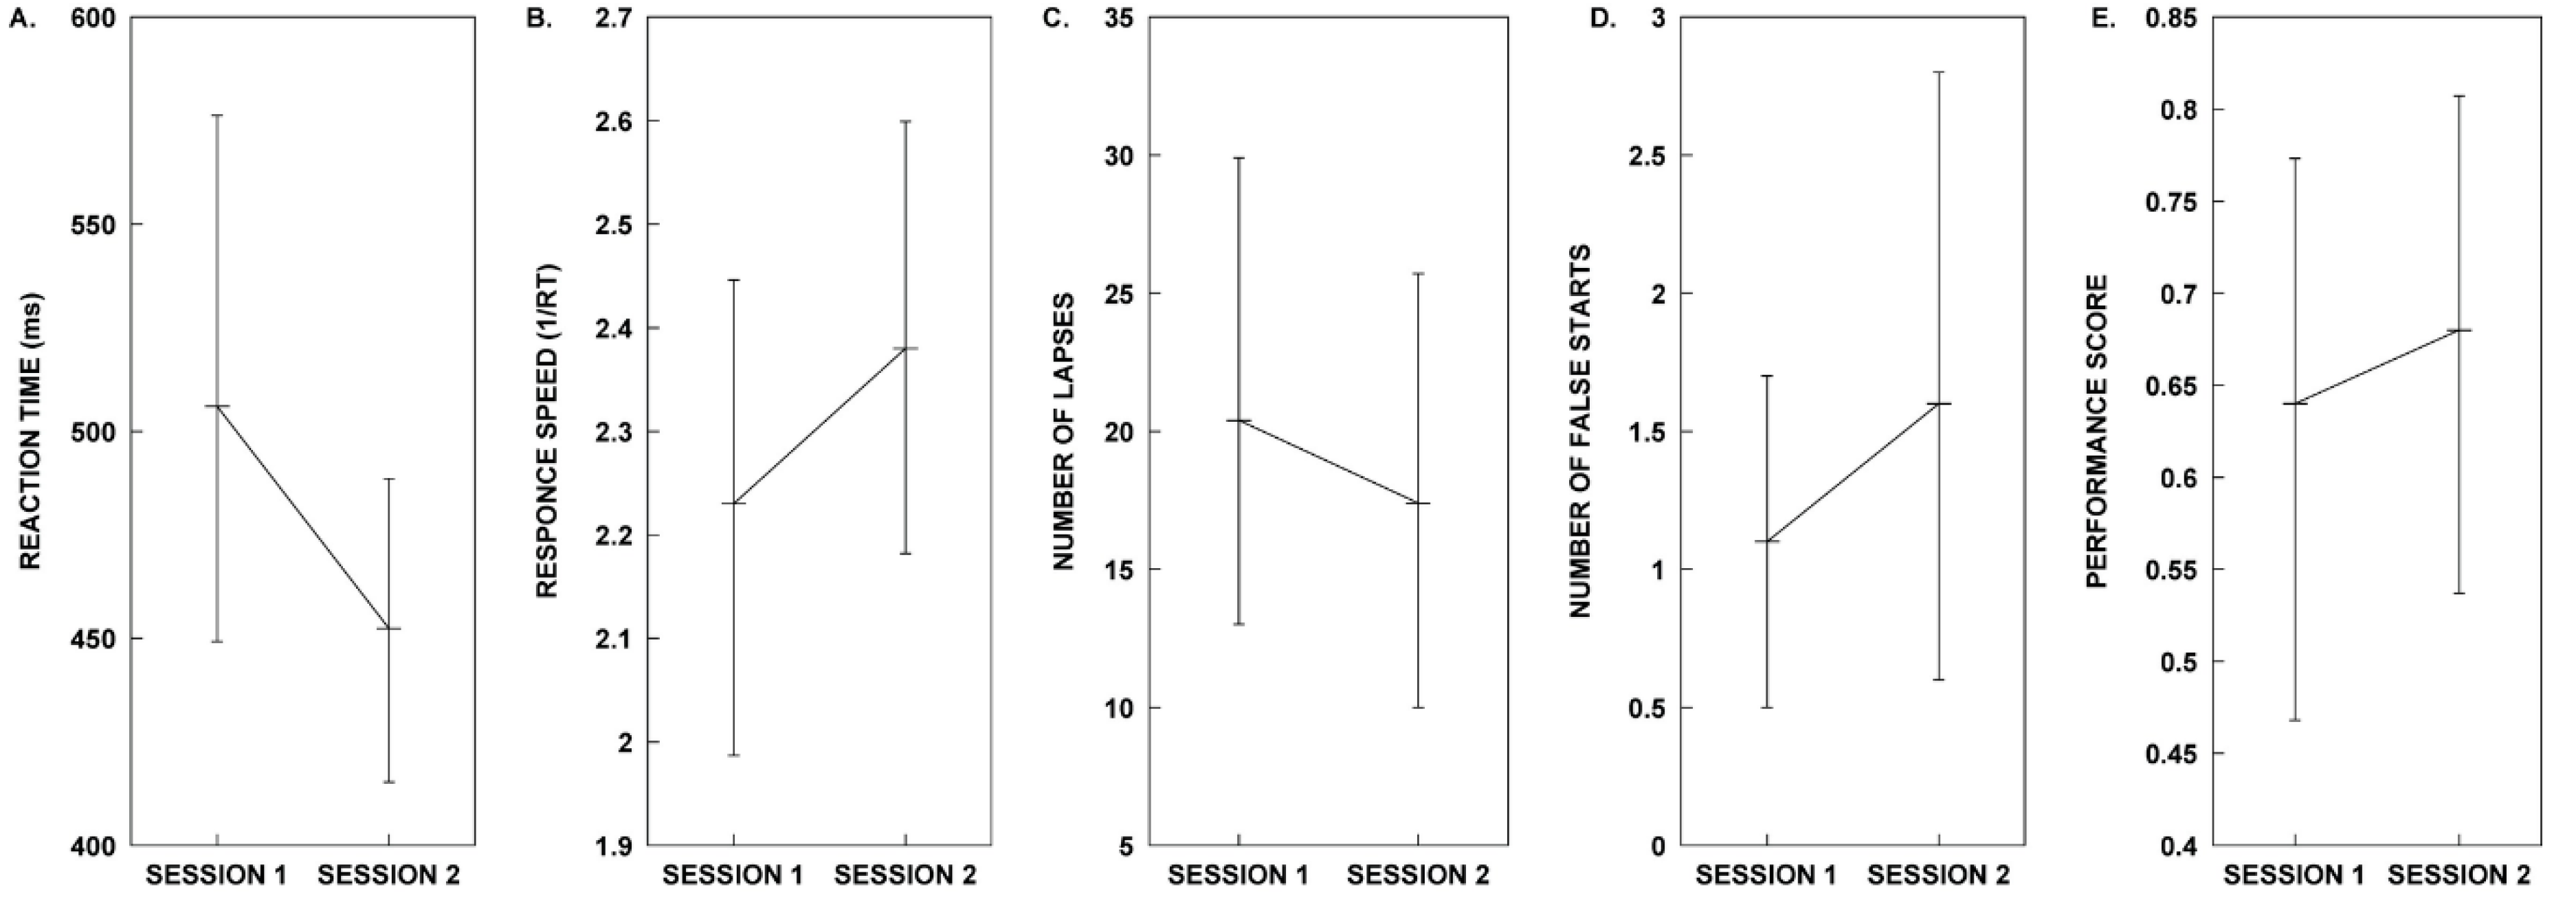
2.2. Test Group B: Rhythm Stimulus
3. Discussion
4. Materials and Methods
4.1. Ethics Statement
4.2. Participants
4.3. Data Collection
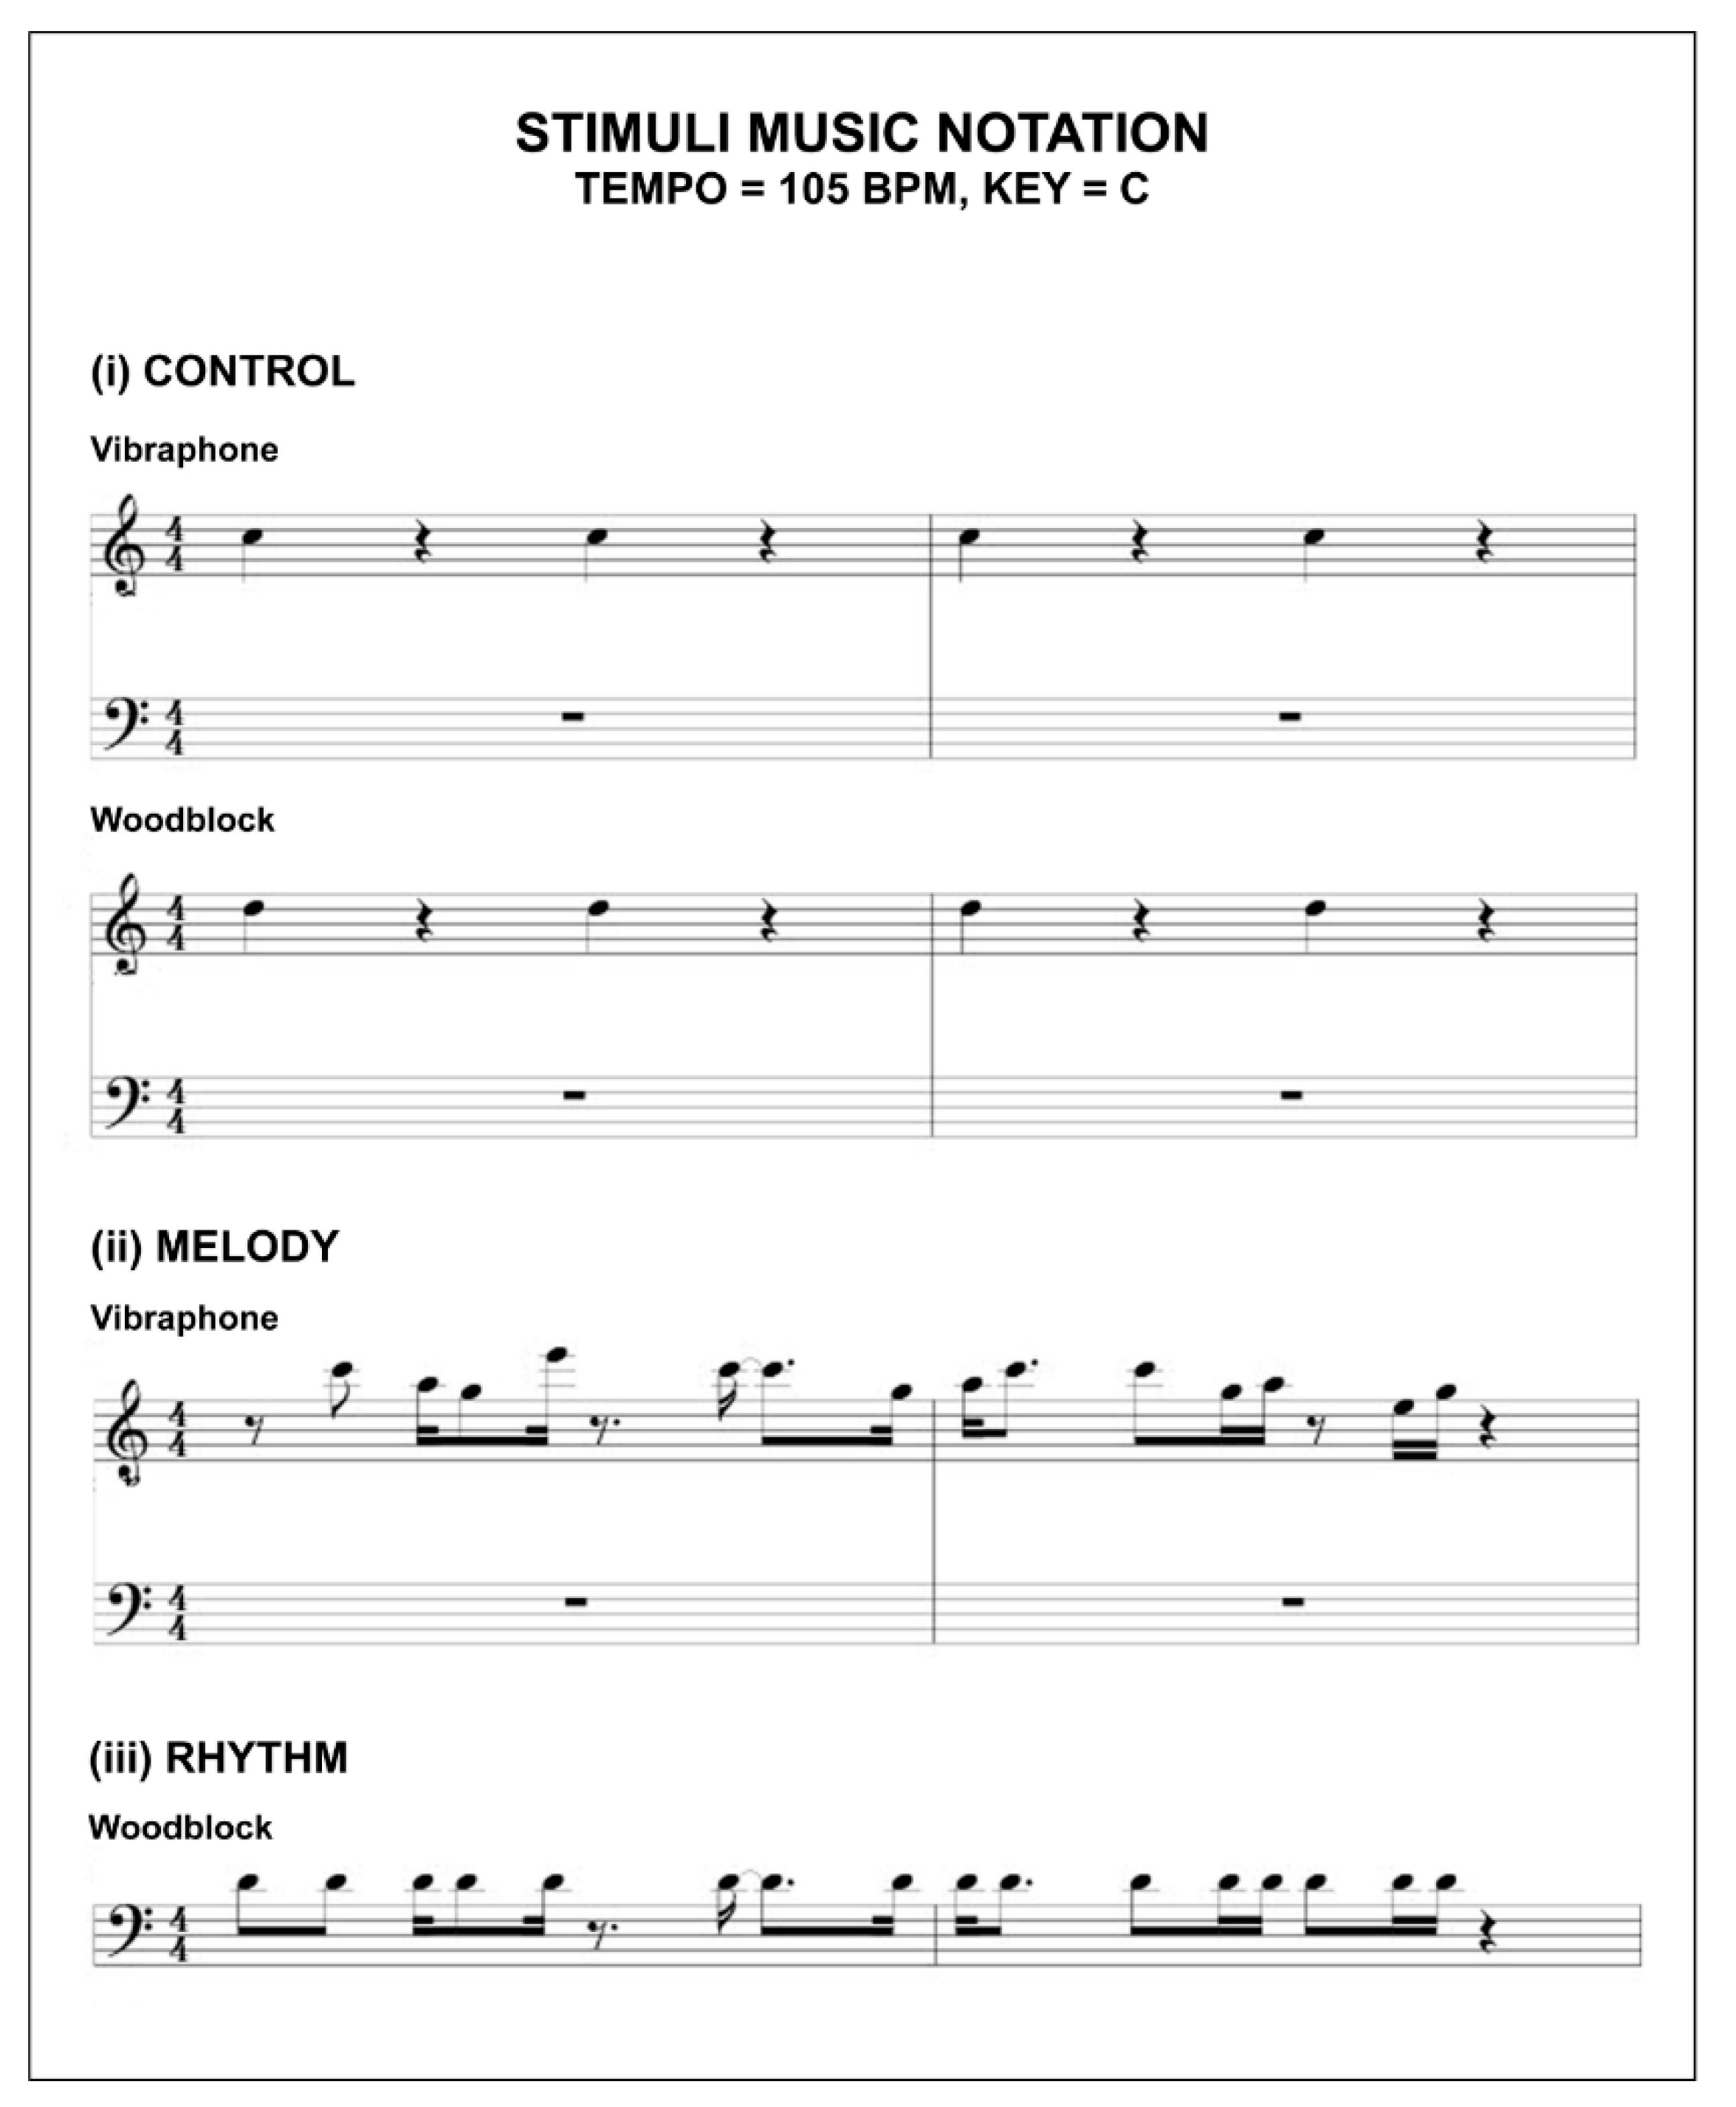
4.4. Test Stimulus—Design and Description
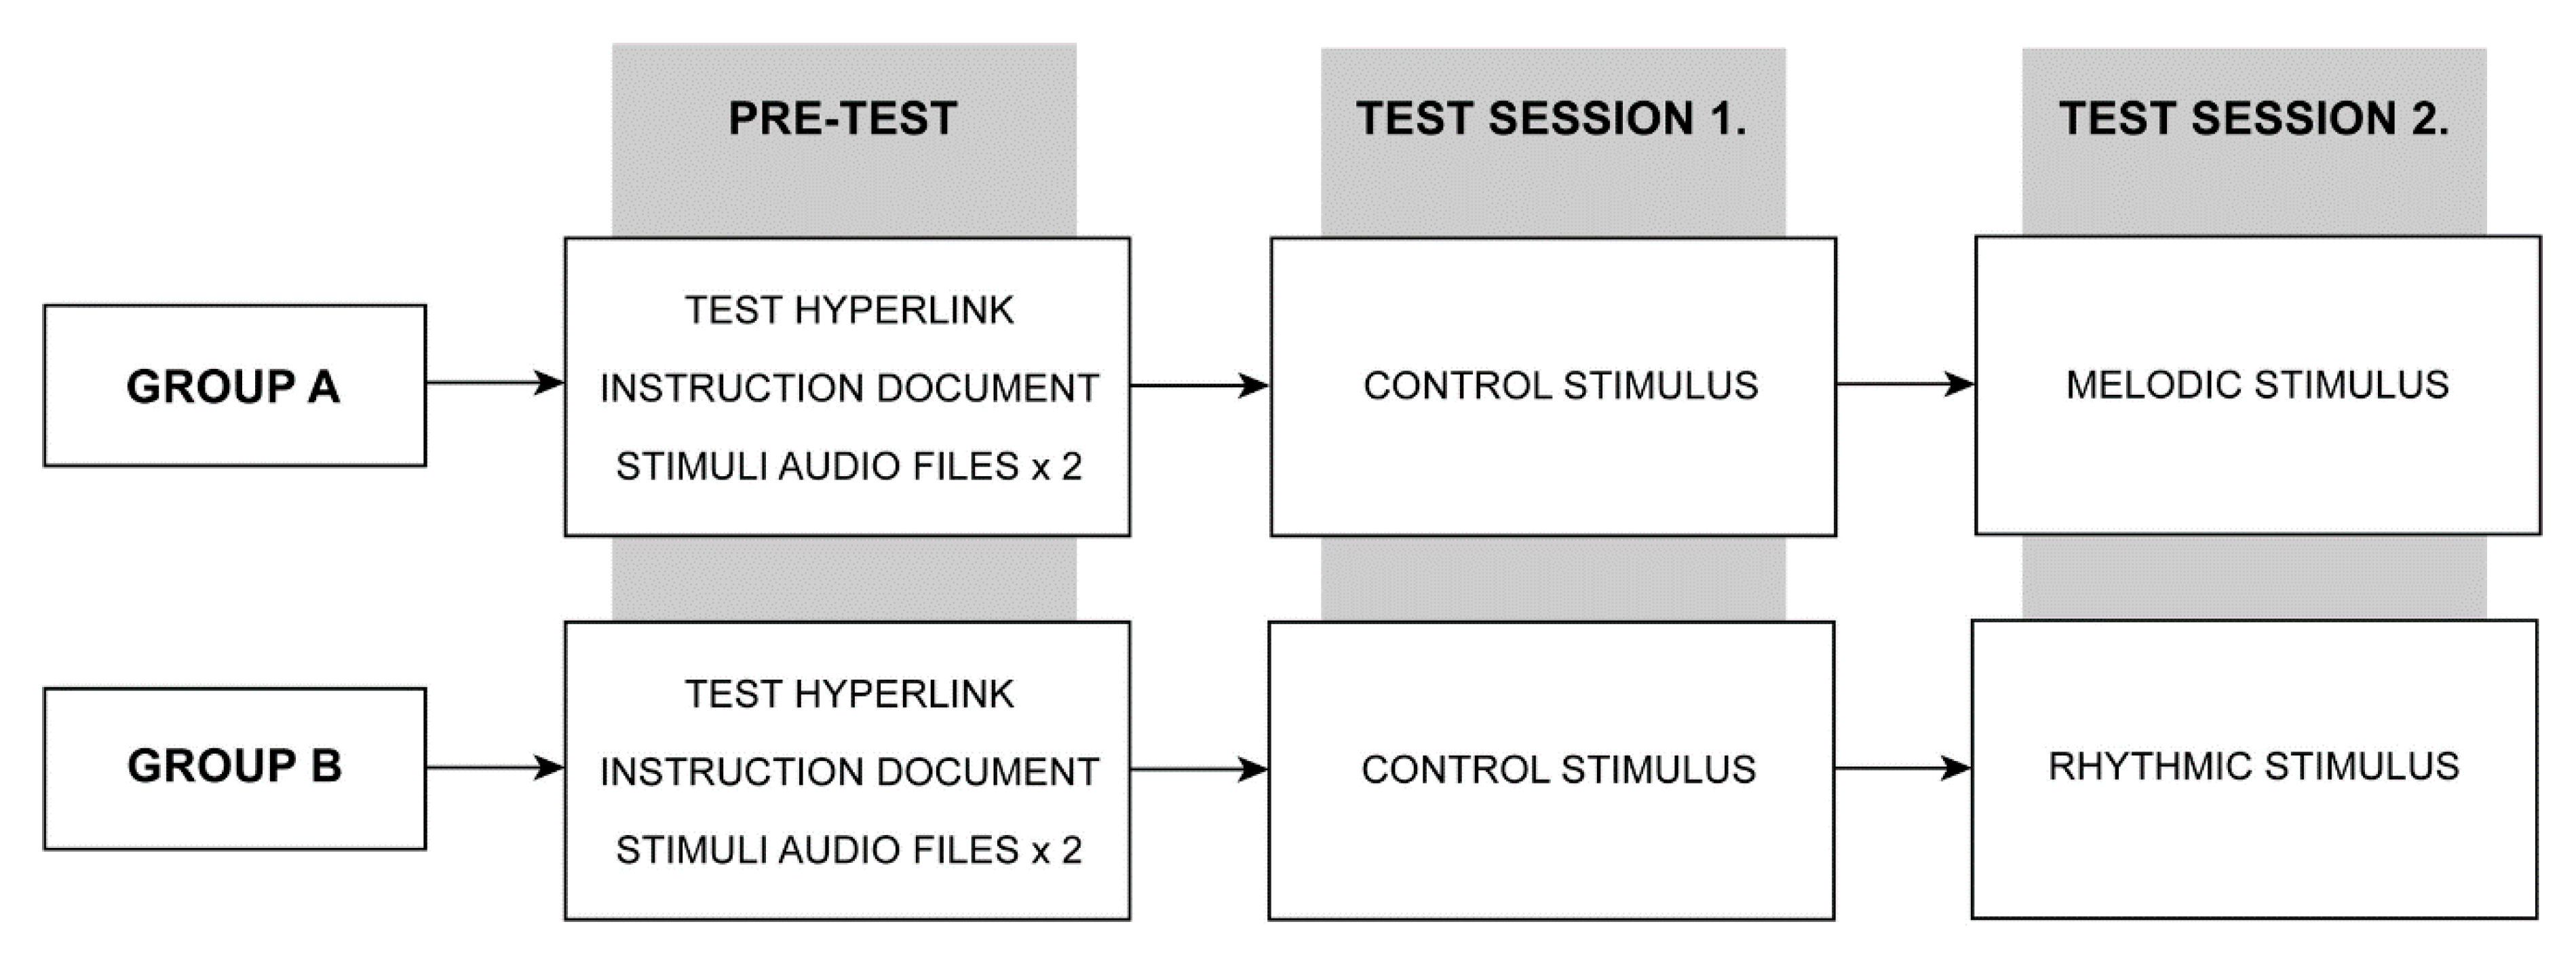
4.5. Study Design
4.6. Statistical Analysis
Supplementary Materials
Author Contributions
Funding
Conflicts of Interest
References
- Trotti, L.M. Waking up is the hardest thing I do all day: Sleep inertia and sleep drunkenness. Sleep Med. Rev. 2017, 35, 76–84. [Google Scholar] [CrossRef] [PubMed]
- Hilditch, C.J.; McHill, A.W. Sleep inertia: Current insights. Nat. Sci. Sleep 2019, 11, 155. [Google Scholar] [PubMed] [Green Version]
- Tassi, P.; Muzet, A. Sleep inertia. Sleep Med. Rev. 2000, 4, 341–353. [Google Scholar] [CrossRef] [PubMed]
- Wertz, A.T.; Ronda, J.M.; Czeisler, C.A.; Wright, K.P., Jr. EFfects of sleep inertia on cognition. JAMA 2006, 295, 163–164. [Google Scholar] [CrossRef] [PubMed]
- Wilkinson, R.T.; Stretton, M. Performance after awakening at different times of night. Psychon. Sci. 1971, 23, 283–285. [Google Scholar] [CrossRef]
- Sallinen, M.; HÄRmÄ, M.; ÅKerstedt, T.; Rosa, R.; Lillqvist, O. Promoting alertness with a short nap during a night shift. J. Sleep Res. 1998, 7, 240–247. [Google Scholar] [CrossRef]
- Jewett, M.E.; Wyatt, J.K.; Ritz-De Cecco, A.; Khalsa, S.B.; Dijk, D.J.; Czeisler, C.A. Time course of sleep inertia dissipation in human performance and alertness. J. Sleep Res. 1999, 8, 1–8. [Google Scholar] [CrossRef]
- Dinges, D.F. Are you awake? Cognitive performance and reverie during the hypnopompic state. In Sleep and Cognition; American Psychological Association: Washington, DC, USA, 1990; pp. 159–175. [Google Scholar] [CrossRef]
- Brooks, A.; Lack, L. A brief afternoon nap following nocturnal sleep restriction: Which nap duration is most recuperative? Sleep 2006, 29, 831–840. [Google Scholar] [CrossRef] [Green Version]
- Van Dongen, H.P.; Price, N.J.; Mullington, J.M.; Szuba, M.P.; Kapoor, S.C.; Dinges, D.F. Caffeine eliminates psychomotor vigilance deficits from sleep inertia. Sleep 2001, 24, 813–819. [Google Scholar] [CrossRef]
- Signal, T.L.; van den Berg, M.J.; Mulrine, H.M.; Gander, P.H. Duration of sleep inertia after napping during simulated night work and in extended operations. Chronobiol. Int. 2012, 29, 769–779. [Google Scholar] [CrossRef]
- Santhi, N.; Groeger, J.A.; Archer, S.N.; Gimenez, M.; Schlangen, L.J.M.; Dijk, D.J. Morning Sleep Inertia in Alertness and Performance: Effect of Cognitive Domain and White Light Conditions. PLoS ONE 2013, 8, e79688. [Google Scholar] [CrossRef] [PubMed] [Green Version]
- Bruck, D.; Pisani, D.L. The effects of sleep inertia on decision-making performance. J. Sleep Res. 1999, 8, 95–103. [Google Scholar] [CrossRef] [PubMed]
- Horne, J.; Moseley, R. Sudden early-morning awakening impairs immediate tactical planning in a changing ‘emergency’scenario. J. Sleep Res. 2011, 20, 275–278. [Google Scholar] [CrossRef] [PubMed]
- Hilditch, C.J.; Dorrian, J.; Banks, S. Time to wake up: Reactive countermeasures to sleep inertia. Ind. Health 2016, 54, 528–541. [Google Scholar] [CrossRef] [PubMed] [Green Version]
- Centofanti, S.A.; Dorrian, J.; Grant, C.; Stepien, J.; Coates, A.; Lushington, K.; Evans, A.; Reuter Lange, S.; Banks, S. 0200 The Effectiveness Of Caffeine Gum In Reducing Sleep Inertia Following A 30min Nighttime Nap Opportunity: Preliminary Results. Sleep 2018, 41, A78. [Google Scholar] [CrossRef] [Green Version]
- Reyner, L.A.; Horne, J.A. Suppression of sleepiness in drivers: Combination of caffeine with a short nap. Psychophysiology 1997, 34, 721–725. [Google Scholar] [CrossRef]
- Hayashi, M.; Masuda, A.; Hori, T. The alerting effects of caffeine, bright light and face washing after a short daytime nap. Clin. Neurophysiol. Off. J. Int. Fed. Clin. Neurophysiol. 2003, 114, 2268–2278. [Google Scholar] [CrossRef]
- Newman, R.A.; Kamimori, G.H.; Wesensten, N.J.; Picchioni, D.; Balkin, T.J. Caffeine gum minimizes sleep inertia. Percept. Mot. Ski. 2013, 116, 280–293. [Google Scholar] [CrossRef]
- Figueiro, M.G.; Sahin, L.; Roohan, C.; Kalsher, M.; Plitnick, B.; Rea, M.S. Effects of red light on sleep inertia. Nat. Sci. Sleep 2019, 11, 45–57. [Google Scholar] [CrossRef] [Green Version]
- Geerdink, M.; Walbeek, T.J.; Beersma, D.G.M.; Hommes, V.; Gordijn, M.C.M. Short Blue Light Pulses (30 Min) in the Morning Support a Sleep-Advancing Protocol in a Home Setting. J. Biol. Rhythm. 2016, 31, 483–497. [Google Scholar] [CrossRef]
- Gabel, V.; Maire, M.; Reichert, C.F.; Chellappa, S.L.; Schmidt, C.; Hommes, V.; Viola, A.U.; Cajochen, C. Effects of artificial dawn and morning blue light on daytime cognitive performance, well-being, cortisol and melatonin levels. Chronobiol. Int. 2013, 30, 988–997. [Google Scholar] [CrossRef] [PubMed] [Green Version]
- Kräuchi, K.; Cajochen, C.; Wirz-Justice, A. Waking up properly: Is there a role of thermoregulation in sleep inertia? J. Sleep Res. 2004, 13, 121–127. [Google Scholar] [CrossRef] [PubMed]
- Krauchi, K.; Knoblauch, V.; Wirz-Justice, A.; Cajochen, C. Challenging the sleep homeostat does not influence the thermoregulatory system in men: Evidence from a nap vs. sleep-deprivation study. Am. J. Physiol. Regul. Integr. Comp. Physiol. 2006, 290, R1052–R1061. [Google Scholar] [CrossRef] [PubMed] [Green Version]
- Kaplan, K.A.; Talavera, D.C.; Harvey, A.G. Rise and shine: A treatment experiment testing a morning routine to decrease subjective sleep inertia in insomnia and bipolar disorder. Behav. Res. Ther. 2018, 111, 106–112. [Google Scholar] [CrossRef] [PubMed]
- Tassi, P.; Nicolas, A.; Dewasmes, G.; Eschenlauer, R.; Ehrhart, J.; Salame, P.; Muzet, A.; Libert, J.P. Effects of Noise on Sleep Inertia as a Function of Circadian Placement of a One-Hour Nap. Percept. Mot. Ski. 1992, 75, 291–302. [Google Scholar] [CrossRef]
- Hayashi, M.; Uchida, C.; Shoji, T.; Hori, T. The effects of the preference for music on sleep inertia after a short daytime nap. Sleep Biol. Rhythm. 2004, 2, 184–191. [Google Scholar] [CrossRef]
- McFarlane, S.J.; Garcia, J.E.; Verhagen, D.S.; Dyer, A.G. Alarm tones, music and their elements: Analysis of reported waking sounds to counteract sleep inertia. PLoS ONE 2020, 15, e0215788. [Google Scholar] [CrossRef] [Green Version]
- Jay, S.M.; Carley, D.M.; Aisbett, B.; Ferguson, S.A.; Paterson, J.L. Can stress act as a sleep inertia countermeasure when on-call? Biol. Rhythm Res. 2019, 50, 429–439. [Google Scholar] [CrossRef]
- Floyd, M. Almost 60% of 16-34 Year Olds Use a Phone as Their Primary Timepiece; YouGov. Available online: https://today.yougov.com/topics/lifestyle/articles-reports/2011/05/05/brother-do-you-have-time (accessed on 2 November 2018).
- Cohen, J. Statistical Power Analysis for the Behavioral Sciences; Lawrence Erlbaum Associates: Mahwah, NJ, USA, 2013; ISBN 1-134-74270-3. [Google Scholar]
- Tassi, P.; Bonnefond, A.; Engasser, O.; Hoeft, A.; Eschenlauer, R.; Muzet, A. EEG spectral power and cognitive performance during sleep inertia: The effect of normal sleep duration and partial sleep deprivation. Physiol. Behav. 2006, 87, 177–184. [Google Scholar] [CrossRef]
- Hirshkowitz, M.; Whiton, K.; Albert, S.M.; Alessi, C.; Bruni, O.; DonCarlos, L.; Hazen, N.; Herman, J.; Katz, E.S.; Kheirandish-Gozal, L.; et al. National Sleep Foundation’s sleep time duration recommendations: Methodology and results summary. Sleep Health J. Natl. Sleep Found. 2015, 1, 40–43. [Google Scholar] [CrossRef]
- Kaida, K.; Abe, T. Attentional lapses are reduced by repeated stimuli having own-name during a monotonous task. PLoS ONE 2018, 13, e0194065. [Google Scholar] [CrossRef] [PubMed] [Green Version]
- Nittono, H.; Tsuda, A.; Akai, S.; Nakajima, Y. Tempo of background sound and performance speed. Percept. Mot. Ski. 2000, 90, 1122. [Google Scholar] [CrossRef] [PubMed]
- Amezcua, C.; Guevara, M.A.; Ramos-Loyo, J. Effects of Musical Tempi on Visual Attention Erps. Int. J. Neurosci. 2005, 115, 193–206. [Google Scholar] [CrossRef] [PubMed]
- Ferguson, A.R.; Carbonneau, M.R.; Chambliss, C. Effects of positive and negative music on performance of a karate drill. Percept Mot Ski. 1994, 78, 1217–1218. [Google Scholar] [CrossRef] [PubMed]
- Riby, L.M. The joys of spring: Changes in mental alertness and brain function. Exp. Psychol. 2013, 60, 71–79. [Google Scholar] [CrossRef]
- Davies, D.R.; Lang, L.; Shackleton, V.J. The effects of music and task difficulty on performance at a visual vigilance task. Br. J. Psychol. 1973, 64, 383–389. [Google Scholar] [CrossRef]
- Husain, G.; Thompson, W.F.; Schellenberg, E.G. Effects of Musical Tempo and Mode on Arousal, Mood, and Spatial Abilities. Music Percept. Interdiscip. J. 2002, 20, 151–171. [Google Scholar] [CrossRef]
- Bruck, D.; Ball, M. Optimizing Emergency Awakening to Audible Smoke Alarms: An Update. Hum. Factors 2007, 49, 585–601. [Google Scholar] [CrossRef] [Green Version]
- Ancoli-Israel, S.; Cole, R.; Alessi, C.; Chambers, M.; Moorcroft, W.; Pollak, C.P. The role of actigraphy in the study of sleep and circadian rhythms. Sleep 2003, 26, 342–392. [Google Scholar] [CrossRef] [Green Version]
- Mantua, J.; Gravel, N.; Spencer, R.M.C. Reliability of Sleep Measures from Four Personal Health Monitoring Devices Compared to Research-Based Actigraphy and Polysomnography. Sensors 2016, 16, 646. [Google Scholar] [CrossRef] [Green Version]
- Faul, F.; Erdfelder, E.; Lang, A.G.; Buchner, A. G*Power 3: A flexible statistical power analysis program for the social, behavioral, and biomedical sciences. Behav. Res. Methods 2007, 39, 175–191. [Google Scholar] [CrossRef] [PubMed]
- Faul, F.; Erdfelder, E.; Buchner, A.; Lang, A.-G. Statistical power analyses using G*Power 3.1: Tests for correlation and regression analyses. Behav. Res. Methods 2009, 41, 1149–1160. [Google Scholar] [CrossRef] [PubMed] [Green Version]
- Cunningham, J.B.; McCrum-Gardner, E. Power, effect and sample size using GPower: Practical issues for researchers and members of research ethics committees. Evid. Based Midwifery 2007, 5, 132–137. [Google Scholar]
- Smith, S.S.; Kilby, S.; Jorgensen, G.; Douglas, J.A. Napping and nightshift work: Effects of a short nap on psychomotor vigilance and subjective sleepiness in health workers. Sleep Biol. Rhythm. 2007, 5, 117–125. [Google Scholar] [CrossRef]
- Australian Government. Guidelines on the Recognition of Sex and Gender; Department, A.G.S., Ed.; Australian Government: Canberra, Australia, 2013.
- Paul Voigt, A.V.D.B. The EU General Data Protection Regulation (GDPR), A Practical Guide; Springer International Publishing AG: Cham, Germany, 2017. [Google Scholar] [CrossRef]
- Gorilla. Gorilla. Available online: www.gorilla.sc (accessed on 10 April 2018).
- Society, T.B.P. The British Psychological Society. Available online: https://www.bps.org.uk (accessed on 5 May 2019).
- Research, N.I.F.H. National Institute for Health Research. Available online: https://www.nihr.ac.uk (accessed on 5 May 2019).
- Cakewalk, I. Cakewalk. Available online: www.cakewalk.com (accessed on 18 November 2017).
- Monson, B.B. Hearing Voices in the High Frequencies: What Your Cell Phone isn’t Telling You. Available online: https://acoustics.org/hearing-voices-in-the-high-frequencies-what-your-cell-phone-isnt-telling-you-brian-b-monson/ (accessed on 8 January 2018).
- Buskirk, E.V. The Most Popular Keys of All Music on Spotify. Available online: https://insights.spotify.com/us/2015/05/06/most-popular-keys-on-spotify/ (accessed on 13 March 2018).
- Bannister, M. The Billboard Hot 100: Exploring Six Decades of Number One Singles; GitHub: San Francisco, CA, USA, April 2017; Available online: https://github.com/mspbannister/dand-p4-billboard/blob/master/Billboard_analysis__100417_.md (accessed on 14 March 2018).
- Crossley-Holland, P. Rhythm; Encyclopaedia Britannica: Chicago, IL, USA; Available online: https://www.britannica.com/art/rhythm-music (accessed on 22 February 2019).
- Olivet, D. (Janurary 10, 2018) Chartmania!! I Broke Down Every Song That Reached the Billboard Top 5 in 2017; Soundfly. Available online: https://flypaper.soundfly.com/write/chartmania-breaking-down-billboard-top-40-songs-2017/ (accessed on 2 February 2018).
- Olivet, D. (Janurary 21, 2019) We Analyzed Every Dang Song That Cracked the Billboard Top 5 in 2018; Soundfly. Available online: https://flypaper.soundfly.com/produce/we-analyzed-every-dang-song-that-cracked-the-billboard-top-5-in-2018/ (accessed on 20 March 2019).
- Fallows, D. (2001) Andante; Grove Music Online. Available online: https://www.oxfordmusiconline.com/grovemusic/view/10.1093/gmo/9781561592630.001.0001/omo-9781561592630-e-0000000854 (accessed on 12 January 2019).
- Moelants, D. Preferred tempo reconsidered. In Proceedings of the 7th International Conference on Music Perception and Cognition; Stevens, C., Burnham, D., McPherson, G., Schubert, E., Renwick, J., Eds.; Causal Productions: Sydney, Adelaide, Austrilia, 2002; pp. 580–583. [Google Scholar]
- Fraisse, P. Rhythm and Tempo/The Psychology of Music/D; Deutsch, Ed.; Academic Press/pag: New York, NY, USA, 1982; Volume 149. [Google Scholar]
- van Noorden, L.; Moelants, D. Resonance in the Perception of Musical Pulse. J. New Music Res. 1999, 28, 43–66. [Google Scholar] [CrossRef]
- Basner, M.; Mollicone, D.; Dinges, D.F. Validity and Sensitivity of a Brief Psychomotor Vigilance Test (PVT-B) to Total and Partial Sleep Deprivation. Acta Astronaut. 2011, 69, 949–959. [Google Scholar] [CrossRef] [Green Version]
- Åkerstedt, T.; Gillberg, M. Subjective and Objective Sleepiness in the Active Individual. Int. J. Neurosci. 1990, 52, 29–37. [Google Scholar] [CrossRef]
- Baulk, S.D.; Reyner, L.A.; Horne, J.A. Driver sleepiness—evaluation of reaction time measurement as a secondary task. Sleep 2001, 24, 695–698. [Google Scholar] [CrossRef]
- Kaida, K.; Takahashi, M.; Akerstedt, T.; Nakata, A.; Otsuka, Y.; Haratani, T.; Fukasawa, K. Validation of the Karolinska sleepiness scale against performance and EEG variables. Clin. Neurophysiol. Off. J. Int. Fed. Clin. Neurophysiol. 2006, 117, 1574–1581. [Google Scholar] [CrossRef]
- Basner, M.; Dinges, D.F. Maximizing sensitivity of the psychomotor vigilance test (PVT) to sleep loss. Sleep 2011, 34, 581–591. [Google Scholar] [CrossRef]
- Dinges, D.F.; Powell, J.W. Microcomputer analyses of performance on a portable, simple visual RT task during sustained operations. Behav. Res. Methods Instrum. Comput. 1985, 17, 652–655. [Google Scholar] [CrossRef]
- Dinges, D.F.; Maislin, D.; Maislin, G.; Moeller, D.; Hammond, R.; Soccolich, S.A.; Hickman, J.S.; Hanowski, R.J.; Kan, K.; Mollicone, D.; et al. 0194 Sleep Quantity And Quality, Pvt-b Performance, And Subjective Sleepiness, Fatigue, And Stress In Commercial Motor Vehicle (cmv) Drivers: On-duty Days Vs. Restart (off-duty) Days. Sleep 2019, 42, A79–A80. [Google Scholar] [CrossRef]
- Centofanti, S.A.; Hilditch, C.J.; Dorrian, J.; Banks, S. A 30-Minute, but Not a 10-Minute Nighttime Nap is Associated with Sleep Inertia. Sleep 2016, 39, 675–685. [Google Scholar] [CrossRef] [Green Version]
- Van Dongen, H.P.; Maislin, G.; Mullington, J.M.; Dinges, D.F. The cumulative cost of additional wakefulness: Dose-response effects on neurobehavioral functions and sleep physiology from chronic sleep restriction and total sleep deprivation. Sleep 2003, 26, 117–126. [Google Scholar]
- Miley, A.Å.; Kecklund, G.; Åkerstedt, T. Comparing two versions of the Karolinska Sleepiness Scale (KSS). Sleep Biol. Rhythm. 2016, 14, 257–260. [Google Scholar] [CrossRef] [Green Version]
- Yi, H.; Shin, K.; Shin, C. Development of the Sleep Quality Scale. J. Sleep Res. 2006, 15, 309–316. [Google Scholar] [CrossRef]
- Buysse, D.J.; Reynolds, C.F., 3rd; Monk, T.H.; Berman, S.R.; Kupfer, D.J. The Pittsburgh Sleep Quality Index: A new instrument for psychiatric practice and research. Psychiatry Res. 1989, 28, 193–213. [Google Scholar]
- Dinges, D.F.; Kribbs, N.B. Performing while sleepy: Effects of experimentally-induced sleepiness. In Sleep, Sleepiness and Performance; John Wiley & Sons: Oxford, UK, 1991; pp. 97–128. [Google Scholar]
- Creswell, J.W.; Creswell, J.D. Research Design: Qualitative, Quantitative, and Mixed Methods Approaches; SAGE Publications: Los Angeles, LA, USA, 2017. [Google Scholar]
- Ghasemi, A.; Zahediasl, S. Normality tests for statistical analysis: A guide for non-statisticians. Int. J. Endocrinol. Metab. 2012, 10, 486–489. [Google Scholar] [CrossRef] [Green Version]
- McDonald, J.H. Handbook of Biological Statistics; Sparky House Publishing: Baltimore, MD, USA, 2009; Volume 2. [Google Scholar]
- Rosenthal, R. Parametric measures of effect size. In The Handbook of Research Synthesis; Russell Sage Foundation: New York, NY, USA, 1994; pp. 231–244. [Google Scholar]
- Microsoft. Microsoft Excel. Available online: www.microsoft.com (accessed on 2 July 2017).
- IBM. SPSS. Available online: www.ibm.com/analytics/spss-statistics-software (accessed on 11 July 2017).


| Measure | Session 1. Control | Session 2. Melody | Test Statistics |
|---|---|---|---|
| Mean RT | µ = 504.21, SD = 107.02 | µ = 475.84, SD = 84.43 | t(9) = 1.44, p = 0.184, d = 0.455 |
| Mean 1/RT | µ = 2.21, SD = 0.50 | µ = 2.28, SD = 0.43 | t(9) = −0.681, p = 0.513, d = −0.215 |
| Lapses | µ = 24.20, SD = 18.29 | µ = 19.40, SD = 17.10 | t(9) = 2.94, p = 0.016, d = 0.930 * |
| False Starts | µ = 2.20, SD = 1.69 | µ = 1.00, SD = 1.05 | t(9) = 4.811, p = 0.001, d = 1.521 ** |
| Performance Score | µ = 0.56, SD = 0.30 | µ = 0.66, SD = 0.28 | t(9) = −3.54, p = 0.006, d = −1.121 ** |
| Measure | Session 1. Control | Session 2. Melody | Test Statistics |
|---|---|---|---|
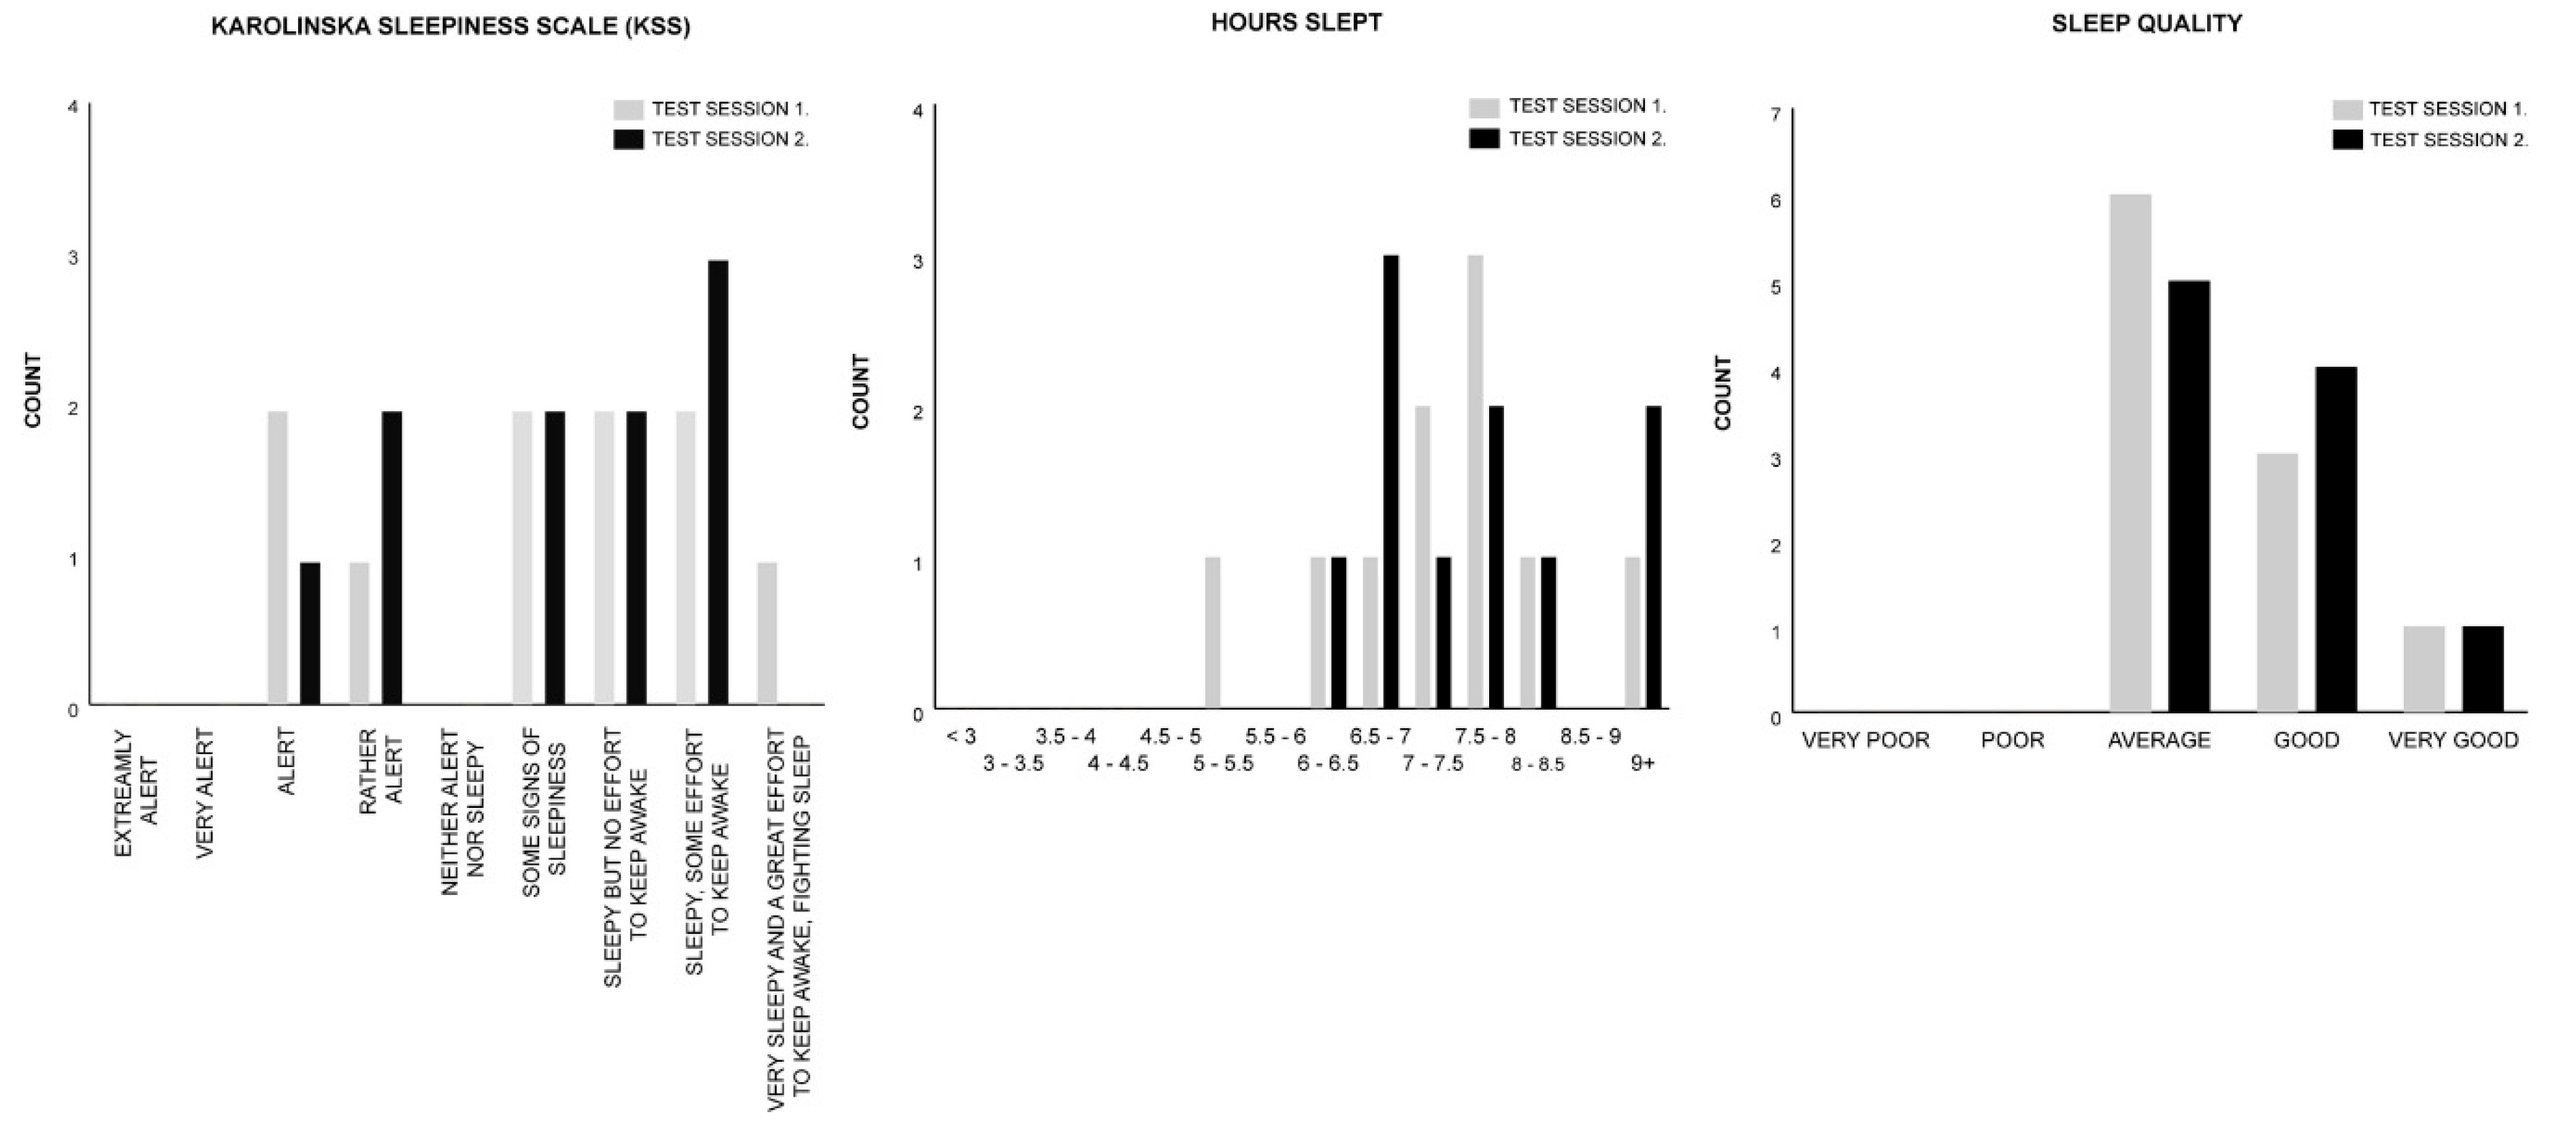
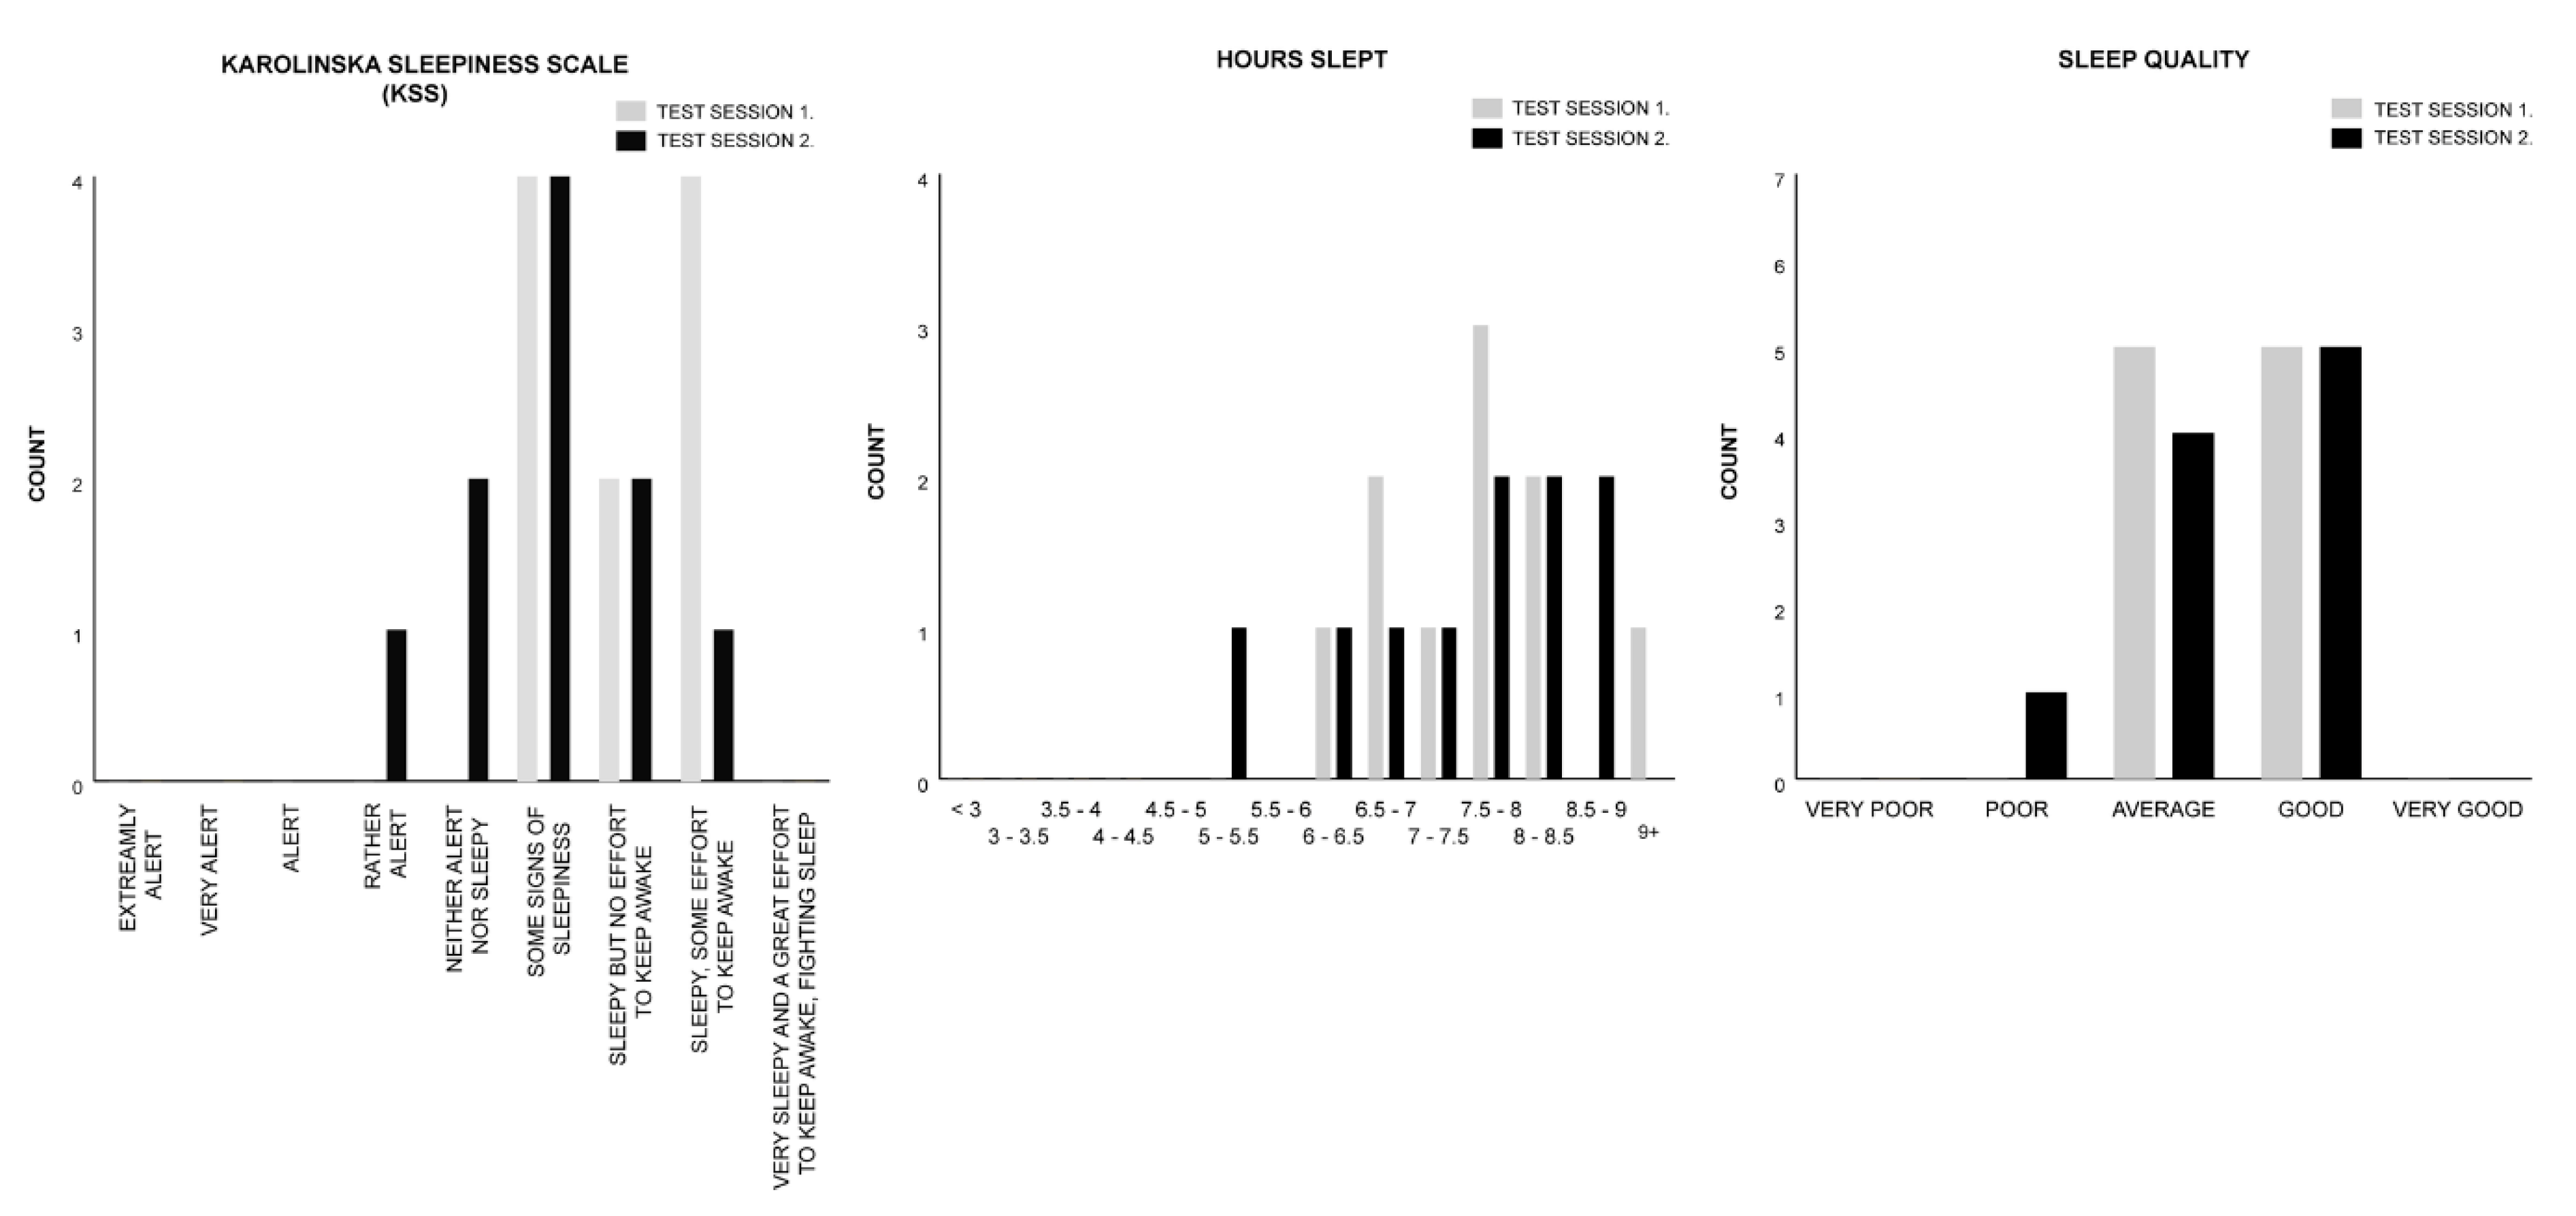
| KSS | M = 6.50 | M = 6.50 | z = 0.000, p = 1.000, r = 0.000 |
| HOURS SLEPT | M = 10.50 | M = 10.50 | z = −1.186, p = 0.236, r = −0.265 |
| SLEEP QUALITY | M = 3.00 | M = 3.50 | z = −0.378, p = 0.705, r = −0.085 |
| Measure | Session 1. Control | Session 2. Rhythm | Test Statistics |
|---|---|---|---|
| Mean RT | µ = 506.01, SD = 109.68 | µ = 452.42, SD = 64.22 | t(9) = 1.405, p = 0.193, d = 0.444 |
| Mean 1/RT | µ = 2.23, SD = 0.40 | µ = 2.38, SD = 0.35 | t(9) = −1.058, p = 0.318, d = − 0.335 |
| Lapse | µ = 20.40, SD = 14.92 | µ = 17.40, SD = 13.45 | t(9) = 0.530, p = 0.609, d = 0.168 |
| False Starts | M = 1.00 | M = 1.00 | z = −1.30, p = 0.194, r = −0.291 |
| Performance Score | µ = 0.64, SD = 0.25 | µ = 0.68, SD = 0.23 | t(9) = −0.421, p = 0.683, d = −0.133 |
| Measure | Session 1. Control | Session 2. Rhythm | Test Statistics |
|---|---|---|---|
| KSS | M = 7.00 | M = 6.00 | z = −1.699, p = 0.089, r = −0.380 |
| HOURS SLEPT | M = 11.00 | M = 11.00 | z = −0.431, p = 0.666, r = −0.096 |
| SLEEP QUALITY | M = 3.50 | M = 3.50 | z = −0.577, p = 0.564, r = −0.129 |
| Test Stimuli Design Overview | ||
|---|---|---|
| Control | Melody | Rhythm |
| Metronomic contour | Metronomic contour | Metronomic contour |
| (Woodblock, Vibraphone) | (Woodblock, Vibraphone) | (Woodblock, Vibraphone) |
| + | + | |
| Melodic contour | Rhythmic contour | |
| (Vibraphone) | (Woodblock) | |
© 2020 by the authors. Licensee MDPI, Basel, Switzerland. This article is an open access article distributed under the terms and conditions of the Creative Commons Attribution (CC BY) license (http://creativecommons.org/licenses/by/4.0/).
Share and Cite
McFarlane, S.J.; Garcia, J.E.; Verhagen, D.S.; Dyer, A.G. Auditory Countermeasures for Sleep Inertia: Exploring the Effect of Melody and Rhythm in an Ecological Context. Clocks & Sleep 2020, 2, 208-224. https://doi.org/10.3390/clockssleep2020017
McFarlane SJ, Garcia JE, Verhagen DS, Dyer AG. Auditory Countermeasures for Sleep Inertia: Exploring the Effect of Melody and Rhythm in an Ecological Context. Clocks & Sleep. 2020; 2(2):208-224. https://doi.org/10.3390/clockssleep2020017
Chicago/Turabian StyleMcFarlane, Stuart J., Jair E. Garcia, Darrin S. Verhagen, and Adrian G. Dyer. 2020. "Auditory Countermeasures for Sleep Inertia: Exploring the Effect of Melody and Rhythm in an Ecological Context" Clocks & Sleep 2, no. 2: 208-224. https://doi.org/10.3390/clockssleep2020017