Response of Photoluminescence of H-Terminated and Hydrosilylated Porous Si Powders to Rinsing and Temperature


Department of Chemistry, West Chester University, West Chester, PA 19383, USA
*
Author to whom correspondence should be addressed.
Surfaces 2020, 3(3), 366-380; https://doi.org/10.3390/surfaces3030027
Submission received: 13 July 2020
/
Revised: 24 July 2020
/
Accepted: 27 July 2020
/
Published: 3 August 2020
Abstract
:The photoluminescence (PL) response of porous Si has potential applications in a number of sensor and bioimaging techniques. However, many questions still remain regarding how to stabilize and enhance the PL signal, as well as how PL responds to environmental factors. Regenerative electroless etching (ReEtching) was used to produce photoluminescent porous Si directly from Si powder. As etched, the material was H-terminated. The intensity and peak wavelength were greatly affected by the rinsing protocol employed. The highest intensity and bluest PL were obtained when dilute HCl(aq) rinsing was followed by pentane wetting and vacuum oven drying. Roughly half of the hydrogen coverage was replaced with –RCOOH groups by thermal hydrosilylation. Hydrosilylated porous Si exhibited greater stability in aqueous solutions than H-terminated porous Si. Pickling of hydrosilylated porous Si in phosphate buffer was used to increase the PL intensity without significantly shifting the PL wavelength. PL intensity, wavelength and peak shape responded linearly with temperature change in a manner that was specific to the surface termination, which could facilitate the use of these parameters in a differential sensor scheme that exploits the inherent inhomogeneities of porous Si PL response.
Keywords:
photoluminescence; passivation; hydrosilylation; porous silicon; quenching; undecylenic acid; sensor1. Introduction
Porous silicon has garnered significant interest in the past several decades due to its relevance to rechargeable lithium ion batteries [1,2,3,4], sensing [5,6,7,8], and biomedical applications including drug delivery [9,10,11], as a vaccine adjuvant [12], in theranostics [13,14], and as a functional biomaterial [15]. When nanostructured, silicon becomes a biocompatible material [16,17]. It is resorbed by the body as its decomposition product is silicic acid, a bioavailable form of Si that is eliminated through the renal system [18,19]. The ability of nanostructured Si to expand and contract without fracturing upon lithiation enables it to be used as an anode of high capacity lithium-ion batteries with favorable cycling characteristics [20,21].
The observation of visible photoluminescence (PL) from nanostructured Si [22] is rooted in a quantum confinement effect that is strongly modified by surface chemistry [23,24]. Therefore, the PL of nanocrystalline porous silicon (por-Si) is sensitive to the nanocrystal size, as well as the surface termination [25]. The long radiative lifetime of nanocrystalline silicon [26] leads to an unusually important competition between radiative and non-radiative processes, which greatly complicates a mechanistic understanding of its photoluminescence [27,28,29]. The natural hydrogen termination of as-formed por-Si is extremely efficient at passivating electron-hole pair recombination centers [30], which act as non-radiative traps. While the reactivity of H-terminated por-Si is low in acidic solutions [31], H-terminated por-Si is highly reactive in alkaline solutions and is rapidly etched under the influence of hydroxide-catalyzed hydrolysis [32,33,34]. The H-terminated surface is also readily oxidized upon exposure to humid air, a process that can be easily observed by the real time shift in the PL spectrum under UV (Ultraviolet) illumination [24].
While the high sensitivity of PL to the surface chemistry of nanocrystalline Si is a complicating factor in the interpretation of its luminescence, this sensitivity also means that nanocrystalline Si is well suited for use in applications whereby the interactions of analytes with its surface are to be probed. However, to ensure a reproducible PL response, the Si surface needs not only to be passivated with respect to the formation of non-radiative traps, it must also be passivated chemically. Hydrosilylation, activated photochemically [35,36,37] or thermally [38,39,40,41], is one method to chemically passivate Si surfaces. Hydrosilylation can be used to terminate por-Si nanoparticles that are stable for weeks in phosphate buffer [42] as well as 2–5 nm colloidal Si particles [43]. Both of these exhibit bright visible photoluminescence that is suitable for either one-photon or two-photon excited bioimaging such as confocal microscopy.
The passivation of por-Si surfaces is composed of two aspects: Chemical and electronic [44]. Chemical passivation refers to terminating the bare Si surface with a chemical moiety that undergoes no further chemical reaction under the conditions in which the Si device is to be used. Electronic passivation refers to the luminescence process. A sample that is electronically passivated presents few if any sites on its surface where electrons and holes can recombine non-radiatively. An electronically passivated surface exhibits high luminescence efficiency. Chemical and electronic passivation are related in that a bare Si surface atom represents a radical site (unpaired electron) that is both highly chemically reactive and highly likely to cause non-radiative relaxation. Similarly, defective Si surface atoms, i.e., surface atoms that are bound in non-ideal tetrahedral geometries, such as steps, are likely to be highly reactive or introduce non-radiative recombination sites, known as non-radiative traps. A completely H-terminated Si surface is known to exhibit extremely good electronic passivation [30,44]. While the chemical reactivity of H-terminated Si is significantly lower than a bare Si surface, H-terminated Si is nonetheless susceptible to chemical attack, for example, by humid air, particularly when exposed to visible or UV radiation [24]. Si surfaces, whether on wafers or nanoparticles, are readily terminated with organic molecules to affect passivation [39,45,46]. These particles present a nontoxic alternative to quantum-dot based biosensors.
An oxide layer can also be used to provide both chemical and electronic passivation. Chemical passivation at a low temperature can be used to make por-Si particles hydrophilic and enhance their stability in biological fluids [47]. However, por-Si particles oxidized in piranha solution (1:2 (v/v) H2O2:H2SO4) at 100 °C and functionalized with 3-aminopropyltriethoxysilane were completely dissolved in under 24 h when exposed to biological fluids, such as phosphate-buffered saline (PBS), fetal bovine serum C or Dulbecco’s modified Eagle Medium B [14]. Higher temperature oxidation has enabled the investigation of individual silicon quantum dots [48]. Oxidation of Si when performed below ~900 °C is a self-limiting process [49]. Unlike hydrosilylated (also referred to as ligand-terminated) nanocrystals, oxide-terminated Si nanocrystals can exhibit blinking [48]. High-pressure water vapor oxidation [50] has been used to generate Si nanocrystals with quantum yields that exceed 50% [26].
The structure and photoluminescence of por-Si responds to drying conditions after formation [24]. Bellet and Canham [51] described the use of supercritical drying (also known as critical point drying) with anodically produced por-Si layers. Canham and co-workers [52] subsequently demonstrated the superior PL quantum yield of anodically produced supercritically dried (SCD) por-Si compared to por-Si that was rinsed with isopropyl alcohol (IPA) and allowed to air dry (AD). The quantum yield of SCD por-Si was almost double that of AD por-Si (32.1% vs. 17.5%). Anodically etched films can be ground or sonicated to generate por-Si powder [53,54].
Critical point drying from CO2/alcohol mixtures is not particularly difficult to implement with the proper instrumentation for films produced on Si wafers, but it is more difficult to implement for powders, especially for very small particles sizes and large volumes. Recently, the regenerative electroless etching or ReEtching method has been demonstrated to produce luminescent por-Si powders by direct etching of Si powders of any grade [42,55]. This process is easily scalable to produce large quantities of por-Si powder. However, direct etching requires filtration rather than simple decanting to separate the powder from the etchant. This motivated us to investigate the role of rinsing during the filtration step on PL intensity and wavelength. Subsequent to these studies we then investigated the response of as-etched and hydrosilylated por-Si to exposure to aqueous solutions. The pH of HCl(aq) and phosphate buffer solutions were varied to observe the effect of pH on PL intensity and peak wavelength.
Here we report experiments that investigate the reduction of PL intensity upon exposure of ReEtched por-Si powder to the atmosphere, a phenomenon known as PL fading, and to determine how PL fading responds to chemically treating the powders under various conditions. While water is commonly used for rinsing, we found that it is more advantageous to use dilute aqueous HCl to rinse Si powder after etching because it more effectively removes ionic etch products left in the pores without additional Si loss due to alkaline etching. Ethanol is commonly used in rinsing of por-Si because its amphiphilic nature allows it to wet hydrophobic H-terminated pore walls as well as more hydrophilic (partially) oxidized Si. In addition, its surface tension (21.91 mN m−1 at 25 °C) [56] is about the same as IPA (20.93 mN m−1) and significantly lower than that of water (72.06 mN m−1). Therefore, it introduces less damage upon air drying than water. Even better is pentane with a surface tension of only 15.45 mN m−1.
2. Materials and Methods
Metallurgical grade Si powder (MG-Si) provided by Elkem Materials INC. (Silgrain HQ, 99.6% purity, Oslo, Norway) was used to synthesize the por-Si. The Si was milled to the desired size range (2.5–45 µm) and cleaned by sonication in dilute (3%) hydrogen peroxide (H2O2) followed by filtration and rinsing with deionized water. Hydrogen peroxide cleans the Si by oxidizing organic and metallic contamination on the particles and sonication dislodges microgranules that are embedded in or stuck to the surfaces of larger particles.
ReEtching was performed as described by Kolasinski et al. [55]. For the investigation of the various rinsing procedures each experiment was performed with nearly identical conditions with the exception of the rinsing. For each run approximately 0.075 g V2O5 (Fisher Scientific, Pittsburgh, PA, USA) was dissolved in 10 mL concentrated HF (Acros Organics 49% ACS reagent, Fisher Scientific, Pittsburgh, PA, USA). In a separate beaker approximately 0.5 g Si was mixed with 10 mL of acetic acid (HAc, Fisher Scientific, ACS reagent, Pittsburgh, PA, USA). Both beakers were placed in a thermally insulated ice/water bath to maintain a temperature close to 0 °C during etching. After cooling for several minutes, the contents of the HF/V2O5-containing beaker were added to the Si-containing beaker. The mixture was cooled for several more minutes while being agitated with a Teflon-coated magnetic stir bar. 3 mL of a solution of 2 mL H2O2 (Fisher Scientific 30% certified ACS, Pittsburgh, PA, USA) or proportionally less Acros Organics 35% ACS reagent, Fisher Scientific, Pittsburgh, PA, USA) and 1 mL deionized H2O were injected over 55 min (molar ratio H2O2:Si = 1:1) using a kdScientific Legato 100 syringe pump (Holliston, MA, USA). The etchant was decanted 5 min after H2O2 injection was ended. The etched Si was filtered in a polypropylene Büchner funnel (Fisher Scientific, Pittsburgh, PA, USA) using 2.5 µm Whatman filter paper (Fisher Scientific certified, Pittsburgh, PA, USA). The filter top with the etched Si was removed and set aside. The Si was wetted with n-pentane (environmental grade, Alpha Aesar, Fisher Scientific, Pittsburgh, PA, USA) for some experiments, but not for all (see individual experiments for details). When Si appeared nominally dry, the filter top was placed in a vacuum oven (Fisherbrand Isotemp, Pittsburgh, PA, USA) at ~50 °C and the oven was evacuated with a two-stage oil sealed rotary vane pump (Edward RV8, Burgess Hill, England, UK, ultimate pressure 2 × 10⁻³ mbar) equipped with an alumina molecular sieve foreline trap (Kurt J. Lesker, Pittsburgh, PA, USA) to eliminate oil backstreaming. After at least several hours Si was removed from the oven and weighed, then placed in a sealed glass vial. PL spectra were acquired from a sample of etched powder that was adhered to a carbon adhesive disk (SPI Supplies, West Chester, PA, USA) affixed to a Si wafer. For PL measurements the Si wafer could then be placed on a solid sample mount inside the fluorimeter (Cary Eclipse, Agilent Technologies, Inc., Santa Clara, CA, USA). The area on the carbon disk that was covered with etched Si powder was larger than the excitation beam to allow for maximum similarity of intensity measurements from different samples. The excitation wavelength for PL spectra was either 340 or 350 nm. For fading studies, the PL for each of the 5 samples was recorded for 15 consecutive days at approximately the same time each day. The powder of ground samples was ground manually with a mortar and pestle for ~1 min.
For the investigation of the temperature and pH dependence, the same grade of raw Si as before was used. The same ReEtching technique described above was used except that twice as much Si was etched and the H2O2 injection time was longer (85 min). Five minutes after the H2O2 injection was completed the sample was filtered. The filtration was performed using 2.5 µm filter paper and was rinsed with ~0.2 M HCl (Fisher ACS certified, Pittsburgh, PA, USA). The sample was removed from the Büchner filter and wetted with pentane. The bulk of the pentane was allowed to air dry before the sample was transferred to the vacuum oven, as described above. Powder was placed on an adhesive carbon disk affixed to a Si wafer as before. The wafer was cleaved to a size that fit diagonally in a polymethylmethacrylate (PMMA) cuvette. For temperature studies, the cuvette was filled with deionized water acidified with hydrochloric acid to the stated pH. The wafer, containing the por-Si, was placed in the cuvette, and the fluorescence of the Si was measured using a Varian Cary Eclipse fluorescence spectrophotometer equipped with a Varian PCB 1500 Peltier temperature controller (Agilent Technologies, Inc., Santa Clara, CA, USA) after the sample equilibrated for at least 30 min before the first measurement and for 5 min at each subsequent temperature. The temperature was varied from 20.0 to 50.0 °C.
To investigate the pH dependence of the photoluminescence either HCl or phosphate buffer was used to prepare the solutions. The buffer used was an aqueous solution comprised of monosodium phosphate and disodium phosphate, with the total concentration of phosphate species held constant at 0.1 M. The use of these two salts set the pH range of the experiment to 6–8 pH. The temperature of the Peltier temperature regulation system was set to 25 °C and held constant throughout the pH measurements. The pH of each solution was carefully measured using a pH probe (MicroLAB, Inc., Bozeman, MT, USA) before the solution contacted the sample. Once the pH was recorded the cuvette containing the sample was submerged in the beaker. After being submerged in the beaker for 5 min the sample was transferred to the fluorimeter. The sample was left in the fluorimeter for 5 min to allow it to thermally equilibrate before measurements was taken. The pH of the solution was measured again and recorded after the sample was in the solution; this is the pH value that was used in the analysis. After the scan was complete, the sample and cuvette were transferred to the next pH beaker and submerged without decanting the solution from the cuvette. This eliminated any concern of the effects of the pores drying and re-wetting between each measurement. It also necessitated the measurement of pH after the sample was equilibrated in the solution. Drying between measurements was avoided not only to eliminate drying induced damage but also because the hydrophobicity of H-terminated por-Si makes it notoriously difficult to rewet subsequent to drying. Samples were excited at 350 nm and PL intensity was measured at 625 nm.
For comparison of H-terminated to hydrosilylated por-Si, ReEtched por-Si batches were functionalized by thermal hydrosilylation by immersing particles in undecylenic acid (99%, Agros Organics, Fisher Scientific, Pittsburgh, PA, USA) and heating them at 120 °C for 16 h as described in [42]. After heating, excess acid was removed by washing the resulting particles with ethanol (EtOH). Coupling of the undecylenic acid through its terminal double bond was confirmed via Fourier transform infrared (FTIR) spectroscopy acquired with 4 cm−1 resolution on a Nicolet iS50 FTIR spectrometer (ThermoFisher, Inc., Waltham, MA, USA). Similar experiments on the PL dependence on changing pH were performed on hydrosilylated particles.
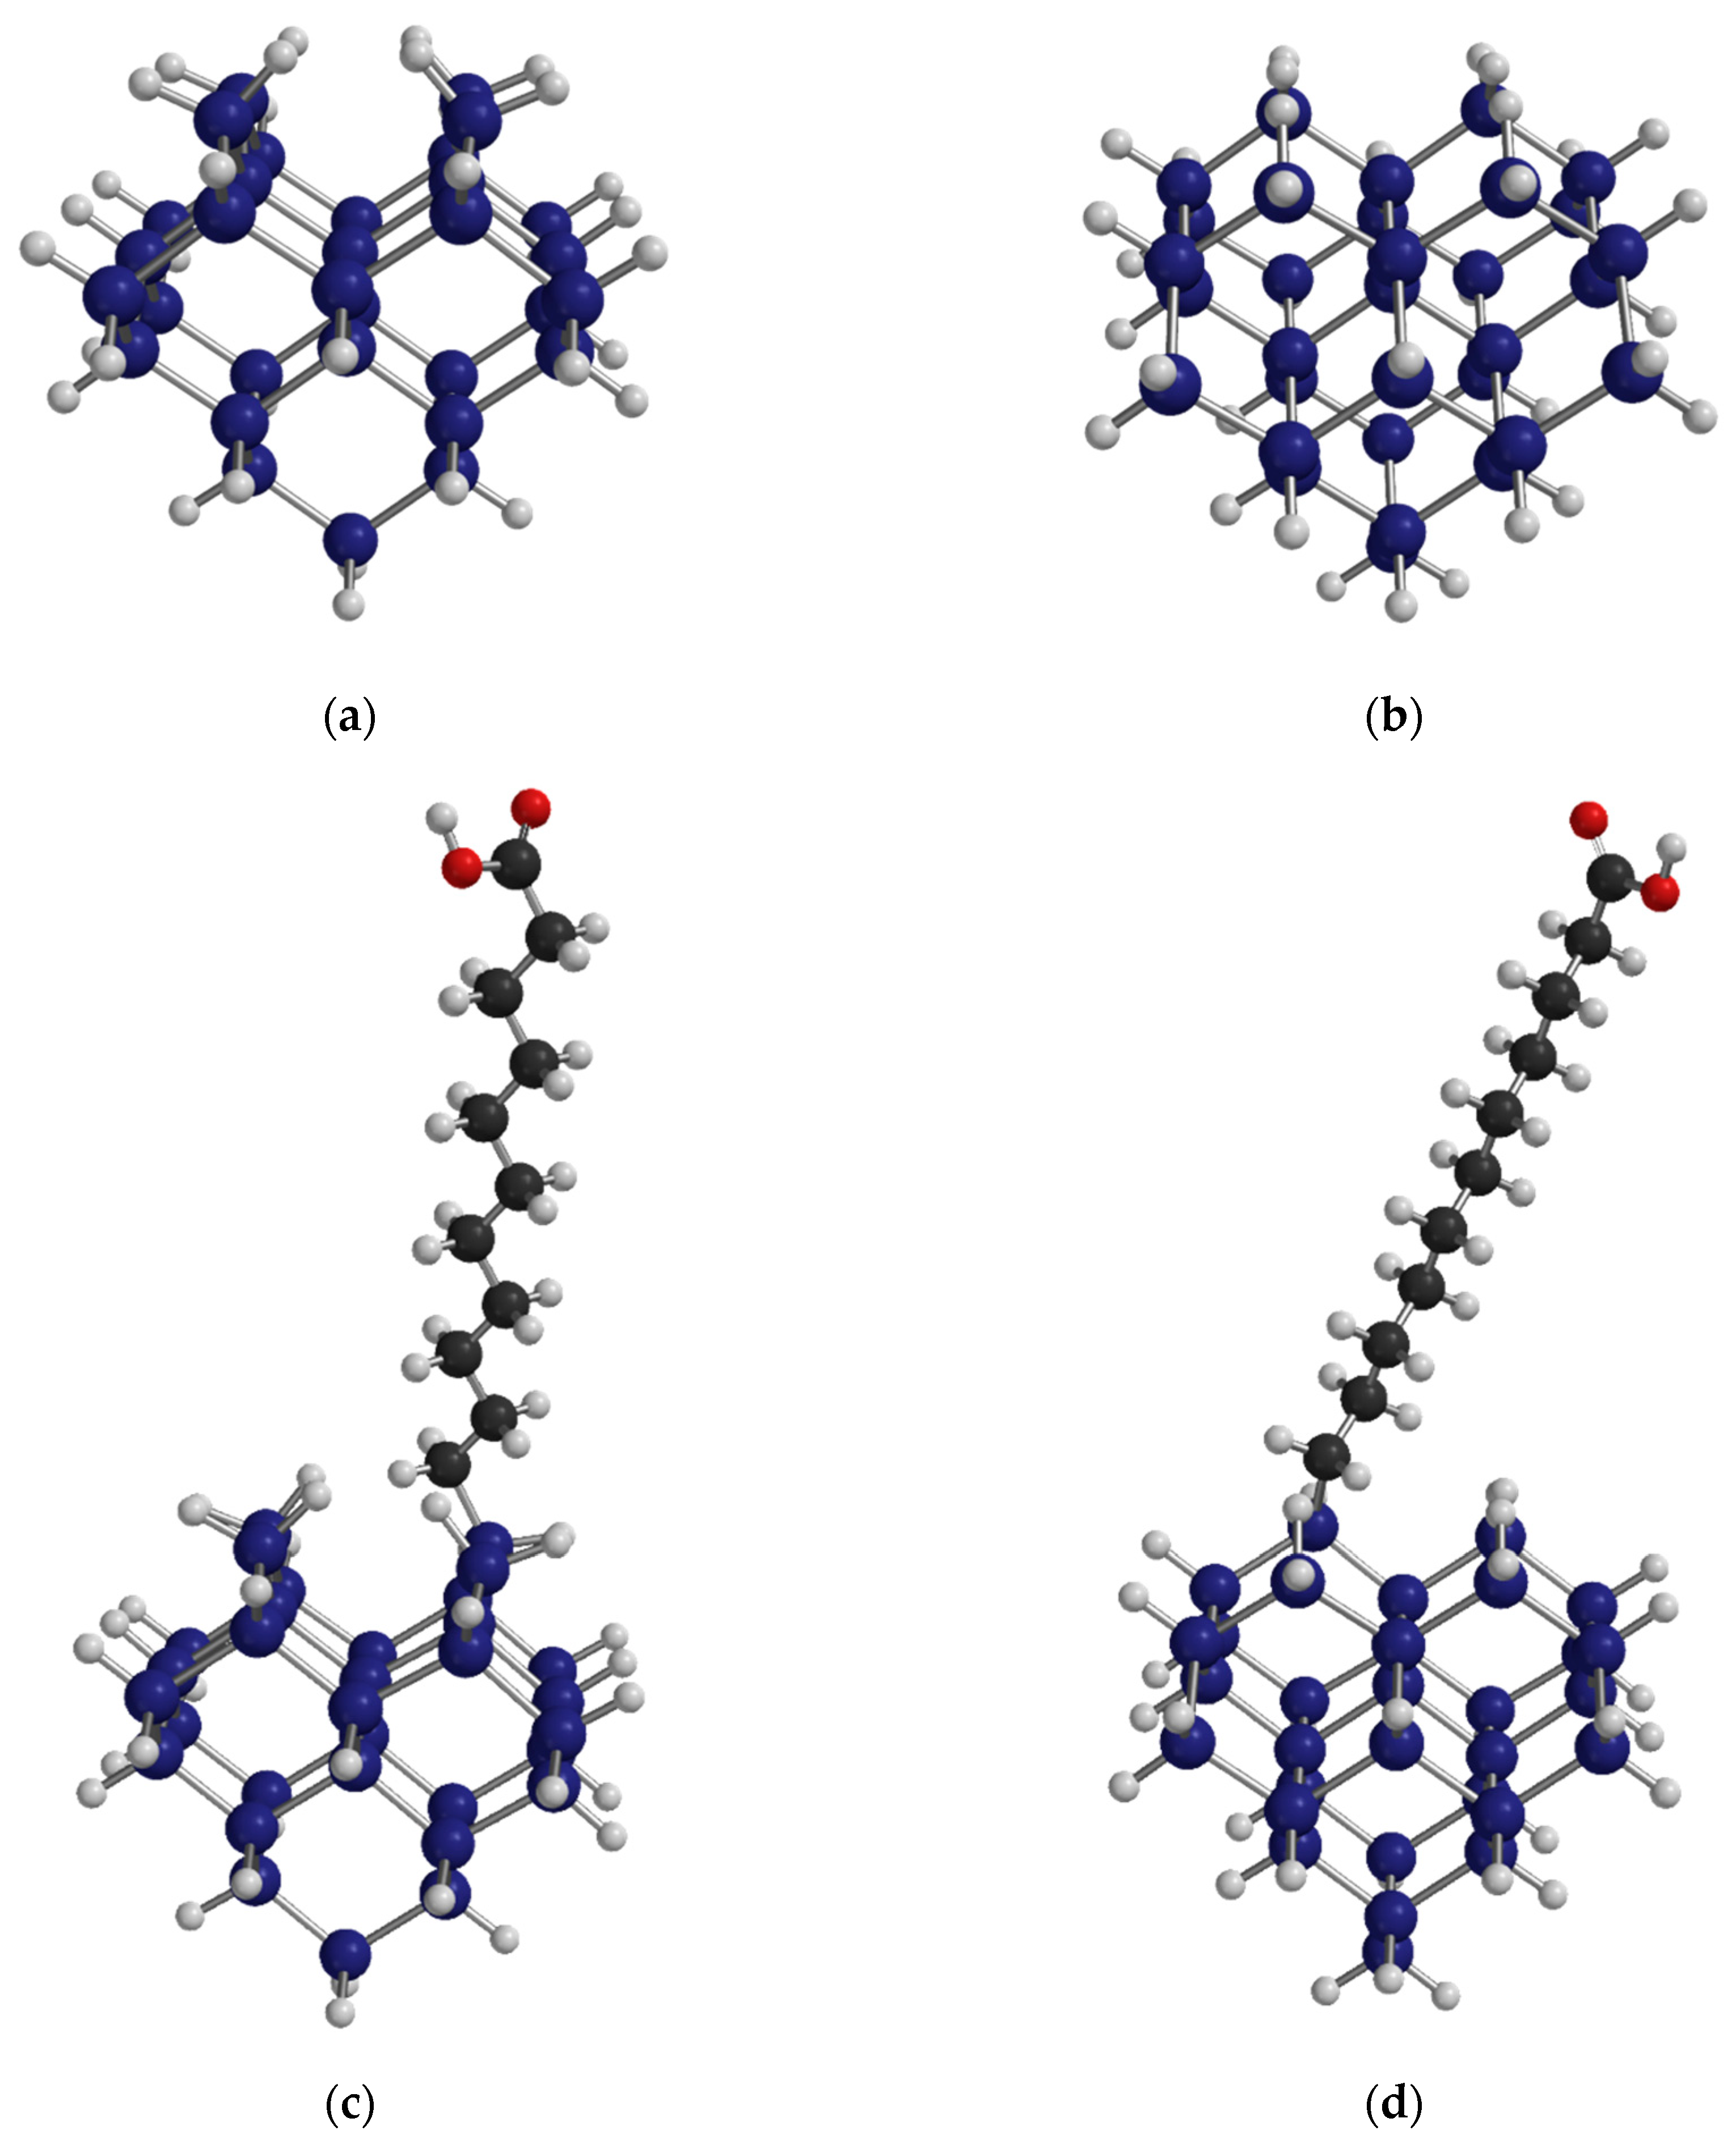
Confirmation of the FTIR spectral assignments were made with reference to the literature [57], as well as by simulation of the spectra of both a H-terminated Si cluster and a H-terminated Si cluster with one –CH2(CH2)9COOH group replacing one of the H atoms. The Si32H36 cluster exposed an upper Si(100)–(1 × 1) surface that contained four Si atoms terminated as dihydride groups (SiH2). All H atoms not bound to the upper surface were assigned the mass of a Si atom. In this manner these heavy H atoms cap the dangling bonds of the Si atoms without introducing artificial coupling to the vibrational modes associated with the Si–H, C–H, C=O and O–H moieties bound to the upper surface. Spartan quantum chemical software (Wavefunction, Inc., Irvine, CA, USA) was used to perform the calculations using density functional theory (DFT) with a 6–31G* basis set and a ωB97X-D exchange functional.
3. Results and Discussion
3.1. Surface Chemical Composition of ReEtched and Hydrosilylated Porous Silicon
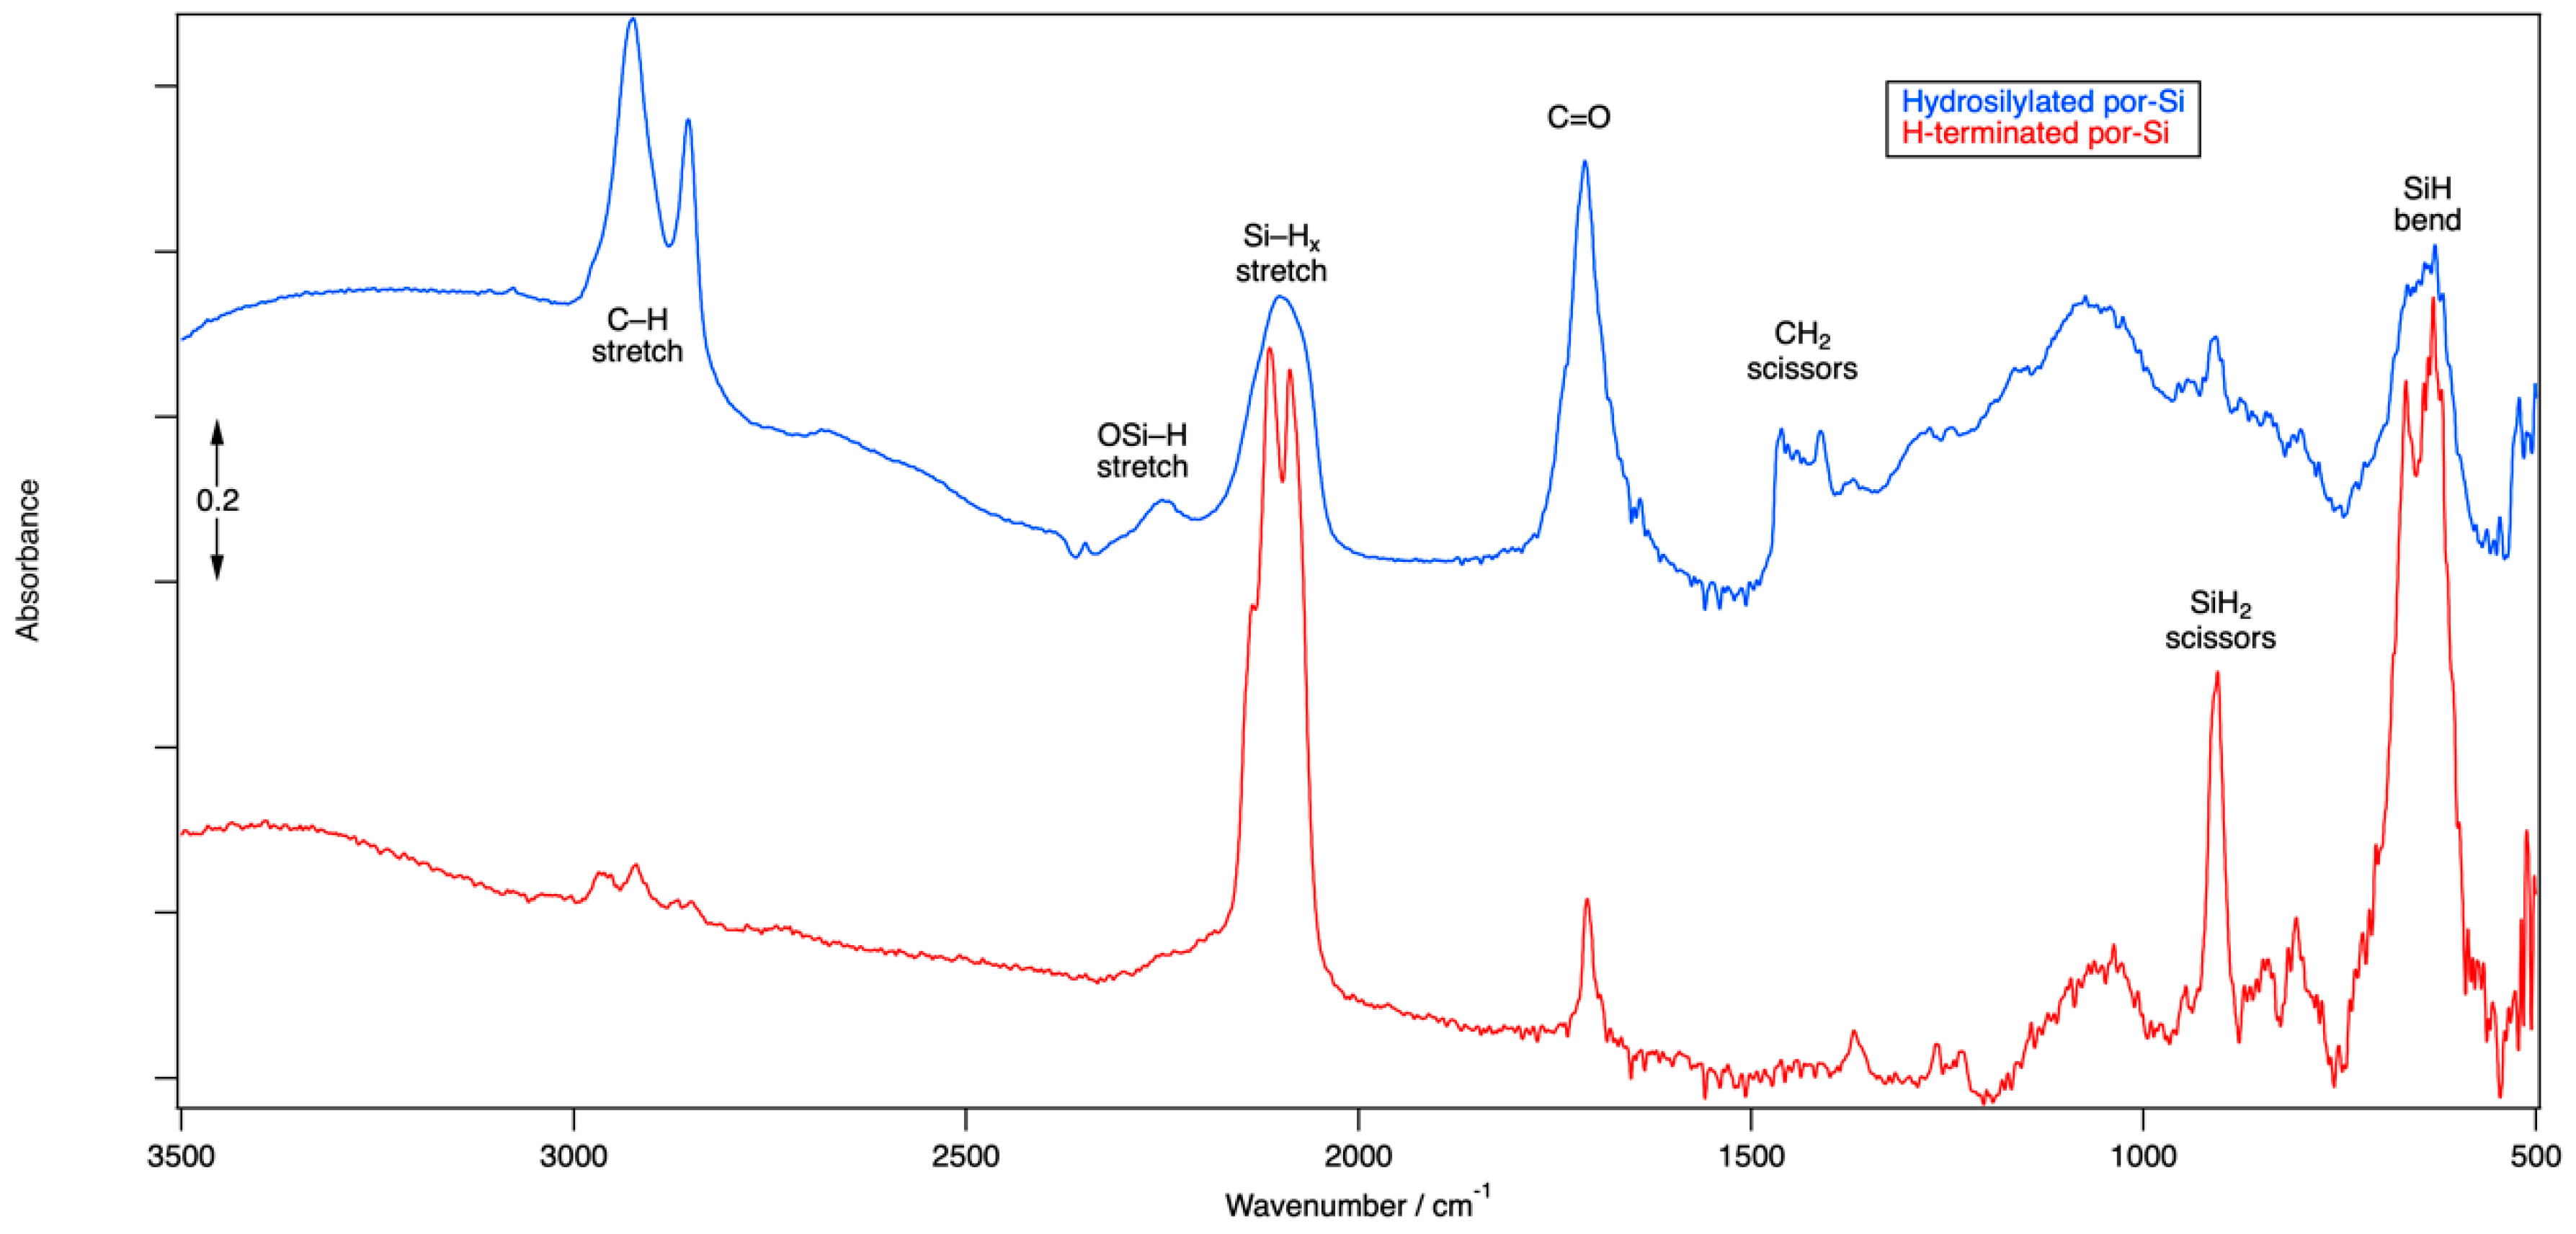
FTIR spectroscopy was used to confirm the chemical termination of as-etched ReEtched por-Si and ReEtched por-Si that has been subjected to hydrosilylation. The FTIR spectrum, see Figure 1, of as-etched por-Si after ReEtching, rinsing and drying is dominated by peaks at 2114 cm−1, 2088 cm−1, 905 cm−1, 666 cm−1 and 631 cm−1. Consistent with results reported previously for stain etched por-Si [57], the FTIR spectrum indicated that the surface was composed primarily of SiH2 and SiH units associated with Si(001) and Si(110) facets. The lack of distinct peaks in the 2150–2250 cm−1 region indicated that very few of the surface Si atoms have been oxidized by the insertion of O atoms into their back bonds. Peaks near 2930 cm−1 and 1710 cm−1 may result from residual acetic acid that was not rinsed from the surface as the relative size of these peaks tends to vary from sample to sample.
After hydrosilylation, the Si–H stretch (near 2100 cm−1), scissors (near 900 cm−1) and bend (near 650 cm−1) regions are all significantly reduced in intensity but also made less resolved. The lack of resolution in the Si–H stretch region for the hydrosilylated sample is consistent with a more heterogeneous chemical environment, i.e., Si–H units have both Si–H and Si-(CH2)10COOH units as neighbors and not just other Si–H units. The peak at 2247 cm−1 is indicative of the O3SiH and related species that occur due to partial oxidation by insertion of O atoms into Si–Si backbonds. Strong peaks at 2925 cm−1 and 2856 cm−1 are associated with C–H stretching modes of an alkyl chain. The mode at 1712 cm−1 is associated with the C=O of the carbonyl unit. DFT calculations reveal that the stretching of the C=O bond mixes significantly with bending motion of the CH2 unit to which it is bound as well as the –OH unit of the carboxyl group. A variety of modes associated with bends of the other CH2 groups along the alkyl chain are found in the 1400–1460 cm−1 range. DFT results indicate that among the myriad vibrational modes involving the Si–H and C–H bonds, many of them couple the motion of both types of hydrides.
The FTIR spectrum clearly indicates that hydrosilylation has linked undecylenic acid to the Si surface by formation of an Si–C bond at the expense of an Si–H bond. The corresponding adsorbate geometry obtained from DFT calculations is shown in Figure 2. H2 is presumably lost while the terminal C atom in the double bond of undecylenic acid, the α-C atom or number ten C atom according to naming convention of undec-10-enoic acid, couples to the Si surface. At the ω-end of the molecule, the carboxylic acid group attached to the number one C atom of the alkyl chain is retained and points away from the Si surface. The surface of the hydrosilylated por-Si contains a mixture of Si–H and Si–(CH2)10COOH units, as shown in Figure 2. Based on the reduction in the area under the peaks of the Si–H stretching modes, roughly 50% of surface Si–H units have been substituted.
3.2. Rinsing and PL Fading
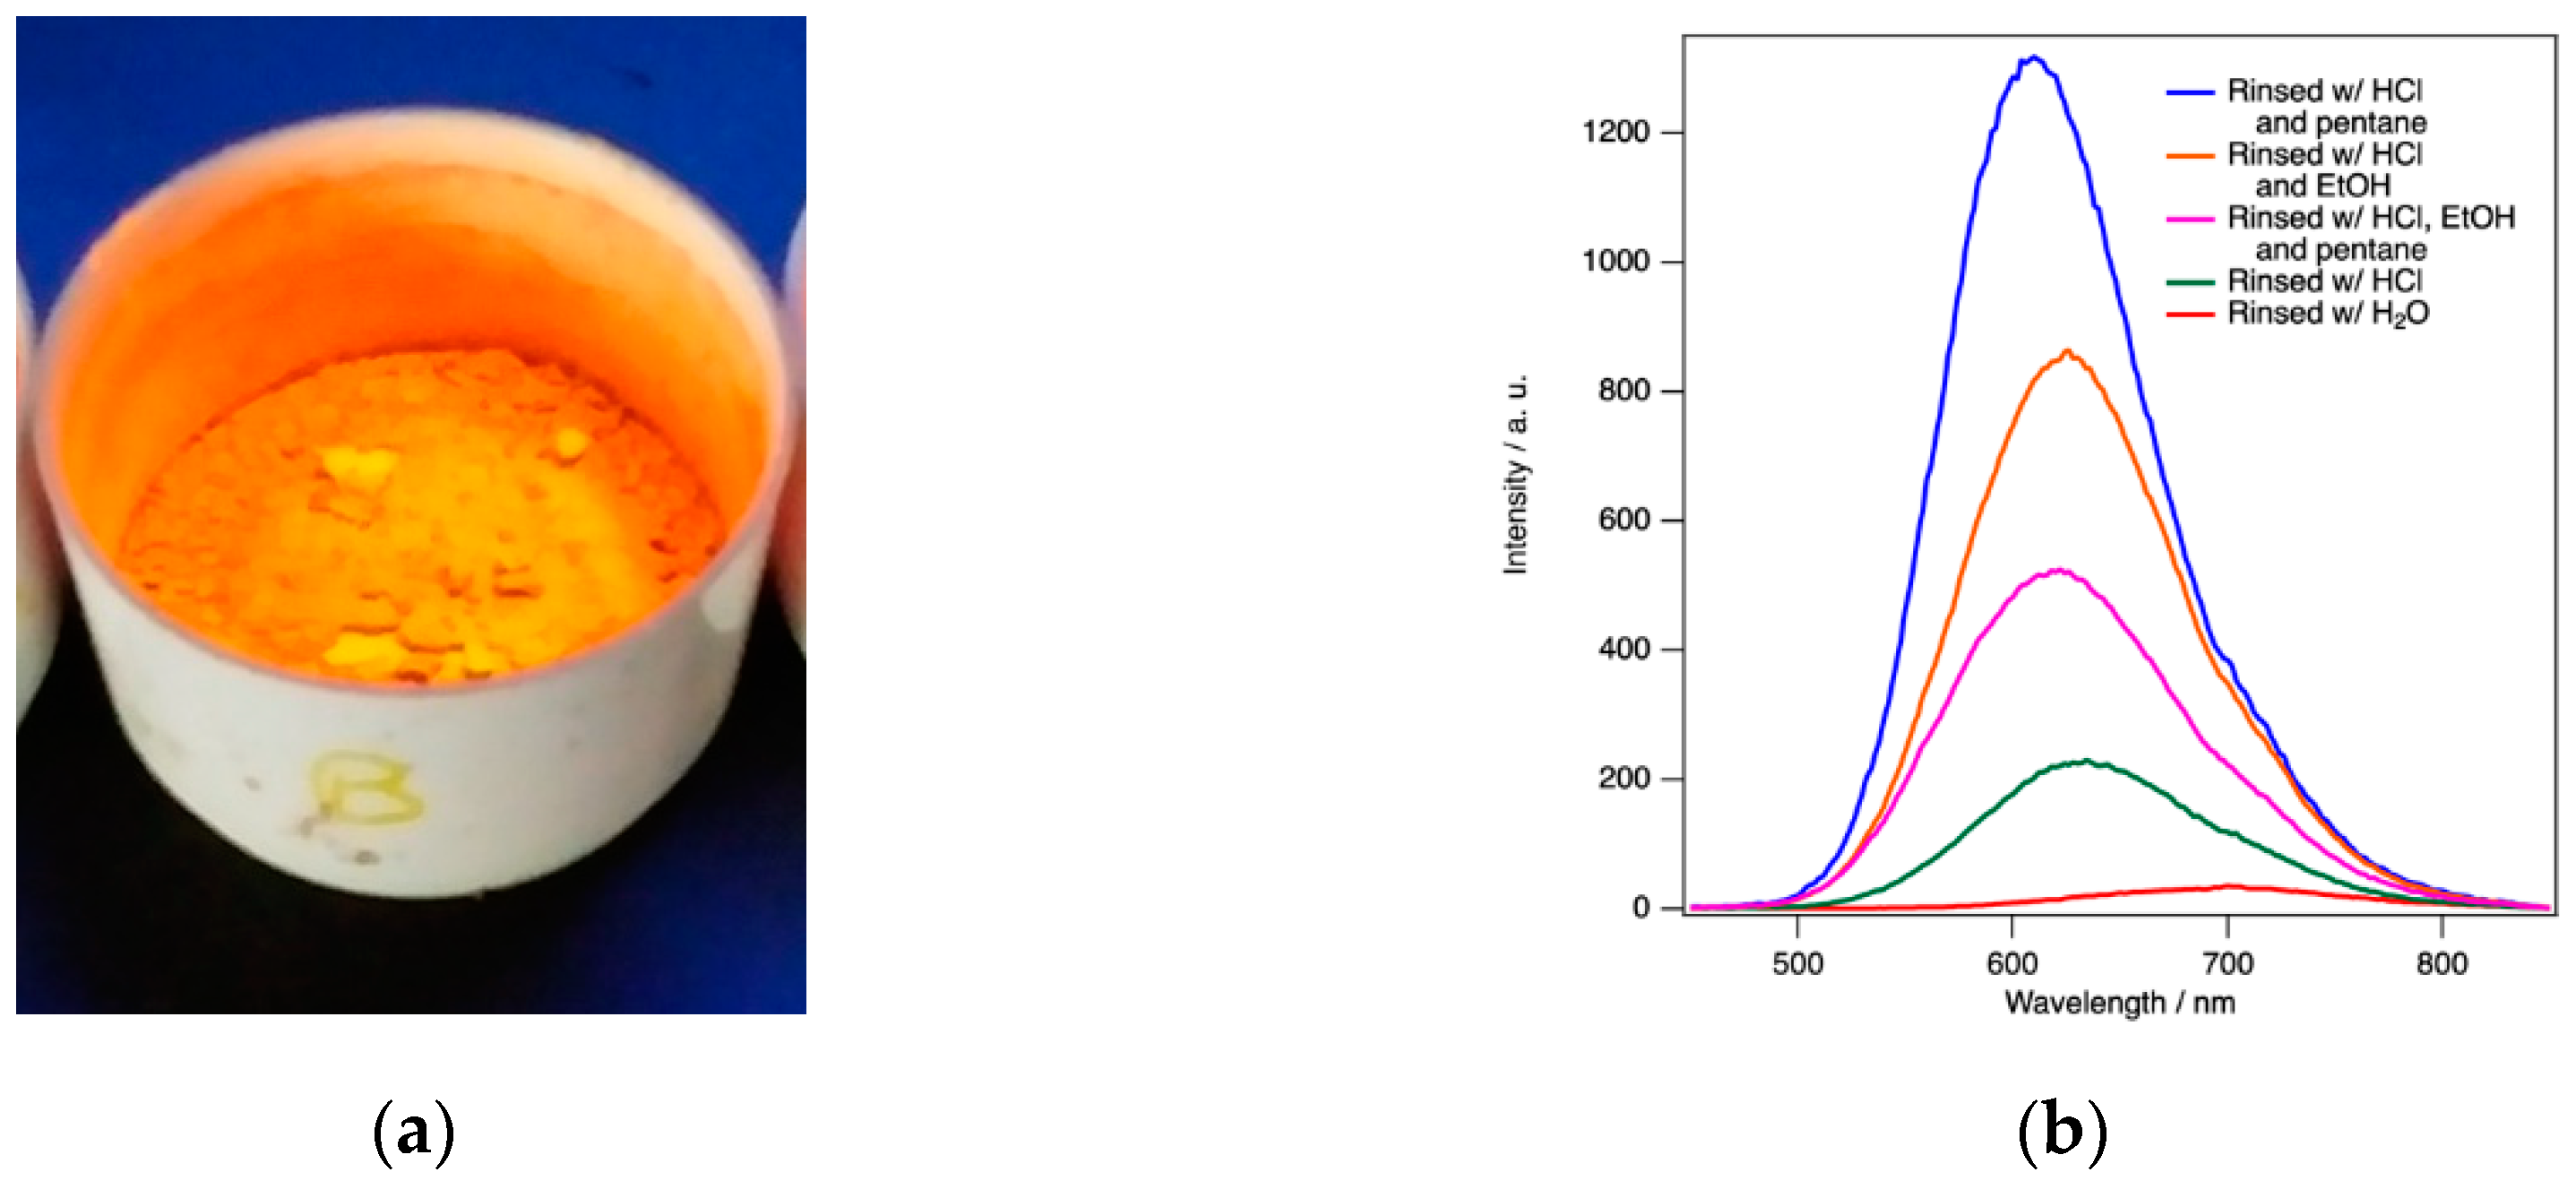
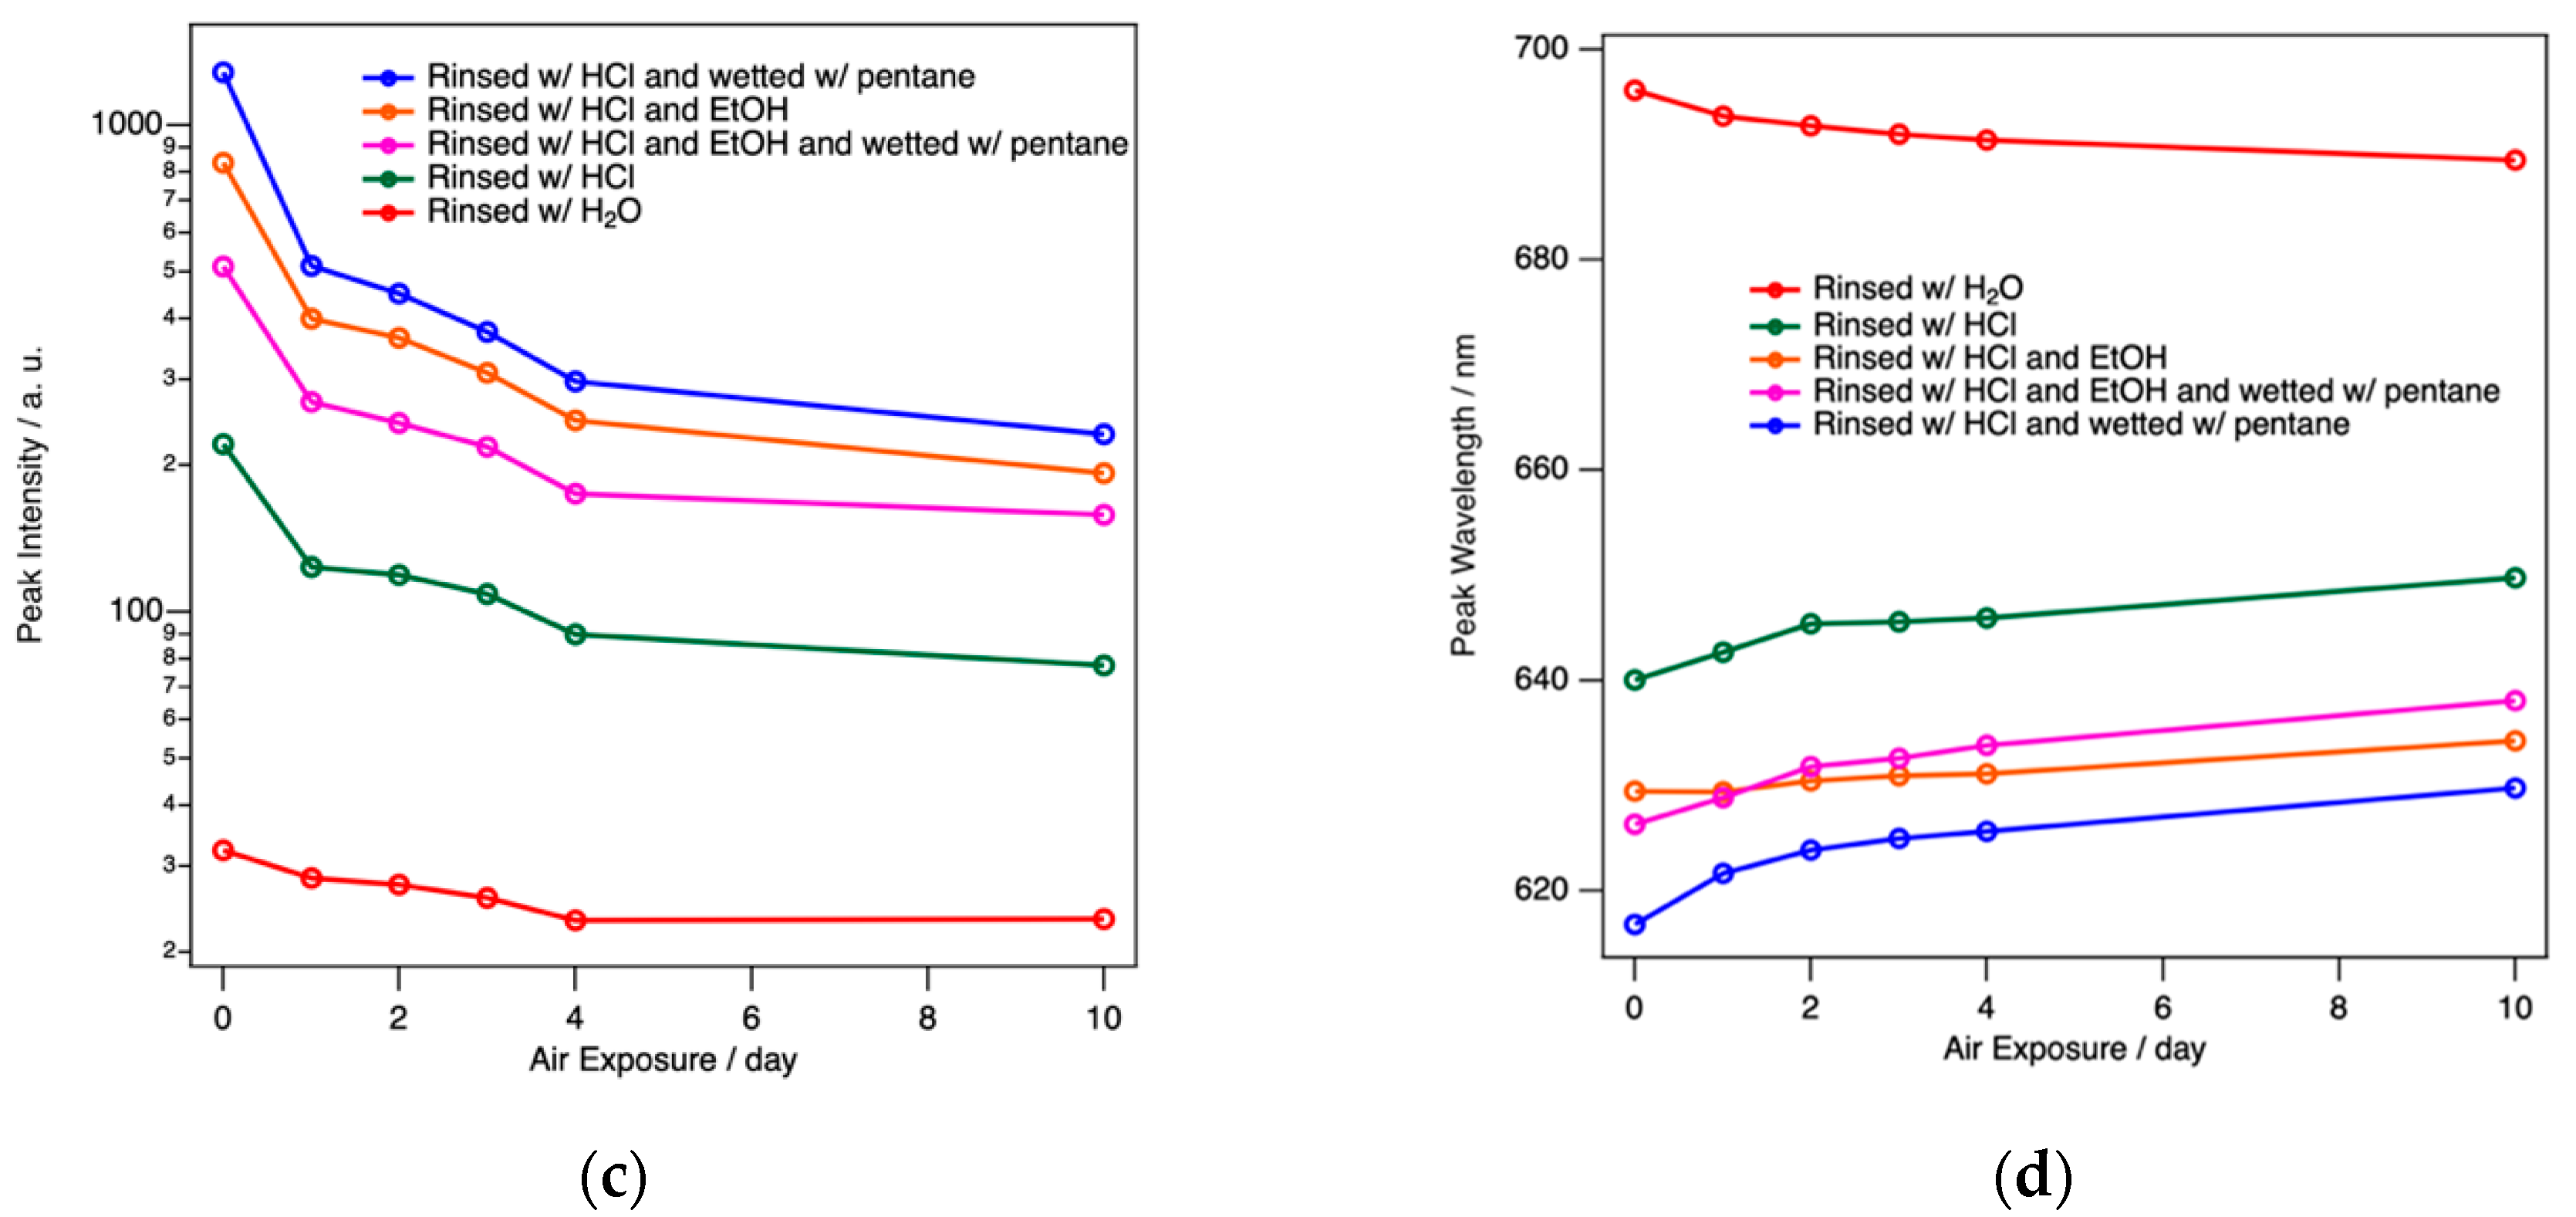
ReEtched por-Si becomes visibly photoluminescent during the etching process. This luminescence can be observed in the etchant and during rinsing under excitation of a handheld UV lamp. The only exception is when ethanol is used because ethanol reversibly quenches the luminescence. The luminescence intensity is greatest after removal from the drying oven as shown in Figure 3a. As demonstrated by the data presented in Figure 3, the intensity, intensity fading, and wavelength shift of the peak maximum all responded to the rinsing conditions.
Rinsing must achieve three imperatives to be effective for retaining maximum PL intensity. It must; (1) remove all etch product and etchant residues, (2) retain maximum H-termination without the incorporation of adsorbates that cause non-radiative traps, and (3) not lead to structural deformations or defects induced by drying that can result in non-radiative traps. Alkaline conditions must be avoided during etching so as to avoid adventitious etching. Only solvents with high dielectric constant can remove ionic etch products and residues. Finally, the fluid that is subjected to air drying should have the lowest possible surface tension. Five different rinsing protocols were investigated: (i) water only, (ii) dilute HCl(aq) only, (iii) dilute HCl(aq) followed by ethanol, (iv) dilute HCl(aq) followed by pentane, and (v) dilute HCl(aq) followed by ethanol followed by pentane.
Regardless of the drying protocol, PL spectra evolved to a steady state over the course of 10–14 days. By far the worst performing rinsing protocol was water only. This resulted in the lowest intensity by far and a significant initial redshift of the peak maximum (696 nm compared to 616 nm for protocol (v) for this series). Unlike all other protocols, samples rinsed with water alone exhibit a blueshift (696 nm to 690 nm in this example) rather than a redshift upon air exposure. Rinsing protocols (i)–(v) exhibited redshifts ranging from 5 nm to 17 nm. PL spectra obtained after water only rinsing also exhibited the greatest sample-to-sample variability.
Dilute HCl(aq) alone was also inferior to the two- or three-step protocols with substantial sample-to-sample variability. Two- and three-step protocols all tend to produce powders with similar steady-state intensity and peak wavelengths. For simplicity, a thorough rinsing with dilute HCl(aq) followed by just a few mL of pentane to wet the powder, before it is allowed to air dry for a few minutes, and then placed in an oven for complete drying is found to be the preferred method to retain the greatest PL intensity with the bluest final peak wavelength. Sample-to-sample variations were still observed in the absolute intensity (within a factor of 2) and peak wavelength values (initially 600–620 nm redshifting to 610–630 nm) for dilute HCl(aq) + pentane rinsing. However, it consistently exhibits the highest intensity and bluest peak wavelength. Trends between the five different protocols always followed the patterns reported in Figure 3.
3.3. pH Dependence
The PL intensity of both H-terminated and hydrosilylated por-Si stabilized after exposure to HCl(aq) for several hours for pH ≤ 5. PL intensity was found to have little if any dependence on pH or time of exposure to HCl(aq) for pH ≤ 5. Above pH 5, the intensity of H-terminated por-Si is much more variable. This region also exhibited greater sample-to-sample variation as well as variation with time exposed to the solution. While, there may be some tendency for the PL intensity to increase over the range 5 < pH < 7, the dependence is not much stronger than the sample-to-sample variations observed. Therefore, it cannot be unambiguously determined whether the changes in PL intensity in this pH range were due to an intrinsic pH dependence or to changes in the surface chemistry of the sample because repeated sampling of the same sample as the pH was varied did not lead to the same PL spectrum. The determination of the pH dependence will be the subject of future study.
Phosphate buffered saline solutions (PBS) are a commonly used medium for cell culturing and biochemistry experiments. Typically, they have a pH value of 7.2 to 7.4, a range in which H-terminated por-Si is unstable both with regard to its structure (because of alkaline etching) and PL. Therefore, stabilization by hydrosilylation has been investigated.
As expected, hydrosilylation changed the PL response and extended the useful range of pH values into the range encountered in PBS. As reported previously [42], exposure to phosphate buffer first enhanced PL intensity. Here, we found that the intensity variation depended on the pH of the phosphate buffer as shown in Figure 4. Over the course of the first 1–2 days of continuous exposure to phosphate buffer in the range 6 ≤ pH ≤ 8, the PL intensity increased by as much as a factor of ~6. Over the course of one week, PL intensity remained above the initial intensity for buffers with pH of 6 or 7. The peak wavelength tends to blue shift with exposure to phosphate buffer. The changes are greatest for pH 8, which is the only sample to exhibit a transient redshift from 617 nm to 624 nm after 4 h exposure. For pH 6 the PL peak is stable at 606 ± 2 nm for exposures of 32–192 h, while over this same period the peak wavelength in pH 7 buffer was 600 ± 5 nm. Note that the data in Figure 4 are typical of individual samples and do not represent the mean averaged over several samples.
Any number of processes might be responsible for the changes in PL intensity and wavelength observed in Figure 4. Included among these are surface reaction (including oxidation), adsorption onto the surface of species from solution, absorption of solution species into the bulk of Si, and etching of Si. Hydrosilylation leads to a fractional coverage of only ~0.5 ML for the –RCOOH moiety. Therefore, the surface is covered by both short, hydrophobic Si–H sites and long, hydrophillic Si–RCOOH sites. Adsorbate interactions with these two different sites may have different and competing effects on the PL spectrum.
One sample of hydrosilylated por-Si was exposed to pH 6 phosphate buffer for one week at room temperature before conducting pH dependence experiments. After being pickled in 0.1 M, pH 6 phosphate buffer for one week, the PL intensity and peak wavelength of hydrosilylated particles remains stable against a changing pH. Three separate series of measurements were performed, each of which consisted of repeated measurements over a period of approximately 2–3 h. Each involved the acquisition of 18 PL spectra in solutions covering the range 6 < pH < 8 in one case and 1.1 < pH < 7.2 in the other two. The PL intensity varied by less than ±7% from the mean and the peak wavelength by no more than ±1 nm from the mean during the course of these three experiments.
3.4. Temperature Dependence
The PL intensity of H-terminated porous silicon was found to have little if any dependence on pH or time of exposure to HCl(aq) for pH ≤ 5. Therefore, we chose to investigate the temperature dependence of H-terminated por-Si at pH 4.9. The results are shown in Figure 5. Photoluminescence of por-Si exhibited a strong dependence on temperature in the range 20–50 °C. To analyze these spectra quantitatively, they were fitted to a skewed Gaussian function [58]:
All PL spectra were fitted to Equation (1) over the wavelength range 500 nm ≤ λ ≤ 750 nm to determine the peak amplitude A, peak wavelength λ0, asymmetry parameter b and the width parameter Δx.
From Figure 5 it is clear to see that each of the spectral parameters was linearly dependent on T with the peak wavelength λ0 and width parameter Δx both increasing with increasing T, whereas the peak amplitude A and asymmetry parameter b were both anti-correlated with T. The use of these four parameters could potentially facilitate the use of the PL response of por-Si as a type of differential sensor. In a conventional differential sensor [59], an array of sensors with distinctive selectivities is constructed. Each of these has a quite general response to a wide variety of analytes. Specificity is obtained by the pattern of responses to a set of several parameters. The broad PL peak observed for por-Si is engendered by the broad range of Si nanocrystal sizes and shapes that comprise the material. Here we exploited the inherent inhomogeneities of por-Si to provide a differential array of PL responses.
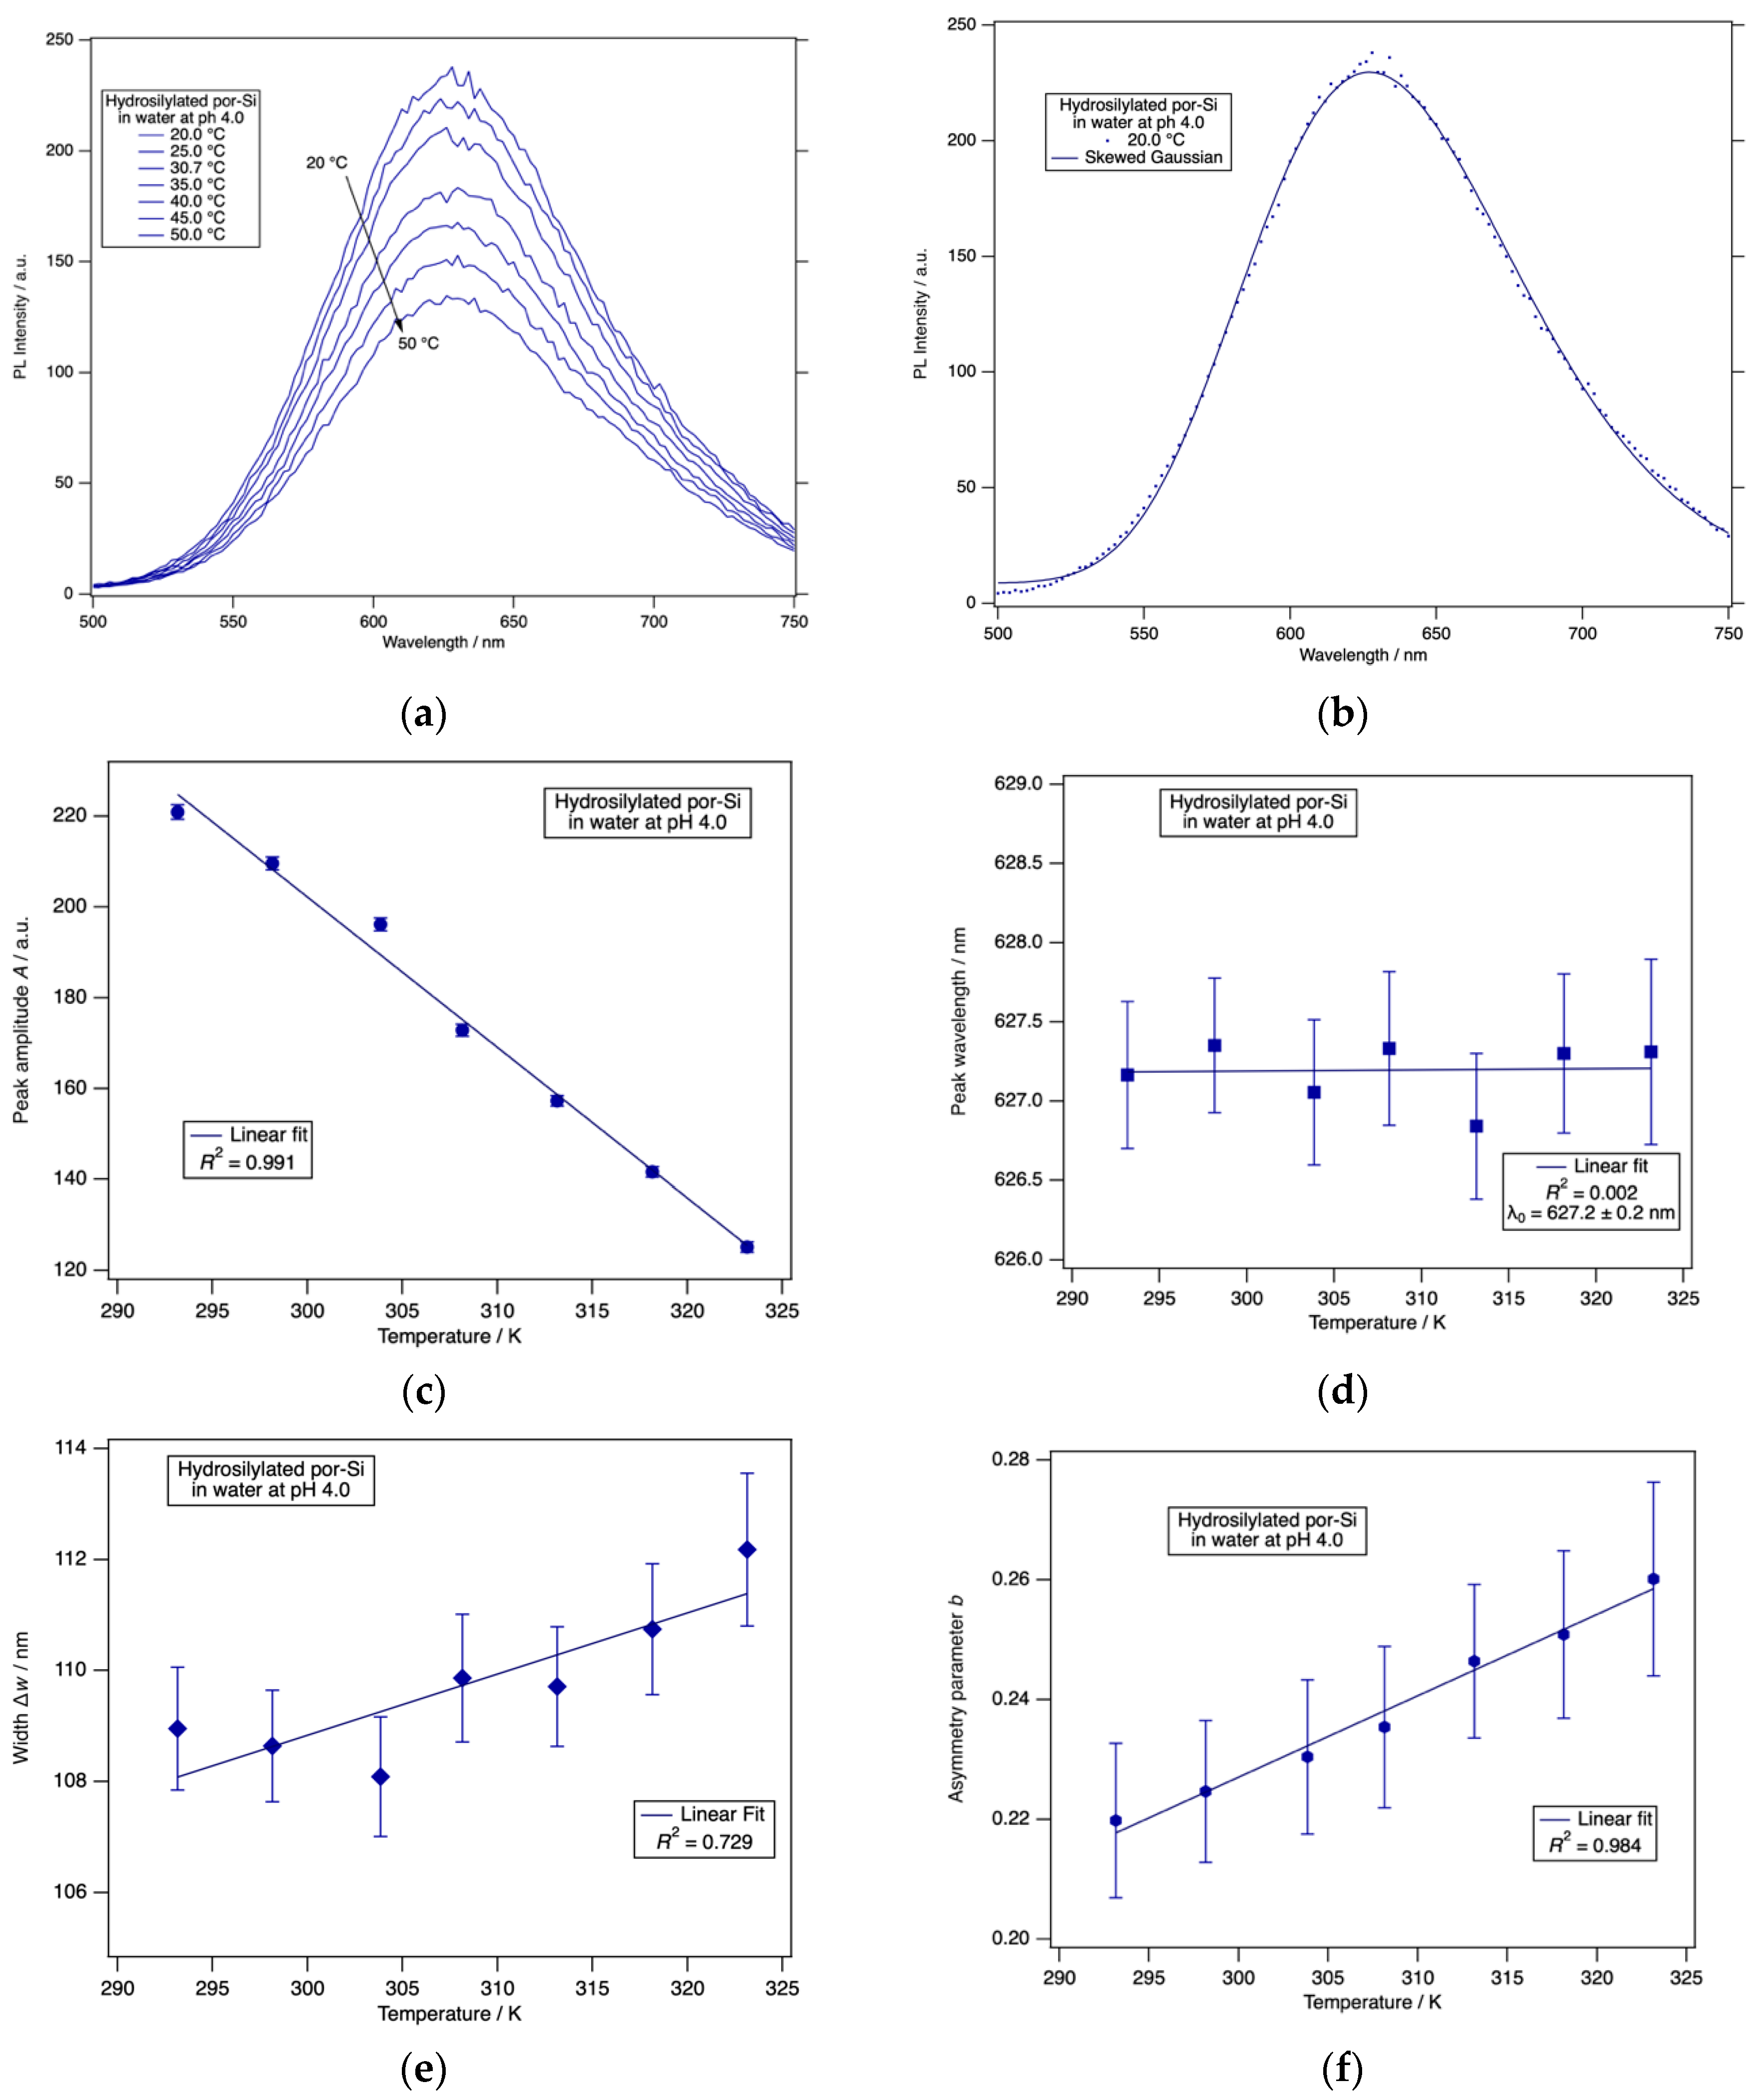
To explore whether these parameters responded to changes in surface chemistry, and, therefore, might form the basis of a differential sensing protocol, we acquired PL spectra as a function of temperature from a hydrosilylated por-Si sample. The results are shown in Figure 6 for an undecylenic acid-terminated por-Si sample held in HCl(aq) at pH 4.0.
The spectra again were well-described by a skewed Gaussian function. Importantly, the spectral parameters were found to have temperature dependences distinct from those of a H-terminated surface. The amplitude decreased with increasing temperature and the width parameter increased with increasing temperature just as for H-terminated por-Si. However, the peak wavelength was constant, and the asymmetry parameter increases linearly with increasing temperature. The behavior of these two parameters clearly differentiates the undecylenic acid-terminated por-Si from the H-terminated por-Si.
Further studies will be required to determine the specificity and versatility of this differential sensor scheme based on por-Si PL. The experimental uncertainties in the amplitude and peak wavelength are quite small compared to their magnitudes. However, the uncertainties in the width and asymmetry parameters are more substantial compared to their range of change. Repeated experiments on the same or following day resulted in the same trends and values of these parameters within experimental uncertainty reported in Figure 6. Repeating the experiment using slit width combinations of (10 nm, 10 nm), (5 nm, 10 nm) and (10 nm, 5 nm) for (excitation slit, emission slit) yielded the same trends and same values within experimental uncertainty. Further work will be required to determine the long-term stability of these parameters and whether experimental parameters can be found that reduce their uncertainty.
4. Conclusions
We have shown that the surface termination of porous Si, as well as the rinsing protocol used during sample preparation is important for determining the resilience of the observed photoluminescence. Porous Si powder should be rinsed thoroughly with dilute HCl(aq) during filtration. Subsequently wetting the powder with pentane and allowing this to air dry for a few minutes before complete drying in a vacuum oven is found to generate samples with the bluest and highest intensity PL signal. After drying, subsequent exposure to air causes PL fading in as-etched H-terminated por-Si. The intensity stabilizes after 10–14 days at a reduced level with a shifted peak wavelength. PL intensity of por-Si passivated with undecylenic acid by hydrosilylation is increased by exposure to phosphate buffer. The PL signal from H-terminated or undecylenic acid-terminated por-Si is rather stable when held in water at pH below 5. PL spectra are well-fitted by a skewed Gaussian and the temperature dependences of spectral parameters (amplitude, peak wavelength, width and asymmetry) associated with the skewed Gaussian are distinctly different for H-terminated and undecylenic acid-terminated samples. Future studies will determine whether a differential sensor scheme based on por-Si PL is feasible.
Supplementary Materials
The following are available online at https://www.mdpi.com/2571-9637/3/3/27/s1, Atomic co-ordinates of the optimized clusters shown in Figure 2.
Author Contributions
Conceptualization, K.W.K.; methodology, K.W.K.; formal analysis, K.W.K.; investigation, K.W.K., J.D.S., B.R. and T.L.; resources, K.W.K.; data curation, K.W.K.; writing—original draft preparation, K.W.K.; writing—review and editing, K.W.K., J.D.S., B.R. and T.L.; supervision, K.W.K.; project administration, K.W.K.; funding acquisition, K.W.K. All authors have read and agreed to the published version of the manuscript.
Funding
Supported by funding provided by National Science Foundation award #1825331 and the Pennsylvania State System of Higher Education Technology Fee Program.
Acknowledgments
We appreciate the support of Elkem Materials INC., who provided us with the Si powder used in this study, and the assistance of Felix Goodson in facilitating the hydrosilylation experiments.
Conflicts of Interest
The authors declare no conflict of interest.
References
- Dai, F.; Yi, R.; Yang, H.; Zhao, Y.; Luo, L.; Gordin, M.L.; Sohn, H.; Chen, S.; Wang, C.; Zhang, S.; et al. Minimized Volume Expansion in Hierarchical Porous Silicon upon Lithiation. ACS Appl. Mater. Interfaces 2019, 11, 13257–13263. [Google Scholar] [CrossRef] [PubMed]
- Manj, R.Z.A.; Chen, X.; Rehman, W.U.; Zhu, G.; Luo, W.; Yang, J. Big Potential From Silicon-Based Porous Nanomaterials: In Field of Energy Storage and Sensors. Front. Chem. 2018, 6. [Google Scholar] [CrossRef] [PubMed] [Green Version]
- Ikonen, T.; Nissinen, T.; Pohjalainen, E.; Sorsa, O.; Kallio, T.; Lehto, V.P. Electrochemically anodized porous silicon: Towards simple and affordable anode material for Li-ion batteries. Sci. Rep. 2017, 7, 7880. [Google Scholar] [CrossRef]
- Armstrong, M.J.; O’Dwyer, C.; Macklin, W.J.; Holmes, J.D. Evaluating the performance of nanostructured materials as lithium-ion battery electrodes. Nano Res. 2014, 7, 1–62. [Google Scholar] [CrossRef] [Green Version]
- Hollett, G.; Roberts, D.S.; Sewell, M.; Wensley, E.; Wagner, J.; Murray, W.; Krotz, A.; Toth, B.; Vijayakumar, V.; Sailor, M.J. Quantum Ensembles of Silicon Nanoparticles: Discrimination of Static and Dynamic Photoluminescence Quenching Processes. J. Phys. Chem. C 2019, 123, 17976–17986. [Google Scholar] [CrossRef] [PubMed]
- Wang, J.; Kumeria, T.; Bezem, M.T.; Wang, J.; Sailor, M.J. Self-Reporting Photoluminescent Porous Silicon Microparticles for Drug Delivery. ACS Appl. Mater. Interfaces 2018, 10, 3200–3209. [Google Scholar] [CrossRef] [PubMed]
- Jin, Y.S.; Kim, D.; Roh, H.; Kim, S.; Hussain, S.; Kang, J.Y.; Pack, C.G.; Kim, J.K.; Myung, S.J.; Ruoslahti, E.; et al. Tracking the Fate of Porous Silicon Nanoparticles Delivering a Peptide Payload by Intrinsic Photoluminescence Lifetime. Adv. Mater. 2018, 30. [Google Scholar] [CrossRef] [PubMed]
- Kim, D.; Kang, J.; Wang, T.; Ryu, H.G.; Zuidema, J.M.; Joo, J.; Kim, M.; Huh, Y.; Jung, J.; Ahn, K.H.; et al. Two-Photon In Vivo Imaging with Porous Silicon Nanoparticles. Adv. Mater. 2017, 29. [Google Scholar] [CrossRef] [Green Version]
- Li, W.; Liu, Z.; Fontana, F.; Ding, Y.; Liu, D.; Hirvonen, J.T.; Santos, H.A. Tailoring Porous Silicon for Biomedical Applications: From Drug Delivery to Cancer Immunotherapy. Adv. Mater. 2018, 30, 1703740. [Google Scholar] [CrossRef]
- Fontana, F.; Albertini, S.; Correia, A.; Kemell, M.; Lindgren, R.; Mäkilä, E.; Salonen, J.; Hirvonen, J.T.; Ferrari, F.; Santos, H.A. Bioengineered Porous Silicon Nanoparticles@Macrophages Cell Membrane as Composite Platforms for Rheumatoid Arthritis. Adv. Funct. Mater. 2018, 28, 1801355. [Google Scholar] [CrossRef]
- Alhmoud, H.; Delalat, B.; Elnathan, R.; Cifuentes-Rius, A.; Chaix, A.; Rogers, M.-L.; Durand, J.-O.; Voelcker, N.H. Porous Silicon Nanodiscs for Targeted Drug Delivery. Adv. Func. Mater. 2015, 25, 1137–1145. [Google Scholar] [CrossRef]
- Xia, X.; Mai, J.; Xu, R.; Perez, J.E.T.; Guevara, M.L.; Shen, Q.; Mu, C.; Tung, H.-Y.; Corry, D.B.; Evans, S.E.; et al. Porous Silicon Microparticle Potentiates Anti-Tumor Immunity by Enhancing Cross-Presentation and Inducing Type I Interferon Response. Cell Rep. 2015, 11, 957–966. [Google Scholar] [CrossRef] [PubMed] [Green Version]
- Kumeria, T.; McInnes, S.J.P.; Maher, S.; Santos, A. Porous silicon for drug delivery applications and theranostics: Recent advances, critical review and perspectives. Expert Opin. Drug Deliv. 2017, 14, 1407–1422. [Google Scholar] [CrossRef] [PubMed]
- Tasciotti, E.; Godin, B.; Martinez, J.; Chiappini, C.; Bhavane, R.; Liu, X.; Ferrari, M. Near-Infrared Imaging Method for the In Vivo Assessment of the Biodistribution of Nanoporous Silicon Particles. Mol. Imaging 2011, 10. [Google Scholar] [CrossRef]
- Dalilottojari, A.; Delalat, B.; Harding, F.J.; Cockshell, M.P.; Bonder, C.S.; Voelcker, N.H. Porous Silicon-Based Cell Microarrays: Optimizing Human Endothelial Cell-Material Surface Interactions and Bioactive Release. Biomacromolecules 2016, 17, 3724–3731. [Google Scholar] [CrossRef]
- Canham, L.T.; Reeves, C.L.; Wallis, D.J.; Newey, J.P.; Houlton, M.R.; Sapsford, G.J.; Godfrey, R.E.; Loni, A.; Simons, A.J.; Cox, T.I.; et al. Silicon as an active biomaterial. Mater. Res. Soc. Symp. Proc. 1997, 452, 579–590. [Google Scholar] [CrossRef]
- Canham, L.T. Bioactive silicon structure fabrication through nanoetching techniques. Adv. Mater. 1995, 7, 1033–1037. [Google Scholar] [CrossRef]
- Park, J.H.; Gu, L.; von Maltzahn, G.; Ruoslahti, E.; Bhatia, S.N.; Sailor, M.J. Biodegradable luminescent porous silicon nanoparticles for in vivo applications. Nat. Mater. 2009, 8, 331–336. [Google Scholar] [CrossRef]
- Santos, H.A.; Mäkilä, E.; Airaksinen, A.J.; Bimbo, L.M.; Hirvonen, J. Porous silicon nanoparticles for nanomedicine: Preparation and biomedical applications. Nanomedicine 2014, 9, 535–554. [Google Scholar] [CrossRef]
- Shin, H.C.; Corno, J.A.; Gole, J.L.; Liu, M.L. Porous silicon negative electrodes for rechargeable lithium batteries. J. Power Sources 2005, 139, 314–320. [Google Scholar] [CrossRef]
- Green, M.; Fielder, E.; Scrosati, B.; Wachtler, M.; Moreno, J.S. Structured Silicon Anodes for Lithium Battery Applications. Electrochem. Solid-State Lett. 2003, 6, A75. [Google Scholar] [CrossRef]
- Canham, L.T. Silicon quantum wire array fabrication by electrochemical and chemical dissolution of wafers. Appl. Phys. Lett. 1990, 57, 1046–1048. [Google Scholar] [CrossRef]
- Wolkin, M.V.; Jorne, J.; Fauchet, P.M.; Allan, G.; Delerue, C. Electronic states and luminescence in porous silicon quantum dots: The role of oxygen. Phys. Rev. Lett. 1999, 82, 197–200. [Google Scholar] [CrossRef]
- Kolasinski, K.W.; Aindow, M.; Barnard, J.C.; Ganguly, S.; Koker, L.; Wellner, A.; Palmer, R.E.; Field, C.; Hamley, P.; Poliakoff, M. On the role of the pore filling medium in photoluminescence from photochemically etched porous silicon. J. Appl. Phys. 2000, 88, 2472–2479. [Google Scholar] [CrossRef]
- Canham, L. Introductory lecture: Origins and applications of efficient visible photoluminescence from silicon-based nanostructures. Faraday Discuss. 2020. [Google Scholar] [CrossRef]
- Gelloz, B.; Juangsa, F.B.; Nozaki, T.; Asaka, K.; Koshida, N.; Jin, L. Si/SiO2 Core/Shell Luminescent Silicon Nanocrystals and Porous Silicon Powders With High Quantum Yield, Long Lifetime, and Good Stability. Front. Phys. 2019, 7, 47. [Google Scholar] [CrossRef] [Green Version]
- Sa’ar, A. Photoluminescence from silicon nanostructures: The mutual role of quantum confinement and surface chemistry. J. Nanophotonics 2009, 3, 032501. [Google Scholar] [CrossRef]
- Dovrat, M.; Goshen, Y.; Jedrzejewski, J.; Balberg, I.; Sa’ar, A. Radiative versus nonradiative decay processes in silicon nanocrystals probed by time-resolved photoluminescence spectroscopy. Phys. Rev. B 2004, 69, 155311. [Google Scholar] [CrossRef]
- Luppi, M.; Ossicini, S. Ab initio study on oxidized silicon clusters and silicon nanocrystals embedded in SiO2: Beyond the quantum confinement effect. Phys. Rev. B 2005, 71, 035340. [Google Scholar] [CrossRef]
- Yablonovitch, E.; Allara, D.L.; Chang, C.C.; Gmitter, T.; Bright, T.B. Unusually low surface-recombination velocity on silicon and germanium surfaces. Phys. Rev. Lett. 1986, 57, 249–252. [Google Scholar] [CrossRef]
- Halimaoui, A. Determination of the specific surface area of porous silicon from its etch rate in HF solutions. Surf. Sci. 1994, 306, L550–L554. [Google Scholar] [CrossRef]
- Allongue, P.; Costa-Kieling, V.; Gerischer, H. Etching of Silicon in NaOH Solutions: II. Electrochemical Studies of n-Si (111) and (100) and Mechanism of the Dissolution. J. Electrochem. Soc. 1993, 140, 1018–1026. [Google Scholar] [CrossRef]
- Allongue, P.; Costa-Kieling, V.; Gerischer, H. Etching of Silicon in NaOH Solutions: I. In Situ Scanning Tunneling Microscopic Investigation of n-Si (111). J. Electrochem. Soc. 1993, 140, 1009–1018. [Google Scholar] [CrossRef]
- Baum, T.; Schiffrin, D.J. Mechanistic aspects of anisotropic dissolution of materials etching of single-crystal silicon in alkaline solutions. J. Chem. Soc. Faraday Trans. 1998, 94, 691–694. [Google Scholar] [CrossRef]
- Sun, Q.Y.; de Smet, L.C.P.M.; van Lagen, B.; Wright, A.; Zuilhof, H.; Sudholter, E.J.R. Covalently attached monolayers on hydrogen terminated Si(100): Extremely mild attachment by visible light. Angew. Chem. Int. Ed. Engl. 2004, 43, 1352–1355. [Google Scholar] [CrossRef]
- Cicero, R.L.; Linford, M.R.; Chidsey, C.E.D. Photoreactivity of Unsaturated Compounds with Hydrogen-Terminated Silicon(111). Langmuir 2000, 16, 5688–5695. [Google Scholar] [CrossRef]
- Stewart, M.P.; Buriak, J.M. Photopatterned Hydrosilylation on Porous Silicon. Angew. Chem. Int. Ed. Engl. 1998, 37, 3257–3260. [Google Scholar] [CrossRef]
- Linford, M.R.; Fenter, P.; Eisenberger, P.M.; Chidsey, C.E.D. Alkyl monolayers on silicon prepared from 1-alkenes and hydrogen-terminated silicon. J. Am. Chem. Soc. 1995, 117, 3145–3155. [Google Scholar] [CrossRef]
- Linford, M.R.; Chidsey, C.E.D. Alkyl monolayers covalently bonded to silicon surfaces. J. Am. Chem. Soc. 1993, 115, 12631–12632. [Google Scholar] [CrossRef]
- de Smet, L.C.P.M.; Zuilhof, H.; Sudholter, E.J.R.; Lie, L.H.; Houlton, A.; Horrocks, B.R. Mechanism of the hydrosilylation reaction of alkenes at porous silicon: Experimental and computational deuterium labeling studies. J. Phys. Chem. B 2005, 109, 12020–12031. [Google Scholar] [CrossRef]
- Anglin, E.J.; Schwartz, M.P.; Ng, V.P.; Perelman, L.A.; Sailor, M.J. Engineering the chemistry and nanostructure of porous Silicon Fabry-Perot films for loading and release of a steroid. Langmuir 2004, 20, 11264–11269. [Google Scholar] [CrossRef] [PubMed]
- Mäkilä, E.; Anton Willmore, A.-M.; Yu, H.; Irri, M.; Aindow, M.; Teesalu, T.; Canham, L.T.; Kolasinski, K.W.; Salonen, J. Hierarchical Nanostructuring of Porous Silicon with Electrochemical and Regenerative Electroless Etching. ACS Nano 2019, 13, 13056–13064. [Google Scholar] [CrossRef] [PubMed]
- Furey, B.J.; Silbaugh, D.A.; Yu, Y.; Guillaussier, A.C.; Estrada, A.D.; Stevens, C.; Maynard, J.A.; Korgel, B.A.; Downer, M.C. Measurement of Two-Photon Absorption of Silicon Nanocrystals in Colloidal Suspension for Bio-Imaging Applications. Phys. Status Solidi (b) 2018, 255, 1700501. [Google Scholar] [CrossRef]
- Wong, K.T.; Lewis, N.S. What a difference a bond makes: The structural, chemical, and physical properties of methyl-terminated Si(111) surfaces. Acc. Chem. Res. 2014, 47, 3037–3044. [Google Scholar] [CrossRef] [PubMed] [Green Version]
- Kolasinski, K.W. Silicon Surface Photochemistry. In Encyclopedia of Interfacial Chemistry: Surface Science and Electrochemistry; Wandelt, K., Ed.; Elsevier: Oxford, UK, 2018; Volume 2, pp. 611–620. [Google Scholar]
- Yang, Z.; Gonzalez, C.M.; Purkait, T.K.; Iqbal, M.; Meldrum, A.; Veinot, J.G.C. Radical Initiated Hydrosilylation on Silicon Nanocrystal Surfaces: An Evaluation of Functional Group Tolerance and Mechanistic Study. Langmuir 2015, 31, 10540–10548. [Google Scholar] [CrossRef] [PubMed]
- Jaganathan, H.; Godin, B. Biocompatibility assessment of Si-based nano- and micro-particles. Adv. Drug Deliver. Rev. 2012, 64, 1800–1819. [Google Scholar] [CrossRef] [PubMed] [Green Version]
- Sychugov, I.; Valenta, J.; Linnros, J. Probing silicon quantum dots by single-dot techniques. Nanotechnology 2017, 28, 072002. [Google Scholar] [CrossRef]
- Liu, H.I.; Biegelsen, D.K.; Johnson, N.M.; Ponce, F.A.; Pease, R.F.W. Self-limiting oxidation of Si nanowires. J. Vac. Sci. Technol. B 1993, 11, 2532–2537. [Google Scholar] [CrossRef]
- Gelloz, B.; Kojima, A.; Koshida, N. Highly efficient and stable luminescence of nanocrystalline porous silicon treated by high-pressure water vapor annealing. Appl. Phys. Lett. 2005, 87, 031107. [Google Scholar] [CrossRef]
- Bellet, D.; Canham, L. Controlled Drying: The key to better quality porous semiconductors. Adv. Mater. 1998, 10, 487–490. [Google Scholar] [CrossRef]
- Joo, J.; Defforge, T.; Loni, A.; Kim, D.; Li, Z.Y.; Sailor, M.J.; Gautier, G.; Canham, L.T. Enhanced quantum yield of photoluminescent porous silicon prepared by supercritical drying. Appl. Phys. Lett. 2016, 108, 153111. [Google Scholar] [CrossRef]
- Wang, C.-F.; Sarparanta, M.P.; Mäkilä, E.; Hyvonen, M.L.K.; Laakkonen, P.M.; Salonen, J.J.; Hirvonen, J.T.; Airaksinen, A.J.; Santos, H.A. Multifunctional porous silicon nanoparticles for cancer theranostics. Biomaterials 2015, 48, 108–118. [Google Scholar] [CrossRef] [PubMed]
- Salonen, J.; Lehto, V.P. Fabrication and chemical surface modification of mesoporous silicon for biomedical applications. Chem. Eng. J. 2008, 137, 162–172. [Google Scholar] [CrossRef]
- Kolasinski, K.W.; Gimbar, N.J.; Yu, H.; Aindow, M.; Mäkilä, E.; Salonen, J. Regenerative Electroless Etching of Silicon. Angew. Chem. Int. Ed. Engl. 2017, 56, 624–627. [Google Scholar] [CrossRef]
- Rumble, J.R. (Ed.) CRC Handbook of Chemistry and Physics, 100th (Internet Version) ed.; CRC Press/Taylor & Francis: Boca Raton, FL, USA, 2019. [Google Scholar]
- Kolasinski, K.W.; Hartline, J.D.; Kelly, B.T.; Yadlovskiy, J. Dynamics of Porous Silicon Formation by Etching in HF + V2O5 Solutions. Mol. Phys. 2010, 108, 1033–1043. [Google Scholar] [CrossRef]
- Rusch, P.F.; Lelieur, J.P. Analytical moments of skewed Gaussian distribution functions. Anal. Chem. 1973, 45, 1541–1543. [Google Scholar] [CrossRef]
- Wong, S.-F.; Khor, S.M. State-of-the-art of differential sensing techniques in analytical sciences. TrAC Trends Anal. Chem. 2019, 114, 108–125. [Google Scholar] [CrossRef]
Figure 1.
FTIR spectra obtained from as-etched H-terminated por-Si (red curve) and hydrosilylated por-Si (blue curve).
Figure 1.
FTIR spectra obtained from as-etched H-terminated por-Si (red curve) and hydrosilylated por-Si (blue curve).

Figure 2.
The geometry obtained from DFT total energy minimization calculations on a Si32 cluster with all dangling bonds terminated. Si atoms are blue, C atoms black, H atoms white and O atoms red. (a) Si32H36 cluster viewed along the direction exposing an upper surface with the geometry of the Si(001)–(1 × 1) surface terminated with four SiH2 units. The 28 H atoms not belonging to these SiH2 units are assigned the same mass as a Si atom. (b) The same Si32H36 cluster rotated by roughly 90° so as to view along the direction. (c) Substitution of one adsorbed H atom from an SiH2 unit with an undecylenic acid molecule bound through the α-C. The cluster is rotated roughly along the direction as in (a). (d) The same hydrosilylated cluster as in (c) but now rotated as in (b) along the direction. Atomic co-ordinates of the optimized clusters are available in the Supplementary Materials.

Figure 3.
(a) PL observed under UV irradiation for a sample still in the Büchner funnel top after oven drying. The rinsing procedure clearly influences; (b) absolute intensity of PL, (c) the intensity fading behavior as a function of time; and (d) the peak wavelength and how it changes with air exposure. All data shown here pertain to as-etched initially H-terminated por-Si.


Figure 4.
(a) The photoluminescence intensity of hydrosilylated por-Si held in phosphate buffer changed with exposure time in a manner that was dependent on pH. (b) Exposure to phosphate buffer for all three pH values tended to blue shift the peak maximum.
Figure 4.
(a) The photoluminescence intensity of hydrosilylated por-Si held in phosphate buffer changed with exposure time in a manner that was dependent on pH. (b) Exposure to phosphate buffer for all three pH values tended to blue shift the peak maximum.
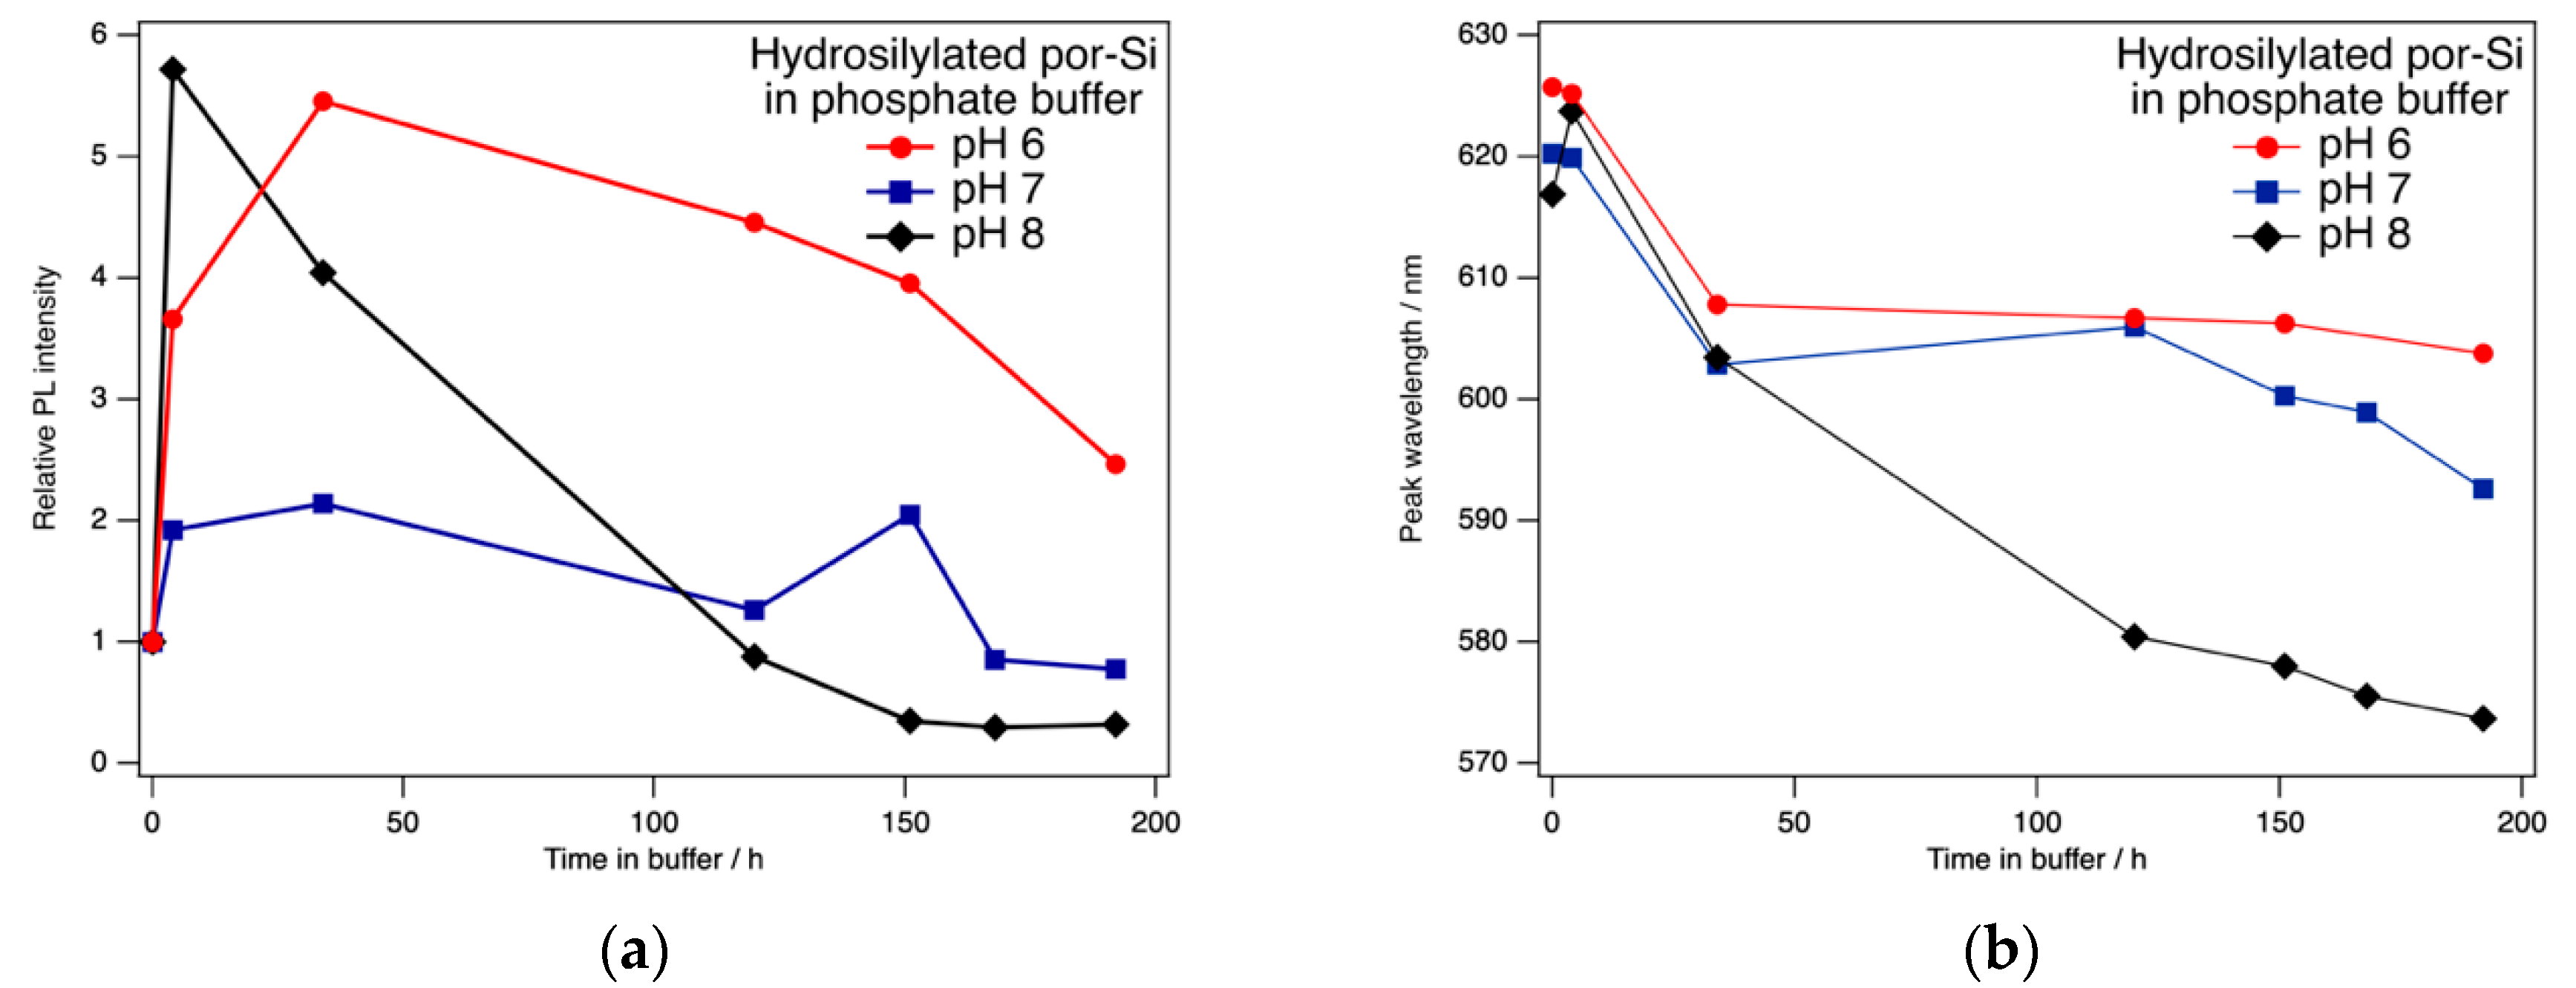
Figure 5.
(a) The photoluminescence spectra of H-terminated por-Si held in HCl(aq) at pH 4.9 changed systematically with increasing temperature. (b) A typical fit to the skewed Gaussian given in Equation (1). (c) The peak amplitude A decreased linearly with increasing temperature. (d) The peak wavelength λ0 redshifted linearly with increasing temperature. (e) The peak width parameter Δx increased linearly with increasing temperature. (f) The asymmetry parameter b decreased linearly with increasing temperature. All error bars represent 95% confidence limits as derived from the nonlinear least squares fit.
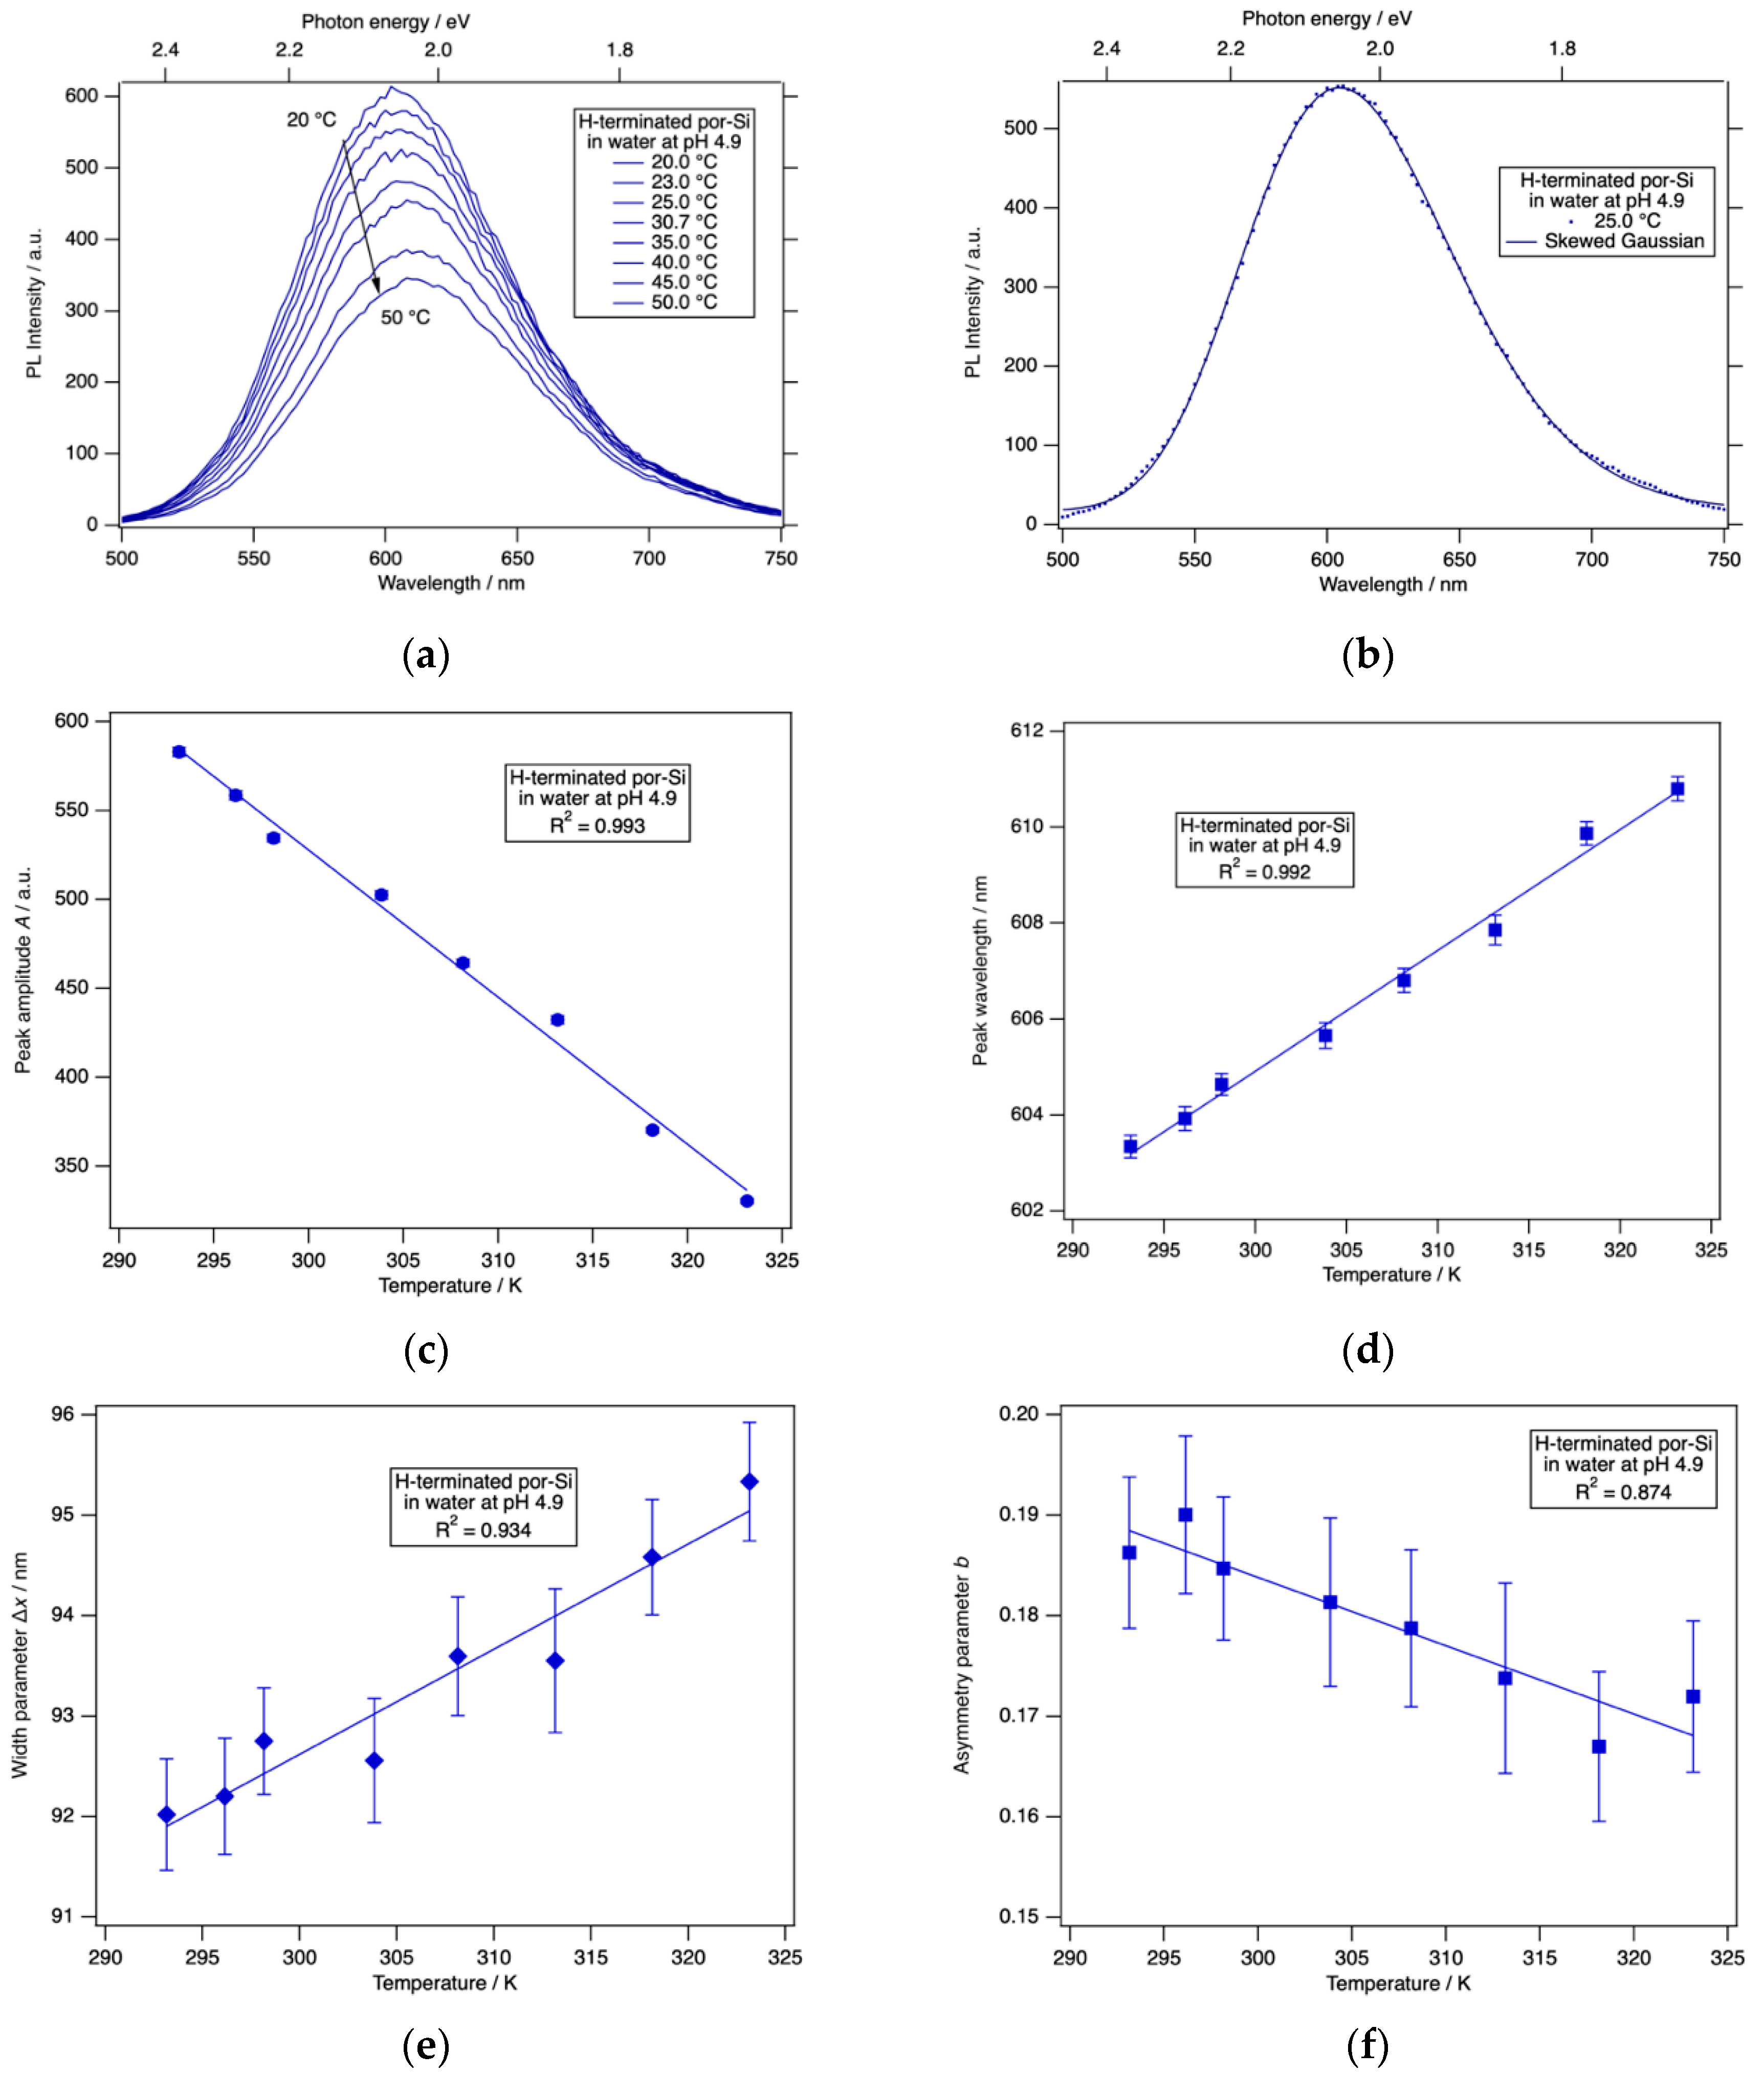
Figure 6.
(a) The photoluminescence spectrum of hydrosilylated por-Si held in HCl(aq) at pH 4.0 was affected systematically by temperature. (b) A typical fit to the skewed Gaussian given in Equation (1). (c) The peak amplitude A decreased linearly with increasing temperature. (d) The peak wavelength λ0 was constant as a function of temperature. (e) The peak width parameter Δx increased linearly with increasing temperature. (f) The asymmetry parameter b increased linearly with increasing temperature. All error bars represent 95% confidence limits as derived from the nonlinear least squares fit.

© 2020 by the authors. Licensee MDPI, Basel, Switzerland. This article is an open access article distributed under the terms and conditions of the Creative Commons Attribution (CC BY) license (http://creativecommons.org/licenses/by/4.0/).
Share and Cite
MDPI and ACS Style
Kolasinski, K.W.; Swanson, J.D.; Roe, B.; Lee, T. Response of Photoluminescence of H-Terminated and Hydrosilylated Porous Si Powders to Rinsing and Temperature. Surfaces 2020, 3, 366-380. https://doi.org/10.3390/surfaces3030027
AMA Style
Kolasinski KW, Swanson JD, Roe B, Lee T. Response of Photoluminescence of H-Terminated and Hydrosilylated Porous Si Powders to Rinsing and Temperature. Surfaces. 2020; 3(3):366-380. https://doi.org/10.3390/surfaces3030027
Chicago/Turabian StyleKolasinski, Kurt W., Joseph D. Swanson, Benjamin Roe, and Teresa Lee. 2020. "Response of Photoluminescence of H-Terminated and Hydrosilylated Porous Si Powders to Rinsing and Temperature" Surfaces 3, no. 3: 366-380. https://doi.org/10.3390/surfaces3030027