Local Surface Electric Field’s Effect on Adsorbed Proteins’ Orientation

 ,
,
Abstract
:
1. Introduction
2. Materials and Methods
3. Results
3.1. Surface Characterization
3.2. Protein–Surface Interaction Analysis
4. Discussion
5. Conclusions
Supplementary Materials
Author Contributions
Funding
Acknowledgments
Conflicts of Interest
References
- Pilehvar, S.; Wael, K.D. Recent Advances in Electrochemical Biosensors Based on Fullerene-C60 Nano-Structured Platforms. Biosensors 2015, 5, 712–735. [Google Scholar] [CrossRef] [PubMed] [Green Version]
- Bhalla, N.; Jolly, P.; Formisano, N.; Estrela, P. Introduction to Biosensors. Essays Biochem. 2016, 60, 1–8. [Google Scholar] [CrossRef] [PubMed]
- Eggins, B.R. Chemical Sensors and Biosensors; Wiley& Sons: Chichester, UK, 2002; Chapter 1; pp. 2–5. [Google Scholar]
- Wilson, J.S. Sensor Technology Handbook; Elsevier: Oxford, UK, 2004; Chapter 6; p. 161. [Google Scholar]
- Chandran, K.; Rajkumar, R.; Bhagrava, K. Biosensors and Bioelectronics; Elsevier: Amsterdam, The Netherlands, 2015; Chapter 1; pp. 2–66. [Google Scholar]
- Touhami, A. Nanomedicine; One Central Press: Cheshire, UK, 2014; Chapter 15; p. 377. [Google Scholar]
- Zhang, X.; Ju, H.; Wang, J. Electrochemical Sensors, Biosensors and their Biomedical Applications; Academic Press: San Diego, CA, USA, 2008; Chapter 3; p. 58. [Google Scholar]
- Ding, J.; Qin, W. Potentiometric sensing of nuclease activities and oxidative damage of single-stranded DNA using a polycation-sensitive membrane electrode. Biosens. Bioelectr. 2013, 47, 559–565. [Google Scholar] [CrossRef] [PubMed] [Green Version]
- Arora, P.; Sindhu, A.; Dilbaghi, N.; Chaudhury, A. Biosensors as innovative tools for the detection of food borne pathogens. Biosens. Bioelectr. 2011, 28, 1–12. [Google Scholar] [CrossRef]
- Qi, M.; Zhao, K.; Bao, Q.; Pan, P.; Zhao, Y.; Yang, Z.; Wang, H.; Wei, J. Adsorption and Electrochemical Detection of Bovine Serum Albumin Imprinted Calcium Alginate Hydrogel Membrane. Polymers 2019, 11, 622. [Google Scholar] [CrossRef]
- Adams, K.L.; Puchades, M.; Ewing, A.G. In Vitro Electrochemistry of Biological Systems. Anal. Rev. Anal. Chem. (Palo Alto Calif.) 2008, 1, 329–355. [Google Scholar] [CrossRef] [Green Version]
- Peng, F.; Su, Y.; Zhong, Y.; Fan, C.; Lee, S.-T.; He, Y. Silicon Nanomaterials Platform for Bioimaging, Biosensing, and Cancer Therapy. Acc. Chem. Res. 2014, 47, 612–623. [Google Scholar] [CrossRef]
- Pavesi, L.; Turan, R. Silicon Nanocrystals; Wiley-VCH Verlag: Weinheim, Germany, 2010; Chapter 1; pp. 1–4. [Google Scholar]
- Monopoli, M.P.; Aberg, C.; Salvati, A.; Dawson, K.A. Biomolecular coronas provide the biological identity of nanosized materials. Nat. Nanotechnol. 2012, 7, 779. [Google Scholar] [CrossRef]
- Saptarshi, S.R.; Duschl, A.; Lopata, A.L. Interaction of nanoparticles with proteins: Relation to bio-reactivity of the nanoparticle. J. Nanobiotechnol. 2013, 11, 26. [Google Scholar] [CrossRef]
- Givens, B.E.; Diklich, N.D.; Fiegel, J.; Grassian, V.H. Adsorption of bovine serum albumin on silicon dioxide nanoparticles: Impact of pH on nanoparticle–protein interactions. Biointerphases 2017, 12, 02D404. [Google Scholar] [CrossRef]
- Nel, A.E.; Mädler, L.; Velegol, D.; Xia, T.; Hoek, E.M.V.; Somasundaran, P.; Klaessig, F.; Castranova, V.; Thompson, M. Understanding biophysicochemical interactions at the nano-bio interface. Nat. Mater. 2009, 8, 543–557. [Google Scholar] [CrossRef]
- Shemetov, A.A.; Nabiev, I.; Sukhanova, A. Molecular interaction of proteins and peptides with nanoparticles. ACSNano 2012, 6, 4585–4602. [Google Scholar] [CrossRef]
- Meissner, J.; Prause, A.; Bharti, B.; Findenegg, G.H. Characterization of protein adsorption onto silica nanoparticles: Influence of pH and ionic strength. Colloid Polym. Sci. 2015, 293, 3381–3391. [Google Scholar] [CrossRef]
- Kurylowicz, M.; Giuliani, M.; Dutcher, J.R. Using nanoscale substrate curvature to control the dimerization of a surface-bound protein. ACS Nano 2012, 6, 10571–10580. [Google Scholar] [CrossRef]
- Shang, W.; Nuffer, J.H.; Muniz-Papandrea, V.A.; Colón, W.; Siegel, R.W.; Dordick, J.S. Cytochrome C on silica nanoparticles: Influence of nanoparticle size on protein structure, stability, and activity. Small 2009, 5, 470–476. [Google Scholar] [CrossRef]
- Valencia-Serna, J.; Chevallier, P.; Bahadur, K.C.R.; Laroche, G.; Uludag, H. Fibronectin-modified surfaces for evaluating the influence of cell adhesion on sensitivity of leukemic cells to siRNA nanoparticles. Nanomedicine 2016, 11, 1123–1138. [Google Scholar] [CrossRef]
- Scarangella, A.; Soumbo, M.; Villeneuve-Faure, C.; Mlayah, A.; Bonafos, C.; Monje, M.-C.; Roques, C.; Makasheva, K. Adsorption properties of BSA and DsRed proteins deposited on thin SiO2 layers: Optically non-absorbing versus absorbing proteins. Nanotechnology 2018, 29, 115101. [Google Scholar] [CrossRef]
- Hasan, V.; Saxena, L.; Pandey, M. Surface Functionalization of Ti6Al4V via Self-assembled Monolayers for Improved Protein Adsorption and Fibroblast Adhesion. Langmuir 2018, 34, 3494–3506. [Google Scholar] [CrossRef]
- Hasan, G.; Waibhaw, L.; Pandey, M. Conformational and Organizational Insights into Serum Proteins during Competitive Adsorption on Self-Assembled Monolayers. Langmuir 2018, 34, 8178–8194. [Google Scholar] [CrossRef]
- Richter, A.G.; Kuzmenko, I. Using in Situ X-ray Reflectivity to Study Protein Adsorption on Hydrophilic and Hydrophobic Surfaces: Benefits and Limitations. Langmuir 2013, 29, 5167–5180. [Google Scholar] [CrossRef]
- Silin, V.; Weetall, H.; Vanderah, D.J. SPR Studies of the Nonspecific Adsorption Kinetics of Human IgG and BSA on Gold Surfaces Modified by Self-Assembled Monolayers (SAMs). Colloid Interface Sci. 1997, 185, 94–103. [Google Scholar] [CrossRef]
- Guo, S.; Pranantyo, D.; Kang, E.-T.; Loh, X.J.; Zhu, X.; Jańczewski, D.; Neoh, K.G. Dominant Albumin–Surface Interactions under Independent Control of Surface Charge and Wettability. Langmuir 2018, 34, 1953–1966. [Google Scholar] [CrossRef]
- Azioune, M.; Chehimi, M.; Miksa, B.; Basinska, T.; Slomkowski, S. Hydrophobic protein− polypyrrole interactions: The role of van der Waals and Lewis acid− base forces as determined by contact angle measurements. Langmuir 2002, 18, 1150–1156. [Google Scholar] [CrossRef]
- Mielczarski, J.A.; Dong, J.; Mielczarski, E. Real time evaluation of composition and structure of concanavalin A adsorbed on a polystyrene surface. J. Phys. Chem. B 2008, 112, 5228–5237. [Google Scholar] [CrossRef]
- Hlady, V.; Buijs, J.; Jennissen, H.P. Amyloid, Prions, and Other Protein Aggregates; Elsevier: San Diego, CA, USA, 1999; Volume 39, p. 402. [Google Scholar]
- Rabe, M.; Verdes, D.; Seeger, S. Understanding protein adsorption phenomena at solid surfaces. Adv. Colloid Interface Sci. 2011, 162, 87–106. [Google Scholar] [CrossRef] [Green Version]
- Dee, K.C.; Puleo, D.A.; Bizios, R. An Introduction to Tissue-Biomaterial Interactions; Wiley-Liss: Hoboken, NJ, USA, 2002; Chapter 3; pp. 37–41. [Google Scholar]
- Roberts, J. Non-native protein aggregation kinetics. Biotechnol. Bioeng. 2007, 98, 927–938. [Google Scholar] [CrossRef] [Green Version]
- Nelson, N.; Schwartz, D.K. Specific Ion (Hofmeister) Effects on Adsorption, Desorption, and Diffusion at the Solid–Aqueous Interface. J. Phys. Chem. Lett. 2013, 4, 4064–4068. [Google Scholar] [CrossRef]
- McUmber, A.C.; Randolph, T.W.; Schwartz, D.K. Electrostatic Interactions Influence Protein Adsorption (but Not Desorption) at the Silica-Aqueous Interface. J. Phys. Chem. Lett. 2015, 6, 2583–2587. [Google Scholar] [CrossRef]
- Trilling, K.; Beekwilder, J.; Zuilhof, H. Antibody orientation on biosensor surfaces: A minireview. Analyst 2013, 138, 1619. [Google Scholar] [CrossRef]
- Tajima, N.; Takai, M.; Ishihara, K. Significance of antibody orientation unraveled: Well-oriented antibodies recorded high binding affinity. Anal. Chem. 2011, 83, 1969–1976. [Google Scholar] [CrossRef]
- Mavropoulos, E.; Costa, A.M.; Costa, L.T.; Achete, C.A.; Mello, A.; Granjeiro, J.M.; Rossi, A.M. Adsorption and bioactivity studies of albumin onto hydroxyapatite surface. Colloids Surf. B Biointerfaces 2011, 83, 1–9. [Google Scholar] [CrossRef] [Green Version]
- Stan, M.S.; Cinteza, L.O.; Petrescu, L.; Mernea, M.A.; Calborean, O.; Mihailescu, D.F.; Sima, C.; Dinischiotu, A. Dynamic analysis of the interactions between Si/SiO2 quantum dots and biomolecules for improving applications based on nano-bio interfaces. Sci. Rep. 2018, 8, 5259. [Google Scholar] [CrossRef]
- RocaiCabarocas, P. Plasma enhanced chemical vapor deposition of amorphous, polymorphous and microcrystalline silicon films. J. Non-Crys. Solids 2000, 266–269, 31–37. [Google Scholar] [CrossRef]
- Amrani, R.; Abboud, P.; Chahed, L.; Cuminal, Y. Low Temperature Growth of Hydrogenated Silicon Prepared by PECVD from Argon Diluted Silane Plasma. Cryst. Struct. Theory Appl. 2012, 1, 62–67. [Google Scholar] [CrossRef]
- Scherrer, P. Nachrichten von der Gesellschaft der Wissenschaften zu Göttingen. Mathematisch-PhysikalischeKlasse 1918, 26, 98–100. [Google Scholar]
- Filali, L.; Brahmi, Y.; Sib, J.D.; Kail, F.; Bouizem, Y.; Benlakehal, D.; Zellama, K.; Bouhekka, A.; Kebab, A.; Chahed, L. Molecular hydrogen-induced nucleation of hydrogenated silicon nanocrystals at low temperature. Surf. Interface Anal. 2019, 51, 531–540. [Google Scholar] [CrossRef]
- Boldyryeva, H.; Honda, S.; Mackova, A.; Mates, T.; Fejfar, A.; Kocka, J. Characterization of hydrogen contained in passivated poly-Si and microcrystalline-Si by ERDA technique. Surf. Interface Anal. 2006, 38, 819–822. [Google Scholar] [CrossRef]
- Álvarez-Macías, C.; Monroy, B.M.; Huerta, L.; Canseco-Martínez, M.A.; Picquart, M.; Santoyo-Salazar, J.; García Sánchez, M.F.; Santana, G. Chemical and structural properties of polymorphous silicon thin films grown from dichlorosilane. Appl. Surf. Sci. 2013, 285, 431–439. [Google Scholar] [CrossRef]
- Belfer, S.; Fainchtain, R.; Purinson, Y.; Kedem, O. Surface characterization by FTIR-ATR spectroscopy of polyethersulphone membranes-unmodified, modified and protein fouled. Membr. Sci. 2000, 172, 113–124. [Google Scholar] [CrossRef]
- Lenk, T.J.; Horbett, T.A.; Ratner, B.D.; Chittur, K.K. Infrared spectroscopic studies of time-dependent changes in fibrinogen adsorbed to polyurethanes. Langmuir 1991, 7, 1755. [Google Scholar] [CrossRef]
- Roach, P.; Farrar, D.; Perry, C.C. Interpretation of Protein Adsorption: Surface-Induced Conformational Changes. J. Am. Chem. Soc. 2005, 127, 8168–8173. [Google Scholar] [CrossRef]
- Chittur, K.K. FTIR/ATR for protein adsorption to biomaterial surfaces. Biomaterials 1998, 19, 357–369. [Google Scholar] [CrossRef]
- Lubambo, A.F.; Benelli, E.M.; Klein, J.J.; Schreiner, W.H.; Silveira, E.; de Camargo, P.C. Tuning protein GlnB-Hs surface interaction with silicon: FTIR-ATR, AFM and XPS study. Colloids Surf. B Biointerfaces 2013, 102, 348–353. [Google Scholar] [CrossRef]
- Awsiuk, K.; Budkowski, A.; Marzec, M.M.; Petrou, P.; Rysz, J.; Bernasik, A. Effects of polythiophene surface structure on adsorption and conformation of bovine serum albumin: A multivariate and multitechnique study. Langmuir 2014, 30, 13925. [Google Scholar] [CrossRef]
- Filali, L.; Brahmi, Y.; Sib, J.D.; Bouhekka, A.; Benlakehal, D.; Bouizem, Y.; Kebab, A.; Chahed, L. The effect of amorphous silicon surface hydrogenation on morphology, wettability and its implication on the adsorption of proteins. Appl. Surf. Sci. 2016, 384, 107–115. [Google Scholar] [CrossRef]
- Brahmi, Y.; Filali, L.; Sib, J.D.; Bouhekka, A.; Benlakehal, D.; Bouizem, Y.; Kebab, A.; Chahed, L. Conformational study of protein interactions with hydrogen-passivated amorphous silicon surfaces: Effect of pH. Appl. Surf. Sci. 2017, 424, 394–402. [Google Scholar] [CrossRef]
- Cedervall, T.; Lynch, I.; Lindman, S.; Berggård, T.; Thulin, E.; Nilsson, H.; Dawson, K.A.; Linse, S. Understanding the nanoparticle-protein corona using methods to quantify exchange rates and affinities of proteins for nanoparticles. Proc. Natl. Acad. Sci. USA 2007, 104, 2050–2055. [Google Scholar] [CrossRef]
- Cedervall, T.; Lynch, I.; Foy, M.; Berggård, T.; Donnelly, S.C.; Cagney, G.; Linse, S.; Dawson, K.A. Detailed Identification of Plasma Proteins Adsorbed on Copolymer Nanoparticles. Angew. Chem. 2007, 119, 5856–5858. [Google Scholar] [CrossRef]
- Norde, W. Driving forces for protein adsorption at solid surfaces. Macromol. Symp. 1996, 103, 5–18. [Google Scholar] [CrossRef]
- Sun, S.F. Physical Chemistry of Macromolecules; John Wiley & Sons, Inc.: Hoboken, NJ, USA, 2004; Chapter 4; p. 77. [Google Scholar]
- Frauenfelder, H. The Physics of Proteins; Springer: New York, NY, USA, 2010; Chapter 18; p. 253. [Google Scholar]
- Podila, R.; Chen, R.; Ke, P.C.; Brown, J.M.; Rao, M. Effects of surface functional groups on the formation of nanoparticle-protein corona. Appl. Phys. Lett. 2012, 101, 263701. [Google Scholar] [CrossRef] [Green Version]
- Kloss, F.R.; Gassner, R.; Preiner, J.; Ebner, A.; Larsson, K.; Hächl, O.; Tuli, T.; Rasse, M.; Moser, D.; Laimer, K.; et al. The role of oxygen termination of nanocrystalline diamond onimmobilisation of BMP-2 and subsequent bone formation. Biomaterials 2008, 29, 2433–2442. [Google Scholar] [CrossRef]
- Maleki, M.S.; Moradi, O.; Tahmasebi, S. Adsorption of albumin by gold nanoparticles: Equilibrium and thermodynamics studies. Arab. J. Chem. 2017, 10, s491–s502. [Google Scholar] [CrossRef]
- Aramesh, M.; Shimoni, O.; Ostrikov, K.; Prawer, S.; Cervenka, J. Surface charge effects in protein adsorption on nanodiamonds. Nanoscale 2015, 7, 5726. [Google Scholar] [CrossRef] [PubMed]
- Tsong, T.Y.; Astumian, R.D. Electroconformational Coupling: How Membrane-Bound ATPase Transduces Energy from Dynamic Electric Fields. Annu. Rev. Physiol. 1988, 50, 273–290. [Google Scholar] [CrossRef] [PubMed]
- Le Saux, A.; Ruysschaert, J.; Goormaghtigh, E. Membrane molecule reorientation in an electric field recorded by attenuated total reflection Fourier-transform infrared spectroscopy. Biophys. J. 2001, 80, 324–330. [Google Scholar] [CrossRef]
- Ojeda-May, P.; Garcia, M.E. Electric Field-Driven Disruption of a Native β-Sheet Protein Conformation and Generation of a Helix-Structure. Biophys. J. 2010, 99, 595–599. [Google Scholar] [CrossRef] [Green Version]
- Jiang, Z.; You, L.; Dou, W.; Sun, T.; Xu, P. Effects of an Electric Field on the Conformational Transition of the Protein: A Molecular Dynamics Simulation Study. Polymers 2019, 11, 282. [Google Scholar] [CrossRef]
- Emaminejad, S.; Javanmard, M.; Gupta, C.; Chang, S.; Davis, R.W.; Howe, R.T. Tunable control of antibody immobilization using electric field. Proc. Natl. Acad. Sci. USA 2015, 117, 1995–1999. [Google Scholar] [CrossRef]
- Poncin-Epaillard, F.; Vrlinic, T.; Debarnot, D.; Mozetic, M.; Coudreuse, A.; Legeay, G.; El Moualij, B.; Zorzi, W. Surface Treatment of Polymeric Materials Controlling the Adhesion of Biomolecules. J. Funct. Biomater. 2012, 3, 528–543. [Google Scholar] [CrossRef] [Green Version]
- McClellan, S.J.; Franses, E.I. Adsorption of bovine serum albumin at solid/aqueous interfaces. Colloid Surf. A Physicochem. Eng. Asp. 2005, 260, 265–275. [Google Scholar] [CrossRef]


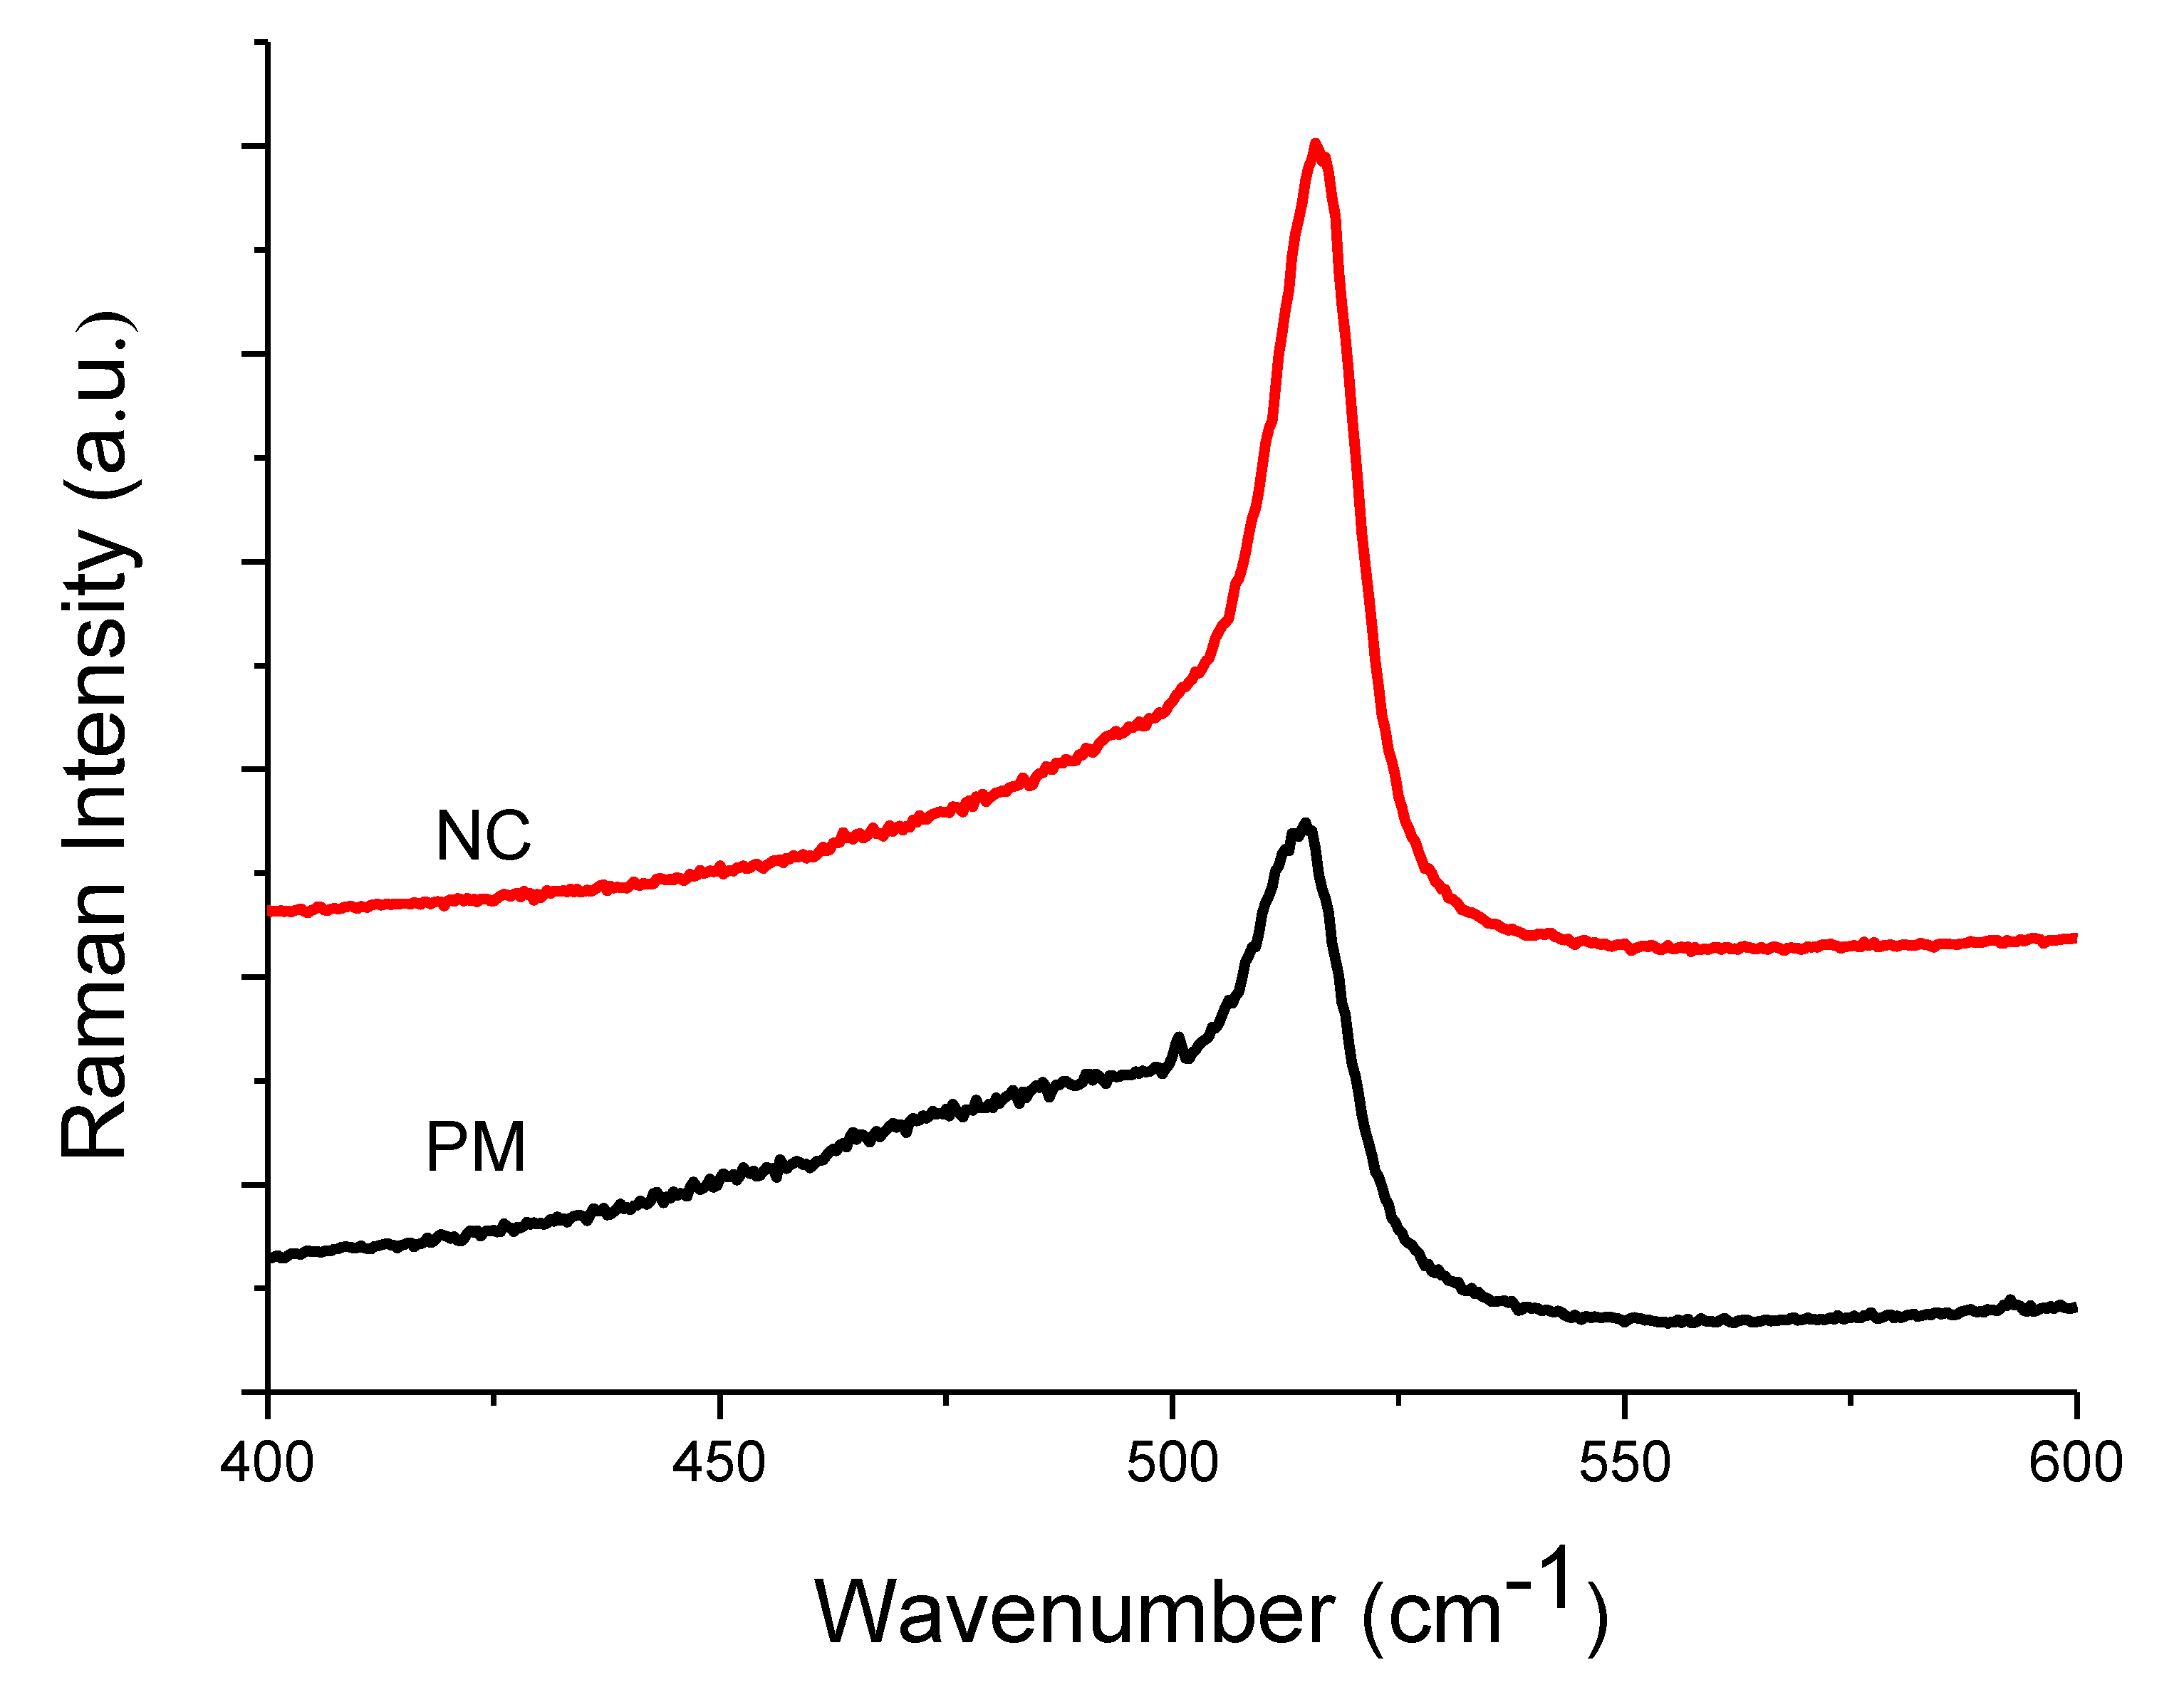
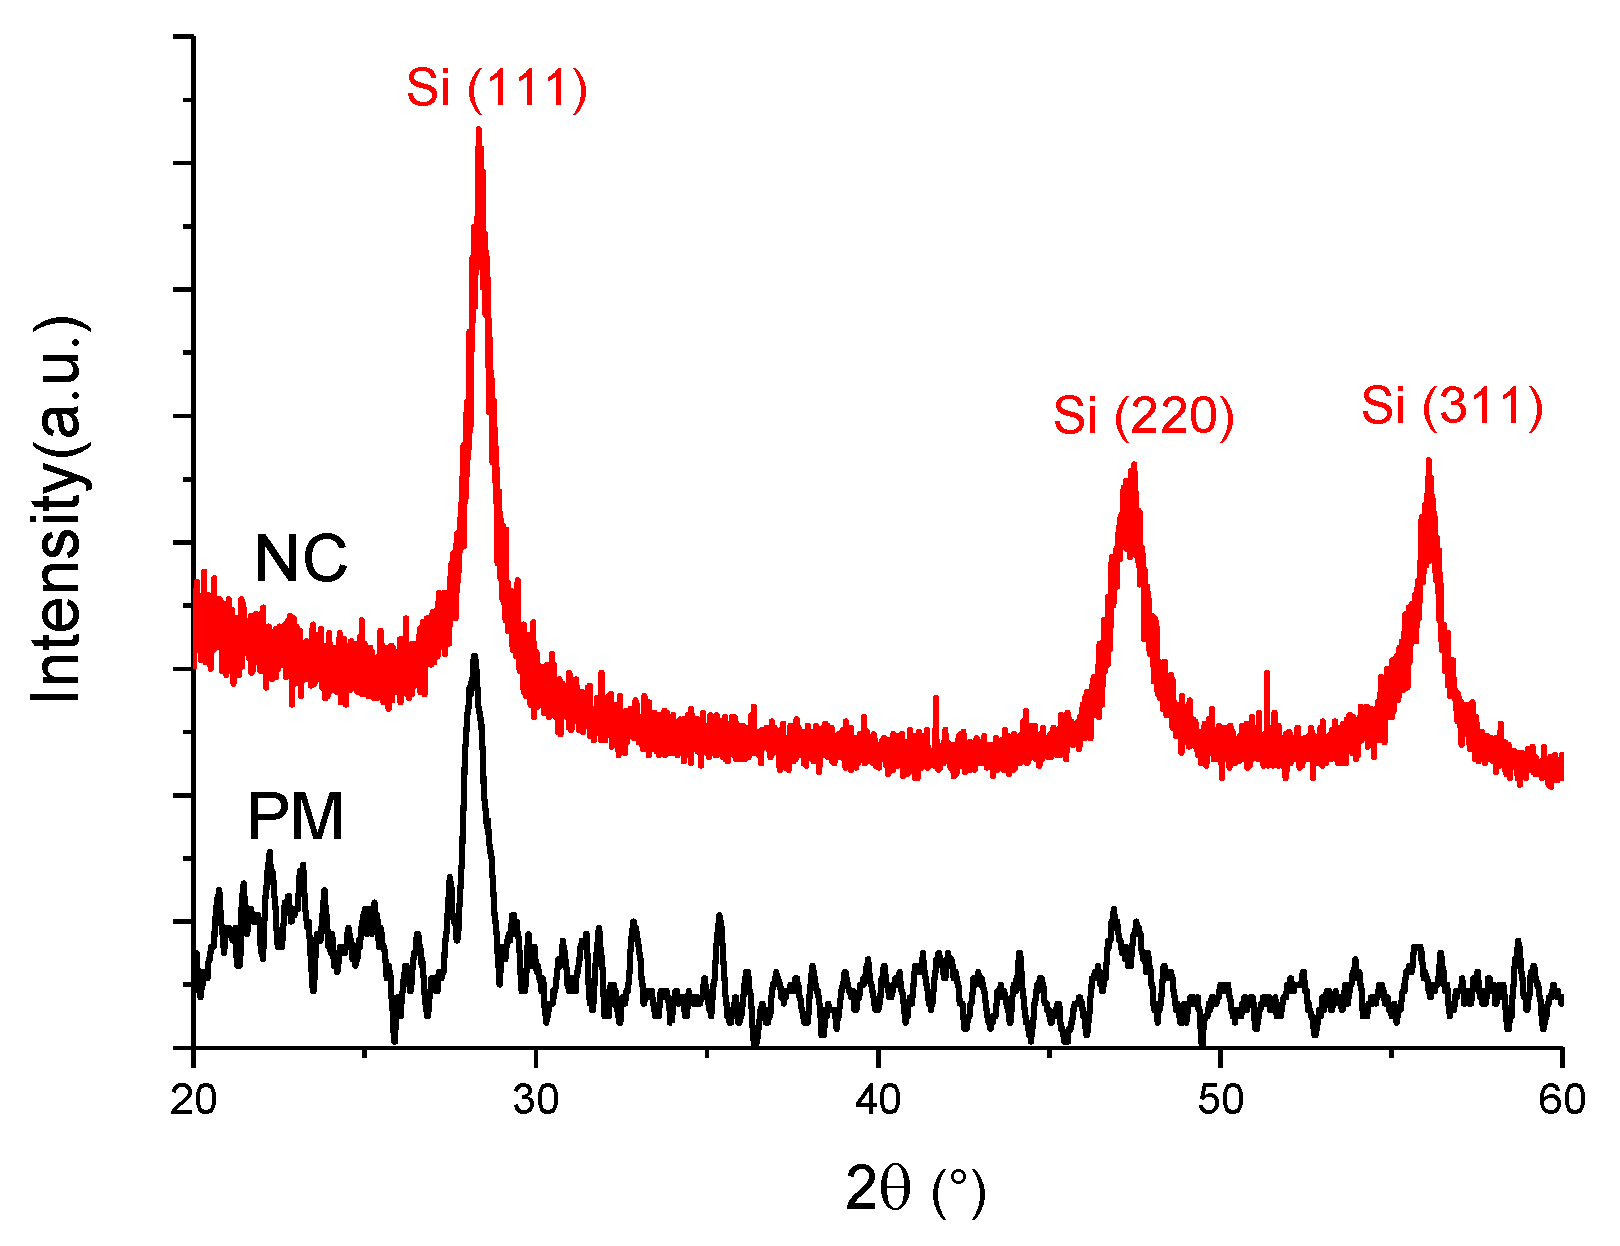
| Raman | XRD | |||||||||
|---|---|---|---|---|---|---|---|---|---|---|
| Sample | Amorphous Phase | Intermediate Phase | Crystalline Phase | Diff. Peak (111) | ||||||
| Position (cm−1) | I480 (%) | Position (cm−1) | I510 (%) | Position (cm−1) | I520 (%) | Xc (%) | Position (°) | FWHM (°) | D (nm) | |
| PM | 487 | 54 | 509 | 24 | 515 | 22 | 46 | 28.2 | 0.82 | 10 ± 0.5 |
| NC | 481 | 30 | 508 | 36 | 516 | 34 | 70 | 28.4 | 0.72 | 11 ± 0.5 |
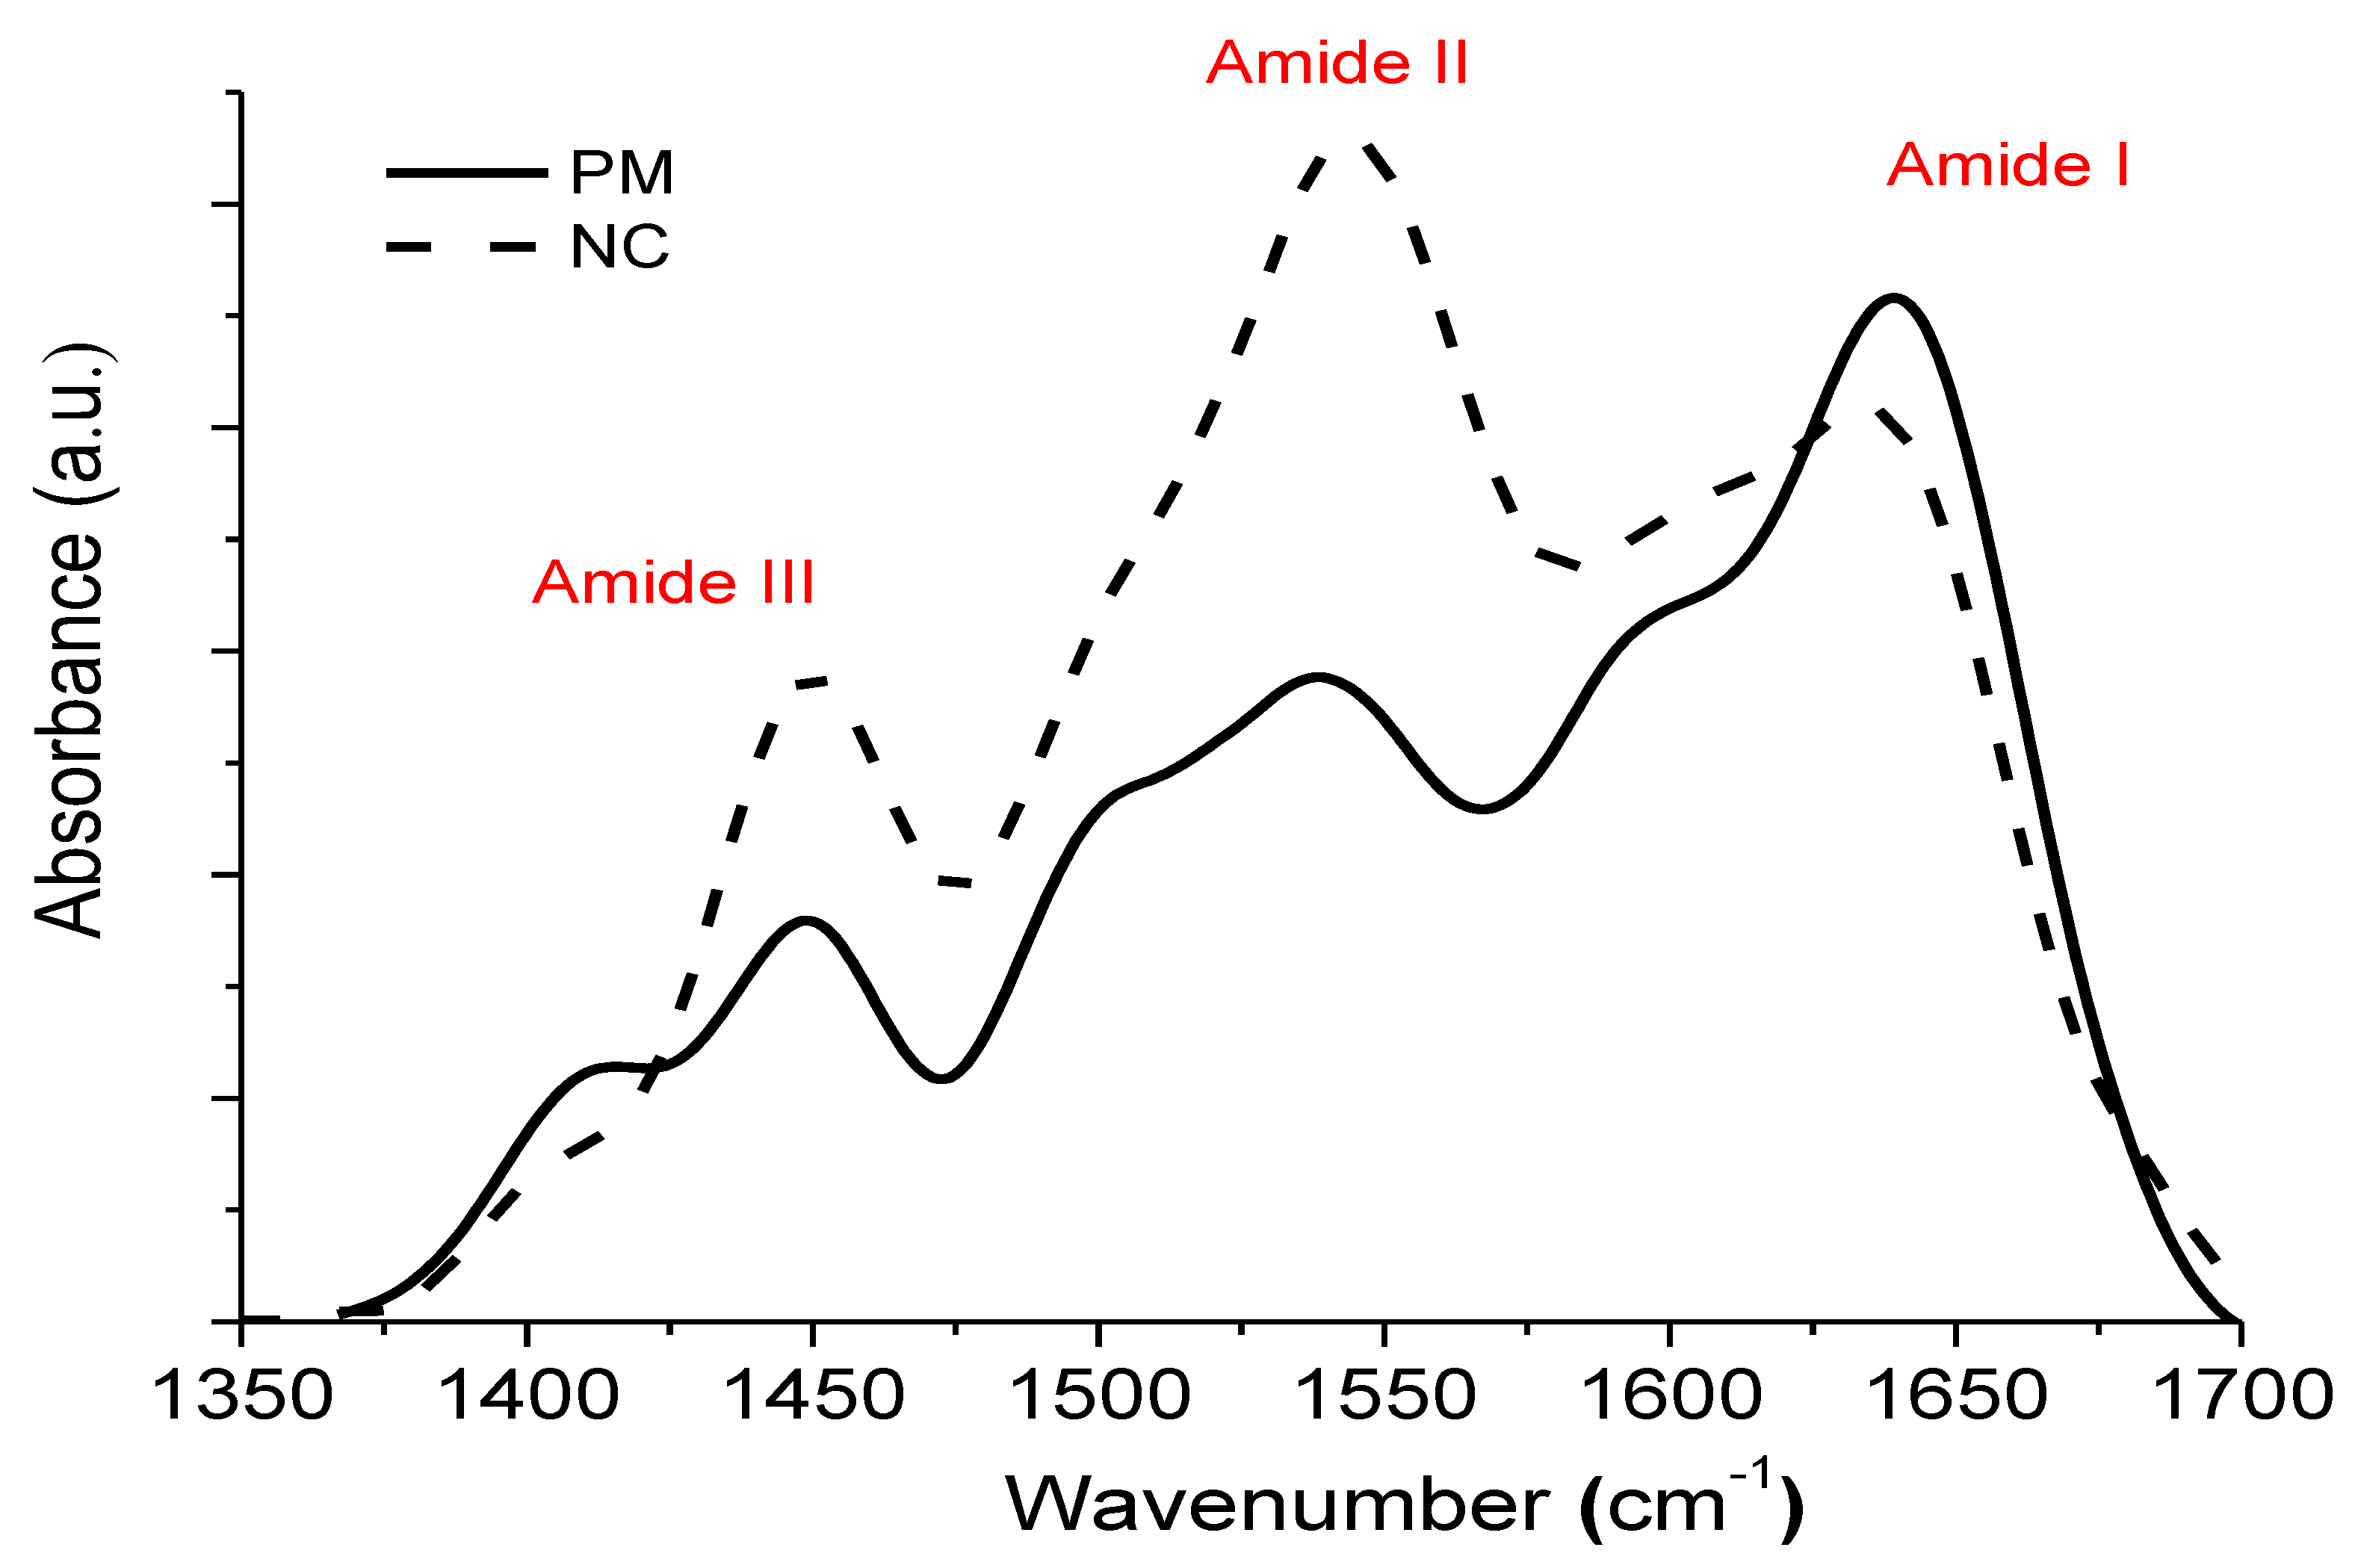
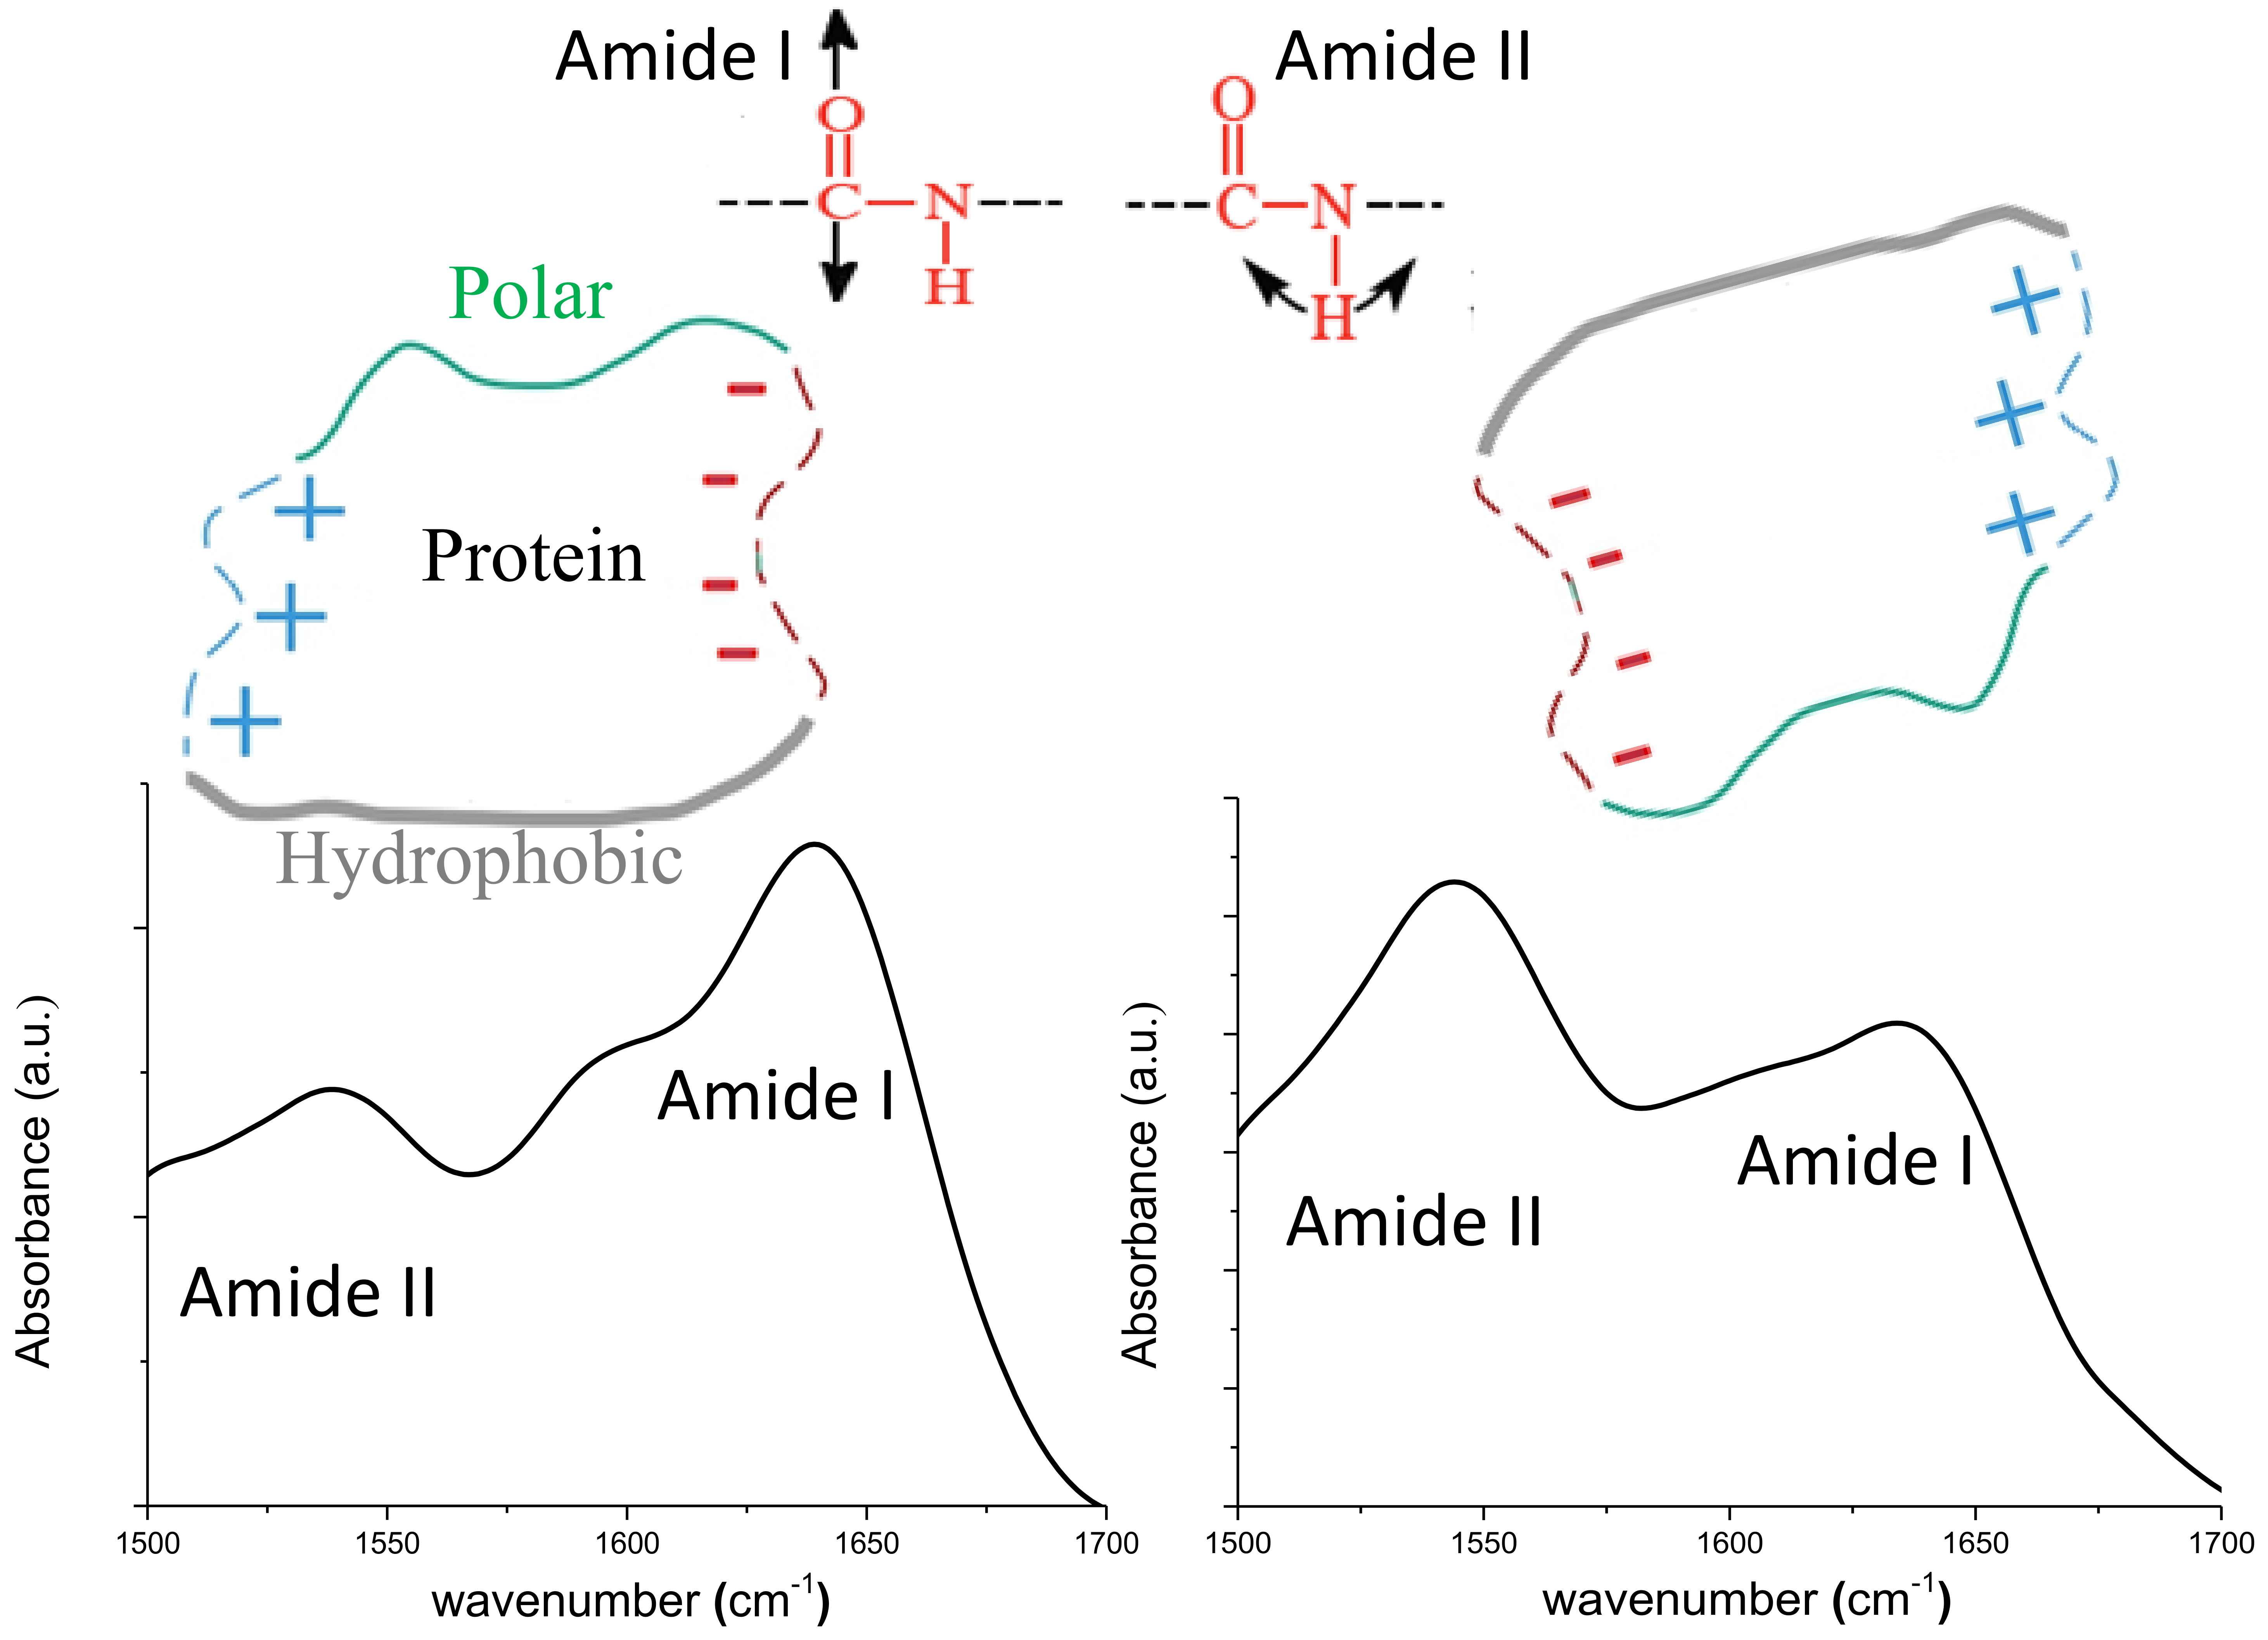
| Sample | Position | Area (%) | Assignment | Area β/α | Max Amide I/II |
|---|---|---|---|---|---|
| PM | 1605 | 20 | Intermolecular β sheet | 3.01 | 1.6 |
| 1625 | 20.5 | β sheet | |||
| 1640 | 35 | β sheet | |||
| 1655 | 18.4 | α helix | |||
| 1668 | 6.1 | Turn | |||
| NC | 1606 | 22.8 | Intermolecular β sheet | 2.55 | 0.77 |
| 1622 | 23 | β sheet | |||
| 1639 | 27.4 | β sheet | |||
| 1654 | 19.8 | α helix | |||
| 1679 | 6.9 | Turn |
© 2019 by the authors. Licensee MDPI, Basel, Switzerland. This article is an open access article distributed under the terms and conditions of the Creative Commons Attribution (CC BY) license (http://creativecommons.org/licenses/by/4.0/).
Share and Cite
Filali, L.; Brahmi, Y.; Sib, J.D.; Bouizem, Y.; Benlakehal, D.; Zellama, K.; Lemée, N.; Bouhekka, A.; Kail, F.; Kebab, A.; et al. Local Surface Electric Field’s Effect on Adsorbed Proteins’ Orientation. Surfaces 2019, 2, 415-431. https://doi.org/10.3390/surfaces2020030
Filali L, Brahmi Y, Sib JD, Bouizem Y, Benlakehal D, Zellama K, Lemée N, Bouhekka A, Kail F, Kebab A, et al. Local Surface Electric Field’s Effect on Adsorbed Proteins’ Orientation. Surfaces. 2019; 2(2):415-431. https://doi.org/10.3390/surfaces2020030
Chicago/Turabian StyleFilali, Larbi, Yamina Brahmi, Jamal Dine Sib, Yahya Bouizem, Djamel Benlakehal, Kacem Zellama, Nathalie Lemée, Ahmed Bouhekka, Fatiha Kail, Aissa Kebab, and et al. 2019. "Local Surface Electric Field’s Effect on Adsorbed Proteins’ Orientation" Surfaces 2, no. 2: 415-431. https://doi.org/10.3390/surfaces2020030