Article

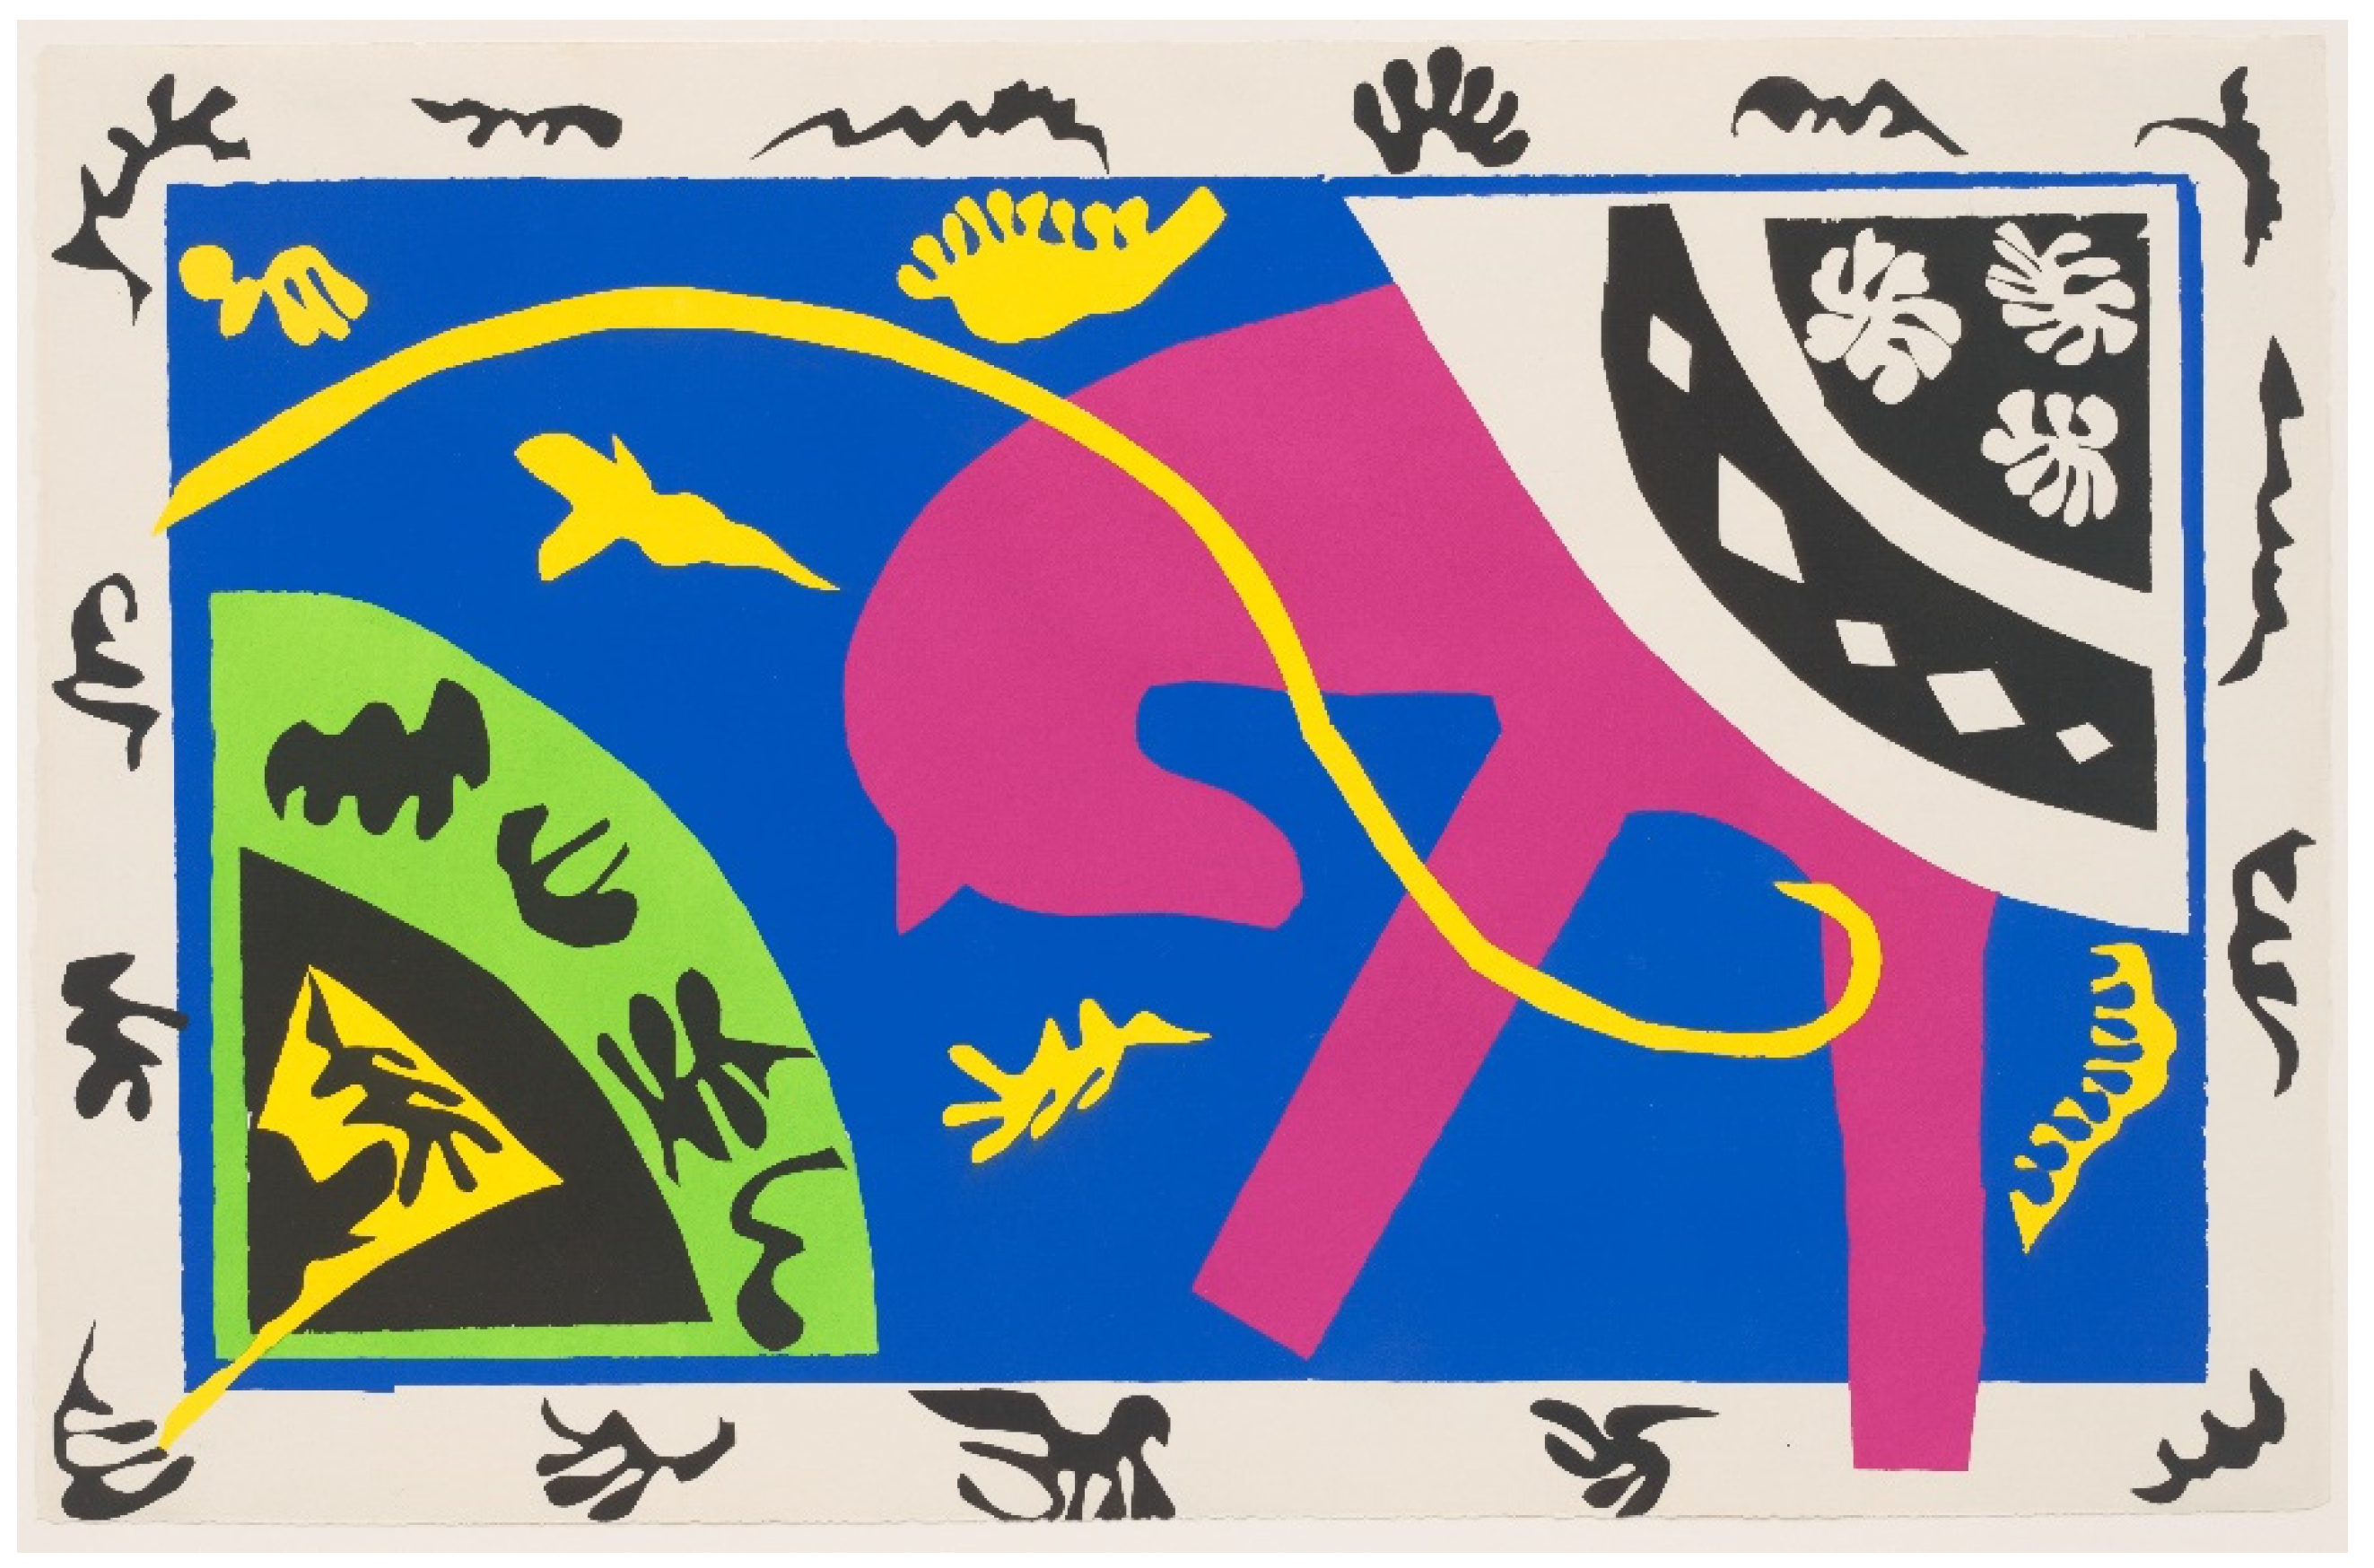
Jazz Colors: Pigment Identification in the Gouaches Used by Henri Matisse

1
The David Booth Conservation Department, The Museum of Modern Art, 11 W53rd Street, New York, NY 10019, USA
2
Service de la Restauration, Cabinet d’Art Graphique, Musée National d’Art Moderne, Centre Pompidou, CEDEX 04, 75191 Paris, France
3
Institut National du Patrimoine (INP), Département des Restaurateurs, Laboratoire de Recherche, 124 Rue Henri Barbusse, 93300 Aubervilliers, France
4
Ph.D. Program in Chemistry, City University of New York Graduate School and University Center, 365 5th Avenue, New York, NY 10016, USA
5
Department of Chemistry, City University of New York, City College of New York, 160 Convent Avenue, New York, NY 10031, USA
6
Centre de Recherche sur la Conservation (CRC, USR 3224), Musée National d’Histoire Naturelle, Ministère de la Culture, CNRS, CP21, 36 Rue Geoffroy-Saint-Hilaire, 75005 Paris, France
*
Author to whom correspondence should be addressed.
Heritage 2021, 4(4), 4205-4221; https://doi.org/10.3390/heritage4040231
Submission received: 26 August 2021 / Revised: 29 October 2021 / Accepted: 29 October 2021 / Published: 4 November 2021

Abstract

:
Jazz, the illustrated book by Henri Matisse, is a testament to the vitality of the artist in the last decade of his career. The book consists of twenty illustrations reproduced in 370 copies using a stencil-based printing technique and the same Linel gouaches the artist had used for the original maquettes. This study reports on the comprehensive analysis carried out to identify the pigments in the gouaches used in Jazz by transmitted and reflectance infrared, Raman, SERS, and X-ray fluorescence spectroscopies, and describes the lightfastness of these gouaches as evaluated by microfaedometry. This study also highlights the necessity of a multi-analytical approach for comprehensive identification of artist materials and investigates the suitability of portable and non-invasive techniques. The results were consistent across the three copies investigated: a portfolio in the collection of the Museum of Modern Art in New York and two books in the collection of the Musée National d’Art Moderne in Paris. In total, 39 distinct colors were characterized, with the magenta, pinks, and blues being the most fugitive.

1. Introduction

Jazz, the artist book illustrated by Henri Matisse and published by Tériade in 1947, is considered a defining moment in the life of the artist, when his papiers découpés, or paper cut-outs, took a life of their own as a new medium in his practice. Matisse’s first cut-outs were maquettes for the cover of Christian Zervos’ Cahiers d’Art nos. 3–5 in 1936 and for the first cover of Tériade’s rival publication Verve in 1937 [1]. Encouraged to create a livre d’artiste in a similar style by Tériade [2], Matisse composed a series of twenty maquettes between August 1943 and March 1944, with “…figures in vivid and violent tones, resulting from crystallizations of memories of the circus, popular tales or travel” [3]. In 1947, after several trials and sustained insistence from Tériade, the maquettes were ultimately reproduced and printed by Edmond Vairel and Draeger Frères, Paris. As stated in the last page of the Jazz book, the plates were reproduced using a stencil method also known as pochoir [4], and using the same Linel gouaches Matisse had used for the maquettes. While he approved of the production technique and proofed all plates, Matisse initially disliked the final appearance of Jazz, lamenting to a friend “… It is absolutely a failure” [5]. Nevertheless, the process itself influenced his future work, where the cut-outs became an end to themselves rather than preliminary models for future work. The maquettes are now part of the collection at the Musée National d’Art Moderne in Paris (MNAM), and a total of 250 books, 100 portfolios, and 20 non-circulated copies are in collections and repositories all over the world [6]. The fifth plate in Jazz is reproduced in Figure 1 to illustrate the vitality of the work.
A full understanding of the materials used in the reproduction of Jazz is important and long overdue because of its significance and reach. It is vital that institutions continue taking the necessary precautions when exhibiting and storing Jazz to ensure the integrity and vibrancy of its colors.
While systematic studies on the composition of commercial paints used by artists abound: Bocour [7], HKS, W&N, and Maimeri [8], Talens [8,9], and Ripolin [10] to only cite a few, no such studies appear to have been carried out for commercial gouaches. Information in the literature on the Linel gouaches used by Matisse, for instance, is essentially limited to light sensitivity, and no studies were found in the literature concerning the Sennelier gouaches which he also used in his early cut-outs [11]. Matisse was aware of the fading of some of these colors, in particular, the organic-based violets and pinks [12]. Fading of the blues, on the other hand, has been established visually and by spectrophotometry in Blue Nude I and The Swimming Pool [11,13], while the colors in Acanthes appear to be relatively stable based on microfadeometry [14]. The same technique established that of the colors present in The Snail, the green, orange, white, and magenta are light-sensitive [15]. A set of cut-out scraps from Matisse’s studio, donated to MoMA by the artist’s family in 2013, was also recently tested and showed a range of light sensitivities between fugitive and stable [16]. Until now, and to the best of the authors’ knowledge, neither chemical nor light stability analyses have been extended to the gouaches used in the printing of Jazz. Therefore, any information on the composition and stability of these gouaches is expected to be of interest to the institutions and collectors holding a copy of Jazz.
This article reports on a comprehensive analysis of the colors used in three reproductions: a portfolio in the collection of the Museum of Modern Art in New York (MoMA) and two books in the Musée National d’Art Moderne de Paris (MNAM), one in the collection and the other one in the study collection. The objective of the study was twofold: on the one hand to gain knowledge on the nature of the pigments present in the gouaches and their light sensitivity, and on the other hand, to support the assertion that all the copies of Jazz were made with the same gouaches. This is also part of a larger study that aims at comparing the materials used in the original cut-out maquettes made in 1943–44 and the pochoirs made in 1947, and also compare these materials with the wider set of cut-out scraps donated to the museum. The identification of the pigments relied on a multi-analytical approach using non-invasive techniques including portable X-ray fluorescence (p-XRF), reflectance spectroscopy (RS), reflectance Fourier transform infrared spectroscopy (r-FTIR), portable Raman spectroscopy (p-Raman), and microfadeometry (MFT) and was complemented with analysis of micro-samples by Fourier transform infrared spectroscopy (µ-FTIR) spectroscopy, confocal Raman spectroscopy, and surface-enhanced Raman (SERS) spectroscopy. Principal component analysis (PCA) was used as a data exploratory method to identify gouaches with similar p-XRF, RS, and r-FTIR spectral signatures and help establish the number of gouaches used by Vairel to reproduce Jazz.

2. Methodology and Analytical Techniques

The books and portfolios contain twenty prints designated here by P1 to P20 in the same sequence they appear in the book. The analyses were performed on a Jazz portfolio in the MoMA collection and two Jazz books in the MNAM collection. A preliminary examination of the MoMA portfolio under an optical microscope (Figure 2) showed minimal overlap between colors but some cross-contamination by paint splatters at the boundary between different color fields, likely caused by the use of a brush to apply the paints [4]. Analysis and sampling were therefore carried out at least 2 cm away from these boundaries whenever possible. Some of the letters and elements in prints P2, P17, and P19, however, were painted over the colored background. This was taken into account when interpreting the data and was confirmed for the three copies of Jazz examined.
The first phase of the study focused on determining the total number of gouaches used to reproduce the MoMA portfolio using non-invasive techniques. For each of the twenty prints, p-XRF analysis and RS were carried on two to three distinct spots for each color and paper support leading to a total of 228 p-XRF spectra and 396 reflectance spectra. The analysis established that for every color in a print, the composition of the two or three spots analyzed was the same. Based on that conclusion, the number of spots for r-FTIR analysis was reduced to one spot per color for each print (142 spectra). Principal component analysis (PCA) was then used as a data exploratory method to identify gouaches with the same p-XRF, RS, and r-FTIR spectral signatures and help establish the number of gouaches used by Vairel to reproduce the MoMA Jazz copy. MFT was also carried out on representative spots for each color to evaluate their sensitivity to light exposure. In the second phase of the project, p-XRF, RS, and r-FTIR analyses were carried out on one of the MNAM copies (one spot for each color) to confirm that the same gouaches had been used as in the MoMA copy.
Pigment identification proved challenging for some of the colors using non-invasive analysis exclusively. Further analysis using p-Raman clarified a few of the unknowns but ultimately sampling and analyses by µ-FTIR, Raman, and SERS were carried out on micro-samples taken from the Jazz book in the MNAM study collection to provide a more comprehensive overview of the gouache palette and confirm or complement the non-invasive analysis. A representative micro-sample was taken using a tungsten needle for each of the 39 colors identified by non-invasive analysis and whenever possible from the edge of the plate (the plates that were sampled are indicated in Table S1 in the Supplemental Information document SI).

2.1. Infrared Spectroscopies (µ-FTIR and r-FTIR)

Micro-FTIR (µ-FTIR) analysis was carried out in transmission mode using a Nicolet iS50-FTIR coupled with a Thermo Nicolet Continuum infrared microscope equipped with an MCT detector. Spectra were collected in the 4000–600 cm−1 range with a 4 cm−1 resolution and 128 scans and using the Thermo Scientific OMNIC 9.0 software package.
Reflectance FTIR (r-FTIR) was carried out using a portable Bruker ALPHA spectrometer equipped with an external reflection module and a DTGS detector. Spectra were collected in the 7000–400 cm−1 range and a 4 cm−1 resolution over 128 scans. Measurements were made in non-contact mode over a spot size of approximately 4 mm in diameter and a 1 to 1.5 cm distance from the object (the focal distance from the surface was adjusted using the instrument’s built-in camera). The background was periodically acquired using a built-in flat gold mirror. The spectra were converted to pseudo-absorbance.
Spectra were examined using the Spectral Search and Multicomponent Search tools available in the Thermo Scientific OMNIC Specta 2.0 software, as well as the IRUG FTIR spectral database [17]. Both original and Kramers–Kronig (KK) transformed r-FTIR spectra were evaluated.

2.2. Raman Spectroscopies (Confocal Raman, p-Raman, SERS)

Confocal Raman spectra (Raman) were collected using a Renishaw In-via Raman system equipped with a 785 nm diode laser at powers between 0.3 to 3 mW, a 1200 lines/mm grating, and a Leica confocal microscope with a 100x objective. Final spectra represent an average of five acquisitions of 10 s. AgNPs for SERS were synthesized using the Lee-Meisel method [18] and measurements were obtained before and after using acid pretreatments for hydrolyzing colorants into the colloidal solution [19] (see supplementary information (SI) for a complete description). SERS spectra were collected using a 532 nm diode laser at powers between 0.5 to 2.5 mW, 1800 lines/mm grating, and a Leica confocal microscope with a ×100 objective. Final spectra represent an average of five acquisitions of 10 s. Portable Raman (p-Raman) spectra were acquired using a Bruker BRAVO Handheld Raman spectrometer equipped with 785 nm and 853 nm diode lasers (DuoLASERTM), a resolution of 10–12 cm−1 and 400 ms exposure time over 30 acquisitions. The output laser is ≈ 50 mW and spot size diameter 1 mm) measurements were carried in non-contact mode at 1–2 mm to prevent thermal degradation or damage to the object. All Raman spectra were evaluated using Omnic Specta.
Reagents for surface-enhanced Raman (SERS) spectroscopy: silver nitrate (AgNO3) (99.9999% trace metals basis) and sodium citrate (≥99%, FG) were used for silver nanoparticle (AgNPs) synthesis. Potassium nitrate (KNO3) (BioXtra, ≥99.5%) was used for AgNP aggregation. Nitric acid (HNO3) (ACS Reagent, 70%) and hydrofluoric acids (HF) (ACS Reagent 48%) were used for colorant hydrolysis into AgNP colloid. All materials were purchased from Millipore-Sigma.

2.3. Reflectance Spectrophotometry (RS)

Reflectance spectra were taken using the X-rite eXact spectrophotometer in the range of 400–700 nm with a 10 nm resolution and a 4 mm diameter spot size. The purpose of these measurements was to identify colors with the same signature spectra across multiple plates and not for pigment identification. It was thus deemed acceptable to perform the measurement through a clear mylar (PET) film (3.8 microns) to avoid direct contact with the surface (preliminary test indicated a 90% reduction in the reflectance).

2.4. X-ray Fluorescence (p-XRF)

Portable X-ray fluorescence (p-XRF) analysis was performed at MoMA with a Bruker Tracer III-SDD handheld XRF instrument with an Rh excitation source and silicon drift detector (5 mm diameter approximate spot size) under He purge. The instrument was operated at 40 kV and 3 μA, and spectra were acquired for 120 s. An Elio spectrometer (XGLab) equipped with an Rh target and 1 mm beam size was used for the analysis at MNAM. An integrated CCD camera and two laser pointers allowed precise focus on the region of interest. All analyses were performed in atmospheric conditions, with no He purge, at 40 kV and 100 μA, with a collection time of 200 s. All the spectra were examined with the Bruker Artax 7.2 software.

2.5. Microfadeometry (MFT)

Illumination was achieved with an Oriel Instruments LIK-LMP Light Intensity Controller Kit equipped with a Si Detector Head and Xe-arc lamp controlled by a Spectra-Physics power supply coupled to a thermo-Oriel Digital Flux controller. Spectra were registered using a Control Development spectrometer in the range of 380–900 nm. Light contact to the object’s surface was achieved using a 100 μm diameter bifurcated fiber optic, which ensures a narrow beam radius and high light intensity. Microfading was performed on three distinct spots for each color (in the same plate and color field) for a duration of 15 minutes. ISO Blue Wool (BW) 1, 2, and 3 were used as internal standards for comparison [20]. The average ΔE76 curves were obtained using the Spectral Viewer software developed at the Getty Conservation Institute [21]. A BW equivalent scale (BWeq) was established by fitting a power function to the ΔE values at t = 15 min for BW 1, 2, and 3 [22,23]. A BWeq value was then calculated for each color by interpolation of that curve for the ΔE values at t = 15 min for each color. the value obtained is rounded to the nearest category: BWeq < 2 is highly light-sensitive; BWeq = 2, 2.5, and 3 are light-sensitive, and BWeq > 3 is moderately light-sensitive to stable. It is important to note the limitation of MFT for elucidating lightfastness beyond BWeq = 3 [24].

2.6. PCA Analysis

Principal component analysis (PCA) was used as an exploratory data analysis method to group colors with very similar p-XRF, RS, and r-FTIR spectral signatures and in this way help determine the number of paints used to reproduce Jazz. PCA was carried out separately on the p-XRF, RS, and r-FTIR spectra using the SOLO-MIA (Eigenvector) software package. Preprocessing of the spectra included Poisson scaling (for the p-XRF spectra in the 1–15 KeV range), first derivative (for RS), and SNV (for r-FTIR), followed by mean centering.

3. Results and Discussion

3.1. Pigment Identification

Jazz was printed on Velin d’ARCHES paper as specified on the last page of the Jazz books. Analysis of the paper support with r-FTIR and p-Raman only produced bands related to cellulose. No additives or coatings were detected with the techniques in use. Analysis with p-XRF detected small amounts of Al, Si, P, S, K, Ca, Fe, and Zn. This small mineral contribution from the paper support was taken into account when evaluating the p-XRF results obtained for the gouaches. The r-FTIR, p-Raman, and p-XRF spectra obtained for the paper support of the twenty MoMA plates and the twenty MNAM pages were very similar, confirming that the same paper was used for both reproductions.
PCA was used as an exploratory method to distinguish gouaches of a similar color but potentially different composition by comparing their p-XRF, RS, and r-FTIR spectra. The contribution of the paper support was the same for all the spots analyzed and thus had no impact on the PCA analysis. The example provided in Figure 3 illustrates how PCA was used to distinguish three groups of yellow gouaches based on their p-XRF spectra. The scores and loading plots (Figure 3a,b respectively) extracted by PCA differentiate gouaches richer in either calcium sulfate (Ca, S) or barium sulfate (Ba, S, Sr) from gouaches containing neither extender. The same procedure was repeated to examine the data obtained with r-FTIR and with RS. Ultimately, seven different yellow gouaches were distinguished based on the similarities between their XRF, r-FTIR, and RS spectral signatures. The same analysis was carried out on the rest of the colors, leading to the final conclusion that 39 different gouaches had been used to reproduce Jazz.
This information was used to guide further non-invasive analysis by p-Raman and MFT for each color. It was also used to guide sampling for complementary analysis by µ-FTIR, Raman, and SERS. Table 1 summarizes the pigments identified in each gouache. Tables S1 and S2 in the SI provide a more detailed account of the results obtained for each gouache with the different analytical methods and the prints where each of these gouaches was used. p-XRF, IR, and Raman spectra obtained for the black gouaches are provided in Figure 4 (also included in the Supplementary Materials as Figure S1 in the Supplementary Materials), Figure 5 (Figure S2), and Figure 6 (Figure S3) to illustrate the findings. The spectra for the other colors are provided in the Supplementary Materials (Figures S1–S31).

3.1.1. Medium, Extenders, Additives, or Impurities

Traditionally, gouache paints are prepared with a gum rabic binder, white fillers for opacity, and organic or inorganic pigments [27]. A detailed medium analysis was beyond the scope of this work, but gum, though generally difficult to distinguish from cellulose was detected in several samples by µ-FTIR (Figure 7) by the presence of the characteristic O-H bending band at 1650–1620 cm−1 [28]. The analyses also revealed the presence of a variety of white inorganic compounds in the gouaches acting as extenders, lake substrates, and other potential additives. All are easily detected by p-XRF (key elements indicated in Table S1) and in most cases confirmed by infrared and Raman spectroscopies. Barium sulfate (BaSO4) was the most prevalent extender and was identified by XRF (Ba, S, Sr) [29], FTIR [30], and Raman [31] spectroscopies. Calcium carbonate (CaCO3) was identified by FTIR [32] and Raman [31] as well. Calcium sulfate was present in the gypsum form (CaSO4·2H2O) based on the presence of sulfate vibration bands and OH stretching and deformation bands in the IR [33] and Raman [31] spectra. Alumina hydrate was identified by μ-FTIR through hydroxyl deformation vibration bands [34]. In the magenta, violet, and red gouaches, and in the yellow and orange gouaches containing PY5, a significant amount of aluminum was detected by XRF, but the source could not be identified. A small but varying amount of zinc was detected in all the gouaches by XRF, possibly as an additive or contamination.

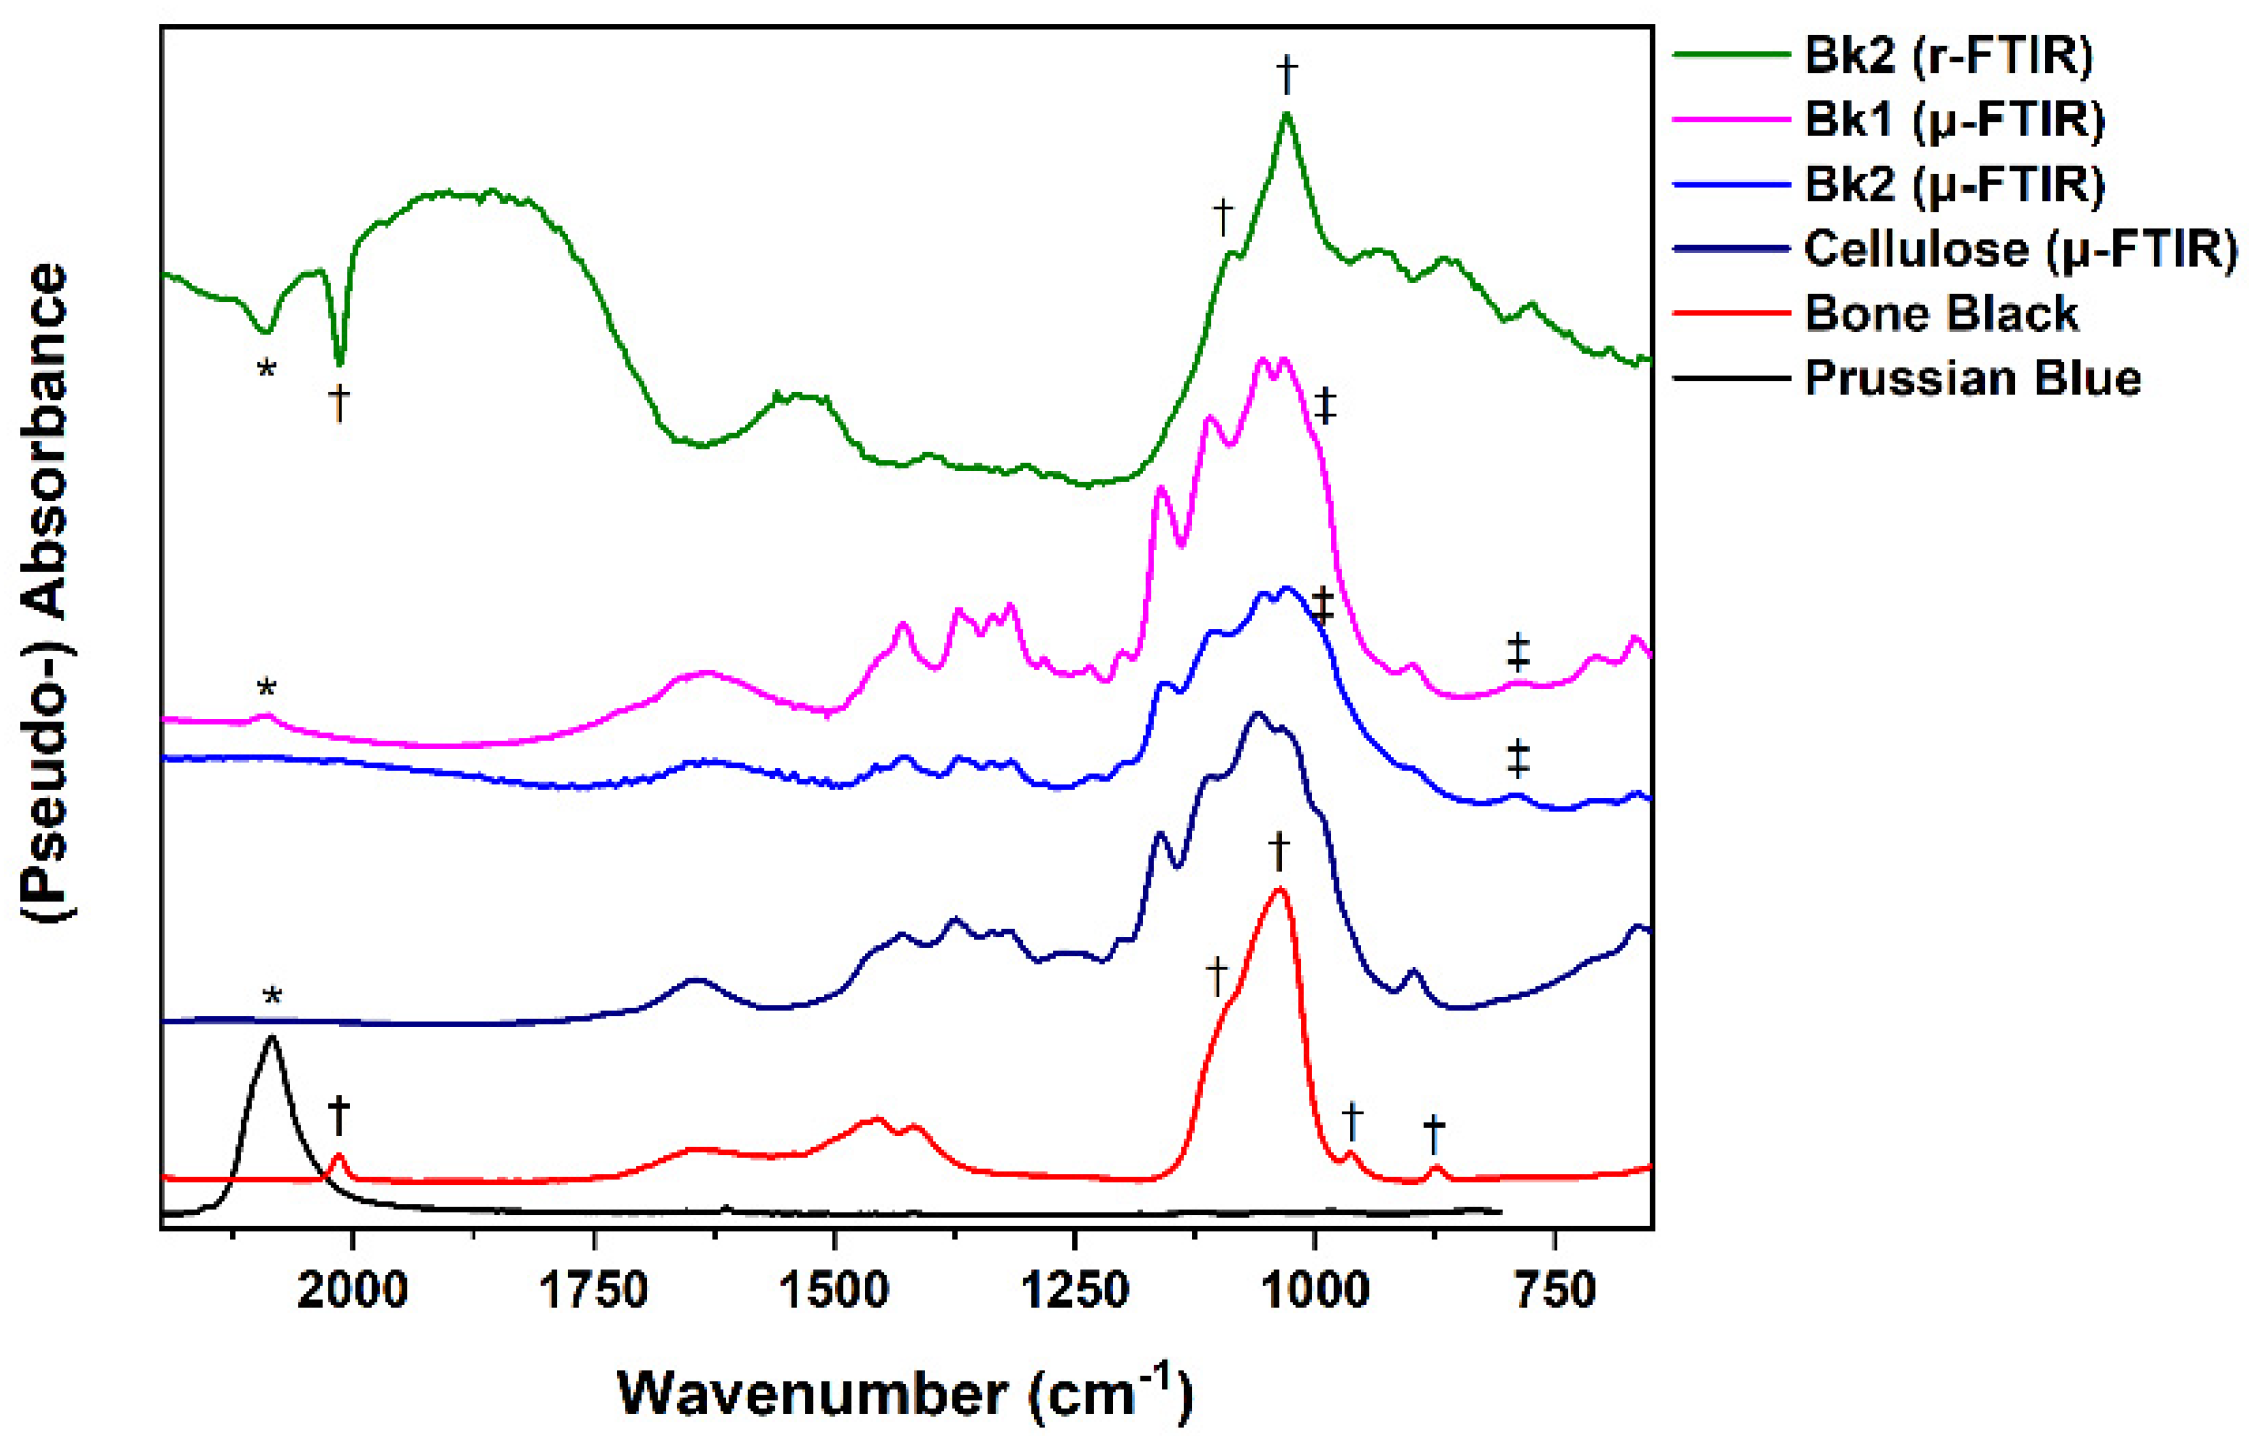
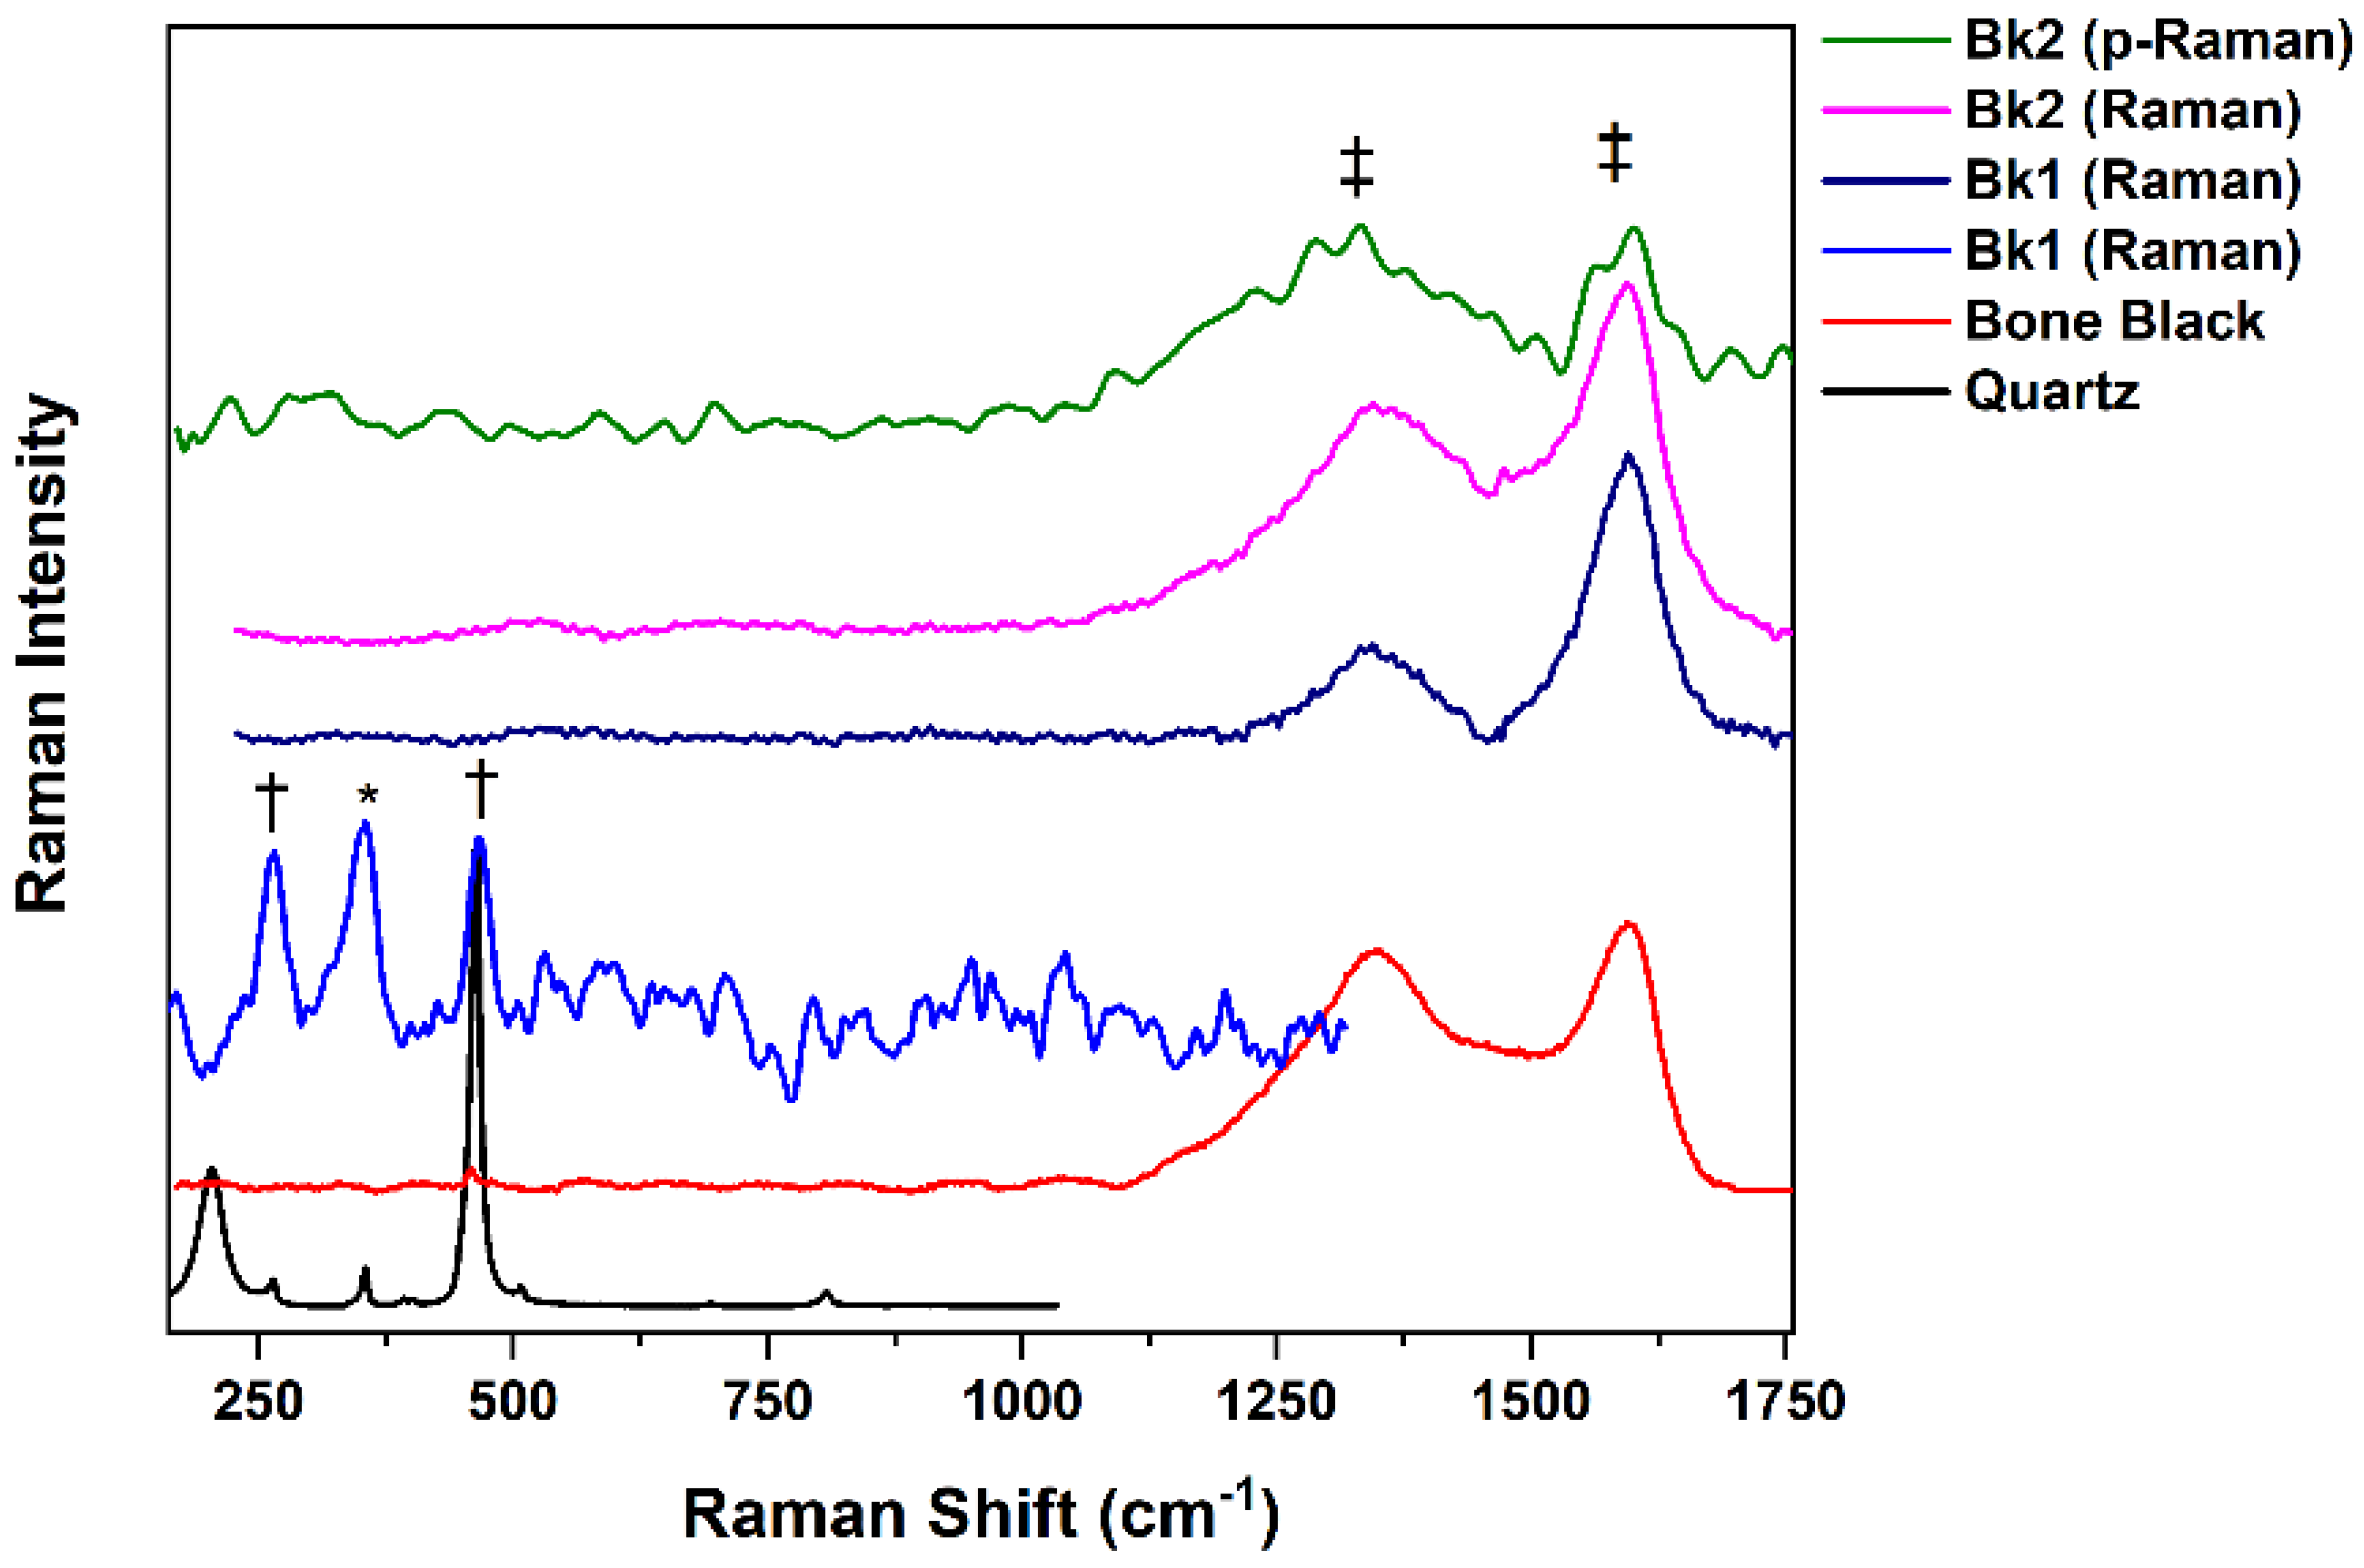
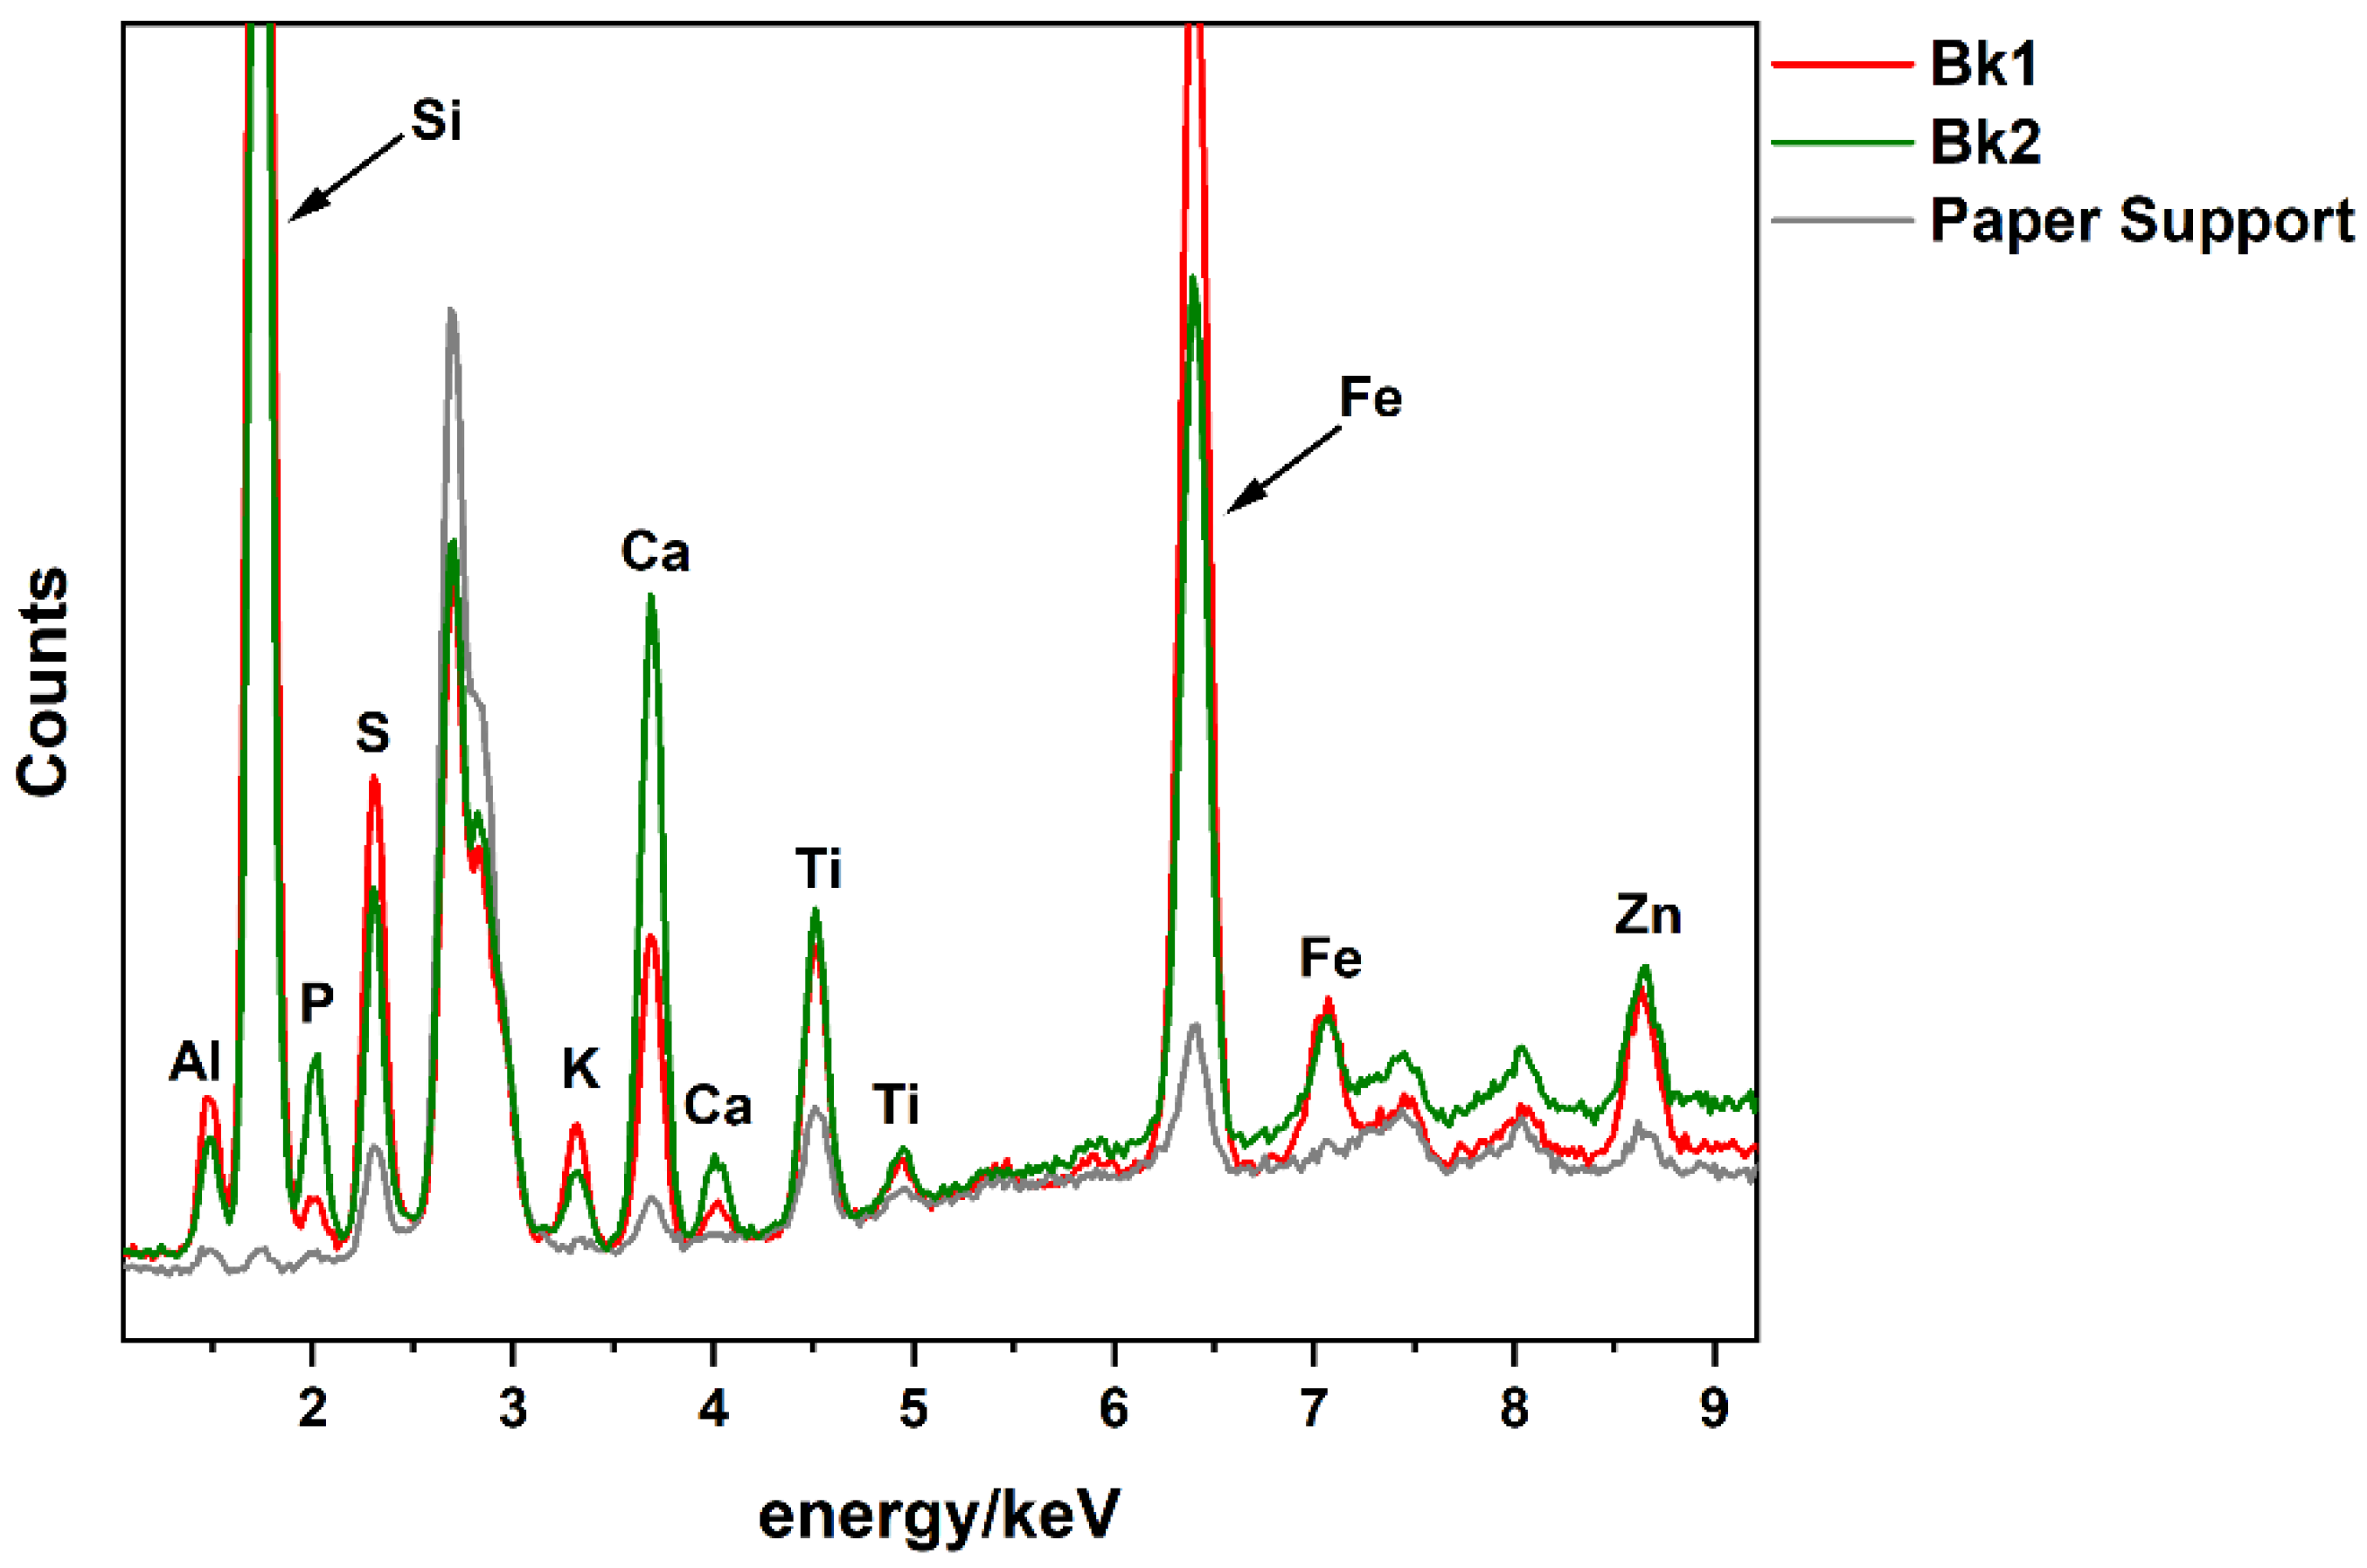
3.1.2. Black Gouaches

Two distinct black gouaches were identified. Both contained a mixture of bone/carbon black, Prussian blue, and silicates with lesser amounts of metal oxides, including possibly iron oxides. The relative concentrations of these pigments were however different: the more predominant Black 1 (Bk1) was slightly richer in Prussian blue and silicates; Black 2 (Bk2), found only in three prints, was richer in bone/carbon black. This pigment is an impure black carbon pigment prepared from charring animal bones containing mainly calcium hydroxyapatite (Ca10(PO4)6(OH)2) and small amounts of magnesium phosphate (Mg3(PO4)2) and calcium carbonate (CaCO3) [27], which is why it could be detected by the presence of P and Ca in the p-XRF spectra (Figure 4), especially in Bk2 where it was more concentrated. Bone black in Bk2 was also confirmed by FTIR through a characteristic band at 2013 cm−1 assigned to degradation products of the pigment synthesis [35]. The characteristic main phosphate band (ν3 at 1036 cm−1) associated with the hydroxyapatite overlaps with the cellulose and silicate bands in the µ-FTIR and (non-KK transformed) r-FTIR spectra [36] and neither 962 nor 875 cm−1 ν2 bands were detected (Figure 5). The presence of the characteristic D and G broad bands in the Raman spectra [25] confirmed the presence of carbon black, either as a constituent of bone black and/or as a pigment (Figure 6). The additional phosphate band at 960 cm−1 in the Raman spectrum is generally weak [37] and was not observed.
Prussian blue is a synthetically produced ferric ferrocyanide blue pigment (KFe[Fe(CN)6]) [38]. Fe and K were detected by p-XRF (these elements can also indicate the presence of natural iron oxides). Further confirmation was provided by r- and µ-FTIR with the characteristic CN asymmetric stretch [30]. The pigment was not observed in either Raman modalities, although it is detectable [31]. The p-XRF spectra also suggested the presence of silicates (Al, Si, K) and metal oxides (Ti, Cr, and possibly Fe). The presence of silicates and aluminosilicates was confirmed by µ- and r-FTIR [33], although several bands overlapped with bone black and cellulose. Confocal Raman spectroscopy confirmed the presence of quartz and silicates [26].

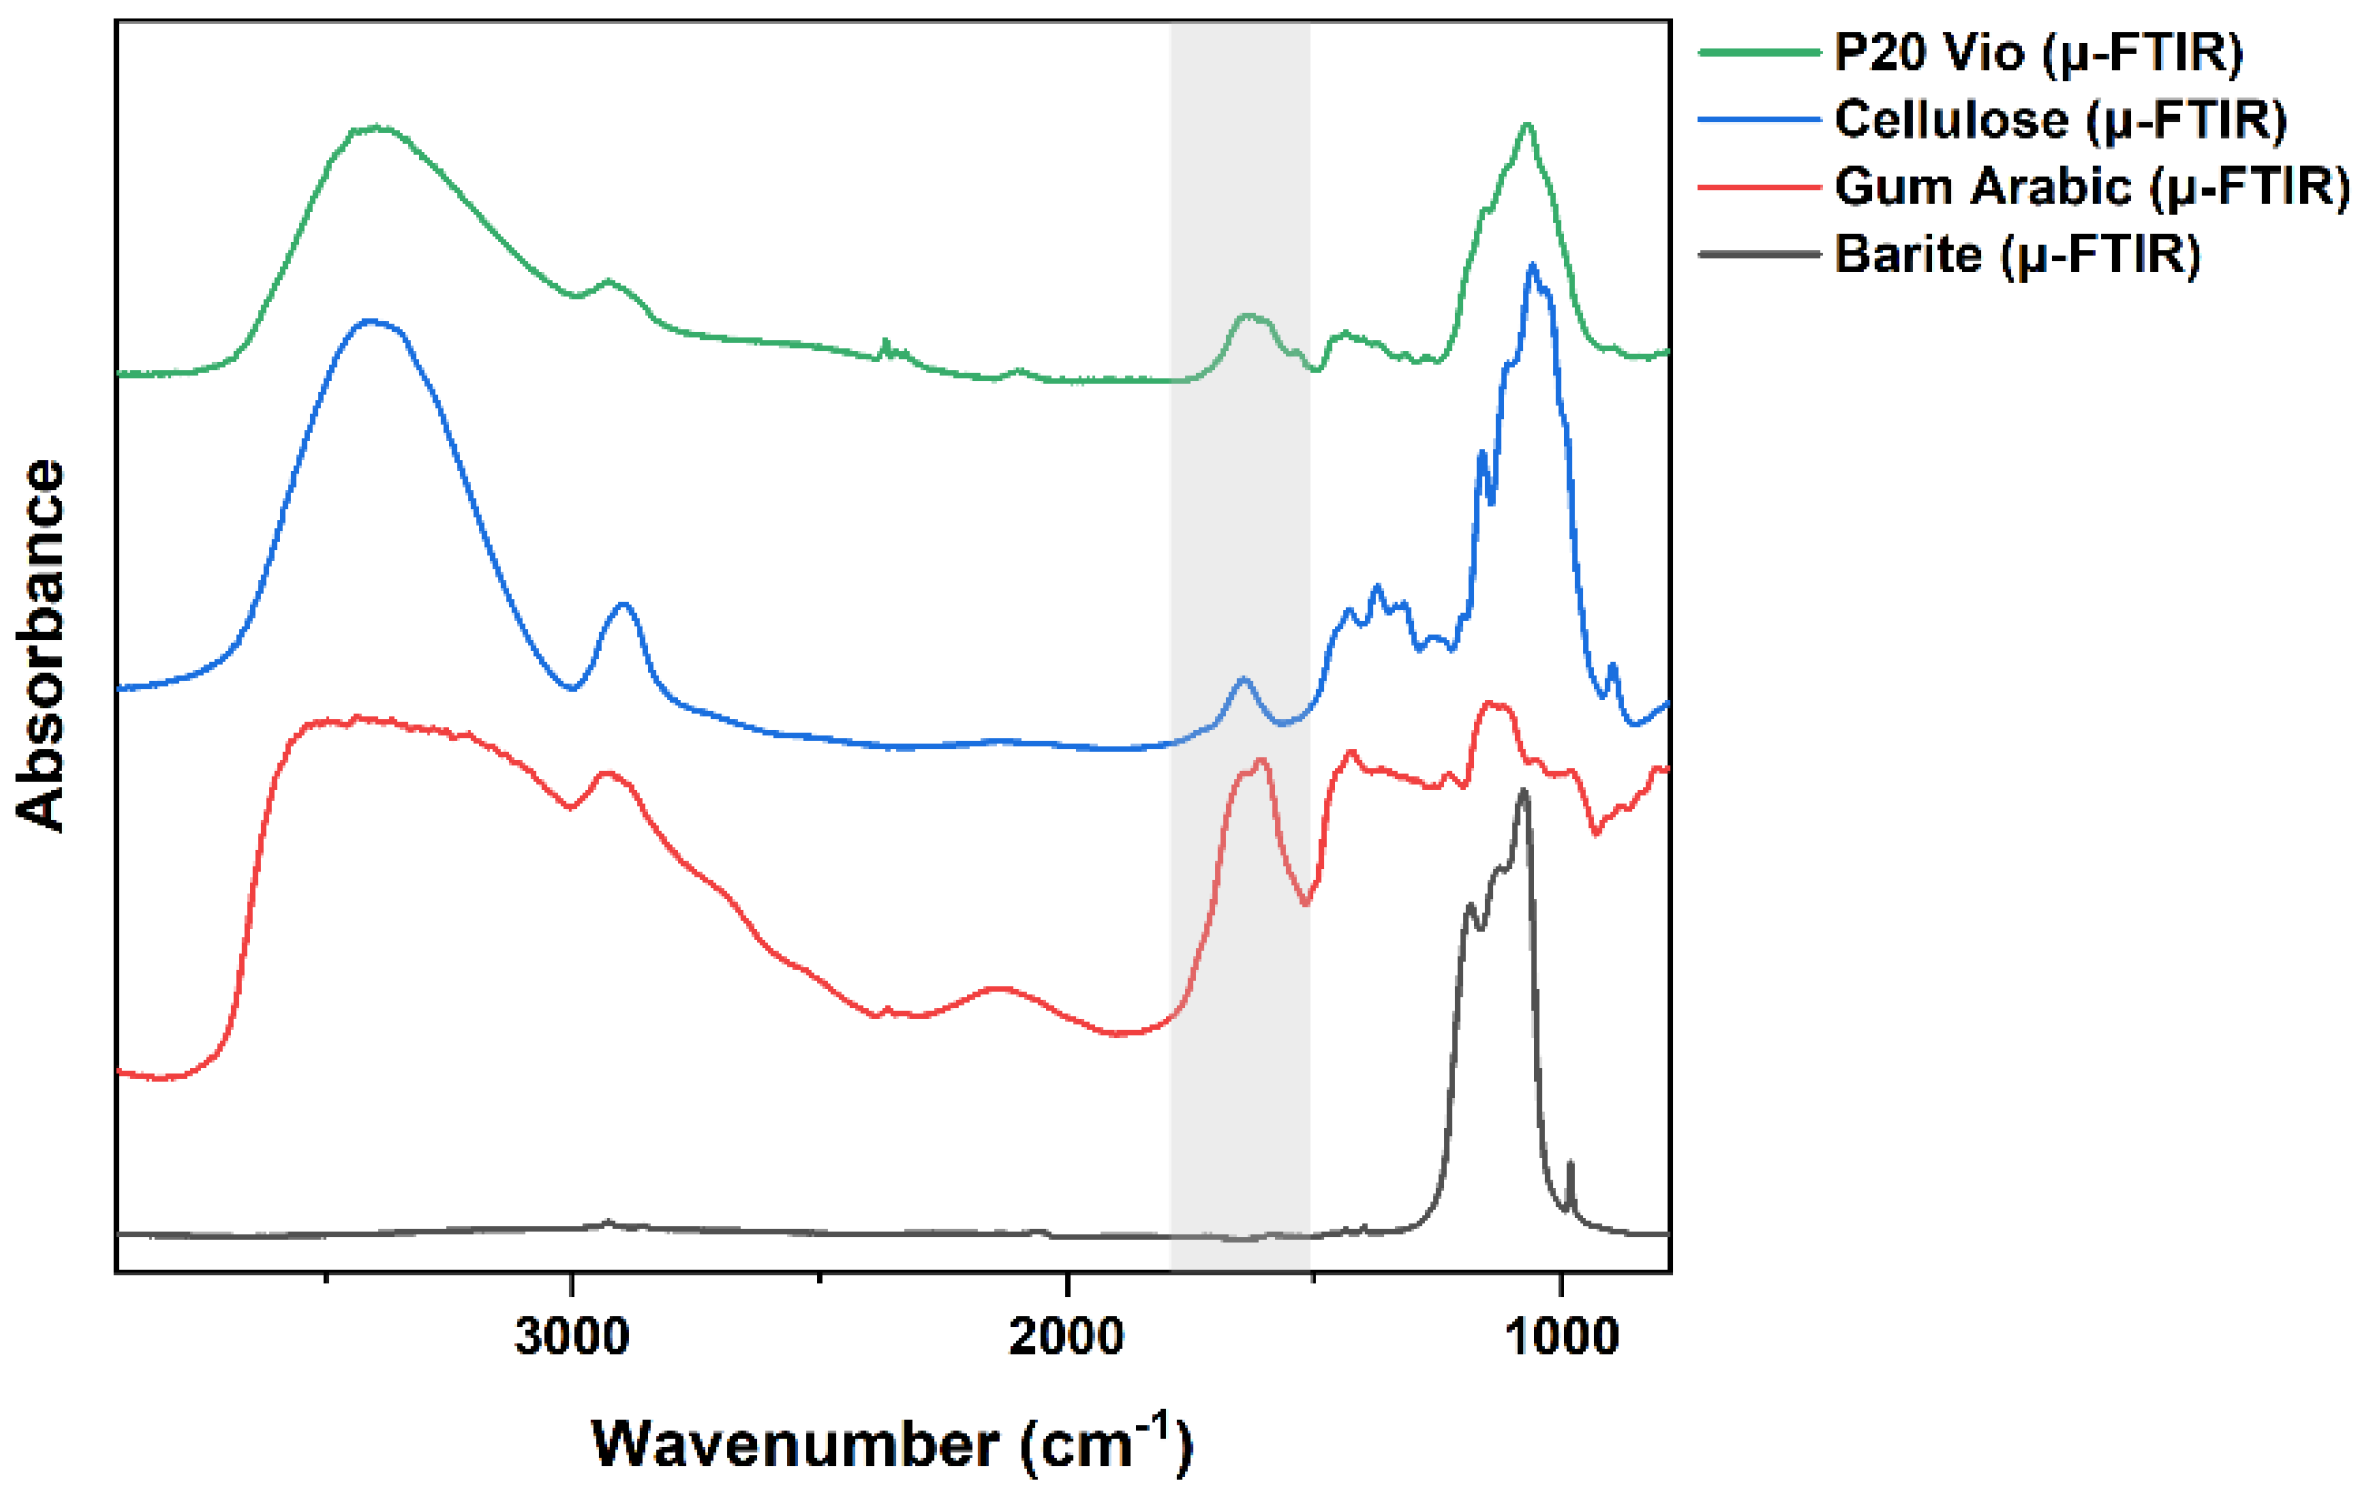
3.1.3. Violet Gouache

The violet gouache (V) was only used in pochoir P20. SERS (Figure S4) identified Rhodamine 6G (R6G) [39] and methyl violet and/or crystal violet (MV/CV) [40]. The weak Cu and Fe peaks in p-XRF (Figure S5) suggested the presence of copper ferrocyanide (CF), also confirmed by the characteristic CN asymmetric stretch in the µ- and r-FTIR spectra. CF could be the precipitating anion for either R6G (PR169) or for MV (PV27) [41].

3.1.4. Magenta Gouache

The composition of the magenta gouache (M) was the same across nine prints. Reference to this gouache appears in published correspondence between Matisse, Tériade, and Gaut, the then director of the Linel company [42]. The source pigment for this gouache was manufactured in Germany and became unavailable after WWII. In the letter, Matisse mentions the importance of a “Violet Fixe” and the large quantity needed to reproduce a large work, indubitably Jazz. SERS spectra indicated the presence of R6G, and confocal Raman also indicated the presence of Rhodamine 3B (R3B) [43] (Figure S6). The p-XRF analysis suggested that these two pigments are precipitated with CF—also confirmed by r-FTIR—and possibly phospho-tungsto-molybdic acid (PTM) since P and W were also detected (Figure S7). The presence of these constituents could be related to the presence of PV2, an R3B-PTM pigment, and PR169, an R6G-CF pigment [41].

3.1.5. Pink Gouaches

Two distinct pink gouaches were identified: R6G and CV/MV by SERS in Pink 1 (Pk1), while the presence of CF was detected by p-XRF (Figure S8) though not confirmed by FTIR. The second pink gouache (Pk2) used in P20 is slightly darker and warmer in tone and contained Calcium Lithol Red (PR49:2) as identified by Raman and SERS (Figure S9) [44]. The p-XRF spectra showed significant peaks for Ca and S as expected, the latter relating to the sulfonated group of the beta-naphthol [41].

3.1.6. Blue Gouaches

A total of five distinct blue gouaches were identified and all included synthetic ultramarine blue. Blue 1 (B1) was the most prominent blue and contained no additional pigments or fillers while Blue 2 (B2), used in P19 and similar to B1 in tonality, also contained titanium white (TiO2), zinc white (ZnO), and calcium carbonate. The intermediate Blue 3 (B3) used in P6 contained zinc white. Both light Blue 4 (B4), used in P12, and Blue 5 (B5), used in P15, had a light gray-blue tone but no additional pigment was detected aside from ultramarine blue. Ultramarine blue (3Na2O.3Al2O3.6SiO2.2Na2S) was detected in all the blues by p-XRF (Figure S10) through the presence of Al, Si, and S (K and Ca were also present in small quantities) [45]. In µ-FTIR and r-FTIR spectra (with no KK transformation), the characteristic Si-O and Al-O stretch as well as the Si-O main bending mode were readily observed (Figure S11) [30,45]. The pigment was also detected with confocal and p-Raman spectroscopy through the Raman modes of the sulfur radical anions S3 and S2 acting as chromophores (Figure S12) [45]. Those bands were weak but still discernible for the light B4 and B5 blues. Titanium white in B2 was detected by p-XRF (Ti), more specifically anatase as confirmed by confocal and p-Raman [46]. Zinc white was detected by p-XRF but could not be confirmed by Raman or infrared spectroscopy, though detectable by the latter [47].

3.1.7. Green Gouaches

Three distinct green gouaches were used in Jazz, a darker (G1), a lighter (G2) yellow-green, and a teal green (G3) that appears streakier. G1 and the lighter G2 both contained Hansa Yellow 10G (PY3), a yellow pigment with a greenish tint, and phthalocyanine green (PG7). The two are often found combined in yellow-greens [48]. PG7 was observed in confocal and p-Raman [49] (Figure S13) and detected by p-XRF through the presence of Cl and Cu peaks (Figure S14), though not confirmed by FTIR [17,50]. Conversely, PY3 was more readily observed by µ- and (non-KK transformed) r-FTIR [17] (Figure S15) than by Raman [49] spectroscopies, emphasizing the advantage and necessity of complementary techniques. The green gouache was applied on top of the gray background in P17 and P19, and both p-Raman and r-FTIR detected a signal from underlying pigments. G3 contains PG7 and ultramarine blue. Both pigments were confirmed by p-XRF and Raman. Some of the PG7 bands were weakly detected by µ-FTIR.

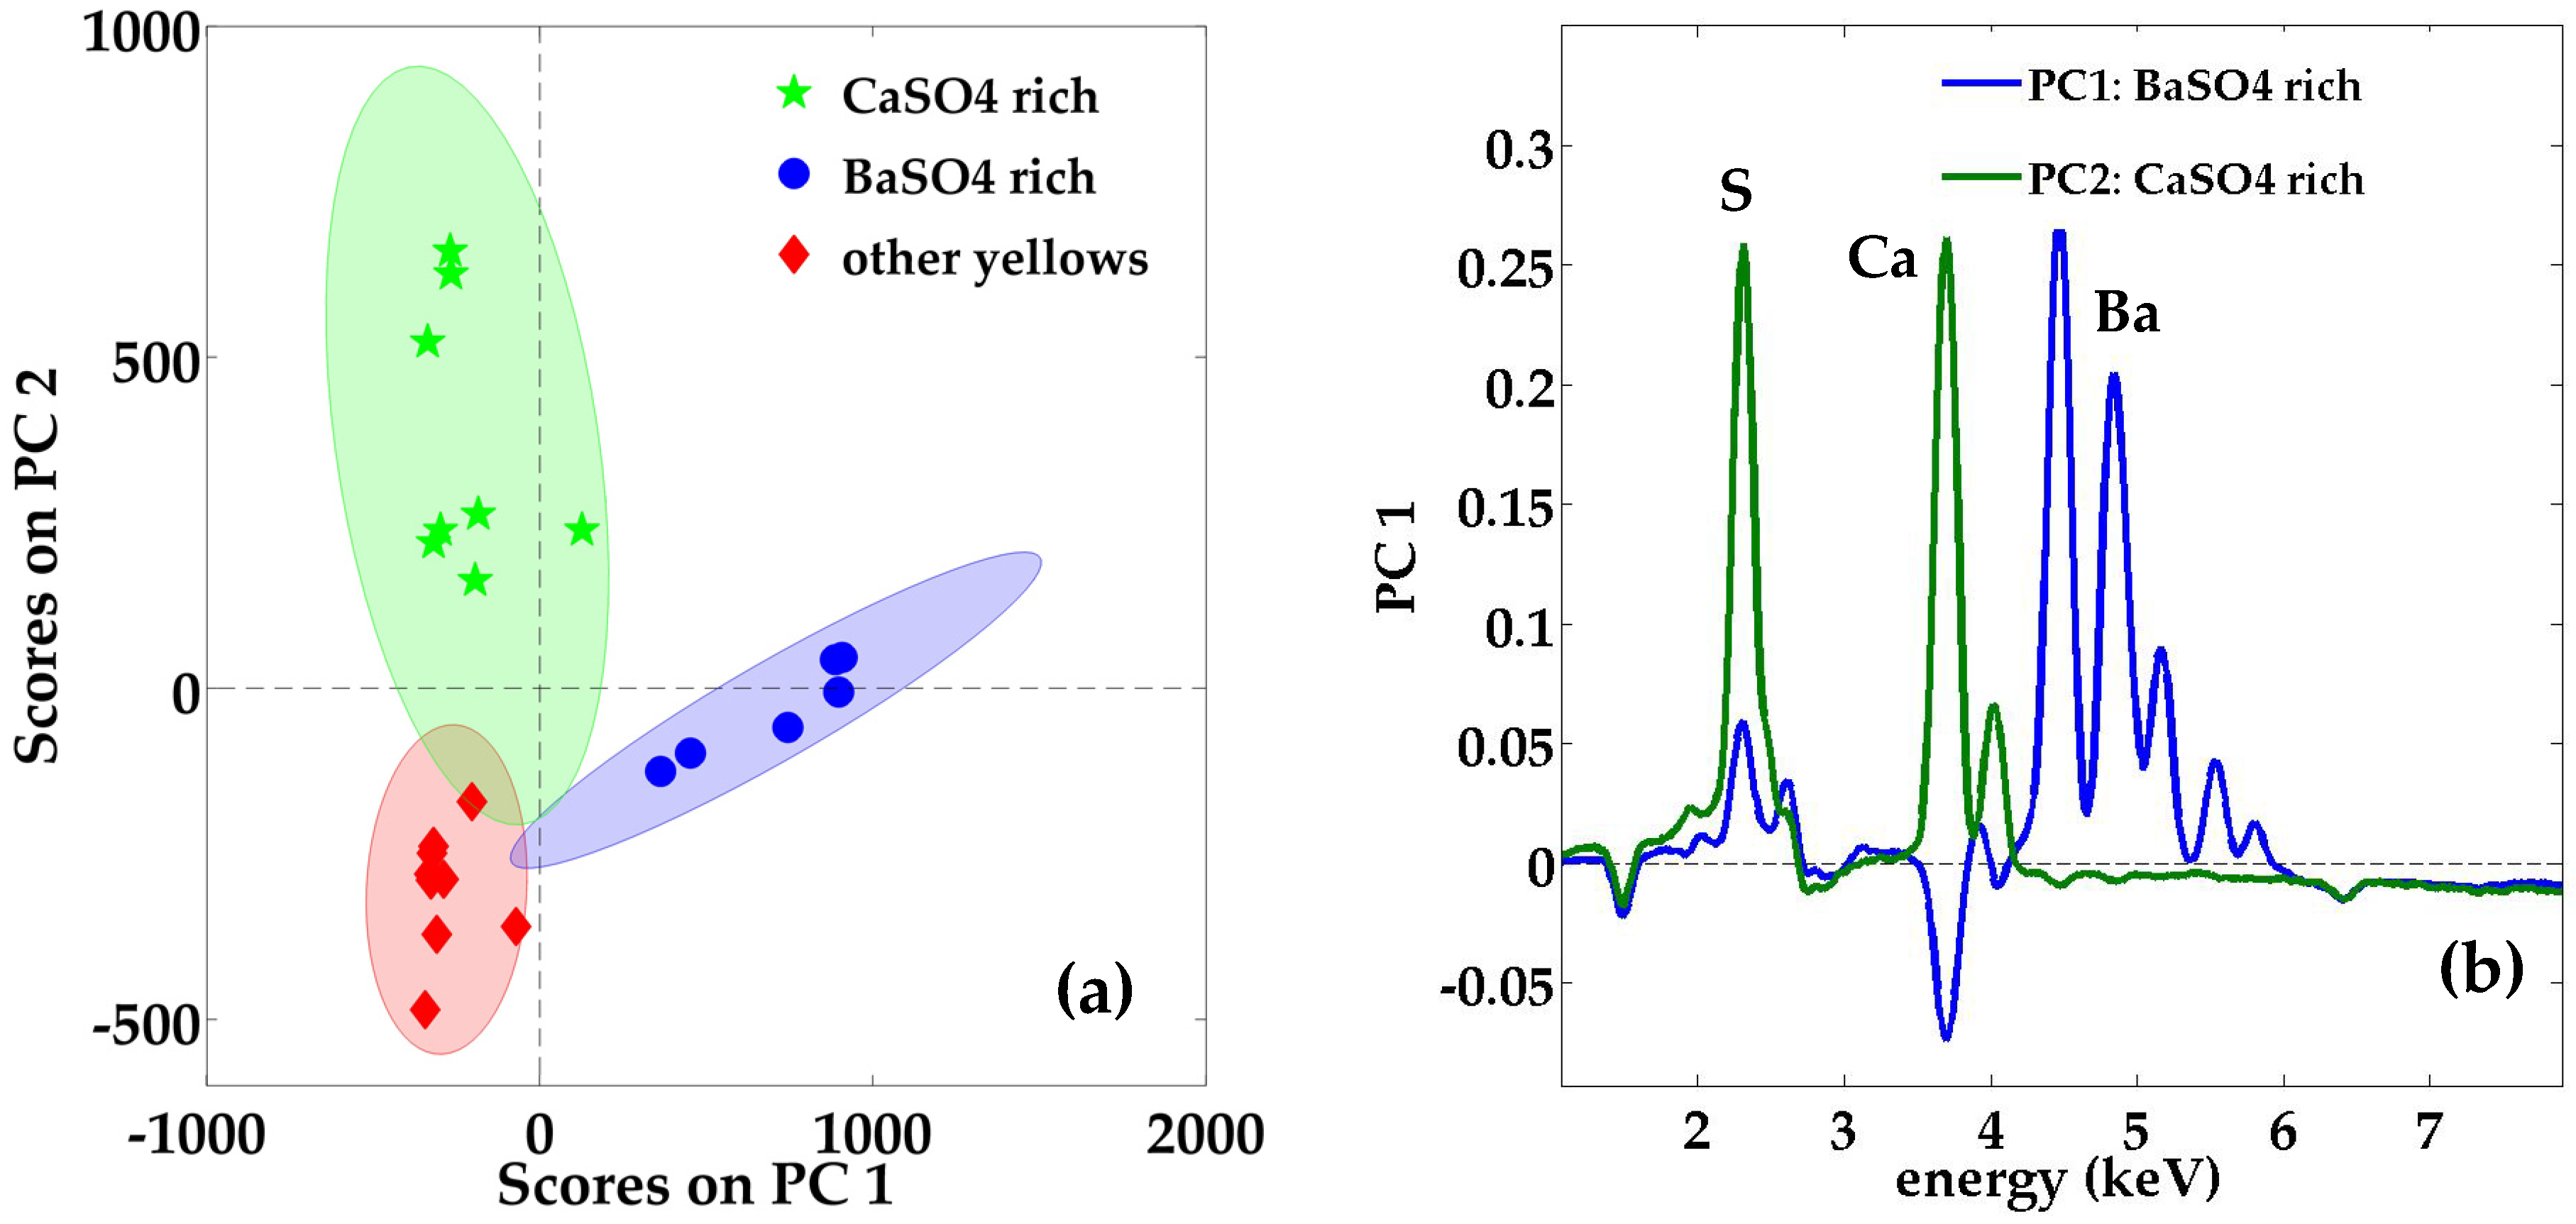
3.1.8. Yellow Gouaches

A total of seven different yellows (Y1 to Y7) were identified across twelve prints, with tonalities varying from light green-yellow to dark orange-yellow. Several prints present both a lighter and a darker yellow. All the pigments were identified as Arylid Hansa yellows, by themselves or combined: green-yellows PY3 and PY5 (Hansa Yellow 5G); red-yellows PY6 (Hansa Yellow 3G) and PY10 (Hansa Yellow R). It is notable that PY5 and PY10 are no longer in production [41]. All were easily identified by µ-FTIR and by r-FTIR when sufficiently abundant (Figures S16 and S17) [17], and/or confocal and p-Raman (Figures S18 and S19) [49]. Cl is a constituent present in most of these monoazo yellows and was detected by p-XRF (Figure S20). A small amount of lead chromate was seen in Y5 as confirmed by p-XRF (Cr, Pb) and µ-Raman (Figure S21) [31].

3.1.9. Orange Gouaches

Overall analysis revealed the use of six different orange (O1 to O6) gouaches that contained one or more organic and/or inorganic pigments: PY5, PY10, Permanent Red R (PR4), iron oxides, and lead chromate. O1 is a bright orange that contained PY5 and PR4 both confirmed by FTIR [17] and Raman [51] analysis. The light Orange 2 and Orange 3 have similar tonalities, and both contained PY5 and PY10 as confirmed by FTIR and Raman analysis. O2, however, also contained a small amount of lead chromate and a significant amount of gypsum. The composition of O3 was the same as Y2, but the ratio of the PY10 (reddish yellow) to PY5 (greenish-yellow) was reversed based on the intensity of their respective bands in the Raman spectra. Orange 4 and Orange 5 contained ochre, a natural iron oxide pigment rich in kaolinite [52], as confirmed by p-XRF (Al, Si, K, Fe) (Figure S22), r- and µ-FTIR [34], and confocal Raman [31] (Figure S23a). Orange 6 had a more complex composition and contained PY5, PR4 detected by FTIR and Raman analysis of the samples (Figures S24–S26), possibly a small amount of lead chromate based on the p-XRF analysis, Mars Red [31] (Figure S23b) and a second iron oxide pigment (214, 252, 304, 402, 463, and 560 cm−1), the latter two detected by confocal Raman.

3.1.10. Red Gouaches

The FTIR (Figures S27 and S28) and Raman analysis suggested that four different reds (R1 to R4) were used. R1, R2, and R4 contained mainly Toluidine Red (PR3) [17,50] and PR49:2—also found in Pk2. The p-XRF detected the presence of small amounts of lead chromate (Pb, Cr) in R2, while vermilion (HgS) was detected in R1 (Figure S29), as confirmed by Raman (Figure S28) [30]. PR49:2 was the only pigment detected in the less orange-hued R3.

3.1.11. Brown Gouache

The brown gouache (Br) was only used in two prints, P2 and P20. The main pigment was a natural iron oxide with a high content of aluminosilicates (possibly Sienna) and was confirmed by the hematite bands in r-FTIR [33] and ochre bands in Raman [31]. The p-XRF analysis also detected a small amount of lead chromate aside from the iron oxides.

3.1.12. An Gouaches

Darker (T1) and lighter (T2) tan gouaches were used in print P10 and P11, respectively. Based on the p-XRF analysis, both gouaches contained a small amount of a natural iron oxide pigment rich in aluminosilicates.

3.1.13. White Gouaches

The white areas in the prints were generally the paper background left in reserve except in prints P12 and P17 where white gouaches were used. Both gouaches appeared to have the same composition based on the p-XRF analysis (S, Zn, Sr, Ba) although White 2 (W2) in P17 was much richer in Zn (Figure S30). The presence of these elements can indicate the presence or combination of barium sulfate (BaSO4), zinc white (ZnO), and lithopone (30%:70% ZnS:BaSO4) [27]. Further distinction was not possible using Raman or infrared spectroscopies as neither zinc white nor zinc sulfide in lithopone [53] are easily detected. The Zn to Ba peak ratio in the p-XRF spectrum for White 1 (W1) however was characteristic of lithopone [54] while W2 had a much higher content of Zn, suggesting that it contained zinc white and barium sulfate or lithopone.

3.1.14. Gray Gouaches

Three different grays (Gy1 to Gy3) were distinguished. Gy1, used only in print P18, contained possibly zinc white and barium sulfate (based on the high Zn to Ba ratio detected by p-XRF—Figure S31) and/or lithopone, and a small amount of Prussian blue (confirmed by a very weak CN band in r-FTIR). Gy2, on the other hand, was mainly composed of titanium white in anatase form according to Raman analysis, and calcium carbonate confirmed by Raman and FTIR (and a small amount of zinc white and barium sulfate or lithopone). The gray tonality was due to the presence of ultramarine blue and Prussian blue in (Figure S23c), both confirmed by p-XRF and by Raman [31]. Gy3 was present in P9 and was similar to Gy2 in tonality and composition except for the presence of the zinc-based pigment.

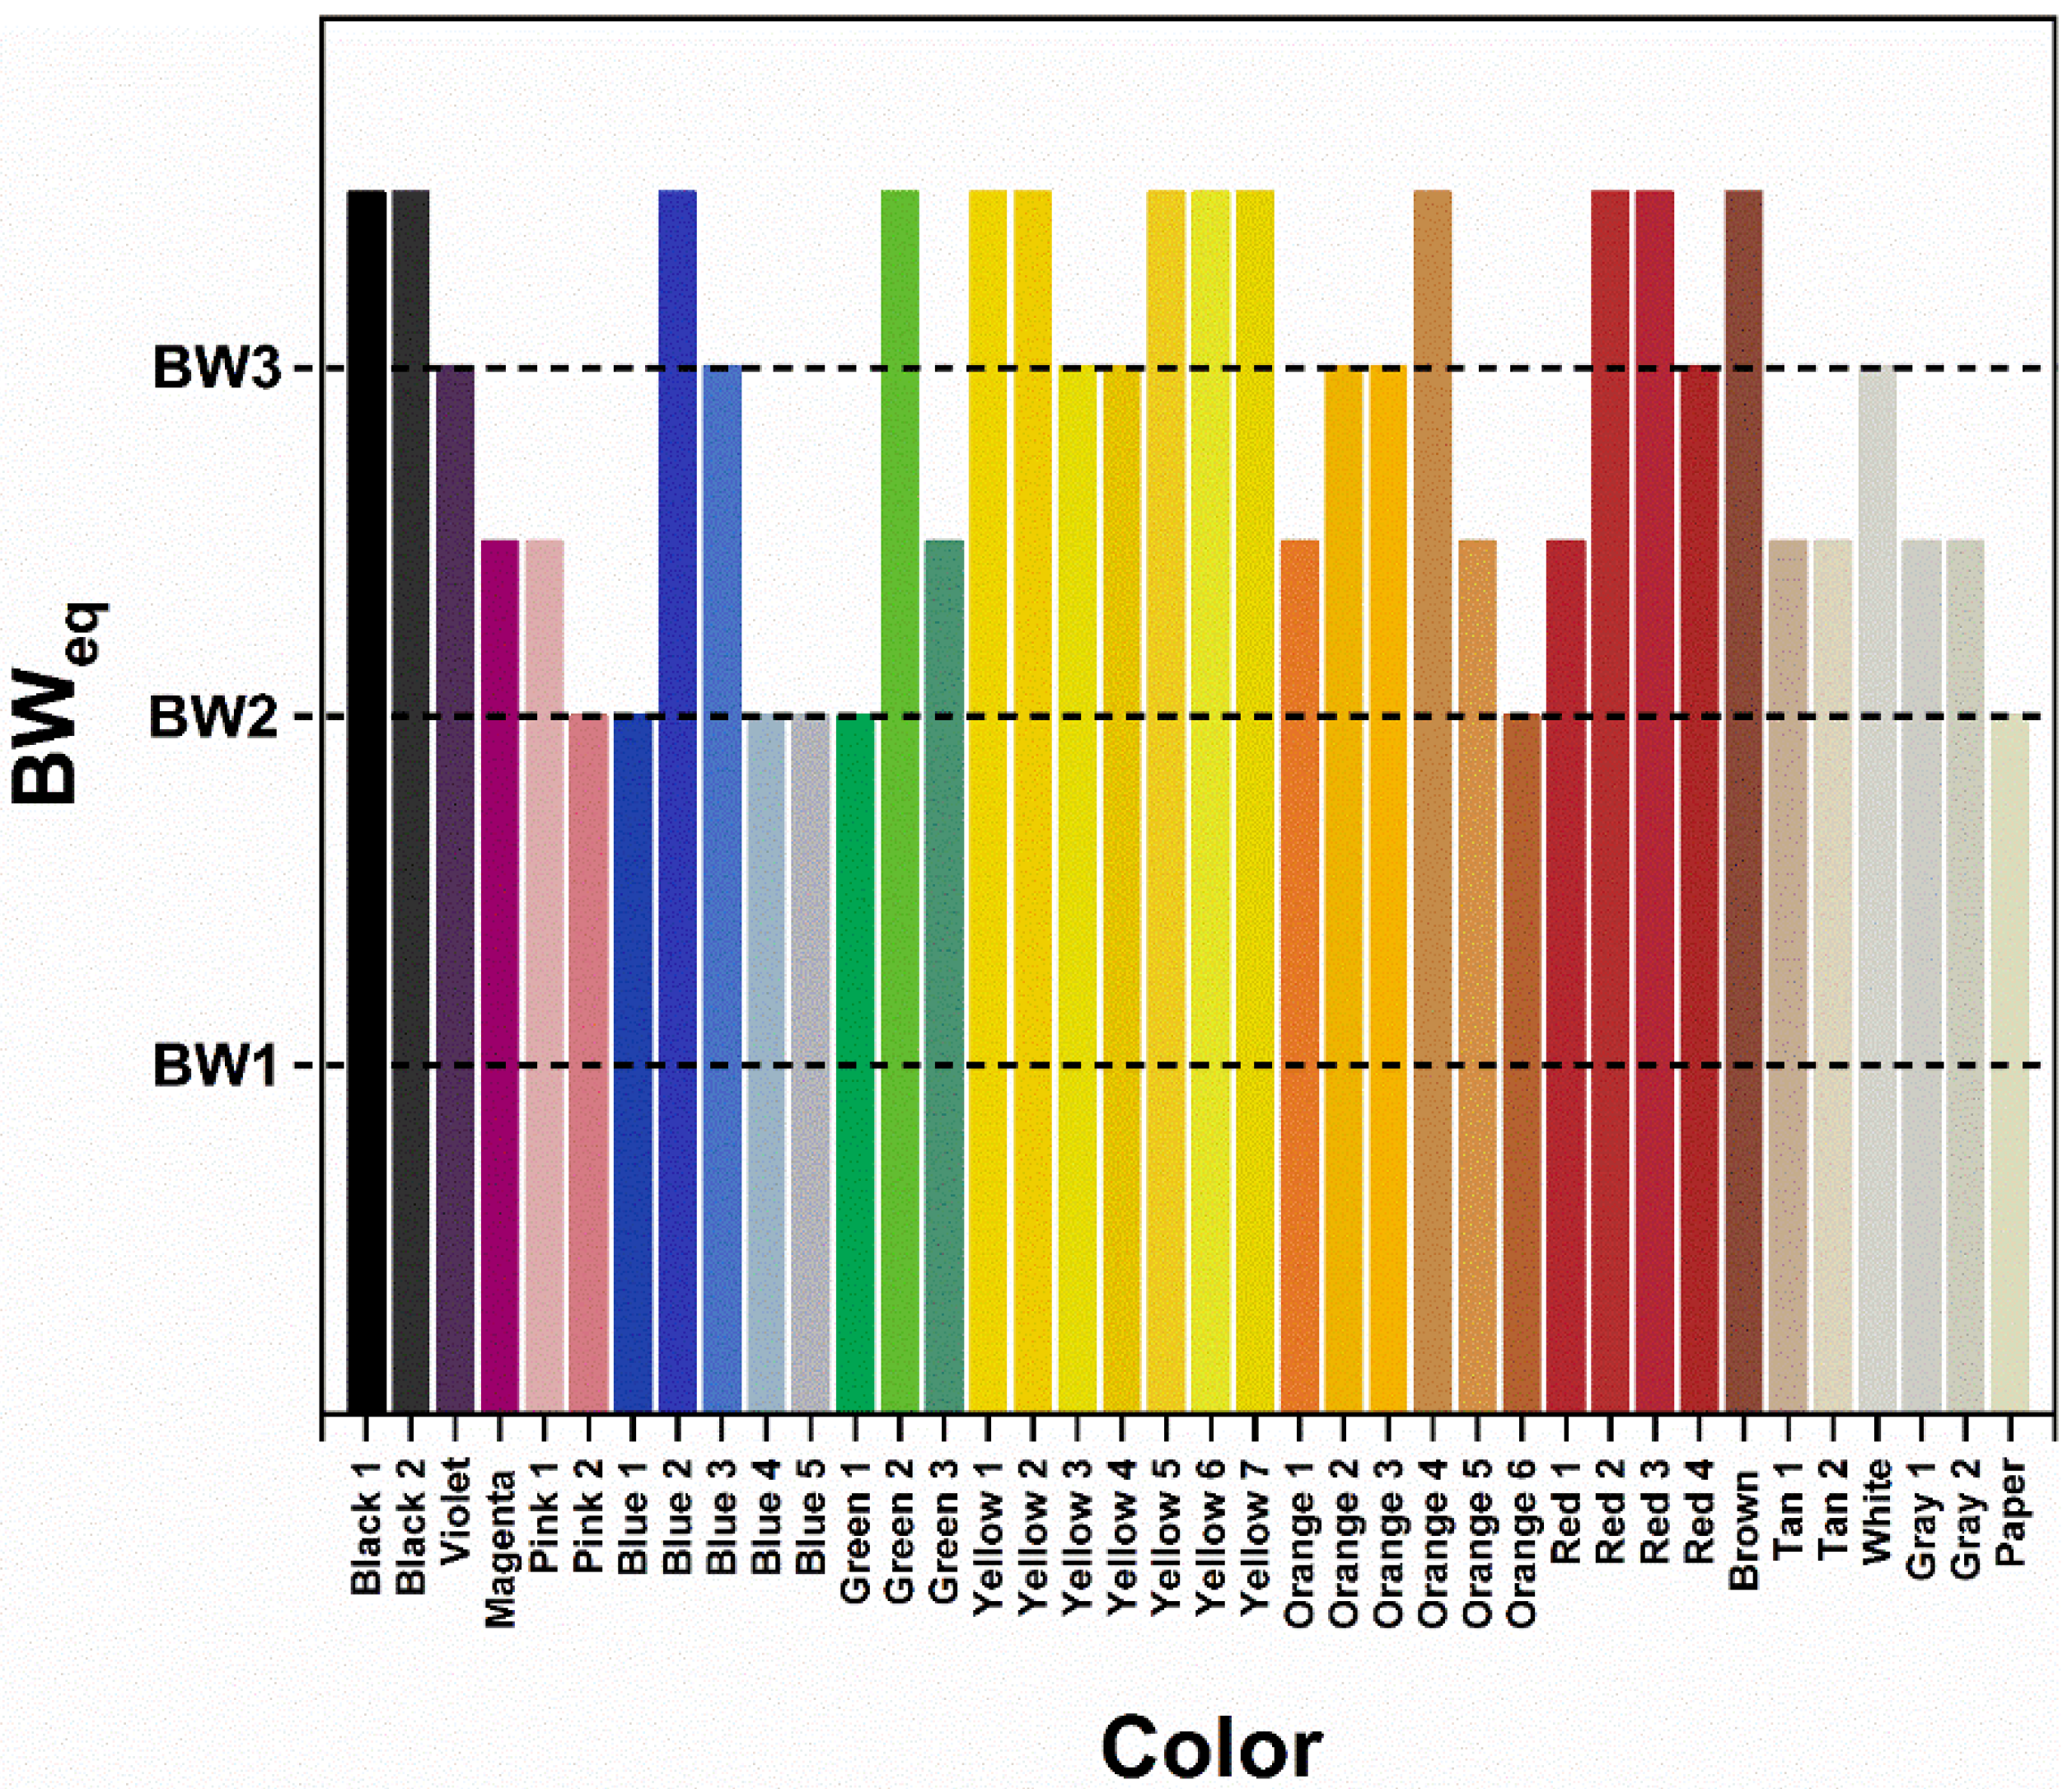
3.2. Color and Color Stability

Microfaedometry indicated that no color is alarmingly light-sensitive, or in any case more sensitive than the paper support (Figure 8). It is important to note that although the tonality of two colors might be similar, like for example Blue 1 and 2, their light sensitivity can be different as a result of their different composition. This highlights the importance of confirming the composition of all the gouaches across this work and other cut-outs by Matisse.
The most sensitive colors appeared to be Blue 1, 4, and 5, Pink 2, and Orange 1. The light blue and pink colors in this group are more transparent. Consequently, the microfaedometry testing also reflects the light sensitivity of the paper support. Fading of Matisse’s blue gouaches was reported in the past [11] for The Swimming Pool (1952) and linked to the acidic environment created by the burlap support [45]. Despite being a lightfast pigment [53], studies have shown that fading of this pigment can be promoted by the paint medium [55]. It appears, however, that the presence of white pigments and fillers in B2 and B3 increases the lightfastness of the gouaches. Orange 6 and the slightly less light-sensitive Orange 1 are the only gouaches that contain PR4, and their sensitivity was unexpectedly high considering the good lightfastness reported for PR4 in the literature (though they are reported to darken overexposure) [41]. Conversely, the sensitivity of Green 1 and to a lesser extent of Green 3, both richer in PG7 than the more light-stable Green 2, was also unexpected [41]. In contrast, although aniline (CV/MV) and xanthene dyes (rhodamines) have reputedly poor lightfastness [41,56], neither the magenta nor the violet gouaches were exceedingly light-sensitive.
The results of the microfaedometry testing led to new recommendations for the exhibition of the Jazz plates at MoMA. The prints have been grouped based on their vulnerability to color change and prioritized for upcoming displays depending on their exhibition history. Prints P14, P15, P16, and P20 are considered the most susceptible to fading as they contain at least two of the most vulnerable colors (BWeq = 2), while prints P6, P7, P10, P11, and P18 are slightly more stable but still contain three or more moderately sensitive colors (BWeq = 2.5).

4. Conclusions

The identification of the pigments present in the gouaches used by Henri Matisse was important to understand the current condition of the Jazz prints and support preventive conservation strategies. Based on the analysis carried out at MoMA and at the MNAM, a total of 39 distinct colored gouaches were used to reproduce the Jazz prints. Some of the colors, though similar in tonality, have a different composition which has implications for their light stability and display recommendations. The composition of the gouaches was consistent across the three copies of Jazz investigated and it is reasonable to assume that this applies to the rest of the existing copies since they were printed at the same time [6].
This study also illustrates the value and limitations and challenges of using a non-invasive approach that combines p-XRF, r-FTIR, and p-Raman to characterize the Linel gouaches used by Matisse in his cut-outs. More than twenty different pigments and extenders were detected and characterized across the twenty Jazz plates. All the pigments were identified using a non-invasive approach that combines p-XRF, r-FTIR, and p-Raman analysis with the exception of the methyl violet and/or crystal violet (MV/CV) and the Rhodamine 3B and 6G pigments that could only be identified by confocal Raman or SERS. The organic pigments PR3, PR4, PR49:2, PY3, PY5, PY6, and PY10 were identified by r-FTIR and p-Raman when present as major constituents, while PG7 was better identified by Raman. p-XRF was particularly suited to detect the presence of mineral pigments, especially when in low concentration, as it was the case of lead chromate and vermilion. It also hinted at the presence of the triarylcarbonium pigments (R3B and R6G) precipitated with complex ions (copper ferrocyanide or phosphotungstic acid). It was also helpful to confirm the presence of inorganic pigments and extenders identified by r-FTIR and/or p-Raman namely Prussian Blue, synthetic ultramarine, bone black, iron oxides, titanium white, barium sulfate and/or lithopone, calcium sulfate, and carbonate. While most of the colors were at least as light-stable as the paper background, adhering to lighting and exhibition guidelines for sensitive works on paper is important to sustain the vibrancy of the most sensitive colors and preserve the harmony and energy of the compositions so vital to Matisse.
Matisse was known to have used gouaches straight out of the tube and unmixed for his cut-outs [11], but the gouaches used in Jazz might have been made-to-order as Linel colorists worked closely with Matisse, Tériade, and Vairel to reproduce this large number of prints. Some of the gouaches have very similar tonalities but slightly different compositions, like the reds, some of the yellows and blues, as well as the blacks. This might have been deliberate to produce slight nuances across the plates or stemmed from the need to prepare multiple batches of gouaches. Although the gouaches identified in Jazz might have a unique composition, the analytical findings should still be relevant for the study of Matisse’s cut-outs, including for dating and authentication purposes.

Supplementary Materials

The following are available online at https://www.mdpi.com/article/10.3390/heritage4040231/s1, Figure S1: p-XRF spectra for the Black 1 (Bk1) and Black 2 (Bk2), Figure S2: r- and µ-FTIR spectra of Black 1 (Bk1) and Black 2 (Bk2), Figure S3: Confocal and p-Raman spectra of Black 1 (Bk1) and Black 2 (Bk2), Figure S4: SERS spectra of Violet (V), Figure S5: p-XRF spectra for the Violet (V), Figure S6: Normal (confocal) Raman and SERS spectra of Magenta (M), Figure S7: p-XRF spectra for the Magenta (M), Figure S8: p-XRF spectra for the Pink 1 (Pk1) and Pink 2(Pk2), Figure S9: Confocal Raman spectrum of Pink 2 (Pk2), Figure S10: p-XRF spectra for the Blue 1 (B1), Blue 2 (B2) and Blue 3 (B3), Figure S11: r- and µ-FTIR spectra of Blue 2 (B2), Figure S12: Confocal and p-Raman spectra of Blue 2 (B2), Figure S13: Confocal and p-Raman spectra of Green 2 (G2), Figure S14: p-XRF spectra for the Green 1 (G1) and Green 3 (G3), Figure S15: r- and µ-FTIR spectra of Green 2 (G2), Figure S16: r- and µ-FTIR spectra of Yellow 5 (Y5), Figure S17: r- FTIR spectrum of Yellow 3 (Y3), Figure S18: Confocal and p-Raman spectra of Yellow 4 (Y4), Figure S19: Confocal and p-Raman spectra of Yellow 1 (Y1) and Yellow 2 (Y2), Figure S20: p-XRF spectra for the Yellow 1 (Y1), Yellow 4 (Y4) and Yellow 5 (Y5), Figure S21: Confocal Raman spectrum of Yellow 5 (Y5), Figure S22: p-XRF spectra for the Orange 4 (O4) and Orange 5 (O5), Figure S23: (a) Confocal Raman spectrum of Orange 5 (O5); confocal Raman spectrum of Orange 6 (O6); confocal and p-Raman spectrum of Gray 2 (Gy2), Figure S24: r- and µ-FTIR spectra of Orange 6 (O6), Figure S25: r- and µ-FTIR spectra of Orange 6 (O6), Figure S26: Confocal Raman spectrum of Orange 6 (O6), Figure S27: r- and µ-FTIR spectra of Red 4 (R4), Figure S28: Confocal Raman spectrum of Red 1 (R1), Figure S29: p-XRF spectra for the Red 1 (R1) and Red 2 (R2), Figure S30: p-XRF spectra for White 1 (W1) and White 2 (W2), Figure S31: p-XRF spectra for the Gray 1 (Gy1), Gray 2 (Gy2) and Gray 3 (Gy3), Table S1: All pigments and auxiliary compounds detected and identified across three copies of Jazz using a multi-analytical approach, Table S2: Gouaches identified in each Jazz plate.

Author Contributions

Conceptualization, A.M. and M.D.; Data curation, A.M.; Formal analysis, A.M., M.D., A.H., C.D., A.G.-L.B. and T.T.; Investigation, A.M. and A.C.P.; Methodology, A.M., A.C.P. and M.D.; Project administration, A.M. and M.D.; Resources, A.C.P.; Writing—original draft, A.M.; Writing—review & editing, A.C.P., M.D., A.H., C.D., A.G.-L.B. and T.T. All authors have read and agreed to the published version of the manuscript.

Funding

This research was funded by Fondation des Sciences du Patrimoine and the Cooperation and International Mobility 2018 program; National Science Foundation (CHE-1402750) and HRD-1547830 (IDEALS CREST); City University of New York PSC-CUNY Faculty Research Award Program, Grant No. 69079.

Data Availability Statement

Data available upon request to authors.

Acknowledgments

Martins, Prud’hom, Duranton, Daher, and Geanatche acknowledge the financial support of the Fondation des Sciences du Patrimoine and the Cooperation and International Mobility 2018 program, as well as the support from Veronique Serano-Stedman and Jonas Strove at the Musée National D’Art Moderne de Paris. Haddad is indebted to the National Science Foundation and the City University of New York. Tang acknowledges the MoMA Summer Internship Program. Martins is grateful for the support of MoMA colleagues Karl Buchberg, Laura Neufeld, and Jodi Hauptman. Martins would also like to thank Georges Matisse and the Matisse family for their generous support. The authors acknowledge the support of Federica Pozzi, Anna Cesaratto, Marco Leona, and The Network Initiative for Conservation Science (NICS) for lending the Bruker Bravo p-Raman instrument. The authors would like to thank Xavier Gallet, Matthieu Lebon and Olivier Tombret (UMR 7194 CNRS–Histoire Naturelle de l’Homme Préhistorique) for providing access their Elio portable XRF.

Conflicts of Interest

The authors declare no conflict of interest.

References

  1. Cullinan, N. Chromatic Composition. In Henri Matisse: The Cut-Outs; Buchberg, K., Cullinan, N., Hauptman, J., Serota, N., Eds.; Tate Publishing: London, UK, 2014. [Google Scholar]
  2. Rabinow, R.A. The Legacy of La Rue Férou: Livres D’Artiste Created for Tériade by Rouault, Bonnard, Matisse, Léger, Le Corbusier, Chagall, Giacometti, and Miró; New York University, Graduate School of Arts and Science: New York, NY, USA, 1995. [Google Scholar]
  3. Wheeler, M. The Last Works of Henri Matisse: Large Cut Gouaches; Museum of Modern Art: New York, NY, USA, 1962. [Google Scholar]
  4. Saudé, J. Traité D’enluminure D’art au Pochoir; Éditions de L’IBIS: Paris, France, 1925. [Google Scholar]
  5. Matisse, H.; Rouveyre, A.; Finsen, H. Matisse—Rouveyre: Correspondance; Flammarion: Paris, France, 2001. [Google Scholar]
  6. Lavarini, B. Henri Matisse: Jazz [1943–1947]: Ein Malerbuch als Selbstbekenntnis; Scaneg Verlag: München, Germany, 2000. [Google Scholar]
  7. Rogge, C.E.; Epley, B.A. Behind the Bocour Label: Identification of Pigments and Binders in Historic Bocour Oil and Acrylic Paints. J. Am. Inst. Conserv. 2017, 56, 15–42. [Google Scholar] [CrossRef]
  8. Izzo, F.C.; van den Berg, K.J.; van Keulen, H.; Ferriani, B.; Zendri, E. Modern oil paints—Formulations, organic additives and degradation: Some case studies. In Issues in Contemporary Oil Paint; Burnstock, A., de Keijzer, M., Krueger, J., Learner, T., de Tagle, A., Heydenreich, G., van den Berg, K.J., Eds.; Springer International Publishing: Berlin/Heidelberg, Germany, 2014; pp. 75–104. [Google Scholar]
  9. Pause, R.; van der Werf, I.D.; van den Berg, K.J. Identification of Pre-1950 Synthetic Organic Pigments in Artists’ Paints. A Non-Invasive Approach Using Handheld Raman Spectroscopy. Heritage 2021, 4, 1348–1365. [Google Scholar] [CrossRef]
  10. Gautier, G.; Bezur, A.; Muir, K.; Casadio, F.; Fiedler, I. Chemical Fingerprinting of Ready-Mixed House Paints of Relevance to Artistic Production in the First Half of the Twentieth Century. Part I: Inorganic and Organic Pigments. Appl. Spectrosc. 2009, 63, 597–603. [Google Scholar]
  11. Buchberg, K.; Gross, M.; Lohrengel, S. Materials and Techniques. In Henri Matisse: The Cut-Outs; Buchberg, K., Cullinan, N., Hauptman, J., Serota, N., Eds.; Tate Publishing: London, UK, 2014. [Google Scholar]
  12. King, A. Henri Matisse: Paper Cut-Outs; St. Louis Art Museum: St. Louis, MO, USA, 1977. [Google Scholar]
  13. Mochon, R. Matisse’s “Swimming Pool”: A Microfading Study; Internal Report; Museum of Modern Art: New York, NY, USA, 2018. [Google Scholar]
  14. Liang, H.; Lange, R.; Andrei, L. Examination of the Light Sensitivity of Acanthes by Henri Matisse Using Microfade Spectroscopy; Internal Report; ISAAC Mobile Lab, Nottingham Trent University: Nottingham, UK, 2012. [Google Scholar]
  15. Townsend, J. Microfading Report on the Snail; Report T00540; Tate: London, UK, 2013. [Google Scholar]
  16. Martins, A. Microfading Report on the Matisse Gouaches Historical Set; The Museum of Modern Art: New York, NY, USA, 2018. [Google Scholar]
  17. Price, B.A.; Boris, P.; Lomax, S.Q. (Eds.) Infrared and Raman Users Group Spectral Database, 2007th ed.; IRUG: Philadelphia, PA, USA, 2009; Volumes 1–2. [Google Scholar]
  18. Lee, P.C.; Meisel, D.J. Adsorption and Surface-Enhanced Raman of Dyes on Silver and Gold Sols. Phys. Chem. 1982, 86, 3391–3395. [Google Scholar] [CrossRef]
  19. Pozzi, F.; Lombardi, J.R.; Bruni, S.; Leona, M. Sample treatment considerations in the analysis of organic colorants by surface-enhanced Raman scattering. Anal. Chem. 2012, 84, 3751–3757. [Google Scholar] [CrossRef]
  20. Druzik, J. Oriel Microfading Tester (MFT): A Brief Description. Research and Technical Studies Specialty Group Postprints. In Proceedings of the 38th Annual Meeting of the American Institute for Conservation of Historic and Artistic Works, Milwaukee, WI, USA, 11–14 May 2010. [Google Scholar]
  21. Keene, L. Getty Spectral Viewer™—Program Written for Getty Conservation Institute [GCI] for Processing Newport-Oriel Microfade Tester SPEC32 Software Results. 2007. Available online: https://www.getty.edu/conservation/our_projects/science/lighting/partners.html (accessed on 19 October 2021).
  22. Ford, B. A microfading survey of the lightfastness of blue, black and red ballpoint pen inks in ambient and modified environments. AICCM Bull. 2018, 39, 26–34. [Google Scholar] [CrossRef]
  23. Mecklenburg, M.F.; del Hoyo-Meléndez, J.M. Development and application of a mathematical model to explain fading rate inconsistencies observed in light-sensitive materials. Color. Technol. 2012, 128, 139–146. [Google Scholar] [CrossRef]
  24. Prestel, T. A classification system to enhance lightfastness data interpretation based on microfading tests and rate of colour change. Color. Technol. 2017, 133, 506–512. [Google Scholar] [CrossRef]
  25. Daly, N.S.; Sullivan, M.; Lee, L.; Trentelman, K.J. Multivariate analysis of Raman spectra of carbonaceous black drawing media for the in situ identification of historic artist materials. Raman Spectrosc. 2018, 49, 1497–1506. [Google Scholar] [CrossRef]
  26. Kingma, K.J.; Hemley, R.J. Raman spectroscopics tudy of microcrystalline silica. Am. Mineral. 1994, 79, 269–273. [Google Scholar]
  27. Gettens, R.J.; Stout, G.L. Painting Materials: A Short Encyclopedia; Courier Corporation: North Chelmsford, MA, USA, 1966. [Google Scholar]
  28. Derrick, M.R.; Stulik, D.; Landry, J.M. Infrared Spectroscopy in Conservation Science; Getty Conservation Institute: Los Angeles, CA, USA, 1999. [Google Scholar]
  29. Feller, R.L. Barium Sulphate. In Artists’ Pigments: A Handbook of Their History and Characteristics; Feller, R.L., Ed.; National Gallery of Art: Washington, DC, USA, 1986; Volume 1. [Google Scholar]
  30. Vetter, W.; Schreiner, M. Characterization of pigment-binding media systems - comparison of non-invasive in-situ reflection FTIR with transmission technical FTIR microscopy E-Preserv. Sci 2011, 8, 10–22. [Google Scholar]
  31. Bell, I.M.; Clark, R.J.H.; Gibbs, P.J. Raman spectroscopic library of natural and synthetic pigments (Pre- ~ 1850 AD). Spectrochim. Acta A Mol. Biomol. Spectrosc. 1997, 53, 2159–2179. [Google Scholar] [CrossRef]
  32. Socrates, G. Infrared and Raman Characteristic Group Frequencies: Tables and Charts, 3rd ed.; John Wiley & Sons: West Sussex, UK, 2004. [Google Scholar]
  33. Genestar, C.; Pons, C. Earth pigments in painting: Characterisation and differentiation by means of FTIR spectroscopy and SEM-EDS microanalysis. Anal. Bioanal. Chem. 2005, 382, 269–274. [Google Scholar] [CrossRef] [PubMed]
  34. Frederickson, L.D. Characterization of hydrated alumina by infrared spectroscopy. Application to study of bauxite ores. Anal. Chem. 1954, 26, 1883–1885. [Google Scholar] [CrossRef]
  35. Vila, A.; Ferrer, N.; García, J.F. Chemical composition of contemporary black printing inks based on infrared spectroscopy: Basic information for the characterization and discrimination of artistic prints. Anal. Chim. Acta 2007, 591, 97–105. [Google Scholar] [CrossRef] [PubMed]
  36. Daveri, A.; Malagodi, M.; Vagnini, M.J. The Bone Black Pigment Identification by Noninvasive, In Situ Infrared Reflection Spectroscopy. J. Anal. Methods Chem. 2018, 2018, 6595643. [Google Scholar] [CrossRef] [PubMed] [Green Version]
  37. Coccato, A.; Jehlicka, J.; Moens, L.; Vandenabeele, P.J. Raman spectroscopy for the investigation of carbon-based black pigments. Raman Spectrosc. 2015, 46, 1003–1015. [Google Scholar] [CrossRef] [Green Version]
  38. Berrie, B. Prussian Blue. In Artists’ Pigments: A Handbook of Their History and Characteristics; West FitzHugh, E., Ed.; National Gallery of Art: Washington, DC, USA, 1997; Volume 3. [Google Scholar]
  39. Jensen, L.; Schatz, G.C.J. Resonance Raman Scattering of Rhodamine 6G as Calculated Using Time-Dependent Density Functional Theory. J. Phys. Chem. A 2006, 110, 5973–5977. [Google Scholar] [CrossRef] [PubMed]
  40. Cañamares, M.V.; Chenal, C.; Birke, R.L.; Lombardi, J.R.J. DFT, SERS, and Single-Molecule SERS of Crystal Violet. Phys. Chem. C 2008, 112, 20295–20300. [Google Scholar] [CrossRef]
  41. Herbst, W.; Hunger, K. Industrial Organic Pigments: Production, Properties, Applications, 3rd ed.; John Wiley & Sons: Weinheim, Germany, 2006. [Google Scholar]
  42. Matisse, H.; Flam, J.D.; Tériade, E.; Szymusiak, D. Matisse et Tériade; Anthèse: Arcueil, France, 1996. [Google Scholar]
  43. Steger, S.; Stege, H.; Bretz, S.; Hahn, O.J. A complementary spectroscopic approach for the non-invasive in-situ identification of synthetic organic pigments in modern reverse paintings on glass (1913–1946). Cult. Herit. 2019, 38, 20–28. [Google Scholar] [CrossRef]
  44. Kennedy, A.; Stewart, H.; Stenger, J. Lithol Red: A Systematic Structural Study on Salts of a Sulfonated Azo Pigment. Chem. Eur. J. 2012, 18, 3064–3069. [Google Scholar] [CrossRef]
  45. Desnica, V.; Furić, K.; Schreiner, M. Notice “Multianalytical characterisation of a variety of ultramarine pigments”. E-Preserv. Sci. 2004, 1, 15–25. [Google Scholar]
  46. Burgio, L.; Clark, R.J.H. Library of FT-Raman spectra of pigments, minerals, pigment media and varnishes, and supplement to existing library of Raman spectra of pigments with visible excitation. Spectrochim. Acta Part A Mol. Biomol. Spectrosc. 2001, 57, 1491–1521. [Google Scholar] [CrossRef]
  47. Silva, C.E.; Silva, L.P.; Edwards, H.G.M.; de Oliveira, L.F.C. Diffuse reflection FTIR spectral database of dyes and pigments. Anal. Bioanal. Chem. 2006, 386, 2183–2191. [Google Scholar] [CrossRef] [PubMed]
  48. Lewis, P.A. (Ed.) Pigment Handbook, Volume 1: Properties and Economics, 2nd ed.; Wiley-Interscience: New York, NY, USA, 1988. [Google Scholar]
  49. Scherrer, N.C.; Stefan, Z.; Francoise, D.; Annette, F.; Renate, K. Synthetic organic pigments of the 20th and 21st century relevant to artist’s paints: Raman spectra reference collection. Spectrochim. Acta Part A Mol. Biomol. Spectrosc. 2009, 73, 505–524. [Google Scholar] [CrossRef] [PubMed]
  50. Buti, D.; Rosi, F.; Brunetti, B.G.; Miliani, C. In-situ identification of copper-based green pigments on paintings and manuscripts by reflection FTIR. Anal. Bioanal. Chem. 2013, 405, 2699–2711. [Google Scholar] [CrossRef] [PubMed]
  51. Fremout, W.; Saverwyns, S.J. Identification of synthetic organic pigments: The role of a comprehensive digital Raman spectral library. Raman Spectrosc. 2012, 43, 1536–1544. [Google Scholar] [CrossRef]
  52. Helwig, K. Iron Ocide. In Artists’ Pigments: A Handbook of Their History and Characteristics; Berrie, B., Ed.; National Gallery of Art: Washington, DC, USA, 2007; Volume 4. [Google Scholar]
  53. Buxbaum, G.; Pfaff, G. (Eds.) Industrial Inorganic Pigments; John Wiley & Sons: Hoboken, NJ, USA, 2006. [Google Scholar]
  54. Capua, R.J. The obscure history of a ubiquitous pigment: Phosphorescent lithopone and its appearance on drawings by John la Farge. J. Am. Inst. Conserv. 2014, 53, 75–88. [Google Scholar] [CrossRef]
  55. de la Rie, E.R.; Michelin, A.; Ngako, M.; Del Federico, E.; Del Grosso, C. Photo-catalytic degradation of binding media of ultramarine blue containing paint layers: A new perspective on the phenomenon of “ultramarine disease” in paintings. Polym. Degrad. Stab. 2017, 144, 43–52. [Google Scholar] [CrossRef]
  56. de Keijzer, M.; van Bommel, M.R. Bright new colours: The history and analysis of fluorescein, eosin, erythrosine, Rhodamin B and some of their derivatives. In The Diversity of Dyes in History and Archaeology; Atkinson, J.K., Ed.; Archetype Books: London, UK, 2017. [Google Scholar]
Figure 1. Henri Matisse Horse, Rider and Clown, from Jazz 1947. One from a portfolio of twenty pochoirs (42.3 × 65.5 cm). Published by Tériade, Paris and printed by Edmond Vairel, Paris, Draeger Frères, Paris. Edition of 100. MoMA object number: 291.1948.5. Copyright © 2021 Succession H. Matisse/Artists Rights Society (ARS), New York. All reproductions of this work are excluded from the CC: BY License.
Heritage 04 00231 g001
Figure 2. Details of Jazz plates examined under the optical microscope (×10 magnification) showing minimal overlap between color fields and some cross-contamination of gouache particles.
Heritage 04 00231 g002
Figure 3. Results of PCA analysis carried out on the p-XRF spectra taken on 23 yellow spots across the 20 MoMA Jazz plates. The scores plot (a) distinguishes three different types of yellows. The loading plot (b) indicates that the distinction is based on the presence or not of CaSO4 or BaSO4 extenders.
Heritage 04 00231 g003
Figure 4. p-XRF spectra for the black gouaches—(red) Bk1 and (gray) paper support for plate P1 and (green) Bk2 for plate P8. Elements present in both gouaches: Al, Si, P, S, K, Ca, Ti, Cr, Mn, Fe, and Zn (small amounts of Al, Si, S, Ca, Fe, and Zn are also present in the paper).
Heritage 04 00231 g004
Figure 5. (Non-KK transformed) r- and µ-FTIR spectra of Black 1 (Bk1) and Black 2 (Bk2) alongside IRUG [17] reference spectra for cellulose, (†) Bone black (875, 962, 1038, 1087 and 2013 cm−1) and (*) Prussian blue (2094 cm−1); (‡) silicates/aluminosilicates were also observed (1001, 794 cm−1).
Heritage 04 00231 g005
Figure 6. Confocal and p-Raman spectra of Black 1 (Bk1) and Black 2 (Bk2) alongside reference spectrum for Bone black [17,25] (D and G broad bands (‡) at 1367 and 1590 cm−1—shifted to 1320 cm−1 in p-Raman). (†) Quartz (468 cm−1) and silicates (272 cm−1) [17,26] were also observed (355 cm−1 unassigned *).
Heritage 04 00231 g006
Figure 7. µ-FTIR spectrum obtained for the violet gouache (V) alongside IRUG [17] reference spectra for barium sulfate, cellulose, and gum rabic (gray region) the characteristic O-H bending mode at 1650–1620 cm−1 [17,28].
Heritage 04 00231 g007
Figure 8. The light sensitivity of all colors represented in Jazz on a range from BW1 (most sensitive) to BW3 (moderate sensitivity).
Heritage 04 00231 g008
Table 1. Pigments and auxiliary compounds detected and identified across three copies of Jazz using a multi-analytical approach (PR49:2: Calcium Lithol Red; PG7: Phthalocyanine green, PY3: Hansa Yellow 10G; PY5: Hansa Yellow 5G; PY6: Hansa Yellow 3G; PY10: Hansa Yellow R; PR3: Toluidine Red; PR4: Permanent Red R) * not analyzed.
Color Pigment(s) IdentifiedMFTColor Pigment(s) IdentifiedMFT
Black 1 (Bk1) Heritage 04 00231 i001Bone black/carbon black
Prussian blue
Silicates and metal oxides
>3Green 3 (G3) Heritage 04 00231 i002PG7
Synthetic ultramarine
Barium sulfate
2.5
Black 2 (Bk2) Heritage 04 00231 i003Bone black/carbon black
Prussian blue
Silicates and metal oxides
>3Yellow 1 (Y1) Heritage 04 00231 i004PY5>3
Violet (V) Heritage 04 00231 i005Crystal violet/methyl violet
Rhodamine 6G
Copper ferrocyanide
Barium sulfate
3Yellow 2 (Y2) Heritage 04 00231 i006PY5
PY10
>3
Magenta (M) Heritage 04 00231 i007Rhodamine 6G
Rhodamine 3B
Copper ferrocyanide
Phototungstic (acid)
Barium sulfate
2.5Yellow 3 (Y3) Heritage 04 00231 i008PY5
PY6
Bariumsulfate/zinc white/
lithopone
3
Pink 1 (Pk1) Heritage 04 00231 i009Crystal violet/methyl violet
Rhodamine 6G
Copper ferrocyanide
Barium sulfate
2.5Yellow 4 (Y4) Heritage 04 00231 i010PY3
PY6
Barium sulfate
3
Pink 2 (Pk2) Heritage 04 00231 i011PR49:22Yellow 5 (Y5) Heritage 04 00231 i012PY3
PY10
Lead chromate
Calcium sulfate
>3
Blue 1 (B1) Heritage 04 00231 i013Synthetic ultramarine2Yellow 6 (Y6) Heritage 04 00231 i014PY3
Gypsum
Barium sulfate
>3
Blue 2 (B2) Heritage 04 00231 i015Synthetic ultramarine
Titanium white
Calcium carbonate
Zinc white
3Yellow 7 (Y7) Heritage 04 00231 i016PY5
PY3
Barium sulfate
>3
Blue 3 (B3) Heritage 04 00231 i017Synthetic ultramarine
Zinc white/
Barium sulfate/lithopone
3Orange 1 (O1) Heritage 04 00231 i018PY5
PR4
2.5
Blue 4 (B4) Heritage 04 00231 i019Synthetic ultramarine2Orange 2 (O2) Heritage 04 00231 i020PY5
PY10
Lead chromate
Calcium sulfate
3
Blue 5 (B5) Heritage 04 00231 i021Synthetic ultramarine2Orange 3 (O3) Heritage 04 00231 i022PY5
PY10
3
Green 1 (G1) Heritage 04 00231 i023PG7
PY3
Barium sulfate
Aluminum Hydrate
2Orange 4 (O4) Heritage 04 00231 i024Iron oxide (yellow ochre)
Lithopone
Calcium carbonate
>3
Green 2 (G2) Heritage 04 00231 i025PG7
PY3
Barium sulfate
>3Orange 5 (O5) Heritage 04 00231 i026Iron oxide (yellow ochre)2.5
Orange 6 (O6) Heritage 04 00231 i027PR4
PY5
Iron oxide (Mars red)
Iron oxide (ochre)
Calcium sulfate
Lead chromate
2Tan 2 (T2) Heritage 04 00231 i028Iron oxide*
Red 1 (R1) Heritage 04 00231 i029PR3
PR49:2
Vermilion
Barium sulfate
2.5White 1 (W1) Heritage 04 00231 i030Barium sulfate/zinc white/
lithopone
≈3
Red 2 (R2) Heritage 04 00231 i031PR3
PR49:2
Lead chromate
Barium sulfate
>3White 2 (W2) Heritage 04 00231 i032Zinc white
Barium sulfate/lithopone
*
Red 3 (R3) Heritage 04 00231 i033PR49:2>3Gray 1 (Gy1) Heritage 04 00231 i034Zinc white
Barium sulfate/zinc white/
lithopone
Prussian blue
2.5
Red 4 (R4) Heritage 04 00231 i035PR3
PR49:2
3Gray 2 (Gy2) Heritage 04 00231 i036Titanium white (anatase)
Calcium carbonate
Ultramarine blue
Prussian blue
Barium sulfate/zinc white/
lithopone
2.5
Brown (Br) Heritage 04 00231 i037Iron oxide (Sienna/Mars red)
Lead chromate
Calcium sulfate
>3Gray 3 (Gy3) Heritage 04 00231 i038Titanium white (anatase)
Calcium carbonate
Ultramarine blue
Prussian blue
*
Tan 1 (T1) Heritage 04 00231 i039Possibly iron oxide
Barium sulfate/zinc white/Lithopone
2.5Paper Heritage 04 00231 i040Low mineral content2
Publisher’s Note: MDPI stays neutral with regard to jurisdictional claims in published maps and institutional affiliations.

