
From Discovery to Public Consumption: The Process of Mapping and Evaluating Underwater Cultural Heritage in Malta

1
Department of Classics and Archaeology, Faculty of Arts, University of Malta, MSD 2080 Msida, Malta
2
Underwater Cultural Heritage Unit, Ex-Naval Bakery, Vittoriosa Waterfront, BRG 1721 Vittoriosa, Malta
*
Author to whom correspondence should be addressed.
Heritage 2021, 4(4), 2732-2745; https://doi.org/10.3390/heritage4040154
Submission received: 30 August 2021
/
Revised: 20 September 2021
/
Accepted: 20 September 2021
/
Published: 28 September 2021
(This article belongs to the Special Issue Dive in Blue Growth – Protection and Promotion of Accessible Underwater Cultural Heritage Sites)
Abstract
:The in situ promotion and preservation of underwater cultural heritage sites is one of the main ideas of the UNESCO Convention on the Protection of Underwater Cultural Heritage. Currently, most shipwrecks are found in water shallower than the 50 m contour. The continued technological advances and increases in technical diving and deep-water exploration point towards a shift in this statistic, which is set to increase exponentially in the not-too-distant future. Thus, it is imperative to look at ways in which such directives can be implemented. This paper will highlight the synergy between existing remote sensing technologies and the management of underwater cultural heritage with examples of on-going research projects, such as Malta’s approach to surveying and implementing a scoring system for historic wreck sites based on local and global considerations of historic and natural conditions of site elements. Such an approach allows for the scaling of sites based on a number of parameters and provides instructive information for the creation of management strategies. The intention here is to demonstrate how large-scale remote sensing surveys can make major contributions to site management, which, in turn, facilitates the decision-making process in terms of how and what information is transmitted to divers and members of the public.
1. Introduction
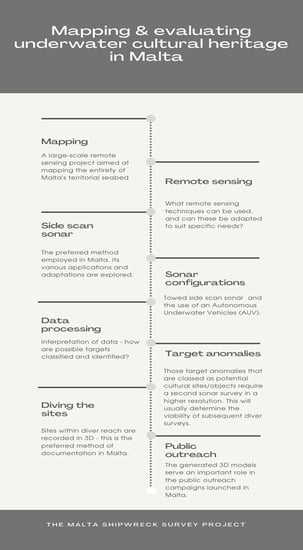
The concept of remote sensing has been defined many times and in many ways. An accurate description would be that remote sensing is ‘the gathering of information from a distance’ [1] (p. 4). The United States Geological Survey defines remote sensing as the ‘process of detecting and monitoring the physical characteristics of an area by measuring its reflected and emitted radiation at a distance […] which help researchers “sense” things about the Earth’ [2]. The mere fact that the ‘oceans and seas are difficult to reach for direct observation’ [3] has necessitated the development of tools that allow maritime archaeologists and heritage managers to “see” beneath the surface. Consequently, since the 1960s, remote sensing technology has been applied to maritime archaeology owing to its various advantageous applications, such as in covering large areas and detecting remains found on the seabed [4]. Since 2006, the University of Malta (UM), in collaboration with the Superintendence of Cultural Heritage (SCH), Malta’s cultural heritage regulator, has been systematically recording Malta’s territorial seabed. This is very much a budget-based initiative, and the areas and sites explored are reliant on the available funding. The aims of this long-term project, which is entitled the Malta Shipwreck Survey Project, are:
- To locate and survey known underwater cultural heritage (UCH) sites.
- To gather and analyze data for the purpose of monitoring and managing Malta’s UCH.
- To explore areas of the seabed in order to detect the presence or absence of UCH.
- To train students and personnel in the use of state-of-the-art marine offshore surveying equipment [5].
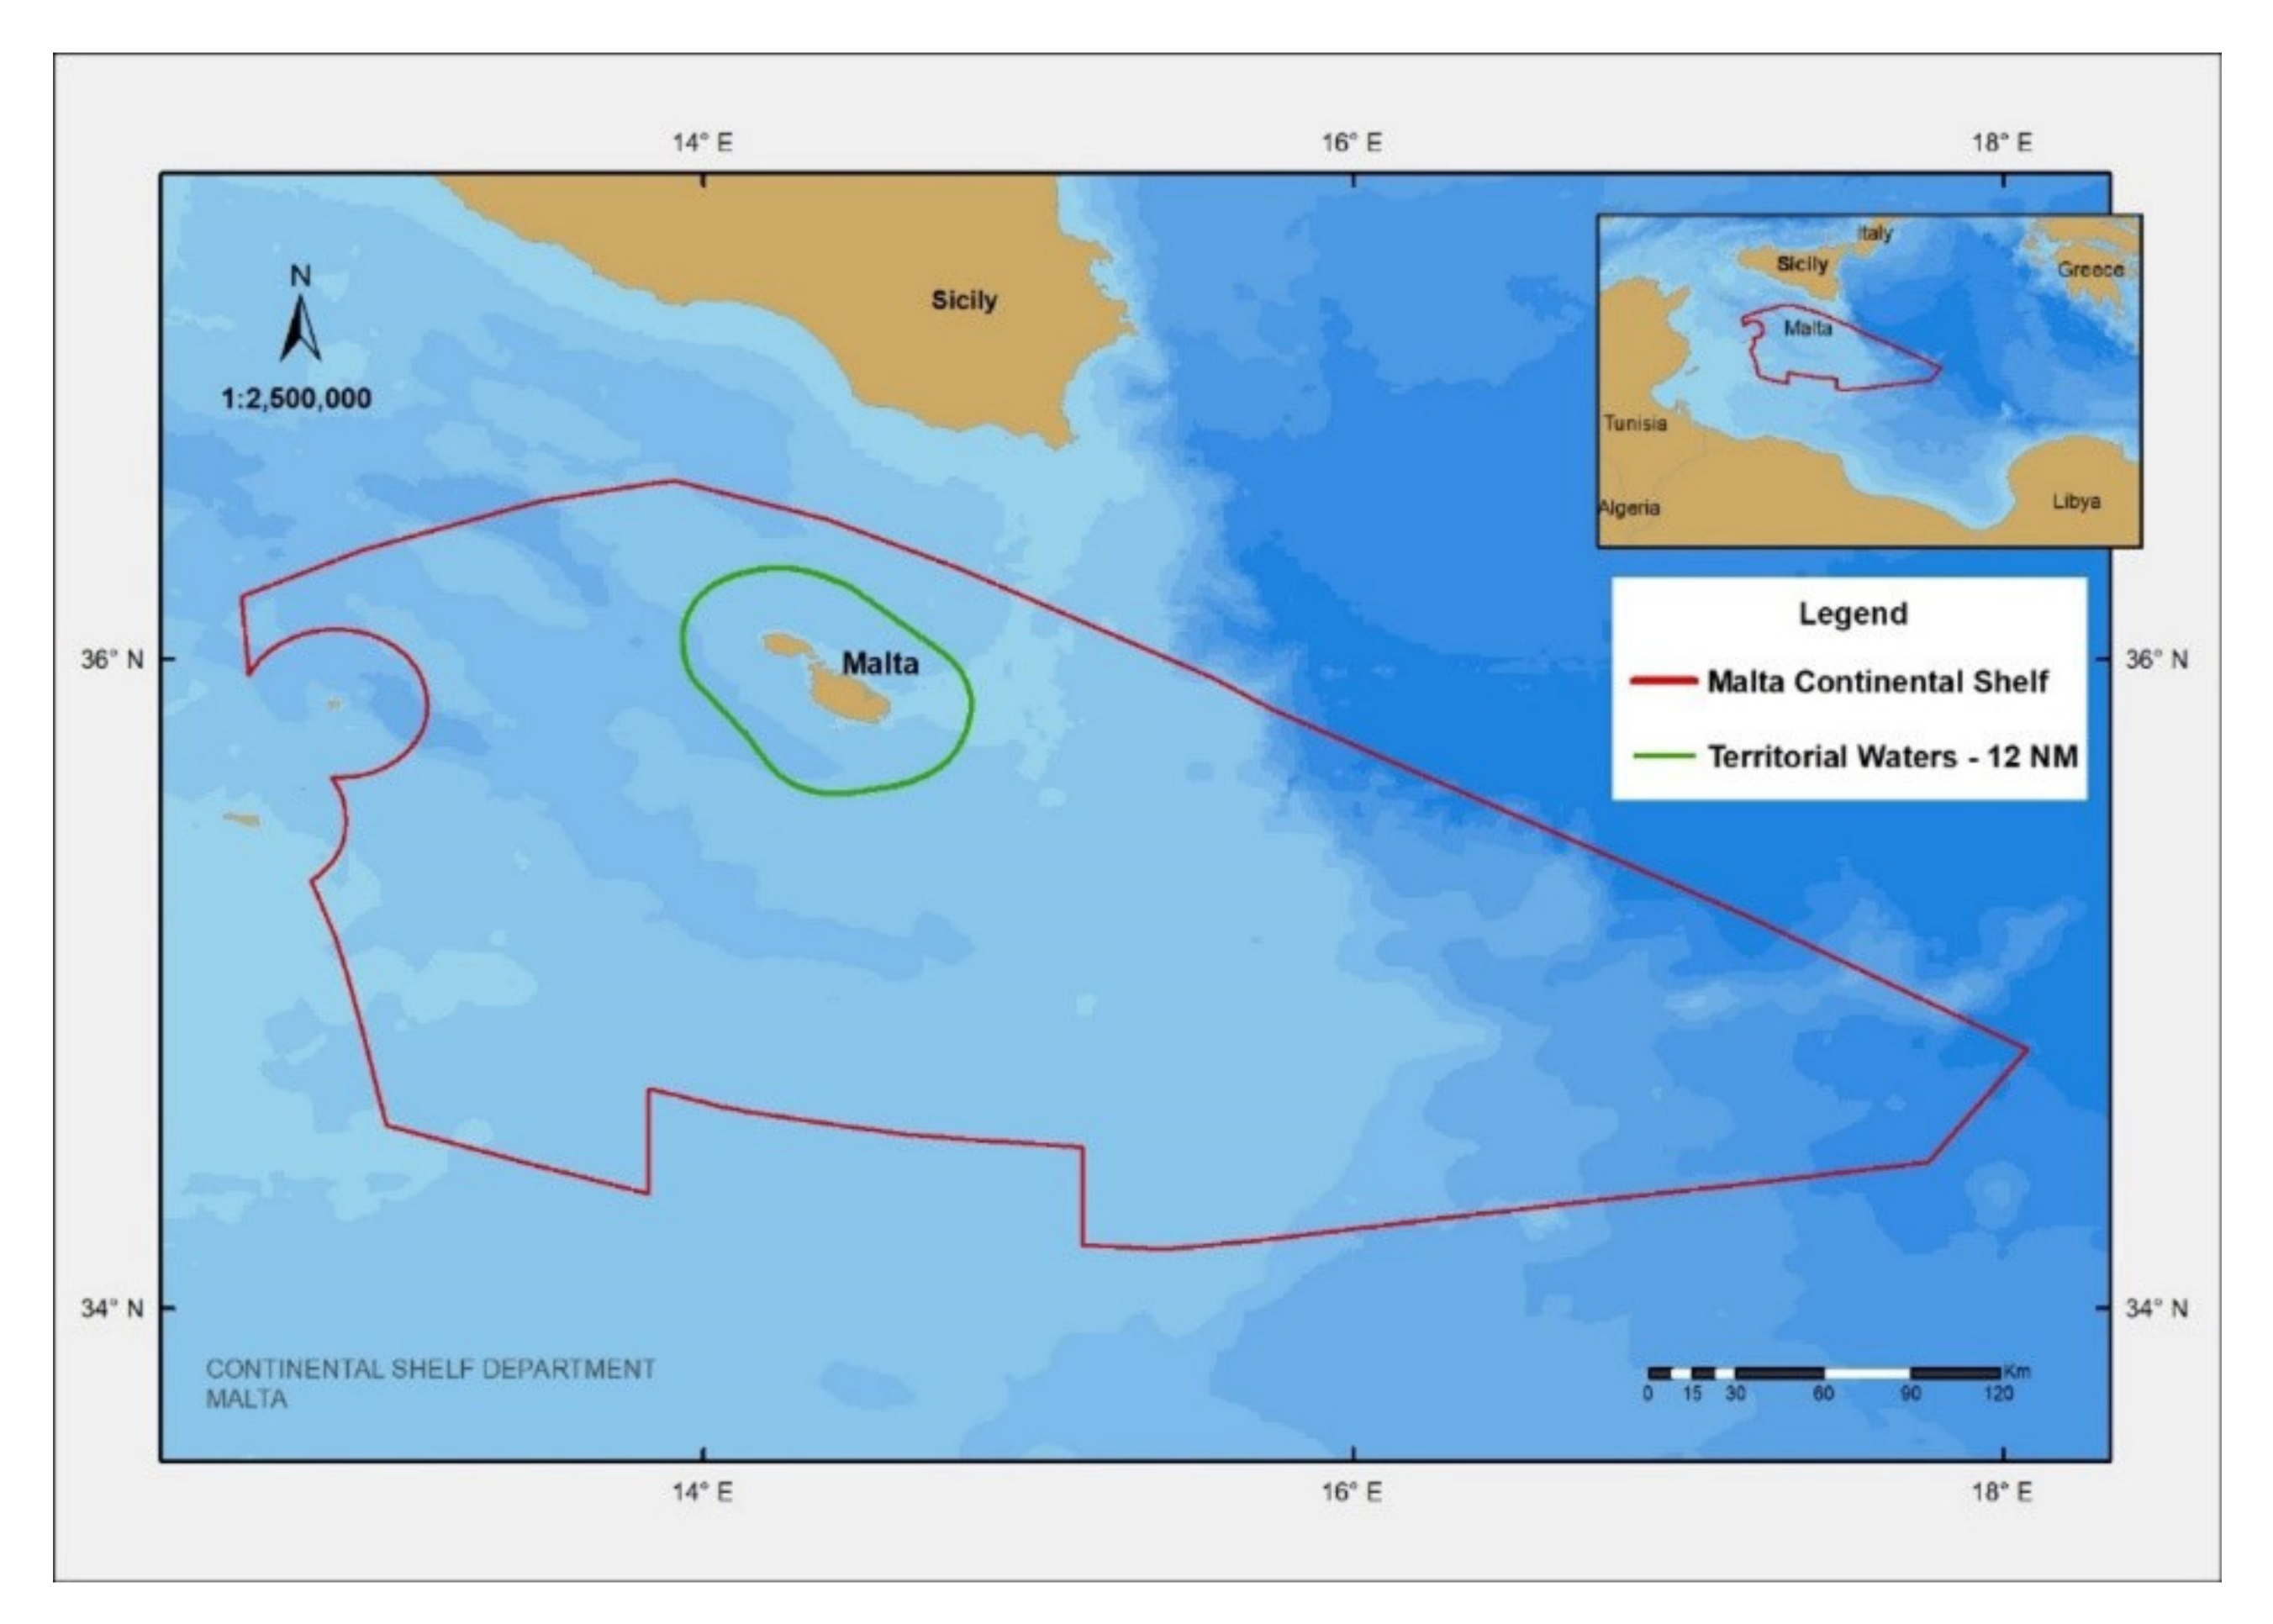
Over the years, the potential of remote sensing as a mapping, evaluation, and management tool has been consolidated. This statement is based on the premise that in order to make decisions on the management of UCH, it is first necessary to know what lays on the seabed. In turn, the more data are gathered, the larger the available database will be, resulting in an increase in knowledge-based decisions. This is a primary reason for why Malta has placed a strong emphasis on systematically recording its territorial seabed. A variety of techniques can be used when conducting underwater surveys. The chosen method is very dependent on the aim of the survey, the type of survey being carried out, the topography of the area, the extent of the area of interest, depth, maritime traffic, and any other possible maritime-related activities, such as fishing and bunkering. A primary consideration for the UM team is depth. Dramatic variations in depth that go to over 1000 m mean that traditional diver surveys are not always an option. For most of Malta’s territorial waters, remote sensing is the only tool available to researchers, and it has today become the primary instrument in Malta’s seabed mapping initiative. The relatively ‘small’ size of the Malta’s territorial waters, approximately 3830 km2, is an advantage, creating a situation whereby the totality of the island’s territorial seabed can be studied in a relatively short amount of time (Figure 1).
The practical applicability of remote sensing in maritime archaeology is undeniable, as it acts as a primary survey tool for large swathes of seabed that would otherwise be inaccessible. Remote sensing equipment is rarely hampered by aspects such as visibility, temperature, or currents. On the other hand, such elements have to be taken into consideration when conducting diver surveys. This does not mean that remote sensing has replaced diver-based surveys; on the contrary, it has enhanced ‘the effectiveness of diver investigation and extended the range of environments in which underwater surveys can be undertaken’ [6] (p. 103). Apart from these practical considerations, remote sensing can also be viewed from a decision-making perspective. The data reveal what, if any, types of cultural remains are present on the seabed and form the foundation for any future considerations. Site management concerns are very much based on the data gathered from marine surveys, acting as baselines from which to plan and make decisions, including: (1) whether further, more detailed surveys are required; (2) whether or not diver and photogrammetric surveys are viable options; (3) whether, ultimately, actions need to be taken for the protection and management of any discovered UCH. In 2019, UCH was explicitly accorded the same level of protection as Maltese terrestrial heritage sites. This landmark legislative change resulted in the setting up of the Underwater Cultural Heritage Unit (UCHU) within Heritage Malta, the national agency for cultural heritage in Malta. The UCHU is responsible for the protection and managed access to underwater sites, working in synergy with the SCH. The basis for any management decisions starts with the remote sensing data gathered by the UM through its Malta Shipwreck Survey Project.
This article will focus on a single remote sensing tool, namely, side scan sonar (SSS), the go-to choice since the inception of the project. In the second part, we elaborate on the uses and applications of SSS in archaeology, whilst in the third part, we delve into the different techniques and methods employed by the UM team, presenting various methods and their outcomes, as well as the public outreach potential of such tools. Concluding remarks are presented in the final section.
2. The Uses and Applications of Side Scan Sonar in Underwater Archaeology
The main principle behind the UNESCO Convention on the Protection of the Underwater Cultural Heritage is preservation in situ. This stipulates that preserving sites and objects on the seabed is the preferred option before recovery or excavation [7]. In order to manage and preserve sites and objects, their location must first be known, and it is here that the importance of SSS is relevant in underwater archaeology. SSS is a well-known and established method, described as ‘perhaps the best search tool for marine archaeological sites on the seabed’ [8] (p. 103). In essence, SSS utilizes acoustic signals that are sent and received by a transducer to ‘provide details on the composition and structure of the seafloor’ [9]. Transducers are typically mounted on a ‘fish’ that is towed behind a surface vessel. In this configuration, the device is towed underwater and controlled from the surface with elements such as a winch for the towing cable and optic tether, as well as data-treatment computers. However, these can also be integrated into an Automated Underwater Vehicle (AUV), as will be explored in detail below. Utilizing SSS as a technique for the detection of anthropic anomalies can be extremely helpful and efficient whilst being extremely difficult at the same time. The ‘ease’ with which targets can be identified depends on the type of seabed, its geological composition, the distance from the transducers to the object, the height of the sonar off the seabed, and the general topography surrounding the anomalies, where geological formations can obscure potential cultural targets.
Gambin (2014) [10] outlined a number of uses of SSS in archaeology, namely:
- -
- The survey of a known shipwreck: SSS can be used to determine the exact location of a known wreck site. The location of a known shipwreck site is often marked on maritime charts or has been discovered through snagged fishing gear. Such a survey can provide information on the general condition of the wreck, beginning with a baseline survey that can be used for comparative purposes with subsequent surveys [10].
- -
- The search and location of an important event: SSS is an ideal tool for the location of events such as naval battles, as it is able to record small objects, such as bronze rams from ancient war galleys or cannons from the Early Modern period [10].
- -
- The search and location of an important shipwreck: Vessels that have been lost at sea are often recorded by survivors, insurance companies, or by nation-states themselves in the case of war vessels. These records provide ideal starting points, and while they rarely provide exact coordinates, a general search area can be inferred [10].
- -
- Broad or blind survey: These surveys are the equivalent of the field-walking techniques utilized in land-based archaeology. Data are gathered systematically along pre-determined survey lines, resulting in the creation of a geo-referenced map of the seabed that reveals any potential cultural targets or anomalies for future research.
The major advantages of SSS are the depth considerations. Traditional diver surveys can be carried out to at ±30 m in the case of an open-circuit configuration and at up to ±70 m for closed-circuit divers [11]. These depth limits are very much based on safety, and whilst deeper dives are indeed possible, the short bottom time that a diver has at any depth below 80 m makes diving unfeasible for broad and large-scale underwater surveys. Diver surveys are suitable for shallow waters in topographically complex environments where deploying SSS would be too intricate. The area of seabed surveyed is another benefit, as SSS is able to survey large swathes that cover kilometers in the same amount of time that it would take divers to survey a few hundred meters. In addition, using surface-operated tools eliminates risk factors that are prevalent with diver-led surveys, such as decompression accidents or any other kinds of dive-related accidents.
3. Remote Sensing with the University of Malta
Initially, the UM team deployed a towed SSS system, but in recent years, it has been running its surveys with an AUV. Both systems and their parameters are presented below.
3.1. Towed
The towed systems used were both dual frequency: a Klein System 3900 (445/900 kHz) and an Edgetech 4125 (400/900 KHz). Both systems were deployed from various vessels of opportunity. In order to operate, a DT marine winch was mounted with 500 m of armored coaxial cable. The vessel towed the side scan at an average speed of 3.5 knots. For the bulk of the survey work, the 445/400 kHz frequencies were used for the Klein and Edgetech systems, respectively. The range was set to 100 m with the line spacing set at 180 m, providing enough overlap to cover any course deviations by the vessel. For areas where accurate bathymetric data were available, the towfish was ‘flown’ at between 10 and 12 m above the seabed. In areas where bathymetric data were not available, the height above the seabed would be maintained at no less than 15 m. Cable control was managed by the sonar operator, and the length of cable out was measured through a cable block and counter that fed data into the topside processing system. The depth sounder on the vessel would display changes in topography, acting as a ‘forward-warning system’ for the sonar operators. This standardized approach facilitated the coverage of large tracts of seabed, albeit with missing areas in the nadir.
3.2. AUV
An AUV is an unmanned robot used as a marine survey platform. For navigation purposes, it integrates a Global Positioning System (GPS), navigation systems, and propulsion and direction modules, which are all built into the vehicle. This is what enables the AUV to execute planned missions whilst avoiding potential risks and obstacles. A forward-looking sonar and a collision avoidance sonar ensure that the robot does not collide with submerged obstructions. These allow the AUV to perform planned missions and to modify certain parameters when necessary, thus avoiding collisions and regaining relative height above the seabed. If the obstacle avoidance is activated, the AUV is still capable of returning to its original survey mission.
The UM Teledyne Gavia AUV carries an Edgetech dual-frequency SSS. This is the main documentation tool utilized throughout surveys. With this technique, geo-referenced 2D imagery of the seabed is obtained. Moreover, targets and features from within the software can be measured accurately. The second payload integrated into the AUV is a Blueview MB-2250 multibeam unit. This system is mounted in order to capture data to fill in the gap created by the nadir of the SSS. The various capabilities of the UM’s SSS systems are specified in Table 1, Table 2 and Table 3. Table 1 presents the capabilities of the sonar system used by the UM, whilst Table 2 highlights the main features of the Teledyne Gavia AUV, and Table 3 offers an insight into the multibeam features of the AUV.
3.3. The University of Malta’s AUV-Based Methodology
The methodology utilized by the UM team is characterized by a consecutive sequence of activities, the trajectory of which is outlined below.
- Desk-based research:
Research into any previous work carried out in the area is conducted. Documentary and cartographic sources are consulted in order to obtain any previous data on elements such as known hazards—either geological or anthropic.
- 2.
- Planning campaigns and missions:
A campaign is the total area to be surveyed, which, in turn, determines the number of daily survey blocks needed to complete the entire area. In general, each survey block is covered by one mission, which consists of the AUV descending, covering the planned lines, and returning to the surface. Consideration must also be given to the distance from the port and the length of the mission. The latter does not just depend on the surface area of the seabed to be covered, but also depth. If a block has excessively drastic topography variations, it may have to be sub-divided into smaller missions, thus increasing the time duration of the survey (Figure 2). An example of the mission parameters is presented in Table 4.
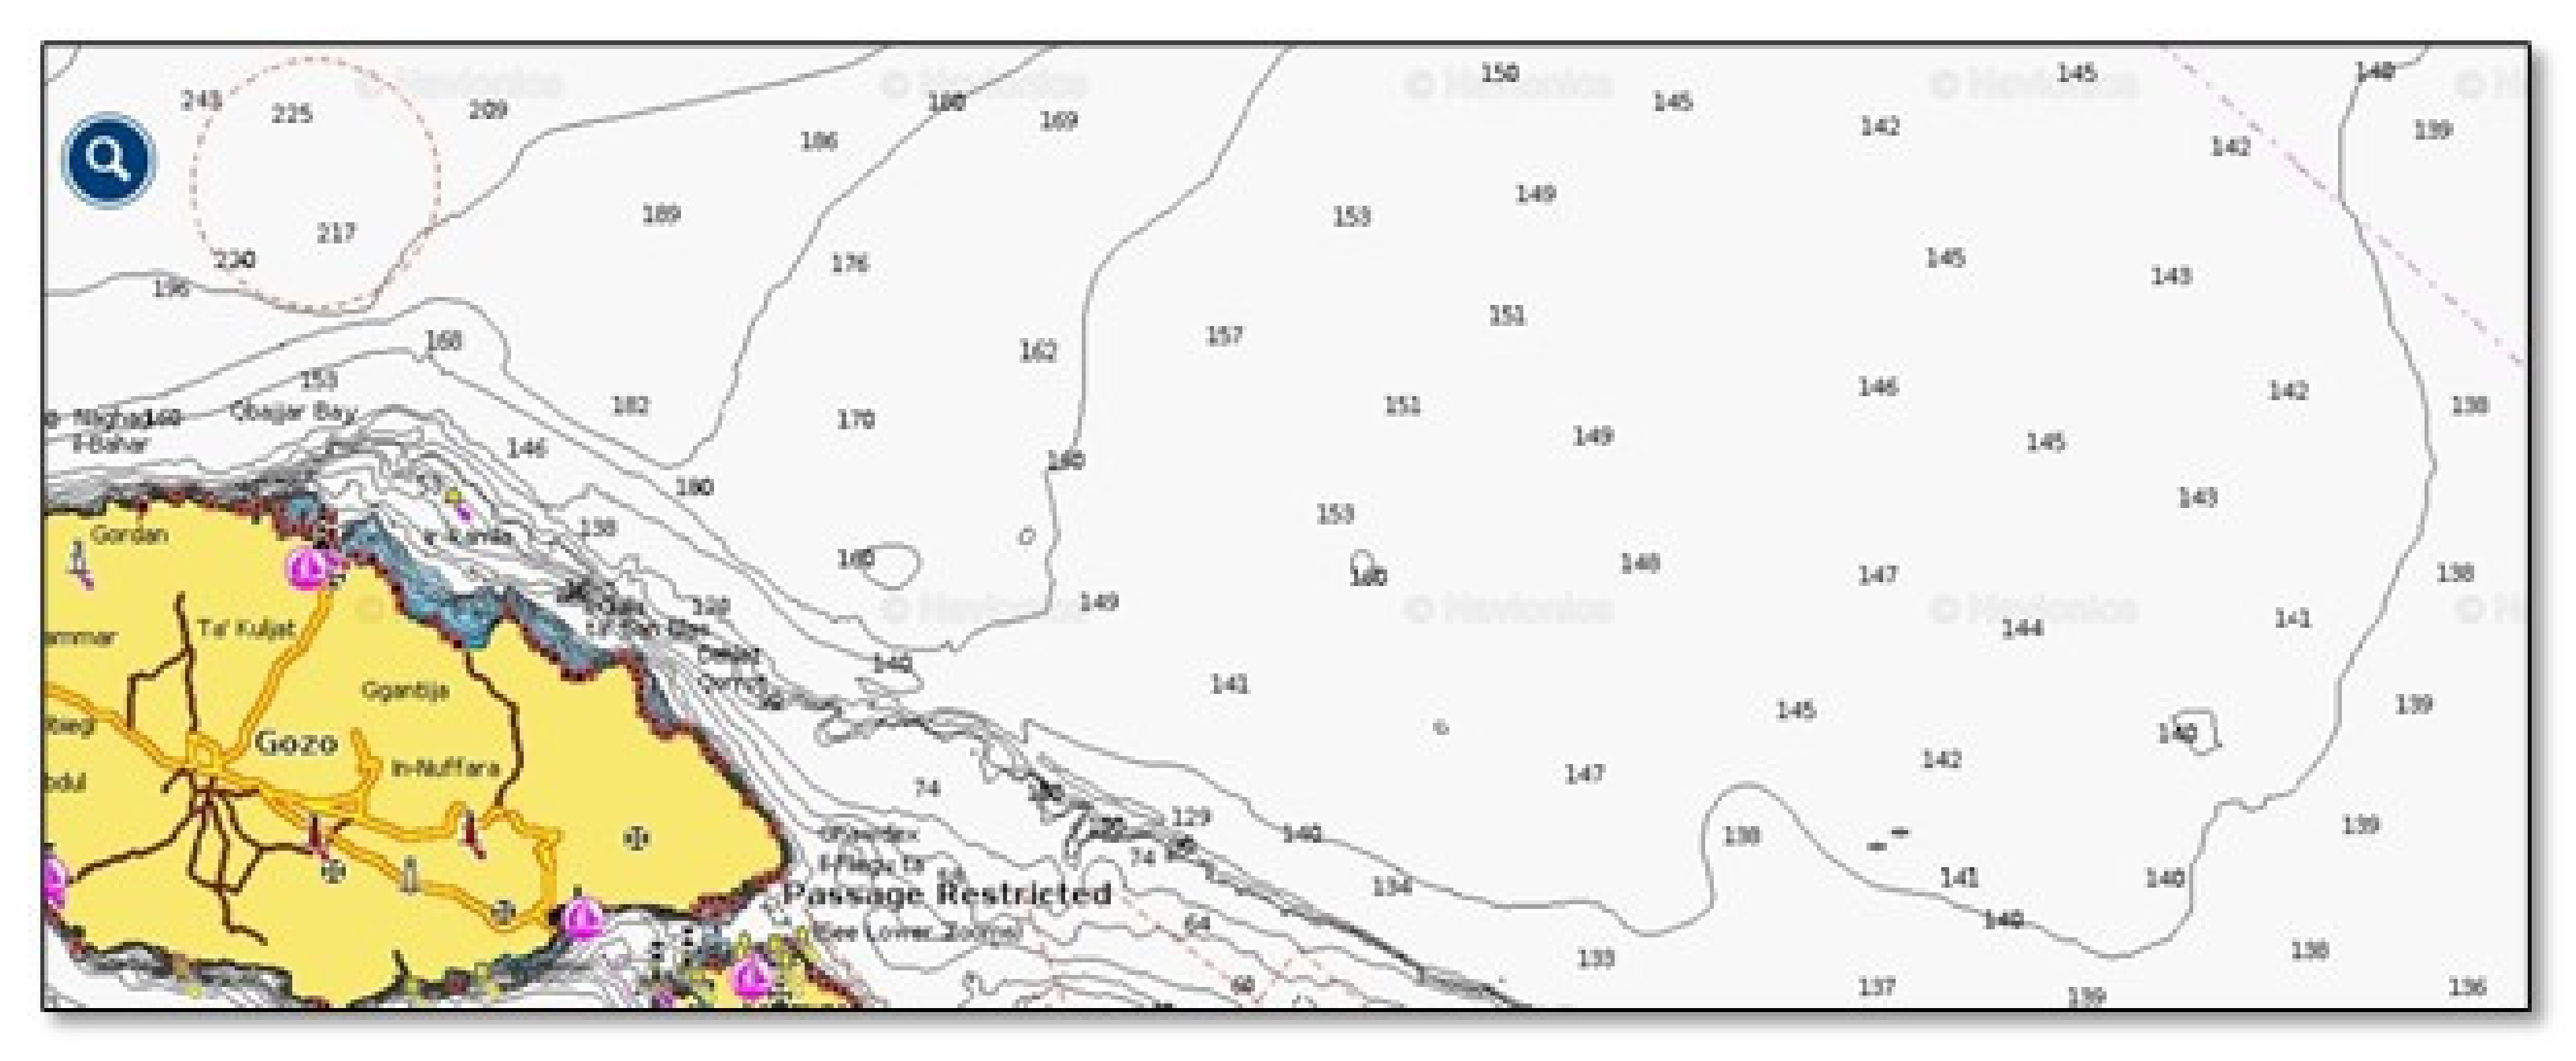
Survey planning in regular areas is relatively straightforward. It is first important to establish what is meant by ‘regular’. Figure 3 shows an area of seabed that is relatively flat with no radical changes in topography or geological formations, such as cliffs or significantly high rocky outcrops. Mission plans for such areas focus mainly on depth, coverage required, maritime traffic in the area, and fishing practices in the area. One of the advantages of surveying regular underwater topographies is that the sonar can be ‘flown’ closer to the seabed when compared to missions in areas with very irregular topography.
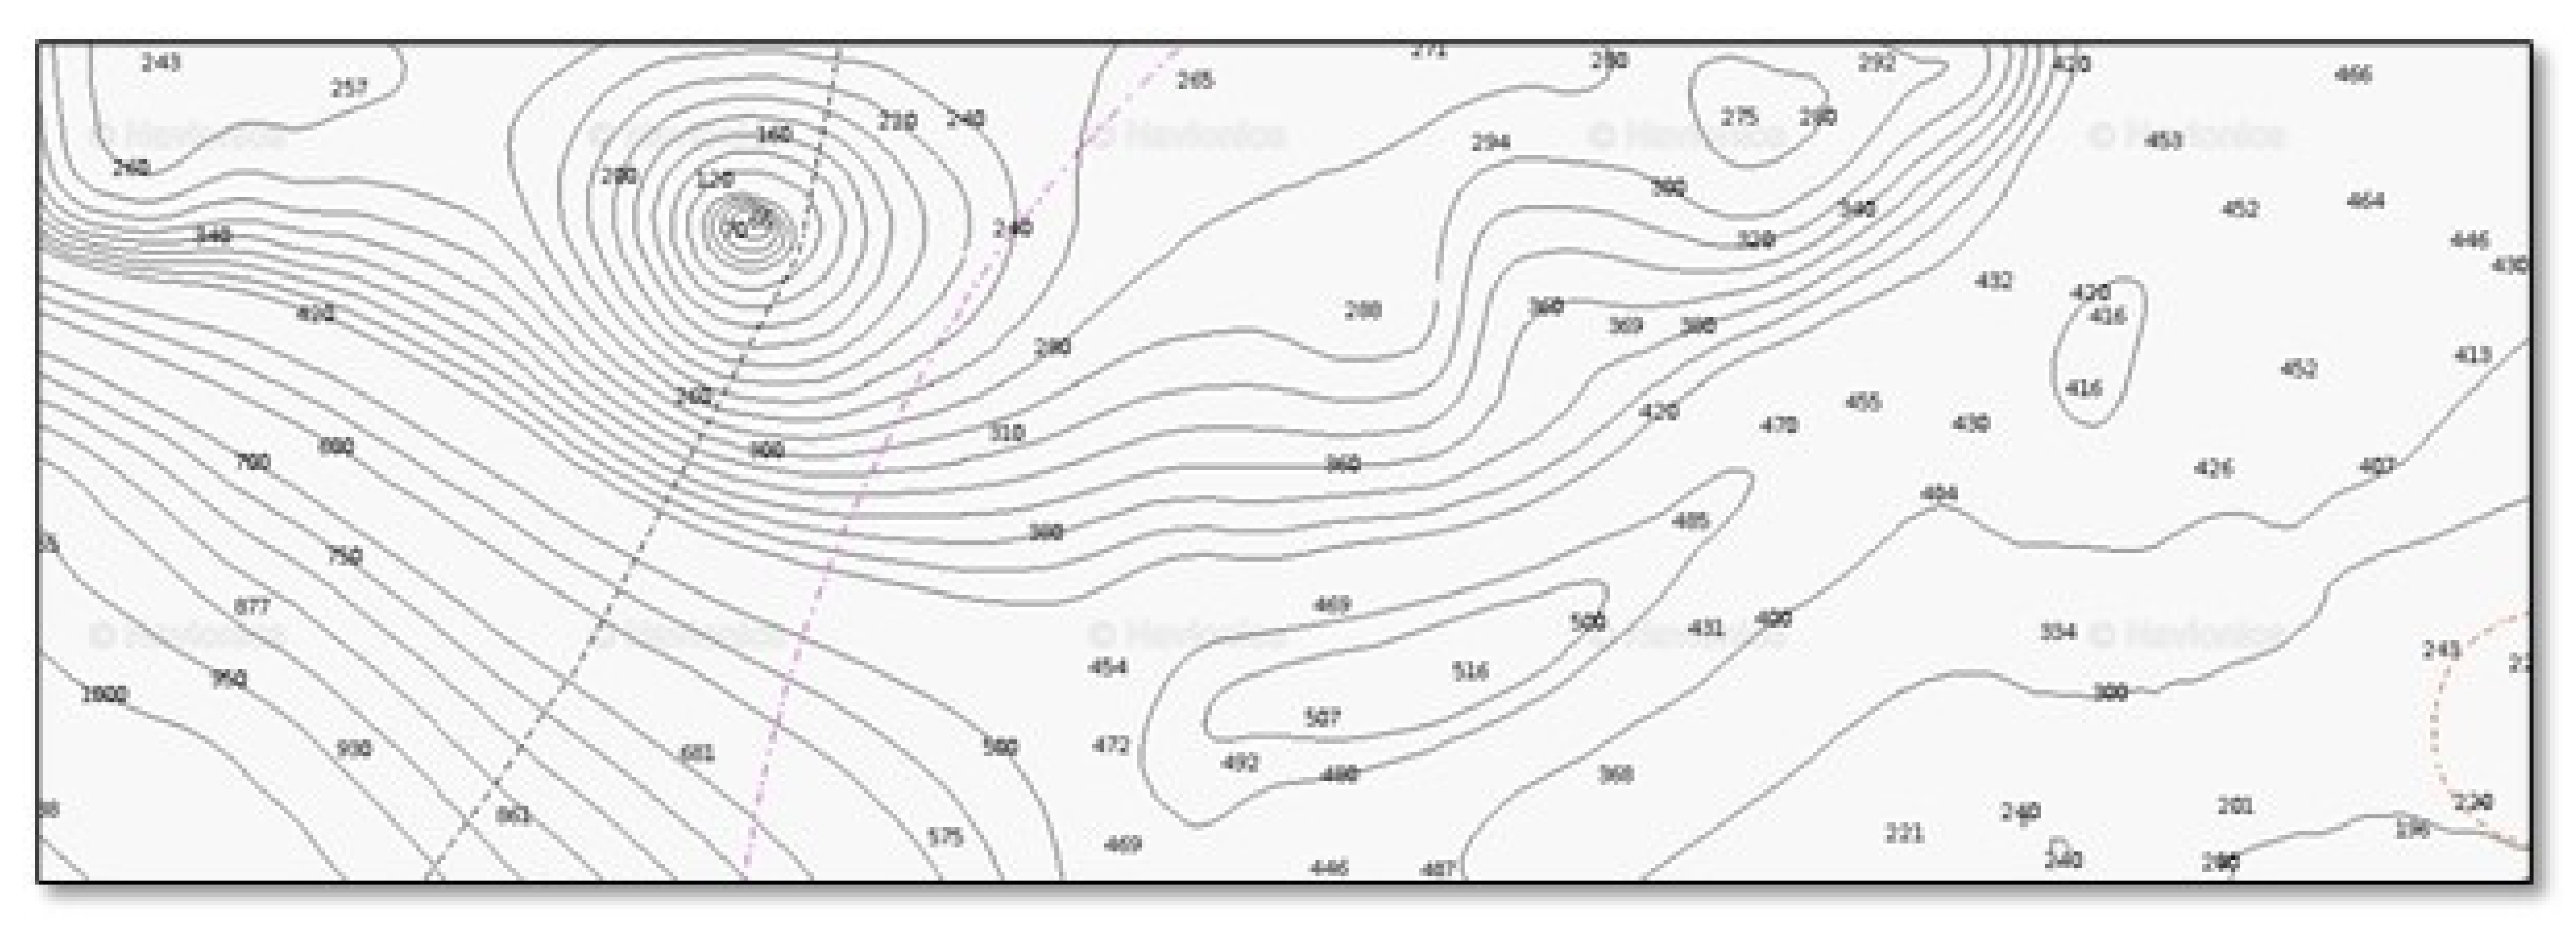
For complex areas in which the topography presents sudden and significant changes in depth, mission planning has to be more precise (Figure 4 and Figure 5). It is imperative that mission plans include the avoidance of natural hazards and that they approach angles of subsea cliffs, other elevations, and banks. This is essential in order to protect the equipment being used and to maximize the quality of data being gathered.
4. Fieldwork
Once out at sea, a series of steps are executed, which are listed below:
- -
- Calibration of the vehicle’s systems.
- -
- Surface verification of potential hazards.
- -
- Deployment.
- -
- Final surface calibration and checking of all systems.
- -
- Execution of mission.
- -
- Tracking and surveying the mission progress. This involves the constant monitoring of the surface conditions, such as avoiding the approach of any vessels into the AUV’s survey area in the case of eventual surfacing.
- -
- Recovering the AUV once the mission is completed.
5. Data Processing
Following the AUV’s recovery, all data are recovered either through the LAN cable (if data are being retrieved in the lab) or via Wi-Fi (if data are being recovered out at sea). Data are subsequently imported into Cheasepeake’s SonarWiz for processing and analysis. Once imported, a series of ‘tweaks’ are performed—generally, the correction of the gain and adjustment of the bottom track. The side scan data are digitized and inspected on a line-byline basis, and the data are analyzed and checked systematically for any potential anomalies (Figure 6). Target identification is very subjective and may vary from one individual to another. To try to reduce redundancy, datasets are, where possible, checked separately by at least two individuals. The results from these checks are then compared, and a definitive target list is created. Detailed annotations are prepared as part of the target identification process. In addition to standard information, such as GPS data, file name, depth, and images, the details added by the operator include:
- (1)
- length;
- (2)
- width;
- (3)
- height off of the seabed;
- (4)
- a general description of what the target may be.
Some anomalies, such as intact aircraft and modern shipwrecks, are immediately recognizable, whilst others are less so. However, there will be anomalies that are less obvious, yet still with the potential of being cultural targets. Where possible, information related to a particular target is cross-referenced with documentary sources, which, in turn, may help identify the exact vessel or aircraft. With aircraft and ships, common sources are checked, such as generic internet searches, newspaper reports, reports of wrecking events, and other wartime sources.
6. Second Dive at Targeted Sites
Once the data have been analyzed, a decision is made as to whether a second dive with the AUV is required. The aim of a second dive is to gather higher-resolution side scan data on specific targets using 1600 kHz and, occasionally, a small-point-of-view (POV) camera is attached in order to supply additional video footage (Figure 7). This footage can provide a conclusive answer as to whether geological or anthropic elements are present on the seabed.
In order to document a specific target, the survey lines are planned to correspond to alignments of the spread or longitudinal axis of the target that are believed to provide the best possible imagery. The number of passes depends on the size of the target, but the aim is to acquire data from either side of the target. The AUV is flown at a lower level over the seabed, resulting in higher-resolution data, and the survey lines are closer to each other, ensuring that as much area as possible is covered and gaps in the data are filled (Figure 8).
7. Diver Surveys
Once the verifications with high-resolution sonar are conducted, a definitive target list is compiled. On the basis of variables such as the depth, size of the site, budget, and availability of equipment, decisions are made as to the next steps to be taken. For small sites that are at a depth of 120 m or shallower, the final documentation is generally performed by technical divers. Since 2015, the UM team has been developing a low-cost 3D modeling process based on Structure-from-Motion (SfM) photogrammetry. Initially, 4k video footage was used, but today, full-frame mirrorless cameras that generate 24-megapixel still images are preferred [9]. The cameras are coupled with powerful underwater lights. In the main, an automatic intervalometer is used. More recently, a diver propulsion vehicle (DPV) was adapted for data-capturing purposes—in particular, for large and more complex wreck sites (Figure 9). To date, the UM has also recorded large-scale shipwrecks up to a maximum depth of 80 m. The main challenge with large-scale shipwrecks at great depths is the limited bottom time for which divers can work on the site. For an in-depth insight into the methodology behind these diver surveys, the reader is referred to Gambin et al. (2021) [9].
Photographs, which are often supplemented by video footage, are used to create detailed and scaled 3D models (Figure 10). Depending on the size and complexity of the wreck and the visibility considerations, many hundreds—if not thousands—of photographs are required. These 3D models act as baselines from which the condition of wreck sites can be monitored, thus creating a dataset that allows for comparisons with future site inspections [9]. The total preservation of sites such as metal shipwrecks is not possible owing to the corrosion of metal and the eventual collapse and disappearance of the site. Therefore, these diver surveys and baseline models are vital for the digital preservation of a site. Apart from the scientific and research considerations, these models are also important public outreach tools. Sites that are discovered beyond 120 m are surveyed and recorded using a remote-operated vehicle (ROV). The UM team is currently experimenting with externally mounted cameras and lights so as to obtain 3D models of deep sites using an ROV.
8. Returning the Findings to the Public
The documentation of the entirety of Malta’s seabed has the final aim of not only recording and protecting any discovered sites or objects, but also ultimately bringing these unique cultural resources to the surface. This is achieved through 3D models that are created and dispersed through a number of different media platforms. The primary platform is the virtual museum Underwater Malta, a digital repository of Malta’s underwater cultural heritage. The virtual museum currently presents 17 underwater sites with 3D models, VR, videos, photos, and informative text panels, which are all aimed at providing an entertaining and educational experience to the public (Figure 11). For a detailed understanding of the conception and workflow of the virtual museum, the reader is referred to Gambin et al. (2021) [9].
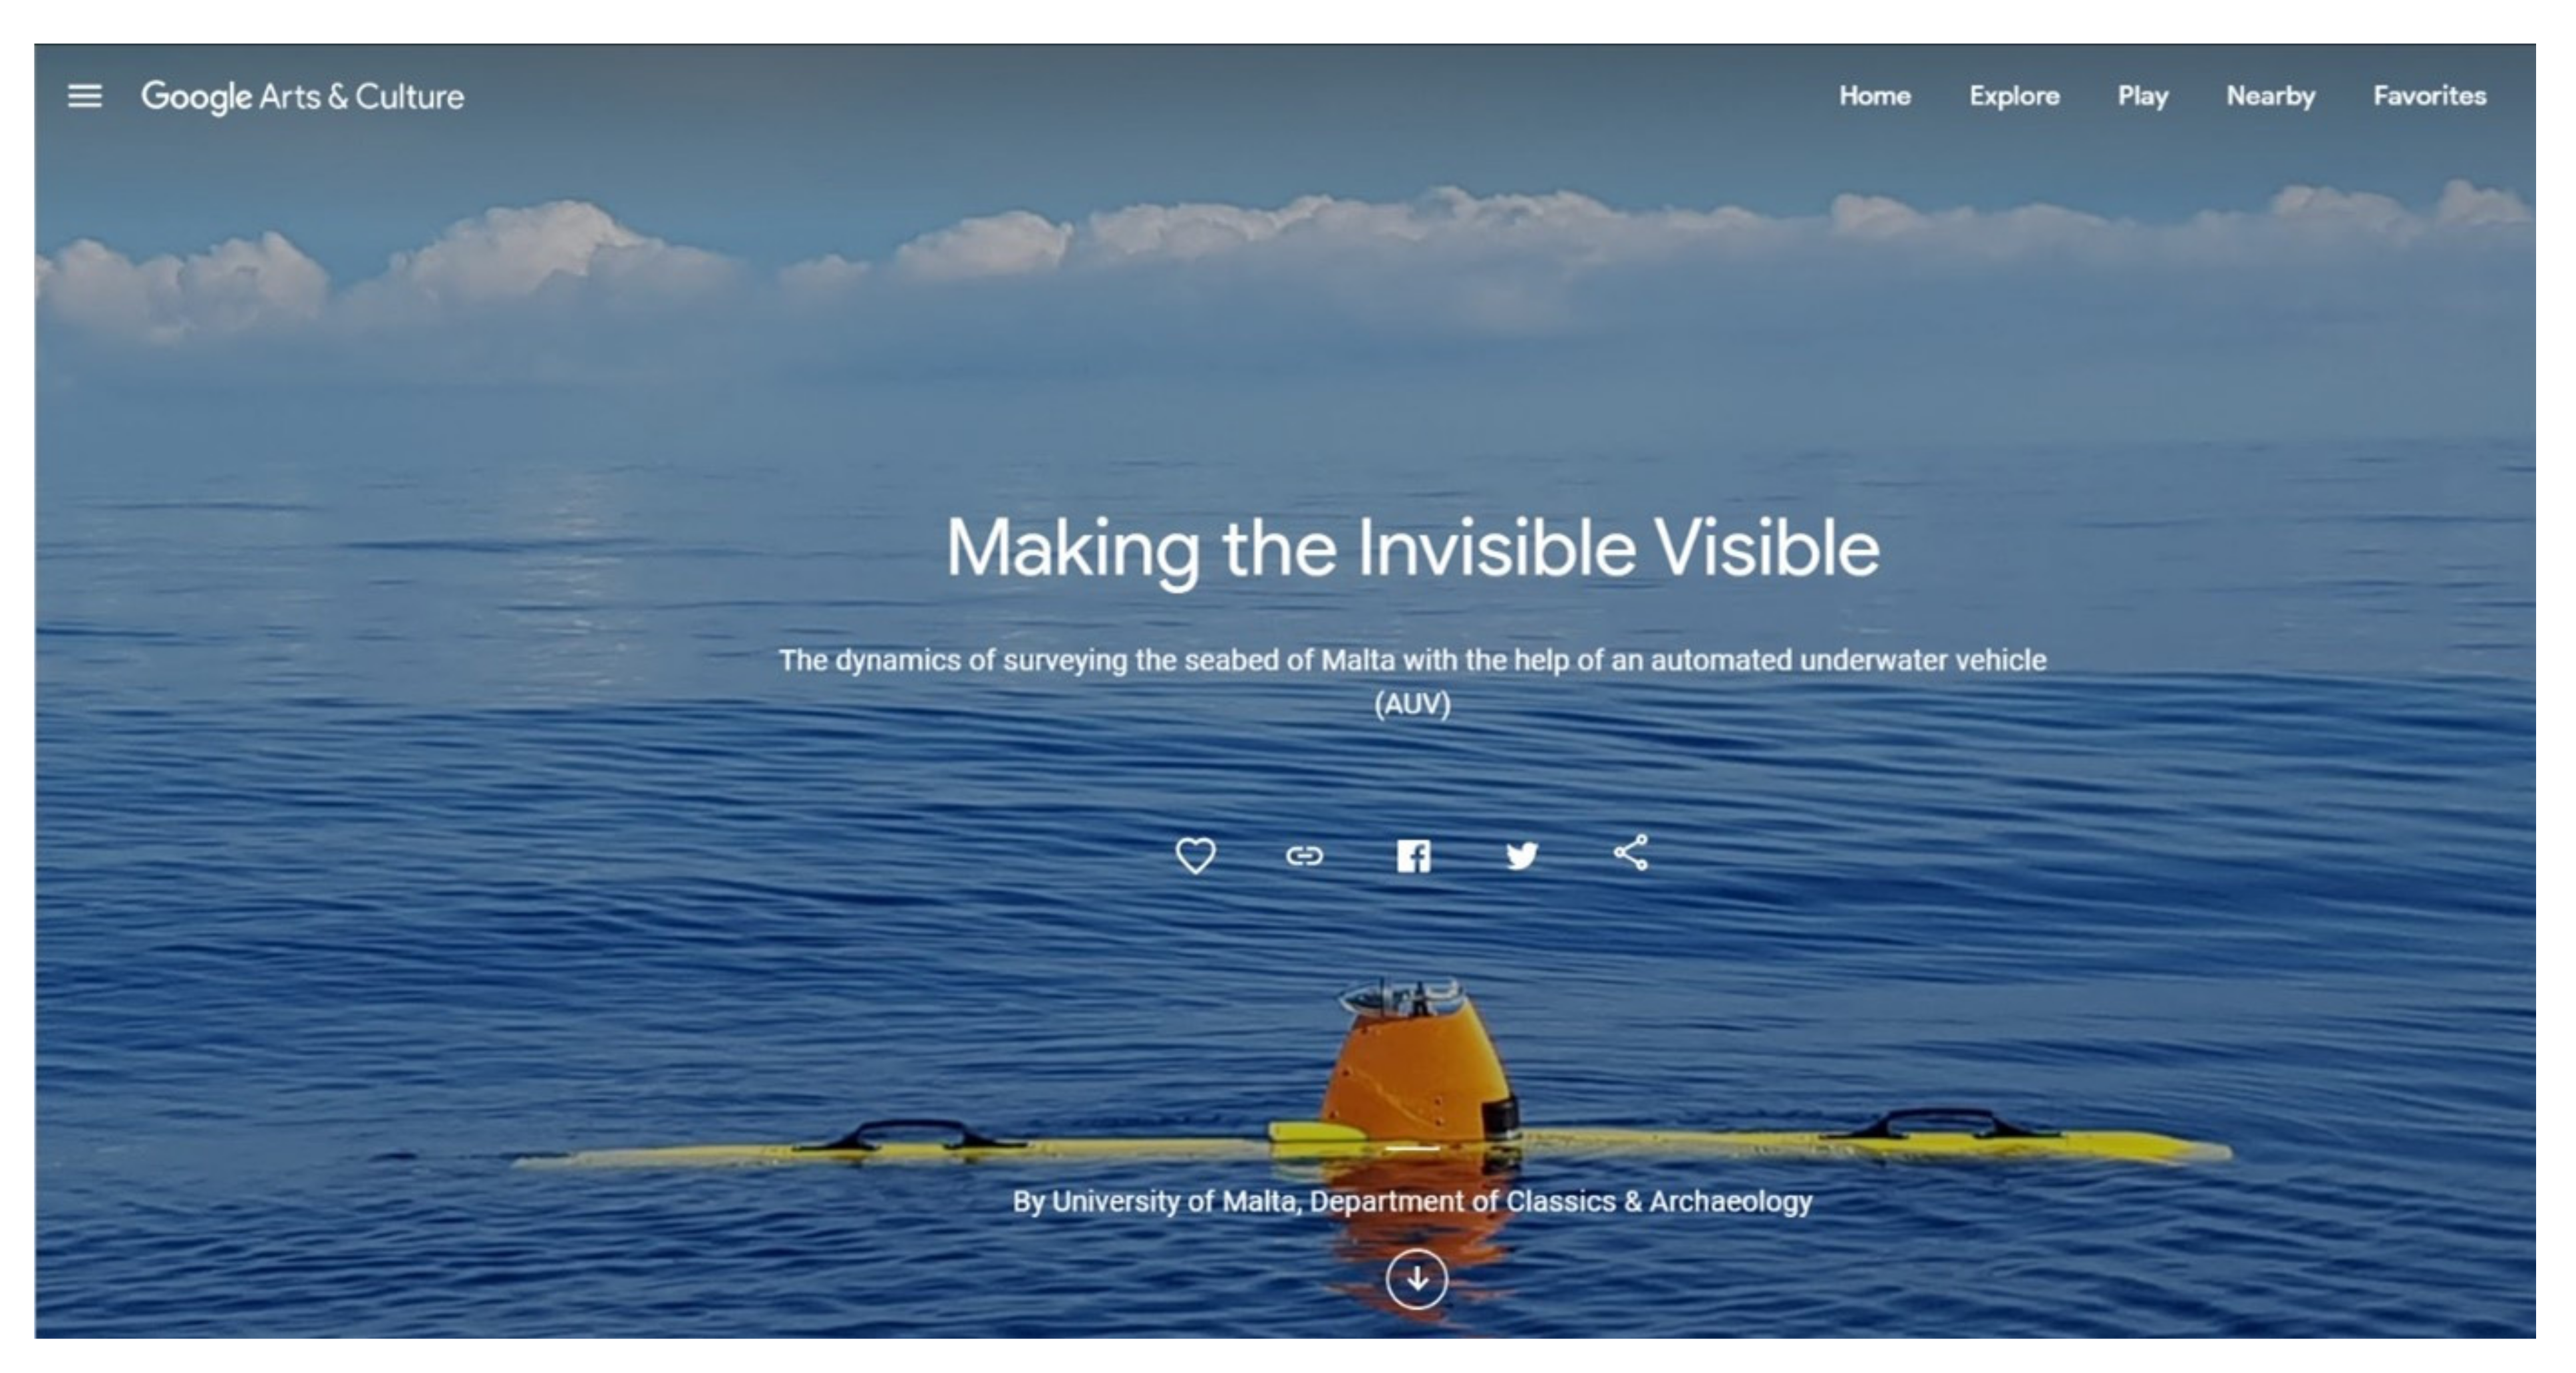
Another online platform that is used to share these sites is Google Arts and Culture. This open platform is intended to host museums and cultural organizations from around the world, allowing them to share parts of their work through a ‘story line’, in which they share particular concepts, exhibitions, events, and more in a simple and effective manner. As part of an agreement with Google, the UM has a page dedicated to ‘stories’ on various topics, including the Phoenician Shipwreck Project, AUV surveys, technical diving, and the work behind the documentation of deep-water sites. Relevant here is the ‘story’, which shows the public exactly how sites are discovered, beginning with the mission-planning stage, the execution of the mission, the analysis of data, and the discovery of potential sites, and ending with how diver or ROV surveys were carried out, and the results are shared with the public (Figure 12).
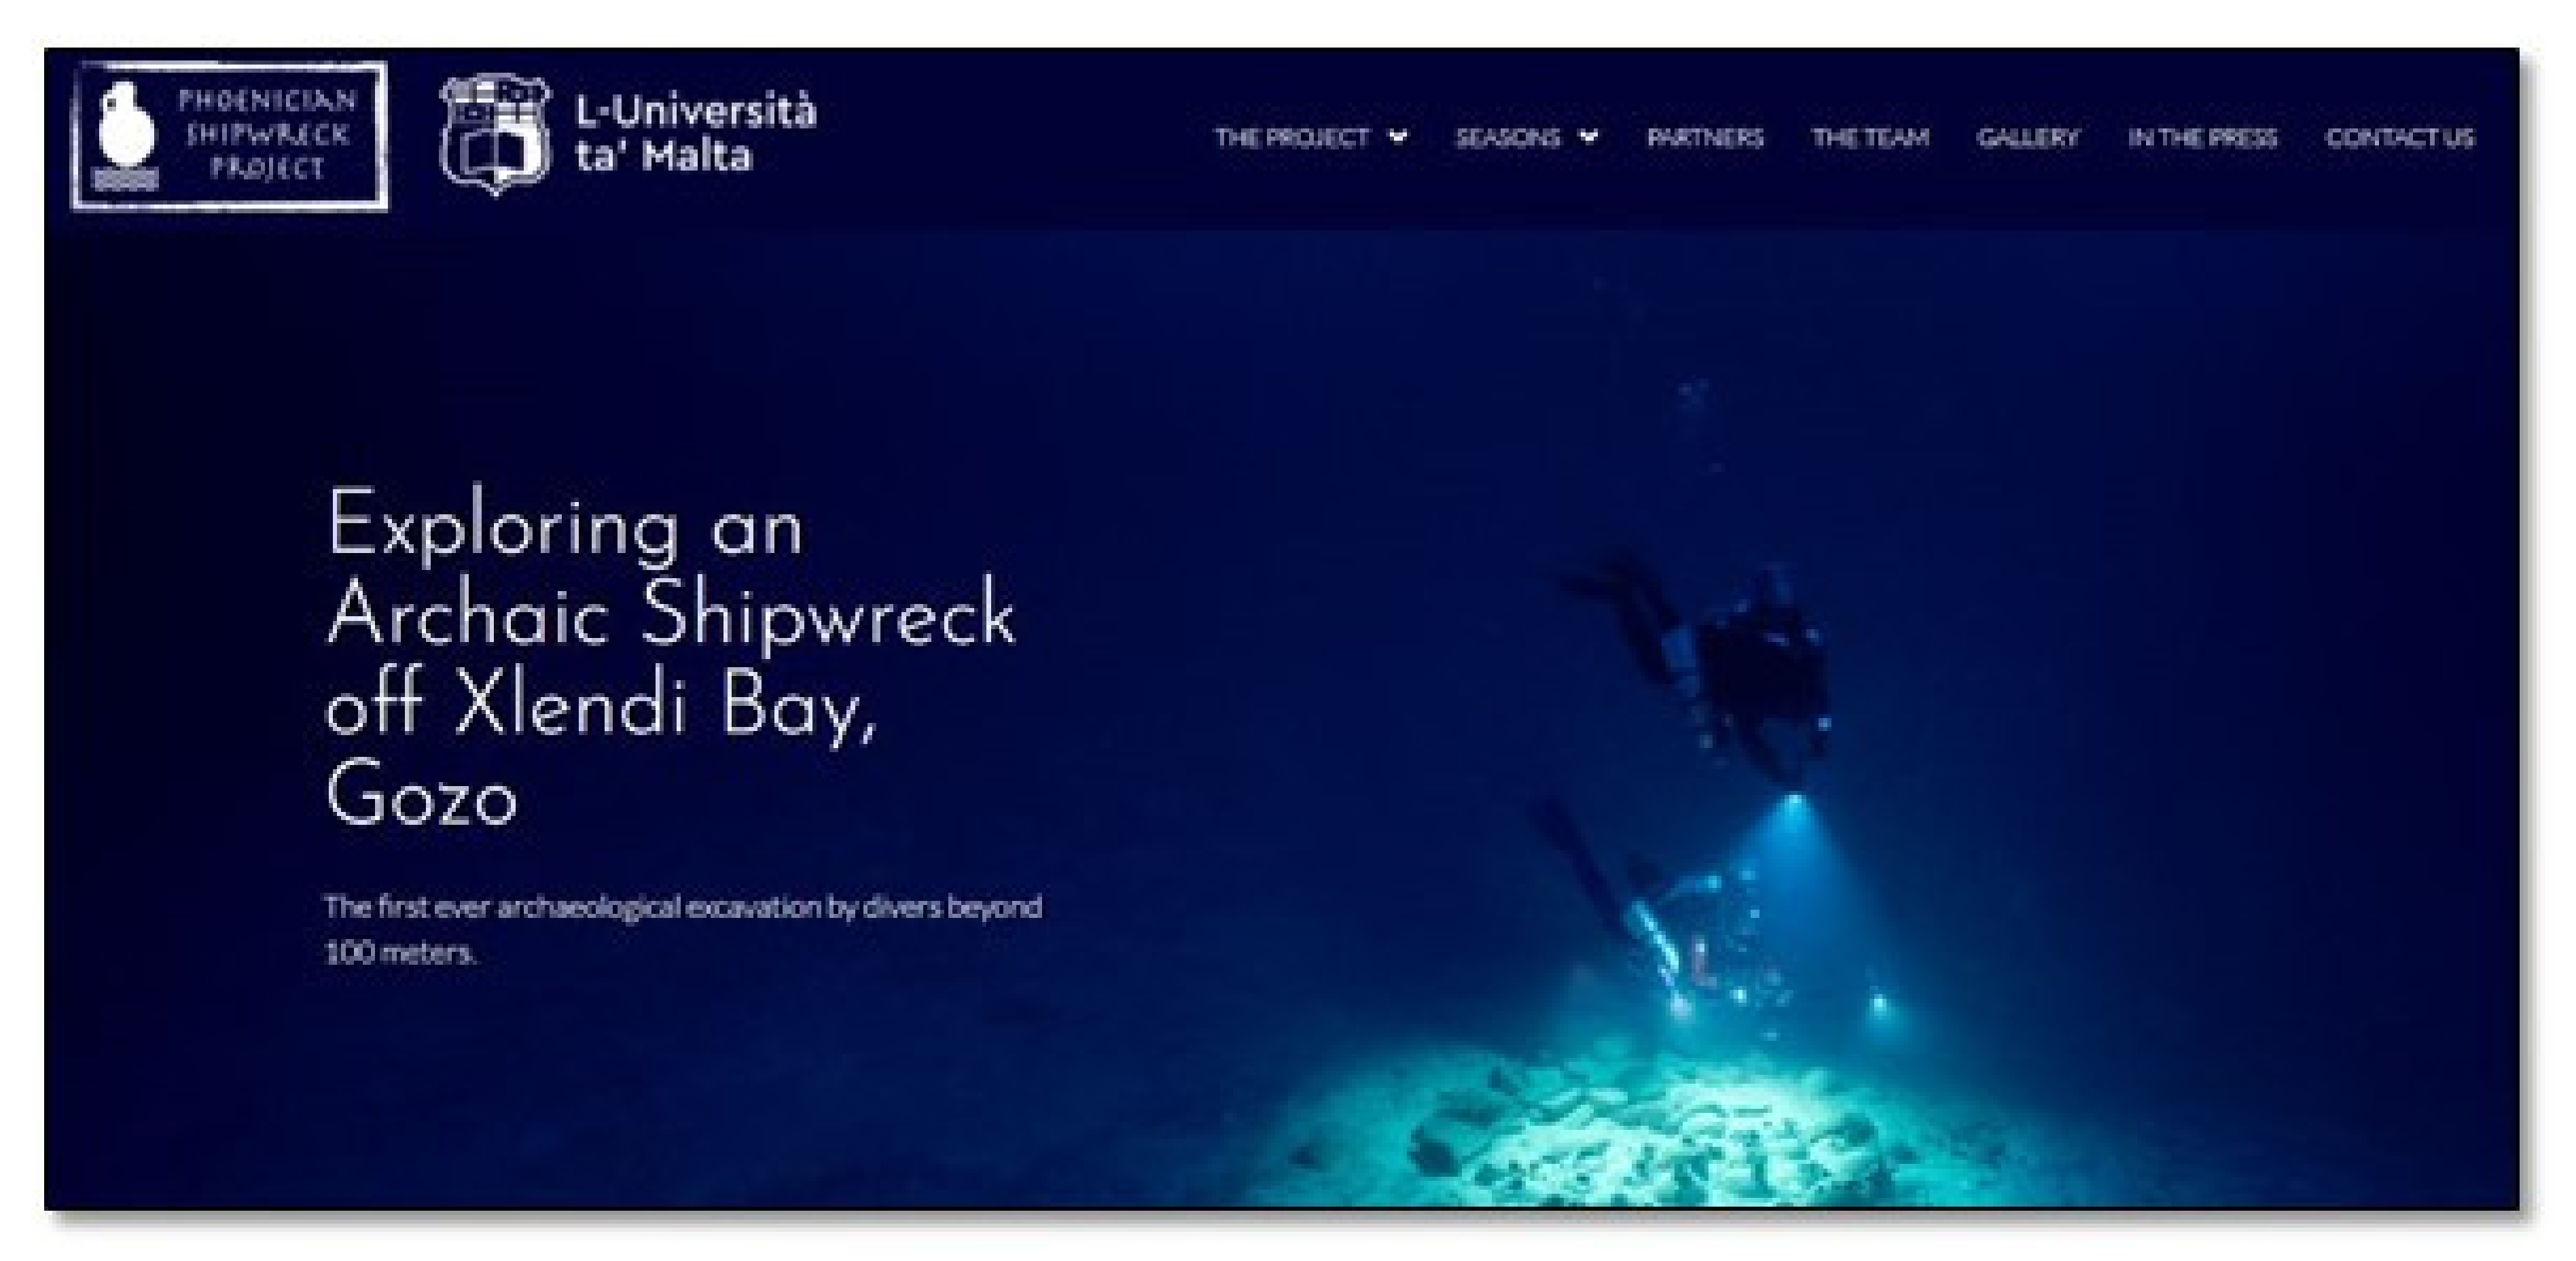
The UM team also utilizes tools such as the internet to share information on particular projects. One such initiative is the Phoenician Shipwreck Project, where a website dedicated exclusively to this project was launched (Figure 13). Here, the public can discover how the site was discovered and what objects have been recovered, and they can follow the yearly progression of the excavation. The website is updated after each annual project campaign. Such platforms allow the wider public to virtually dive into history and are public outreach tools that guarantee a wide reach and provide an insightful and entertaining means through which sites that would normally be out of sight and out mind can be explored.
9. Conclusions
This article presented the process through which the UM team maps and evaluates UCH sites in Malta, tracing each step from discovery to public consumption. The synergy between remote sensing and the management of underwater sites was presented through a presentation of how large-scale remote sensing projects, such as the UM project of mapping the entire territorial seabed of Malta, can make major contributions to site management, which, in turn, facilitates the decision-making process in terms of how and what information is transmitted to divers and the members of the public. The article traced the importance of remote sensing and, in particular, SSS as a large-scale mapping tool. This was exemplified through the ongoing UM project and the different techniques employed. These vary from the initial towed configuration to the present-day integrated AUV systems. The possibilities associated with the use of AUVs are linked to the ability of the vehicles to survey large swathes of seabed in a relatively small amount of time. Whilst the operation of an AUV mission can be relatively straightforward, elements such as the avoidance of collisions and entanglements with fishing gear present high-risk factors and need to be planned for. AUV services can also be marketed for offshore survey purposes in order to provide additional income whilst simultaneously aiding in the continuation of a large-scale mapping project.
The results generated from this remote sensing exercise are hugely important. From an archaeological perspective, these are significant due to their contribution to the overall story of Malta’s human history. From a natural perspective, the data gathered are valuable to marine scientists, with wreck sites acting as artificial reefs that attract a variety of marine flora and fauna. Underwater geological features are mapped as effectively as cultural objects and sites, presenting opportunities for interdisciplinary exchanges. In terms of the management of cultural heritage, these results form the basis of decision-making processes that determine which sites are to be protected and which sites can be accessed by the public. In order for sites to be opened to the public, they are declared as Zones of Archaeological Importance, and the approximate position of the implemented buffer zone is published on Malta’s Government Gazette. Once published, the local hydrographic authorities are notified, and navigational charts are updated accordingly. The majority of sites are not openly declared as Zones of Archaeological Importance for the simple reason that there are too many underwater sites. Publishing all sites would create management and protection issues that are unwarranted. Heritage authorities are working towards the creation of a geo-referenced database for UCH with various levels of access. Full access will be granted to heritage managers, whereas other entities will have managed access when required. Furthermore, the database will be available via the internet, albeit with a limited number of UCH sites included.
However, the ultimate aim of understanding just how many and what types of cultural remains are found on Malta’s seabed is insignificant without being able to share these results with the wider public.
Author Contributions
Conceptualization, T.G. and A.B.-M.R.; methodology, T.G. and A.B.-M.R.; formal analysis, A.B.-M.R.; investigation, T.G., A.B.-M.R. and M.S.; resources, T.G.; data curation, A.B.-M.R. and M.S.; writing—original draft preparation, A.B.-M.R. and M.S.; writing—review and editing, A.B.-M.R., M.S. and T.G.; visualization, T.G. and A.B.-M.R.; supervision, T.G.; project administration, A.B.-M.R. All authors have read and agreed to the published version of the manuscript.
Funding
Funding for the Automated Underwater Vehicle was obtained through the University of Malta and the SIntegraM Project.
Institutional Review Board Statement
Not applicable.
Informed Consent Statement
Not applicable.
Data Availability Statement
Data sharing is not applicable.
Acknowledgments
The authors would like to thank the University of Malta’s Maritime Archaeology Program, as well as the divers and the technical and support teams that participate in various capacities.
Conflicts of Interest
The authors declare no conflict of interest.
References
- Campbell, J.B. Introduction to Remote Sensing; Guilford Press: New York, NY, USA, 2002; p. 4. [Google Scholar]
- USGS. What Is Remote Sensing and What Is It Used For? Available online: https://www.usgs.gov/faqs/what-remote-sensing-and-what-it-used?qt-news_science_products=0#qt-news_science_products (accessed on 21 July 2021).
- Kapetanović, N.; Vasilijević, A.; Nađ, Đ.; Zubčić, K.; Mišković, N. Marine Robots Mapping the Present and the Past: Unraveling the Secrets of the Deep. Remote Sens. 2020, 12, 3902. [Google Scholar] [CrossRef]
- Quinn, R. Acoustic Remote Sensing in Maritime Archaeology. In The Oxford Handbook of Maritime Archaeology; Oxford University Press: New York, NY, USA, 2013; pp. 68–89. [Google Scholar]
- The Malta Shipwreck Survey Project. Available online: https://www.um.edu.mt/arts/classics-archaeo/ourresearch/themaltashipwrecksurveyproject (accessed on 21 July 2021).
- Bowens, A. (Ed.) Underwater Archaeology: The NAS Guide to Principles and Practice; Blackwell Publishing: Chichester, UK, 2009. [Google Scholar]
- UNESCO. Convention on the Protection of the Underwater Cultural Heritage; HeinOnline: Pairs, France, 2001. [Google Scholar]
- Søreide, F. Ships from the Depths: Deepwater Archaeology; Texas A&M University Press: College Station, TX, USA, 2011. [Google Scholar]
- Gambin, T.; Hyttinen, K.; Sausmekat, M.; Wood, J. Making the Invisible Visible: Underwater Malta—A Virtual Museum for Submerged Cultural Heritage. Remote Sens. 2021, 13, 1558. [Google Scholar] [CrossRef]
- Gambin, T. Side Scan Sonar and the Management of Underwater Cultural Heritage. In Future Preparedness: Thematic and Spatial Issues for the Environment and Sustainability; University of Malta: Msida, Malta, 2014; pp. 259–270. ISBN 9789995783464. [Google Scholar]
- Norro, A. The Closed-Circuit Rebreather (CCR): Is It the Safest Device for Deep Scientific Diving? Underw. Technol. 2016, 34, 31–38. [Google Scholar] [CrossRef]
Figure 1.
Map presenting Malta and its territorial waters, which are marked in green. © https://continentalshelf.gov.mt/en/Pages/The-Department.aspx (accessed on 19 July 2021).
Figure 1.
Map presenting Malta and its territorial waters, which are marked in green. © https://continentalshelf.gov.mt/en/Pages/The-Department.aspx (accessed on 19 July 2021).

Figure 2.
Example of a planned mission, including the survey lines, as well as the start and end points from which the AUV will descend and ascend. Chart data indicate the presence of a known wreck.
Figure 2.
Example of a planned mission, including the survey lines, as well as the start and end points from which the AUV will descend and ascend. Chart data indicate the presence of a known wreck.
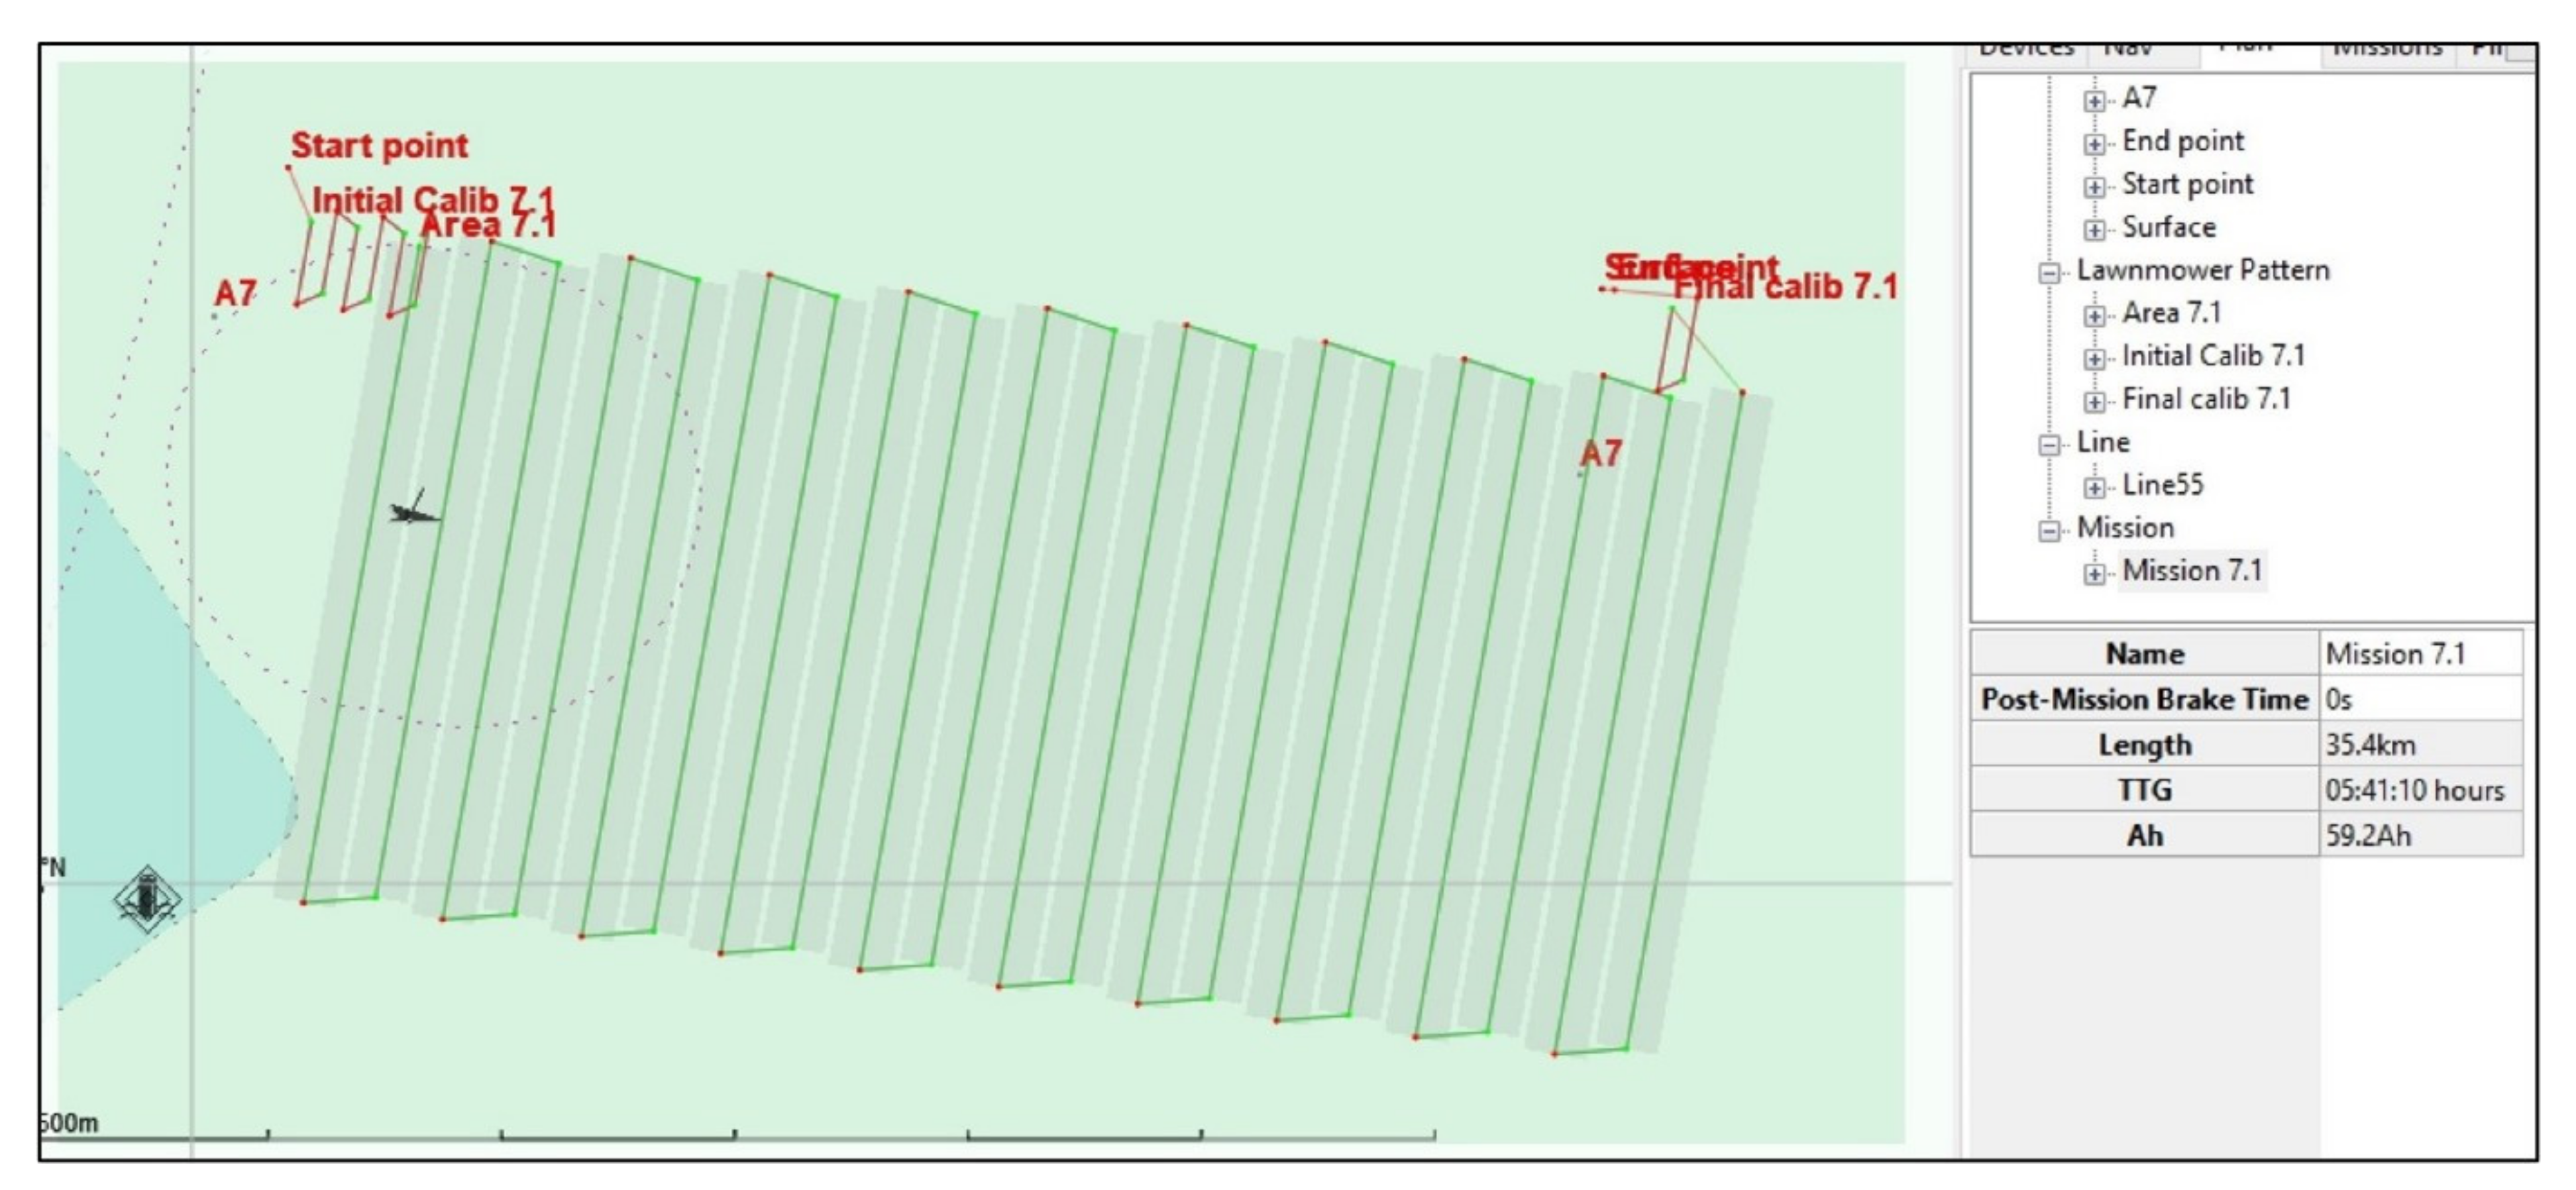
Figure 3.
Regular and flat seabed off the coast of Gozo. © www.navionics.com (accessed on 15 July 2021).
Figure 3.
Regular and flat seabed off the coast of Gozo. © www.navionics.com (accessed on 15 July 2021).

Figure 4.
Complex seabed topography. © www.navionics.com (accessed on 15 July 2021).
Figure 4.
Complex seabed topography. © www.navionics.com (accessed on 15 July 2021).

Figure 5.
Sudden topographic changes in the seabed and changes in depth off the northeastern coast of Malta. © www.navionics.com (accessed on 15 July 2021).
Figure 5.
Sudden topographic changes in the seabed and changes in depth off the northeastern coast of Malta. © www.navionics.com (accessed on 15 July 2021).
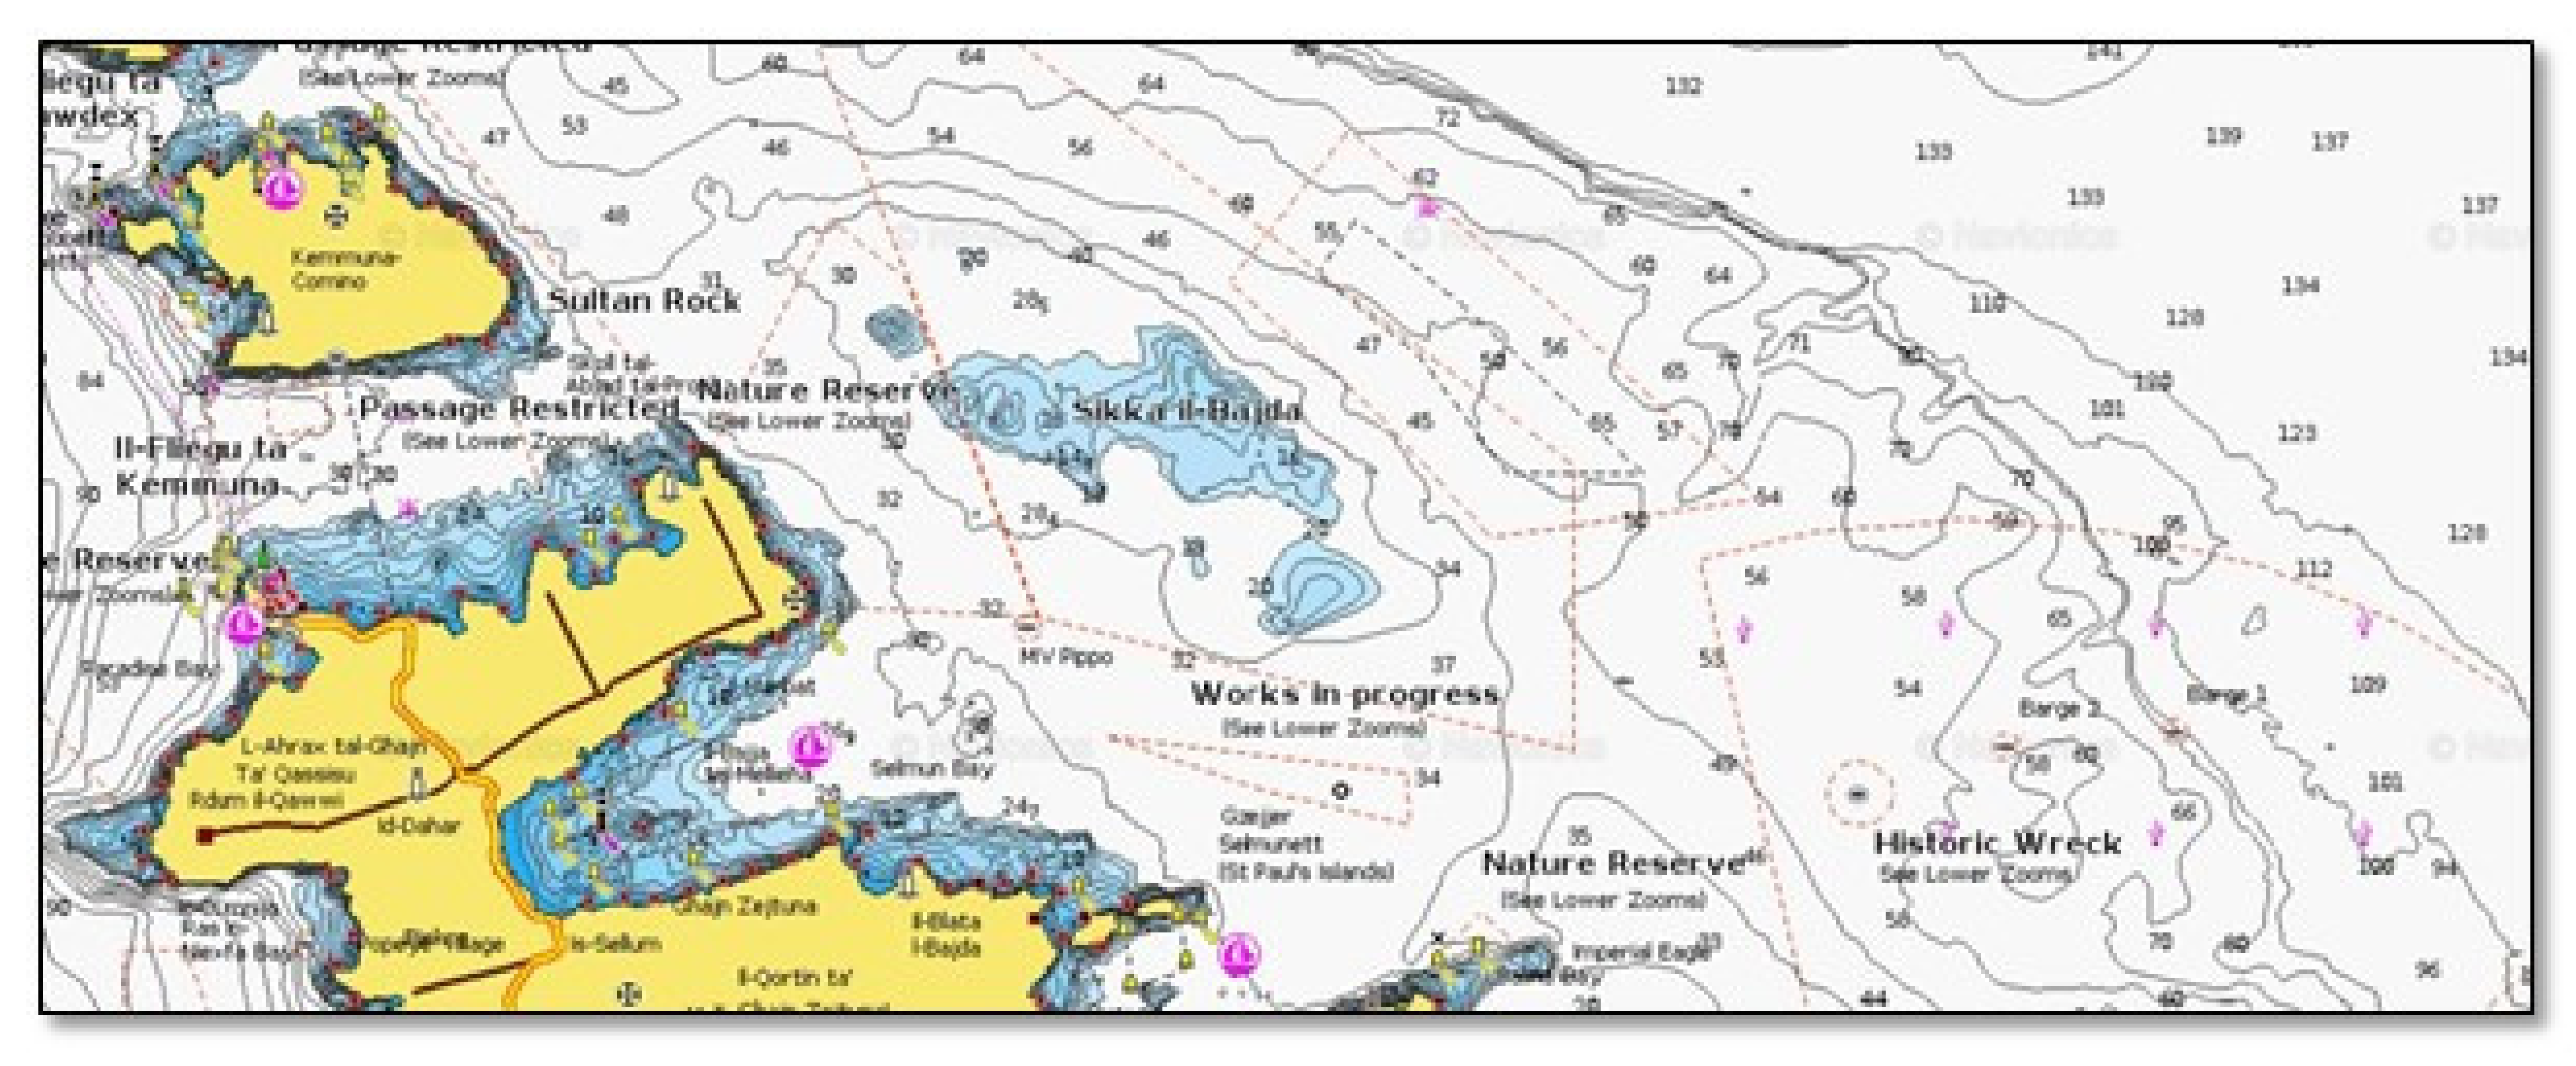
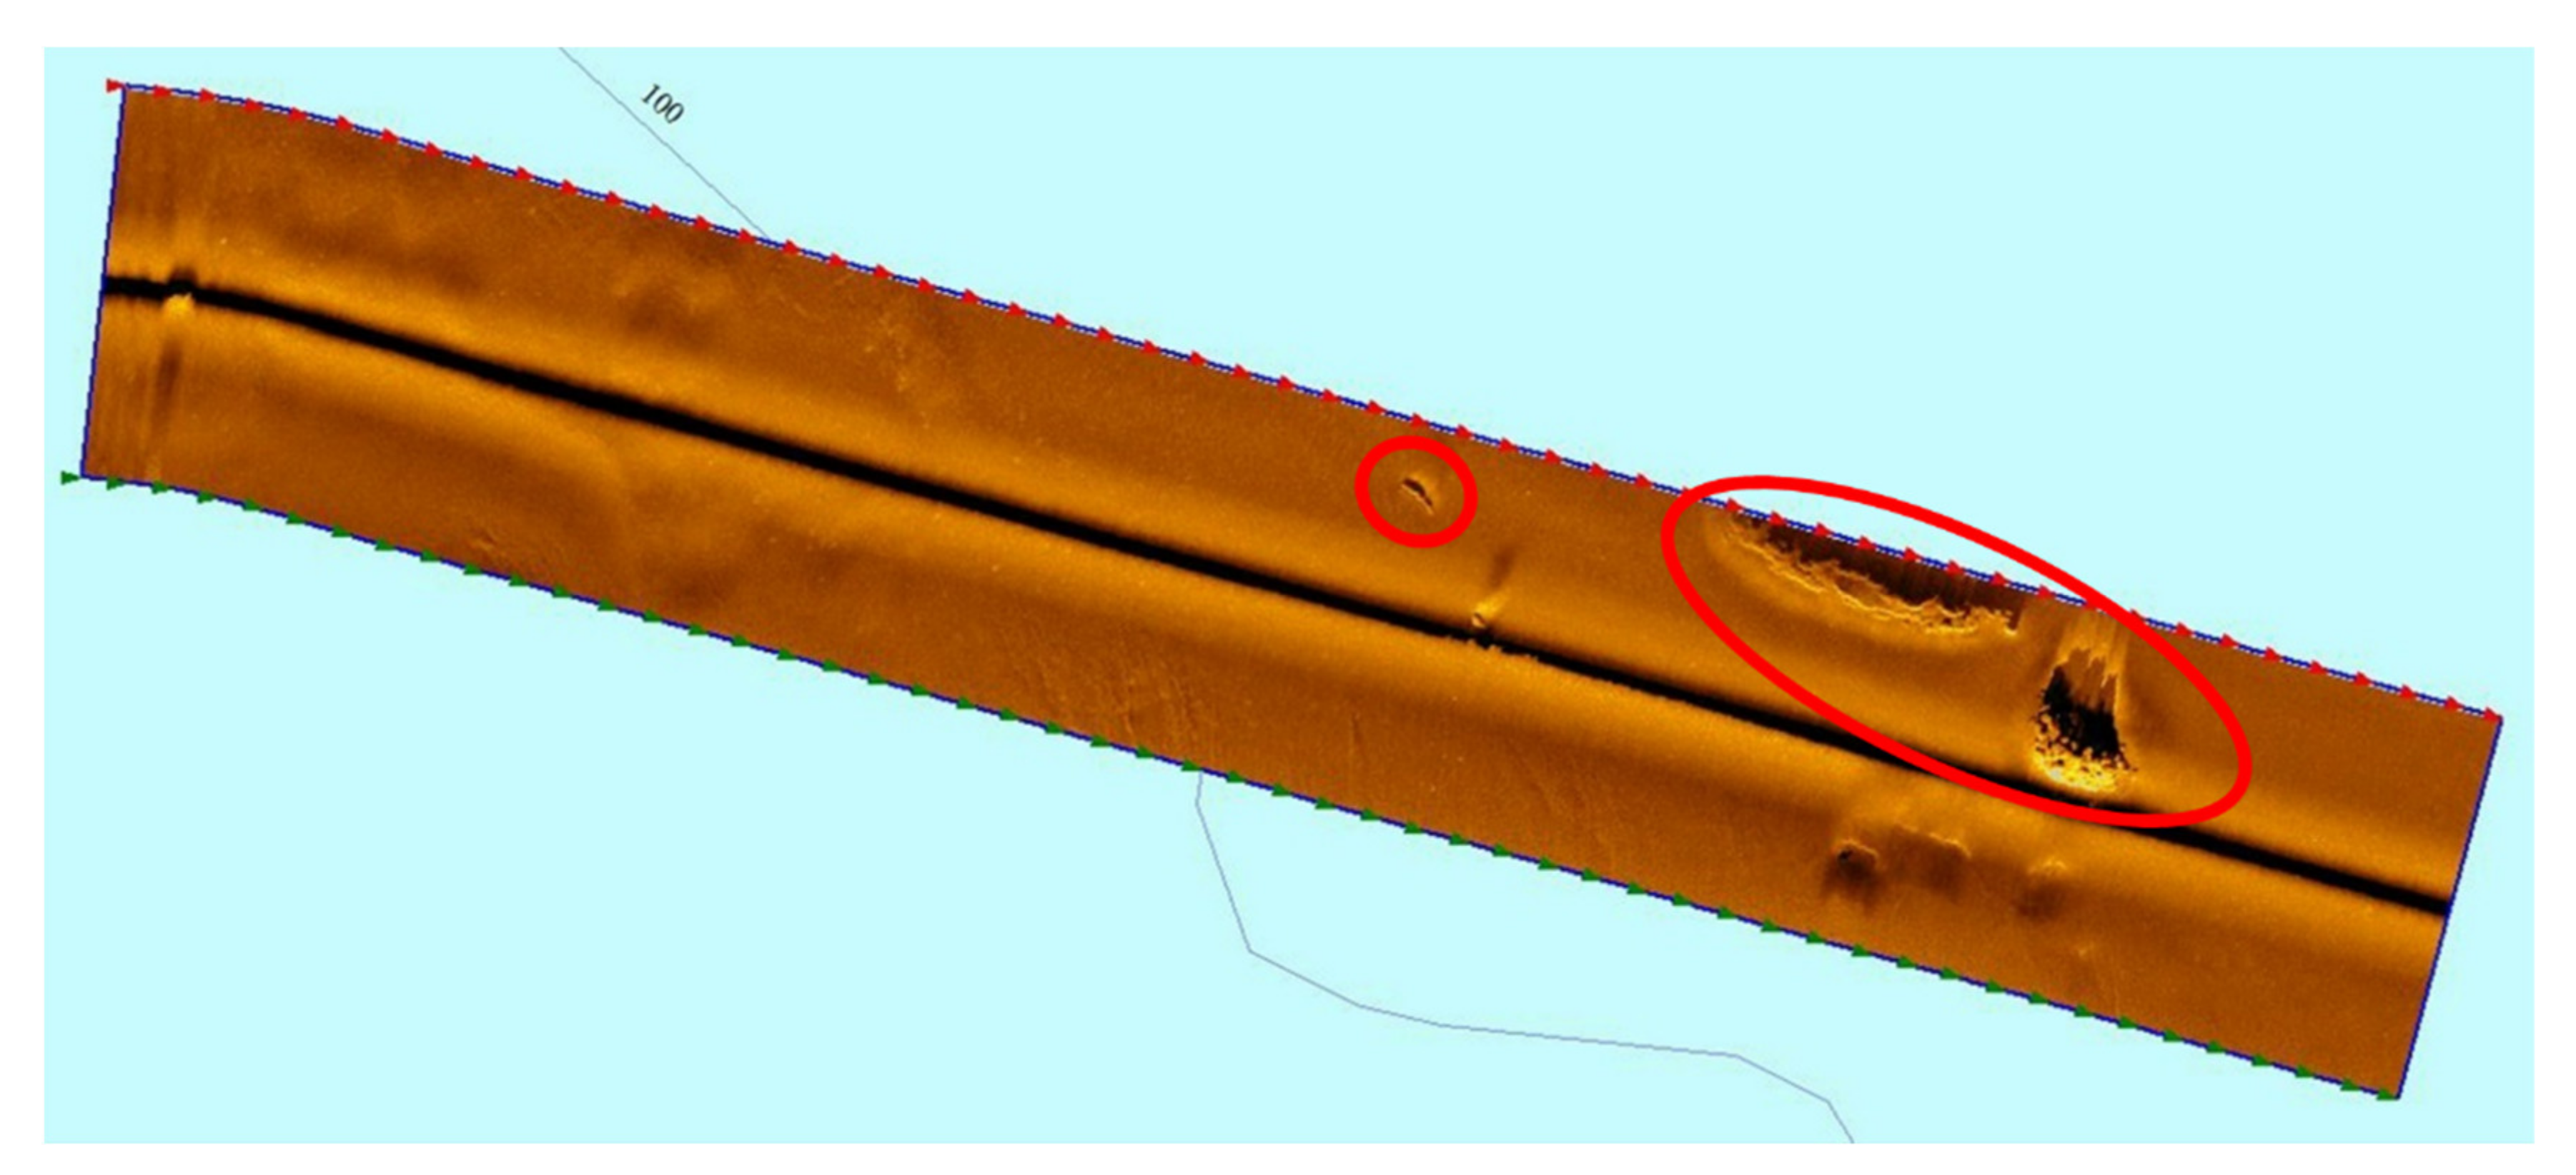
Figure 6.
An example of a digitalized line that reveals the presence of geological formations (circled in red) on the seabed.
Figure 6.
An example of a digitalized line that reveals the presence of geological formations (circled in red) on the seabed.

Figure 7.
POV camera mounted on the AUV.
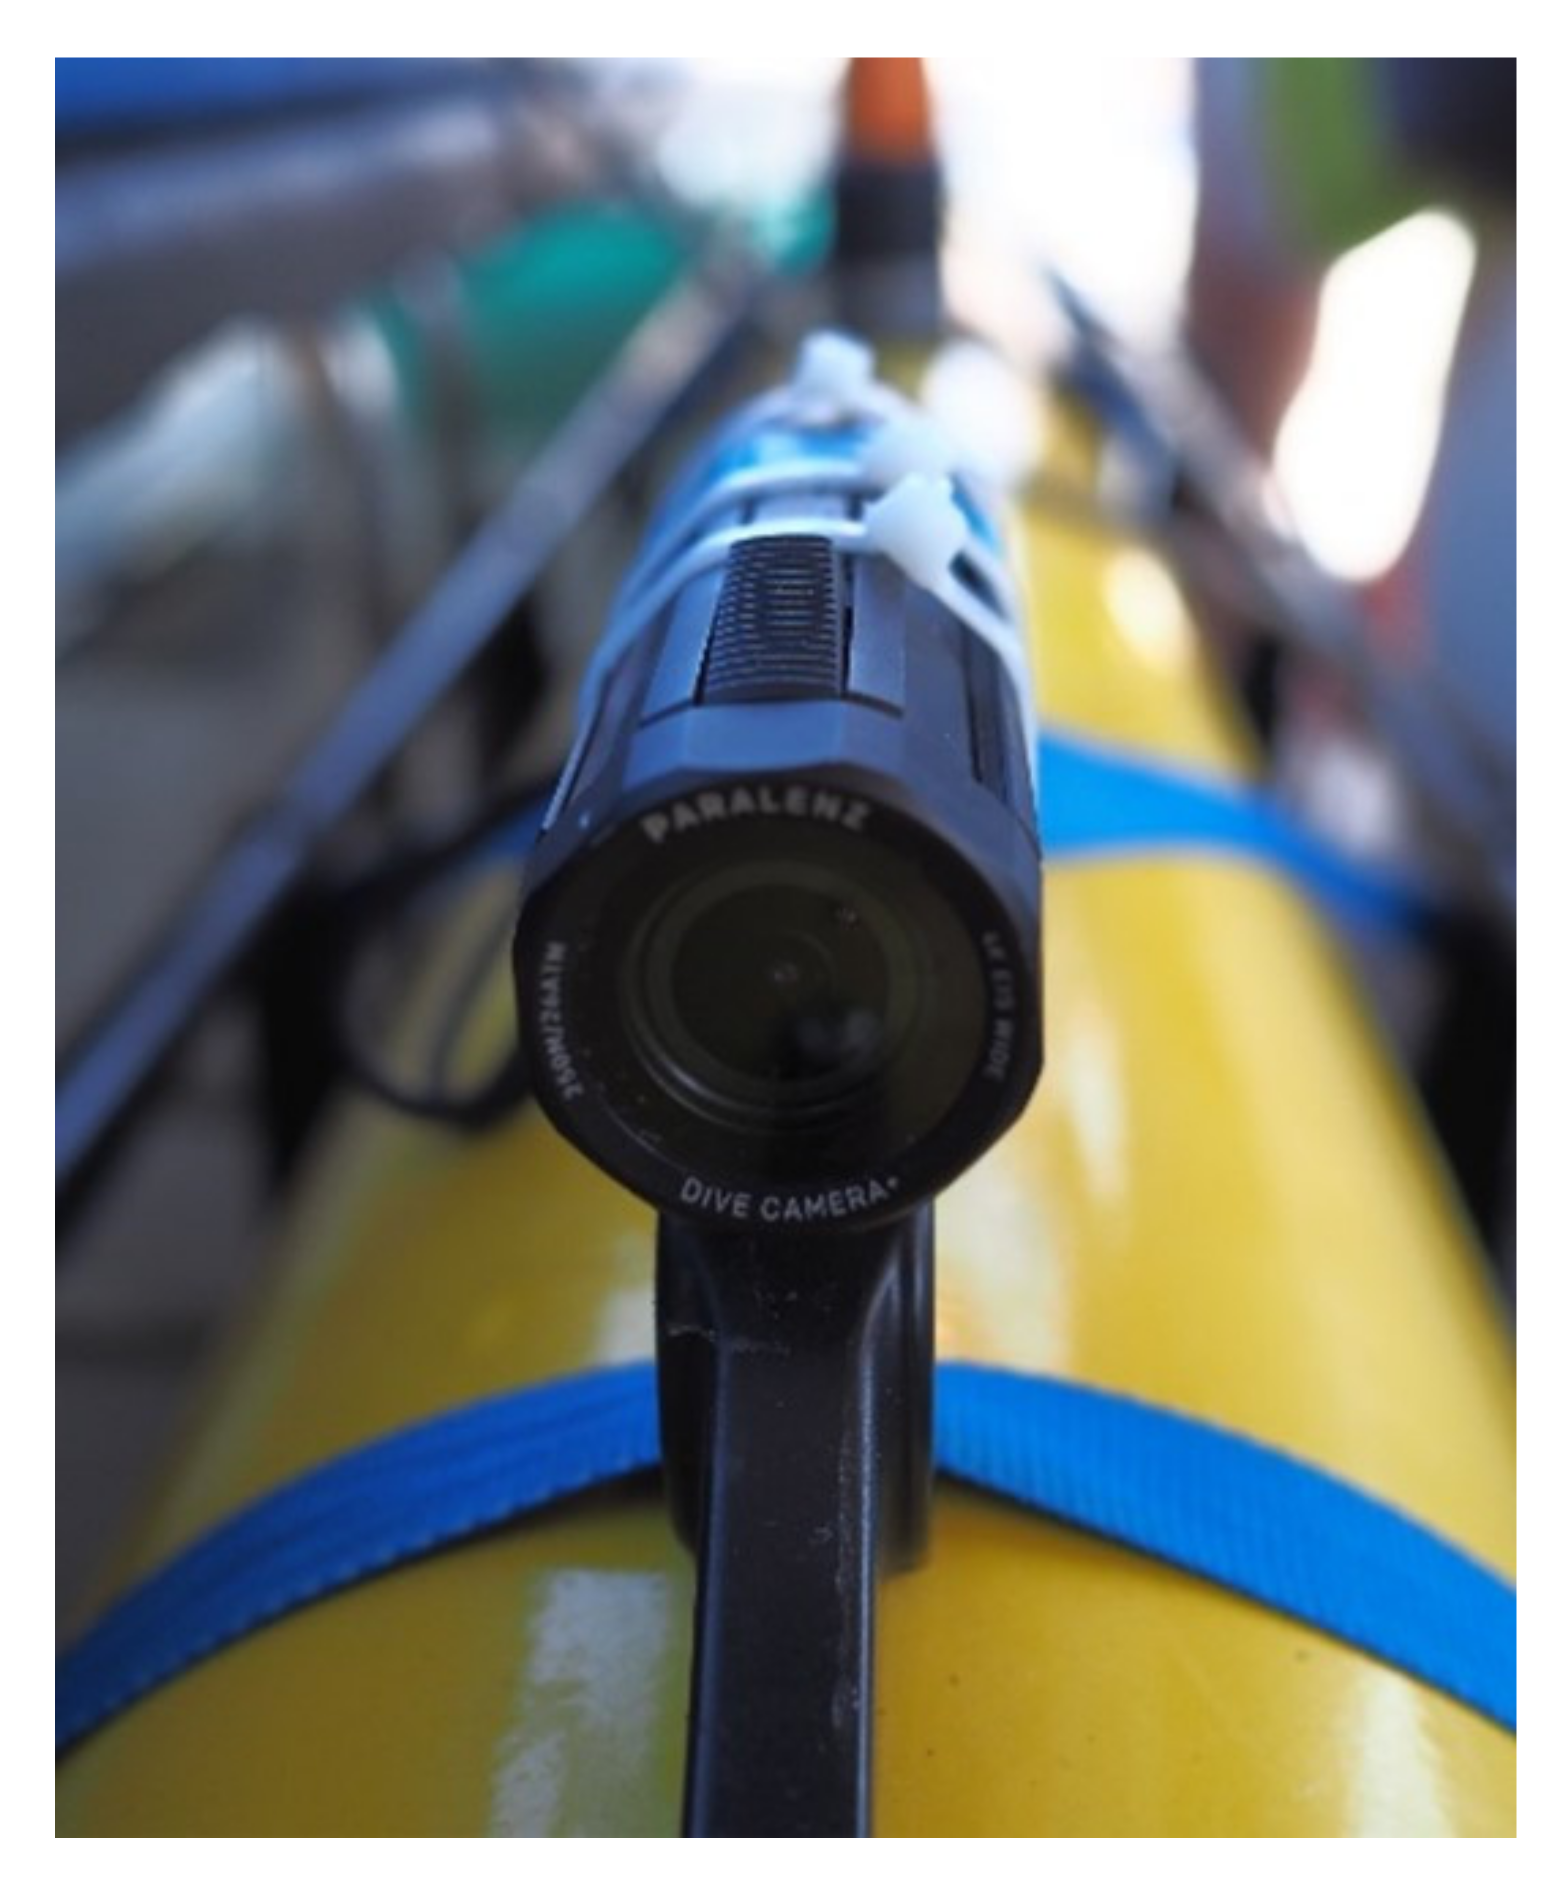
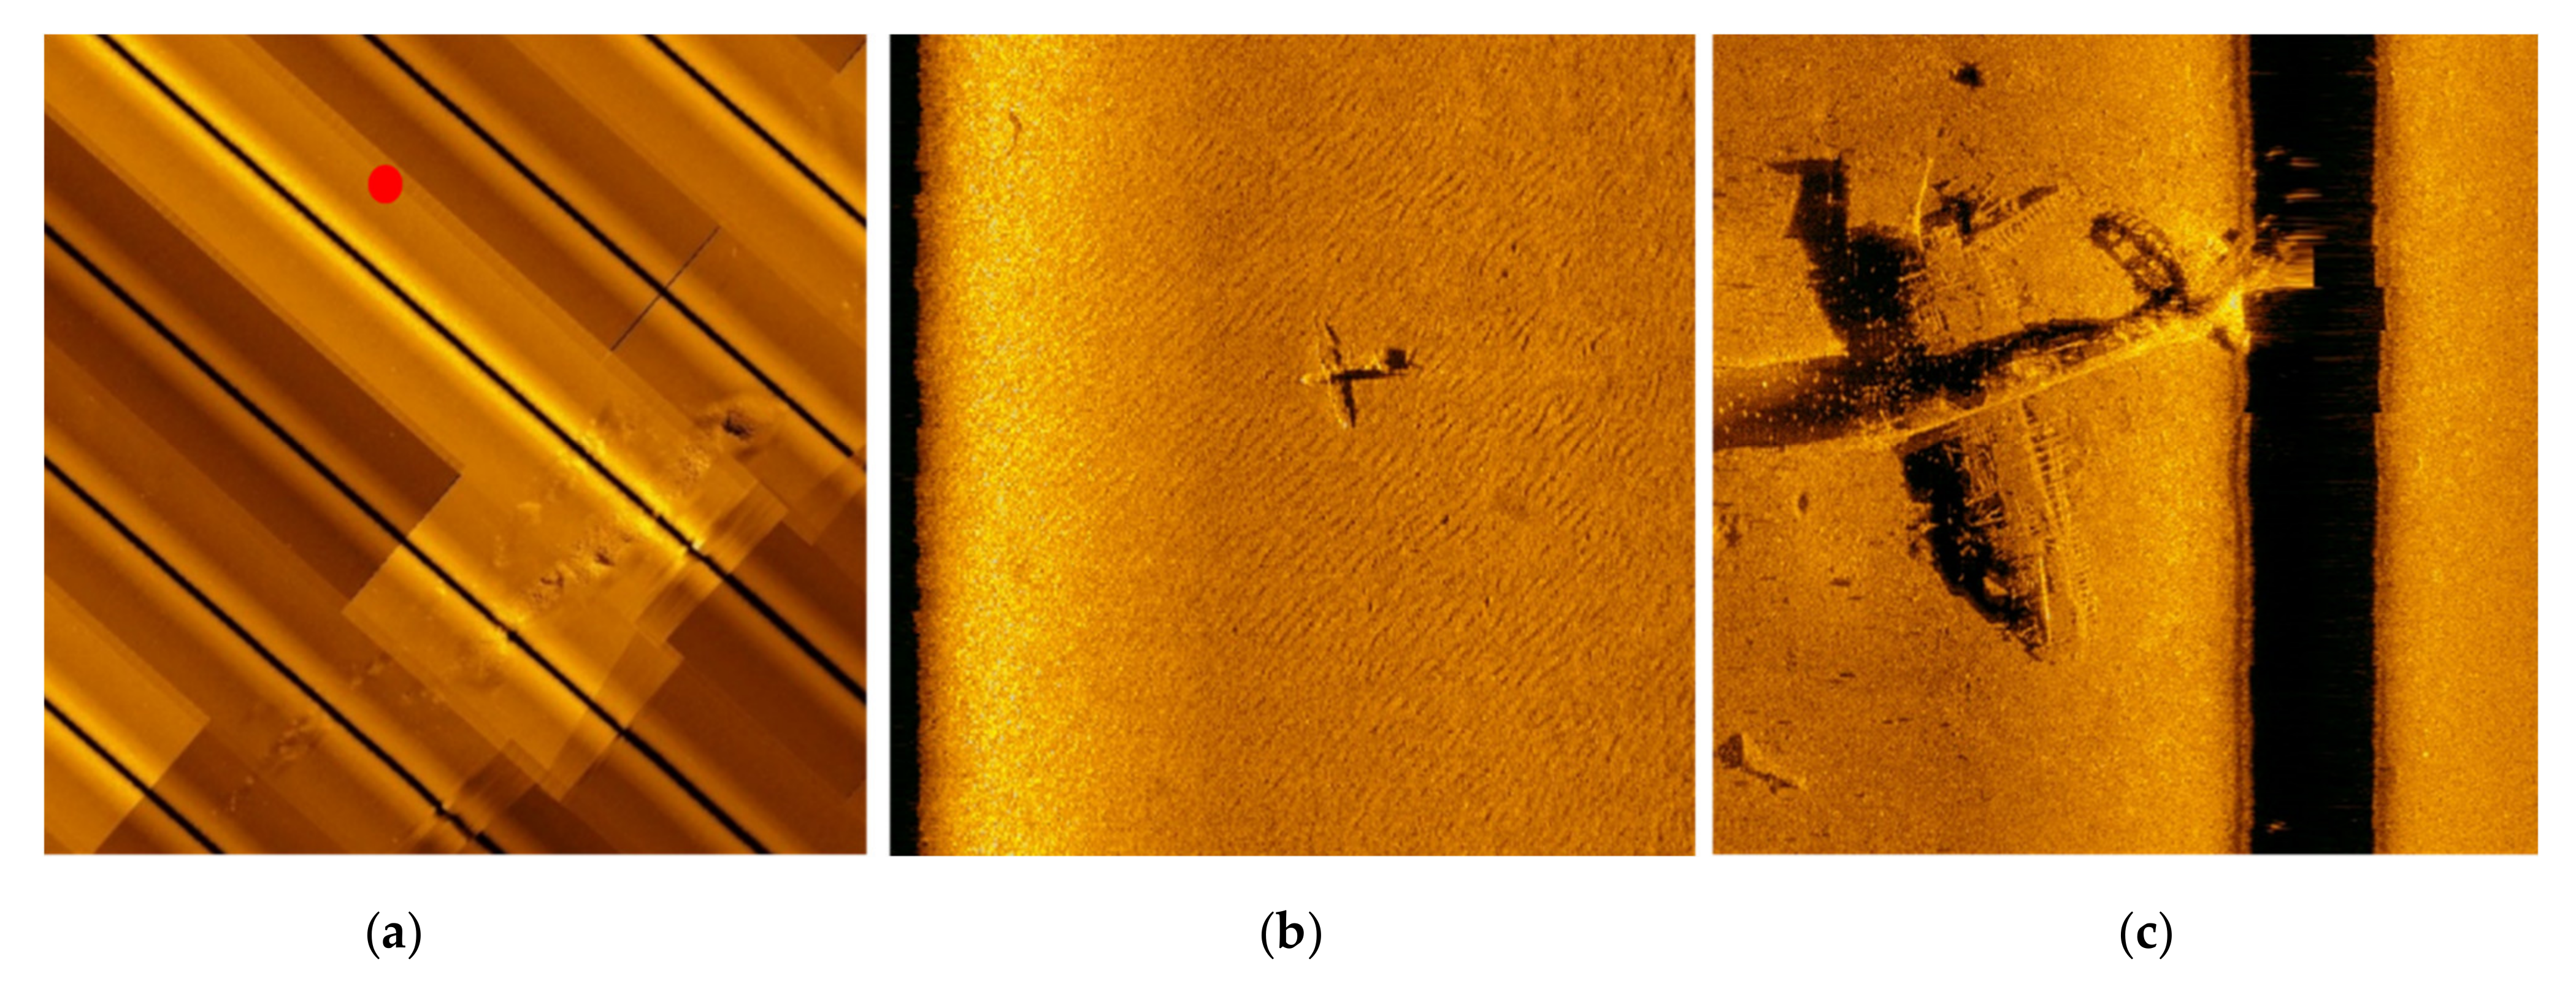
Figure 8.
(a) Blind systematic survey flying 10 m from the seabed. (b) Identification of the target at 600 KHz. (c) Second dive for high-resolution documentation at 1600 KHz while flying 6 m from the seabed. This aircraft was identified as a Fairey Fulmar, which played a crucial role in convoy protection to and from Malta.

Figure 9.
Diver using a camera-mounted DPV to record a large shipwreck. © Dave Gration/University of Malta.
Figure 9.
Diver using a camera-mounted DPV to record a large shipwreck. © Dave Gration/University of Malta.

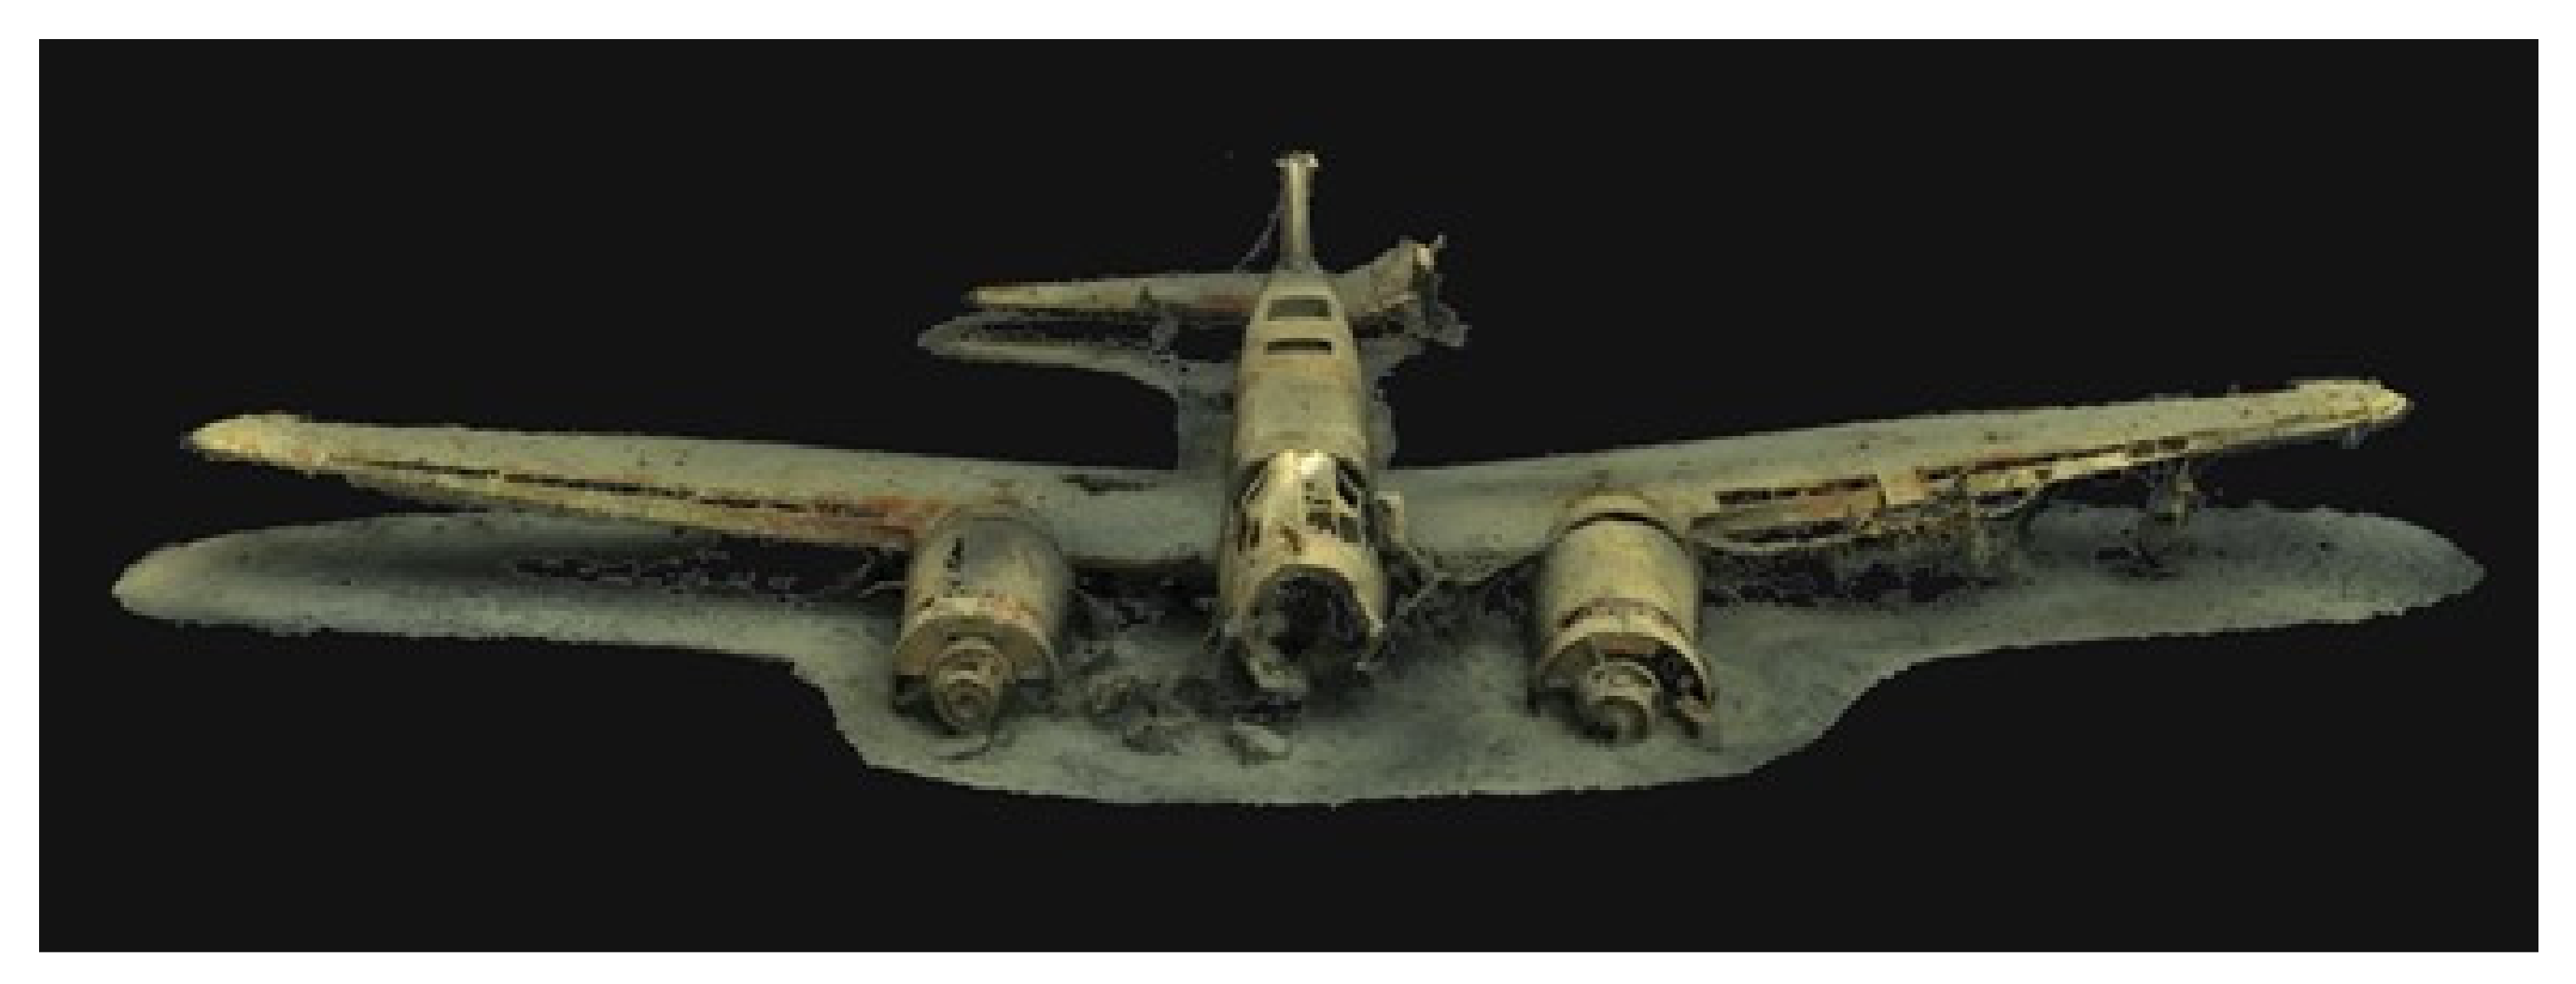
Figure 10.
Three-dimensional model of a Junkers Ju88 aircraft that was wrecked off the south-eastern coast of Malta is now resting on the seabed at a depth of 106 m.
Figure 10.
Three-dimensional model of a Junkers Ju88 aircraft that was wrecked off the south-eastern coast of Malta is now resting on the seabed at a depth of 106 m.

Figure 11.
Example of the Underwater Malta landing page for a specific wreck site, the Fairey Swordfish. https://underwatermalta.org/discover/fairy-swordfish/ (accessed on 10 August 2021).
Figure 11.
Example of the Underwater Malta landing page for a specific wreck site, the Fairey Swordfish. https://underwatermalta.org/discover/fairy-swordfish/ (accessed on 10 August 2021).
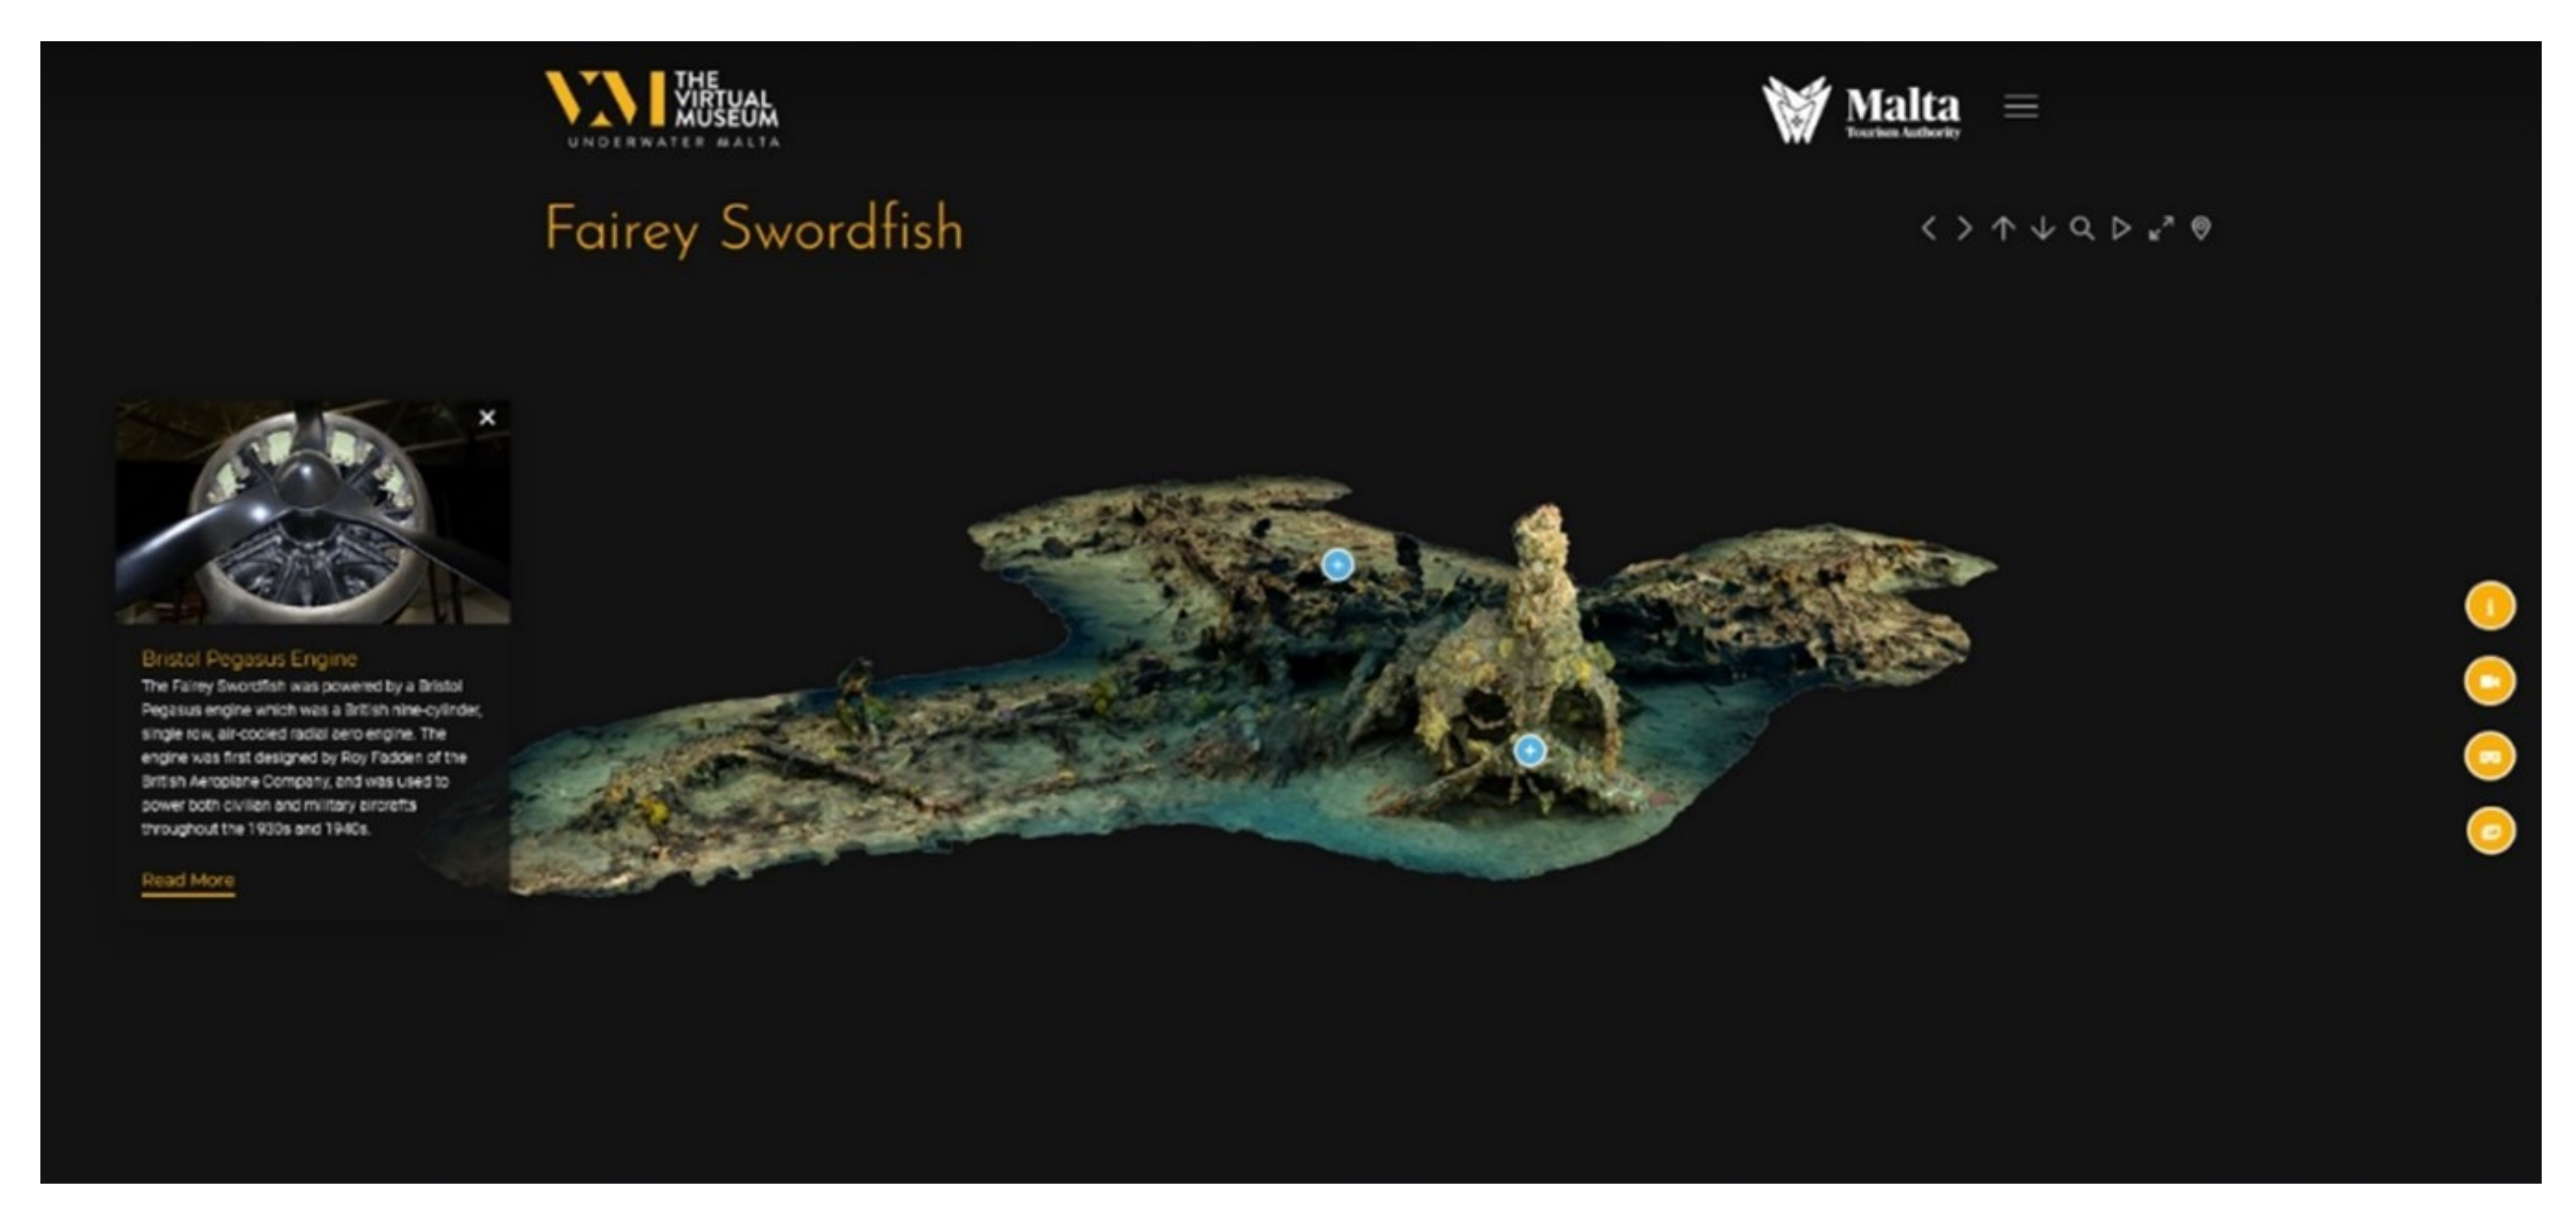
Figure 12.
The Google Arts and Culture ‘story’ on AUV surveys. https://artsandculture.google.com/story/making-the-invisible-visible/aAKSJPvfvuIXIA (accessed on 10 August 2021).
Figure 12.
The Google Arts and Culture ‘story’ on AUV surveys. https://artsandculture.google.com/story/making-the-invisible-visible/aAKSJPvfvuIXIA (accessed on 10 August 2021).

Figure 13.
Landing page of the website of the Phoenician Shipwreck Project. https://phoenicianshipwreck.org (accessed on 10 August 2021).
Figure 13.
Landing page of the website of the Phoenician Shipwreck Project. https://phoenicianshipwreck.org (accessed on 10 August 2021).


Table 1.
The capabilities of the Edgetech 2205 SSS system utilized by the UM.
| Parameter | Value |
|---|---|
| Frequencies | 600 kHz/1600 KHz |
| Height from the seabed | 1–20 m |
| Low-frequency ranges | 60–110 m |
| High-frequency ranges | 5–20 m |
| Depth operating limit | 500 m |
Table 2.
Teledyne Gavia AUV capabilities utilized by the UM.
| Parameter | Value |
|---|---|
| Vehicle dimensions | 3.20 m (UM configuration) |
| Maximum depth | 500 m |
| Maximum mission length | 6–7 h |
| Average daily coverage | 4–5 km2, depending on mission length |
Table 3.
Blueview’s multibeam parameters.
| Parameter | Value |
|---|---|
| Minimum range | 0.5 |
| Minimum distance from the seabed | 3 |
| Maximum range | 10 |
| Maximum distance from the seabed | 8.8 |
| Ping period | 50 ms |
Table 4.
Example of the mission parameters used by the University of Malta team.
| Parameter | Value |
|---|---|
| Speed | 700–800 rpm |
| Height from the bottom | 3–15 m |
| Length of the lines | 900–1800 m |
| Distance in between lines | (depending on range) |
| Edgetech Frequency | 900/1600 KHz |
| Edgetech Range | (Depending on frequency, distance between lines, seabed type, and distance to the seabed) 30–100 m |
Publisher’s Note: MDPI stays neutral with regard to jurisdictional claims in published maps and institutional affiliations. |
© 2021 by the authors. Licensee MDPI, Basel, Switzerland. This article is an open access article distributed under the terms and conditions of the Creative Commons Attribution (CC BY) license (https://creativecommons.org/licenses/by/4.0/).
Share and Cite
MDPI and ACS Style
Gambin, T.; Bravo-Morata Rodríguez, A.; Sausmekat, M. From Discovery to Public Consumption: The Process of Mapping and Evaluating Underwater Cultural Heritage in Malta. Heritage 2021, 4, 2732-2745. https://doi.org/10.3390/heritage4040154
AMA Style
Gambin T, Bravo-Morata Rodríguez A, Sausmekat M. From Discovery to Public Consumption: The Process of Mapping and Evaluating Underwater Cultural Heritage in Malta. Heritage. 2021; 4(4):2732-2745. https://doi.org/10.3390/heritage4040154
Chicago/Turabian StyleGambin, Timmy, Alberto Bravo-Morata Rodríguez, and Maja Sausmekat. 2021. "From Discovery to Public Consumption: The Process of Mapping and Evaluating Underwater Cultural Heritage in Malta" Heritage 4, no. 4: 2732-2745. https://doi.org/10.3390/heritage4040154