
Numerical Investigation of the Effect of Sloped Terrain on Wind-Driven Surface Fire and Its Impact on Idealized Structures


1
Department of Mechanical Engineering, Faculty of Engineering, University of Birjand, Birjand 97175615, Iran
2
School of Engineering and Information Technology, University of New South Wales Canberra, Canberra, ACT 2610, Australia
3
Department of Fire Protection Engineering, Worcester Polytechnic Institute, Worcester, MA 01609, USA
*
Author to whom correspondence should be addressed.
Fire 2021, 4(4), 94; https://doi.org/10.3390/fire4040094
Submission received: 5 November 2021
/
Revised: 4 December 2021
/
Accepted: 8 December 2021
/
Published: 12 December 2021
(This article belongs to the Special Issue Wind Fire Interaction and Fire Whirl)
Abstract
:In this study, a time-dependent investigation has been conducted to numerically analyze the impact of wind-driven surface fire on an obstacle located on sloped terrain downstream of the fire source. Inclined field with different upslope terrain angles of 0, 10, 20, and 30° at various wind-velocities have been simulated by FireFoam, which is a large eddy simulation (LES) solver of the OpenFOAM platform. The numerical data have been validated using the aerodynamic measurements of a full-scale building model in the absence of fire effects. The results underlined the physical phenomena contributing to the impact of varying wind flow and terrain slope near the fire bed on a built area. The findings indicated that under a constant heat release rate and upstream wind velocity, increasing the upslope terrain angle leads to an increase in the higher temperature areas on the ground near the building. It is also found that raising the inclined terrain slope angle from 0 to 30°, results in an increase in the integrated temperature on the surface of the building. Furthermore, by raising the terrain slope from 0 to 30°, the integrated temperature on the ground for the mentioned cases increases by 16%, 10%, and 13%, respectively.
1. Introduction
Bushfires are inevitable natural disasters which have enormous negative environmental and economic impacts. It is widely known that complex terrains have major effects on the dynamic of the wind flow, which in turn influences the fire dynamic’s behavior.
The wind and topography are widely recognized as the dominant factors affecting forest fire behavior [1]. Several studies examined the impact of wind on the geometrical parameters of the flame such as flame length and tilt angle [2,3,4,5]. These studies suggested that having a higher wind speed results in an increase in the flame length, which then drops off. In some other studies, it is also reported that terrain slope has major contributions on the rate of spread of the fire in the inclined fields [6,7,8]. Overall, terrain slope is a crucial element in fire behavior [9], including the rate of spread [10] due to the complex interaction between wind and fire in inclined and complex terrains [11]. Another major challenge in understanding wildfire behavior and fire spread rate is wind and the anomaly of its interaction with fire [12]. The impact of terrain slope and wind on wildfire behavior has been explored in some recent studies [11,13,14]. The authors showed that by increasing terrain slope, the rate of fire spread increases. In other investigations, it is reported that in windward inclined terrain, air flow acceleration leads to greater fire propagation [15,16]. Hilton and Grag [17] compared the two-dimensional and three-dimensional methods of simulating wildfire behavior considering wind–terrain interaction and experimentally measured datasets. They found a good agreement between the two-dimensional model and the experimental data and proved that a two-dimensional model requires no parametrization or fitting term, unlike the 3D model. A numerical study of terrain slope effects on wildfire behavior was conducted by Linn et al. [18]. In the study, six numerical simulations using three different fuel beds on flat and upslope terrain were carried out, and it was shown that terrain slope has a significant effect on the spread rate and spread pattern. They also demonstrated that there are differences in the wind movement around the fire on sloped terrain. The mentioned differences in air movement affect the convective and radiative heat transfer. An experimental study on the effect of terrain slope on heat transfer of wildfire was also run by Clements and Seto [19]. The investigation highlights the complex interaction of fire, meteorology, and topography that affects fire behavior in complex terrain. The authors proved that simulations using coupled fire–atmospheric models should be conducted to better understand the dynamic mechanisms of the observed thermodynamic and kinematic structure reported from this field experiment. Abouali et al. [1] conducted a computational and laboratory investigation on wind flow and fire behavior over an isolated inclined ridgeline laboratory-scale terrain for the different terrain slopes. The results indicated the importance of interaction between terrain-modified flow mechanisms and fire, which results in accelerated flows that drive the indicated unexpected behavior. A detailed investigation on bushfire risk and fire behavior on mountains was carried out by Sharples [20]. These authors conducted a study of mountain meteorology parameters and the role they may play in bushfire behavior prediction. The authors reported that the flame’s streamwise velocity profile and fire-induced flow are associated with the terrain slope. Mendes-Lopes et al. [21] conducted a set of experiments on changing the terrain slope and wind velocity. Flame height, flame length, flame angle, and temperature were measured. The results revealed that the rate of spread is enhanced with terrain slope for up-hill propagation. In addition, it is shown that flame angle and height depend on terrain slope. In another work, the effect of terrain slope and wind were experimentally and mathematically investigated by Viegas [22]. This study was conducted in a homogenous and plane fuel bed under uniform wind and slope conditions. The effect of terrain slope on fire behavior was studied in the work of Dupuy and his co-authors [23]. In this work, 109 experiments were conducted to obtain the impact of slope (0°, 10°, 20°, 30°) on fire behavior parameters such as temperature and flame geometry. It was shown that by increasing the terrain slope, the flame residence time increases. Some wind-slope models based on wind vectors and topographic terrain slope were developed by Sharples [24]. The author presented a review of using slope corrections in simulating the rate of spread. The effect of terrain slope on fire spreading toward a fuel break was investigated by Dupuy et al. [25]. They used a multiphase physical model to simulate wildfire spread through a pine stand. The results showed that the method was fully capable to simulate the propagation of a crown fire and to estimate the efficiency of a fuel break. A numerical and experimental study on fire plume and slope effect was conducted by Wu et al. [26]. The effect of the surface conditions such as slope and fire heat release rate on the plume as well as the critical inclination angle were investigated in this study. The results showed that the critical inclination angle is not related to the fire heat release rate or surface conditions.
One important aspect of wildfire research is directed towards the analysis of thermal and aerodynamic impacts of fire-enhanced wind on building structures in urban environments. The lack of enough research in analyzing the impact of wildfire on wind and buildings with mesh sizes smaller than the boundary layer thickness can be seen in the work of He and his co-authors [27]. Richards et al. [28] reported an experimental and numerical investigation on the mean pressure of cube-shaped building and reported an important sets of data on the aerodynamic behavior of a building in the wind flow. Hostikka et al. [29] carried out an investigation on fire behavior at the wildland–urban interface. Their work focused on the numerical simulation and shed a light on understanding the thermal impact of bushfires on building. Their results indicated that a mesh size of 0.25 m is appropriate for the numerical simulation of thermal radiation. A new dynamic modelling on the radiation heat transfer of wildfires on the building in urban area was proposed by Hilton et al. [30]. The fire spread rate was simulated with a quasi-steady model that was unable to present adequate insights on dynamic behaviors of the fire. Fryanova and Perminov [31] studied the effect of fire intensity and wind speed on the ignition probability of building structures. Thermal and hydrodynamic effect of wind flow on building were explored. Mell et al. [32] explored the wildland–urban interface phenomenon and their challenges. They reported that fire behavior can be predicted in a near realistically broad range by physics-based models under a variety of atmospheric and terrain slope conditions. These models, with supporting experimental data, are very useful to develop risk assessment and mitigation strategies for realistic WUI fuels and environmental conditions.
Previous works provide indispensable numerical data into the impact of a wind-driven surface fire on fire dynamic behavior and temperature profile downstream of the fire source. However, the fundamental mechanisms of how the interaction of horizontal wind flow with a line fire changes the velocity profile around a building located on a sloped terrain and the surface temperature of the building downstream of the fire source still requires further study. Such studies emphasize the necessity of further development of wildfire risk management strategies, together with improved urban planning policies.
This work aimed to fill the gap by providing quantitative and systematic analysis into the factors contributing to the alteration of velocity profile, surface temperature, and heat flux on a building located on sloped terrain with various slope angles. Although fire behavior on upslope and downslope terrains has been studied by many researchers, the combination of topographic effects and weather impact, such as wind velocity, on a built area has not been investigate in detail. The outcomes of the current work helps to mitigate the wildfire damages and measure the risk managements, such as the one in Australian Standard AS 3959 and Construction of Buildings in bushfire-prone areas [33].
This paper is an initial attempt to simulate the wildland–urban interface with an idealized building structure on a sloped terrain using the FireFOAM solver.
A time-dependent analysis of the interaction between wind, terrain slope, and wildfire and their effect on building structure in terms of thermal load, both convection and radiation effects, and the aerodynamic behavior of the fire downstream of the fire source are examined and reported in detail.
2. Geometrical Model and Boundary Conditions
In the current study, a cubic structure with a size of 6 × 6 × 6 m is used to replicate an experiment.
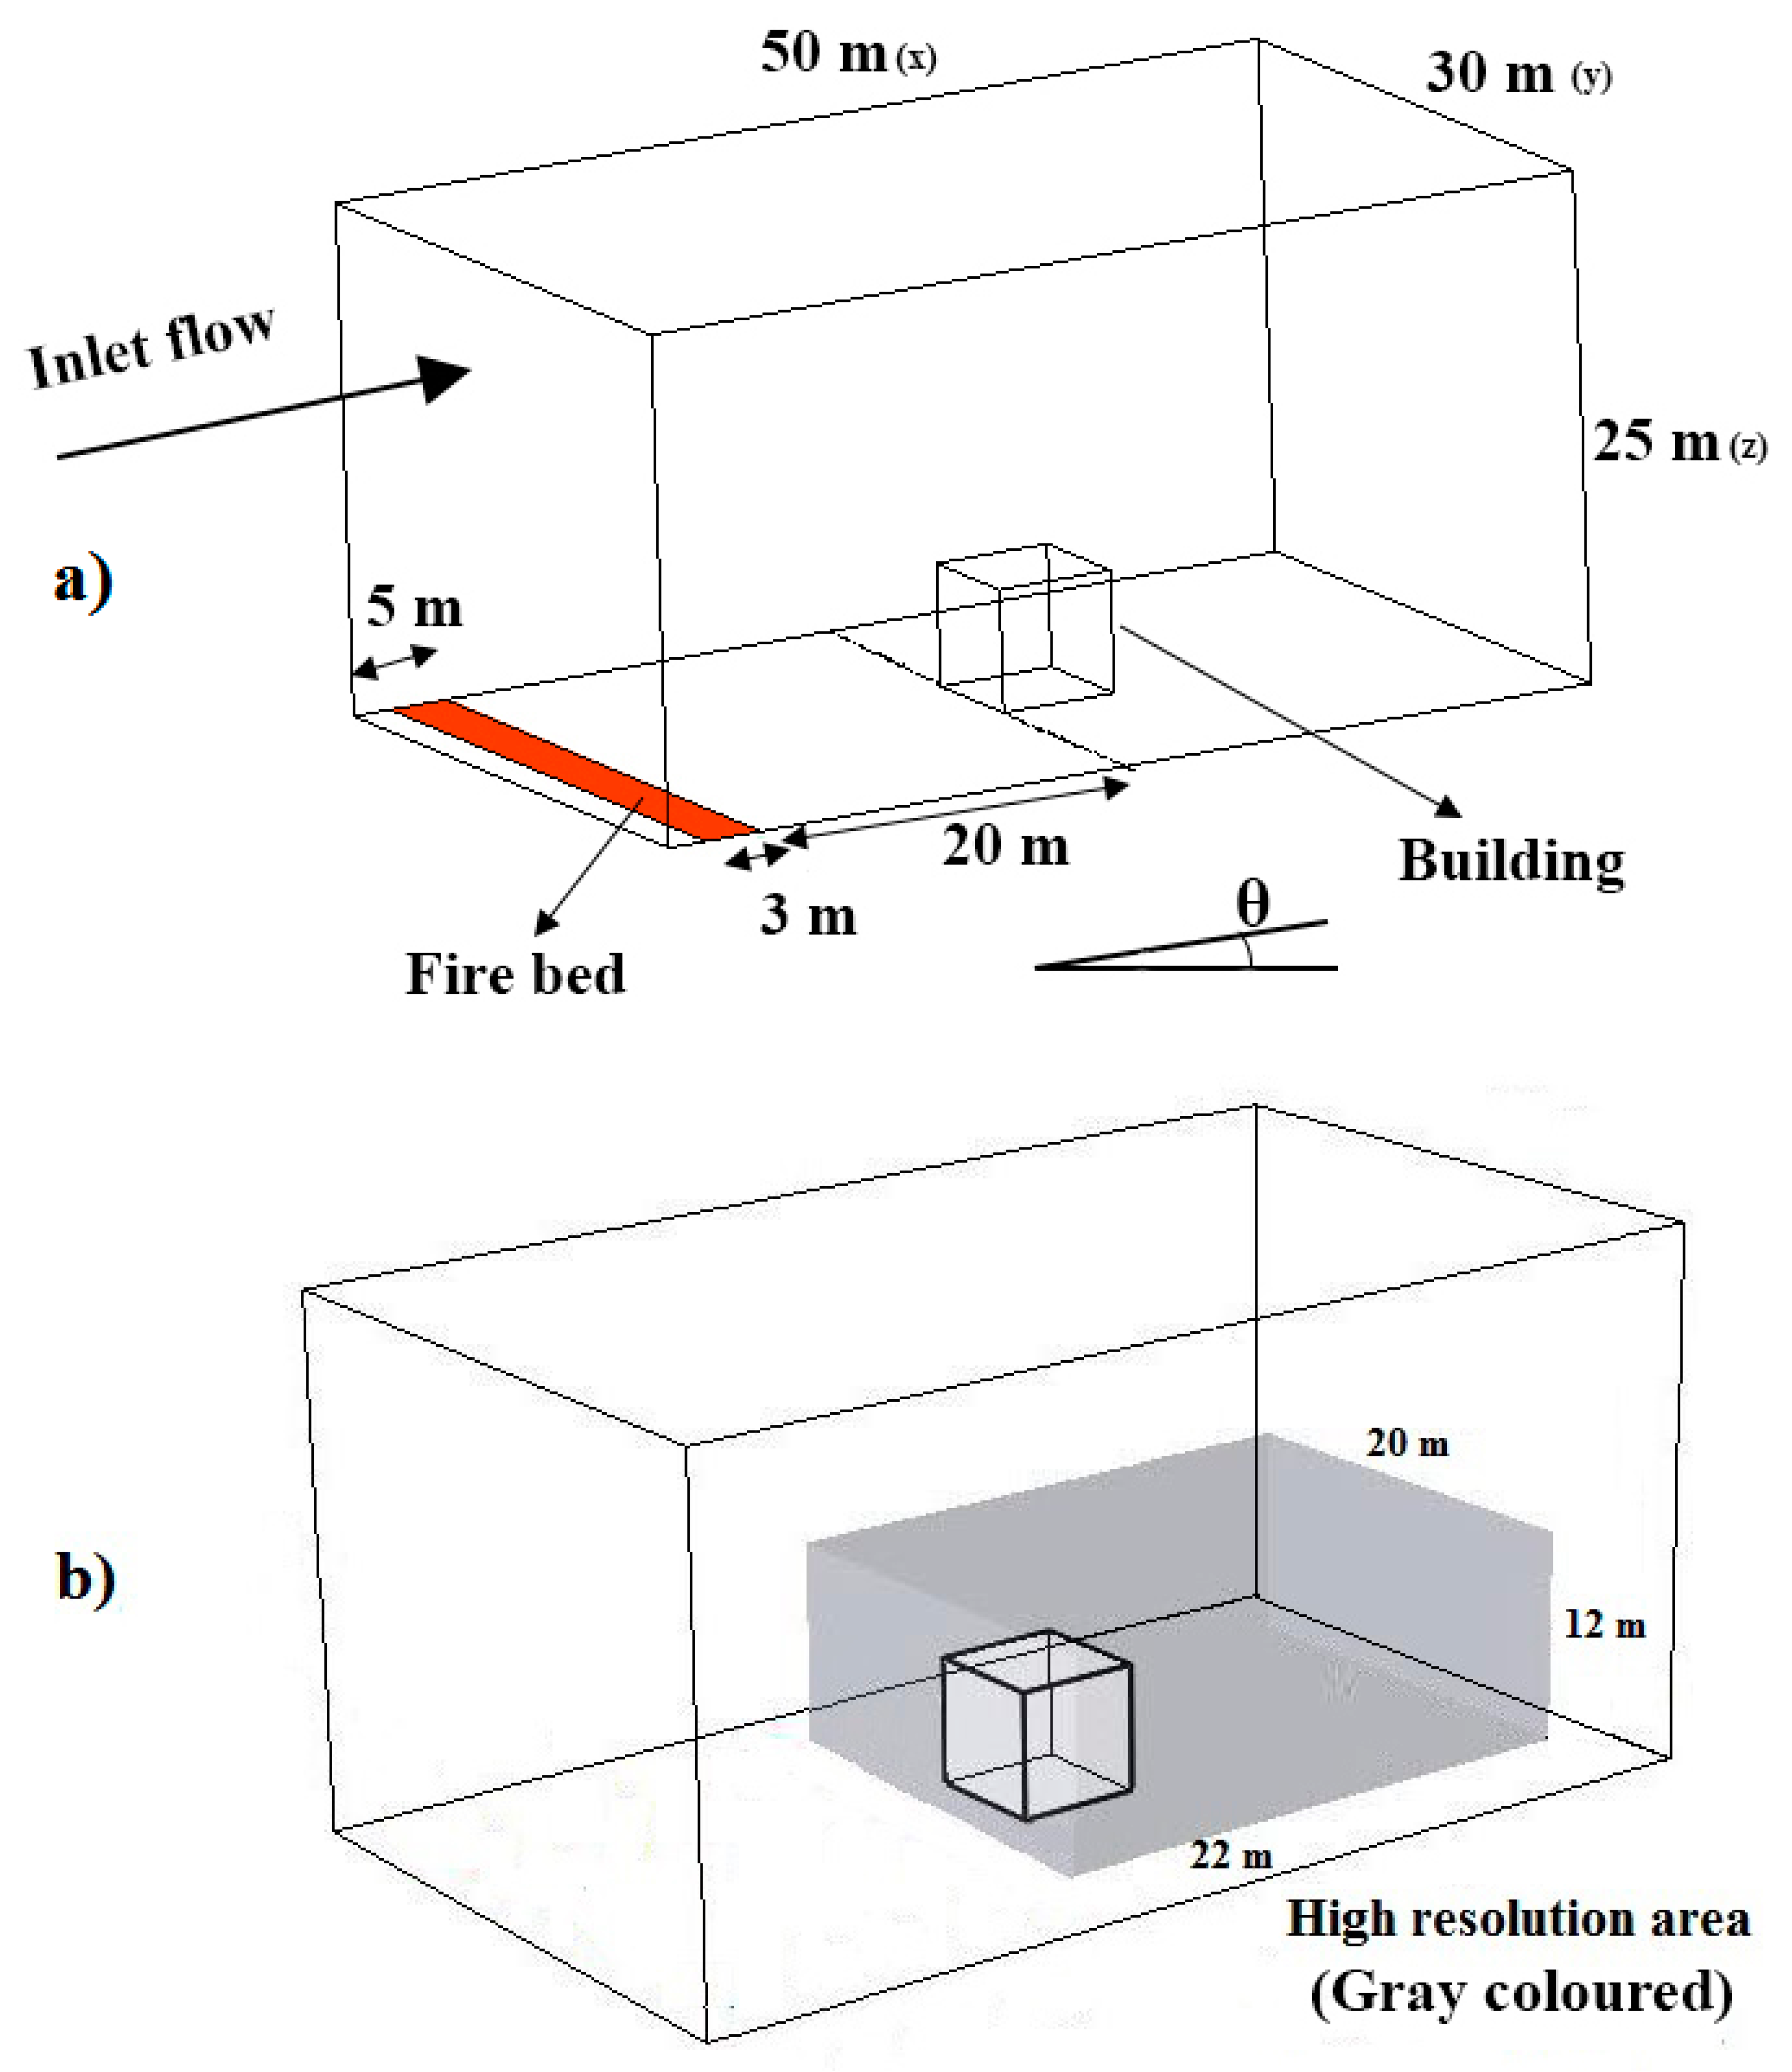
The dimensions of the current geometry are the same as the dimensions of the cubic structure of Silsoe building in an experimental study [28]. As shown in Figure 1a, the building is in the 50 ×30 × 25 m computational domain. In the current study, the boundaries of the considered domain are far enough from the building to avoid happening the adverse boundary condition effects [34].
The structure is placed in various wind streams near the fire bed to analyze the impact of wind-fire interactions on an urban area with different terrain slopes. To have more accurate thermal/aerodynamic data around the cube and downstream of the fire, a near-wall regions sized in 22 × 20 × 12 m is considered as a high-resolution mesh subdomain (See Figure 1b).
As shown in Figure 1a, the computational domain is dimensioned at 50 × 30 × 25 m. A 3m width fire bed is placed 20 m upstream of the building [35], and a heat release rate (HRR) equal to 180 MW is considered, which is provided by burning methane with the rate of 3.96 kg/s and heat of combustion equal to 45,435 kj/kg [36] as a fuel to provide fire intensity [37] of 6 MW/m, which is equivalent to a wildfire with a spread rate of 0.75 m/s and a fuel load of 0.4 kg/m2 in grassland.
To reconstruct the turbulent flow fluctuations, the random noise with the mean flow velocity is applied at the domain inlet. In addition, at the domain inlet, a velocity profile of power-law inflow is used as given in Equation (1).
To decrease the simulation cost for the transition process, simulation of spatially evolving turbulent flow starts with an inflow boundary that is moved to a smaller distance upstream of the domain [38]. Having accurate inflow conditions at the boundary similar to the real condition is not achievable unless the inflow boundary moves toward to the upstream to let error relaxation assist in estimating the inflow conditions. This “development section” can raise the cost of the simulation [38]. In order to decrease the simulation cost and to have an effective inflow data and turbulent inflow condition, the method of superposing random fluctuations on a considered mean velocity profile is used [39]. In spite of its simplicity, the random fluctuation approach to simulate perturbations in the flow has been applied with different degrees of success [40,41].
The boundary layer at the atmosphere has been applied using a power-law velocity profile as shown in Equation (1):
where Zref is the reference height equal to the building’s height (6 m), and Uref is the reference velocity, which, in this paper, is considered as different value ranges of 4.5 m/s, 6 m/s, and 7.5 m/s. α is specified based on the terrain category of the experimental study [42] and considered as 0.16.
A conventional atmospheric pressure (101 kPa) for inlet, outlet, initial internal field, and top boundaries is applied, and the slide boundaries are considered as a free slip boundary. The wall model proposed by Launder and Spalding [43] is used to have the near-wall treatment of turbulent flow. The used self-adapting wall function contributes to having higher-resolution near-wall eddies for a fine wall grid corresponding to the dimensionless wall distance parameter of less than 5 (y+ < 5 m). This means that the turbulent boundary layer is fully resolved up to the viscous sublayer. The y+ parameter shows the first cell size near the wall [44]. More information about the implementation of boundary conditions can be found in references [45,46,47].
The horizontal slope (domain attack) angle, θ, is considered as the angle of gravitational acceleration to the z coordinate of the computation domain, which is defined as two non-zero components:
The initial temperature and velocity of the domain are considered as 300 K and power-law velocity profile, respectively. In this paper, the domain attack angle is assumed at four different upslope angles (θ = 0°, 10°, 20°, and 30°).
3. Numerical Modeling
In order to solve the equations governing the problem, the FireFoam [48] solver of OpenFoam, which is an open-source software, is used. FireFOAM is designed and developed for solving turbulent buoyant flows and diffusion flames and more specifically for simulating dynamic of fire behavior. FireFOAM has also been shown to be an efficient tool in wildfire modelling [49].
To obtain the wind velocity and terrain slope effects and their interaction with unsteady fire plume on a building, all the cases are simulated considering the factor of ignition time. The unsteady problem is taken into account, and the simulations from the ignition time to steady state condition have been carried out.
To simulate turbulent flows, the Large Eddy Simulation (LES) method is applied. The Favre-filtered formulation of the Navier–Stokes equations representing the fire dynamics is written as a set of momentum conservation equations of mass, energy, and chemical species mass fraction.
Continuity, momentum, energy, species, and state equations [35] are presented in Equations (3)–(7):
where “¯” and “~” show spatial and Favre filtering, respectively, is the static pressure, represents the total enthalpy, is the mass fraction of species m, and g represents the gravitational acceleration. , , , , , , , and are the turbulent Prandtl number, turbulent Schmidt number, laminar diffusion coefficient, laminar viscosity, turbulent viscosity, density, gas constant, thermal diffusion coefficient, Kronecker delta, and production/sink rate of species m due to gas reaction, respectively. Coupled velocity and pressure is applied in PIMPLE scheme, which is used by FireFoam. In the current numerical model, the Eddy Dissipation Model (EDM) was used. The differencing scheme of first order upwind was applied. Equation (4) can be written in the flow acceleration form as derived in Equation (8):
where represents the acceleration of the flow, u represents the flow velocity, is the pressure gradient, and is the viscous shear stress.
4. Validation
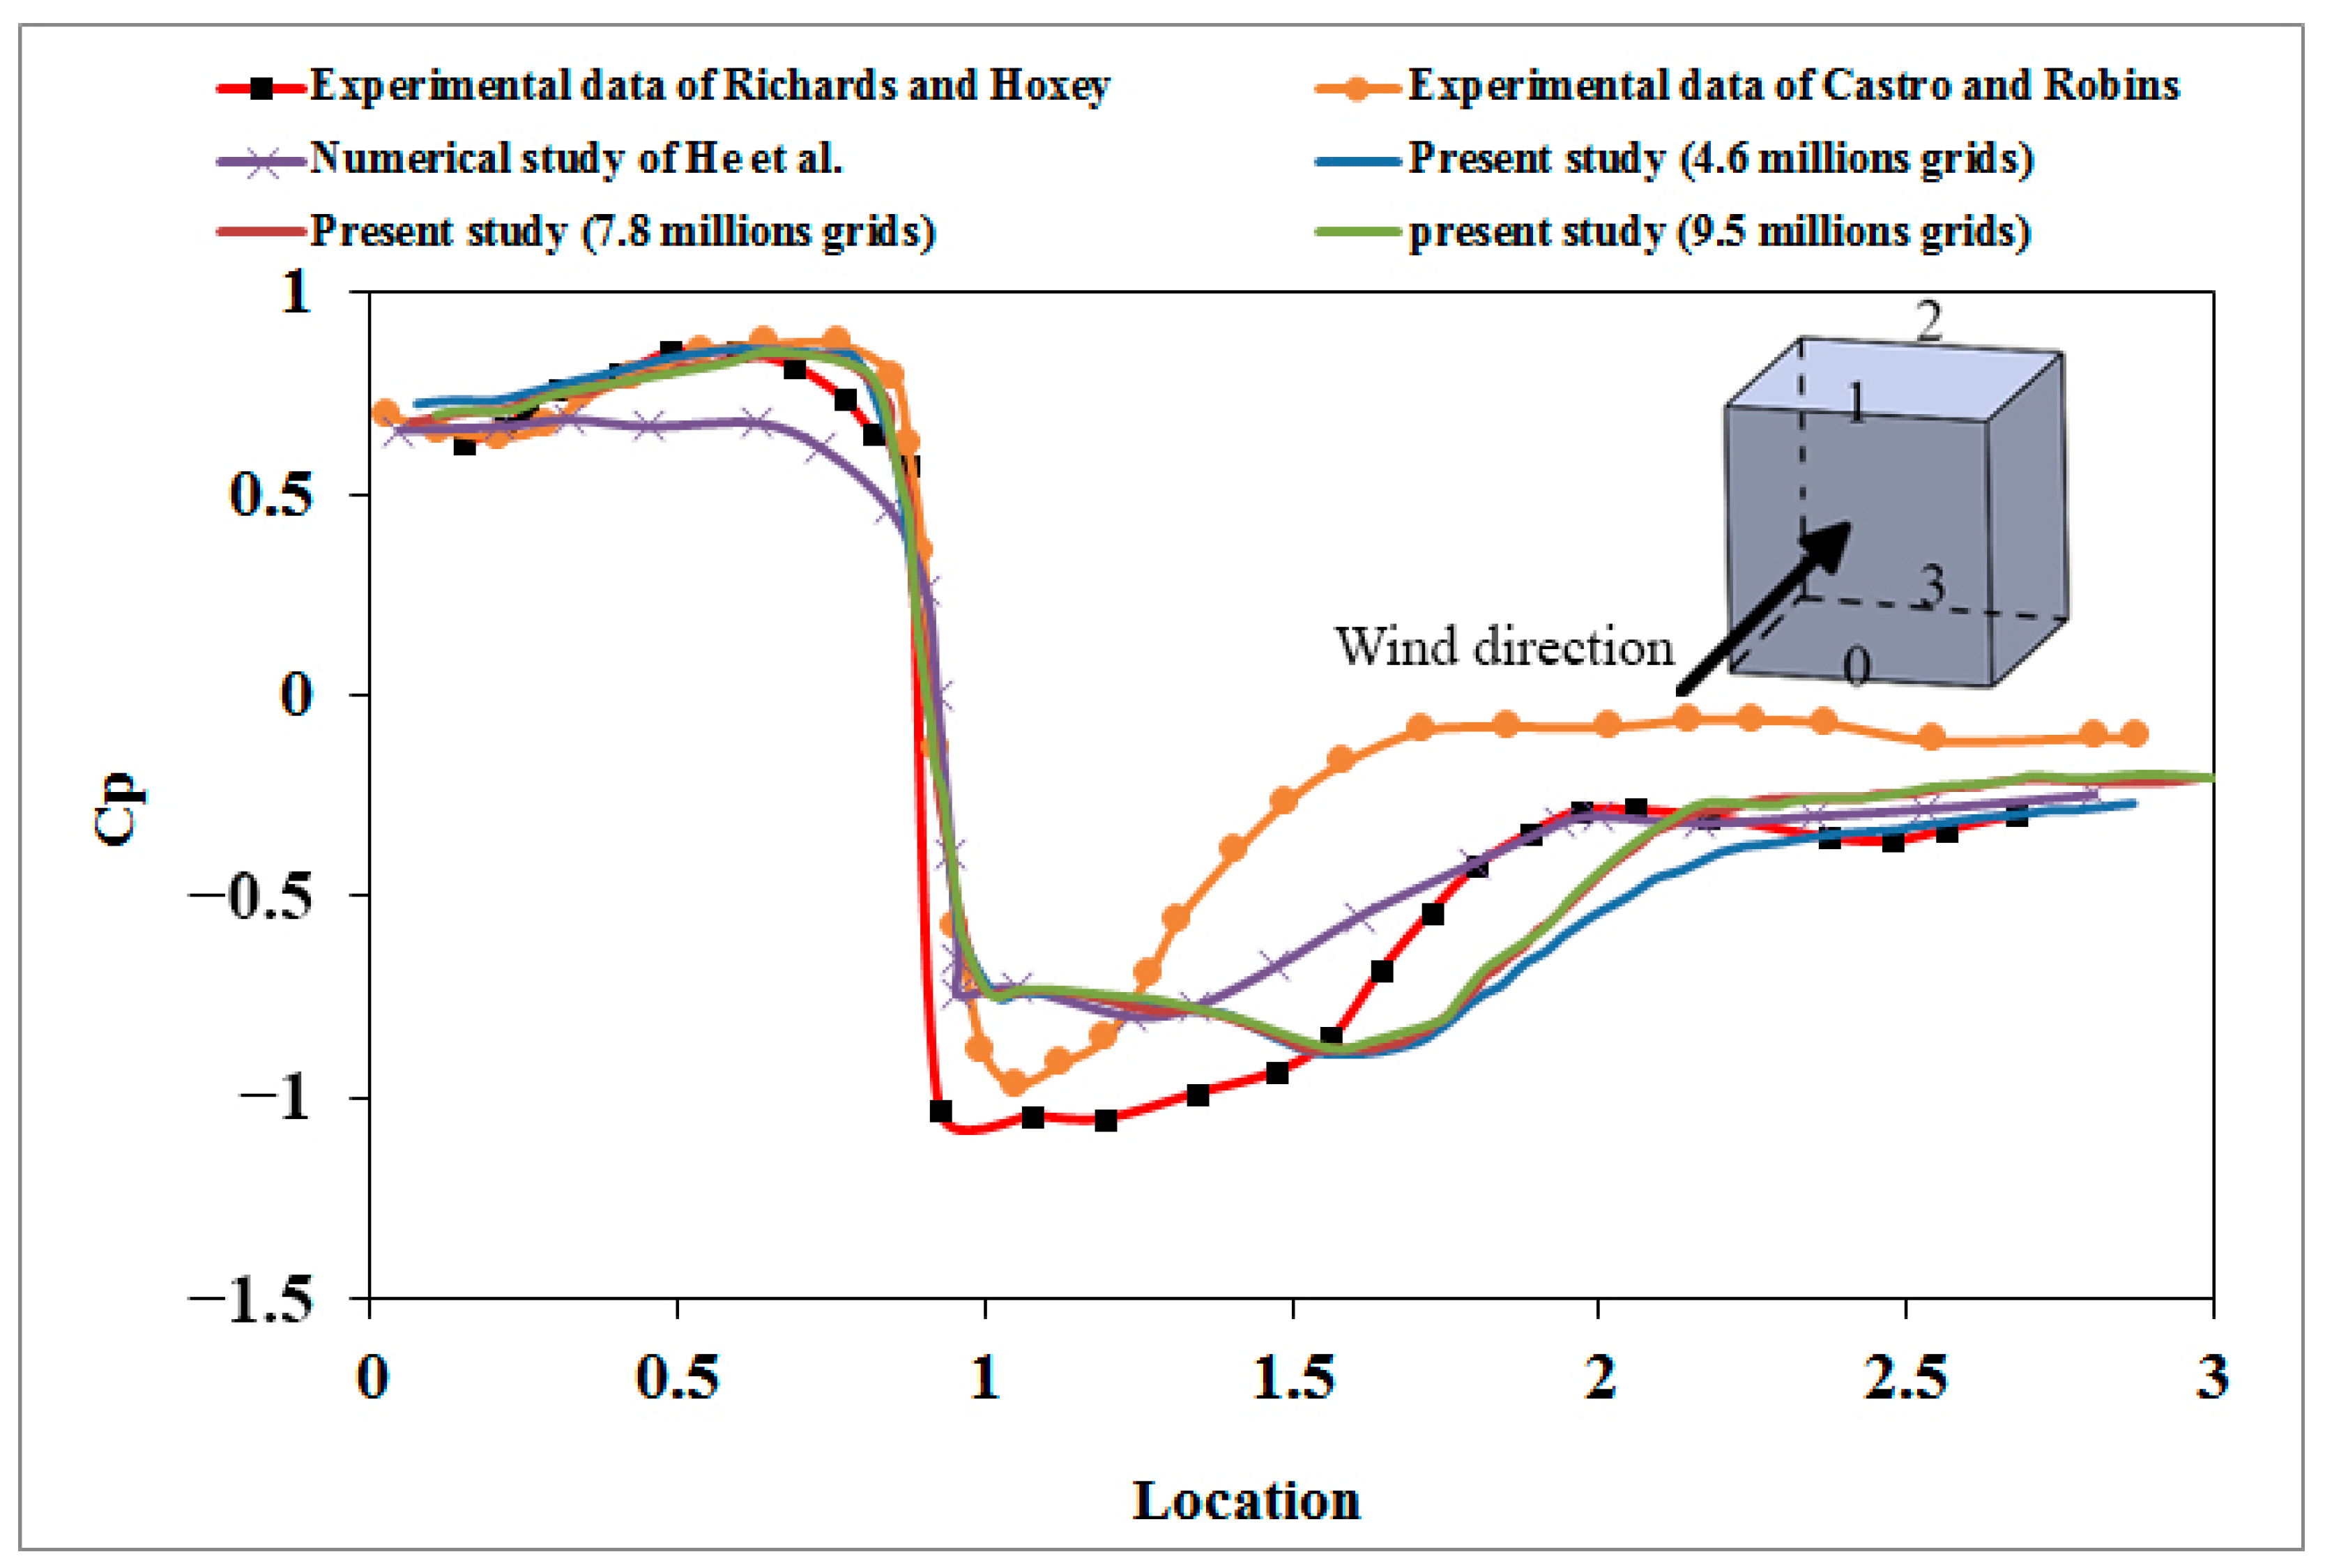
To validate the numerical model, a detailed comparison between the mean pressure coefficients of the present study and two sets of experimental measurements and a numerical simulation is made and shown in Figure 2. The first experimental investigation is of Richards and Hoxey [28,50]. They measured the pressure along the vertical and horizontal centrelines of the Silsoe cube. The second empirical study used to validate the current numerical simulation is Castro and Robins [51] on testing the irrotational and sheared turbulent flows around a cube. In addition, the numerical study on interactions between bushfires, wind, and building structure, conducted by He et al. [27], is used as part of our verification presented in Figure 2. In their study, He and his co-authors [27] modeled the pressure coefficient distribution around a building under no-fire conditions and compared their findings with other experimental studies.
It is worth noting that the validation of the numerical model is performed in the absence of the fire effect by comparing the results to those of the full-scale Silsoe cubic building calculated by Richards and Hoxey [50]. As the Eddy Dissipation Concept (EDC) is mainly regulated by turbulent mixing, the characteristics of the fire dynamic are tightly linked with the building aerodynamics. Therefore, the pressure distribution along the building in a no-fire scenario is an applicable gauge indicating the accuracy and validity of the numerical findings. As seen, in Figure 2, the results of the presented model and experimental published data are consistent, and an acceptable agreement is observed. The maximum error is accrued in location 1.25, which is about 18%.
The grid independence study is conducted for three structure meshes of 4,600,000, 7,800,000, and 9,500,000 into the domain. The results indicate that increasing the number of the grid cells initially leads to an increase in the mean pressure coefficient while a further increase in the number of cells marginally affects the temperature profile.
Another comparison between the present study and Morvan [52] is also made to validate the thermal phase of the present investigation, which is presented in Table 1. In the table, the flame height for three different wind velocities is presented. As seen, the present results are considerably close to the study of Morvan [52] with a maximum error of 8%.
5. Result and Discussion
The present study investigated the simulated effect of terrain slope at a dynamically changing wind-field on a stationary source of fire, representing a line fire in WUI configuration. The simulations investigated the time-dependent (transient) fire behavior, from the ignition time to the steady state condition, that could be expected on an idealized building.
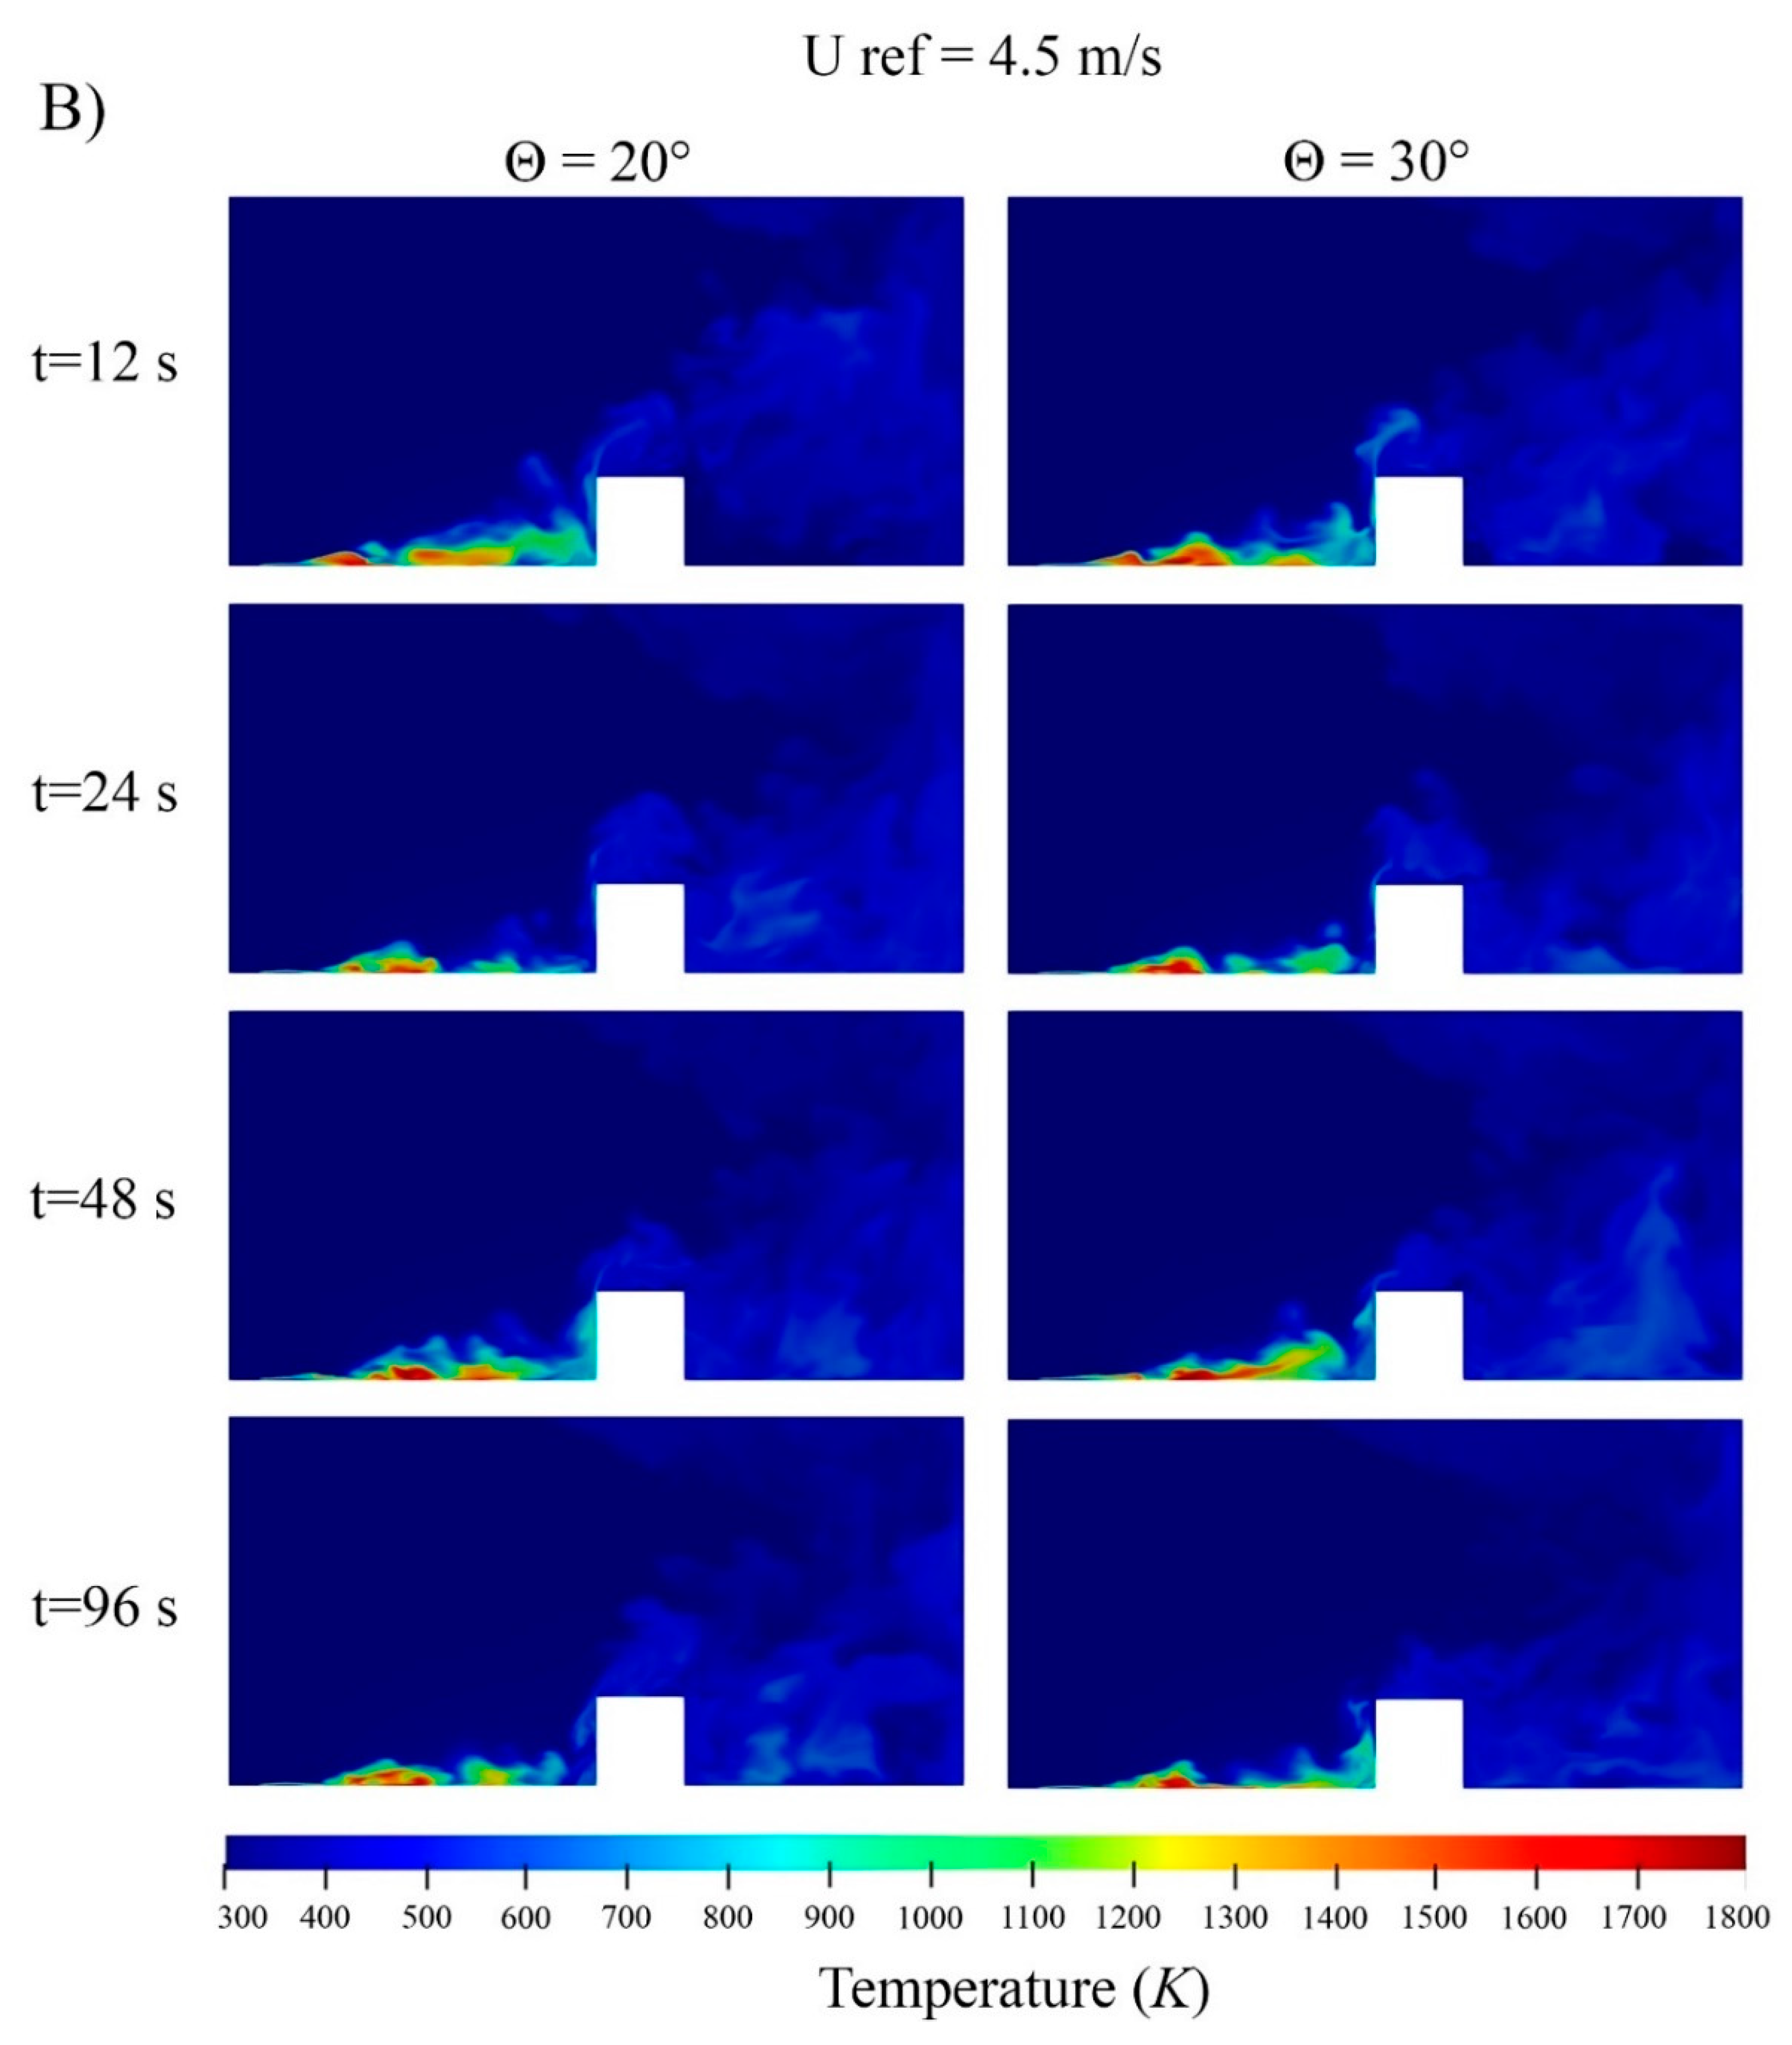
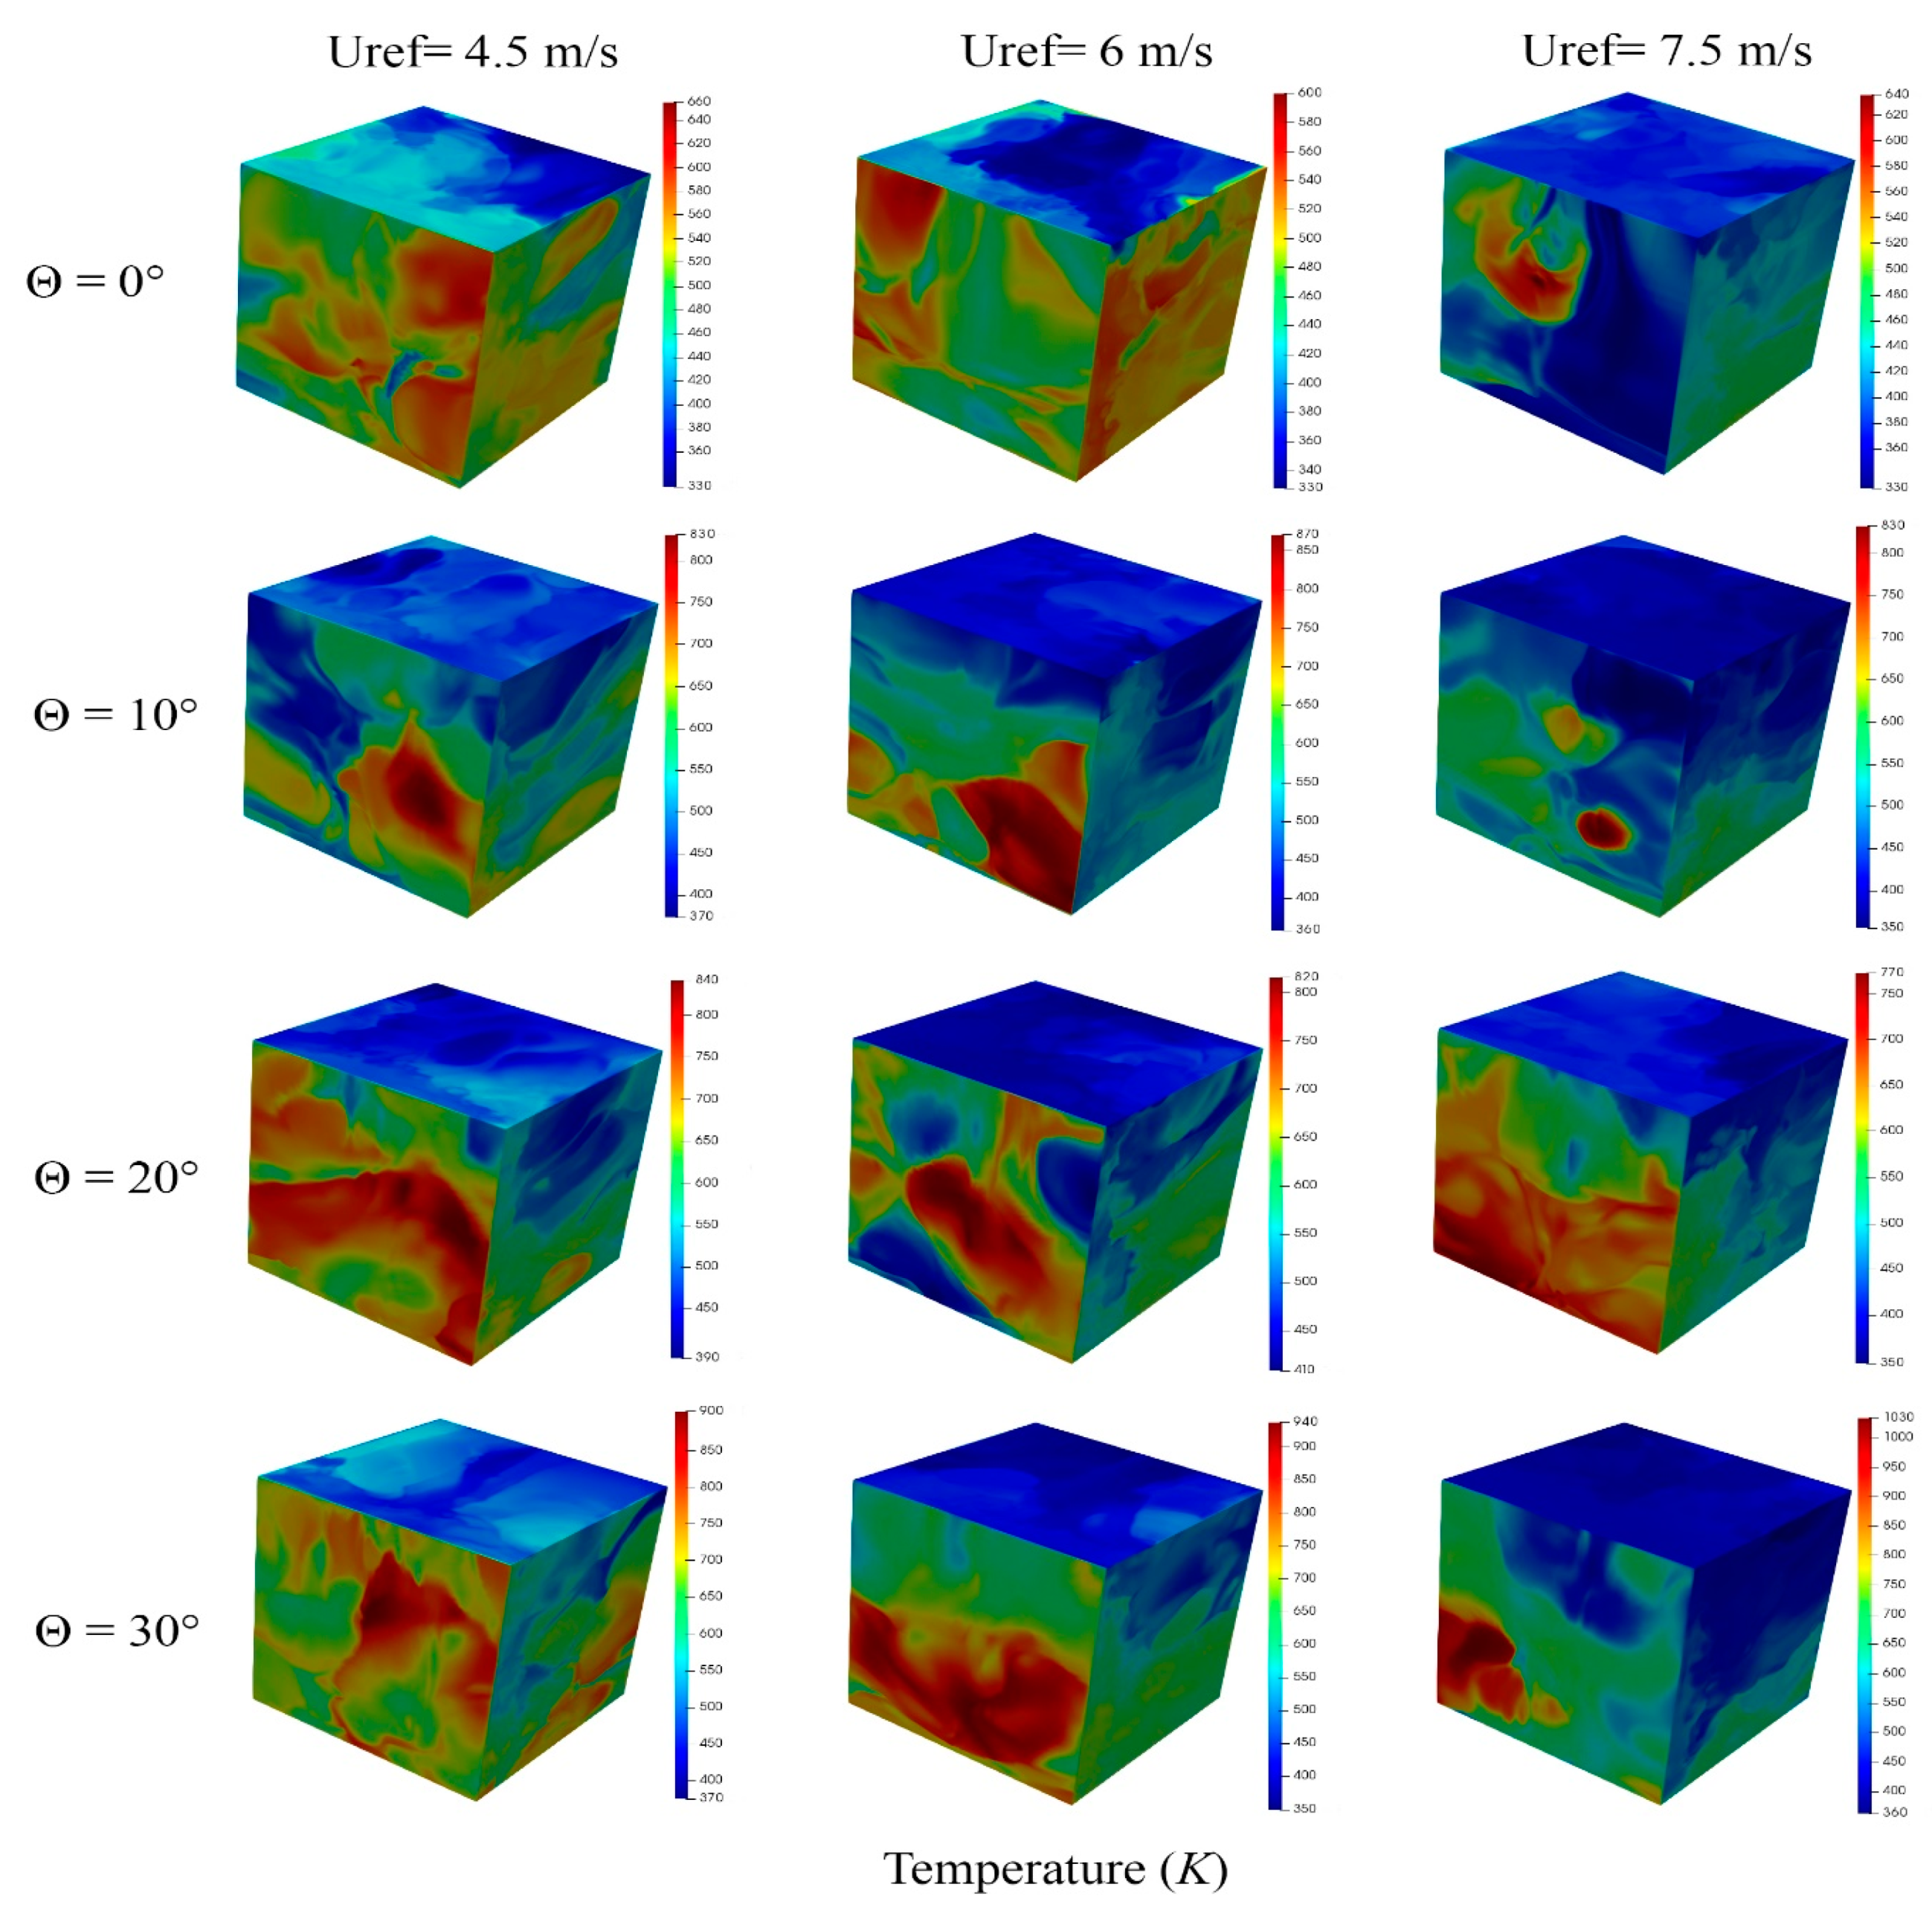
Figure 3 presents the effect of terrain slope on temperature distribution caused by the fire bed in the domain at Uref = 4.5, 6, and 7.5 m/s. As can be seen in this figure, by increasing the terrain slope, the flame tilt angle caused by buoyancy force increases, and the temperature near the building goes up. This is mainly due to the generation of a component of the buoyancy force in the cases with higher terrain slope, which intensifies the tilt angle and ends up having a higher flame temperature closer to the ground. Another parameter that enhances the flame tilt angle is a higher wind velocity. Combining the effect of terrain slope and wind velocity results in a higher temperature in the vicinity of the building structure in these scenarios. The higher flame tilt angle, caused by the aforementioned reasons, the lower the distance between the flame and the building structure. Looking at the temperature distribution, it can be concluded that the buildings at the up-slope terrains are at higher risk of wildfire damages.
The terrain slope and wind velocity parameters which cause the flame to become tilted counteract each other if the building is being built on a down-slope terrain.
Looking at the results presented in Figure 3 in more detail, the flames are reach a steady state after the first 12 s of ignition. From 12 s to 96 s at all set slopes and reference velocities, the flame fluctuates due to the changing in the density of the air in the vicinity of the flame, which is caused by convection heat transfer. The denser air (cold air) is replaced with the lighter air (hot air) and makes a circulation in the downstream. This is mostly the reason behind the fluctuated movement of the flame.
One of the important parameters which plays a key role in fire spread is the flame tilt angle [53]. Figure 3 emphasizes two aspects associated with the increasing flame tilt angle, namely, terrain slope and wind velocity.
It is evident that the presence of buildings on an upslope terrain results in a higher altitude from the sea level.
On the one hand, it is known that the buoyancy force results in having higher temperatures at higher altitudes above the flame bed because of the lower density of the hot air compared with the cold air. On the other hand, as it is discussed, the up-slope terrain leads to an increase in the flame tilt angle toward to the building.
Given the mentioned facts, structures built on the positive inclined terrains will be at higher risk of damage caused by fire intensity compared to the equivalents placed on the flat ground or down-sloped terrain.
Wind velocity is also another reason for increasing flame tilt angle. The pressure drops between the upstream before the flame and downstream after the flame, resulting in making the flame positioned towards the wind direction, and this creates a higher temperature field downstream of the fire.
The incident radiation heat rate on the building surface for three different reference velocities of 4.5, 6, and 7.5 m/s and a terrain slope from 0 to 30° is shown in Figure 4. As can be observed, by increasing the terrain slope, the absorbed heat rate by the building surface increases. This is due to the increase in the flame tilt angle, the subsequent increase in the view factor between the flame source and the building surface, and, finally, the increase in the radiation heat transfer. The incident radiation heat rate on the building located at the downstream of the fire in the terrain with a slope of 30° is equal to about 5800–6100 kW, which is quite higher than that in flat terrain.
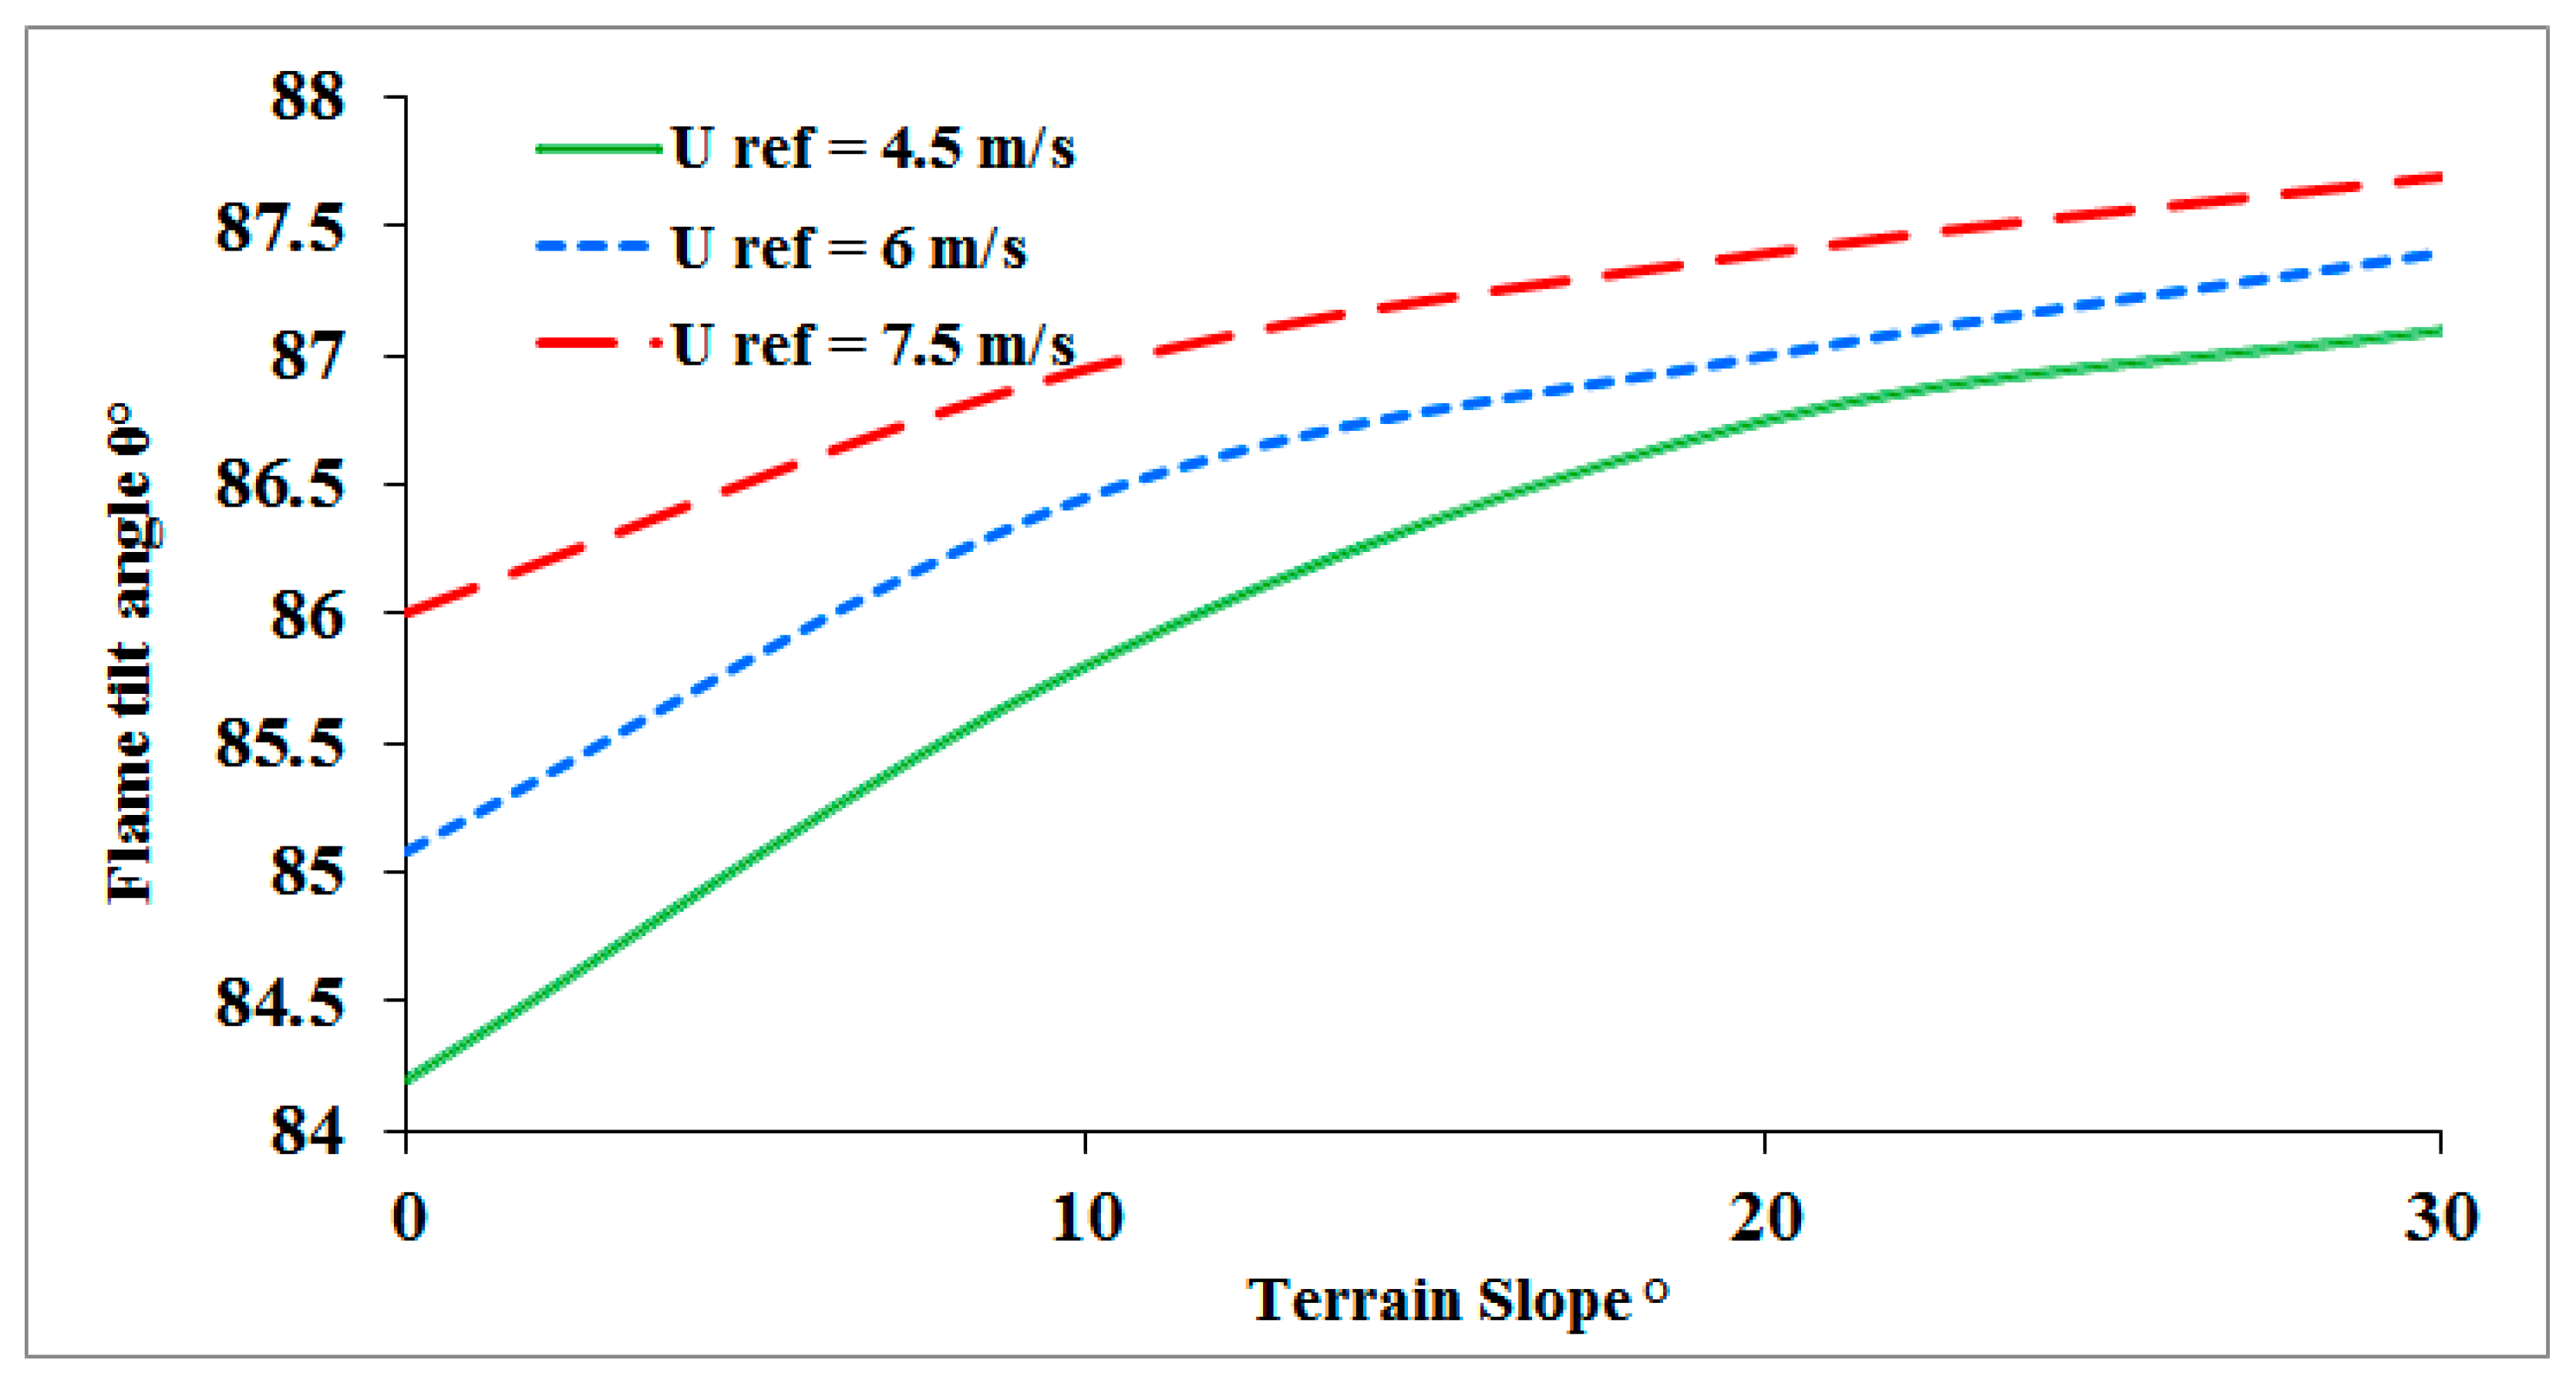
Figure 5 shows the average flame tilt angles for three different reference velocities of 4.5, 6, and 7.5 m/s and a terrain slope from 0 to 30°. The flame tilt angles are obtained using temperature contours. It is defined as the angle between the normal to the ground and the intersection of the flame axis and the front of the isotherm curve [53]. As can be seen, the average flame tilt angles for Uref = 4.5, 6, and 7.5 m/s and terrain slope 0°, 10°, 20°, and 30° are shown in Figure 5, aligned with the trend observed in Figure 3.
By increasing the terrain slope and reference velocities correspondent with the wind intensity, the flame tilt angle increases. Evidently, the difference between the flame tilt angles of each curve decreases with the increasing terrain slope. On the other hand, the sharper the terrain slope, the lower the effect of Uref enhancement on the increase in flame tilt angle will be. This is due to the decrease in the Ux component of wind velocity with the increase in terrain slope.
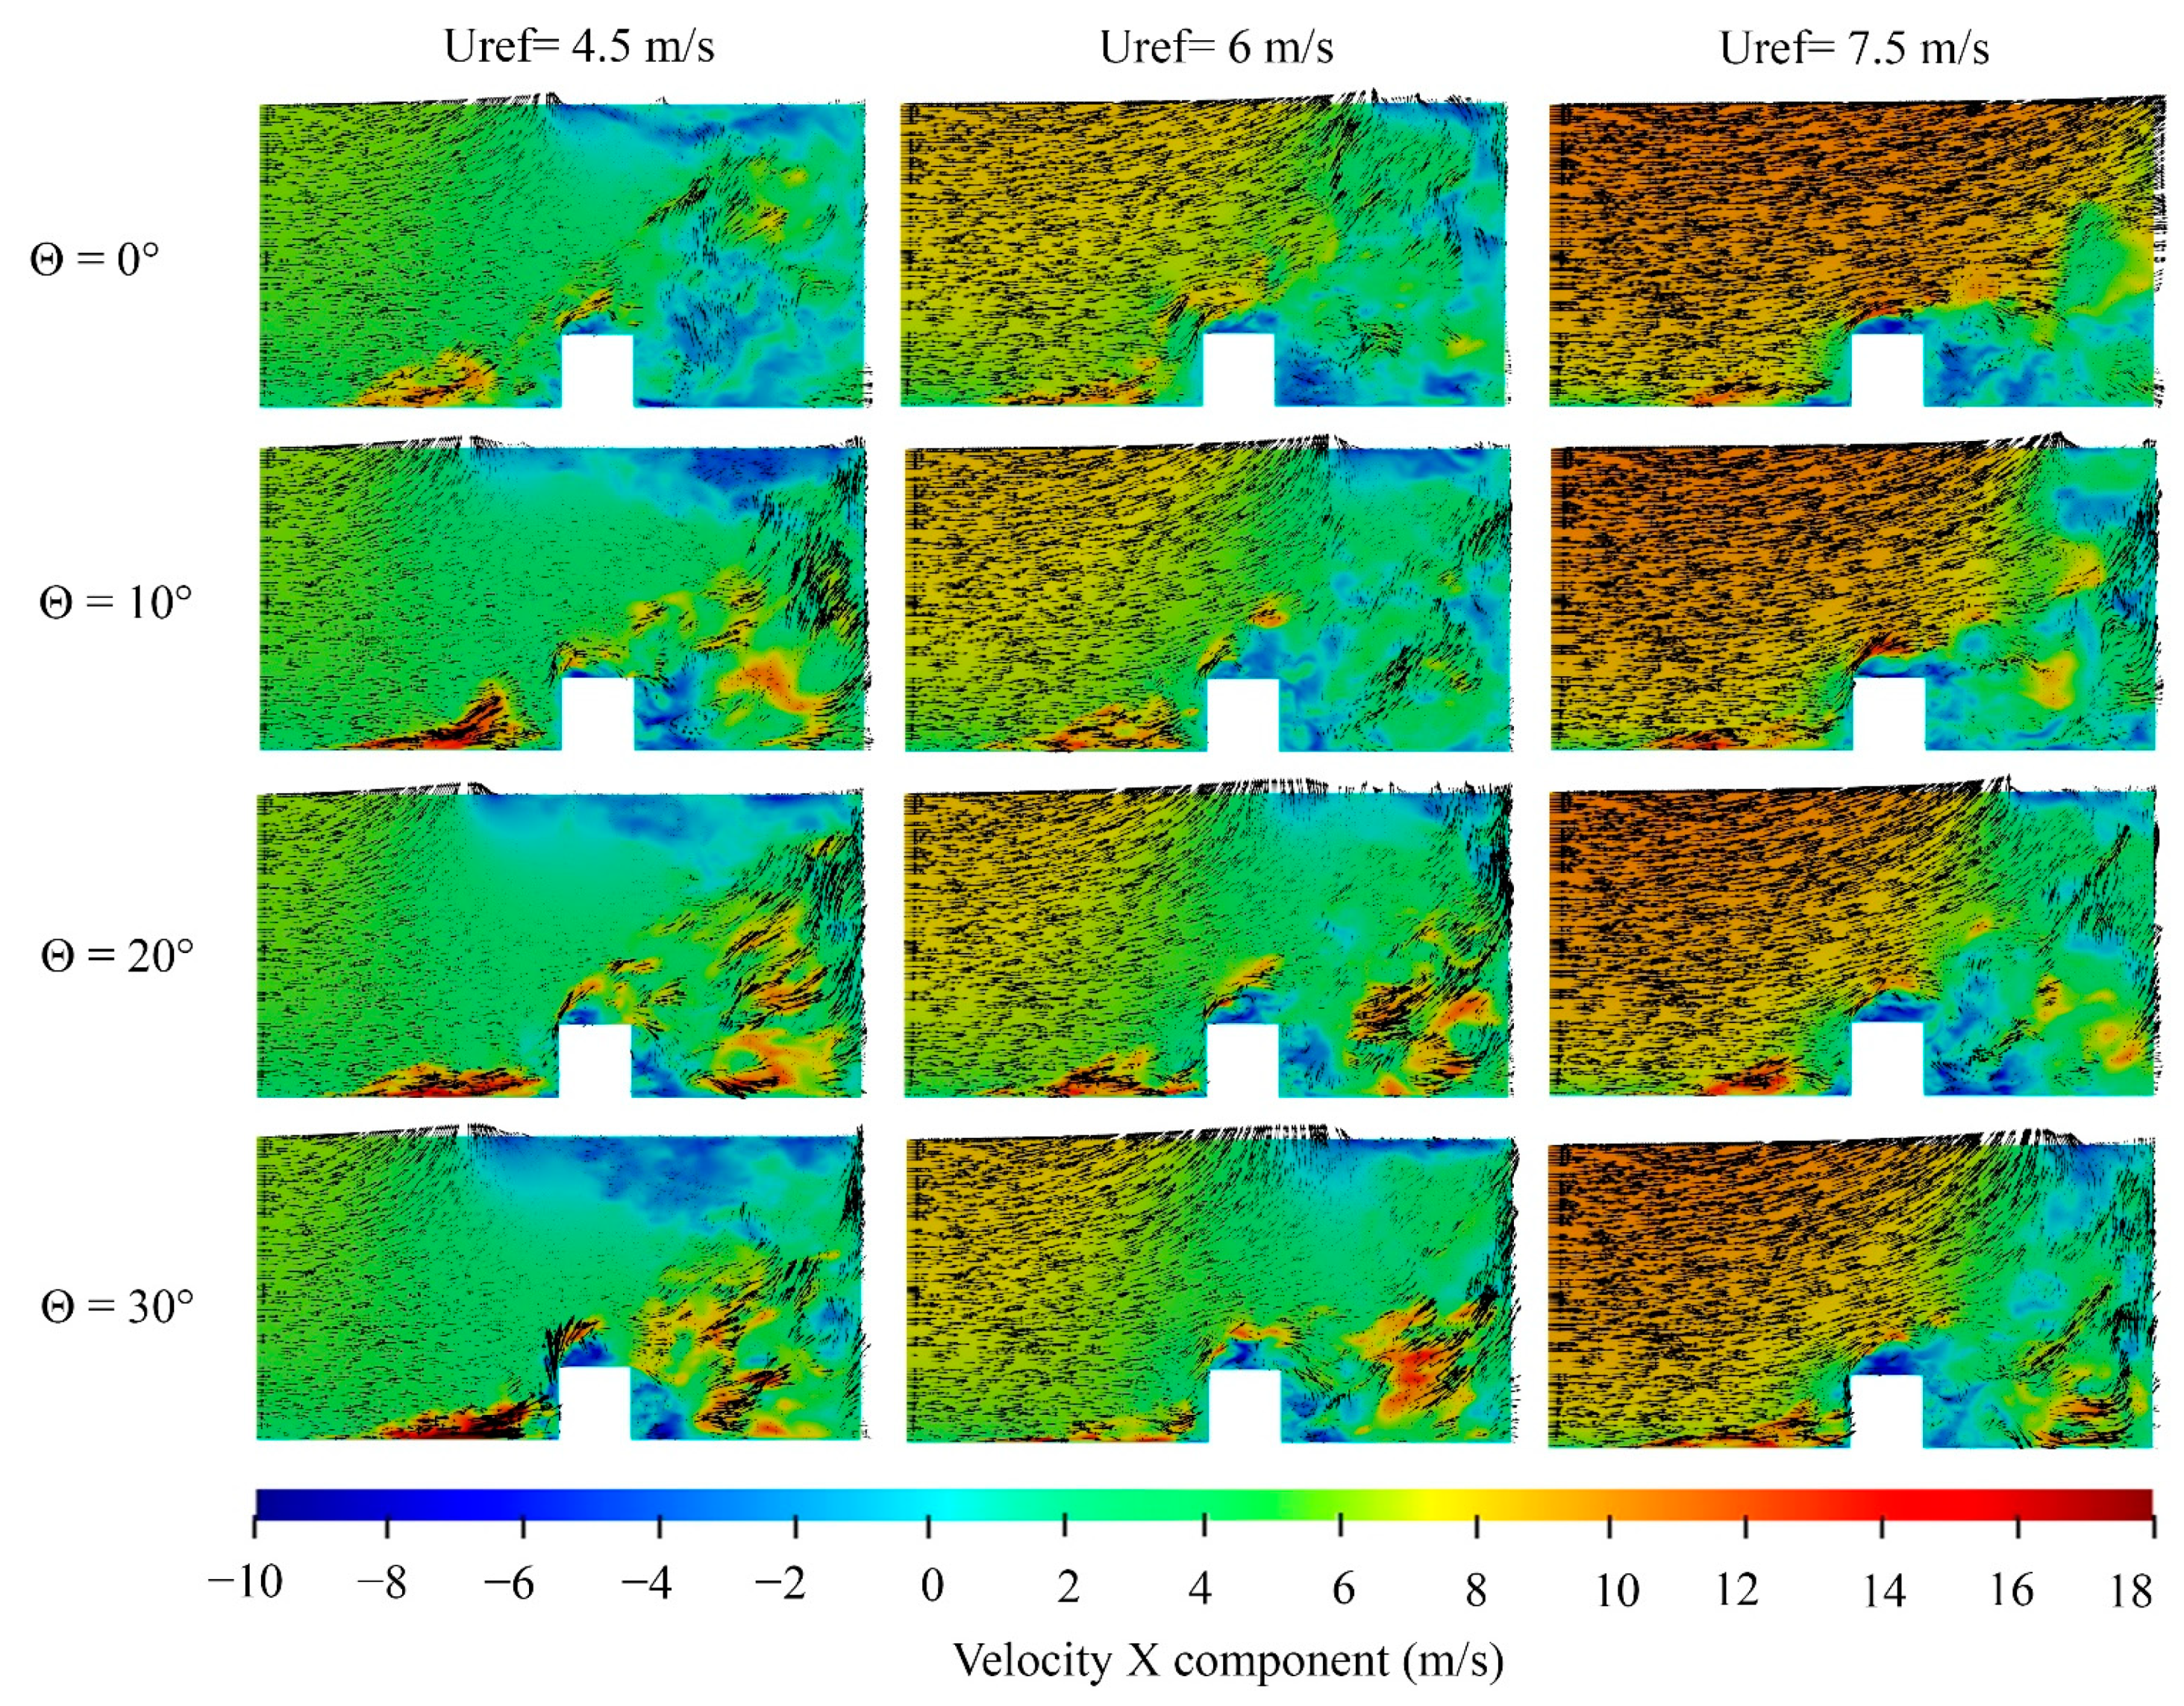
Figure 6 shows the contours of vertical transects of instantaneous streamwise velocity component (Ux = velocity component in X direction) and corresponding velocity vectors on the terrain without slope (θ = 0) and three inclined terrains (θ = 10, 20 and 30°) for various reference velocities, Uref = 4.5, 6, and 7.5 m/s. As shown, the flame is tilted windward downstream of the fire. By increasing wind velocity, the tilt angle is also increased. The main reason behind this observed trend is having a low-pressure region behind the fire bed which is created by the air entering the domain. This accelerates the fire plume downstream of the fire bed.
The non-uniform region with a random movement of the fire plume can be observed in Figure 6. It is caused due to the lack of balance between buoyancy force and inertial wind flow from upstream toward to the downstream of the domain. As can be seen, by time, the fire–ground attachment area is extended by the fluctuating behavior of the fire plume. Downstream of the fire, behind the building, a recirculation region as a result of the reverse flow can be seen. This is due to having a pressure drop and wake as well as a buoyant instability [54] phenomenon which leads to the creation of a higher temperature air region behind the building. The above phenomenon increases with the increment in the terrain slope due to the increase in the buoyant instability as a result of changes in the buoyancy force direction.
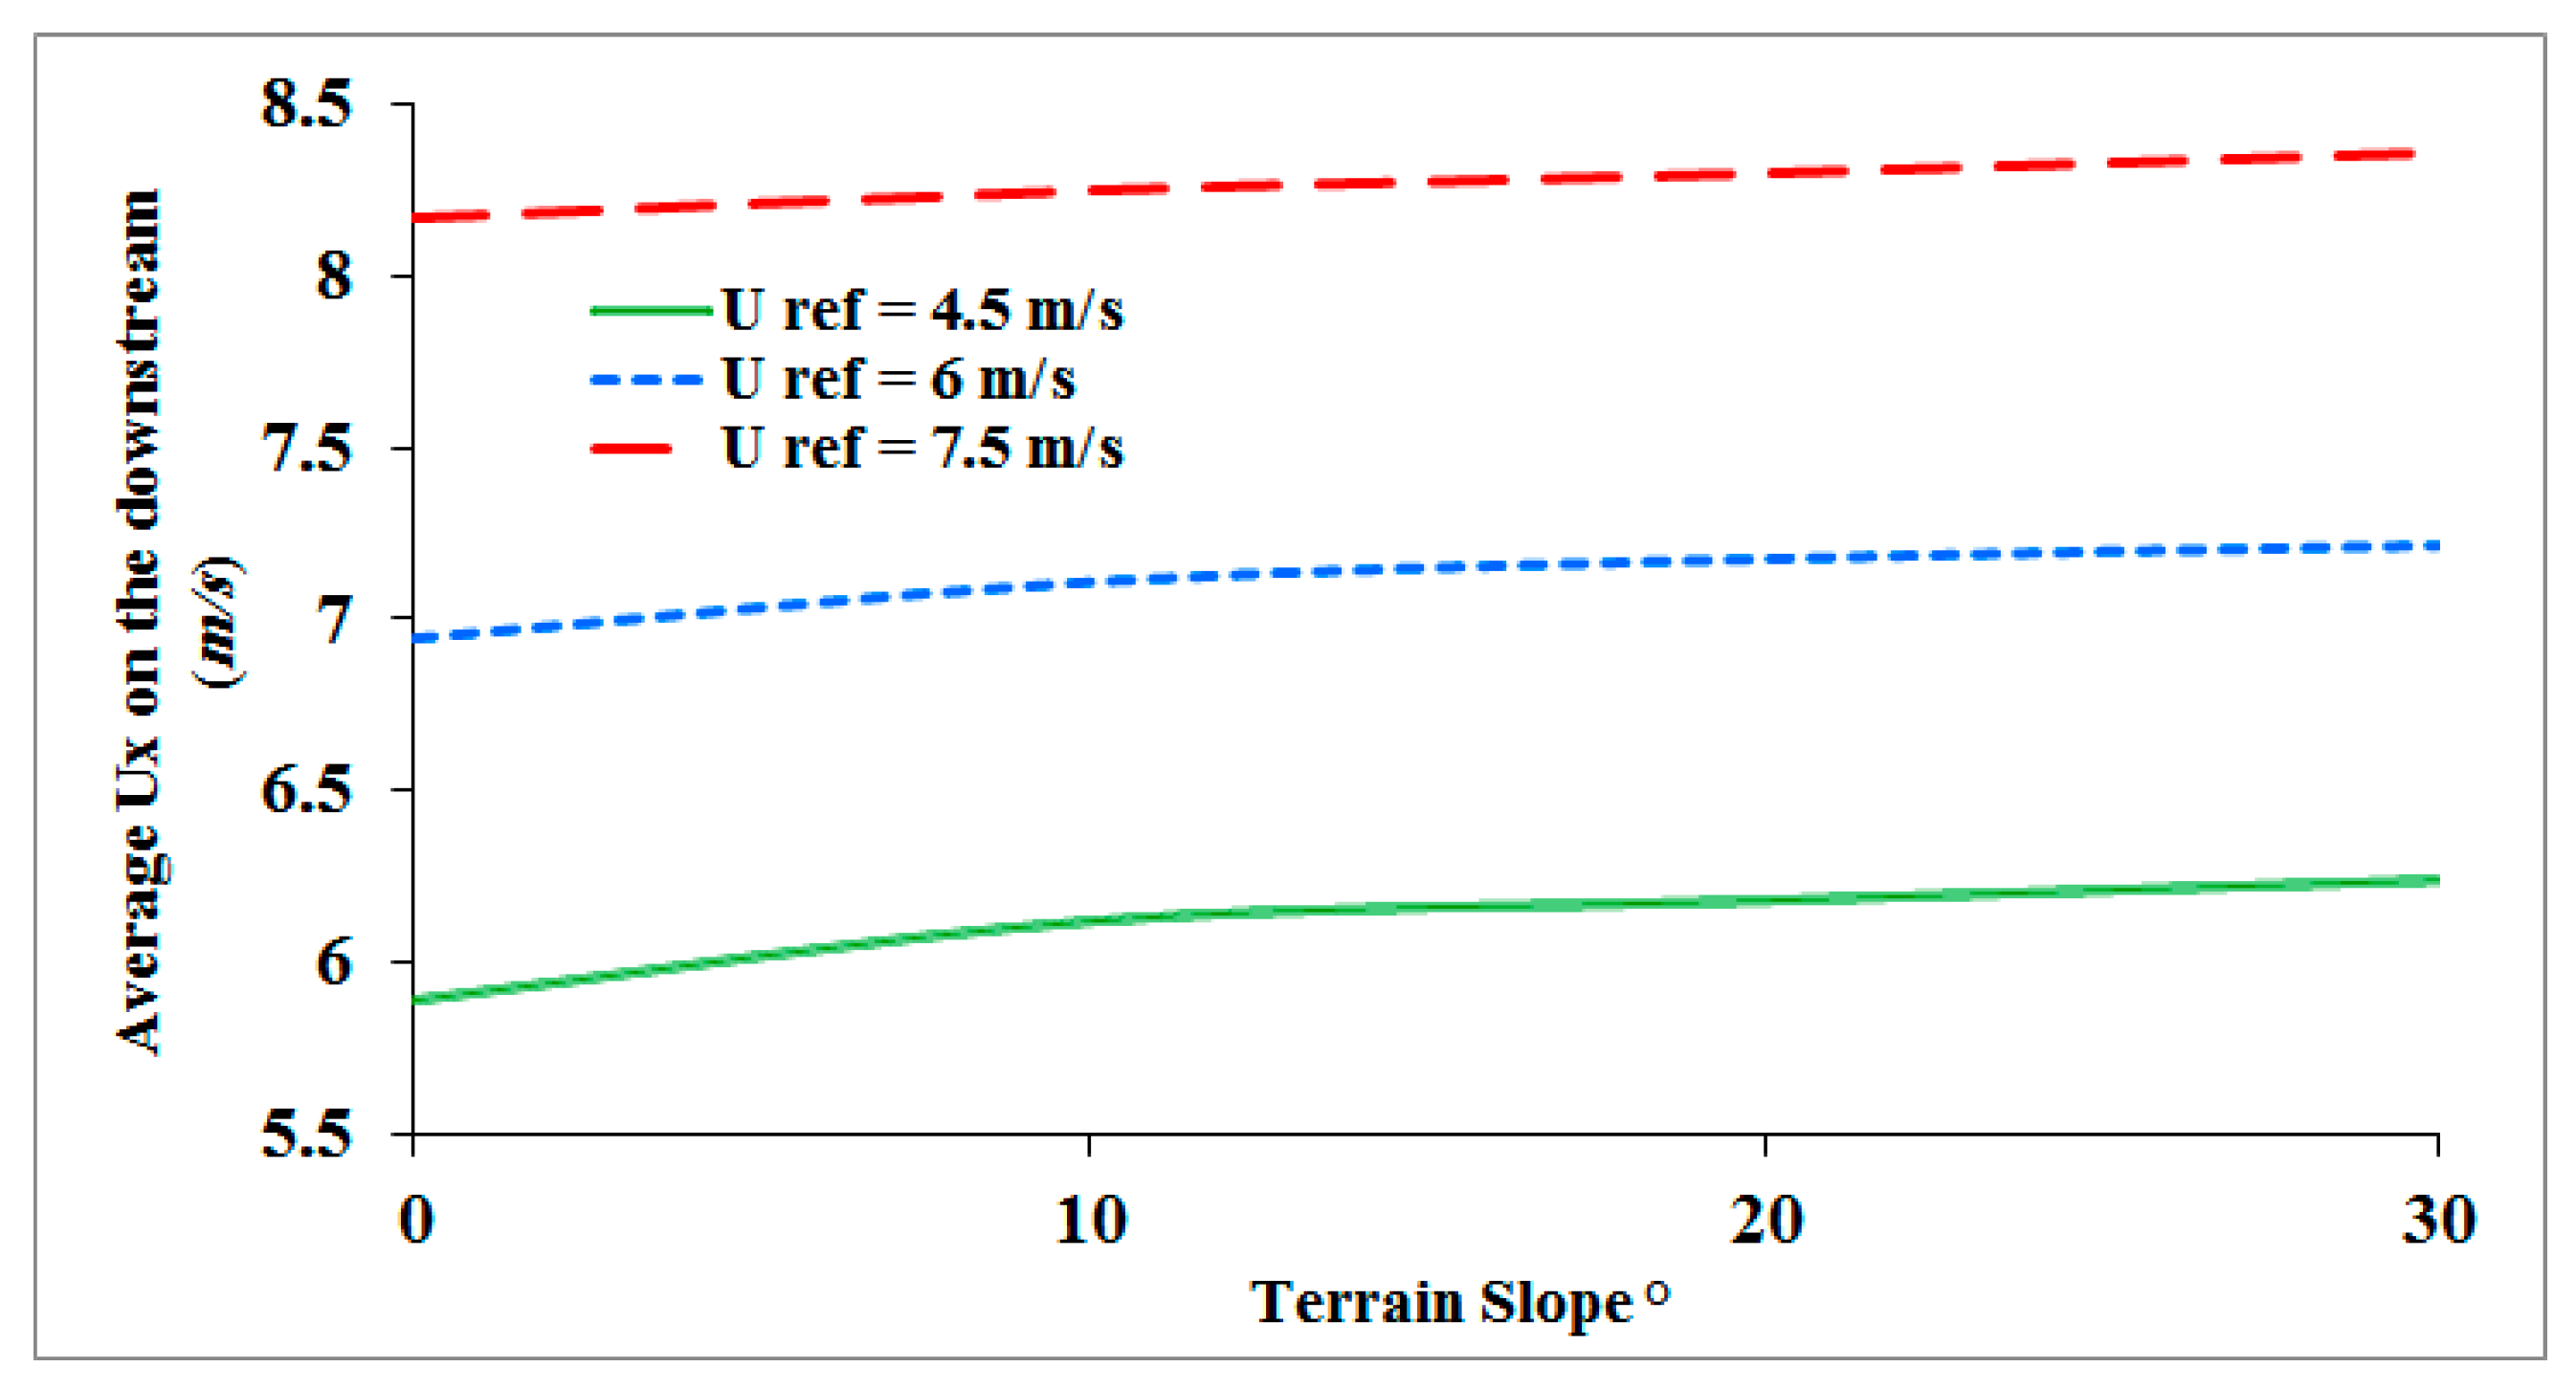
Figure 7 demonstrates the average vertical component of flow velocity downstream behind the flame versus the terrain slope for three different Uref = 4.5, 6, and 7.5 m/s. Figure 7’s trend is aligned with the findings presented in Figure 6. As discussed, having steeper slope leads to leaning the flame towards the downstream and causes an increment in the flow velocity.
The Froude number distribution of the domain for different terrain slopes 0°, 10°, 20°, and 30° and Uref = 4.5, 6, and 7.5 m/s are shown in Figure 8. The dimensionless Froude number can be used to specify the ratio of the inertial force and thermal buoyancy in fire [55]. The Froude number is defined in Equation (9) [56,57]:
where g is the gravity acceleration, and Lw is equal to the width of the fire bed perpendicular to the wind. The effect of slope on the Froude number can be seen in the air flow velocities’ variation corresponding to the fire plume, which depends on the air temperature.
As can be seen, increasing velocity results in an increase in the Froude number. In cases with a lower value of Uref, the velocity magnitude of the flow in the fire region is higher than in the other cases due to having velocity components other than the X-direction. By increasing the Uref values, the X-direction of the flow downstream of the fire increases.
Figure 9 shows the contours of temperature distribution on the ground, in the vicinity of the building, and downstream of the fire. As can be seen, the increasing terrain slope leads to an increase in the area with higher temperature toward the building. This is due to the combination of two main parameters: First, the negative pressure gradient increases with the increment of the buoyancy force caused by the upslope terrain, and as a result, the wind enhancement happens.
Given this, in steeper slopes, the Coanda effect [26] increases. In other word, in addition to the wind force, the buoyancy force intensifies the wind velocity and contributes to the Coanda effect, which increases the flame tilt angle and the attachment of the flame to the ground. The second parameter is the increment of view factor between the fire plume and the ground. An increase in the tilt angle increases the view factor, and finally, the radiation heat transfer between the fire flames and the ground increases, which, again, intensifies the temperature.
Above and beyond the increment in the wind reference velocity can contribute to the increase in the higher temperature fields’ length by increasing the tilt angle.
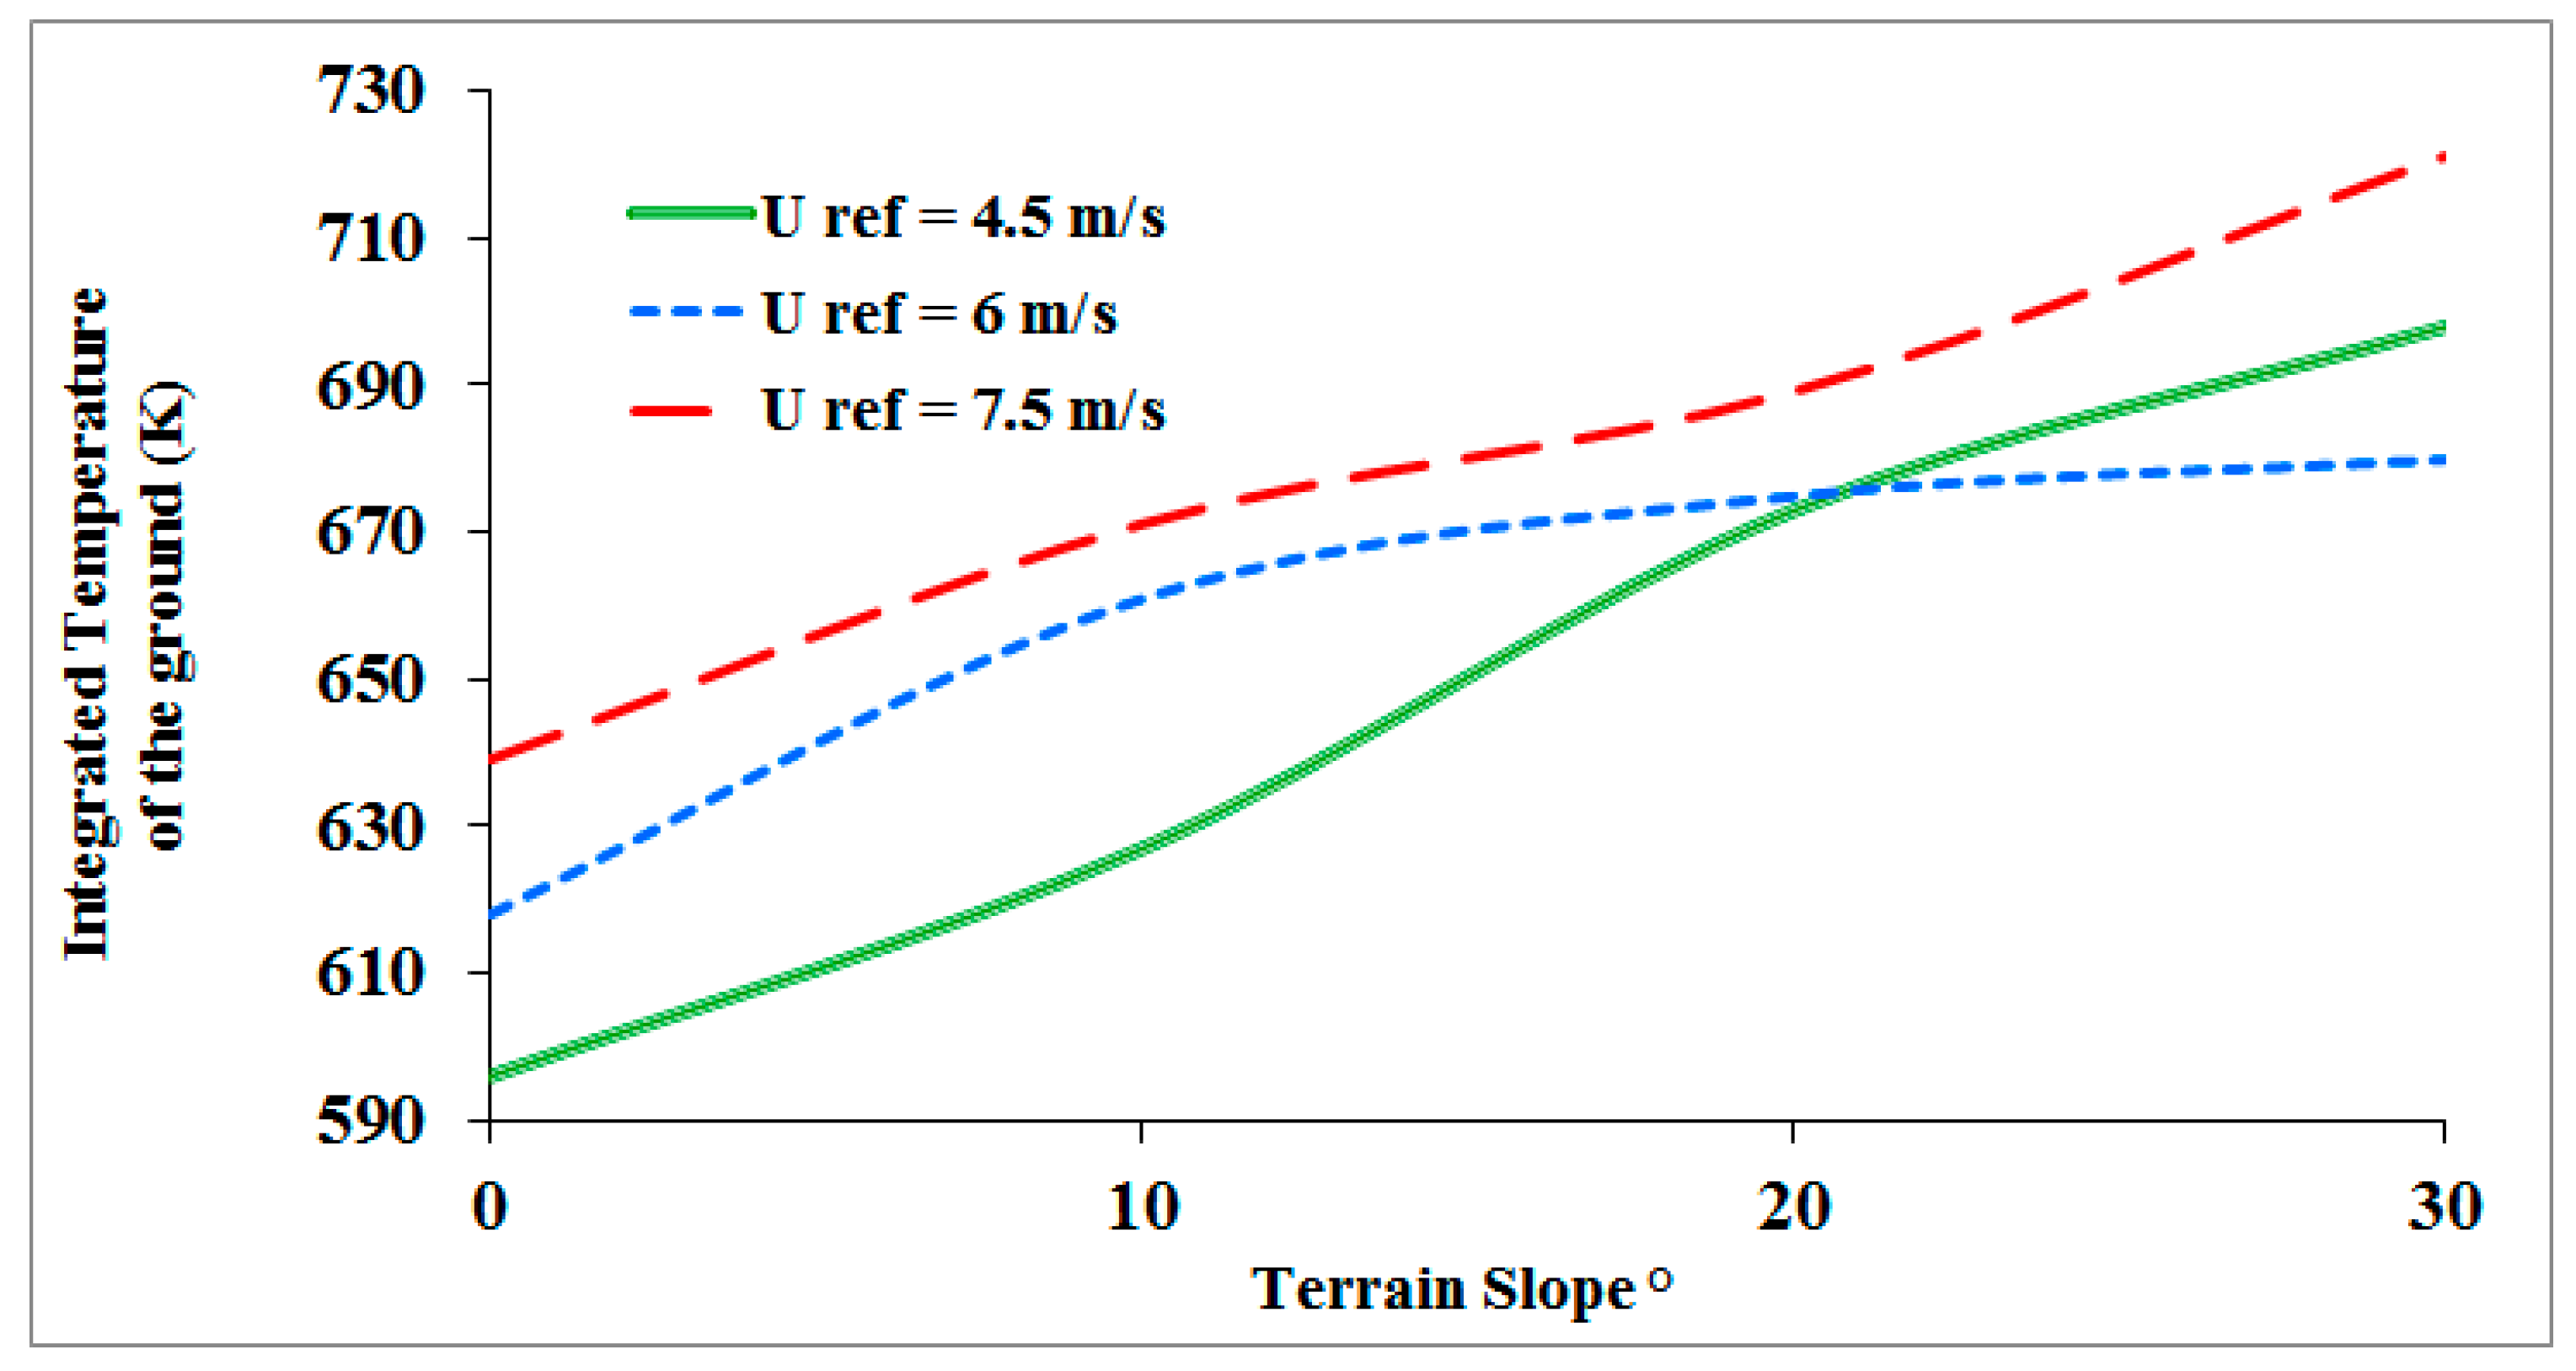
Figure 10 indicates the integrated temperature on the ground and at the domain for three different reference velocities of 4.5, 6, and 7.5 m/s and terrain slopes 0, 10, 20, and 30°. The integrated temperature of the ground is defined as the mean temperature of the whole ground surface. Due to the fact that each point of the surface has a different temperature, the integrated temperature is calculated in these simulations. As seen, the three cases have different trends. This is associated with the fluctuating behavior of the fire plume caused by the imbalance between the buoyancy force and the inertial wind flow. The overall trend observed in the cases shown in Figure 10 is aligned well with Figure 9’s description, in that by increasing the terrain slope and Uref values, larger areas with higher temperatures on the ground are observed. Increasing the terrain slope from 0 to 30° raises the integrated temperature on the ground by 16%, 10%, and 13% for the cases with Uref = 4.5, 6, and 7.5 m/s, respectively. Looking at Figure 10 in more detail, there is no linear relation between the terrain slope and the integrated temperature of the ground, and it can especially be seen that in slopes more than 20°, the value of ground temperature for the case with Uref = 4.5 m/s is more than that of the case with Uref = 6 m/s. However, overall, the Uref values and the integrated temperature of the ground have a direct relation.
Shown in Figure 11 is the temperature distribution at the surface of the building for different terrain slopes and reference velocities. Quite obviously, the front surface of the building has the highest temperature; this is due to having the highest view factor for the radiation heat transfer from the fire source. By increasing the terrain slope, the maximum temperature on the building surface increases. The random appearance of the provided contours is caused by instability between the buoyancy force and inertial wind flow, which results in a turbulent flame.
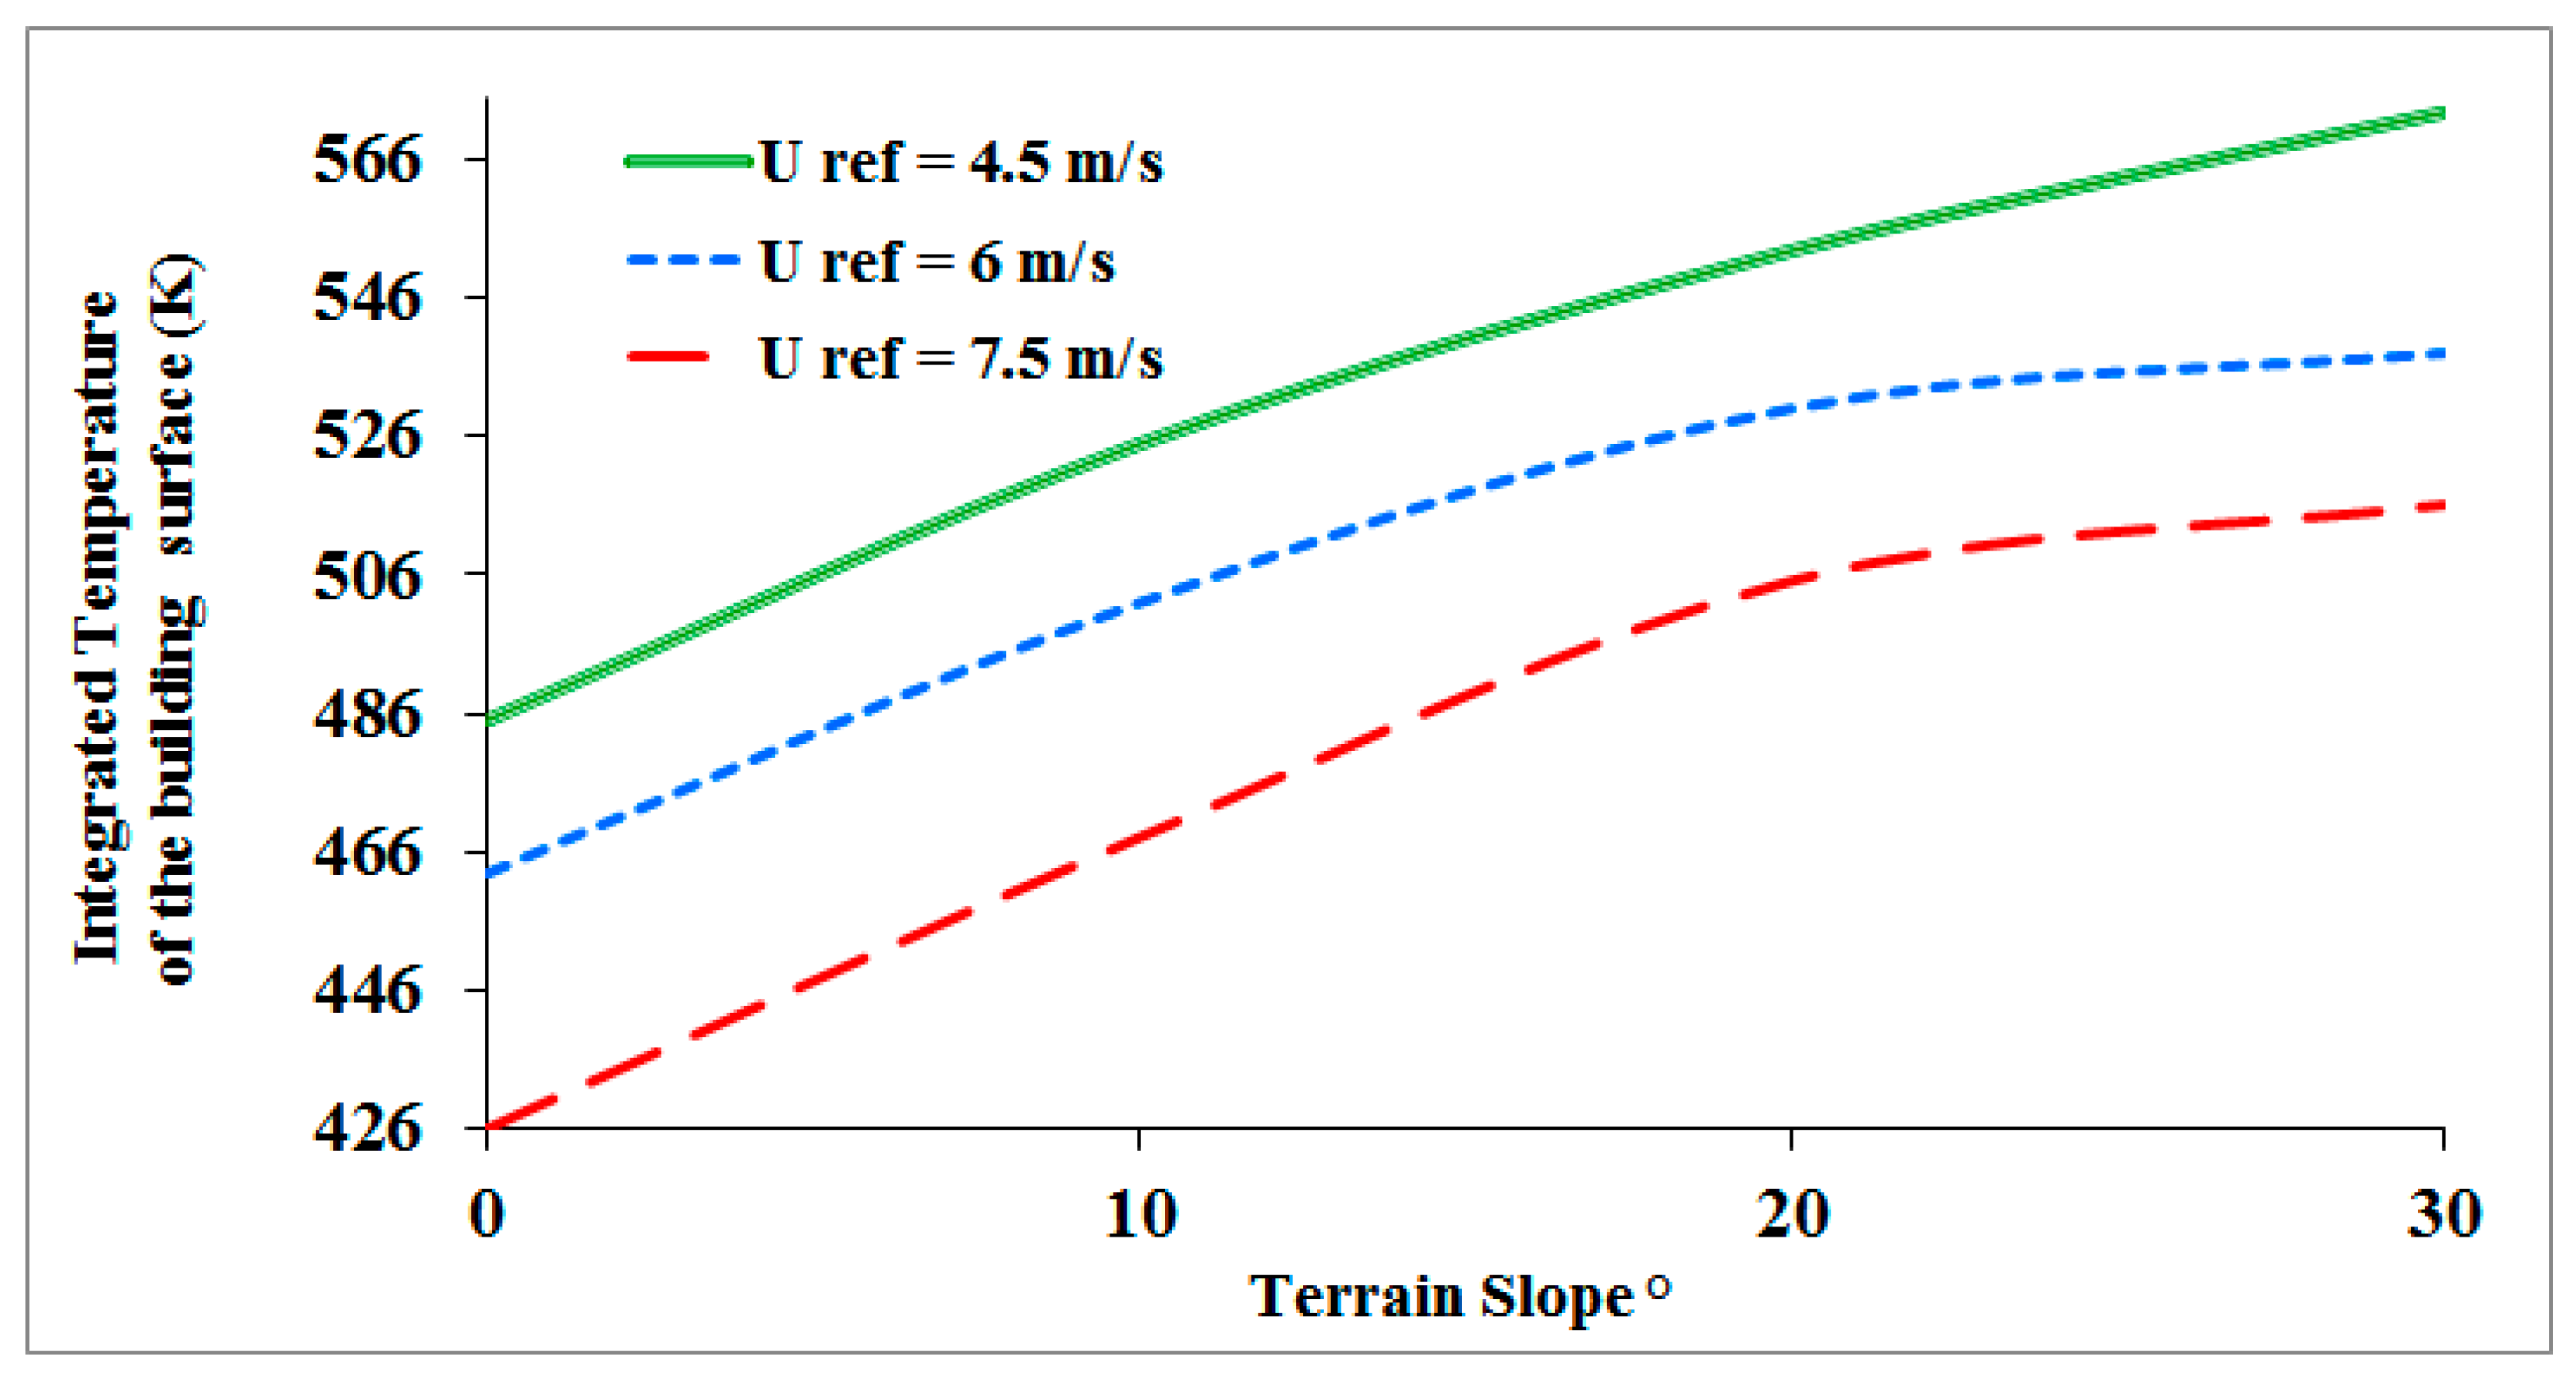
The graph of the integrated temperature on the building surface for Uref = 4.5, 6, and 7.5 m/s and terrain slope 0°, 10°, 20°, and 30° is shown in Figure 12, and it is calculated in the same way as before, so that the integrated temperature is defined as the mean temperature of the whole surface. Increasing the terrain slope from 0 to 30° increases the integrated temperature of the building surface for the cases with Uref = 4.5, 6, and 7.5 m/s by 14%, 15%, and 21%, respectively. Furthermore, by increasing the terrain slope, the slope of the curve decreases. This is associated with the decrease in the derivative of the view factor by increasing the terrain slope.
6. Conclusions
In the present study, the effect of inclined terrain with different slope angles on a wind-driven surface fire and its downstream temperature distribution and velocities in the presence of an idealized building is numerically investigated. The slope angles of 0, 10, 20, and 30° at various wind-fields with reference velocities of 4.5, 6, and 7.5 m/s are considered. All the cases are simulated on a building, considering the factor of ignition time to obtain the wind velocity and terrain slope effects and their interaction with unsteady fire plume. The main outcomes of the study are summarized as follows:
- The simulated results show acceptable agreement with the experimental measurements for cold flow. The maximum error between the numerical obtained data and experimental results is 18%.
- For the inclined fields, corresponding to an increase in the upslope terrain angle, the tilt angle of the flame increases due to the buoyancy force, which results in increasing the temperature at the vicinity of the building.
- The created low-pressure region behind the fire bed accelerates the fire plume downstream of the fire bed and increases the tilt angle.
- Increasing the terrain angle leads to an increase in the area with higher temperature on the ground near the building.
- By raising the terrain slope from 0 to 30°, the integrated temperature on the ground for the cases with Uref = 4.5, 6, and 7.5 m/s increases by 16%, 10%, and 13%, respectively.
- Raising the inclined terrain slope angle from 0 to 30° results in an increase in the integrated temperature of the building surface so that for cases with Uref = 4.5, 6, and 7.5 m/s, the increments are 14%, 15%, and 21%, respectively.
Author Contributions
Methodology, M.G. and A.S.; formal analysis, A.E.-n. and M.G.; writing—original draft preparation, A.E.-n. and M.G.; writing—review and editing, M.G. and A.S.; visualization, A.S., M.G. and A.E.-n.; supervision, M.G. and A.S. All authors have read and agreed to the published version of the manuscript.
Funding
This research received no external funding.
Informed Consent Statement
Not applicable.
Data Availability Statement
The data presented in this study are available on request from the corresponding author.
Acknowledgments
This work was supported by computational resources provided by the Australian Government through University of New South Wales under the National Computational Merit Allocation Scheme.
Conflicts of Interest
The authors declare no conflict of interest.
Nomenclature
| g | acceleration of gravity | Zref | Reference height equal to the building’s height |
| P | Pressure | Uref | Reference velocity |
| T | Temperature | Ym | Mass fraction of species m |
| Lw | Width of the fire bed perpendicular to the wind | Tmax | Maximum temperature of flame |
| ui | Component of velocity in the i direction | h | Enthalpy |
| Yk | Species mass fraction | Prt | Turbulent Prandtl number |
| Sct | turbulent Schmidt number | Dc | Laminar diffusion coefficient |
| R | Gas constant | Fr | Froude number |
| Greek symbols | |||
| υ | Laminar viscosity | Average values of mass conservation | |
| average values of combustion reaction rates | αt | Thermal diffusion coefficient | |
| θ | Terrain slope | a | Acceleration of the flow |
| ϕ | Viscous shear stress | Kronecker delta | |
References
- Abouali, A.; Viegas, D.X.; Raposo, J.R. Analysis of the wind flow and fire spread dynamics over a sloped–ridgeline hill. Combust. Flame 2021, 234, 111724. [Google Scholar] [CrossRef]
- Hu, L. A review of physics and correlations of pool fire behaviour in wind and future challenges. Fire Saf. J. 2017, 91, 41–55. [Google Scholar] [CrossRef]
- Hu, L.; Liu, S.; de Ris, J.L.; Wu, L. A new mathematical quantification of wind-blown flame tilt angle of hydrocarbon pool fires with a new global correlation model. Fuel 2013, 106, 730–736. [Google Scholar] [CrossRef]
- Hu, L.; Wu, L.; Liu, S. Flame length elongation behavior of medium hydrocarbon pool fires in cross air flow. Fuel 2013, 111, 613–620. [Google Scholar] [CrossRef]
- Lam, C.S.; Weckman, E.J. Wind-blown pool fire, Part I: Experimental characterization of the thermal field. Fire Saf. J. 2015, 75, 1–13. [Google Scholar] [CrossRef]
- Hawley, L. Theoretical considerations regarding factors which influence forest fires. J. For. 1926, 24, 756–763. [Google Scholar]
- Sullivan, A.L. Wildland surface fire spread modelling, 1990–2007. 3: Simulation and mathematical analogue models. Int. J. Wildland Fire 2009, 18, 387–403. [Google Scholar] [CrossRef] [Green Version]
- Sullivan, A.L.; Sharples, J.J.; Matthews, S.; Plucinski, M.P. A downslope fire spread correction factor based on landscape-scale fire behaviour. Environ. Model. Softw. 2014, 62, 153–163. [Google Scholar] [CrossRef]
- Butler, B.; Anderson, W.; Catchpole, E. Influence of slope on fire spread rate. In The Fire Environment—Innovations, Management, and Policy, Conference Proceedings, Proceedings of the RMRS-P-46CD, Destin, FL, USA, 26–30 March 2007; US Department of Agriculture, Forest Service, Rocky Mountain Research Station: Fort Collins, CO, USA, 2007; pp. 75–82. [Google Scholar]
- Vega, J.; Jiménez, E.; Dupuy, J.-L.; Linn, R.R. Effects of flame interaction on the rate of spread of heading and suppression fires in shrubland experimental fires. Int. J. Wildland Fire 2012, 21, 950–960. [Google Scholar] [CrossRef]
- Liu, N.; Wu, J.; Chen, H.; Xie, X.; Zhang, L.; Yao, B.; Zhu, J.; Shan, Y. Effect of slope on spread of a linear flame front over a pine needle fuel bed: Experiments and modelling. Int. J. Wildland Fire 2014, 23, 1087–1096. [Google Scholar] [CrossRef]
- Scesa, S. Transfer of Heat by Forced Convection from a Line Combustion Source—The Influence of Atmospheric Stability and Surface Roughness; Forest Service: Washington, DC, USA, 1957.
- Morandini, F.; Silvani, X.; Dupuy, J.-L.; Susset, A. Fire spread across a sloping fuel bed: Flame dynamics and heat transfers. Combust. Flame 2018, 190, 158–170. [Google Scholar] [CrossRef]
- Zhu, P.; Wanga, X.S.; He, Y.P.; Tao, C.F.; Ni, X.M. Flame characteristics and burning rate of small pool fires under downslope and upslope oblique winds. Fuel 2016, 184, 725–734. [Google Scholar] [CrossRef]
- Albini, F.A.; Latham, D.J.; Baughman, R.G. Estimating Upslope Convective Windspeeds for Predicting Wildland Fire Behavior; US Department of Agriculture, Forest Service, Intermountain Forest and Range Experiment Station: Washington, DC, USA, 1982; Volume 257.
- Jackson, P.; Hunt, J. Turbulent wind flow over a low hill. Q. J. R. Meteorol. Soc. 1975, 101, 929–955. [Google Scholar] [CrossRef]
- Hilton, J.; Garg, N. Rapid wind–terrain correction for wildfire simulations. Int. J. Wildland Fire 2021, 30, 410–427. [Google Scholar] [CrossRef]
- Linn, R.R.; Winterkamp, J.L.; Weise, D.R.; Edminster, C. A numerical study of slope and fuel structure effects on coupled wildfire behaviour. Int. J. Wildland Fire 2010, 19, 179–201. [Google Scholar] [CrossRef]
- Clements, C.B.; Seto, D. Observations of fire–atmosphere interactions and near-surface heat transport on a slope. Bound.-Layer Meteorol. 2015, 154, 409–426. [Google Scholar] [CrossRef]
- Sharples, J.J. An overview of mountain meteorological effects relevant to fire behaviour and bushfire risk. Int. J. Wildland Fire 2009, 18, 737–754. [Google Scholar] [CrossRef]
- Mendes-Lopes, J.M.; Ventura, J.M.; Amaral, J.M. Flame characteristics, temperature–time curves, and rate of spread in fires propagating in a bed of Pinus pinaster needles. Int. J. Wildland Fire 2003, 12, 67–84. [Google Scholar] [CrossRef]
- Viegas, D.X. Slope and wind effects on fire propagation. Int. J. Wildland Fire 2004, 13, 143–156. [Google Scholar] [CrossRef]
- Dupuy, J.-L.; Marechal, J.; Portier, D.; Valette, J.-C. The effects of slope and fuel bed width on laboratory fire behaviour. Int. J. Wildland Fire 2011, 20, 272–288. [Google Scholar] [CrossRef]
- Sharples, J.J. Review of formal methodologies for wind–slope correction of wildfire rate of spread. Int. J. Wildland Fire 2008, 17, 179–193. [Google Scholar] [CrossRef]
- Dupuy, J.-L.; Morvan, D. Numerical study of a crown fire spreading toward a fuel break using a multiphase physical model. Int. J. Wildland Fire 2005, 14, 141–151. [Google Scholar] [CrossRef]
- Wu, Y.; Xing, H.; Atkinson, G. Interaction of fire plume with inclined surface. Fire Saf. J. 2000, 35, 391–403. [Google Scholar] [CrossRef]
- He, Y.; Kwok, K.C.S.; Douglas, G.; Razali, I. Numerical investigation of bushfire-wind interaction and its impact on building structure. Fire Saf. Sci. 2011, 10, 1449–1462. [Google Scholar] [CrossRef]
- Richards, P.; Hoxey, R. Pressures on a cubic building—Part 1: Full-scale results. J. Wind Eng. Ind. Aerodyn. 2012, 102, 72–86. [Google Scholar] [CrossRef]
- Hostikka, S.; Mangs, J.; Mikkola, E. Comparison of two and three dimensional simulations of fires at wildland urban interface. Fire Saf. Sci. 2008, 9, 1353–1364. [Google Scholar] [CrossRef] [Green Version]
- Hilton, J.; Leonard, J.; Blanchi, R.; Newnham, G.; Opie, K.; Rucinski, C.; Swedosh, W. Dynamic modelling of radiant heat from wildfires. In Proceedings of the 22nd International Congress on Modelling and Simulation (MODSIM2017), Tasmania, Australia, 3–8 December 2017. [Google Scholar]
- Fryanova, K.; Perminov, V. Impact of forest fires on buildings and structures. Mag. Civil Eng. 2017, 75. [Google Scholar] [CrossRef]
- Mell, W.E.; Manzello, S.L.; Maranghides, A.; Butry, D.; Rehm, R.G. The wildland–urban interface fire problem–current approaches and research needs. Int. J. Wildland Fire 2010, 19, 238–251. [Google Scholar] [CrossRef]
- Debnam, G.; Chow, V.; England, P. AS 3959 Construction of Buildings in Bushfire-Prone Areas–Draft for Public Comment (dr 05060) Review of Calculation Methods and Assumptions; Warrington Fire Research: Sydney, Australia, 2005. [Google Scholar]
- Richards, P.; Norris, S. LES modelling of unsteady flow around the Silsoe cube. J. Wind Eng. Ind. Aerodyn. 2015, 144, 70–78. [Google Scholar] [CrossRef]
- Ghaderi, M.; Ghodrat, M.; Sharples, J.J. LES Simulation of Wind-Driven Wildfire Interaction with Idealized Structures in the Wildland-Urban Interface. Atmosphere 2021, 12, 21. [Google Scholar] [CrossRef]
- Kremer, H.; Schäfer, G. Rates of fuel conversion and heat release in turbulent combustion of methane-air mixtures in tunnel burners. In Symposium (International) on Combustion; Elsevier: Amsterdam, The Netherlands, 1973. [Google Scholar]
- Byram, G.M. Combustion of forest fuels. In Forest Fire: Control and Use; Davis, K.P., Ed.; McGraw-Hill: New York, NY, USA, 1959; pp. 61–89. [Google Scholar]
- Lund, T.S.; Wu, X.; Squires, K.D. Generation of turbulent inflow data for spatially-developing boundary layer simulations. J. Comput. Phys. 1998, 140, 233–258. [Google Scholar] [CrossRef] [Green Version]
- Wu, X. Inflow turbulence generation methods. Annu. Rev. Fluid Mech. 2017, 49, 23–49. [Google Scholar] [CrossRef]
- Bonnet, J.-P.; Delville, J.; Lamballais, E. The Generation of Realistic 3D, Unsteady Inlet Conditions for LES. In Proceedings of the 41st Aerospace Sciences Meeting and Exhibit, Reno, NV, USA, 6–9 January 2003. [Google Scholar]
- Davidson, L. Hybrid LES-RANS: Inlet boundary conditions for flows including recirculation. In Fifth International Symposium on Turbulence and Shear Flow Phenomena; Begel House Inc.: Munich, Germany, 2007. [Google Scholar]
- Tominaga, Y.; Mochida, A.; Yoshie, R.; Kataoka, H.; Nozu, T.; Yoshikawa, M.; Shirasawa, T. AIJ guidelines for practical applications of CFD to pedestrian wind environment around buildings. J. Wind Eng. Ind. Aerodyn. 2008, 96, 1749–1761. [Google Scholar] [CrossRef]
- Launder, B.; Spalding, D. The numerical computation of turbulent flows, Numerical Prediction of Flow. Heat Transf. Turbul. Combust. 1983, 40, 96–116. [Google Scholar]
- Versteeg, H.K.; Malalasekera, W. An Introduction to Computational Fluid Dynamics: The Finite Volume Method; Pearson Education: London, UK, 2007. [Google Scholar]
- Frangieh, N.; Accary, G.; Morvan, D.; Méradji, S.; Bessonov, O. Wildfires front dynamics: 3D structures and intensity at small and large scales. Combust. Flame 2020, 211, 54–67. [Google Scholar] [CrossRef]
- Maragkos, G.; Rauwoens, P.; Wang, Y.; Merci, B. Large eddy simulations of the flow in the near-field region of a turbulent buoyant helium plume. Flow Turbul. Combust. 2013, 90, 511–543. [Google Scholar] [CrossRef]
- Ghodrat, M.; Shakeriaski, F.; Nelson, D.J.; Simeoni, A. Existing Improvements in Simulation of Fire–Wind Interaction and Its Effects on Structures. Fire 2021, 4, 27. [Google Scholar] [CrossRef]
- Wang, Y.; Chatterjee, P.; de Ris, J.L. Large eddy simulation of fire plumes. Proc. Combust. Inst. 2011, 33, 2473–2480. [Google Scholar] [CrossRef]
- El Houssami, M.; Lamorlette, A.; Morvan, D.; Hadden, R.; Simeoni, A. Framework for submodel improvement in wildfire modeling. Combust. Flame 2018, 190, 12–24. [Google Scholar] [CrossRef] [Green Version]
- Sikanen, T.; Hostikka, S. Modeling and simulation of liquid pool fires with in-depth radiation absorption and heat transfer. Fire Saf. J. 2016, 80, 95–109. [Google Scholar] [CrossRef]
- Castro, I.; Robins, A. The flow around a surface-mounted cube in uniform and turbulent streams. J. Fluid Mech. 1977, 79, 307–335. [Google Scholar] [CrossRef]
- Morvan, D. A numerical study of flame geometry and potential for crown fire initiation for a wildfire propagating through shrub fuel. Int. J. Wildland Fire 2007, 16, 511–518. [Google Scholar] [CrossRef]
- Li, B.; Ding, L.; Simeoni, A.; Ji, J.; Yu, L. Numerical investigation of the flow characteristics around two tandem propane fires in a windy environment. Fuel 2021, 286, 119344. [Google Scholar] [CrossRef]
- Verma, M.K. Physics of Buoyant Flows: From Instabilities to Turbulence; World Scientific: Singapore, 2018. [Google Scholar]
- Guo, Y.; Yuan, Z.; Yuan, Y.; Cao, X.; Zhao, P. Numerical simulation of smoke stratification in tunnel fires under longitudinal velocities. Undergr. Space 2021, 6, 163–172. [Google Scholar] [CrossRef]
- Himoto, K.; Deguchi, Y. Temperature elevation and trajectory in the downwind region of rectangular fire sources in cross-winds. Fire Saf. J. 2020, 116, 103183. [Google Scholar] [CrossRef]
- Nelson, R.M. Re-analysis of wind and slope effects on flame characteristics of Mediterranean shrub fires. Int. J. Wildland Fire 2015, 24, 1001–1007. [Google Scholar] [CrossRef]
Figure 1.
Schematic of computational domain and the location of the building. (a) Total geometry and (b) high-resolution mesh subdomain.
Figure 1.
Schematic of computational domain and the location of the building. (a) Total geometry and (b) high-resolution mesh subdomain.

Figure 2.
Comparison of the mean pressure coefficient for the experimental studies of [28,51], numerical simulation of [27], and three different grids number for the presented study.

Figure 3.
Temperature distribution for the reference velocity (A,B) Uref = 4.5, (C,D) Uref = 6, (E,F) Uref = 7.5 m/s in various terrain slope angles.
Figure 3.
Temperature distribution for the reference velocity (A,B) Uref = 4.5, (C,D) Uref = 6, (E,F) Uref = 7.5 m/s in various terrain slope angles.
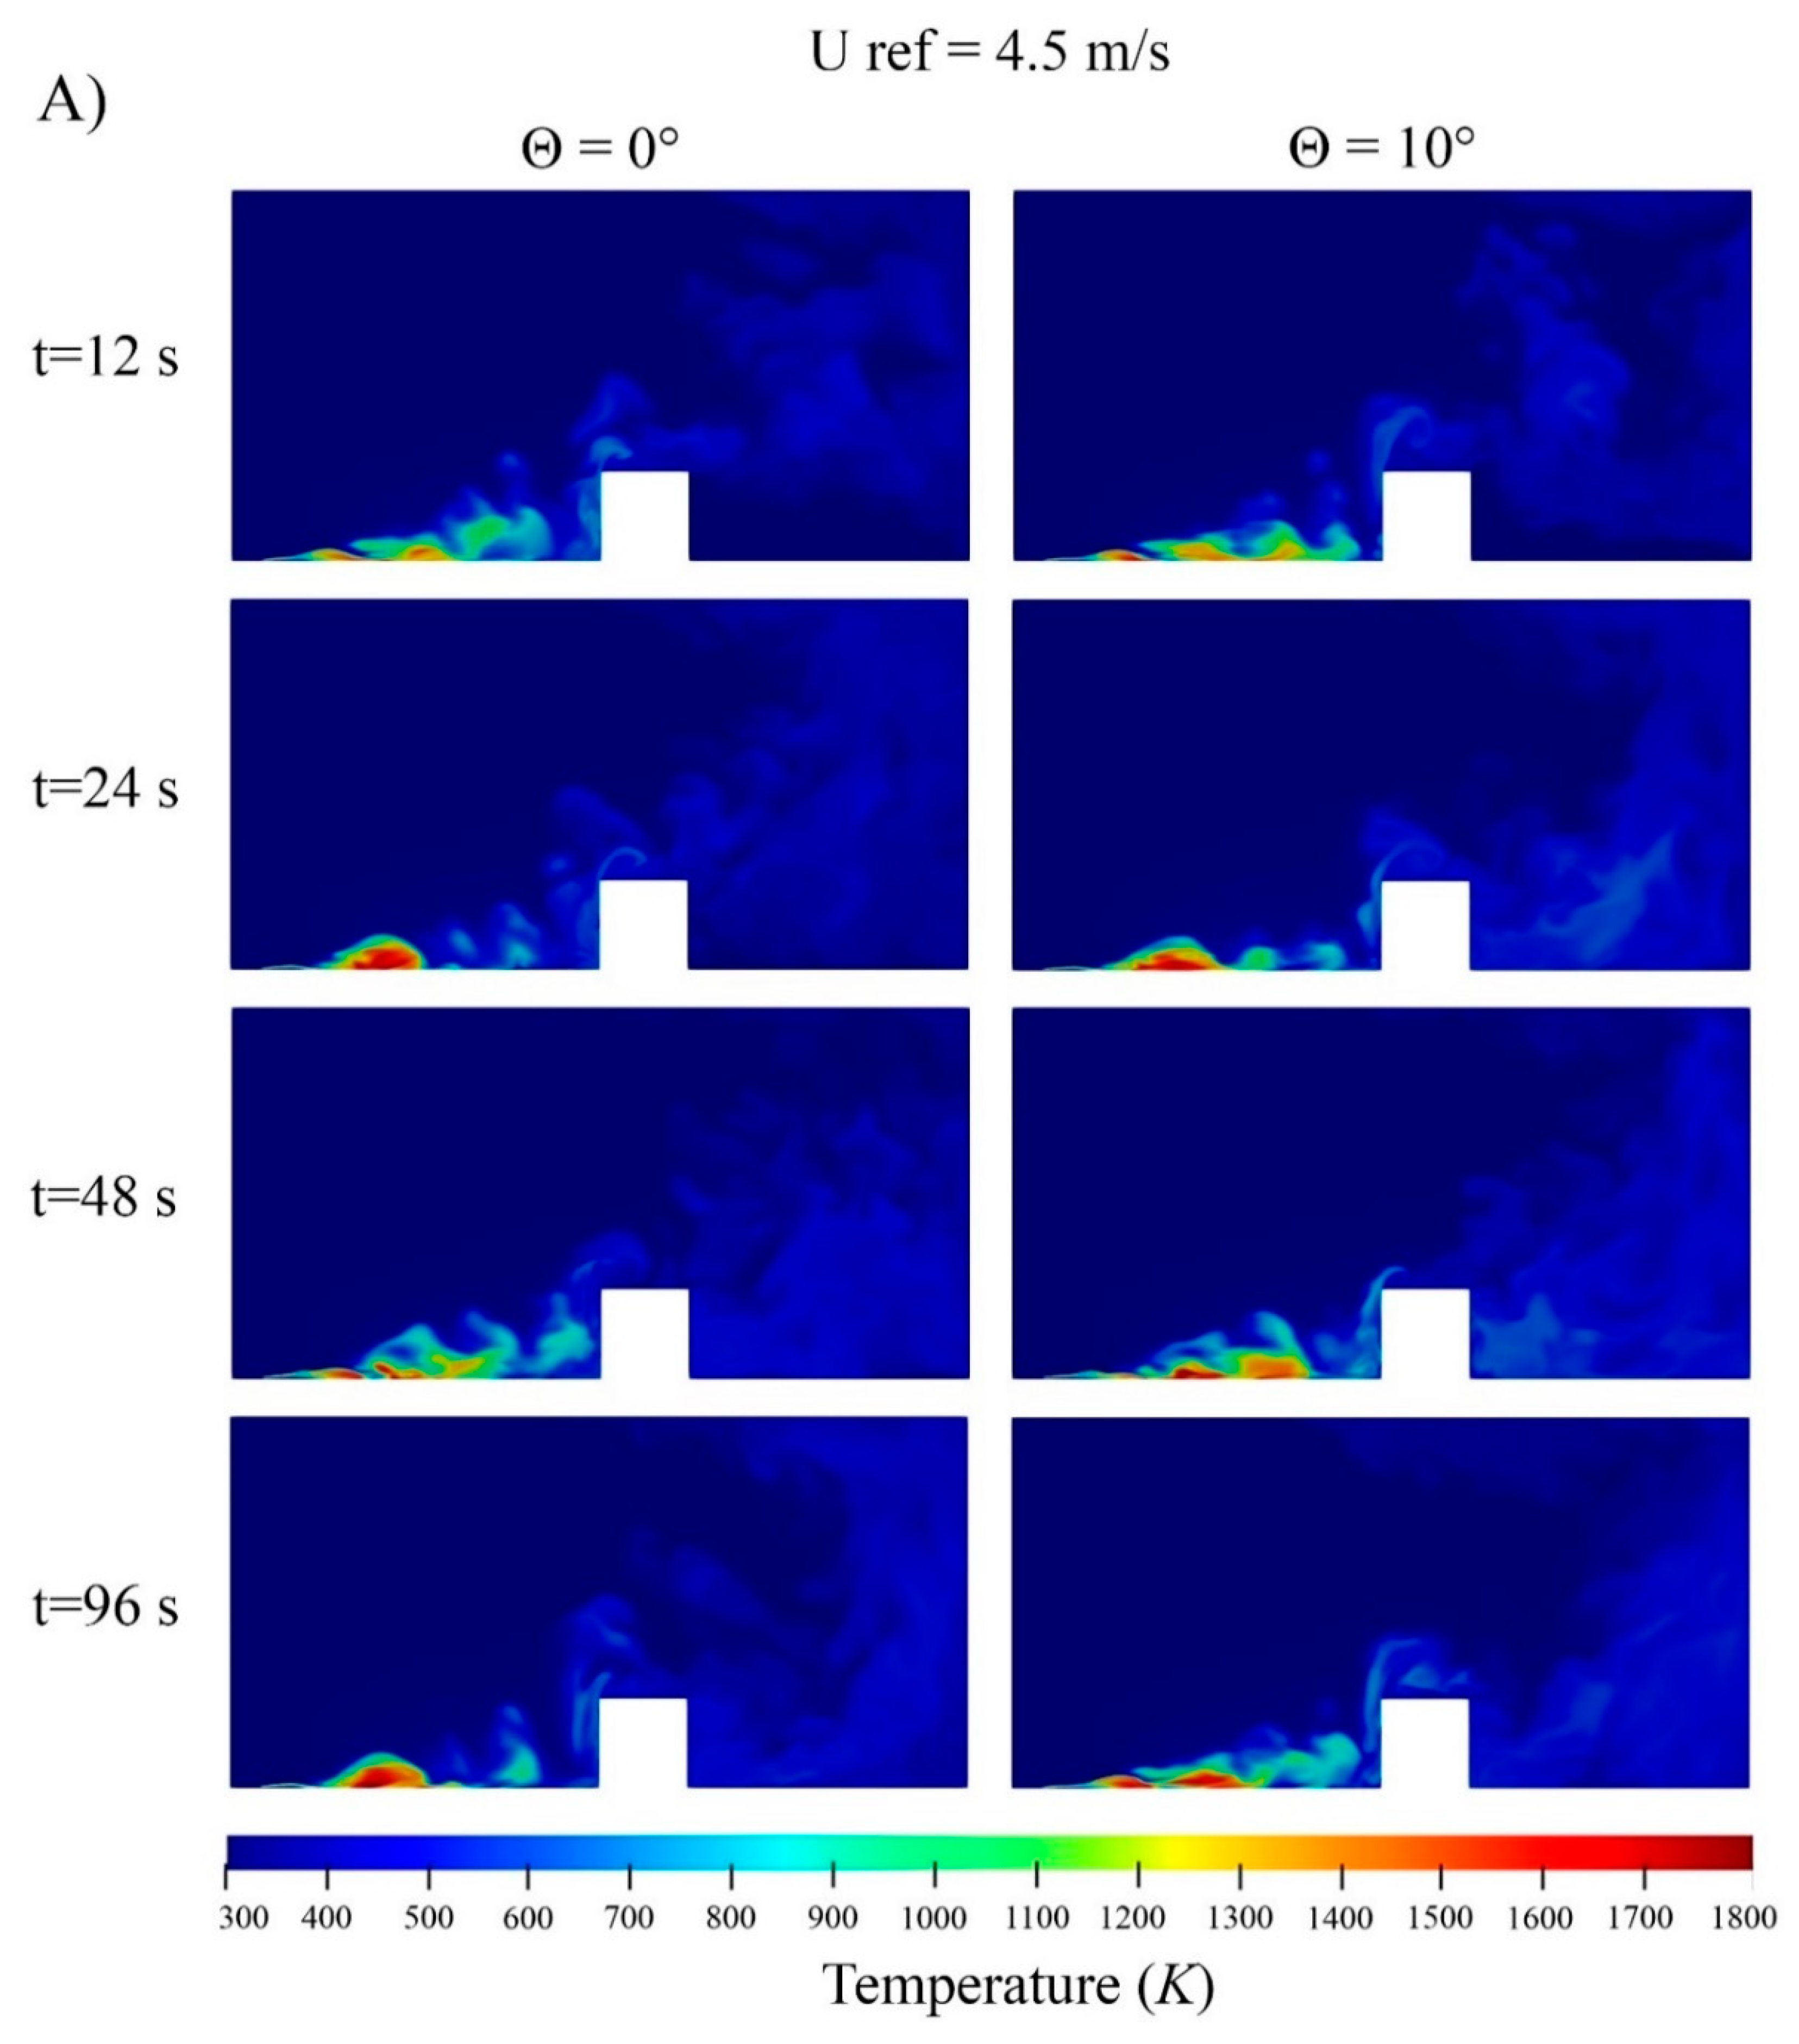


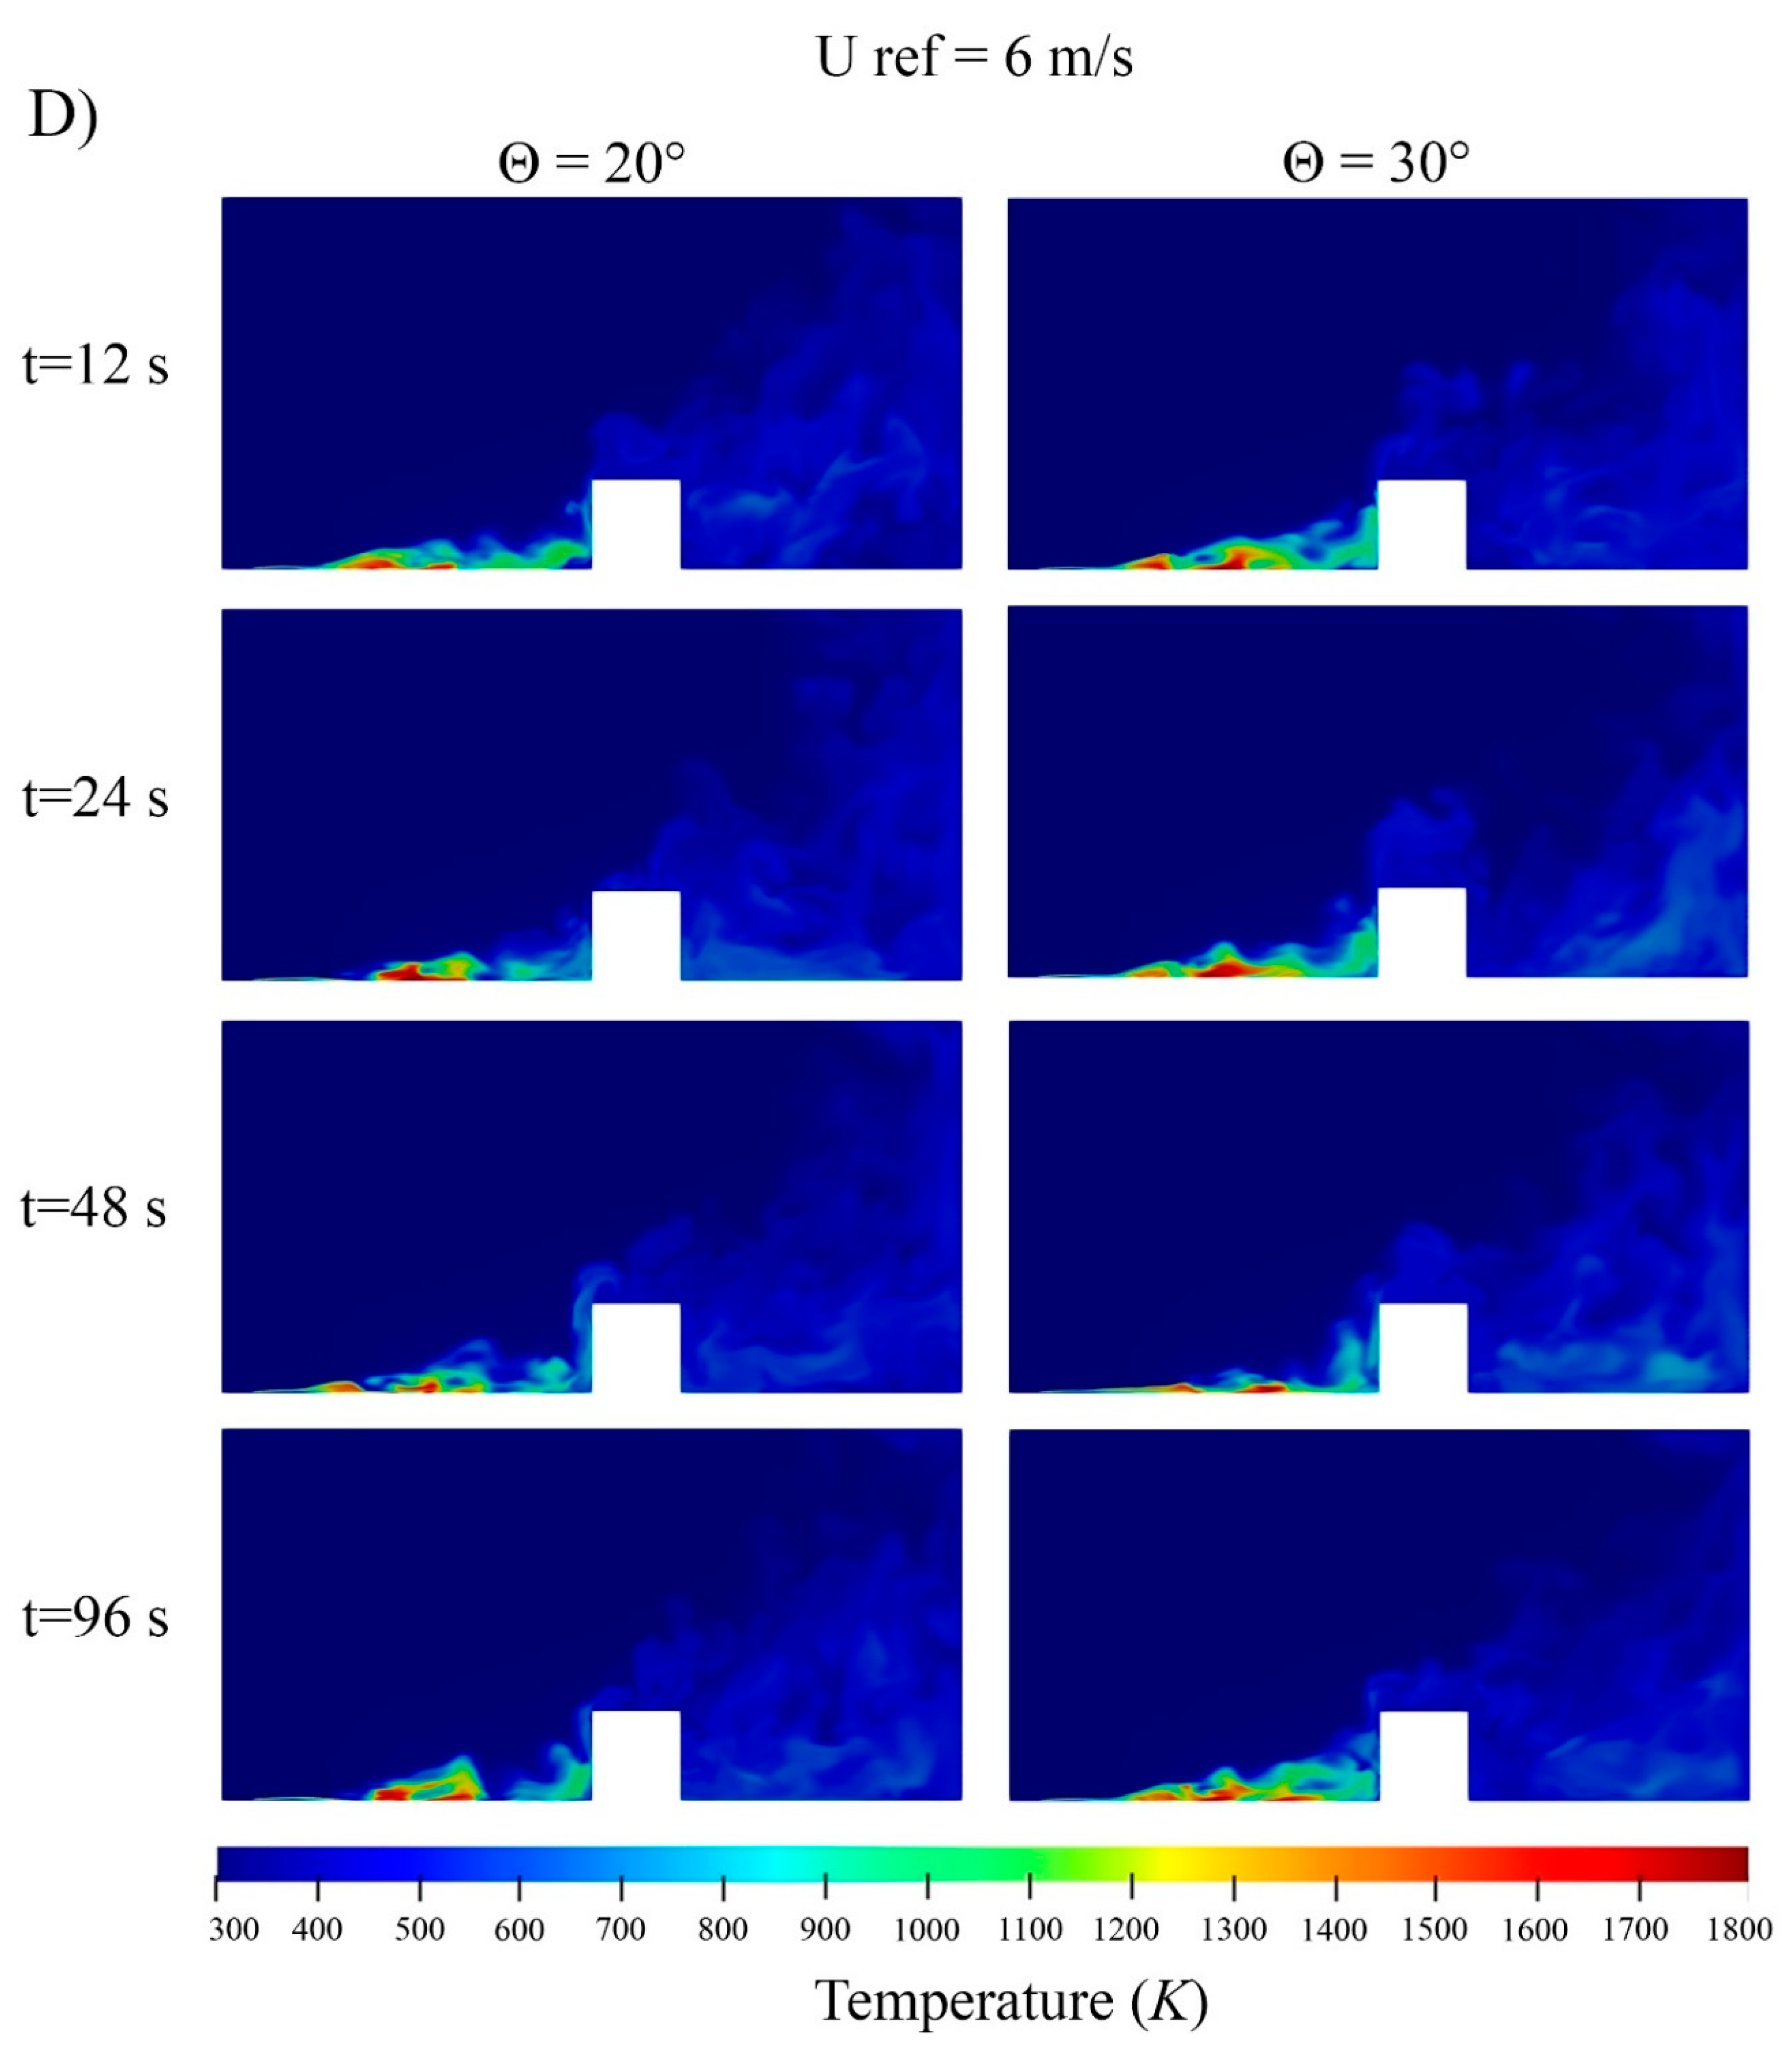

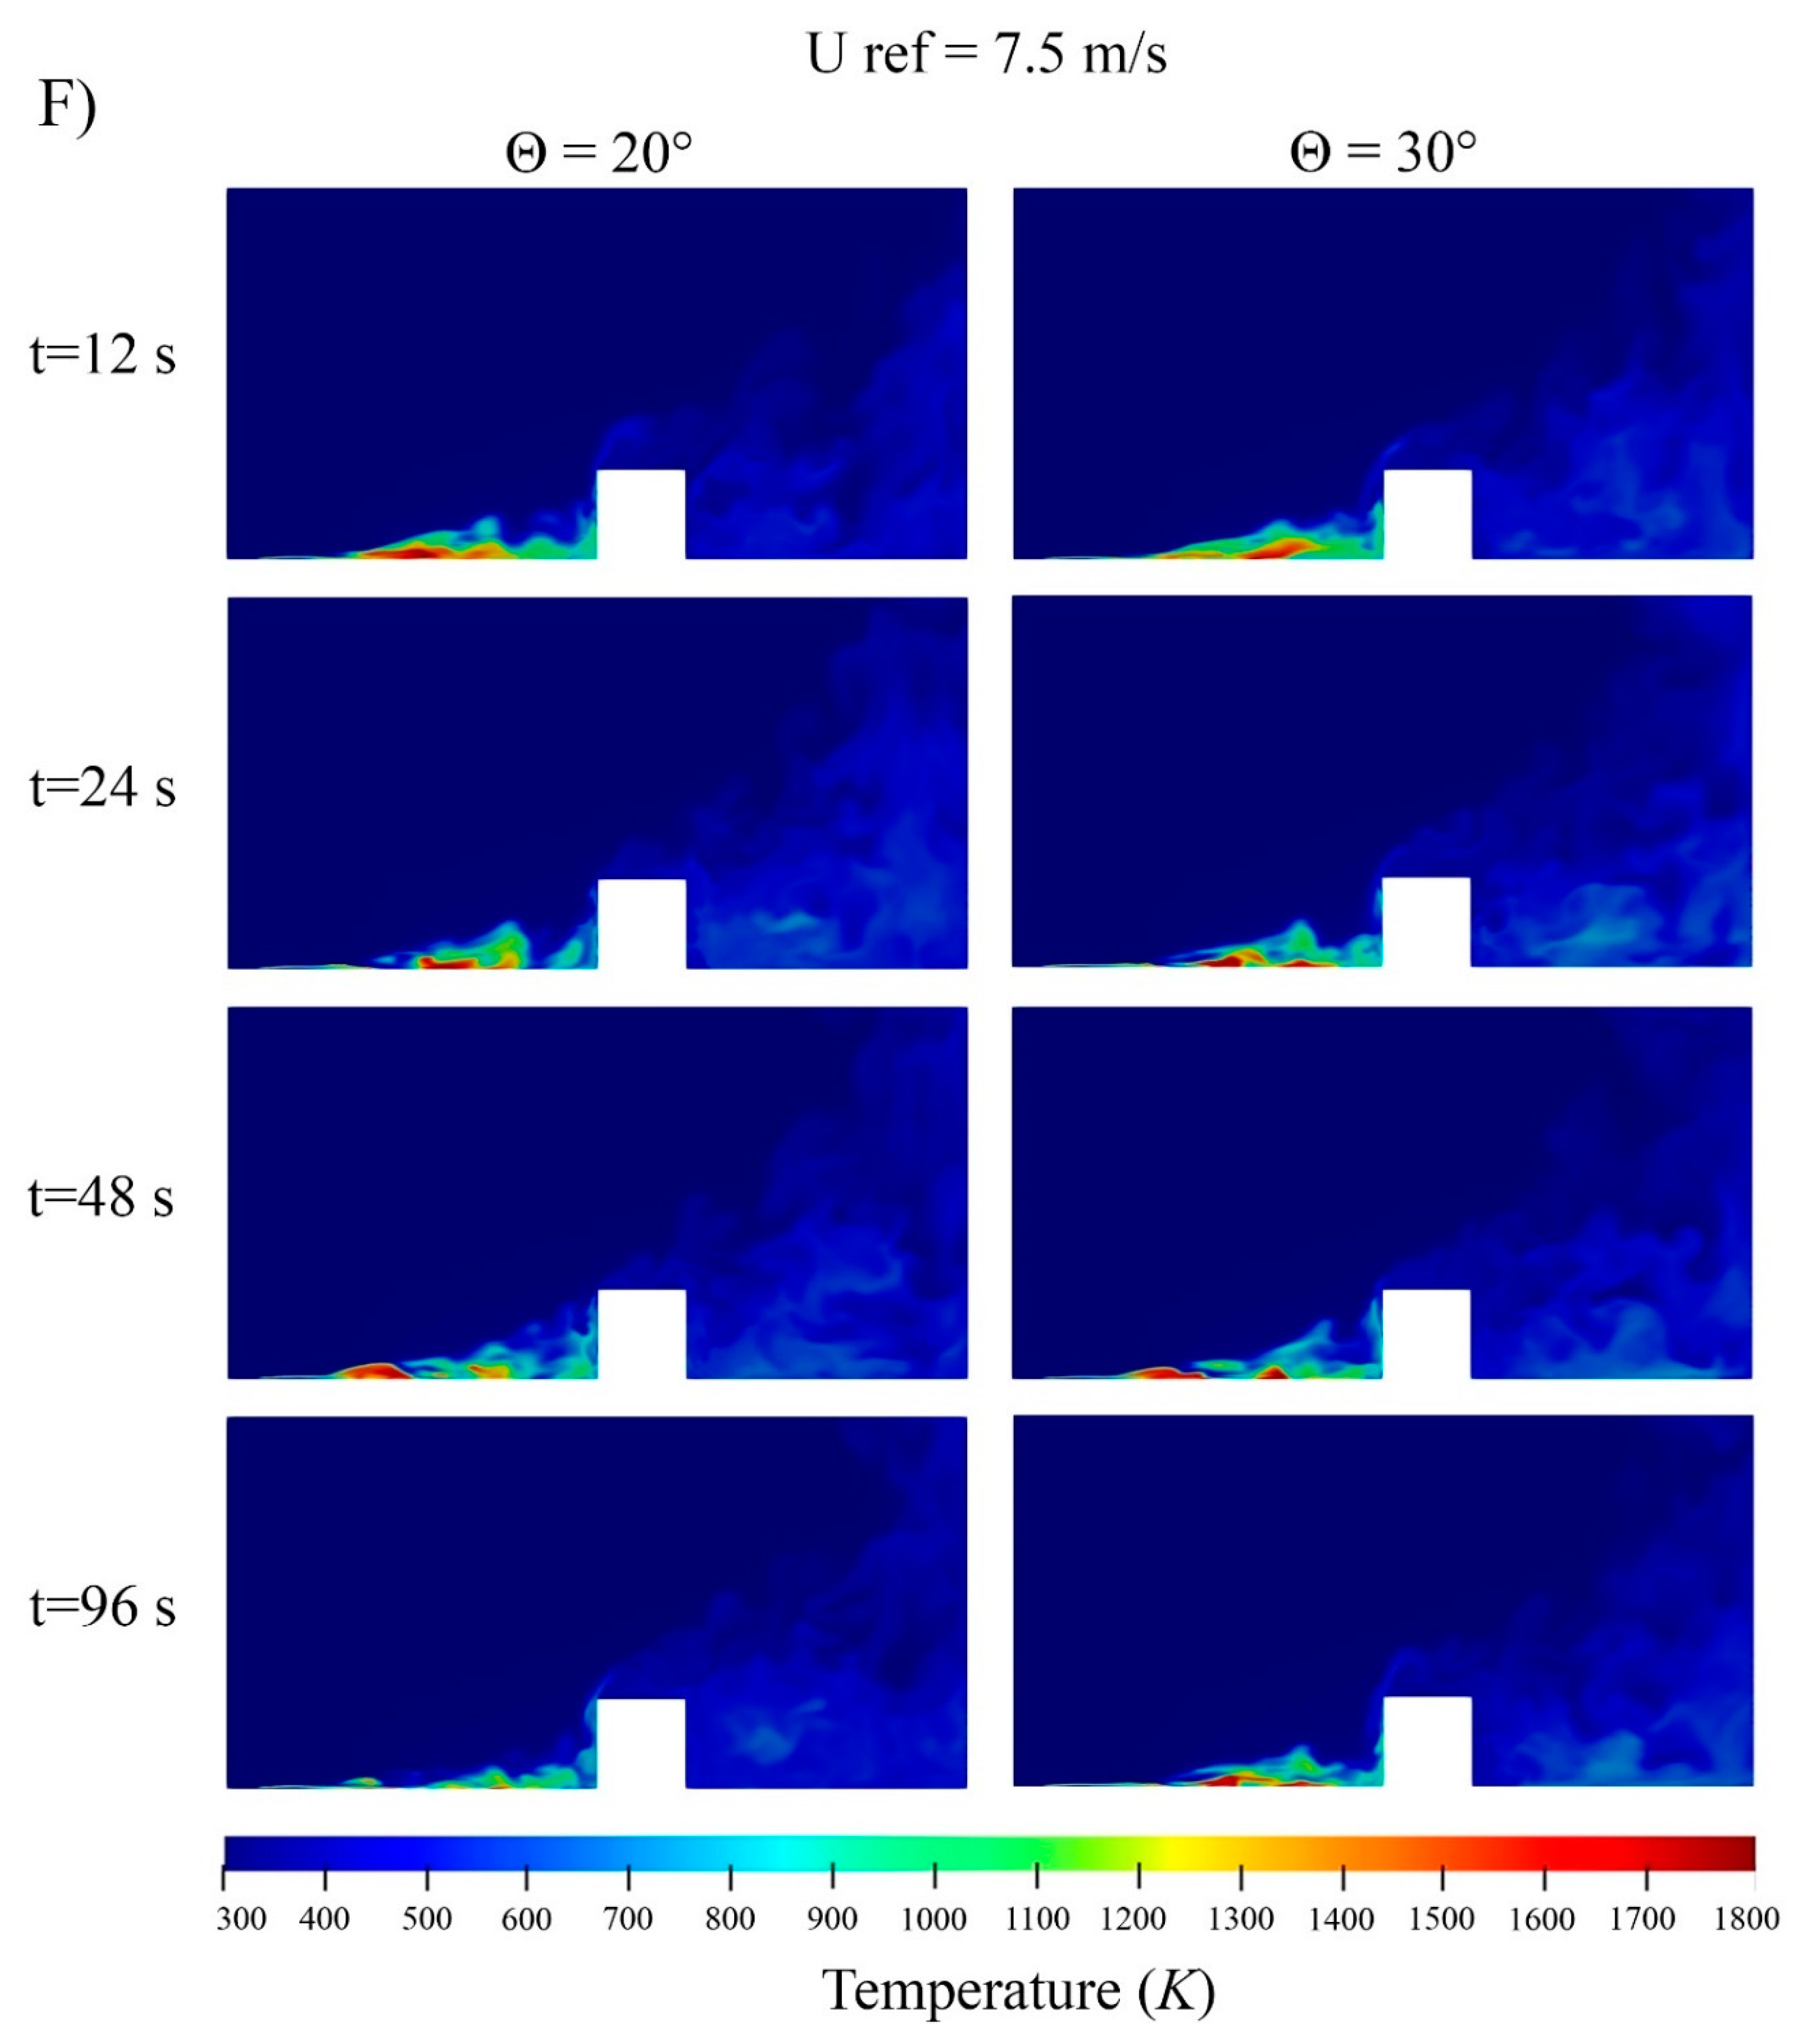
Figure 4.
Incident radiation heat rate on the building surface for Uref = 4.5, 6, and 7.5 m/s and terrain slope 0°, 10°, 20°, and 30°.
Figure 4.
Incident radiation heat rate on the building surface for Uref = 4.5, 6, and 7.5 m/s and terrain slope 0°, 10°, 20°, and 30°.
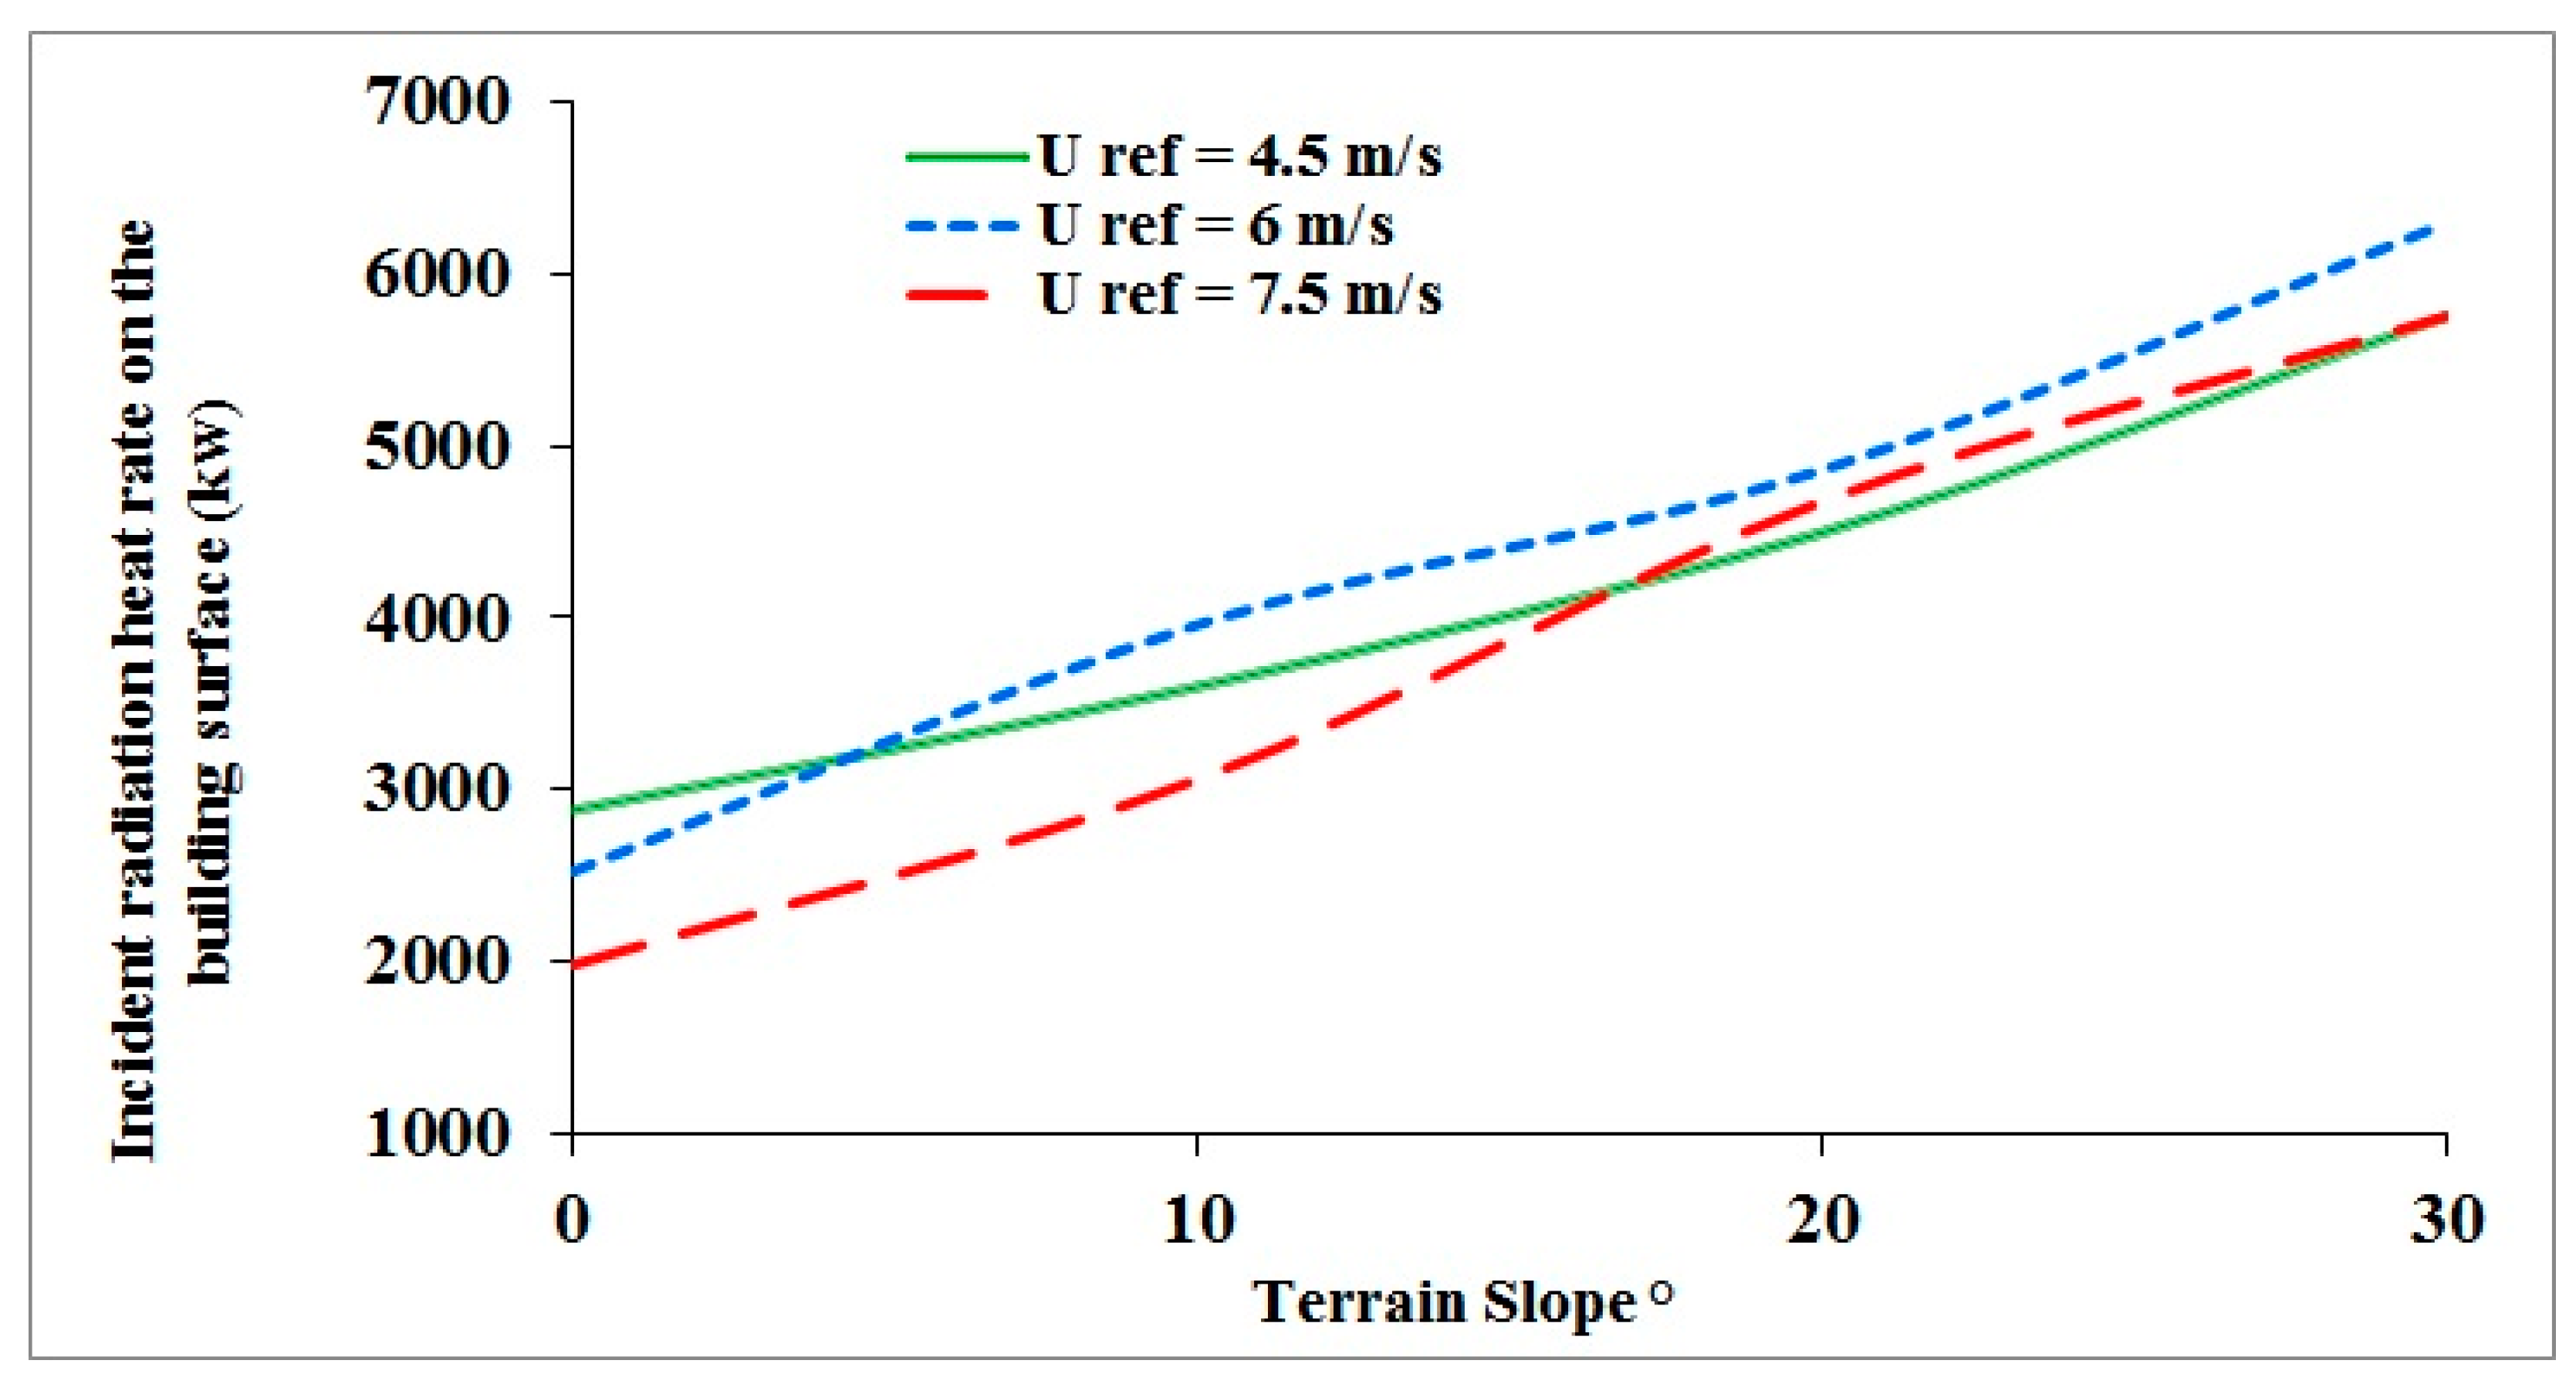
Figure 5.
Average tilt angle for Uref = 4.5, 6, and 7.5 m/s and terrain slope 0°, 10°, 20°, and 30°.
Figure 5.
Average tilt angle for Uref = 4.5, 6, and 7.5 m/s and terrain slope 0°, 10°, 20°, and 30°.

Figure 6.
Vertical transects of instantaneous streamwise velocity component (Ux) for the reference velocities Uref = 4.5, 6, and 7.5 m/s in various terrain angle.
Figure 6.
Vertical transects of instantaneous streamwise velocity component (Ux) for the reference velocities Uref = 4.5, 6, and 7.5 m/s in various terrain angle.

Figure 7.
Average Ux on the downstream for Uref = 4.5, 6, and 7.5 m/s and terrain slope 0°, 10°, 20°, and 30°.
Figure 7.
Average Ux on the downstream for Uref = 4.5, 6, and 7.5 m/s and terrain slope 0°, 10°, 20°, and 30°.

Figure 8.
The contour of Froude number distribution on the domain in Uref = 4.5, 6, and 7.5 m/s and terrain slope 0°, 10°, 20°, and 30°.
Figure 8.
The contour of Froude number distribution on the domain in Uref = 4.5, 6, and 7.5 m/s and terrain slope 0°, 10°, 20°, and 30°.
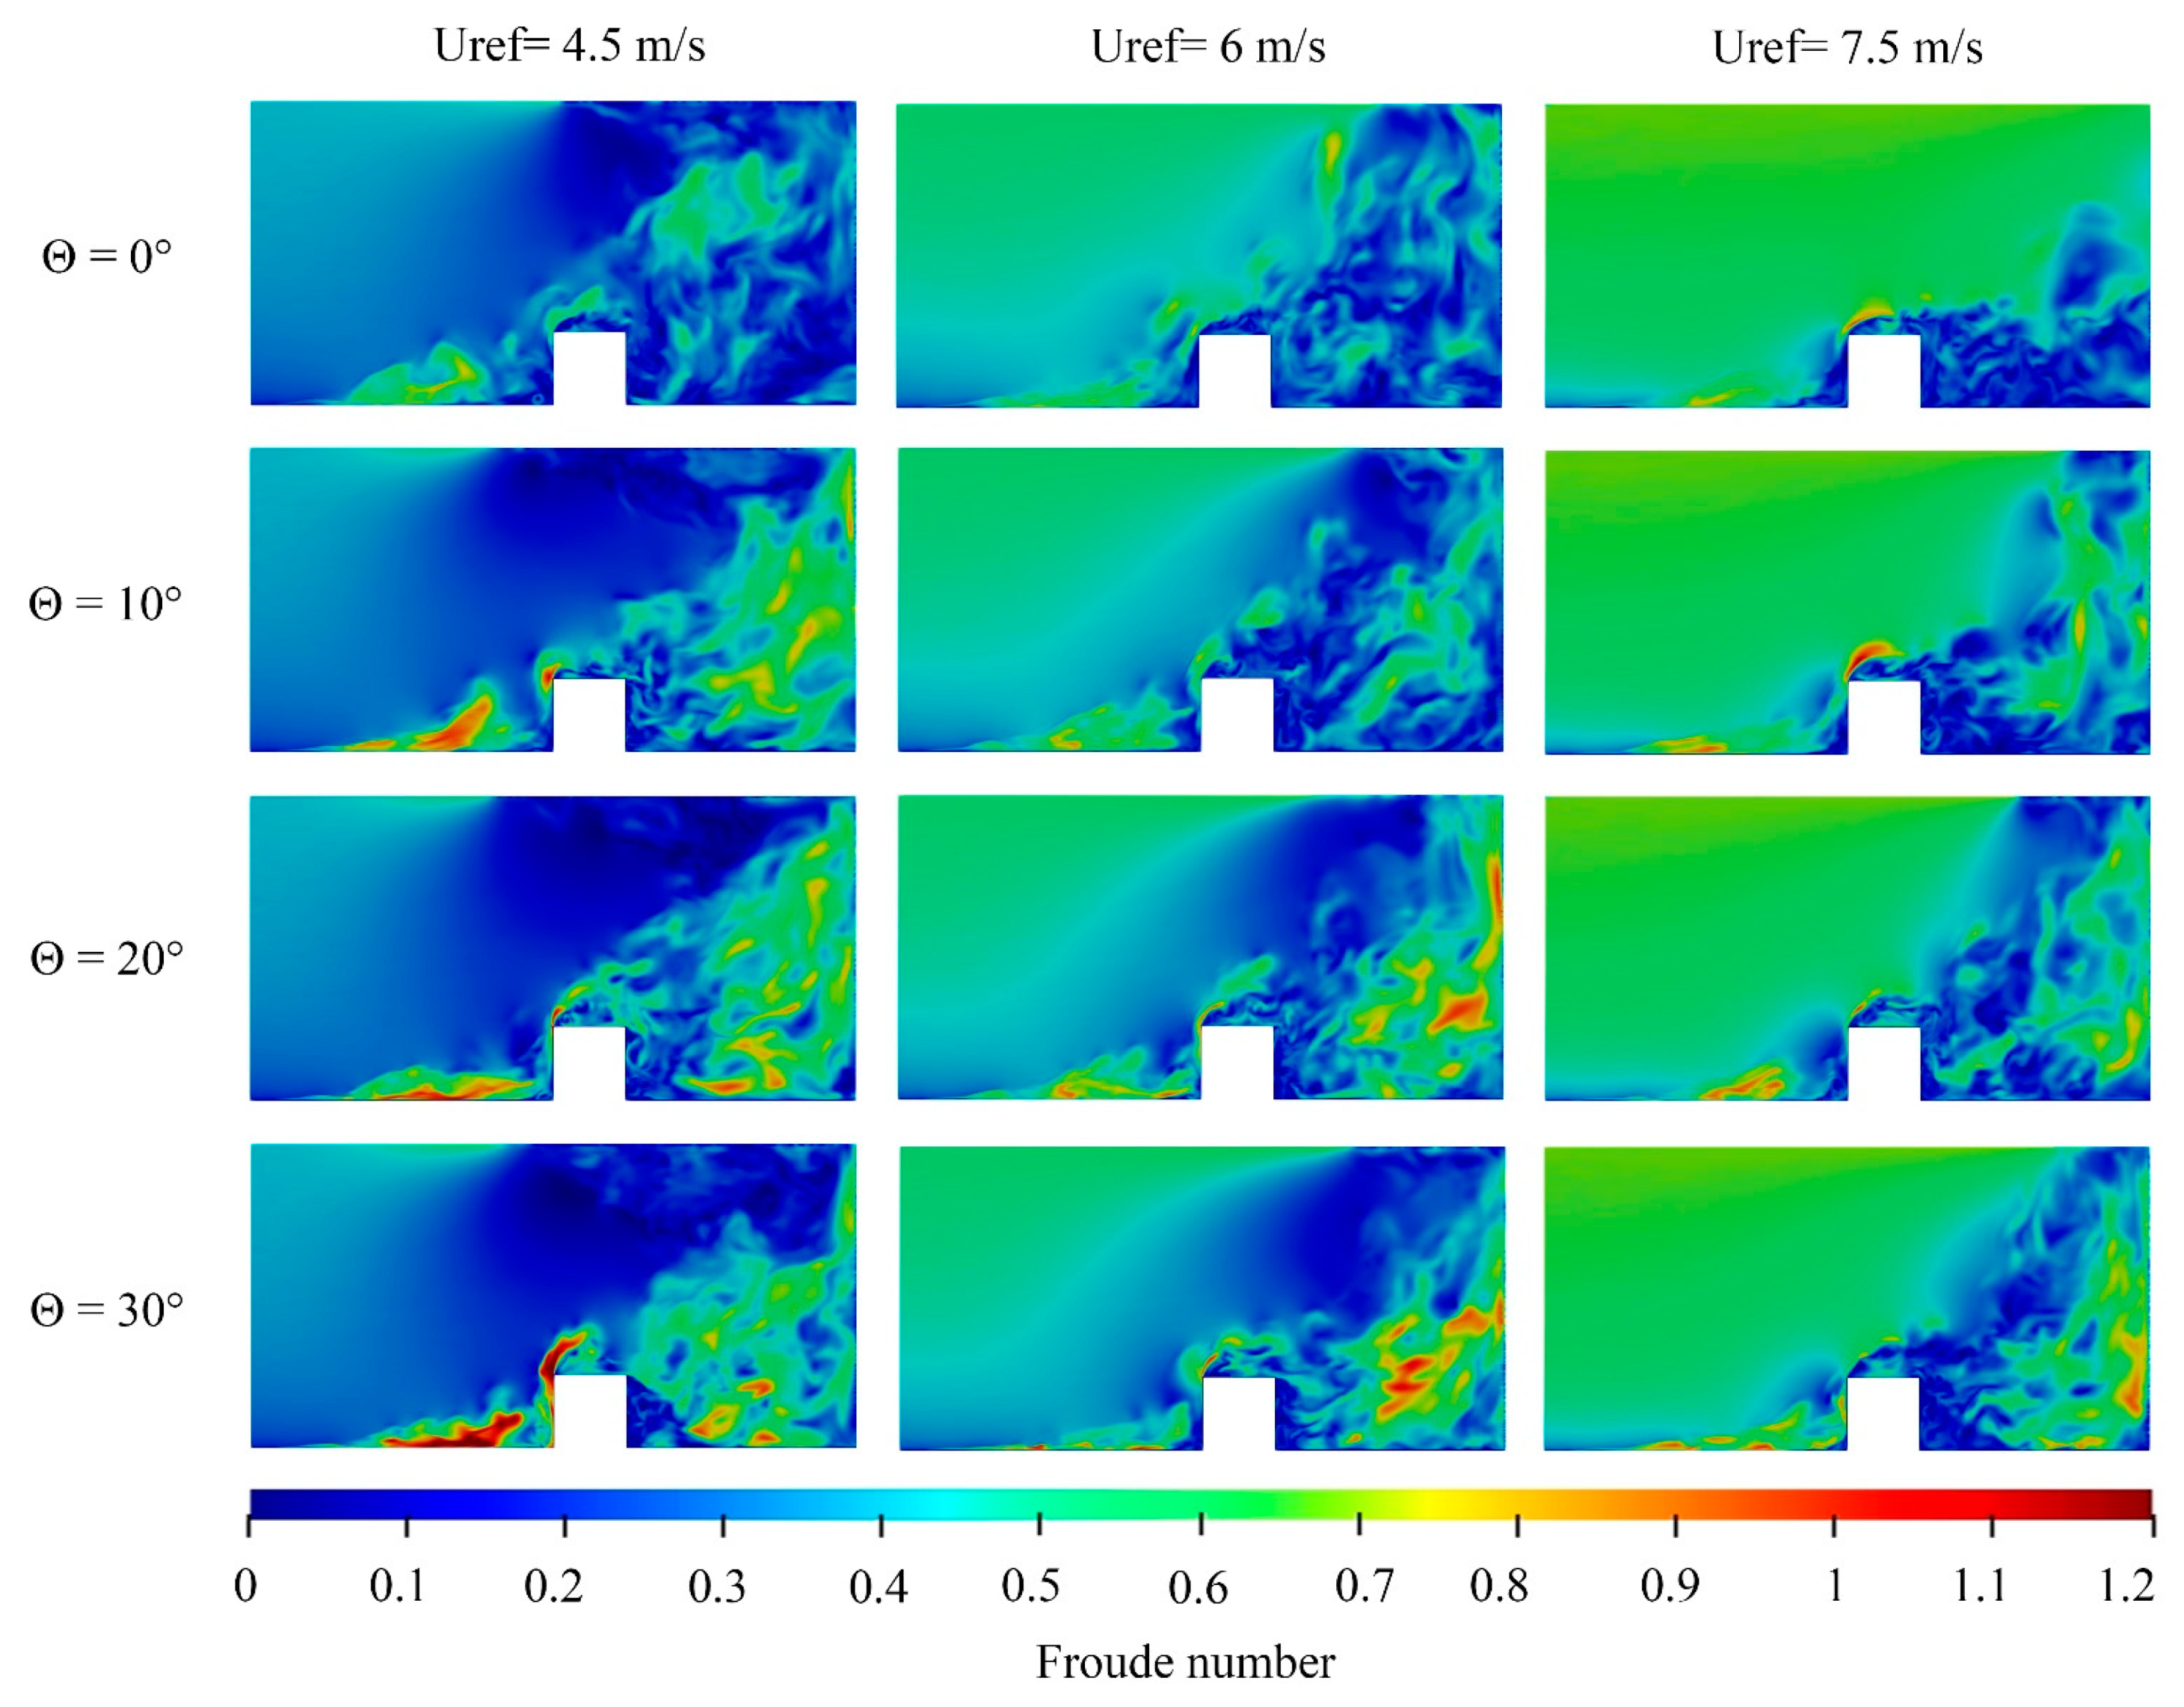
Figure 9.
Temperature distribution on the ground in Uref = 4.5, 6, and 7.5 m/s and terrain slope 0°, 10°, 20°, and 30°.
Figure 9.
Temperature distribution on the ground in Uref = 4.5, 6, and 7.5 m/s and terrain slope 0°, 10°, 20°, and 30°.
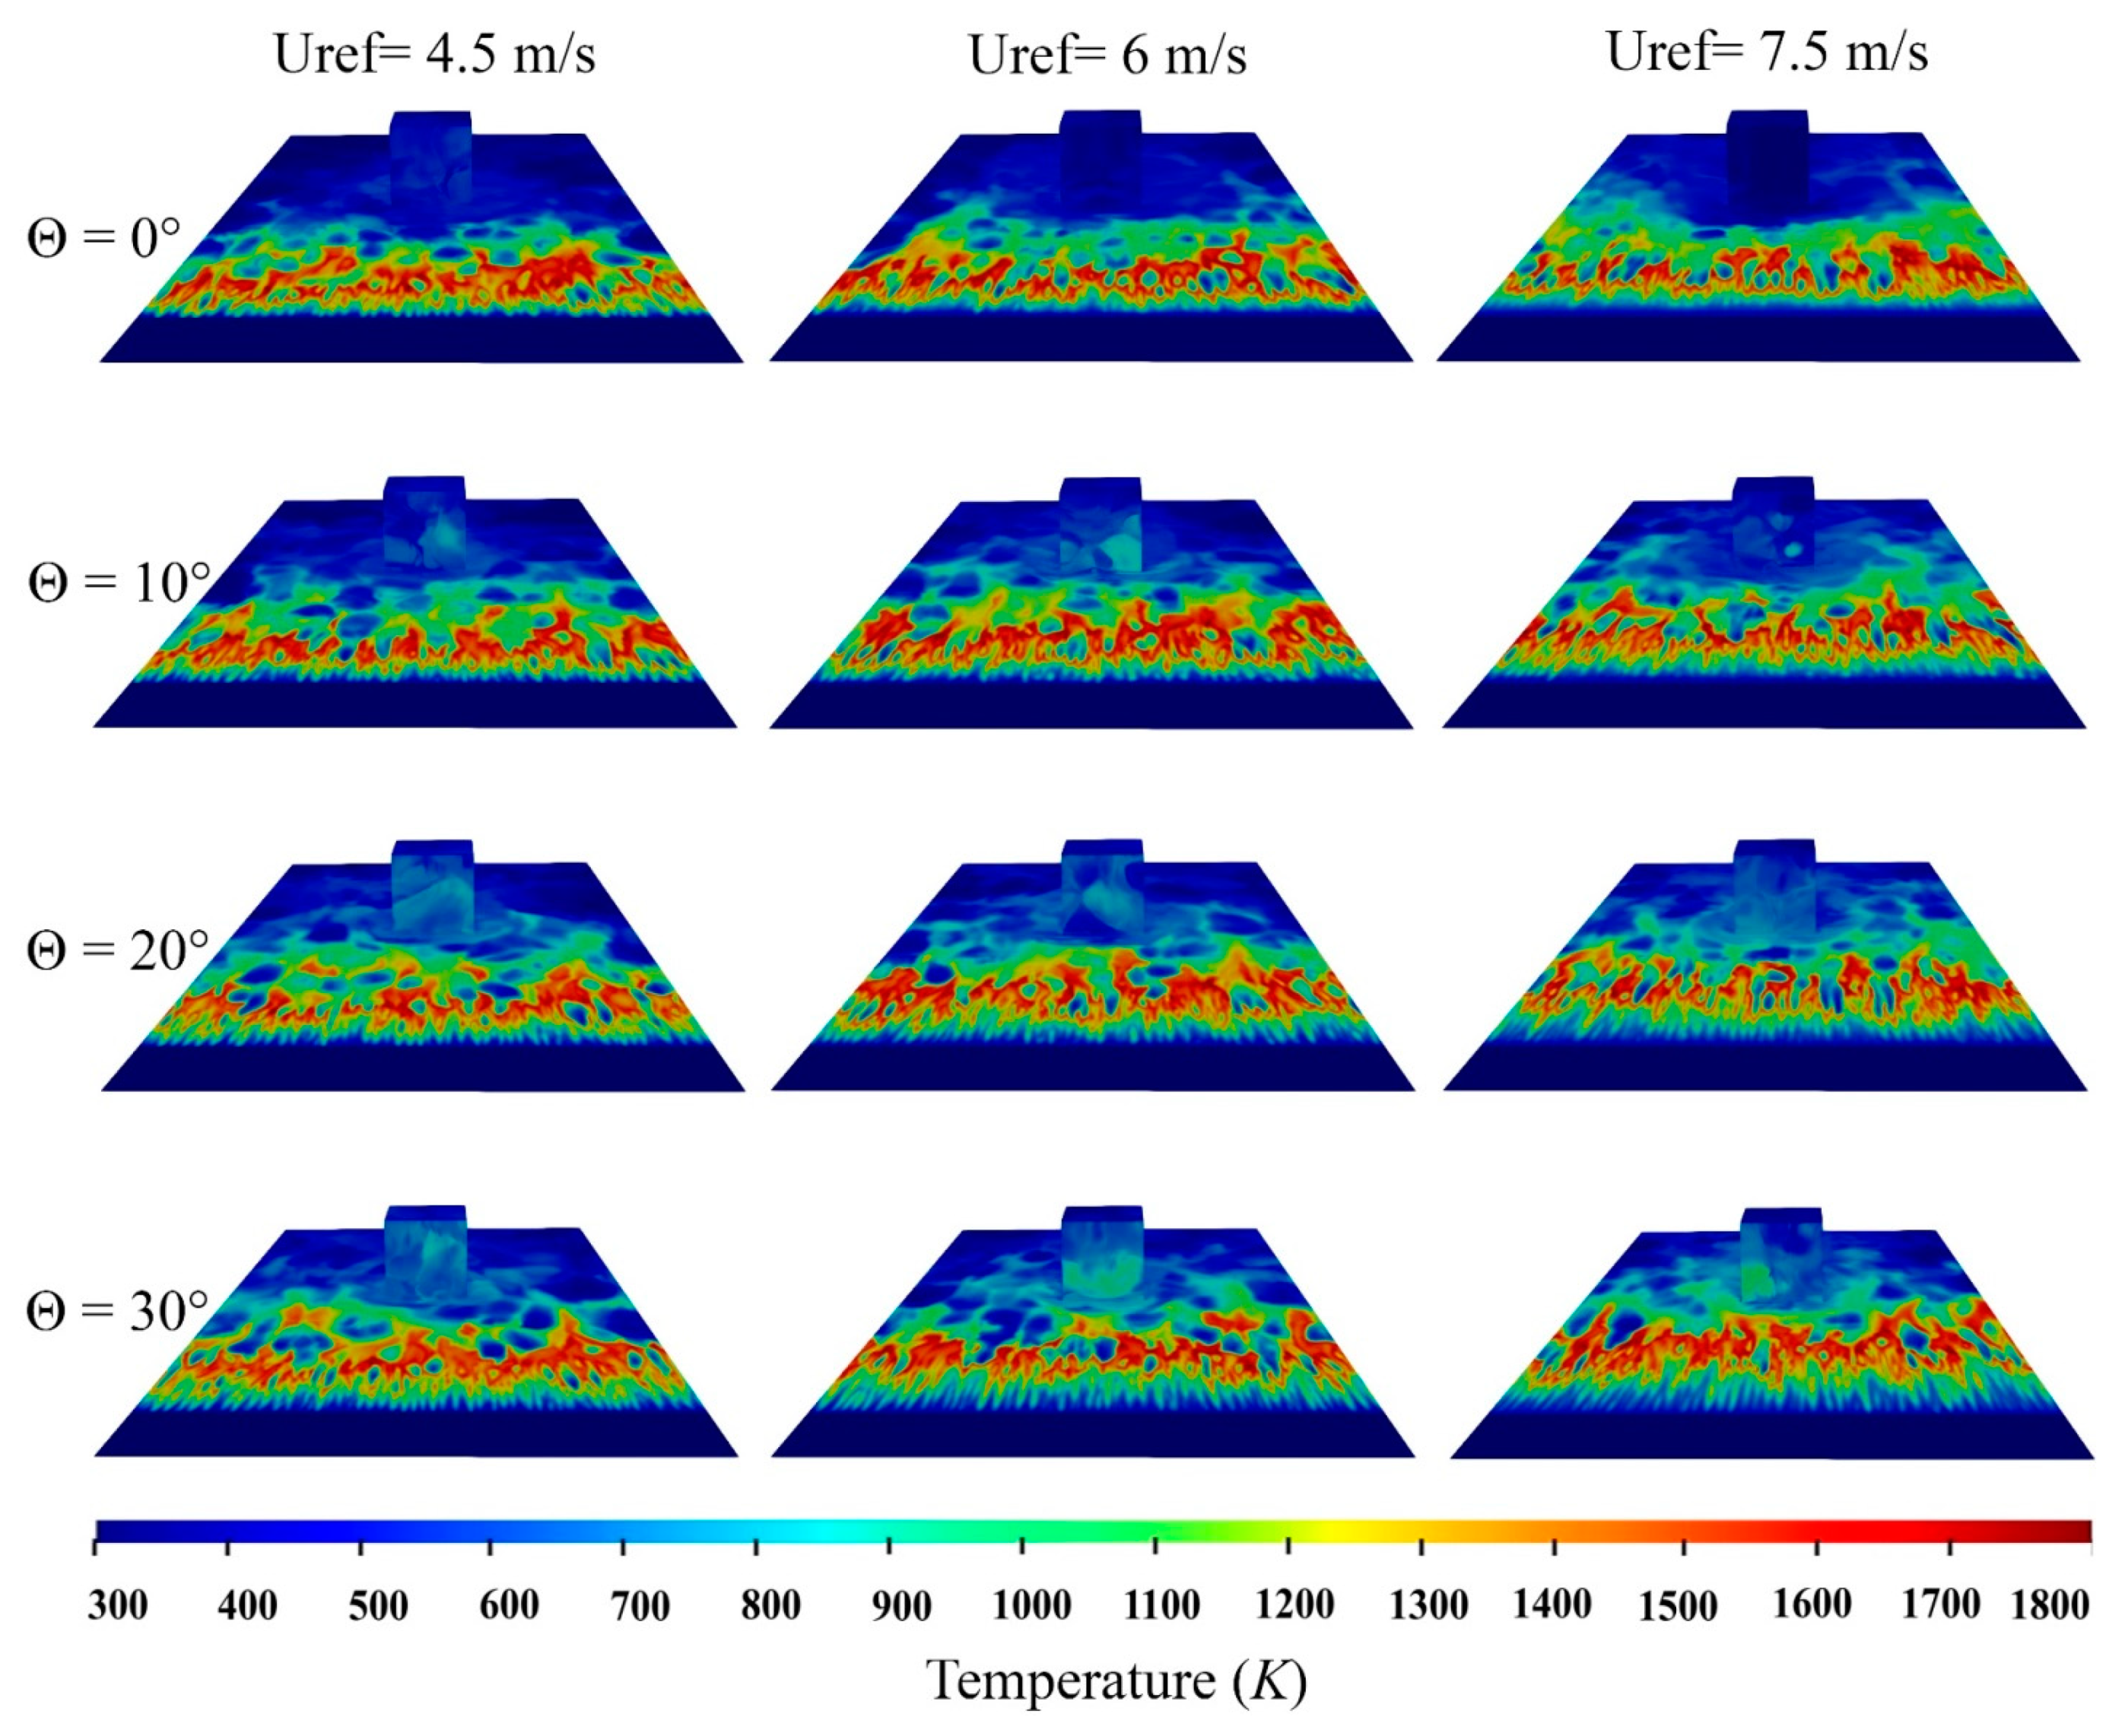
Figure 10.
Integrated temperature on the ground at the considered domain for Uref = 4.5, 6, and 7.5 m/s and terrain slope 0°, 10°, 20°, and 30°.
Figure 10.
Integrated temperature on the ground at the considered domain for Uref = 4.5, 6, and 7.5 m/s and terrain slope 0°, 10°, 20°, and 30°.

Figure 11.
Temperature distribution on the building in Uref = 4.5, 6, and 7.5 m/s and terrain slope 0°, 10°, 20°, and 30°.
Figure 11.
Temperature distribution on the building in Uref = 4.5, 6, and 7.5 m/s and terrain slope 0°, 10°, 20°, and 30°.

Figure 12.
Integrated temperature on the building surface for Uref = 4.5, 6, and 7.5 m/s and terrain slope 0°, 10°, 20°, and 30°.
Figure 12.
Integrated temperature on the building surface for Uref = 4.5, 6, and 7.5 m/s and terrain slope 0°, 10°, 20°, and 30°.

Table 1.
Comparison of the flame height, as functions of the wind velocity, between published data [52] and the present study.
Publisher’s Note: MDPI stays neutral with regard to jurisdictional claims in published maps and institutional affiliations. |
© 2021 by the authors. Licensee MDPI, Basel, Switzerland. This article is an open access article distributed under the terms and conditions of the Creative Commons Attribution (CC BY) license (https://creativecommons.org/licenses/by/4.0/).
Share and Cite
MDPI and ACS Style
Edalati-nejad, A.; Ghodrat, M.; Simeoni, A. Numerical Investigation of the Effect of Sloped Terrain on Wind-Driven Surface Fire and Its Impact on Idealized Structures. Fire 2021, 4, 94. https://doi.org/10.3390/fire4040094
AMA Style
Edalati-nejad A, Ghodrat M, Simeoni A. Numerical Investigation of the Effect of Sloped Terrain on Wind-Driven Surface Fire and Its Impact on Idealized Structures. Fire. 2021; 4(4):94. https://doi.org/10.3390/fire4040094
Chicago/Turabian StyleEdalati-nejad, Ali, Maryam Ghodrat, and Albert Simeoni. 2021. "Numerical Investigation of the Effect of Sloped Terrain on Wind-Driven Surface Fire and Its Impact on Idealized Structures" Fire 4, no. 4: 94. https://doi.org/10.3390/fire4040094