Predictive Modeling of Wildfire Occurrence and Damage in a Tropical Savanna Ecosystem of West Africa


1
Laboratoire Science Société et Environnement (LSSE), Unité Mixte de Recherche et d’Innovation Sciences Agronomiques et Génie Rural, Institut National Polytechnique Félix Houphouët-Boigny (INP-HB), P.O. Box 1093, Yamoussoukro 10010202, Côte d’Ivoire
2
Future Africa, University of Pretoria, South St, Koedoespoort 456-Jr, Pretoria 0002, South Africa
*
Author to whom correspondence should be addressed.
Fire 2020, 3(3), 42; https://doi.org/10.3390/fire3030042
Submission received: 30 May 2020
/
Revised: 5 August 2020
/
Accepted: 7 August 2020
/
Published: 12 August 2020
Abstract
:Wildfires are a major environmental, economic, and social threat. In Central Côte d’Ivoire, they are among the biggest environmental and forestry problems during the dry season. National authorities do not have tools and methods to predict spatial and temporal fire proneness over large areas. This study, based on the use of satellite historical data, aims to develop an appropriate model to forecast wildfire occurrence and burnt areas in each ecoregion of the N’Zi River Watershed. We used an autoregressive integrated moving average (ARIMA) model to simulate and forecast the number of wildfires and burnt area time series in each ecoregion. Nineteen years of monthly datasets were trained and tested. The model performance assessment combined Ljung–Box statistics, residuals, and autocorrelation analysis coupled with cross-validation using three forecast errors—namely, root mean square error, mean absolute error, and mean absolute scaled error—and observed–simulated data analysis. The results showed that the ARIMA models yielded accurate forecasts of the test dataset in all ecoregions and highlighted the effectiveness of the ARIMA models to forecast the total number of wildfires and total burnt area estimation in the future. The forecasts of possible wildfire occurrence and extent of damages in the next four years will help decision-makers and wildfire managers to take actions to reduce the exposure and the vulnerability of ecosystems and local populations to current and future pyro-climatic hazards.
1. Introduction
Wildfires are a predominant ecological disturbance in West African savanna landscapes. In Côte d’Ivoire, particularly in the N’Zi River Watershed (NRW), wildfires threaten the conservation of the local landscape and biodiversity, and influence the climate of this important biome. According to Kouassi et al. [1], the number of wildfires and burnt areas has been decreasing in this ecoregion. In rural areas, wildfires are used in agricultural activities (slash and burn or stubble cultivation), hunting (animal skidding), pastoral activities (burning for grazing renewal, pest reduction), and energy (charcoal production) [2,3].
Recent studies on the drivers of deforestation in Côte d’Ivoire have shown that wildfires represent 3% and 23% of the direct factors of deforestation and forest degradation, respectively [4]. These wildfires cause damage to activities, human and animal lives, and have a very high social and economic cost [5,6]. Indeed, around January and February of each year, the region experiences a peak of wildfires, that ravage hundreds of thousands of hectares of lands suitable for agriculture, and sometimes cause death [7,8,9].
In addition, there is an increase in mean temperature, dry years, and persistence of the drought zone at the local scale [10,11]. These climatic events coupled with anthropogenic practices have made wildfires a recurring phenomenon that returns every year during the dry season [2]. This exposure to wildfires is expected to be most intensified due to the increase in temperature and decrease of rainfall, with significant impacts on forests’ survival, livelihoods, and the ecosystems [12,13]. To address these challenges, it is necessary to provide a decision-support tool for fire risk management, early warning, and prevention at the local scale. Forecasts can only provide outlooks to wildfire managers for significant fire potential seasons [14]. In addition, they may lead to large-scale wildfire suppression and reduction of the average size or per unit damages that occur because wildfire managers are adequately prepared to respond rapidly [14,15].
The predictability of wildfire occurrence implies the use of statistical models. Several methods have been used to evaluate and model fire activity (number of fires and burnt areas). The first models used to model the occurrence of fires were about linear regressions [16,17]. Computing and statistics have improved modeling approaches for discovering trends found in fire time series data. Generalized linear models (GLM) were used to analyze fire ignition [18] and identify variables that have a significant influence on the frequency of wildfires [19,20,21]. Among the most widely used GLMs, logistic regression models were applied to socio-economic variables at the municipal or provincial level [22,23,24,25,26,27,28,29]. In addition, Poisson and Zero-Inflated Poisson models were used to predict vegetation fires and their daily occurrence in Europe and Canada [30,31,32,33,34,35,36]. Boubeta et al. [37] used an extension of the classical Poisson regression models including forest area as a random effect for the prediction of wildfires in Galicia (northeastern Spain). Serra et al. [38] used multiple linear regression models to explain the main drivers of changes in land use and land cover, as well as the relationship with the frequency of wildfires in a coastal area of Catalonia (Spain). Other more complex methods have been introduced as alternatives to traditional statistical methods, particularly in the case of large databases, nonlinear models, and highly correlated or normally undistributed variables. These include classification and regression tree methods [39,40,41], generalized additive models [1,42,43], artificial neural networks [28,44], support vector machines [45], generalized linear spatial models [20], and the weight of evidence using Bayesian inference to measure the spatial association between evidence variable maps and fire ignition maps [46,47,48,49].
In non-parametric contexts, kernel smoothing and parametric estimation were used to explore the relationship between incidence and meteorological variables [50,51]. For the first time, Schroeder [52] introduced time series models for the analysis of climate history and wildfire variability. Chronological methods were used to search for cycles or trends in annual fire and burnt area time series in Ontario (Canada) between 1918 and 2000 [53]. The importance of previous climatic conditions for the variability of wildfires (total burned area and total number of wildfires) in Arizona was highlighted by Crimmins and Comrie [54].
One of the most important and widely used time series models is the Autoregressive Integrated Moving Average (ARIMA) model [55]. This modeling approach is particularly useful when little knowledge is available on the data generation process or in the absence of a satisfying explanatory model linking the predictor variable to other explanatory variables [56,57]. The popularity of the ARIMA model is due to its statistical properties as well as the well-known Box–Jenkins methodology [58] in the modeling process. In addition, various models of exponential smoothing can be implemented by ARIMA models [59]. ARIMA models have been widely used for modeling wildfire occurrence and burned areas. Miller et al. [60] studied fire severity using ARIMA processes in Sierra Nevada, California. They estimated the trends in the annual percentage of high severity and burned area size. The model predicted 37% high severity and 62% of post-fire patch size in 2007. In addition, Taylor and Scholl [61] identified the influence of interannual and interdecadal climate variations and land-use changes on fire regimes using autocorrelation functions (ACF) and ARIMA in the Sierra Nevada. Boubeta et al. [62] used two semi-parametric time series models to describe and predict weekly burned areas in a year using ARIMA modeling combined with smoothing. Viganó et al. [63] used ARIMA models for predicting the occurrence of forest fires in the Pantanal in Brazil.
Since several studies used statistical modeling to forecast wildfires activities, these works are located in temperate and tropical ecosystems of Europe and America. However, in Africa, the regime of this disturbance is linked to regional- and national-level socio-economic and ecological contexts.
In addition, fire information and forecasts, available to wildfire managers, play an important role in raising awareness among local communities and helping them cope with this scourge [14].
Therefore, it appears necessary to model wildfire occurrence and estimate the spread of this scourge in the future at the regional scale in a tropical savanna zone of West Africa to support decision-making and develop fire prevention and management strategies.
The purpose of this study focuses on the analysis and the forecasting for the next four years of wildfire occurrence as well as the damages at the watershed and ecoregional scales in an African tropical zone using ARIMA processes [64]. For this analysis, we used remotely sensed monthly fire observational datasets (number of wildfires and burnt areas) of the NRW from 2001 to 2019.
2. Materials and Methods
2.1. Study Area
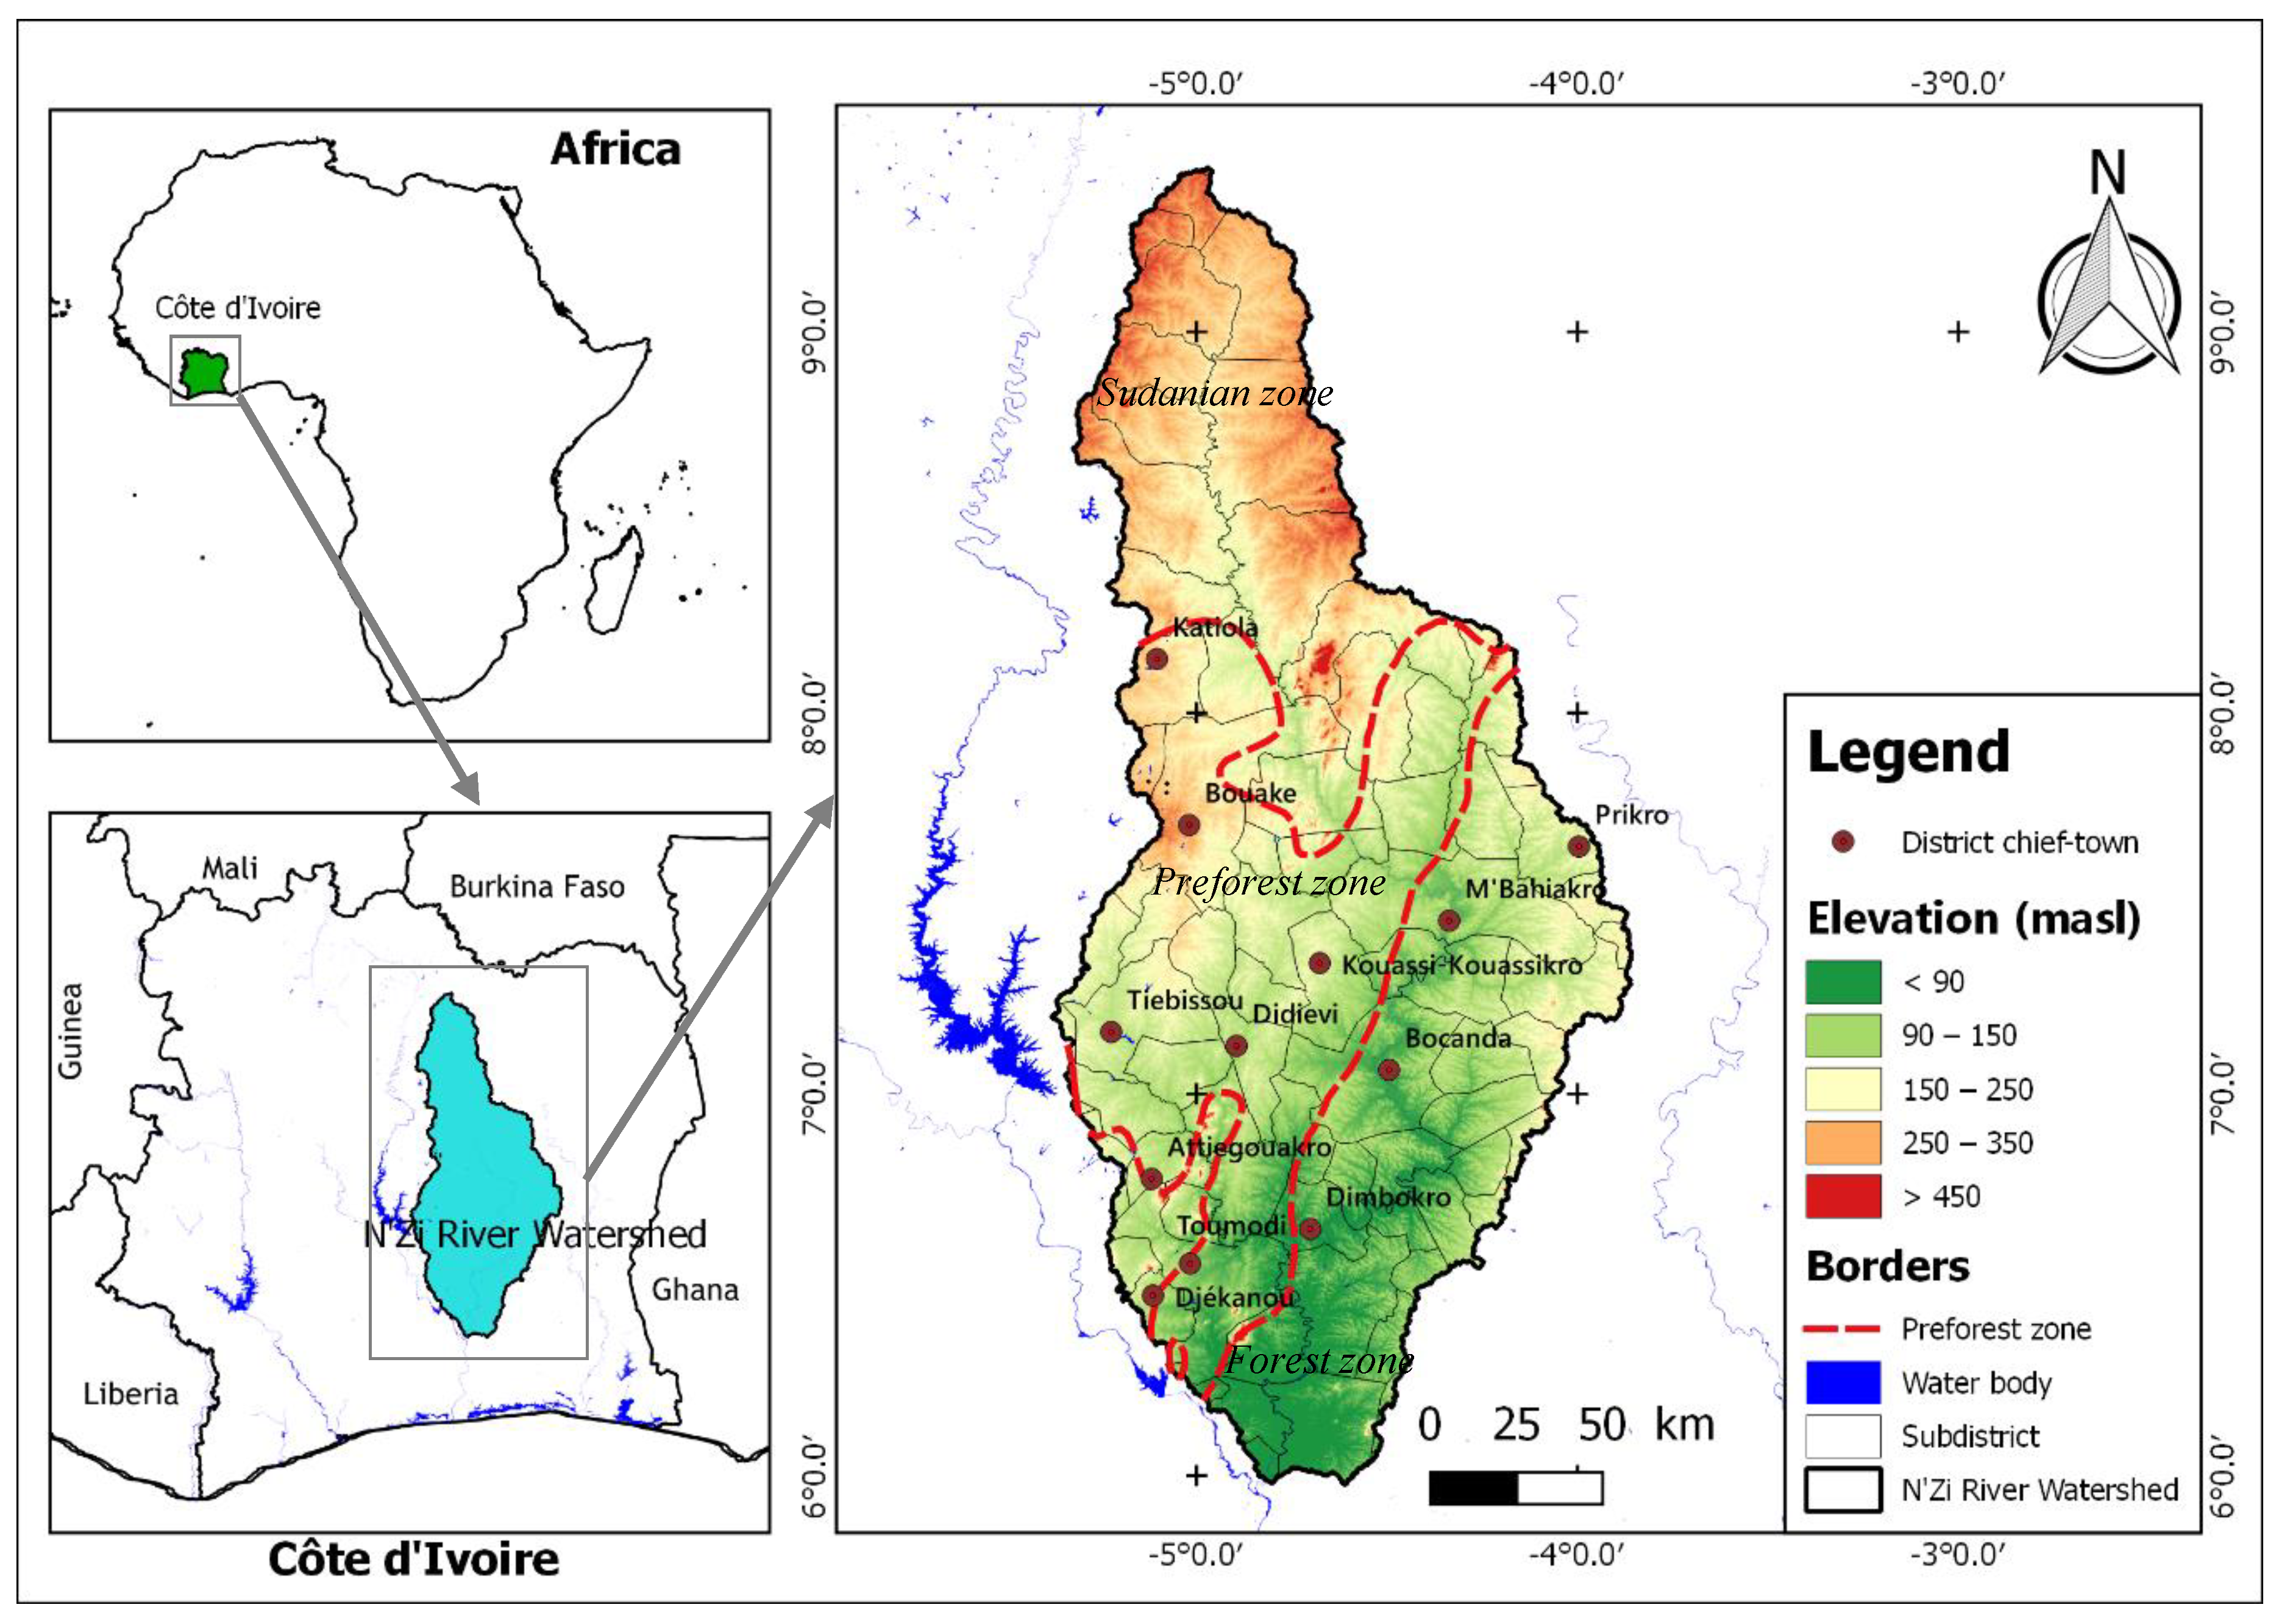
Located in central Côte d’Ivoire, the study area is the N’Zi River Watershed, a tributary of the Bandama River. It lies between 3°46′ W and 5°24′ W longitude and between 5°58′ N and 9°26′ N latitude, with an altitude ranging between less than 100 m above sea level (a.s.l.) in the south and more than 600 m a.s.l. in the north (Figure 1). With an approximate area of 35,309 km2, the NRW occupies nearly 11% of the national territory and straddles 80 subdistricts [1]. The population of the NRW was estimated at 2,866,836 inhabitants according to the 2014 General Census of Population and Housing [65].
Due to its longitudinal configuration, the NRW spans the major climatic regions of Côte d’Ivoire and is covered by forest ecosystems in the south, mosaic forest‒savannah ecosystems in the center, and savannah ecosystems in the north [66,67].
According to the Köppen–Geiger climate classification, the climate of the study area is of Aw type (warm and humid). In the forest zone, an equatorial transition climate (Guinean climate) with annual rainfall between 1300 and 2400 mm can be found [67]. In this area, the characteristic of the vegetation is a dense moist forest with some remaining forests on the tops of hills and in the classified forests [68]. In the pre-forest zone, there is an attenuated equatorial transition climate (Baoulean climate). The annual rainfall ranges between 1500 and 2200 mm. The vegetation is characterized by Guinean forest‒savannah mosaic, with forest patches along the river [67]. The open forests are composed of trees whose crowns almost meet, below which the land and grass cover is very sparse. The wooded savannahs and open wooded savannahs are made up of trees or shrubs sparse with gramineous groups (especially Panicum spp., Loudetia arundinacea, L. simplex, etc.) and elephant palm (Borassus aethiopum) stands, which are easily affected by wildfires [68]. These two ecoregions have two dry seasons and two rainy seasons. In the Sudanian zone, the climate is characterized by a dry tropical transition climate (Sudano-Guinean climate) with two seasons [67]. The landscape is mainly composed of grassland and wooded grasslands. In this area, the herbaceous cover, ranging in height from 20 cm to 1.5 m, is composed of species of Panicum and Pennisetum, which are regularly affected by wildfires [68].
2.2. Active Fire and Burned Area Data
Spatial and temporal patterns of wildfire occurrence in the area were assessed with a combination of the Moderate Resolution Imaging Spectroradiometer (MODIS) MCD14DL active fire products with a resolution of 1 km [69], VIIRS VNP14IMGTDL active fire products with a resolution of 375 m [70], derived from the MODIS and VIIRS sensors, respectively, and burned area scars generated from the 500 m resolution MODIS burned area product MCD64A1 [71]. The Moderate Resolution Imaging Spectroradiometer (MODIS) is an onboard sensor aboard the Terra and Aqua satellites of the Earth Observing System (EOS) program of the National Aeronautical and Space Administration (NASA), launched in 1999 and 2002, respectively [72].
The MODIS MCD14DL Collection 6 and VIIRS VNP14IMGTDL products contain geographic coordinates, day of detection, brightness temperature, fire radiation power, and detection confidence level for all MODIS/VIIRS fire pixels. These data were produced by the University of Maryland and are downloadable from the NASA LANCE FIRMS website [73,74].
The MCD64A1 Burned Area product is a monthly Level 3 MODIS 500 m resolution product, derived from the Terra/Aqua MODIS sensor, containing per-pixel burn information and metadata [75]. The pixels detected as burned pixels are directly converted into burnt areas. Monthly data from the MODIS subcontinental Windows 9, containing data of West African countries, available on the University of Maryland server ftp://ba1.geog.umd.edu, were used for this study.
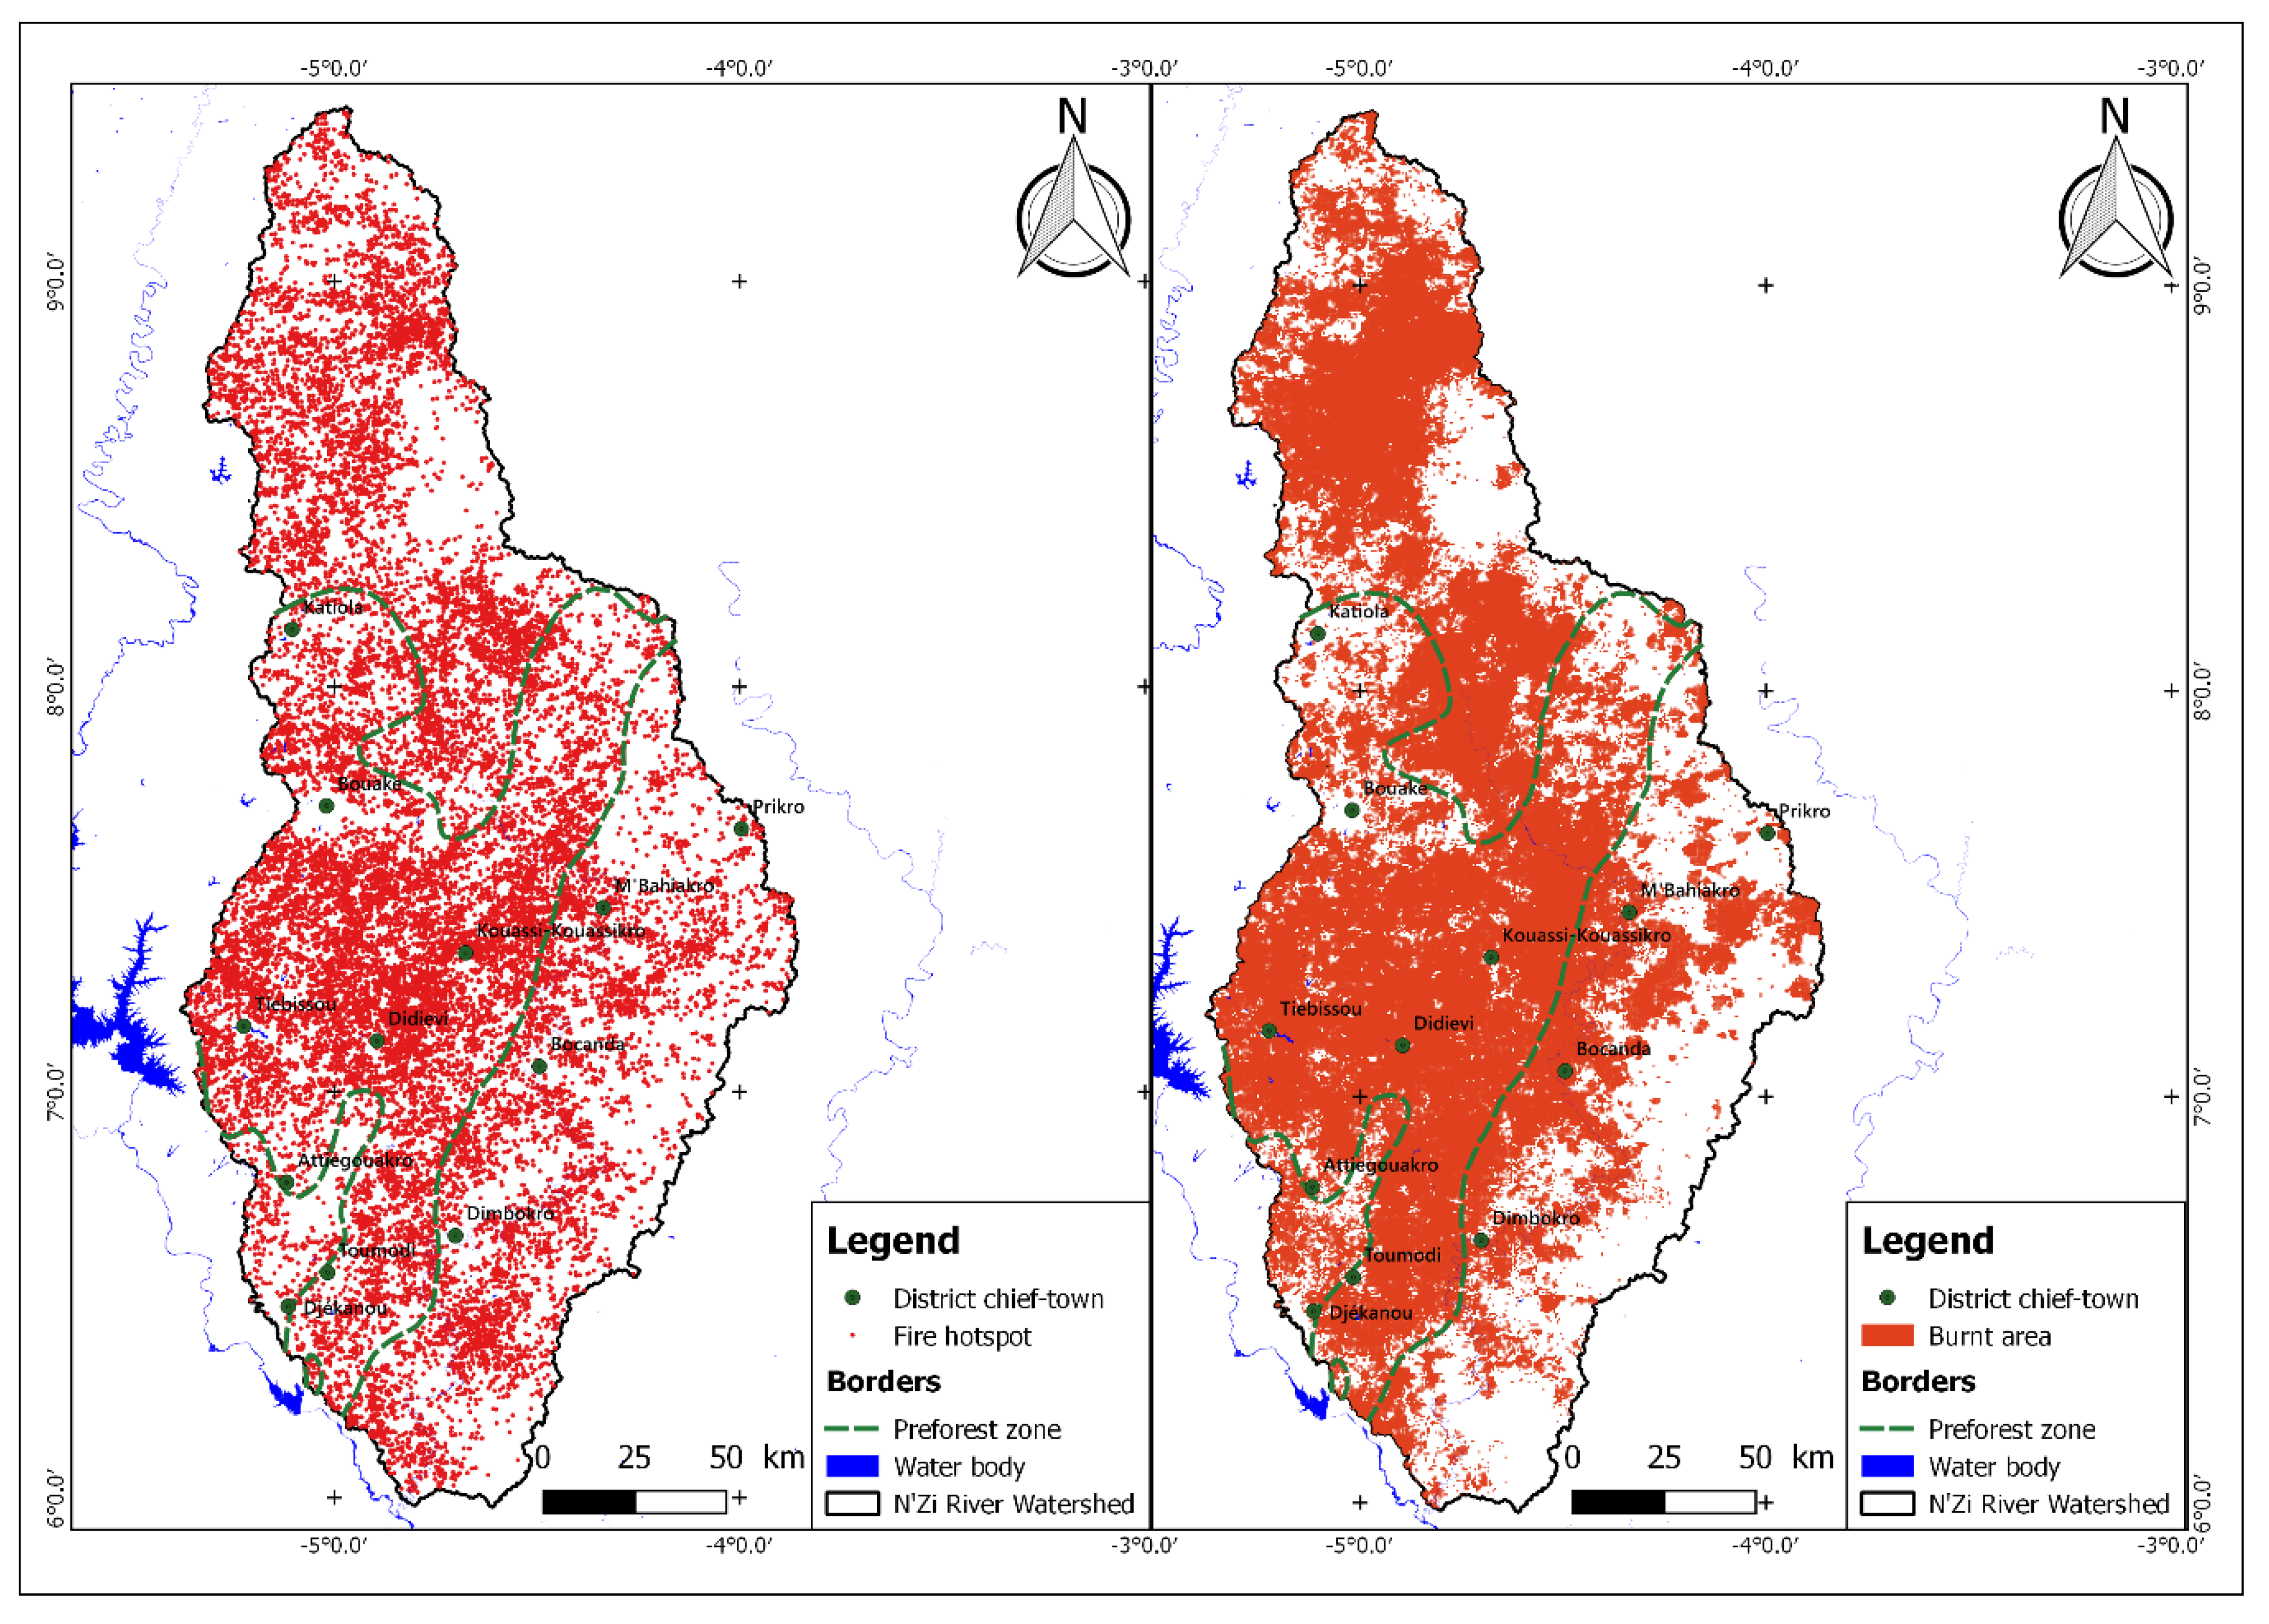
For this study, we used monthly data of two pyrological time series composed of the number of wildfires (NF) and burned areas (SB) of the NRW. The number of wildfires is composed of the monthly values of daily active hotspots, while burnt areas represent monthly values of the fire patch size in the landscape. In total, we found 21,362 fire events burning 78,226.11 km² of vegetation in the region during the period 2001–2019 (Figure 2).
2.3. ARIMA Modeling
Modeling of time series subjected to random disturbances could be performed using ARIMA models. These models allowed the combination of three types of temporal processes: Autoregressive processes (AR), moving average processes (MA), and integrated processes (I). In general, an ARIMA model (p, d, q) is a combination of these three types of processes, p, d, and q, respectively denoting the order of the autoregressive process, the order of integration, and the order of the moving average [76].
The generic form of ARIMA modeling is presented in Equation (1).
where and are the autoregressive and moving average operators, is the value of fire occurrence Y at a given time t, is the uncorrelated random error with zero mean and unit variance (white noise), L is the lagged operator, and d is the number of the series differentiation.
For seasonal ARIMA, or the SARIMA model, the general model is denoted as ARIMA(p,d,q)(P,D,Q)S and the generic form of the modeling is given by the Equation (2):
where is the usual Gaussian white noise process, is the ordinary autoregressive polynomial, is the seasonal autoregressive polynomial, is the ordinary moving average polynomial, is the seasonal moving average polynomial, L is the monthly lagged operator, is an ordinary difference component, is the seasonal difference component, is the value of fire occurrence Y at a given time t, and is the uncorrelated random error with zero mean and unit variance (white noise).
In the framework of this study, we forecasted fire activity (number of wildfires and burned areas) using seasonal ARIMA models. To apply this method, the following three stages proposed by Box and Jenkins should be followed: Identification, estimation, and diagnosis [58,62,76,77,78]. The stationarity of the time series was evaluated using the Augmented Dickey–Fuller (ADF) and KPSS (Kwiatkowski–Phillips–Schmidt–Shin) tests, preceded by a Box–Cox transformation aimed at stabilizing the variance. Indeed, given the non-normal distribution of the residuals of the studied variable time series (X), their natural logarithm was used to meet statistical assumptions of normality. One unit was added to these variables to avoid null values in the logarithmic calculation (Equation (3)).
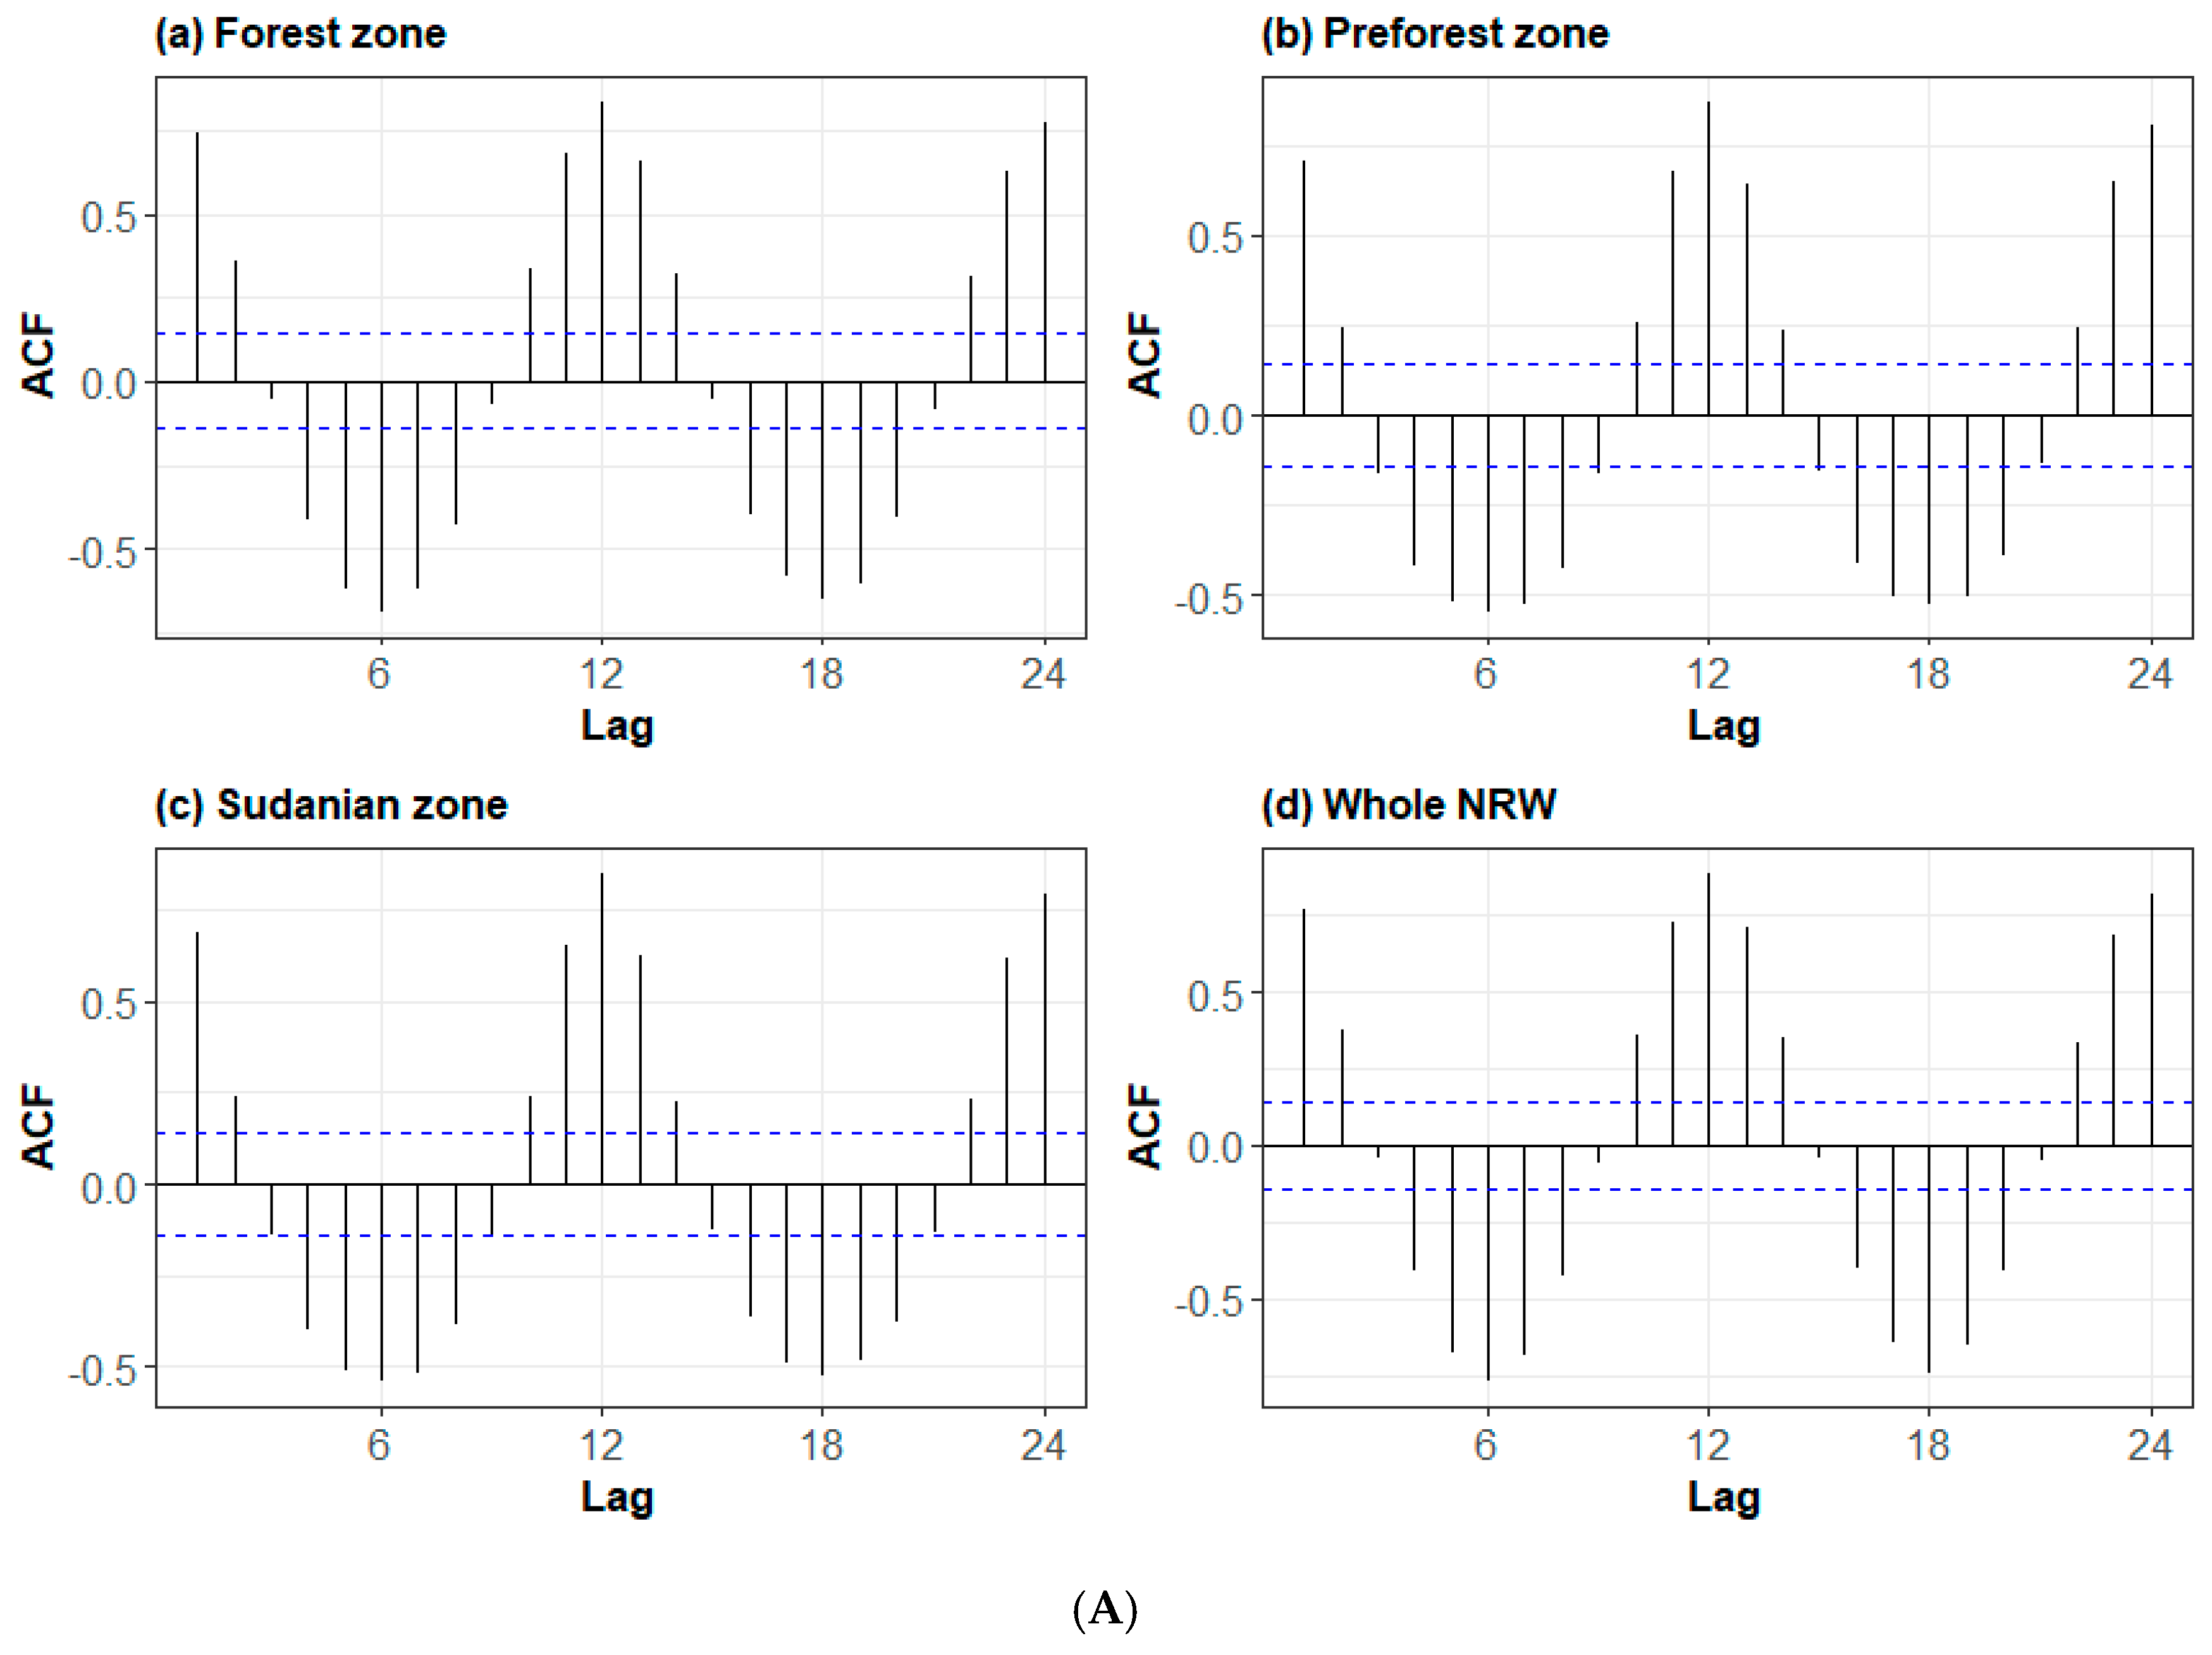
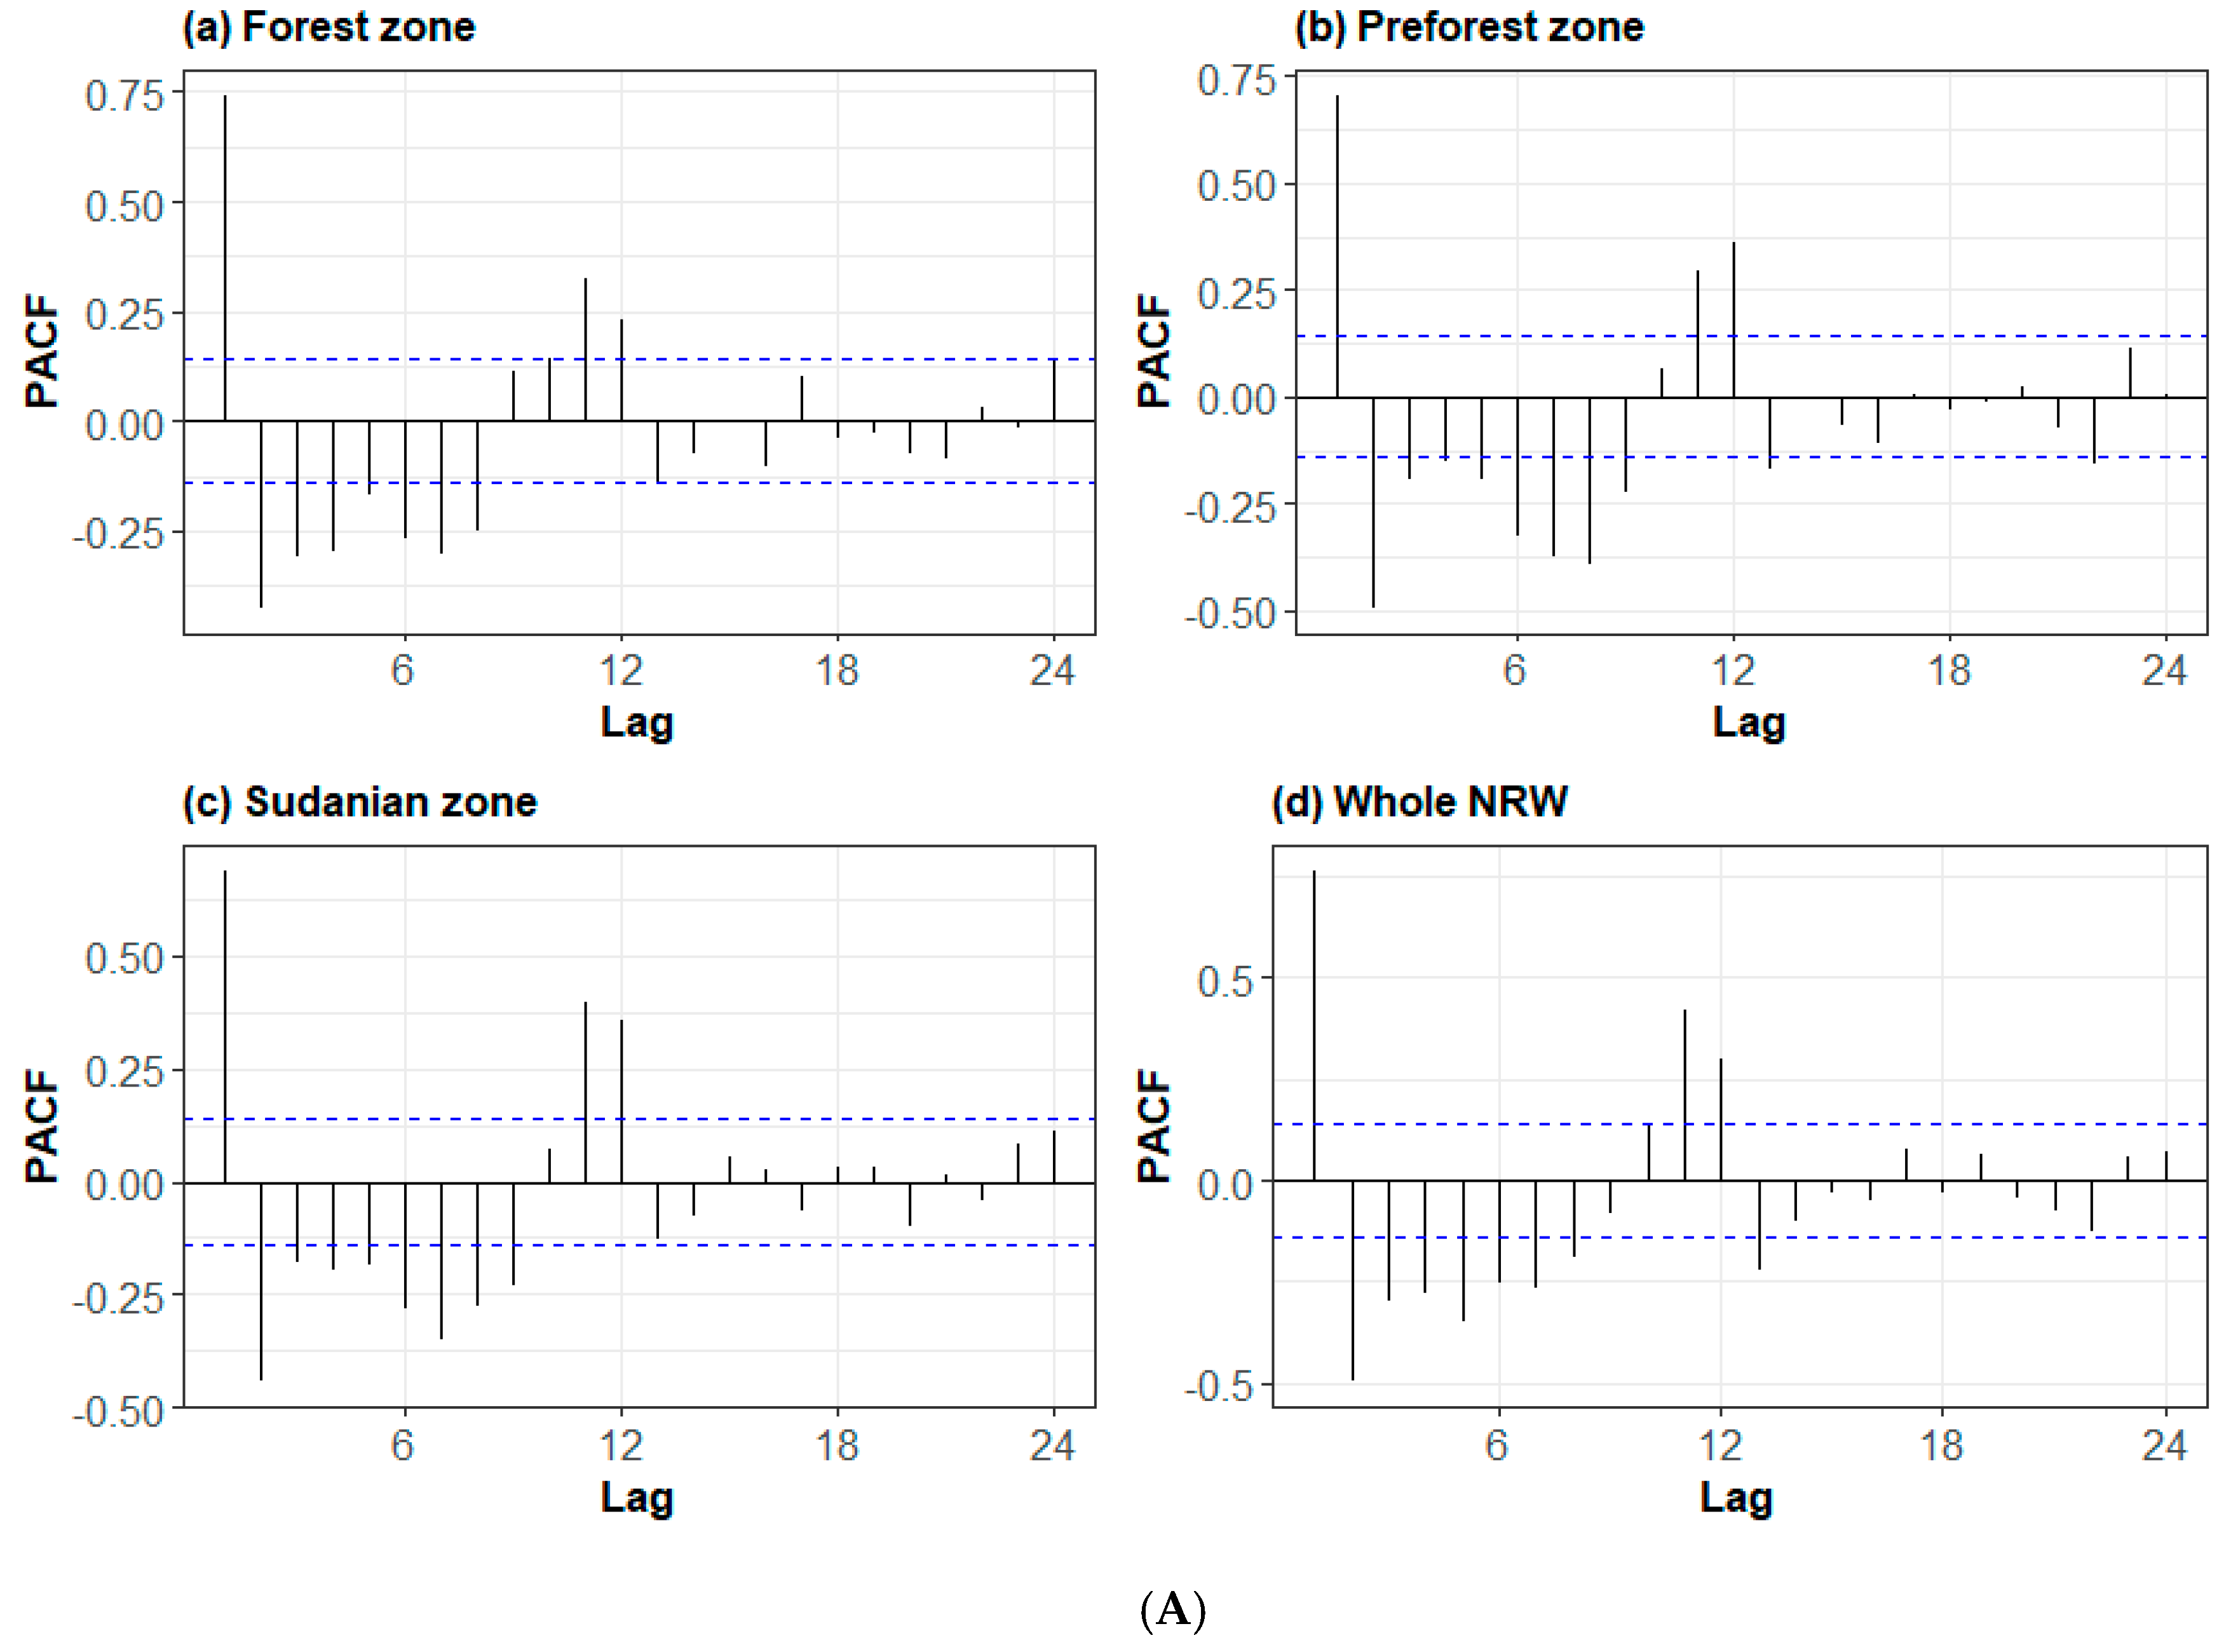
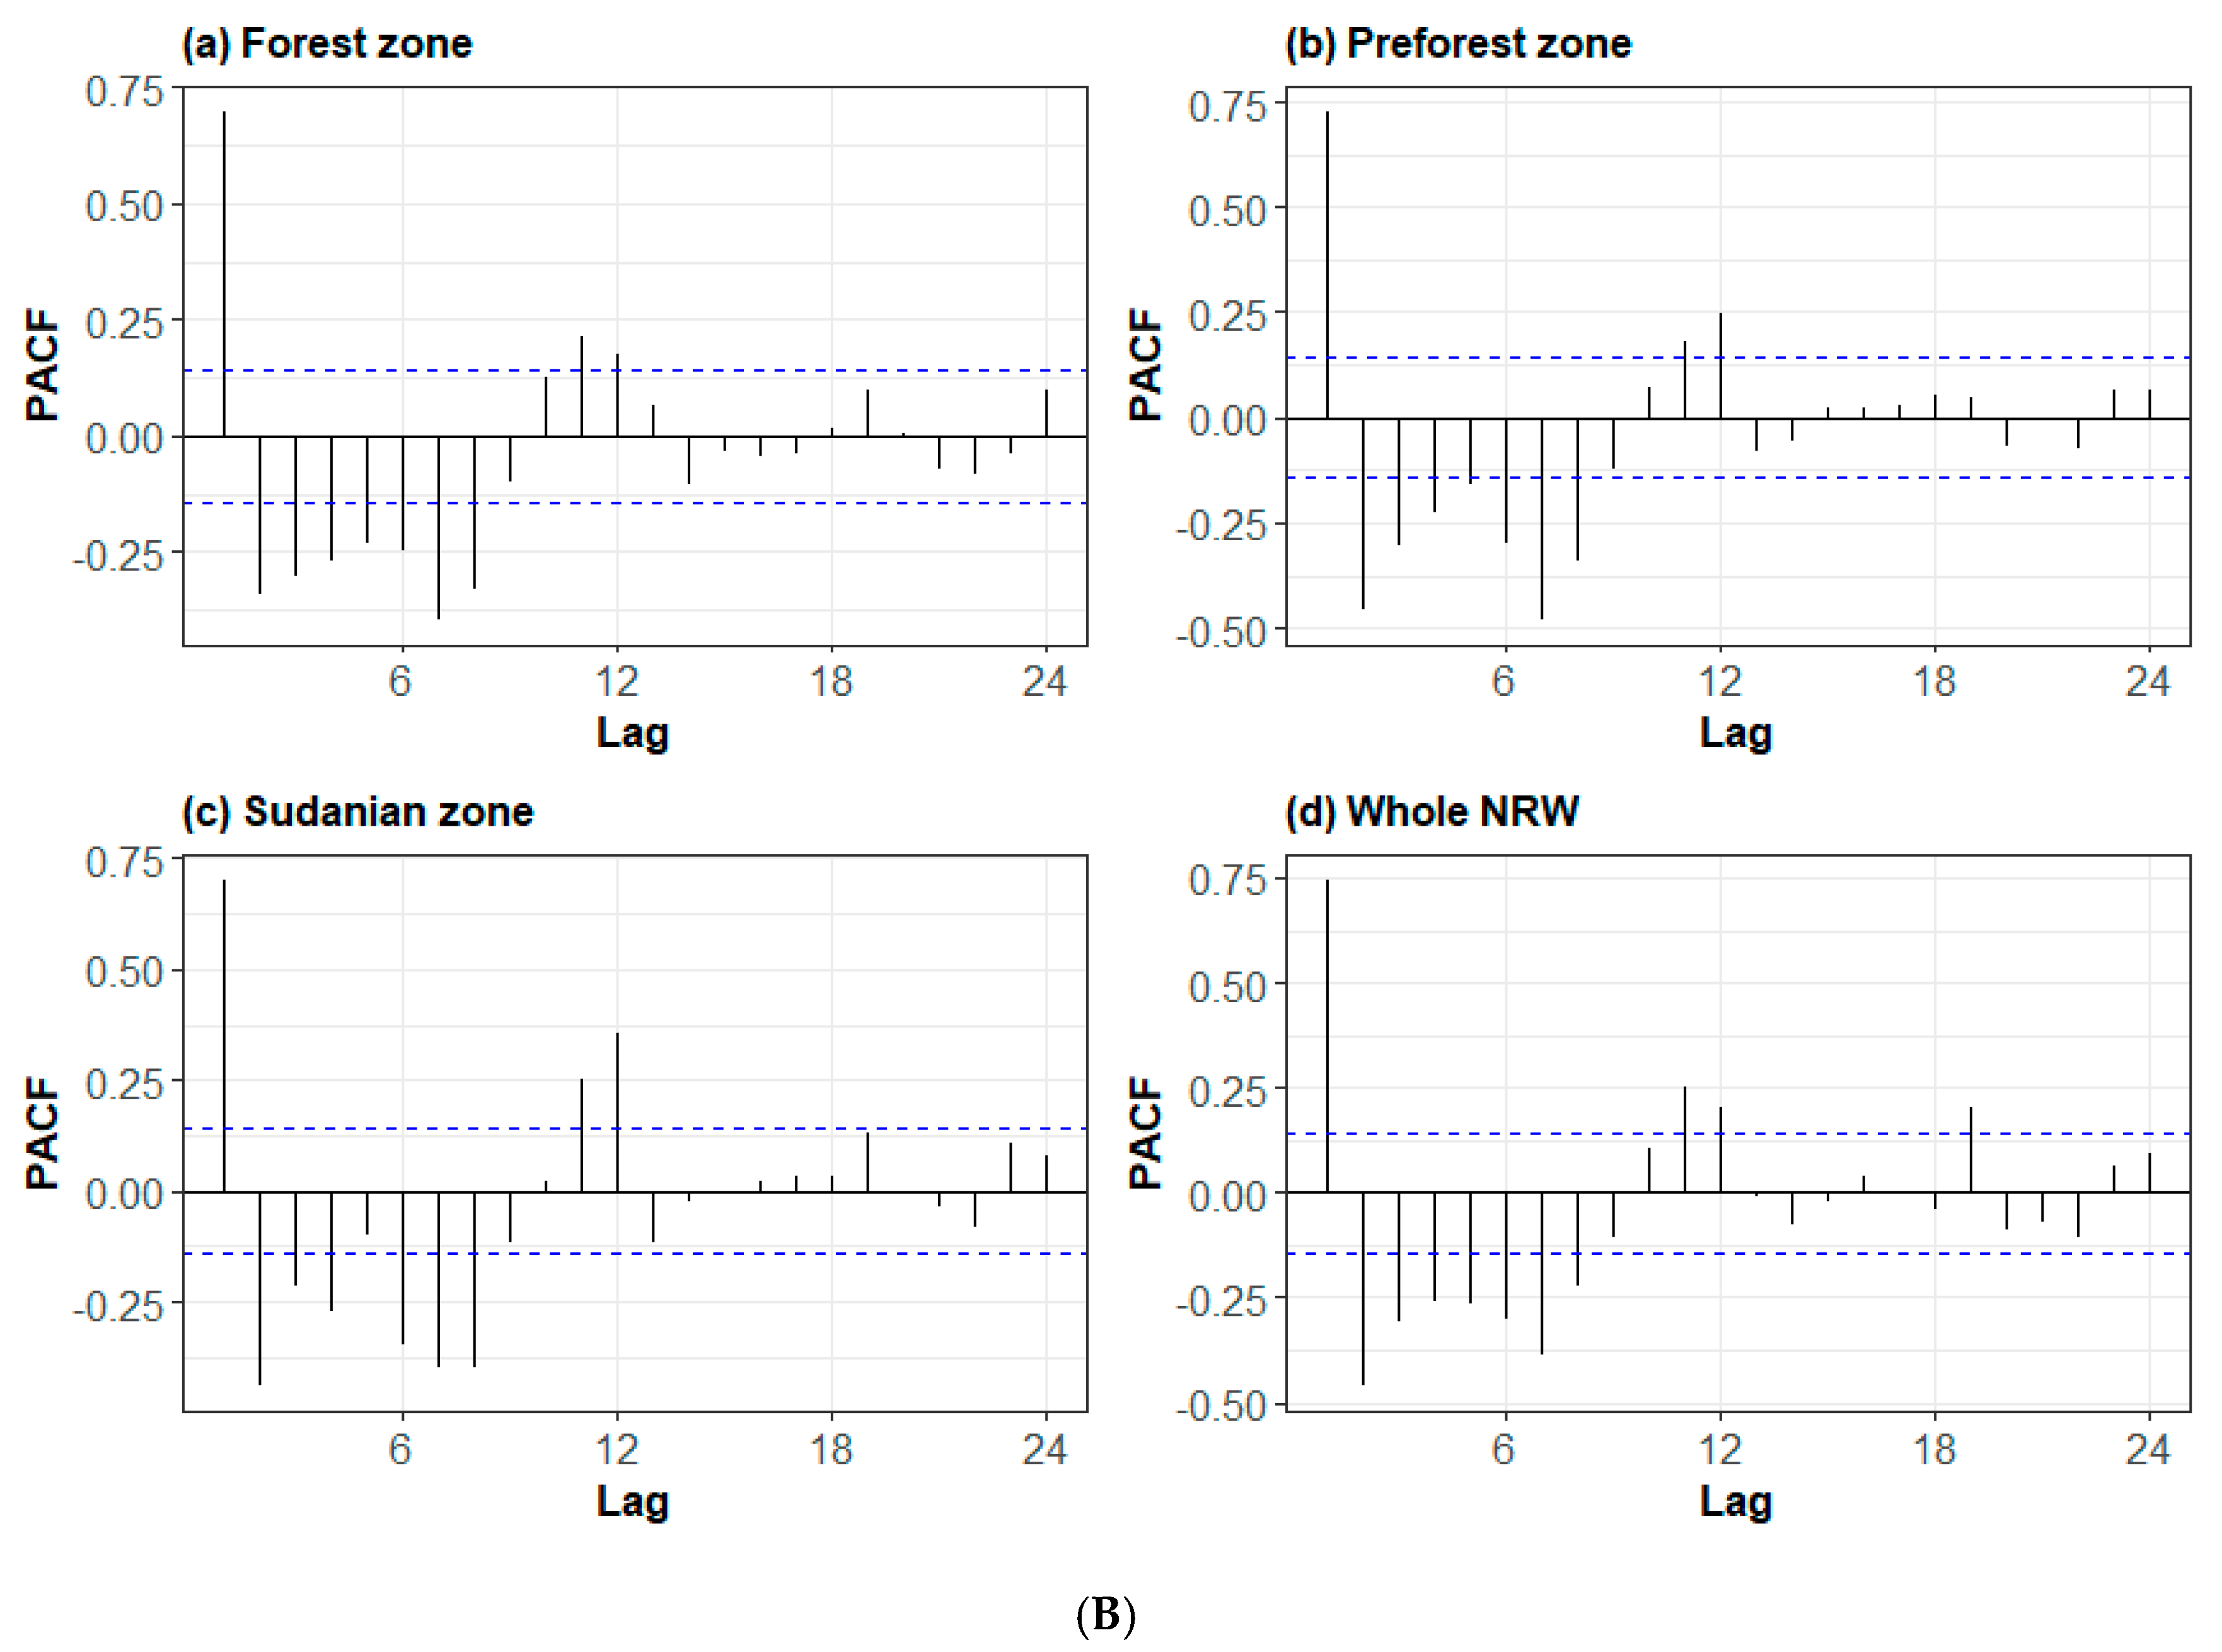
The dependence between the pyrological time series (wildfire occurrence and burned areas) was analyzed using autocorrelation functions (ACF) and partial autocorrelation functions (PACF). Correlograms were plotted with a 95% confidence level to determine statistically significant coefficients.
The SARIMA models and the coefficients were estimated using the auto.arima function in R software [79]. This function combined unit root tests, Akaike’s Corrected Information Criterion (AICc) minimization, and maximum likelihood evaluation to automatically select the appropriate SARIMA model [80]. These models were studied at a 95% confidence level. In addition, the simulated values were compared to the values of the actual data to evaluate the predictive ability of the models.
The predictive performance of the models was assessed by the evaluation of the significance of the parameters, residual analysis (autocorrelation, normality, Ljung–Box test), time series cross-validation, and error analysis (Root Mean Square Error—RMSE, Mean Absolute Error—MAE, and Mean Absolute Scaled Error—MASE) [81,82,83]. For cross-validation, the dataset was subsetted in two portions, training and test data, where the training data were used to estimate any parameters of a forecasting method and the test data were used to evaluate its accuracy [76]. The training dataset ranged from 2001 to 2016, while the test dataset covered 2017–2019.
After demonstrating that the residuals of the models were white noise and that the models were accurate (lowest RMSE values), a forecast of the future values of the studied variables was made using the valid SARIMA model resulting from modeling. In this study, these forecasts were made over four years (2020–2023). The analyses were performed using the packages forecast [80,84] and trend [85] of the R software [86].
3. Results
3.1. Study of the Stationarity
The stationarity of the time series is a fundamental hypothesis in ARIMA modeling. The stationarity of the pyrological time series was examined by the ADF and KPSS tests using the training dataset (Table 1).
Table 1 showed that the KPSS test statistic was much smaller than the 1% and 5% critical values, which indicated that the stationarity hypothesis is accepted.
In addition to this test, the p-value of the ADF test was greater than 5% for all NRW ecoregions, showing the non-stationarity of wildfire occurrence and burned area time series for all NRW ecoregions. Therefore, the series were trend stationary, and these trends were removed by seasonal differencing (D = 1) to make the series’ stationarity strict. These two results suggested that the studied pyrologic variables were all stationary.
3.2. Dependency Analysis
The autocorrelations of the pyrological time series (number of wildfires and burnt areas) were presented by autocorrelation function (ACF) and partial autocorrelation function (PACF). Figure 3 and Figure 4 show the results of the ACF and PACF of the number of wildfires and burned areas, respectively.
The variation of the autocorrelation functions confirmed the suspected evolution of the autocorrelation function in all the study sites about the different peaks. Strong correlations were mainly observed by offsets of annual periods. It was evident that a dominant period of six months was present in all ecoregions.
For this reason, seasonality was suspected because autocorrelations in the vicinity of k = 6, 12, 18, or 24 shifts greatly exceed the 95% confidence interval. The significant peak at lag 6 in the ACF suggested a first-order non-seasonal moving average component and a first-order autoregressive component. The graphs showed a seasonality of 12 months for the studied time series.
The partial autocorrelation was calculated to determine the periodicity. The significant peak in PACF at lags 1 and 2 suggested a first-order seasonal moving average component.
The two blue dashed lines across the plot indicate the point of statistical significance. Values between these lines and zero are not statistically significant, while those above and below the lines (towards one and minus one) are significant.
3.3. Wildfire Activity Modeling
The pyrological time series were modeled using SARIMA models derived from automated algorithms. The best models were selected based on the lowest AICc. The summary of the SARIMA modeling of the time series of log(NF + 1) and log(SB + 1) in the three ecoregions of the watershed is presented in Table 2.
The pyrologic variables did not present a non-seasonal autoregressive order, except for the number of wildfires in the forest zone and burned areas in the pre-forest zone. The number of seasonal AR processes was evaluated at 2, except the number of wildfires in the forest zone and in the whole NRW, which did not show any seasonal autoregressive processes.
The maximum number of seasonal and non-seasonal MA processes was 1. The identified period for the phenomena studied was 12 months. All the coefficients of the SARIMA models were significant at the 5% threshold except for the MA1 coefficients of burned areas in the Sudanian zone and the whole NRW, MA1 of the number of wildfires in the forest zone, AR1 of burned areas in the pre-forest zone, and SAR1 of burnt areas and the number of wildfires in the forest and pre-forest zones, respectively.
A differencing was applied to all the time series to stationarize them, and could be identified by the seasonal differencing order (D = 1) of the ARIMA models (Table 2).
Wildfire occurrence in the pre-forest zone and total burnt areas in the forest zone followed the same ARIMA(0,0,0)(2,1,1)12 model. In addition, the burnt areas in the whole NRW and the total number of wildfires in the Sudanian zone showed the same ARIMA(0,0,1)(2,1,0)12 model.
3.4. Model Assessment
In order to use the results of the SARIMA modeling for the prediction of the studied phenomena, the validity of the models was tested using the Ljung–Box test, residual analysis, and cross-validation. Table 3 presents the summary statistics of the Ljung–Box test.
The results of the Ljung–Box test (or portmanteau test) were not significant (the p-values were greater than 5%), as shown by Table 3. In addition, the large values of Q* suggest that the autocorrelations do not come from a white noise series. Therefore, we concluded that the residuals were not distinguishable from white noise. The ACF plots of all SARIMA model residuals for the studied pyrologic variables showed that all autocorrelations were within the threshold, indicating that the residuals behave like white noise. In addition, we noted that the SARIMA model residuals of wildfire occurrence (Figure S1) and burned areas (Figure S2) had constant variance and followed a normal distribution, as demonstrated by the histogram and the graph of residuals.
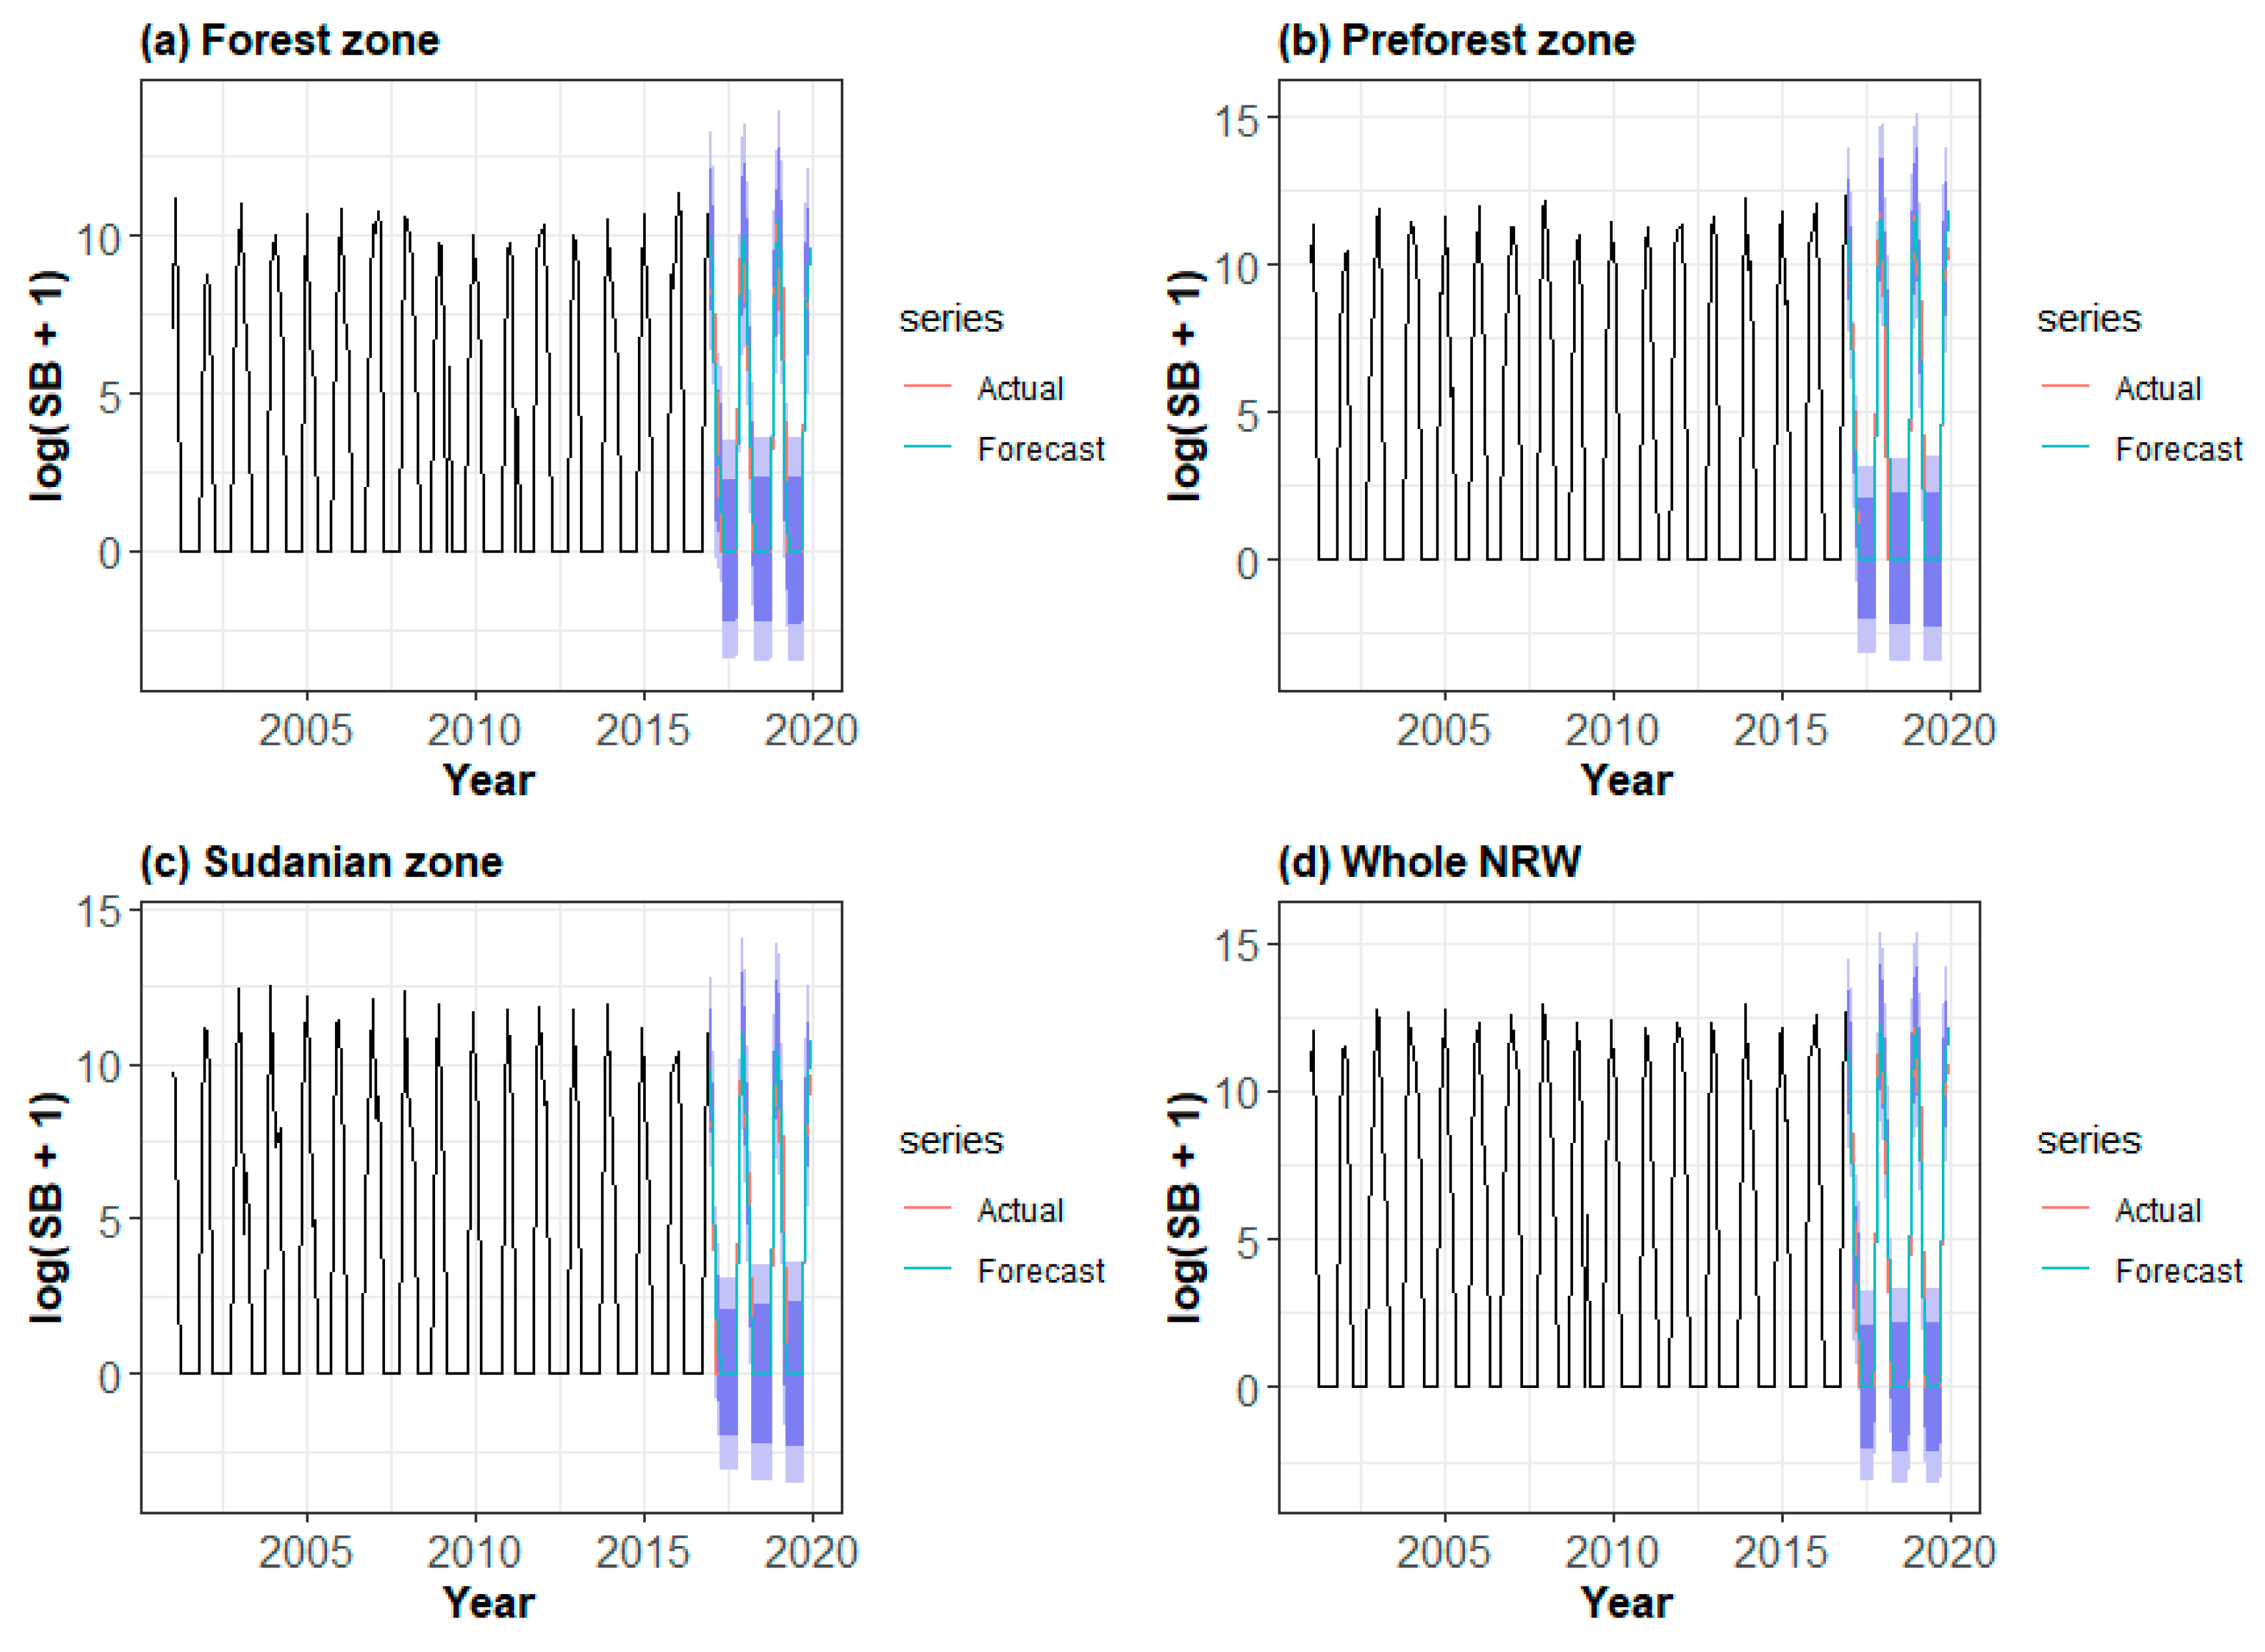
Figure 5 and Figure 6 show the forecasts of ARIMA applied to the monthly number of wildfire occurrences and the total burnt area estimation, respectively, using data only up to the end of 2016. The results showed that the actual values matched the predicted values at a 95% confidence level.
For determining the prediction models, the testing and training RMSE values of each ecoregion were computed. Table 4 shows the testing and training forecast error values of wildfire activity in each ecoregion. RMSE values ranged from 0.5 to 1.7, while MAE values varied between 0.3 and 1.0, which presages a good quality of the models. The testing RMSE values were lower than training RMSE values and showed the good performance of the fitted models.
In addition to these tests, a visual comparison of observations and model-adjusted data was made. This comparison showed that the models reproduced all the historical data very faithfully, which gave a high degree of confidence in the models.
The comparison graphs of the observed and simulated values showed that the models, except for a few peaks, regularly reproduced the seasonal peaks. As a result, models could be used to forecast wildfire activity on a specific horizon. In this study, we forecasted the monthly wildfire occurrence and total burned area estimation in the next four years.
3.5. Forecast of Wildfires’ Dynamics
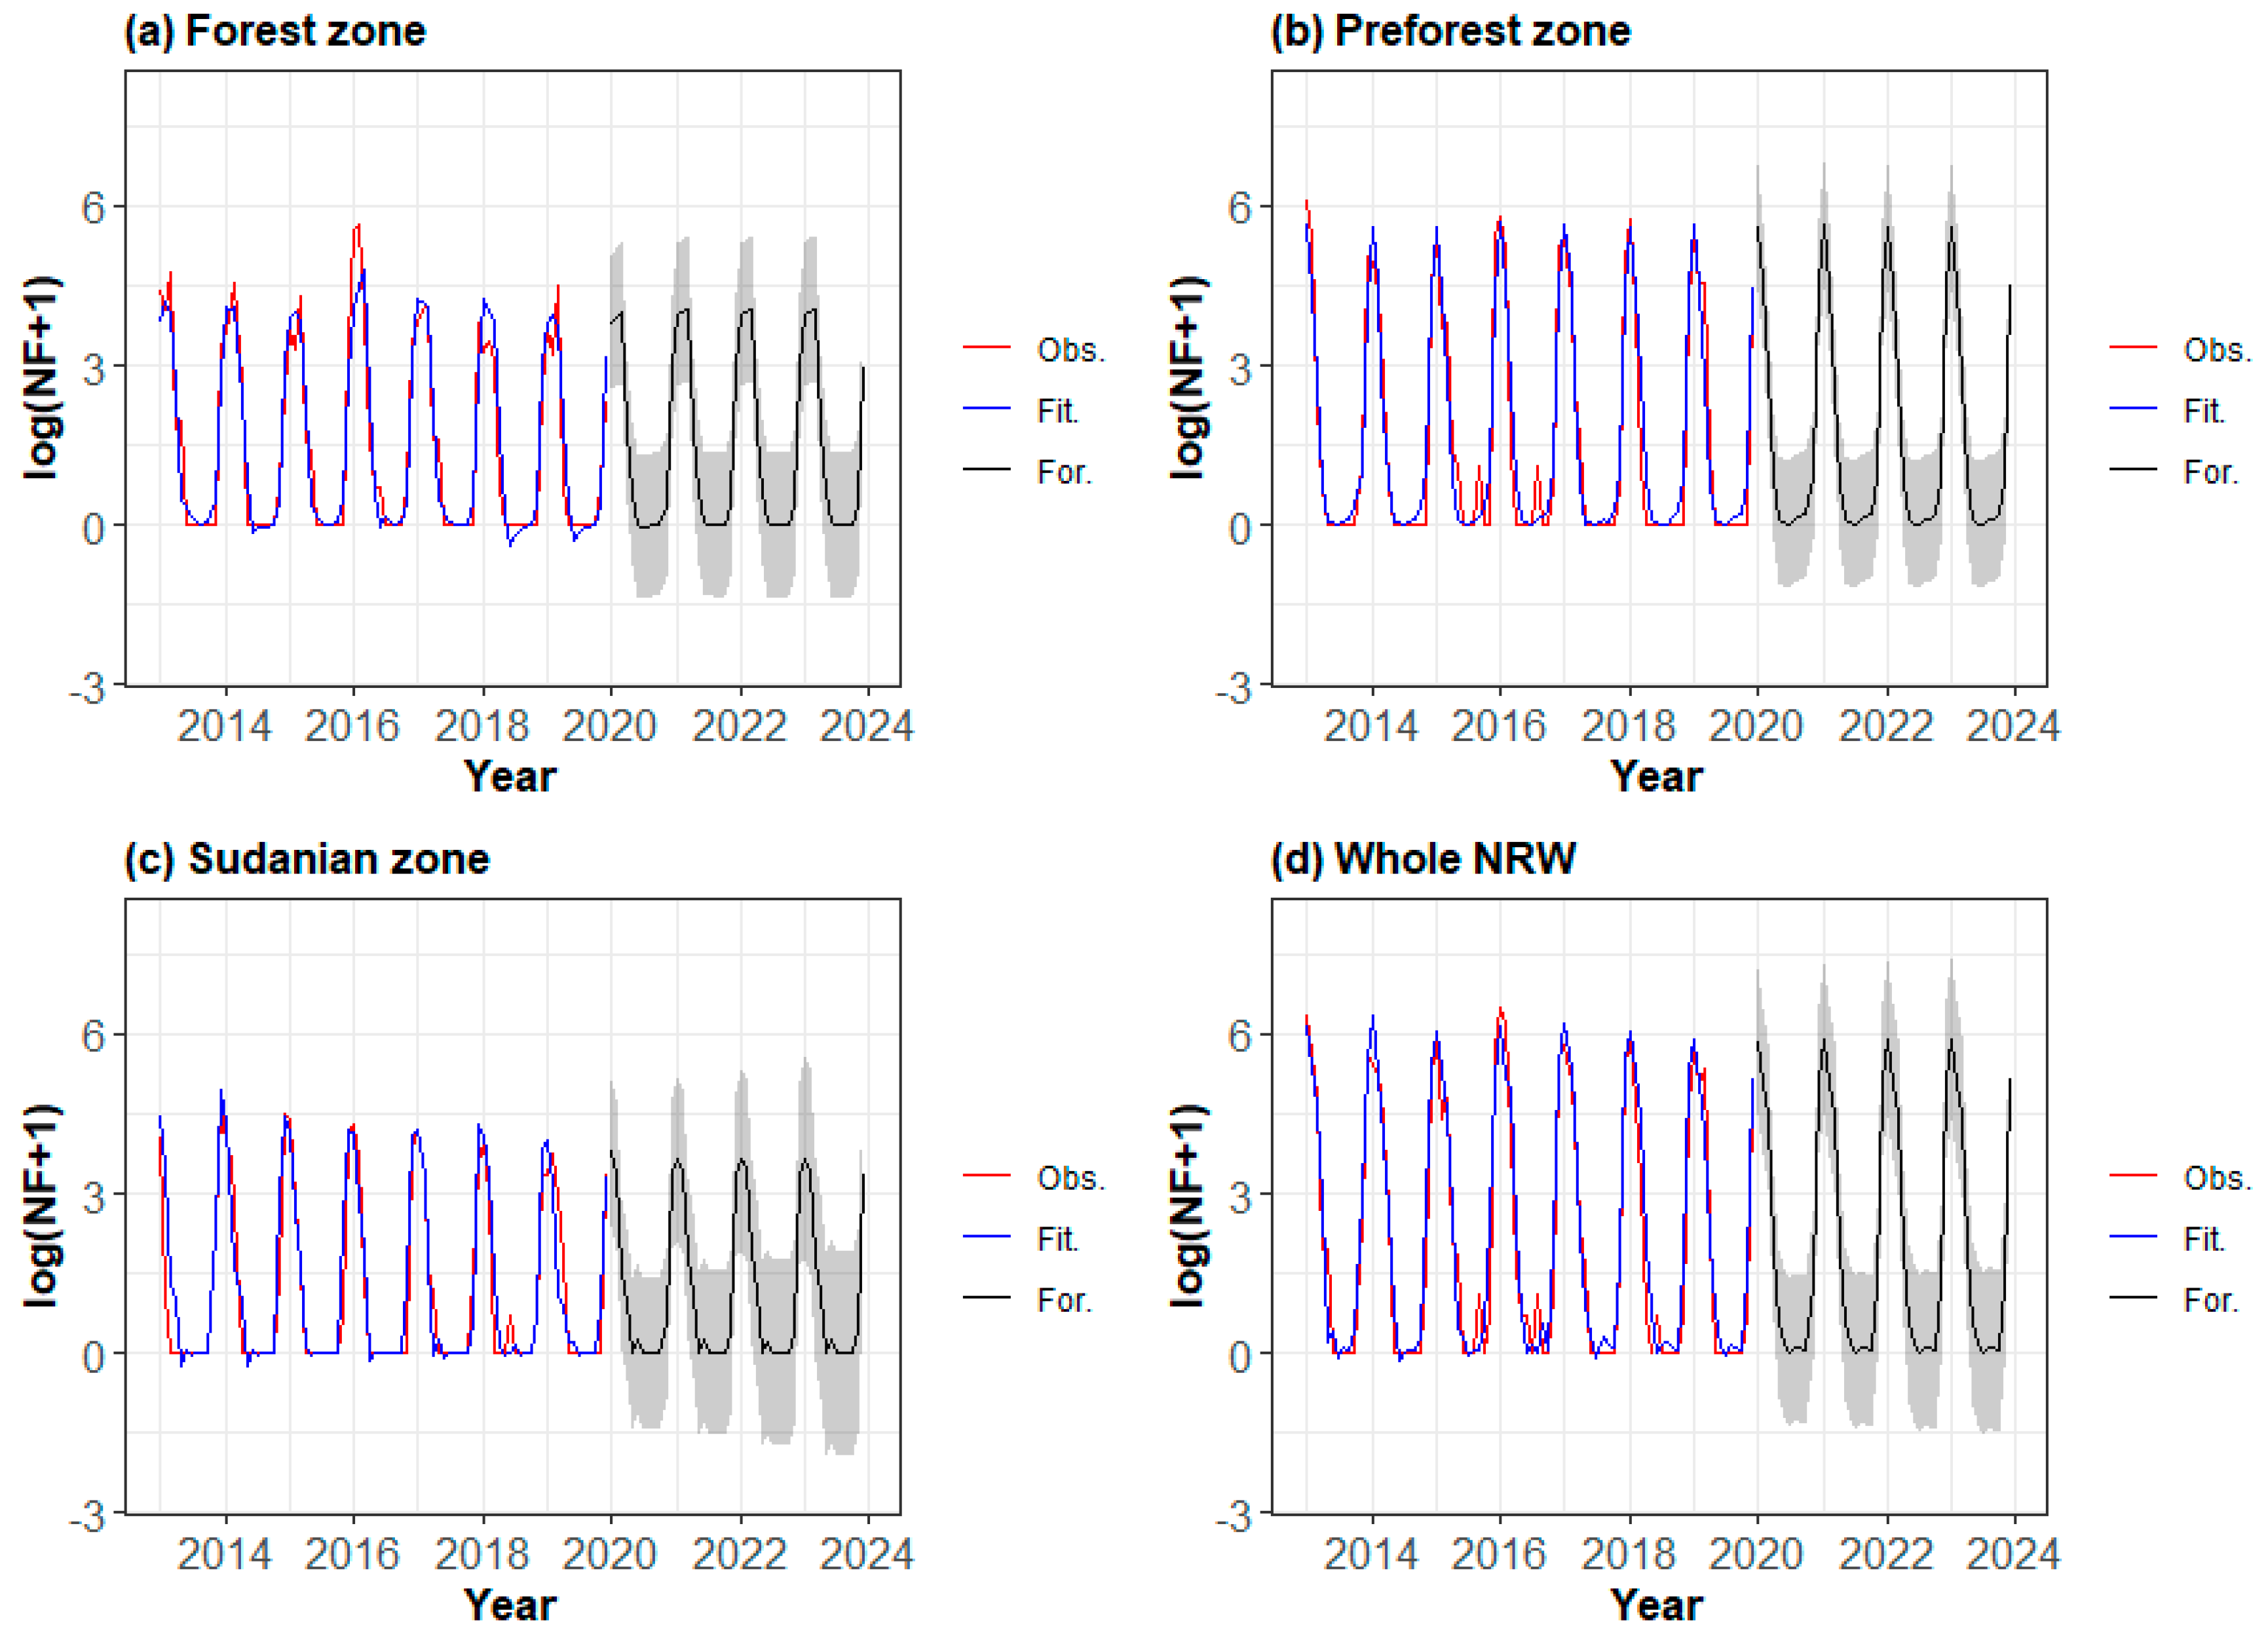
SARIMA models assessed using the Box and Jenkins method were used to forecast monthly values of the number of wildfires and burned areas over a four-year horizon. Figure 7 shows the results of the predictions of the number of wildfires at a 95% prediction interval from 2020 to 2023.
The values of simulated fire foci followed historical trends in the logarithms of the pyrological variables across the ecoregions (Figure 7). The predicted peaks were relatively constant from one zone to another. The highest peaks were close to 4 in the forest and Sudanian zones, while they largely exceeded 5 at the level of the pre-forest zone and the whole NRW. The lowest peaks were all close to zero in all ecoregions. Confidence intervals remained constant except in the Sudanian zone, where growth in the forecast interval was noted. At the level of the whole NRW, these forecasts were estimated at 5.859 (i.e., 580 wildfires) for January 2020 and 5.116 (or 166 wildfires) for February 2020. For the year 2020, the forecasts of fire foci were evaluated at 783 wildfires across the NRW.
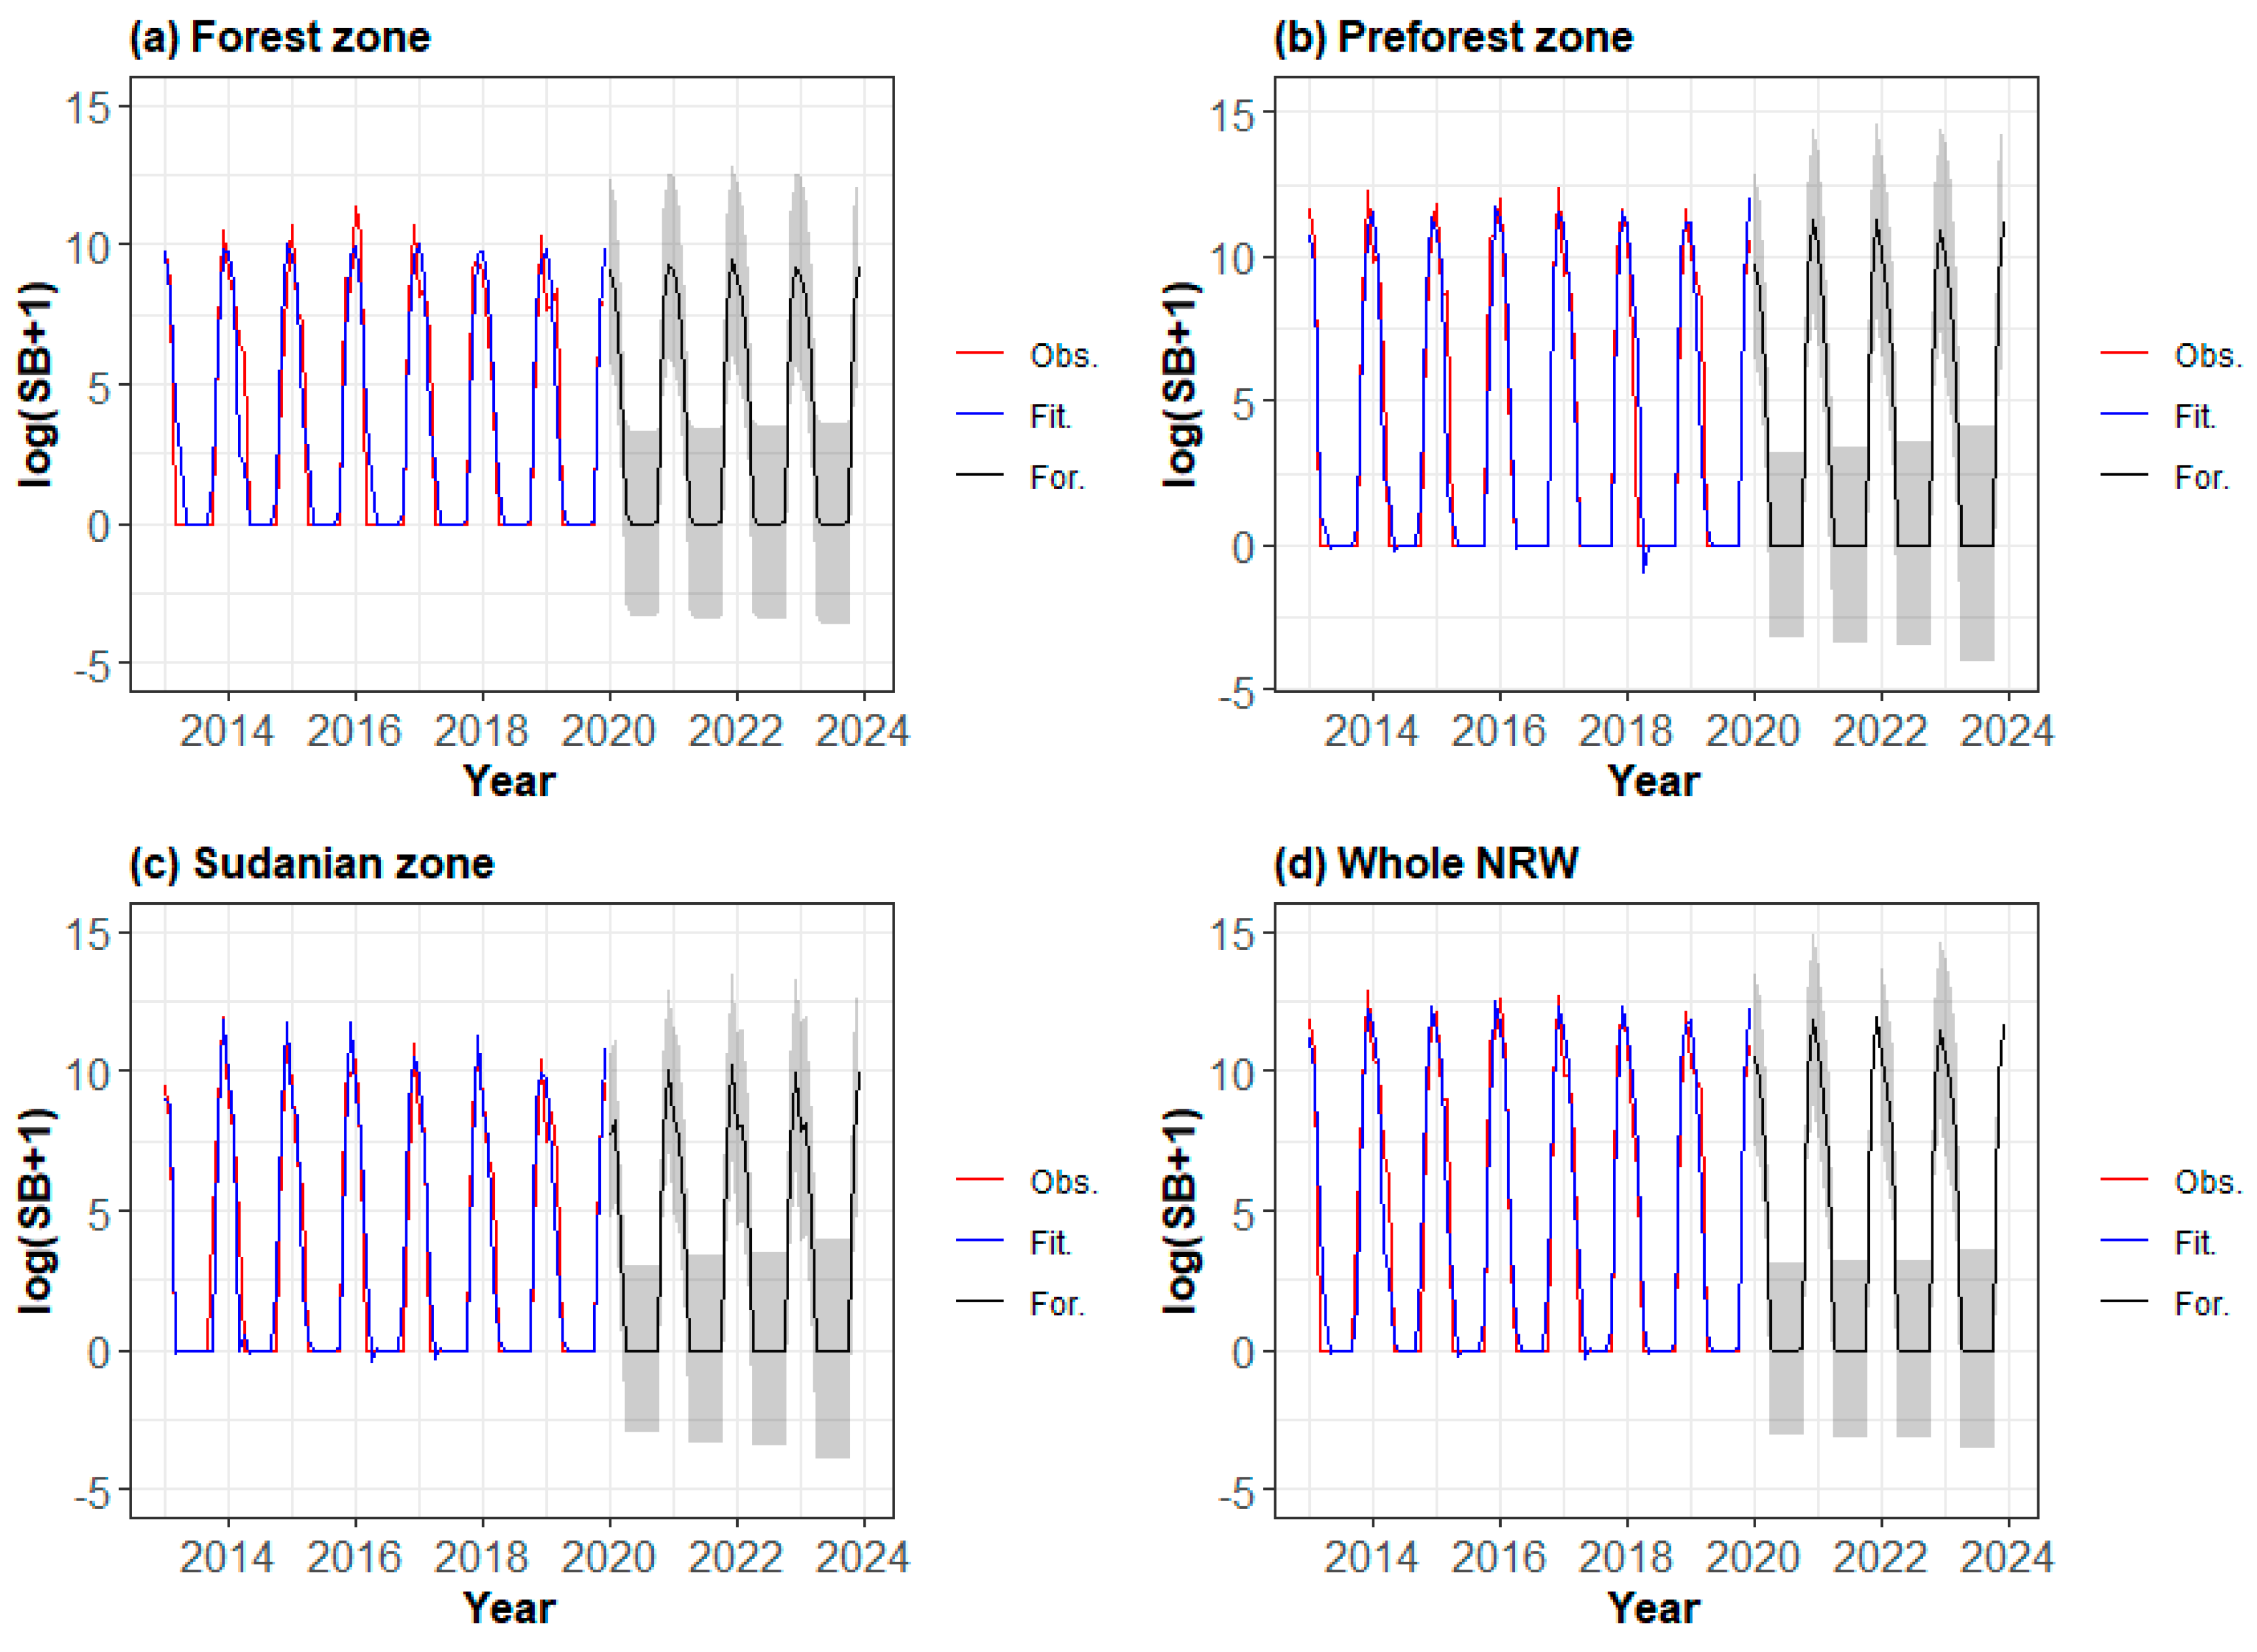
At the level of the burned areas, the results of the 95% interval forecasts in the different ecoregions of the NRW are shown in Figure 8.
Figure 8 shows that the logarithmic values of the burned areas perfectly follow the general trend of previous values across NRW ecoregions. At the level of the forest zone, the highest peaks were close to 10 in the forest and Sudanese zones, while they exceed 11 in the pre-forest zone and the whole NRW. The lowest predicted values were all close to zero in all ecoregions. However, it should be noted that the forecast interval was slightly higher in the Sudanian zone and the forest zone. These forecast intervals were low during the dry season (December to February).
For the whole NRW, these forecasts were estimated at 10.479 km² (35,566.34 km²) and 9.740 km² (16,984.90 km²) for January and February 2020, respectively. For the year 2020, the forecast of burned areas was estimated at 212,675.645 km² across the NRW.
The large and rapidly increasing prediction intervals showed that the wildfire activity (occurrence and damages) could start increasing or decreasing at any time.
4. Discussion
As part of this research, the seasonal ARIMA models adopted made it possible to forecast the pyrological series studied. Fire prediction is a major issue because of the complexity of the processes involved, the limitations of observational data, competitive interactions, and combined effects of several factors. The comparison of observed and simulated values shows that SARIMA models can be used to generate forecasts of fire activity in the studied landscape. Past trends in the pyrological data seem to continue in the future with a slight increase in the number of wildfires and burned areas by 2023. These forecasts were based essentially on historical values (business as usual scenario) and could quickly become obsolete in the case of adopting innovative fire prevention strategies or emerging better or worse environmental conditions in the study area. These results were close to those of Boubeta et al. [62] and Viganó et al. [63], who respectively used the ARIMA models for the prediction of burned areas in Spain and the occurrence of forest fires in the Pantanal in Brazil. To increase the confidence and relevance of our results, it would be very useful for similar analyses to be conducted within the study area or in other watersheds of the country, such as Bandama and Comoé, which are also undergoing wildfires. These analyses should include regressors such as climatic and biophysical variables (SARIMA models with exogenous variables, or SARIMAX). These SARIMAX models, similar to multivariate regression models, took advantage of the autocorrelation that may be present in the regression residuals to improve the accuracy of the forecast [84]. According to Taylor et al. [87], fire activity prediction models generally included variables that could influence the ignition potential (fuel type and moisture, ignition source, etc.) and take into account variations in topographical, meteorological, and fuel conditions (type, humidity, etc.). The authors did not analyze climate predictors in the current study due to the long period of missing values observed in the available climate dataset [2].
The forecast results showed that the one-month forecast depended only on observed values, while the two-month forecast depended on the one-month forecast and one observed value. The three-month forecast, on the other hand, depended on two-month and one-month forecasts, and so on. It thus appeared that the short-term forecasts (one or two years) were more reliable than the long-term forecasts about the biases that could be encountered within the predicted values. The lowest predictability values of wildfire occurrence and burnt areas can be attributed to the non-stationarity of the historical observations of the studied variables [88]. Newman et al. [89] showed that projections for the future that rely on models fit from non-stationary observations are fragile to expected changes in these parameters.
The forecasts of wildfire activity in the Sudanian zone showed a downward trend. Kouassi et al. [1] identified this trend and argued that it could be led by fuel patterns of this area. In addition, the shortening of the fallow period, the burning vegetation through early fire for livestock purposes, and the extension of fields increase the discontinuities of the landscape, which limit the spread of wildfires and the size of burnt areas [90].
The broad prediction intervals identified at the different peaks (high and low) could be explained by the great variability of recorded values within the pyrological variables during these periods. Their fine ranges show that the identified models have acceptable accuracy and the uncertainty in the forecasts is almost similar [76]. The number, the severity, and the size of wildfires varied considerably by region and year, partly due to large-scale, top-down drivers of wildfire, such as climatic variations (rainfall, temperature, etc.), environmental conditions (desiccation rate, vegetation types, etc.) and demographic and behavioral factors [87,89]. In addition, more mechanistic and smaller-scale bottom-up drivers, such as ignitions, fuel patterns, and local topography, could play an important role in wildfire occurrence [89]. These conditions could affect the accuracy of fire prediction from year to year, as is the case in our study.
The proposed models were not designed to be generalized on a national scale or in another area of interest. This first assessment of the NRW’s monthly wildfire and burn rate forecast is a baseline study for future analysis. Possible future developments should include fire detection patterns, more specific and more sophisticated climate prediction systems, zone-specific fire–climate data, and more sophisticated empirical methods with improved predictor calibration [62,91].
5. Conclusions
The current study investigated the effective use of statistical models for simulating and forecasting wildfires’ monthly activity in a four-year period according to phytogeographic zones.
The modeling and the forecasting of the number of wildfires and burned areas at the watershed and ecoregion scale using SARIMA models indicate that the proposed models provide satisfactory results. These models present a good description and acceptable prediction performance of the pyrological variables. Observed and fitted values of the numbers of wildfires and burned areas were very close, and the forecast errors highlight the accuracy of the models regarding their low RMSE. Forecasts for the numbers of wildfires and burnt areas over four years (48 months) seemed to be increasing slightly. These relevant and reliable forecasts should be used as a basis for sensitizing local populations and developing a decision-support tool for the management of the studied ecosystem and wildfire prevention in this ecosystem. Wildfire managers should share these forecasts with the local population and sensitize them to avoid activities that could ignite and spread wildfires.
As limitations, the present paper presents specific limitations, which could stand as sources for future research in the field. First, our research is limited to a specific region of Cote d’Ivoire. The research could be further applied to the whole country or Africa to support decision-making on a wide level. Secondly, our paper uses the ARIMA modeling approach, which is based only on past values of the studied time series. Our research could be further approached by applying SARIMAX that includes environmental factors in forecasting time series.
Supplementary Materials
The following are available online at https://www.mdpi.com/2571-6255/3/3/42/s1. Figure S1: Monthly wildfire occurrence in the (a) forest zone, (b) pre-forest zone, (c) Sudanian zone, and (d) whole NRW. Figure S2: Monthly burnt areas in the (a) forest zone, (b) pre-forest zone, (c) Sudanian zone, and (d) whole NRW. Figure S3: Annual wildfire occurrence in the (a) forest zone, (b) pre-forest zone, (c) Sudanian zone, and (d) whole NRW. Figure S4: Annual burnt areas in the (a) forest zone, (b) pre-forest zone, (c) Sudanian zone, and (d) whole NRW. Figure S5: Residual plots of the fitted SARIMA models of the number of wildfires in the (a) forest zone, (b) pre-forest zone, (c) Sudanian zone, and (d) whole NRW. Figure S6: Residual plots of the fitted SARIMA models of burnt areas in the (a) forest zone, (b) pre-forest zone, (c) Sudanian zone, and (d) whole NRW.
Author Contributions
Conceptualization, J.-L.K. and N.W.; methodology, J.-L.K.; software, J.-L.K.; validation, J.-L.K., N.W., and C.M.; formal analysis, J.-L.K.; data curation, J.-L.K.; writing—original draft preparation, J.-L.K.; writing—review and editing, N.W. and C.M.; supervision, N.W. All authors have read and agreed to the published version of the manuscript.
Funding
This research received no external funding.
Acknowledgments
We acknowledge the use of data and imagery from LANCE FIRMS operated by the NASA/GSFC/Earth Science Data and Information System (ESDIS) with funding provided by NASA/HQ. Also, we gratefully acknowledge the constructive comments of the two anonymous reviewers.
Conflicts of Interest
The authors declare no conflict of interest.
References
- Kouassi, J.-L.; Wandan, N.; Mbow, C. Assessing the Impact of Climate Variability on Wildfires in the N’Zi River Watershed in Central Côte d’Ivoire. Fire 2018, 1, 36. [Google Scholar] [CrossRef] [Green Version]
- Kouassi, J.-L. Variabilité Climatique, Dynamique Des Feux de Végétation et Perceptions Locales Dans le Bassin Versant du N’Zi (Centre de la Côte d’Ivoire); Institut National Polytechnique Felix Houphouet-Boigny: Yamoussoukro, Cote d’Ivoire, 2019; Available online: https://tel.archives-ouvertes.fr/tel-02183044 (accessed on 2 May 2020).
- Mbow, C.; Nielsen, T.T.; Rasmussen, K. Savanna Fires in East-Central Senegal: Distribution Patterns, Resource Management and Perceptions. Hum. Ecol. 2000, 28, 561–583. [Google Scholar] [CrossRef]
- Etc Terra-Rongead; BNETD. Analyse Qualitative des Facteurs de Déforestation et de Dégradation des Forêts en Côte d’Ivoire; Ministère de l’Environnement et du Développement Durable: Abidjan, Côte d’Ivoire, 2016.
- Bigot, S. Variabilité Climatique, Interactions et Modifications Environnementales: L’exemple de la Côte d’Ivoire; Université des Sciences et Technologies de Lille: Lille, France, 2005. [Google Scholar]
- FAO. Fire Management Global Assessment 2006; FAO Forestry Paper 151: Rome, Italy, 2007. [Google Scholar]
- Goldammer, J.G.; de Ronde, C. Wildland Fire Management Handbook for Sub-Saharan Africa; Goldammer, J.G., de Ronde, C., Eds.; Global Fire Monitoring Center: Freiburg, Germany, 2004. [Google Scholar]
- MINEF. Campagne Nationale de Lutte Contre Les Feux de Brousse Edition 2016–2017. Available online: http://www.eauxetforets.gouv.ci/index.php/le-minef/actualites/a-la-une/514-campagne-nationale-de-lutte-contre-les-feux-de-brousse-edition-2016–2017 (accessed on 14 June 2017).
- Goldammer, J.G. Global Fire–A Message from the Global Fire Monitoring Center; UN International Strategy for Disaster Reduction: Geneva, Switzerland, 2000. [Google Scholar]
- Goula, B.T.A.; Soro, E.G.; Kouassi, W.; Srohourou, B. Tendances et ruptures au niveau des pluies journalières extrêmes en Côte d’Ivoire (Afrique de l’Ouest). Hydrol. Sci. J. 2012, 57, 1067–1080. [Google Scholar] [CrossRef] [Green Version]
- Kouassi, A.M.; Kouamé, K.F.; Goula, B.T.A.; Lasm, T.; Paturel, J.E.; Biémi, J. Influence de la variabilité climatique et de la modification de l’occupation du sol sur la relation pluie-débit à partir d’une modélisation globale du bassin versant du N’Zi (Bandama) en Côte d’Ivoire. Rev. Ivoir. Des. Sci. Technol. 2008, 11, 207–229. [Google Scholar]
- Fearnside, P.M. Global Warming and Tropical Land-Use Change: Greenhouse Gas Emissions from Biomass Burning, Decomposition and Soils in Forest Conversion, Shifting Cultivation and Secondary Vegetation. Clim. Chang. 2000, 46, 115–158. [Google Scholar] [CrossRef]
- IPCC. Climate Change 2014: Impacts, Adaptation, and Vulnerability. Part B: Regional Aspects. Contribution of Working Group II to the Fifth Assessment Report of the Intergovernmental Panel on Climate Change; Barros, V.R., Field, C.B., Dokken, D.J., Mastrandrea, M.D., Mach, K.J., Bilir, T.E., Chatterjee, M., Ebi, K.L., Estrada, Y.O., Genova, R.C., et al., Eds.; Cambridge University Press: Cambridge, UK, 2014. [Google Scholar]
- Owen, G.; McLeod, J.D.; Kolden, C.A.; Ferguson, D.B.; Brown, T.J. Wildfire Management and Forecasting Fire Potential: The Roles of Climate Information and Social Networks in the Southwest United States. Weather Clim. Soc. 2012, 4, 90–102. [Google Scholar] [CrossRef] [Green Version]
- Prestemon, J.P.; Butry, D.T.; Thomas, D.S. The net benefits of human-ignited wildfire forecasting: The case of tribal land units in the United States. Int. J. Wildl. Fire 2016, 25, 390. [Google Scholar] [CrossRef] [Green Version]
- Haines, D.; Main, W.; Johnson, V. Relation between the U.S. National Fire Danger Rating System Spread Component and Fire Activity in the Lake States; US Department of Agriculture: St. Paul, MN, USA, 1970.
- Haines, D.A.; Main, W.A.; Frost, J.S.; Simard, A.J. Fire-danger rating and wildfire occurrence in the Northeastern United States. For. Sci. 1983, 29, 679–696. [Google Scholar] [CrossRef]
- Viedma, O.; Angeler, D.G.; Moreno, J.M. Landscape structural features control fire size in a Mediterranean forested area of central Spain. Int. J. Wildl. Fire 2009, 18, 575. [Google Scholar] [CrossRef]
- Mbow, C.; Goïta, K.; Bénié, G.B. Spectral indices and fire behavior simulation for fire risk assessment in savanna ecosystems. Remote Sens. Environ. 2004, 91, 1–13. [Google Scholar] [CrossRef]
- Ordóñez, C.; Saavedra, A.; Rodríguez-Pérez, J.R.; Castedo-Dorado, F.; Covián, E. Using model-based geostatistics to predict lightning-caused wildfires. Environ. Model. Softw. 2012, 29, 44–50. [Google Scholar] [CrossRef]
- Sow, M.; Mbow, C.; Hély, C.; Fensholt, R.; Sambou, B. Estimation of herbaceous fuel moisture content using vegetation indices and land surface temperature from MODIS data. Remote Sens. 2013, 5, 2617–2638. [Google Scholar] [CrossRef] [Green Version]
- Catry, F.X.; Rego, F.C.; Bação, F.L.; Moreira, F. Modeling and mapping wildfire ignition risk in Portugal. Int. J. Wildl. Fire 2009, 18, 921. [Google Scholar] [CrossRef] [Green Version]
- Chas-Amil, M.L.; Prestemon, J.P.; McClean, C.J.; Touza, J. Human-ignited wildfire patterns and responses to policy shifts. Appl. Geogr. 2015, 56, 164–176. [Google Scholar] [CrossRef]
- Chuvieco, E.; Aguado, I.; Yebra, M.; Nieto, H.; Salas, J.; Martín, M.P.; Vilar, L.; Martínez, J.; Martín, S.; Ibarra, P.; et al. Development of a framework for fire risk assessment using remote sensing and geographic information system technologies. Ecol. Model. 2010, 221, 46–58. [Google Scholar] [CrossRef]
- Martínez, J.; Vega-Garcia, C.; Chuvieco, E. Human-caused wildfire risk rating for prevention planning in Spain. J. Environ. Manag. 2009, 90, 1241–1252. [Google Scholar] [CrossRef]
- Padilla, M.; Vega-García, C. On the comparative importance of fire danger rating indices and their integration with spatial and temporal variables for predicting daily human-caused fire occurrences in Spain. Int. J. Wildl. Fire 2011, 20, 46. [Google Scholar] [CrossRef]
- Preisler, H.K.; Westerling, A.L. Statistical model for forecasting monthly large wildfire events in Western United States. J. Appl. Meteorol. Clim. 2007, 46, 1020–1030. [Google Scholar] [CrossRef] [Green Version]
- Vasconcelos, M.J.P.; Silva, S.; Tomé, M.; Alvim, M.; Pereira, J.M.C. Spatial prediction of fire ignition probabilities: Comparing logistic regression and neural network. Photogramm. Eng. Remote Sens. 2001, 67, 73–81. [Google Scholar]
- Verdú, F.; Salas, J.; Vega-García, C. A multivariate analysis of biophysical factors and forest fires in Spain, 1991–2005. Int. J. Wildl. Fire 2012, 21, 498. [Google Scholar] [CrossRef]
- Arienti, M.C.; Cumming, S.G.; Krawchuk, M.A.; Boutin, S. Road network density correlated with increased lightning fire incidence in the Canadian western boreal forest. Int. J. Wildl. Fire 2009, 18, 970. [Google Scholar] [CrossRef]
- Krawchuk, M.A.; Cumming, S.G.; Flannigan, M.D. Predicted changes in fire weather suggest increases in lightning fire initiation and future area burned in the mixedwood boreal forest. Clim. Chang. 2009, 92, 83–97. [Google Scholar] [CrossRef]
- Liu, D.; Zhang, Y. Research of regional forest fire prediction method based on multivariate linear regression. Int. J. Smart Home 2015, 9, 13–22. [Google Scholar] [CrossRef] [Green Version]
- Mandallaz, D.; Ye, R. Prediction of forest fires with Poisson models. Can. J. Res. 1997, 27, 1685–1694. [Google Scholar] [CrossRef]
- Marchal, J.; Cumming, S.G.; McIntire, E.J.B. Exploiting Poisson additivity to predict fire frequency from maps of fire weather and land cover in boreal forests of Québec, Canada. Ecography 2017, 40, 200–209. [Google Scholar] [CrossRef] [Green Version]
- Papakosta, P.; Straub, D. Probabilistic prediction of daily fire occurrence in the Mediterranean with readily available spatio-temporal data. Iforest 2017, 10, 32–40. [Google Scholar] [CrossRef] [Green Version]
- Viedma, O.; Urbieta, I.R.; Moreno, J.M. Wildfires and the role of their drivers are changing over time in a large rural area of west-central Spain. Sci. Rep. 2018, 8, 17797. [Google Scholar] [CrossRef] [Green Version]
- Boubeta, M.; Lombardía, M.J.; Marey-Pérez, M.F.; Morales, D. Prediction of forest fires occurrences with area-level Poisson mixed models. J. Environ. Manag. 2015, 154, 151–158. [Google Scholar] [CrossRef]
- Serra, P.; Pons, X.; Saurí, D. Land-cover and land-use change in a Mediterranean landscape: A spatial analysis of driving forces integrating biophysical and human factors. Appl. Geogr. 2008, 28, 189–209. [Google Scholar] [CrossRef]
- Amatulli, G.; Rodrigues, M.J.; Trombetti, M.; Lovreglio, R. Assessing long-term fire risk at local scale by means of decision tree technique. J. Geophys. Res. Biogeosci. 2006, 111. [Google Scholar] [CrossRef] [Green Version]
- Argañaraz, J.P.; Gavier Pizarro, G.; Zak, M.; Landi, M.A.; Bellis, L.M. Human and biophysical drivers of fires in Semiarid Chaco mountains of Central Argentina. Sci. Total Environ. 2015, 520, 1–12. [Google Scholar] [CrossRef] [PubMed]
- Sitanggang, I.S.; Yaakob, R.; Mustapha, N.; Ainuddin, A.N. Predictive models for hotspots occurrence using Decision Tree Algorithms and Logistic Regression. J. Appl. Sci. 2013, 13, 252–261. [Google Scholar] [CrossRef]
- Loepfe, L.; Rodrigo, A.; Lloret, F. Two thresholds determine climatic control of forest-fire size in Europe. Biogeosci. Discuss. 2012, 9, 9065–9089. [Google Scholar] [CrossRef]
- Vilar, L.; Woolford, D.G.; Martell, D.L.; Martín, M.P. A model for predicting human-caused wildfire occurrence in the region of Madrid, Spain. Int. J. Wildl. Fire 2010, 19, 325. [Google Scholar] [CrossRef]
- Ruiz-Mirazo, J.; Martínez-Fernández, J.; Vega-García, C. Pastoral wildfires in the Mediterranean: Understanding their linkages to land cover patterns in managed landscapes. J. Environ. Manag. 2012, 98, 43–50. [Google Scholar] [CrossRef] [PubMed]
- Rodrigues, M.; de la Riva, J.; Fotheringham, S. Modeling the spatial variation of the explanatory factors of human-caused wildfires in Spain using geographically weighted logistic regression. Appl. Geogr. 2014, 48, 52–63. [Google Scholar] [CrossRef]
- Penman, T.D.; Nicholson, A.E.; Bradstock, R.A.; Collins, L.; Penman, S.H.; Price, O.F. Reducing the risk of house loss due to wildfires. Environ. Model. Softw. 2015, 67, 12–25. [Google Scholar] [CrossRef]
- Rohde, D.; Corcoran, J.; Chhetri, P. Spatial forecasting of residential urban fires: A Bayesian approach. Comput. Environ. Urban. Syst. 2010, 34, 58–69. [Google Scholar] [CrossRef]
- Romero-Calcerrada, R.; Barrio-Parra, F.; Millington, J.D.A.; Novillo, C.J. Spatial modelling of socioeconomic data to understand patterns of human-caused wildfire ignition risk in the SW of Madrid (central Spain). Ecol. Model. 2010, 221, 34–45. [Google Scholar] [CrossRef]
- Vega Orozco, C.; Tonini, M.; Conedera, M.; Kanveski, M. Cluster recognition in spatial-temporal sequences: The case of forest fires. Geoinformatica 2012, 16, 653–673. [Google Scholar] [CrossRef] [Green Version]
- Mbow, C.; Sambou, B.; Ba, A.T.; Goudiaby, A. Vegetation and fire readiness in main morphological units of Niokolo Koba National Park (Southeast Senegal). Geogr. Tidsskr. J. Geogr. 2003, 103, 55–62. [Google Scholar] [CrossRef]
- Schoenberg, F.P.; Pompa, J.; Chang, C.-H. A note on non-parametric and semi-parametric modeling of wildfire hazard in Los Angeles County, California. Environ. Ecol. Stat. 2009, 16, 251–269. [Google Scholar] [CrossRef] [Green Version]
- Schroeder, M.J. Critical Fire Weather Patterns in the Conterminous United States; Office of Meterological Operations: Washington, DC, USA, 1969. [Google Scholar]
- Podur, J.; Martell, D.L.; Knight, K. Statistical quality control analysis of forest fire activity in Canada. Can. J. Res. 2002, 32, 195–205. [Google Scholar] [CrossRef]
- Crimmins, M.A.; Comrie, A.C. Interactions between antecedent climate and wildfire variability across south-eastern Arizona. Int. J. Wildl. Fire 2004, 13, 455. [Google Scholar] [CrossRef] [Green Version]
- Shahwan, T.; Odening, M. Forecasting agricultural commodity prices using hybrid neural networks. In Computational Intelligence in Economics and Finance; Springer: Berlin/Heidelberg, Germany, 2007; pp. 63–74. [Google Scholar] [CrossRef]
- Khandelwal, I.; Adhikari, R.; Verma, G. Time Series Forecasting Using Hybrid ARIMA and ANN Models Based on DWT Decomposition. Procedia Comput. Sci. 2015, 48, 173–179. [Google Scholar] [CrossRef] [Green Version]
- Zhang, G.P. Time series forecasting using a hybrid ARIMA and neural network model. Neurocomputing 2003, 50, 159–175. [Google Scholar] [CrossRef]
- Box, G.E.P.; Jenkins, G. Time Series Analysis: Forecasting and Control; Holden-Day: San Francisco, CA, USA, 1970. [Google Scholar]
- McKenzie, E. General exponential smoothing and the equivalent arma process. J. Forecast. 1984, 3, 333–344. [Google Scholar] [CrossRef]
- Miller, J.D.; Safford, H.D.; Crimmins, M.; Thode, A.E. Quantitative evidence for increasing forest fire severity in the Sierra Nevada and Southern Cascade Mountains, California and Nevada, USA. Ecosystems 2009, 12, 16–32. [Google Scholar] [CrossRef]
- Taylor, A.H.; Scholl, A.E. Climatic and human influences on fire regimes in mixed conifer forests in Yosemite National Park, USA. Ecol. Manag. 2012, 267, 144–156. [Google Scholar] [CrossRef]
- Boubeta, M.; Lombardía, M.J.; González-Manteiga, W.; Marey-Pérez, M.F. Burned area prediction with semiparametric models. Int. J. Wildl. Fire 2016, 25, 669–678. [Google Scholar] [CrossRef]
- Viganó, H.H.D.G.; De Souza, C.C.; Neto, J.F.R.; Cristaldo, M.F.; De Jesus, L. Previsão e Modelagem das Ocorrências de Incêndios no Pantanal. Rev. Bras. Meteorol. 2018, 33, 306–316. [Google Scholar] [CrossRef]
- Hamilton, J.D. Time Series Analysis; Princeton University Press: Princeton, NJ, USA, 1994. [Google Scholar]
- INS. Recensement Général de la Population et de l’Habitat (RGPH) de 2014; Institut National de la Statistique: Abidjan, Côte d’Ivoire, 2014. [Google Scholar]
- Eldin, M. Le climat. In Le Milieu Naturel de la Côte d’Ivoire; Avenard, J.-M., Eldin, M., Girard, G., Touchebeuf, P., Guillaumet, J.-L., Adjanohoun, E., Perraud, A., Eds.; ORSTOM: Paris, France, 1971; pp. 73–108. [Google Scholar]
- Goula, B.T.A.; Savané, I.; Fadika, V.; Konan, B.; Kouadio, G.B. Impact de la variabilité climatique sur les ressources hydriques des bassins du N’Zo et N’Zi en Côte d’Ivoire (Afrique Tropicale Humide). VertigO 2006, 7, 1–12. [Google Scholar] [CrossRef]
- Guillaumet, J. La végétation de la Côte d’Ivoire. In Le Milieu Naturel de la Côte d’Ivoire; Avenard, J.-M., Eldin, M., Girard, G., Touchebeuf, P., Guillaumet, J.-L., Adjanohoun, E., Perraud, A., Eds.; ORSTOM: Paris, France, 1971; pp. 157–263. [Google Scholar]
- Giglio, L.; Schroeder, W.; Justice, C.O. The collection 6 MODIS active fire detection algorithm and fire products. Remote Sens. Environ. 2016, 178, 31–41. [Google Scholar] [CrossRef] [PubMed] [Green Version]
- Schroeder, W.; Oliva, P.; Giglio, L.; Csiszar, I.A. The New VIIRS 375m active fire detection data product: Algorithm description and initial assessment. Remote Sens. Environ. 2014, 143, 85–96. [Google Scholar] [CrossRef]
- Giglio, L.; Boschetti, L.; Roy, D.; Hoffmann, A.A.; Humber, M. Collection 6 MODIS Burned Area Product User’s Guide, 1st ed.; NASA EOSDIS Land Processes DAAC: Sioux Falls, South Dakota, 2016.
- Kaufman, Y.J.; Justice, C.O.; Flynn, L.P.; Kendall, J.D.; Prins, E.M.; Giglio, L.; Ward, D.E.; Menzel, W.P.; Setzer, A.W. Potential global fire monitoring from EOS-MODIS. J. Geophys. Res. Atmos. 1998, 103, 32215–32238. [Google Scholar] [CrossRef]
- LANCE FIRMS. Collection 6 NRT Hotspot/Active Fire Detections MCD14DL. Available online: https://earthdata.nasa.gov/firms (accessed on 21 June 2017).
- LANCE FIRMS. NRT VIIRS 375 m Active Fire product VNP14IMGT. Available online: https://earthdata.nasa.gov/firms (accessed on 21 June 2017).
- Giglio, L.; Justice, C.; Boschetti, L.; Roy, D. MCD64A1 MODIS/Terra + Aqua Burned Area Monthly L3 Global 500m SIN Grid V006; NASA EOSDIS Land Processes DAAC: Sioux Falls, South Dakota, 2015.
- Hyndman, R.J.; Athanasopoulos, G. Forecasting: Principles and Practice, 2nd ed.; OTexts: Melbourne, Austria, 2018. [Google Scholar]
- Sakulkitbanjong, K.; Pongchavalit, C.; Garivait, S. Time series analysis and forecasting of forest fire weather. In Proceedings of the 98th The IIER International Conference, Pattaya, Thailand, 10–11 March 2017; pp. 6–12. [Google Scholar]
- Shumway, R.H.; Stoffer, D.S. Time Series Analysis and its Applications; Springer Texts in Statistics; Springer International Publishing: Cham, Switzerland, 2017. [Google Scholar]
- Hyndman, R.J.; Khandakar, Y. Automatic Time Series Forecasting: The forecast Package for R. J. Stat. Softw. 2008, 27. [Google Scholar] [CrossRef] [Green Version]
- Hyndman, R.J.; Khandakar, Y. Forecast: Forecasting functions for time series and linear models. J. Stat. Softw. 2016, 26, 1–22. [Google Scholar]
- Coghlan, A. A Little Book of R for Time Series; Wellcome Trust Sanger Institute: Cambridge, UK, 2014. [Google Scholar]
- James, G.; Witten, D.; Hastie, T. An Introduction to Statistical Learning: With Applications in R; Springer Science+Business Media: New York, NY, USA, 2014. [Google Scholar]
- Kuhn, M. Caret: Classification and Regression Training 2020. Available online: https://cran.r-project.org/package=caret (accessed on 1 February 2020).
- Hyndman, R.; Athanasopoulos, G.; Bergmeir, C.; Caceres, G.; Chhay, L.; O’Hara-Wild, M.; Petropoulos, F.; Razbash, S.; Wang, E.; Yasmeen, F. Forecast: Forecasting Functions for Time Series and Linear Models. 2018. Available online: http://pkg.robjhyndman.com/forecast (accessed on 2 April 2020).
- Pohlert, T. Non-Parametric Trend Tests and Change-Point Detection. Available online: https://cran.r-project.org/web/packages/trend/vignettes/trend.pdf (accessed on 30 July 2018).
- R Core Team. R: A Language and Environment for Statistical Computing; R Foundation for Statistical Computing: Vienna, Austria, 2019. [Google Scholar]
- Taylor, S.W.; Woolford, D.G.; Dean, C.B.; Martell, D.L. Wildfire prediction to inform fire management: Statistical science challenges. Stat. Sci. 2013, 28, 586–615. [Google Scholar] [CrossRef] [Green Version]
- Yates, K.L.; Bouchet, P.J.; Caley, M.J.; Mengersen, K.; Randin, C.F.; Parnell, S.; Fielding, A.H.; Bamford, A.J.; Ban, S.; Barbosa, A.M.; et al. Outstanding Challenges in the Transferability of Ecological Models. Trends Ecol. Evol. 2018, 33, 790–802. [Google Scholar] [CrossRef] [Green Version]
- Newman, E.A.; Kennedy, M.C.; Falk, D.A.; McKenzie, D. Scaling and Complexity in Landscape Ecology. Front. Ecol. Evol. 2019, 7, 293. [Google Scholar] [CrossRef] [Green Version]
- Devineau, J.L.; Fournier, A.; Nignan, S. Savanna fire regimes assessment with MODIS fire data: Their relationship to land cover and plant species distribution in western Burkina Faso (West Africa). J. Arid Environ. 2010, 74, 1092–1101. [Google Scholar] [CrossRef] [Green Version]
- Anggraeni, W.; Vinarti, R.A.; Kurniawati, Y.D. Performance Comparisons between Arima and Arimax Method in Moslem Kids Clothes Demand Forecasting: Case Study. Procedia Comput. Sci. 2015, 72, 630–637. [Google Scholar] [CrossRef] [Green Version]
Figure 1.
Map of N’Zi River Watershed (NRW).

Figure 2.
Spatial distribution of wildfire hotspots and burnt areas detected by Moderate Resolution Imaging Spectroradiometer (MODIS) in the NRW from 2001 to 2019.
Figure 2.
Spatial distribution of wildfire hotspots and burnt areas detected by Moderate Resolution Imaging Spectroradiometer (MODIS) in the NRW from 2001 to 2019.

Figure 3.
Autocorrelation functions of (A) the number of wildfires and (B) burnt areas.

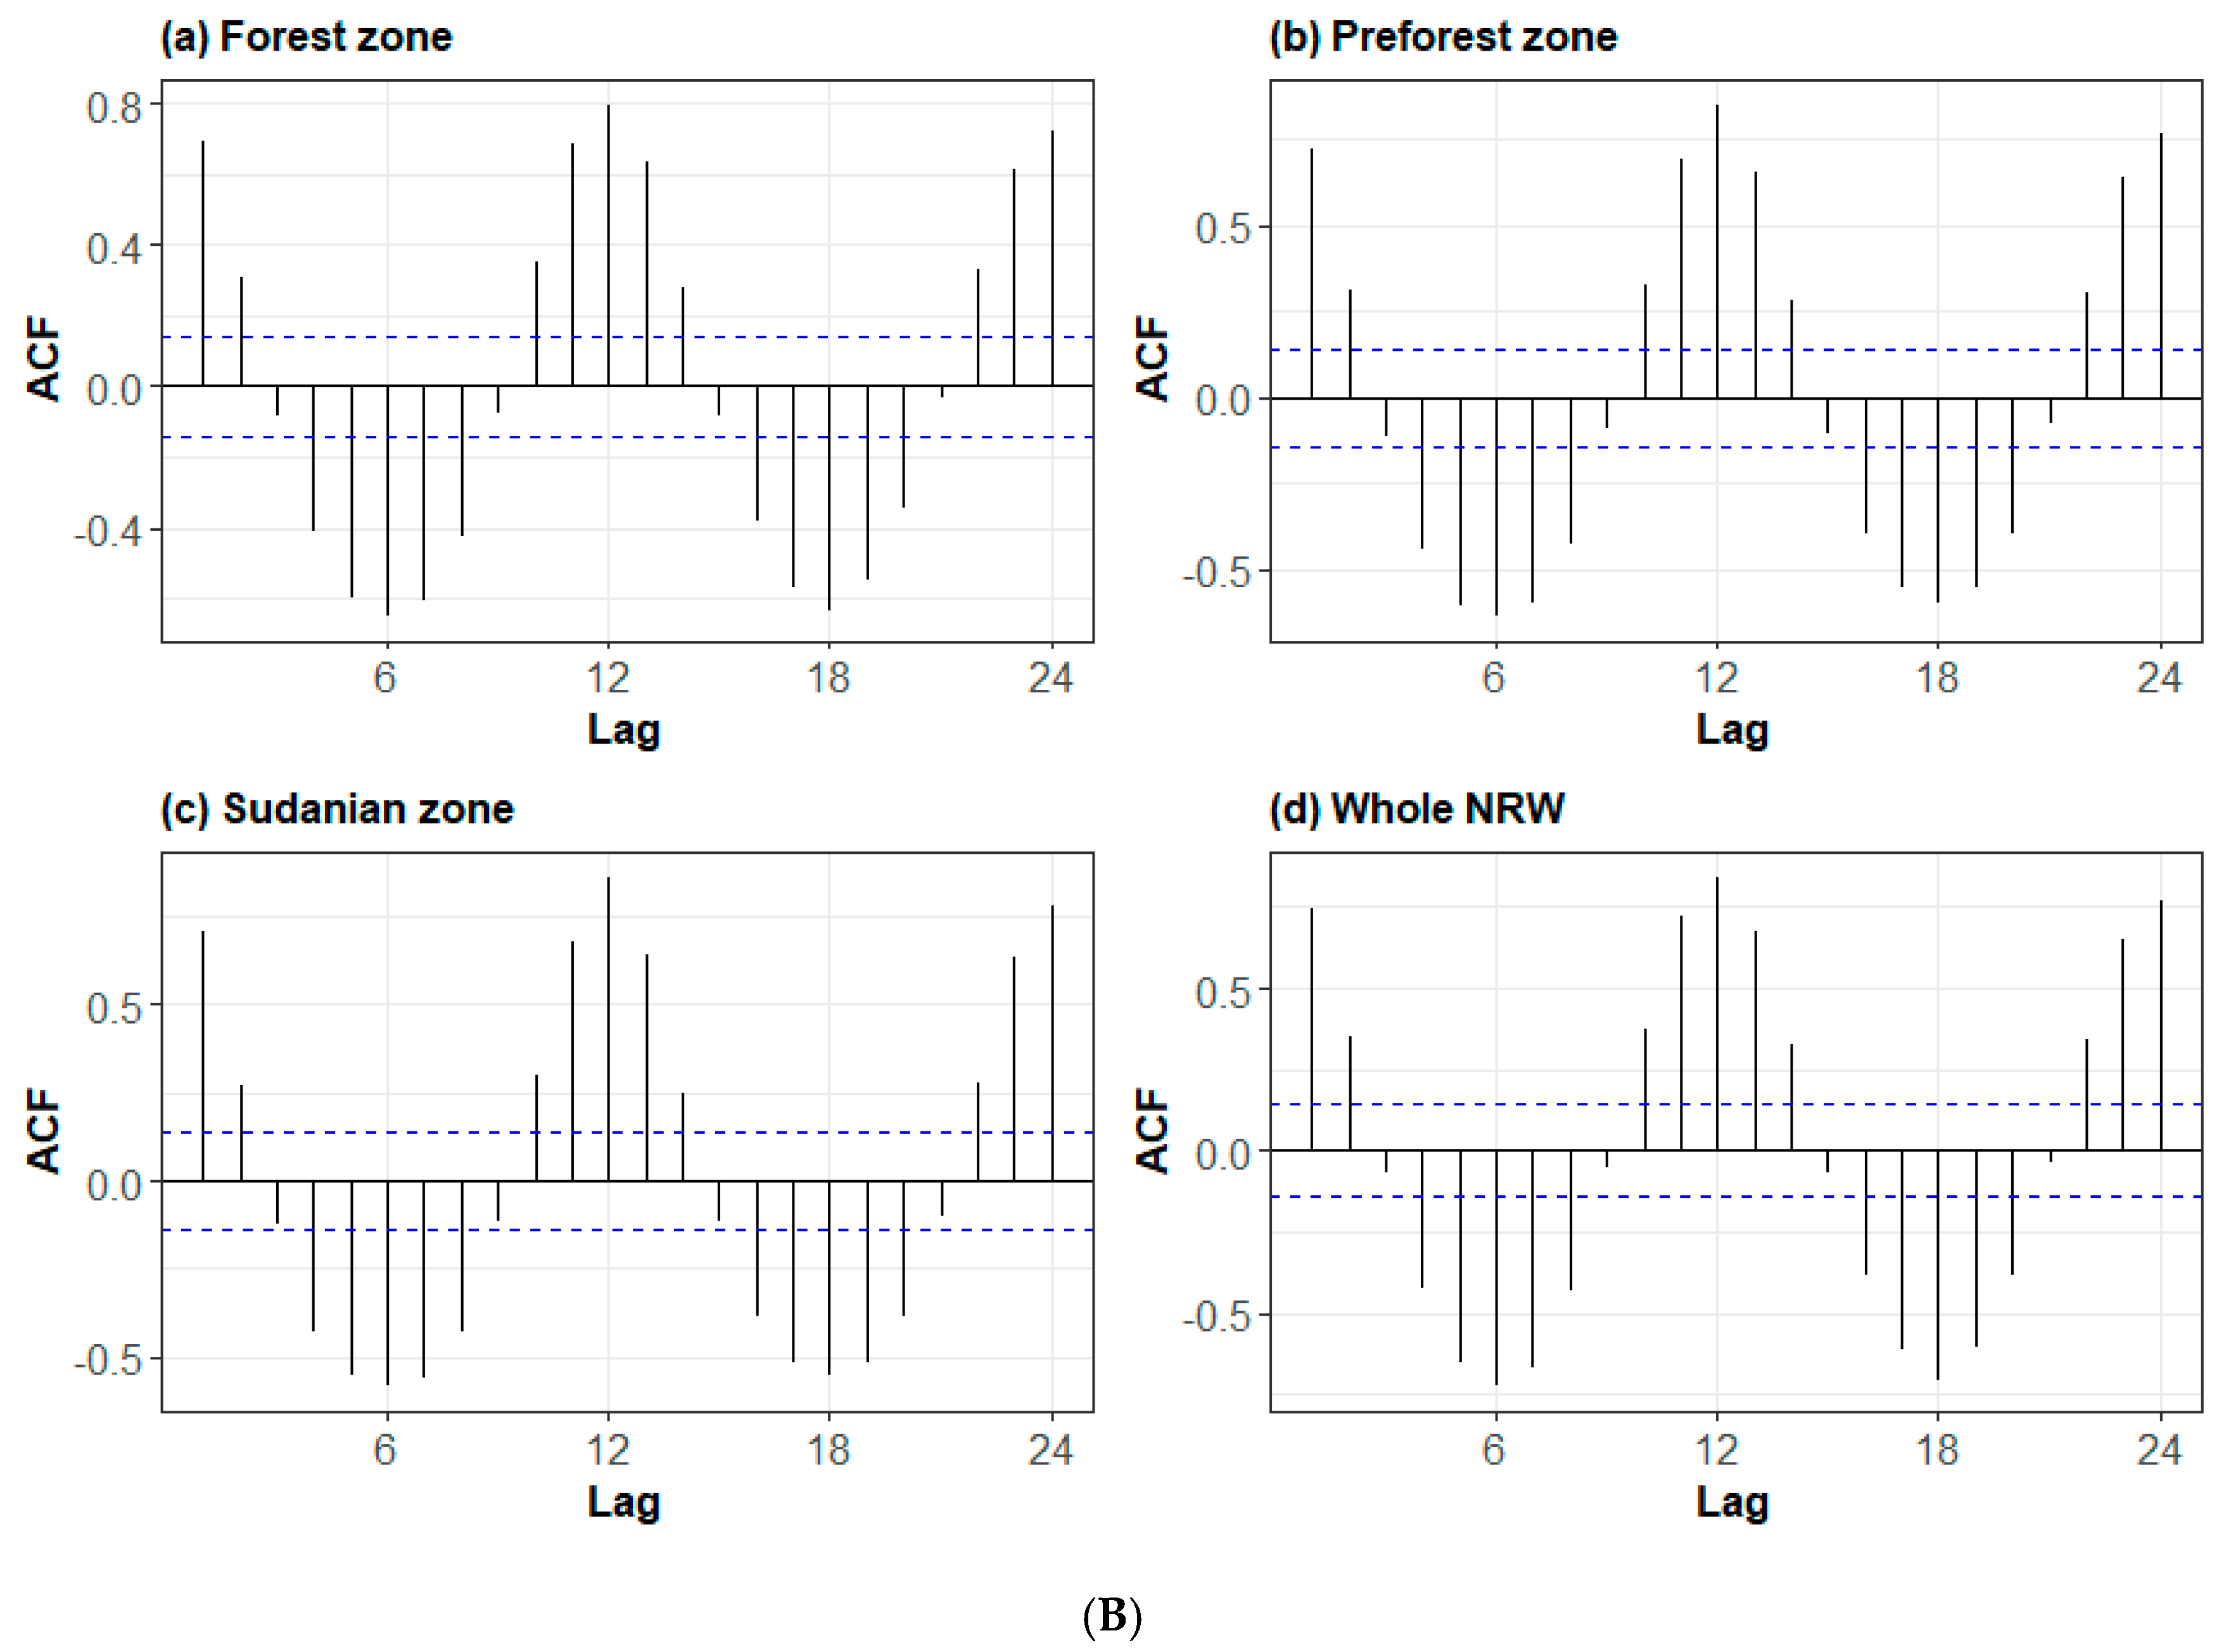
Figure 4.
Partial autocorrelation functions of (A) the number of wildfires and (B) burnt areas.


Figure 5.
Forecasts of the number of wildfires in the (a) forest zone, (b) pre-forest zone, (c) Sudanian zone, and (d) whole NRW using the training dataset.
Figure 5.
Forecasts of the number of wildfires in the (a) forest zone, (b) pre-forest zone, (c) Sudanian zone, and (d) whole NRW using the training dataset.
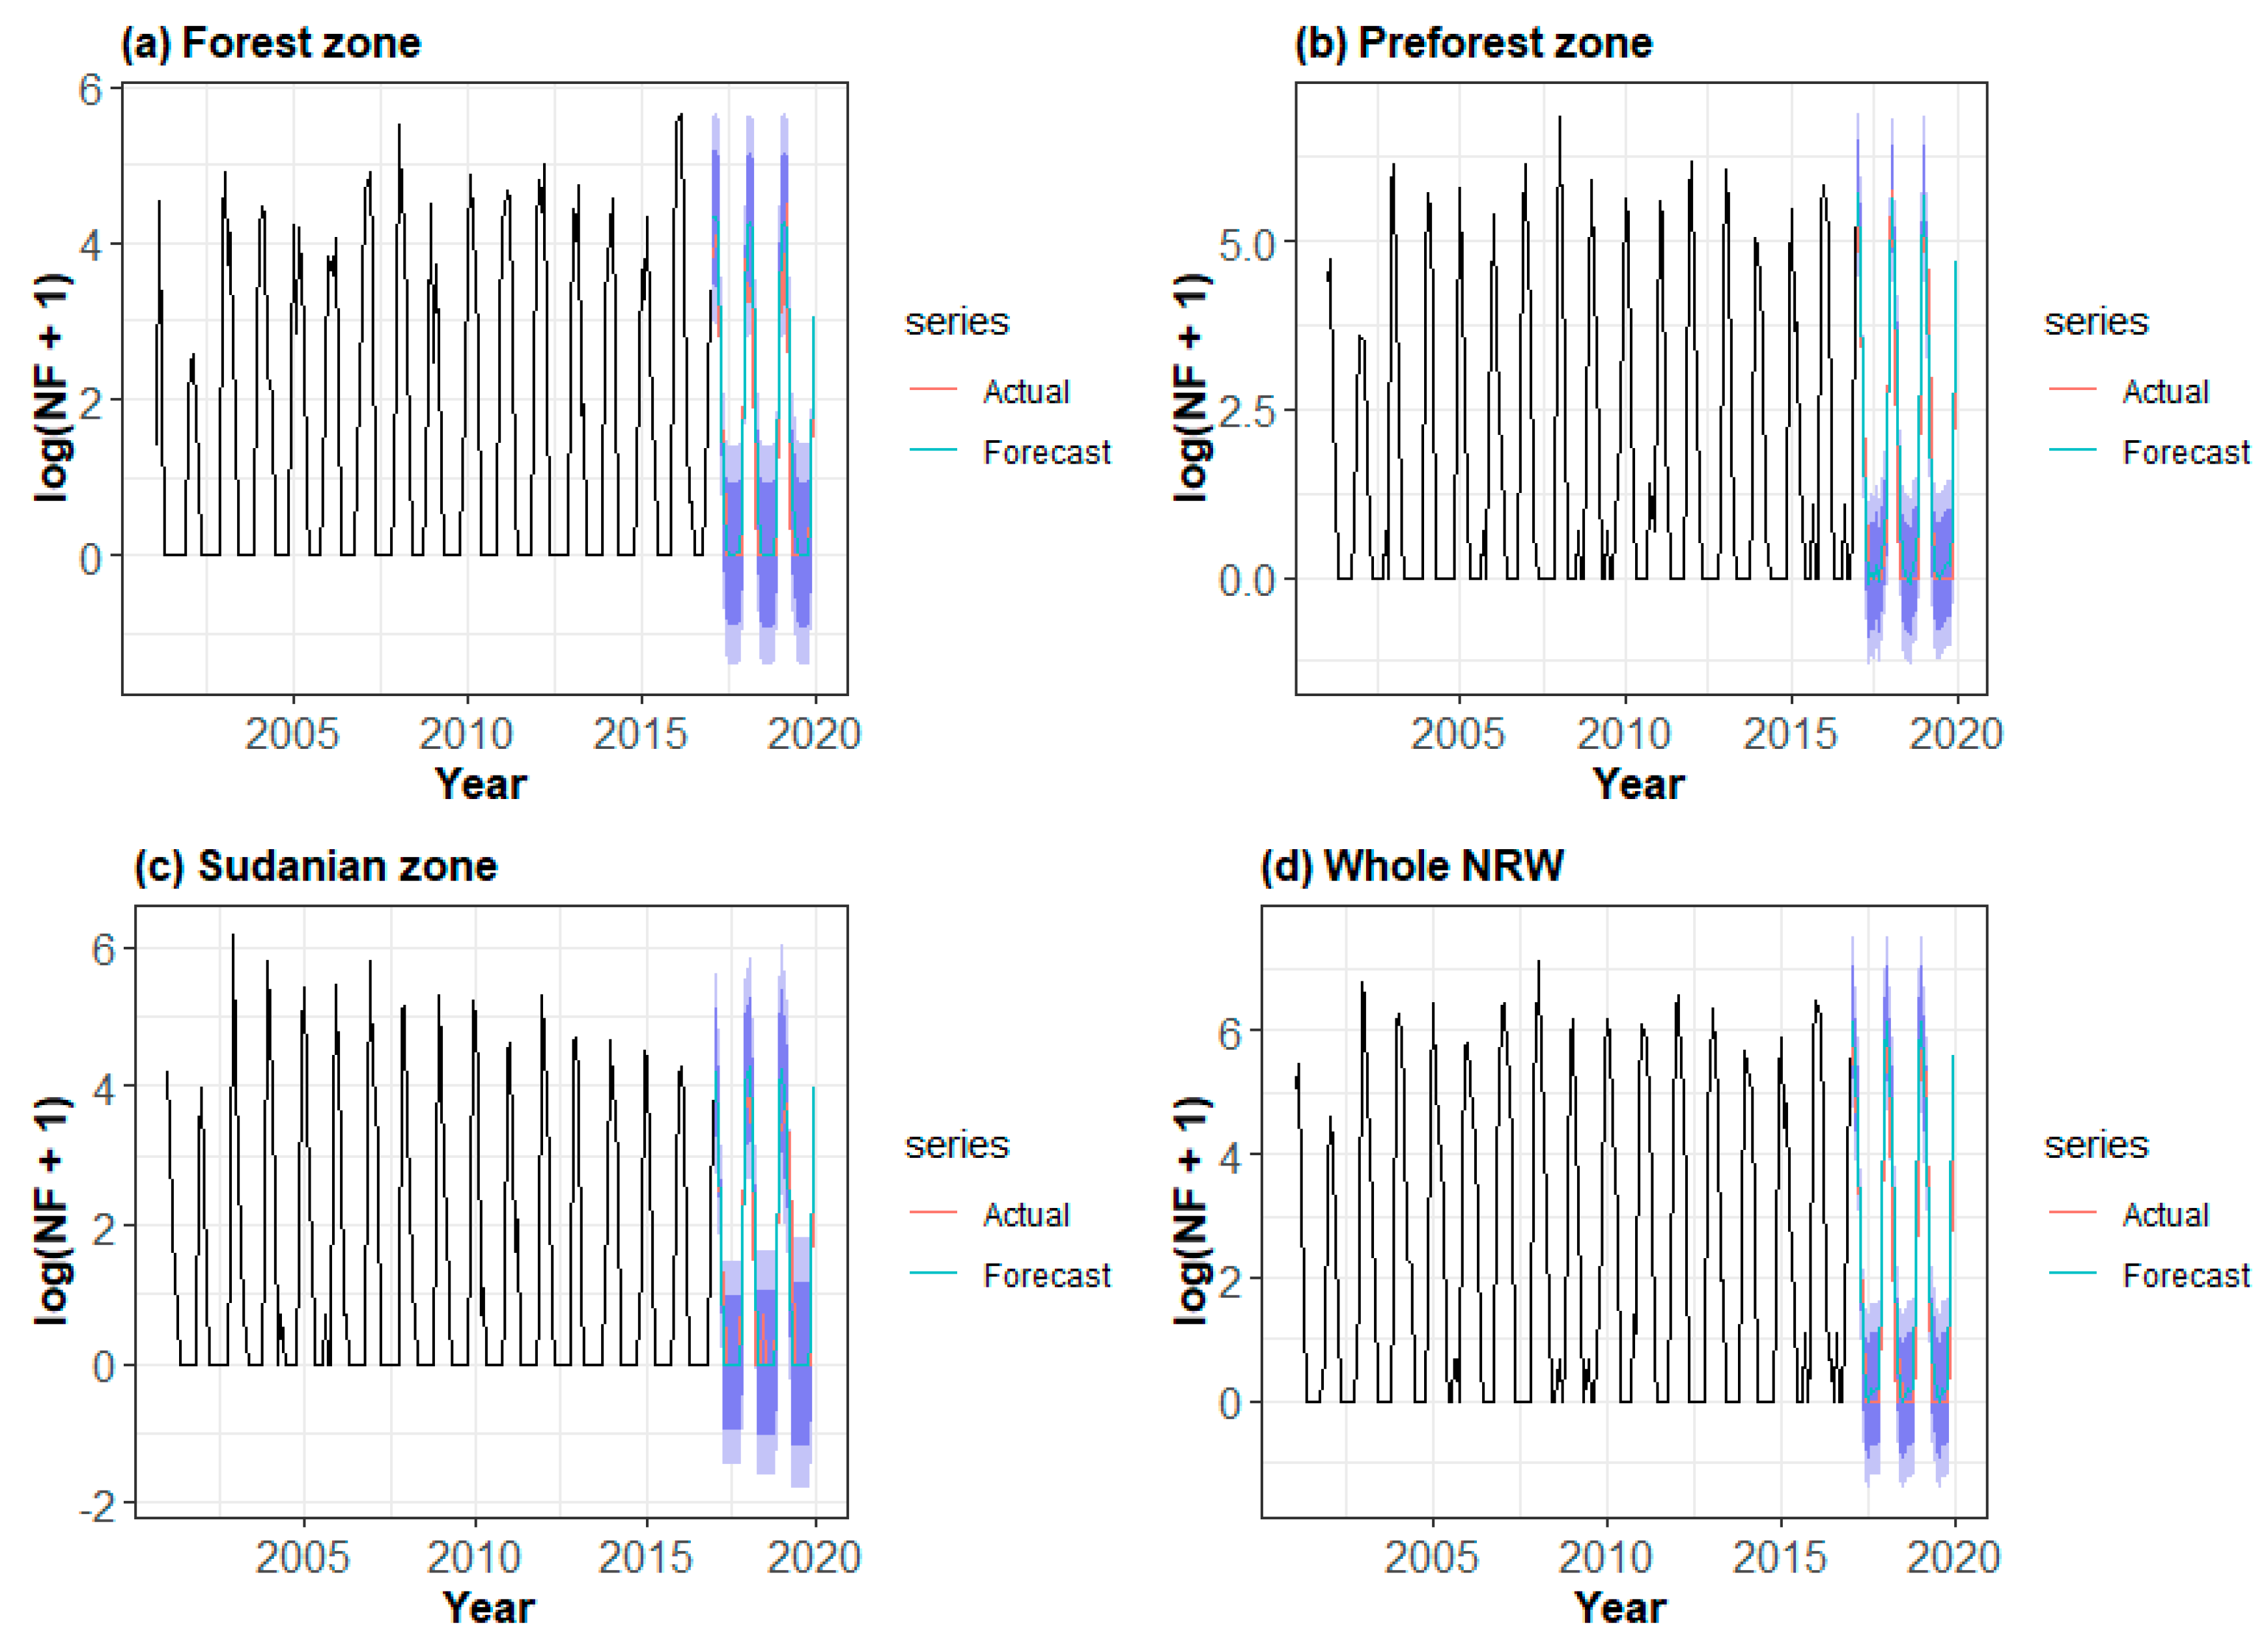
Figure 6.
Forecasts of the total burnt areas in the (a) forest zone, (b) pre-forest zone, (c) Sudanian zone, and (d) whole NRW using the training dataset.
Figure 6.
Forecasts of the total burnt areas in the (a) forest zone, (b) pre-forest zone, (c) Sudanian zone, and (d) whole NRW using the training dataset.

Figure 7.
Forecasts from the seasonal ARIMA (SARIMA) models applied to the number of wildfires in the (a) forest zone, (b) pre-forest zone, (c) Sudanian zone, and (d) whole NRW.
Figure 7.
Forecasts from the seasonal ARIMA (SARIMA) models applied to the number of wildfires in the (a) forest zone, (b) pre-forest zone, (c) Sudanian zone, and (d) whole NRW.

Figure 8.
Forecasts from the SARIMA models applied to burnt areas in the (a) forest zone, (b) pre-forest zone, (c) Sudanian zone, and (d) whole NRW.
Figure 8.
Forecasts from the SARIMA models applied to burnt areas in the (a) forest zone, (b) pre-forest zone, (c) Sudanian zone, and (d) whole NRW.


Table 1.
Summary of Augmented Dickey–Fuller (ADF) and Kwiatkowski–Phillips–Schmidt–Shin (KPSS) tests of pyrological time series.
Table 1.
Summary of Augmented Dickey–Fuller (ADF) and Kwiatkowski–Phillips–Schmidt–Shin (KPSS) tests of pyrological time series.
| Time Series | Location | ADF Test | KPSS Test | |||
|---|---|---|---|---|---|---|
| t-Test | p-Value | Statistics | Critical Values | |||
| 5% | 1% | |||||
| Number of wildfires | FZ | −2.789 | 0.203 | 0.030 | 0.463 | 0.739 |
| PFZ | −2.957 | 0.147 | 0.014 | 0.463 | 0.739 | |
| SZ | −2.922 | 0.158 | 0.039 | 0.463 | 0.739 | |
| NRW | −2.443 | 0.356 | 0.019 | 0.463 | 0.739 | |
| Burnt areas | FZ | −3.390 | 0.056 | 0.017 | 0.463 | 0.739 |
| PFZ | −3.291 | 0.071 | 0.013 | 0.463 | 0.739 | |
| SZ | −3.235 | 0.081 | 0.032 | 0.463 | 0.739 | |
| NRW | −3.364 | 0.059 | 0.029 | 0.463 | 0.739 | |
FZ: Forest zone; PFZ: Pre-forest zone; SZ: Sudanian zone; NRW: N’Zi River Watershed.
Table 2.
Summary of fitted autoregressive integrated moving average (ARIMA) models to the input time series of log(NF + 1) and log(SB + 1).
Table 2.
Summary of fitted autoregressive integrated moving average (ARIMA) models to the input time series of log(NF + 1) and log(SB + 1).
| Time Series | Location | Order | Coefficient | AICc | ||||||||||
|---|---|---|---|---|---|---|---|---|---|---|---|---|---|---|
| p | d | q | P | D | Q | S | AR1 | SAR1 | SAR2 | MA1 | SMA1 | |||
| Number of wildfires [log(NF + 1)] | FZ | 1 | 0 | 1 | 0 | 1 | 1 | 12 | 0.6248 *** | −0.3271 ns | −0.8716 *** | 385.69 | ||
| PFZ | 0 | 0 | 0 | 2 | 1 | 1 | 12 | 0.0036 ns | −0.2504 * | −0.8737 *** | 730.92 | |||
| SZ | 0 | 0 | 1 | 2 | 1 | 0 | 12 | −0.5581 *** | −0.1797 * | 0.2183 ** | - | 407.56 | ||
| NRW | 0 | 0 | 1 | 0 | 1 | 1 | 12 | - | 0.1778 ** | −0.8722 * | 404.94 | |||
| Burnt areas [log(SB + 1)] | FZ | 0 | 0 | 0 | 2 | 1 | 1 | 12 | −0.254 ns | −0.3337 * | −0.4946 * | 747.44 | ||
| PFZ | 1 | 0 | 0 | 2 | 1 | 0 | 12 | 0.1135 ns | −0.5715 *** | −0.5358 *** | 694.71 | |||
| SZ | 0 | 0 | 1 | 2 | 1 | 0 | 12 | −0.4984 *** | −0.4515 *** | 0.1523 ns | 684.03 | |||
| NRW | 0 | 0 | 1 | 2 | 1 | 1 | 12 | −0.4245 ** | −0.4809 *** | 0.113 ns | −0.3559 * | 705.67 | ||
ns = non-significant; * p < 0.05; ** p < 0.01; *** p < 0.001; FZ: Forest zone; PFZ: Pre-forest zone; SZ: Sudanian zone; NRW: N’Zi River Watershed; p: Non-seasonal order of the autoregressive part; d: Non-seasonal degree of first differencing involved; q: Non-seasonal order of the moving average part; P: Seasonal order of the autoregressive part; D: Seasonal degree of first differencing involved; Q: Seasonal order of the moving average part; S: Number of observations per year; AR1: Autoregressive order 1 process; SAR1: Seasonal autoregressive order 1 process; SAR2: Seasonal autoregressive order 2 process; MA1: Moving average order 1 process; SMA1: Seasonal moving average order 1 process.
Table 3.
Residual analysis of wildfire time series by ecoregion.
| Time Series | Location | Ljung–Box Test | ||
|---|---|---|---|---|
| Model | Q* | p-Value | ||
| Number of wildfires [log(NF + 1)] | FZ | ARIMA(1,0,1)(0,1,1)12 | 19.828 | 0.532 |
| PFZ | ARIMA(0,0,0)(2,1,1)12 | 21.649 | 0.420 | |
| SZ | ARIMA(0,0,1)(2,1,0)12 | 16.431 | 0.745 | |
| NRW | ARIMA(0,0,1)(0,1,1)12 | 20.483 | 0.553 | |
| Burnt areas [log(SB + 1)] | FZ | ARIMA(0,0,0)(2,1,1)12 | 24.356 | 0.276 |
| PFZ | ARIMA(1,0,0)(2,1,0)12 | 10.735 | 0.968 | |
| SZ | ARIMA(0,0,1)(2,1,1)12 | 18.110 | 0.580 | |
| NRW | ARIMA(0,0,1)(2,1,0)12 | 22.455 | 0.373 | |
Q*: Ljung–Box Q test statistic; FZ: Forest zone; PFZ: Pre-forest zone; SZ: Sudanian zone; NRW: N’Zi River Watershed.
Table 4.
Cross-validation of the fitted models of wildfire time series by ecoregion.
| Time Series | Location | Data Type | Errors | ||
|---|---|---|---|---|---|
| RMSE | MAE | MASE | |||
| Number of wildfires [log(NF + 1)] | FZ | Train set | 0.6375 | 0.4177 | 0.8158 |
| Test set | 0.5988 | 0.4188 | 0.8181 | ||
| PFZ | Train set | 0.5948 | 0.3781 | 0.7035 | |
| Test set | 0.5835 | 0.3727 | 0.6935 | ||
| SZ | Train set | 0.7028 | 0.3988 | 0.8686 | |
| Test set | 0.5884 | 0.3320 | 0.7231 | ||
| NRW | Train set | 0.6765 | 0.4530 | 0.7956 | |
| Test set | 0.6527 | 0.4674 | 0.8209 | ||
| Burnt areas [log(SB + 1)] | FZ | Train set | 1.6909 | 0.9354 | 0.7625 |
| Test set | 1.4606 | 0.8383 | 0.6834 | ||
| PFZ | Train set | 1.5344 | 0.8072 | 0.7568 | |
| Test set | 1.4919 | 0.6518 | 0.6110 | ||
| SZ | Train set | 1.5017 | 0.8041 | 0.8307 | |
| Test set | 1.2092 | 0.5882 | 0.6077 | ||
| NRW | Train set | 1.5566 | 0.8687 | 0.6981 | |
| Test set | 1.2112 | 0.7116 | 0.5718 | ||
FZ: Forest zone; PFZ: Pre-forest zone; SZ: Sudanian zone; NRW: N’Zi River Watershed.
© 2020 by the authors. Licensee MDPI, Basel, Switzerland. This article is an open access article distributed under the terms and conditions of the Creative Commons Attribution (CC BY) license (http://creativecommons.org/licenses/by/4.0/).
Share and Cite
MDPI and ACS Style
Kouassi, J.-L.; Wandan, N.; Mbow, C. Predictive Modeling of Wildfire Occurrence and Damage in a Tropical Savanna Ecosystem of West Africa. Fire 2020, 3, 42. https://doi.org/10.3390/fire3030042
AMA Style
Kouassi J-L, Wandan N, Mbow C. Predictive Modeling of Wildfire Occurrence and Damage in a Tropical Savanna Ecosystem of West Africa. Fire. 2020; 3(3):42. https://doi.org/10.3390/fire3030042
Chicago/Turabian StyleKouassi, Jean-Luc, Narcisse Wandan, and Cheikh Mbow. 2020. "Predictive Modeling of Wildfire Occurrence and Damage in a Tropical Savanna Ecosystem of West Africa" Fire 3, no. 3: 42. https://doi.org/10.3390/fire3030042