Tree Mortality Following Mixed-Severity Prescribed Fire Dramatically Alters the Structure of a Developing Pinus taeda Forest on the Mid-Atlantic Coastal Plain

The Nature Conservancy, MD/DC Chapter, Bethesda, MD 20814, USA
*
Author to whom correspondence should be addressed.
Fire 2019, 2(2), 25; https://doi.org/10.3390/fire2020025
Submission received: 28 March 2019
/
Revised: 13 May 2019
/
Accepted: 15 May 2019
/
Published: 17 May 2019
Abstract
:This case study documents the aftermath of a mixed-severity prescribed fire conducted during the growing season in a young loblolly pine forest. The specific management objective involved killing a substantial proportion of the overstory trees and creating an open-canopy habitat. The burn generated canopy openings across 26% of the 25-ha burn block, substantially altering the horizontal structure. Mortality of pines was high and stems throughout the size distribution were impacted; stem density was reduced by 60% and basal area and aboveground biomass (AGB) by ~30% at the end of the first growing season. A nonlinear regression model fit to plot data portrays a positive relationship between high stocking (i.e., relative density > 0.60) and postburn mortality. Survival of individual trees was reliably modeled with logistic regression, including variables describing the relative reduction in the size of tree crowns following the burn. Total AGB recovered rapidly, on average exceeding levels at the time of the burn by 23% after six growing seasons. Intentional mixed-severity burning effectively created persistent canopy openings in a young fire-tolerant precommercial-sized pine forest, meeting our objectives of structural alteration for habitat restoration.
1. Introduction
Fire exclusion has led to dramatic changes in the composition and structure of Eastern US forests, often with negative implications for species and habitat diversity [1,2,3]. Forest management, including the use of prescribed fire, that generates structural and compositional heterogeneity is advocated as a viable approach to promoting adaptation and resilience in the context of a changing climate [4,5,6]. Restoring historical fire regimes can support these goals by creating opportunities for the establishment of adapted trees and understory vegetation [7,8]. However, low-severity disturbances, including conventional forest thinning and understory burning, may not alter stand development trajectories sufficiently to achieve more broad-based management objectives (e.g., [9]).
The ecological “work” accomplished by moderate and severe wildland fires is increasingly recognized as important for generating structural heterogeneity and habitat conditions that are often missing from contemporary forests, most conspicuously in the Western US [10,11]. In the Mid-Atlantic Coastal Plain (MACP), available evidence suggests that mixed- and high-severity fires likely played an important, if spatially limited, role in driving forest dynamics prior to widespread fire exclusion. For MACP forests, estimates of the historical return interval for surface fires fall within the 4–12-year range [12,13] but with up to 10% of the region having been characterized by mixed-severity fire regimes (i.e., relatively uniform areas of 25%–75% top kill) [14]. Regionally, forests with significant components of pitch (Pinus rigida Mill.), pond (P. serotina Michx.), and Virginia pine (P. virginiana Mill.) are considered adapted to mixed-severity regimes. Moreover, once locally abundant Atlantic white-cedar (Chamaecyparis thyoides L.) forests were characterized by an infrequent stand-replacement fire regime [15]. Land managers tasked with carrying out prescribed fires that seek to emulate these higher-severity fire regimes would benefit from more examples of their application.
Embedded within these broader landscapes, there are also rare fire-dependent ecosystems of conservation concern. A notable example in the MACP are paleo inland dunes of aeolian origin that are a prominent geomorphic feature of the Central Delmarva Peninsula [16,17]. Medium- and fine-grained sands with excessive drainage characteristics support rare Inland Sand Dune and Ridge Woodland communities (G3) comprised of pyrogenic tree (Quercus, Pinus) and shrub (Gaylussacia, Vaccinium) species [18,19]. These historically variably open-canopy habitats are a regional conservation priority for rare and threatened (RTE) species, including the Eastern Pine Barrens Tiger Beetle (Cicindelidia abdominalis) G3/S1 and Sundial Lupine (Lupinus perennis L.) S2/Frosted Elfin Butterfly (Callophrys irus) G3/S1 association. Yet, the closed canopy loblolly pine monocultures that currently occupy many of these sites diminish their habitat value. Returning fire to these areas is a high-priority component of their overall restoration management.
Retrospective analyses can be used to estimate the effects of wildfires and prescribed burns on tree mortality and growth response of surviving trees [20,21,22,23], where variables describing crown damage, bole char, and duff consumption have proven useful for predicting fire-induced tree mortality [24,25]. Researchers have also explored the potential of using prescribed fire to accomplish the silvicultural goal of precommercial thinning within young densely stocked southern pine stands, where not causing substantial damage to the overstory is taken as a measure of success [26,27,28]. At larger spatial scales, burn severity maps derived from multispectral image pairs allow forecasting of fire effects on vegetation structure, that is, development of canopy gaps, primarily in conifer-dominated systems [29,30,31]. Working in Central Appalachian mixed forests, Lorber et al. [32] used aerial imagery and field plots to map canopy gaps generated by prescribed burns and characterized temporal dynamics of the resulting early successional habitat. Because these relationships vary across combinations of factors including species composition, season of burn, postburn weather patterns, and stage of forest development, empirical observations collected over as wide a range of conditions as possible provide important data points for comparison with findings from designed studies.
Forecast trends in climate, including increased temperature and precipitation, evaporative demand, and extended periods of drought, raise the possibility that conditions conducive to mixed-severity fires may increase in the Eastern United States [33,34,35]. In combination, interest in emulating the range of historical fire regimes and the potential of increased fire danger elevate the relevance of examples documenting the effects of mixed-severity burns and can help provide context for practitioners contemplating their use. Moreover, intentional mixed-severity burning presents a potentially low-cost solution for addressing conservation issues related to high canopy closure in young forests that may be undertaken before trees reach commercial size and timber harvesting becomes an option. Here, we report on the aftermath of one such prescribed fire carried out in a rapidly developing precommercial-sized pine monoculture, a common condition in the Mid-Atlantic and Southeastern Coastal Plain regions. Our management objective was to initiate the improvement of habitat conditions for a suite of RTE species that inhabit inland dune woodland communities and which would benefit from the creation of fire-mediated canopy openings. Seven years of remeasurement data were used to describe structural changes induced by the burn at three levels of spatial resolution: the forest canopy, fixed area plots, and individual trees. Generation of persistent canopy openings was considered the primary measure of treatment success, and we tracked the response of groups of trees (i.e., plots) and individual trees in order to provide detailed information about the possible effects of mixed-severity fires in young pine forests.
2. Materials and Methods
2.1. Study Area
The Nature Conservancy’s (TNC) Nassawango Creek Preserve (4048 ha) is located on the Eastern Shore of Maryland, Delmarva Peninsula, USA (38°16′09.5″ N, 75°28′15.2″ W). Riparian and other wetland forest types dominate the ownership, though approximately one-third of the property is occupied by loblolly pine stands established by former industrial owners. The 25-ha burn block of 10-year-old naturally regenerated loblolly pine that is the subject of this study encompasses an extensive area of inland dune habitat identified by TNC as high priority for restoration management. The landscape is predominantly of low relief but with inland sand dunes extending 1–5 m above the surrounding flats [16]. This particular dune is distributed across two burn blocks distinguished by management history. Whereas adjacent burn blocks had been thinned prior to burning, the trees within the study area were below merchantable size at the time of the burn. The former owners carried out an aerial herbicide application around stand-age 5 to release pines from overtopping competition by hardwoods [36]. Management units surrounding the study area were burned earlier in the spring, creating an extensive area of “black” for safety when this more aggressive prescription was carried out.
2.2. Prescribed Fire Treatment
The prescribed fire took place on 11 May 2011 between the hours of 2:00 and 4:00 p.m. EST, representing the first time this forest was burned since it was regenerated in ~2001. During the burn interval, ambient temperatures ranged from 19.4 up to 21.1 °C, relative humidity (RH) ranged between 55% and 58%, and winds were relatively light at 3.2–8.0 km/h from the NE. The unit received precipitation 7 and 12 days prior to the burn in the amounts of 1.78 and 1.12 cm, respectively. Ignition was carried out as a strip head fire operation oriented in a NW–SE direction. Three igniters were spaced out over ~15 m, and a total of three consecutive passes (nine lines total) were used to ignite the interior of the block. Understory fuels were uniform and dominated by accumulated pine needles, approximately 5–10 cm deep. The fuel model that best represents conditions at this site is “TL8, Long-Needle Litter” [37]. Weather conditions during the following week included generally warming temperatures, and a total of 2.08 cm of precipitation distributed over three events, the largest (1.12 cm) arriving on 14 May. Fire behavior variables were not recorded during the burn. We used the height of char on the boles of pine trees and height and proportion of crown scorch as proxies for fire intensity.
2.3. Forest Inventory
A systematic grid of fixed-area inventory plots (0.008 ha, n = 20) was established across the study area ~1 week after the burn. Measurements collected on the individual trees (≥2.54-cm diameter at breast height (DBH) at 1.37 m) included: species; stem diameter; total height; height to base of live crown (lowest whorl or major live branch, i.e., uncompacted); height to the base of crown scorch; height of scorch on bole; crown class (i.e., dominant, codominant, intermediate, and overtopped); and live or dead status. Crown length and live or dead status at the time of the burn were reconstructed based on observations made at the time of the first postburn inventory. Specifically, retention of scorched needles was sufficient to reliably estimate the height of the live crown base at the time of the burn, and in the rare cases where it was difficult to discern (n < 5), we used the condition of the inner bark to distinguish between trees that were standing dead at the time of the burn from those killed by the fire. Hereafter, for convenience, we refer to the reconstructed values as the preburn condition. Individual trees were marked with numbered metal tags. Plots were visited seven times over a seven-year period, at shorter intervals immediately following the burn, to assess mortality, accretion, and ingrowth (Table 1). Loblolly pine aboveground biomass (AGB) was estimated using equation “G” (DBH, height) in [38], and for subcanopy hardwoods, we used the general equation in [39], after converting to groundline diameter. Mortality resulting from the burn was assessed over the interval from May to September 2011 (Table 1).
2.4. Statistical Models
To describe changes in stand structure, we used two complementary approaches to modeling mortality dynamics associated with the prescribed fire. First, at the plot level (n = 20), a nonlinear regression model was used to describe the relationship between preburn pine stocking, that is, relative density (RD) based on Stand Density Index (SDI, [40]) for loblolly pine, where SDIMAX = 1111 and RD = SDIPLOT/SDIMAX, and cumulative loss of pine basal area (BA) one growing season after the burn (in September 2011). Second, the likelihood of pines surviving the burn was evaluated with a binary logistic model including variables describing pre- and postburn attributes of the individual trees (n = 477). A total of 21 plausible competing models were fit using the logit model option in SYSTAT (v.12, SYSTAT Software, Inc., San Jose, CA USA, 2007) and included one to three independent variables describing the social position of the tree on the plot (relative size), bole and crown scorch ratios, and length of the tree’s live crown before and after the burn (Table 2). Relative size was evaluated as the average of relative height (HR) and relative diameter (DR), where HR = H/HMAX and DR = D/DMAX considering all trees ≥ 2.54-cm DBH on each plot. We note that these regression models were fit to plot- and tree-level data from the same treatment, which limits their extrapolation beyond that domain.
2.5. Remote Sensing
To quantify the size distribution of canopy openings, the project area was flown with a photogrammetric drone in the spring of 2016, after the majority of trees killed in the fire had fallen over, providing ~7.5-cm-resolution imagery of the study area. To quantify the area impacted by the burn, we digitized contiguous areas of open canopy within ArcGIS (v.10.6, ESRI, Inc., Redlands, CA, USA, 2017) based on the approximate drip edge of tree crowns bordering each opening. A minimum size threshold of 4.64 m2 was used to map canopy openings, corresponding to the average crown projection area of dominant and codominant trees on the study plots. Canopy openings registered on the 2016 imagery were compared with 15-cm-resolution imagery acquired in 2010, prior to the burn, to avoid the possibility of misattributing openings to the burn. Paired pre- and postburn Landsat-TM scenes (30-m resolution) were used to develop burn severity maps based on difference normalized burn ratio (dNBR) following the standard methodology of the Monitoring Trends in Burn Severity program and validated for southern pine systems by [31]. To test for a relationship between opening size and burn severity, correlation analysis (Pearson’s r) was carried out between the area of the mapped canopy opening and corresponding dNBR value, determined by clipping the dNBR raster to the canopy opening layer and calculating an area weighted average using raster math in ArcGIS.
3. Results
3.1. Fire Effects on Forest Structure and Composition
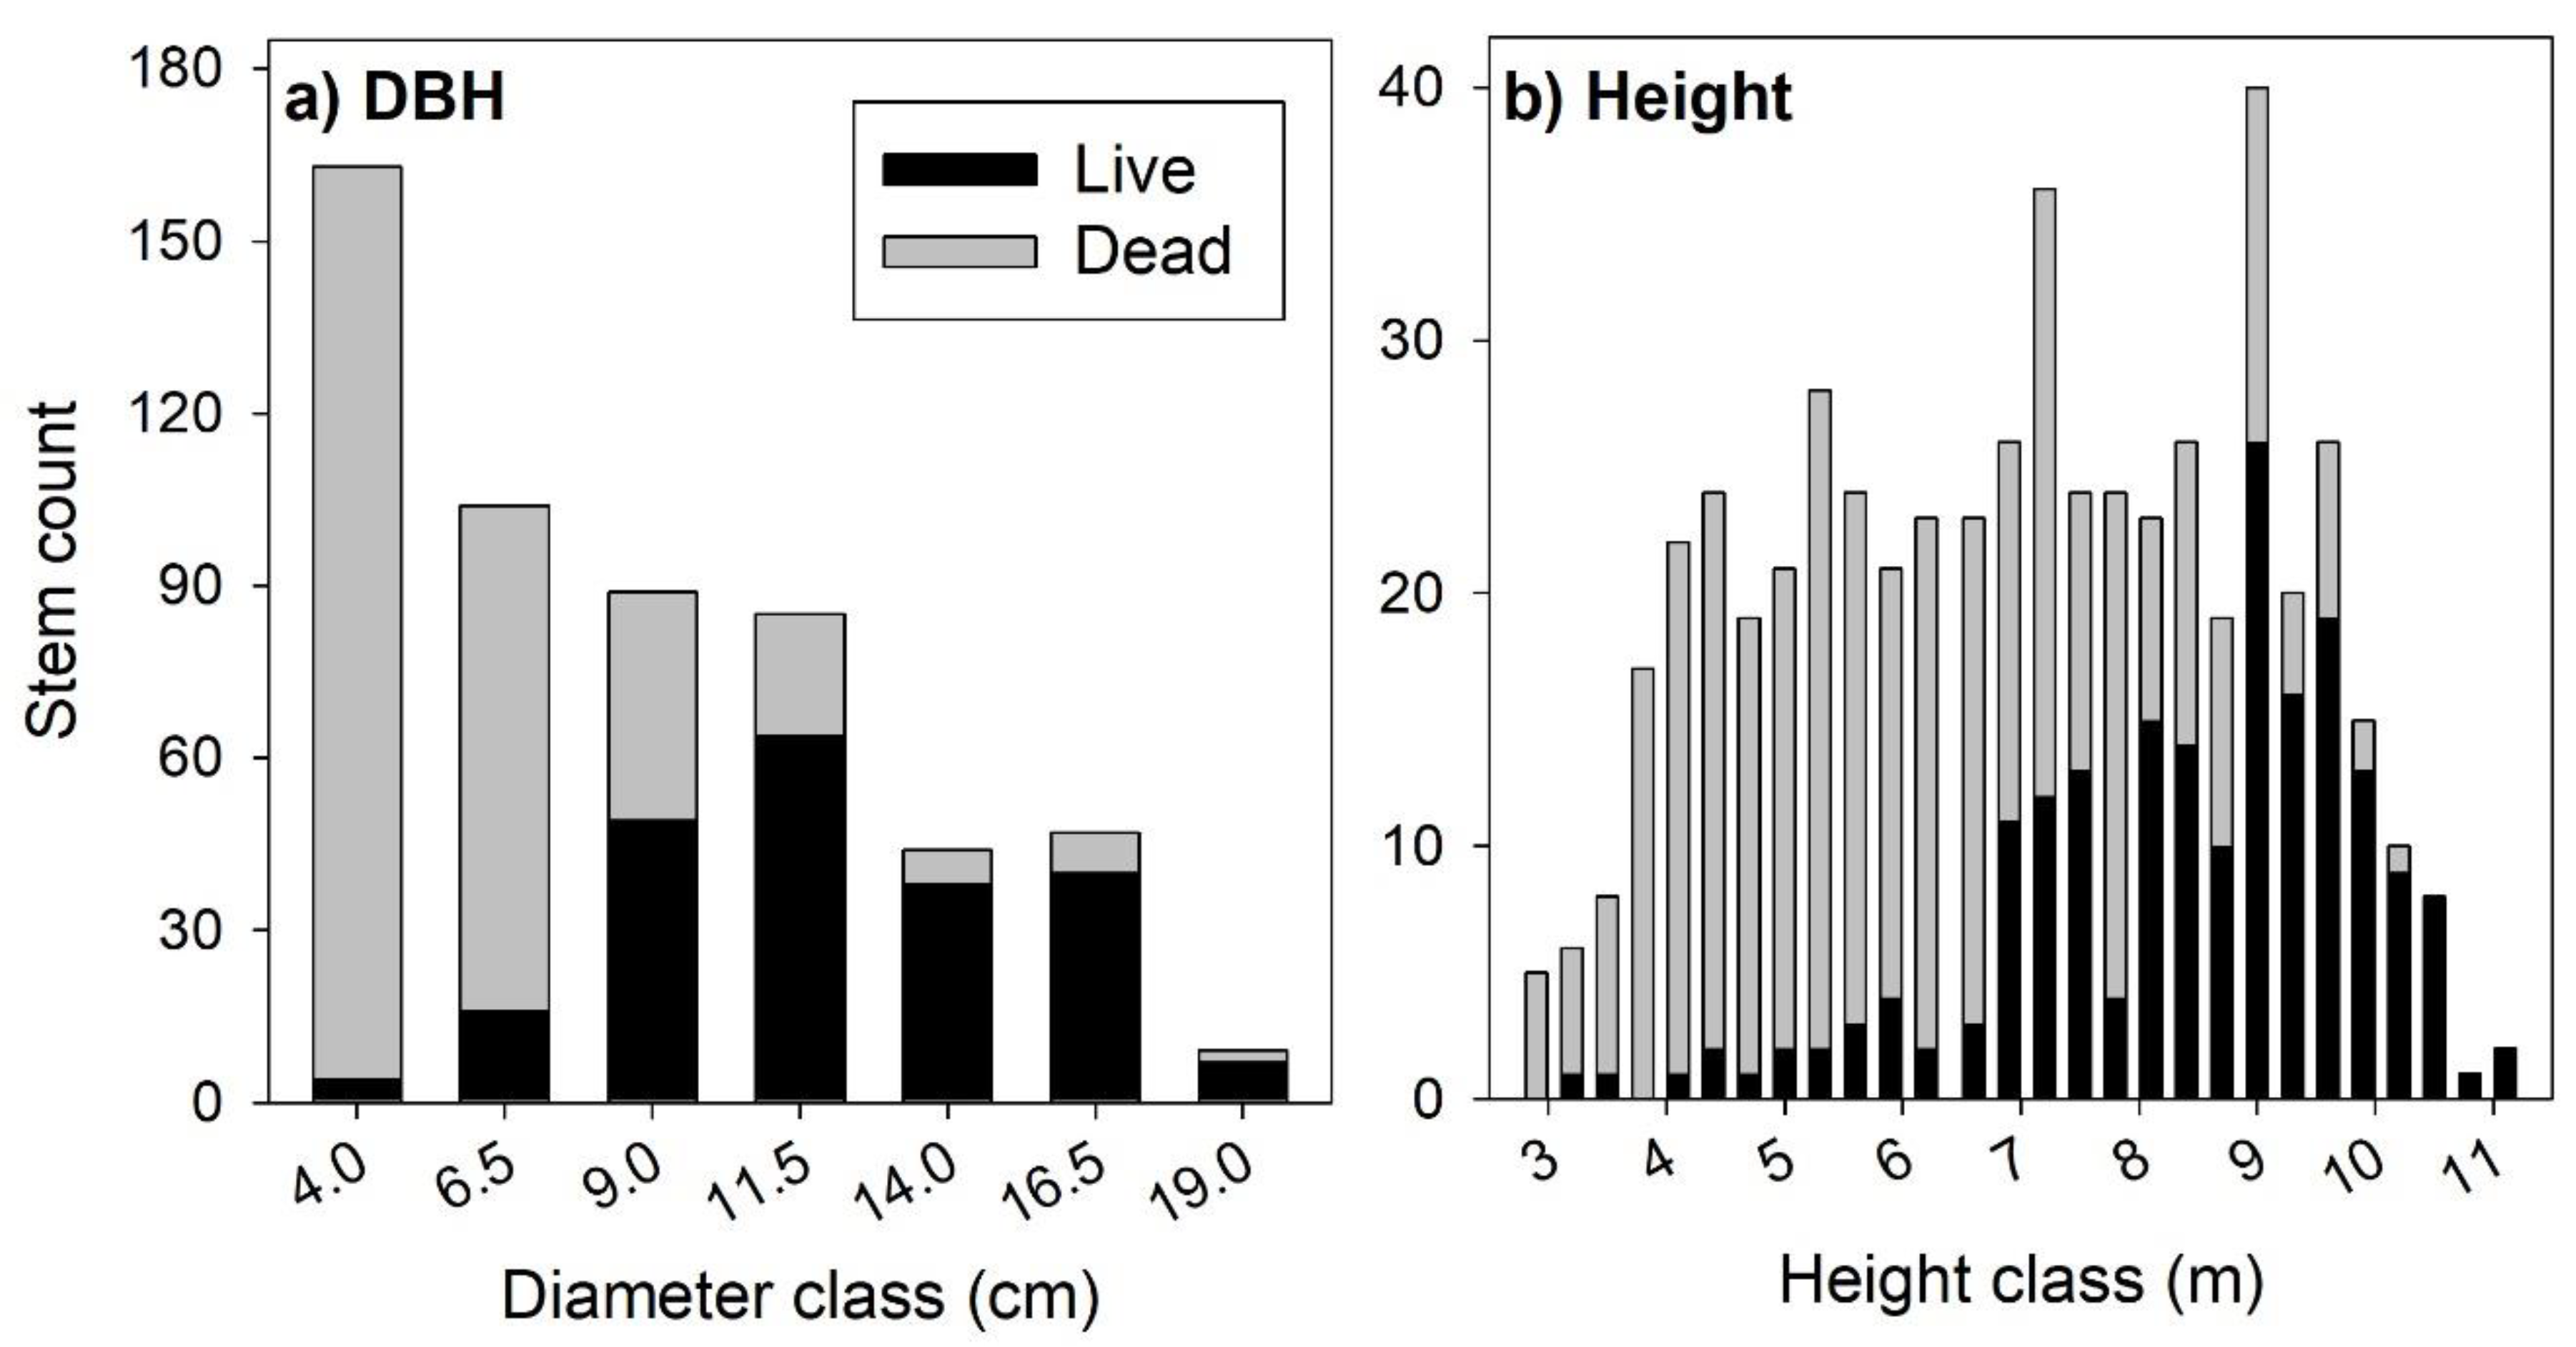
At the time of the burn, the dominant vegetation at the study site was best characterized as a rapidly developing loblolly pine monoculture with a minor component of Virginia and pond pines (combined 0.7% of total stems and 0.2% of BA), and a low density of subcanopy broadleaf trees (Table 1). The average height of dominant and codominant pines was 8.69 ± 0.88 m (mean ± SD) and the average height to the base of the live crown for all pines ≥2.54-cm DBH was 1.89 ± 0.49 m. The preponderance of mortality attributable to the prescribed burn was apparent by the end of the first growing season, when we documented a 60% reduction in stem density and ~30% declines in both pine BA and AGB (Table 1). The corresponding trend of increasing quadradic mean stand diameter (Dq) indicates that smaller pine trees were relatively more susceptible to fire-induced mortality (Figure 1a). Yet, while comparatively large stems (i.e., ≥10-cm DBH) represented only 14% of all pines killed by the fire, they accounted for half of the total BA lost. Similarly, there was a marked tendency for relatively short stems to be killed by the fire (Figure 1b). Hardwoods, including sweetgum (Liquidambar styraciflua L.) and southern red oak (Quercus falcata Michx.), which were only a minor component of this forest at the time of the burn, were nearly all topkilled (Table 1). Resprouting and ingrowth of stems ≥2.54-cm DBH resulted in a 65% increase to the initial density of hardwoods, yet they still only accounted for 2.3% of BA and 1.4% of AGB seven years after the burn.
3.2. Modeling Fire Effects on Plots and Trees
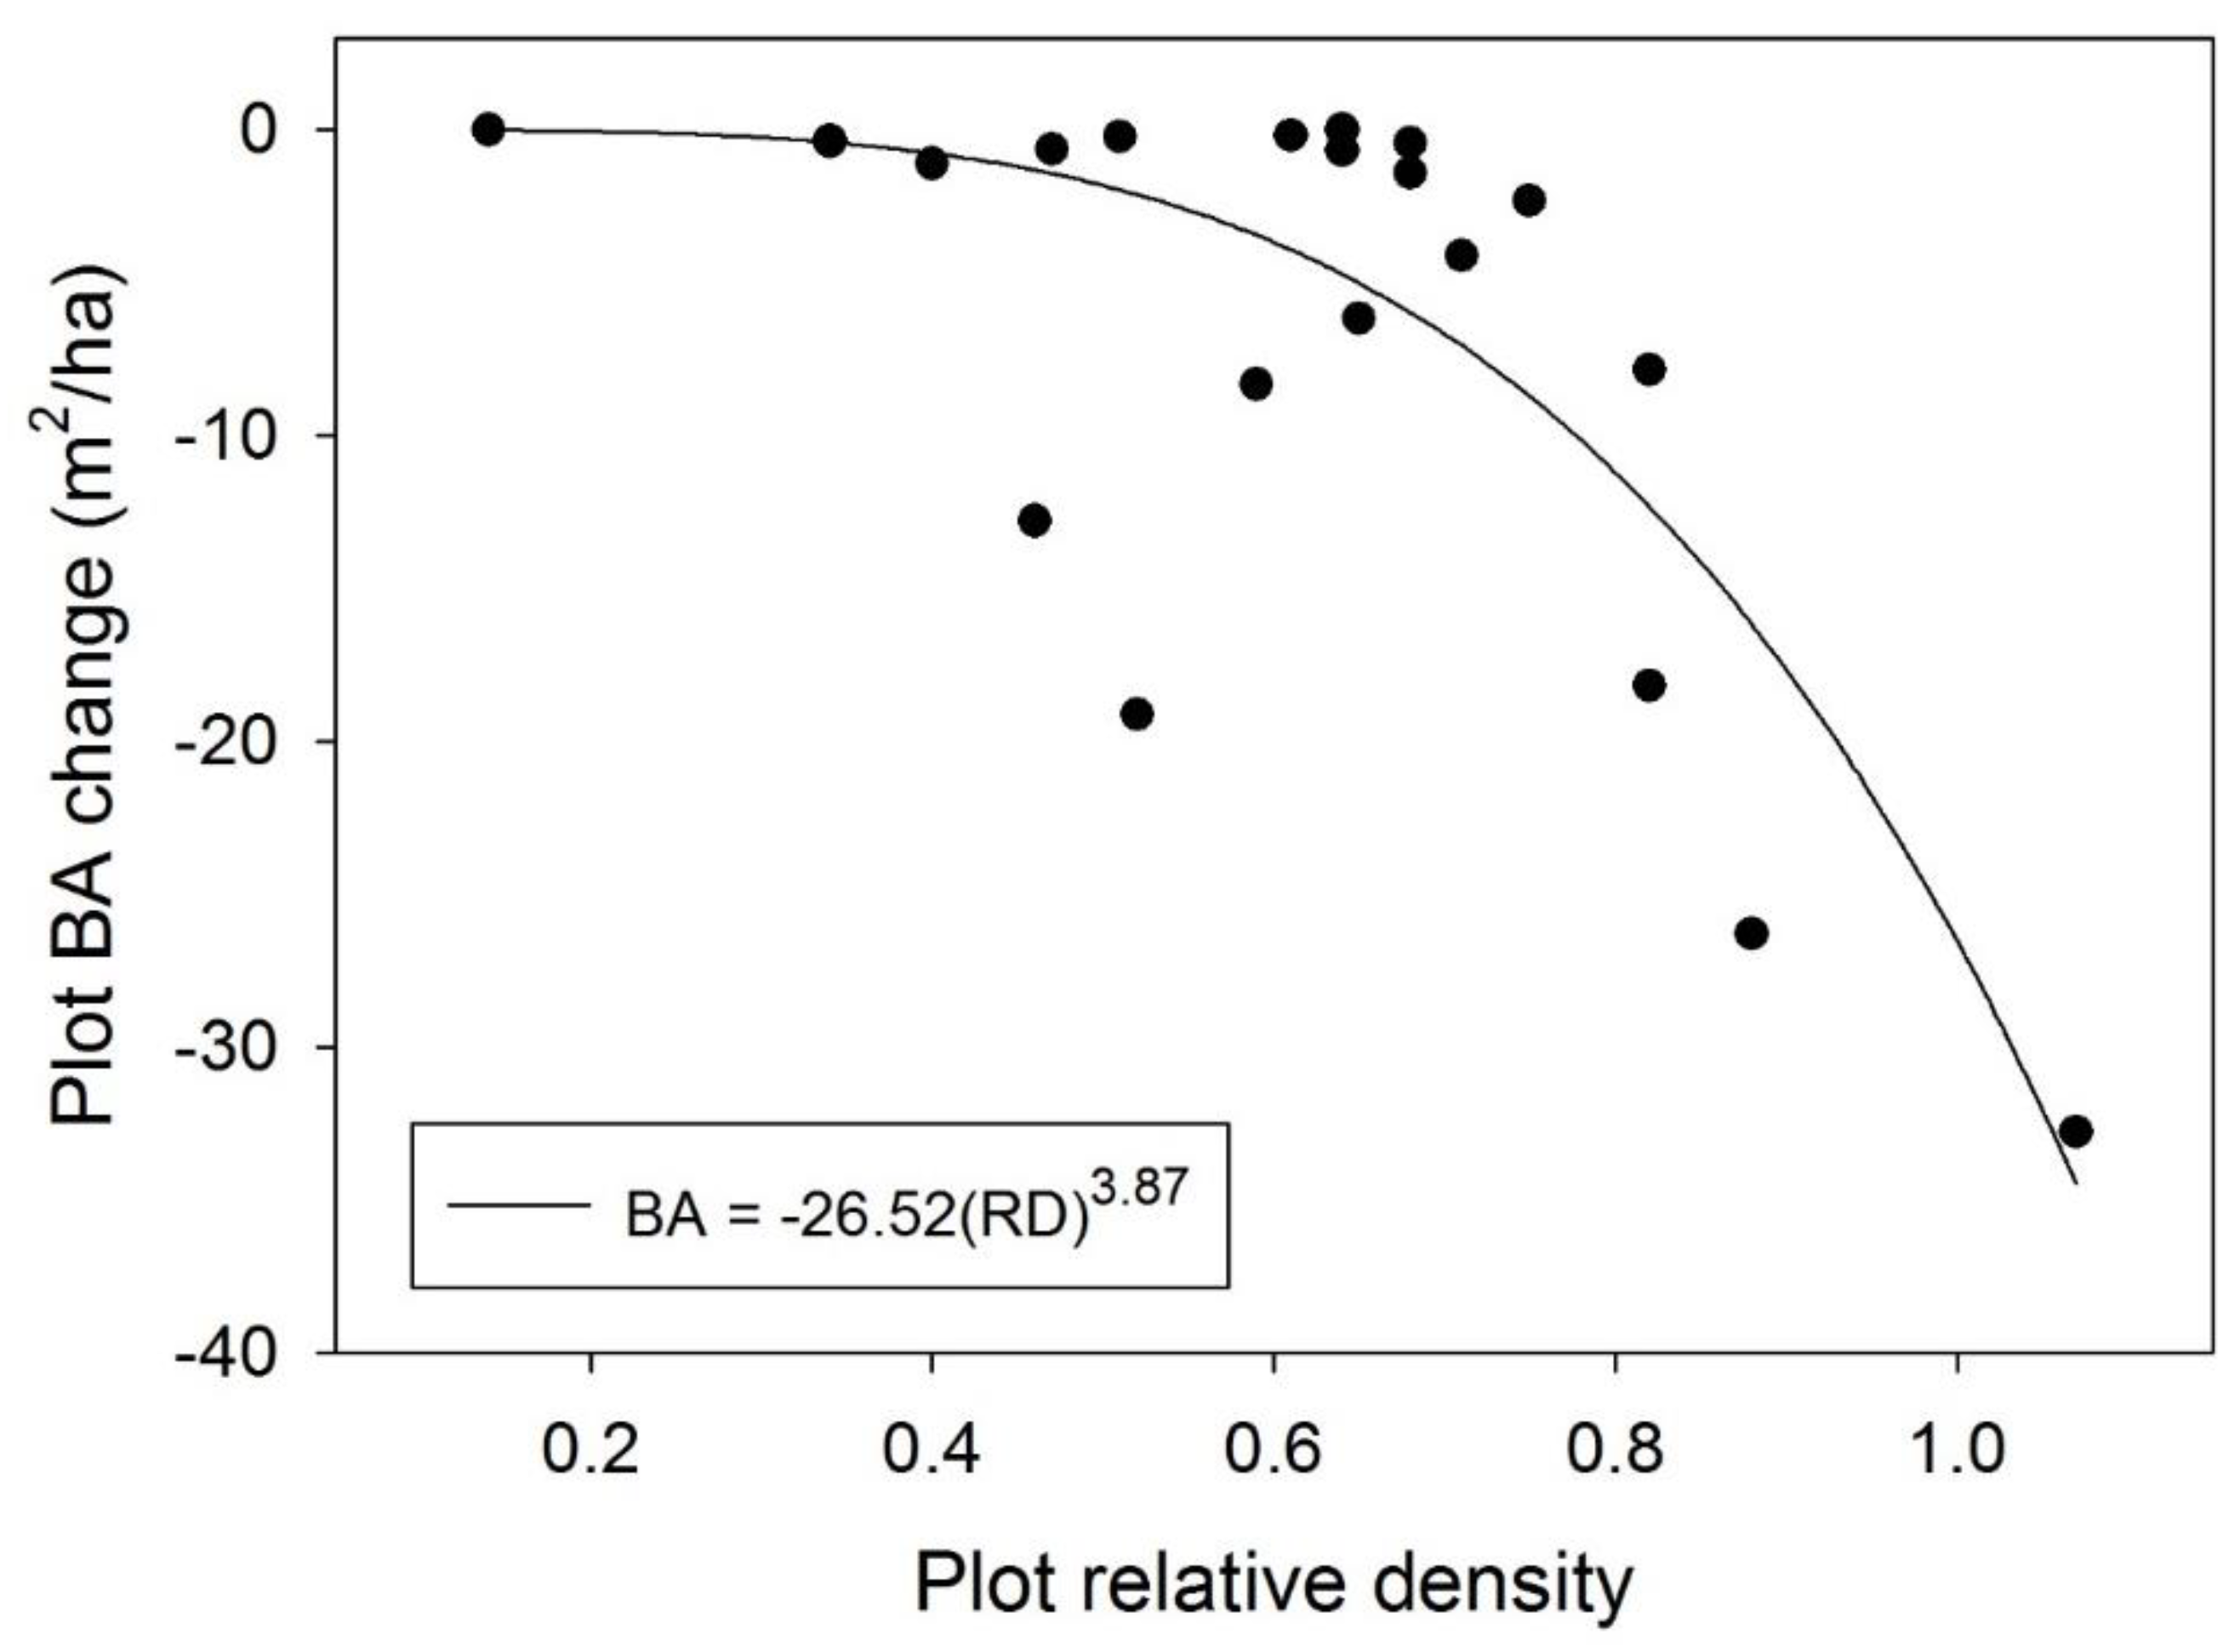
The relative density (RD) of the individual plots exhibited a wide range, from 0.14 to 1.07 (mean = 0.62), and was positively correlated with average height to the base of the live crown for all trees on a given plot (r = 0.547, p = 0.013, n = 20), consistent with expectations due to lower light availability and crown recession on more densely stocked plots. The two-parameter power model fit the plot-level data reasonably well (R2 = 0.576, p < 0.001, n = 20), indicating a positive relationship between RD and burn-related mortality losses above approximately RD = 0.60 (Figure 2). For example, model predictions were for BA losses of 6.7 m2/ha at RD = 0.7, 11.3 m2/ha at RD = 0.8, and 17.7 m2/ha at RD = 0.9. In contrast, among plots for which RD was <0.6, BA losses were minimal, averaging 0.9 m2/ha below that threshold of stocking.
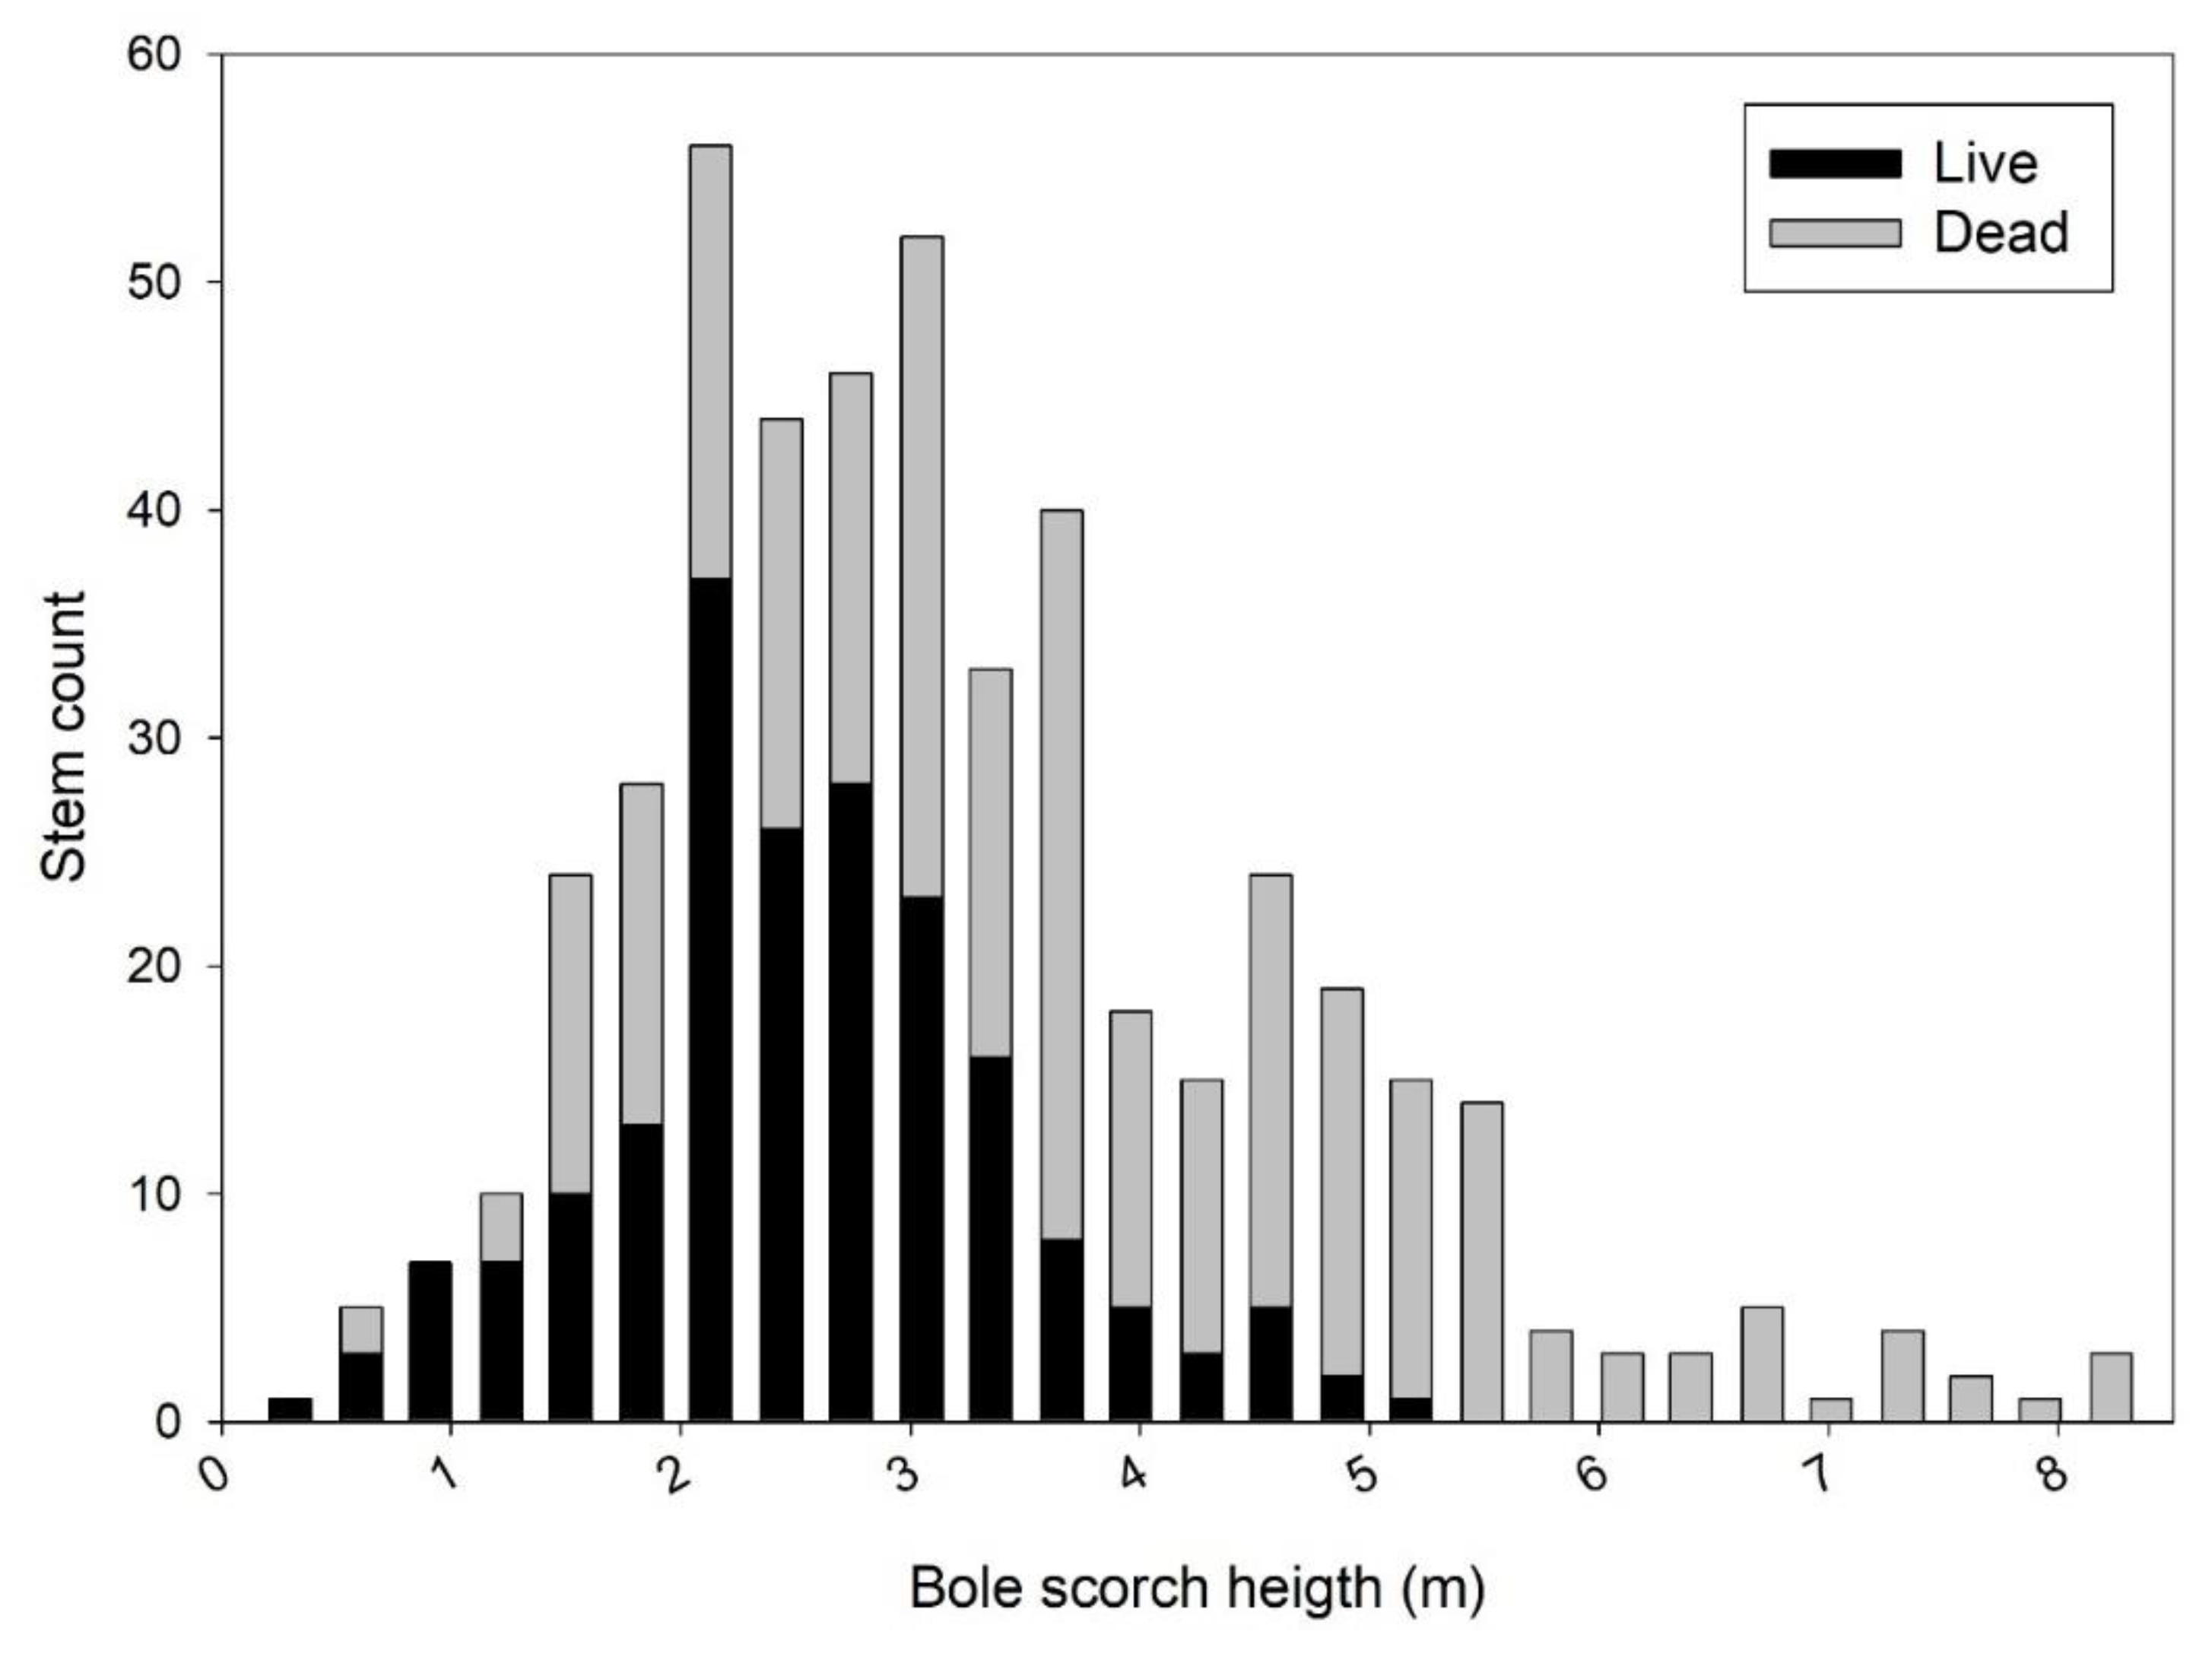
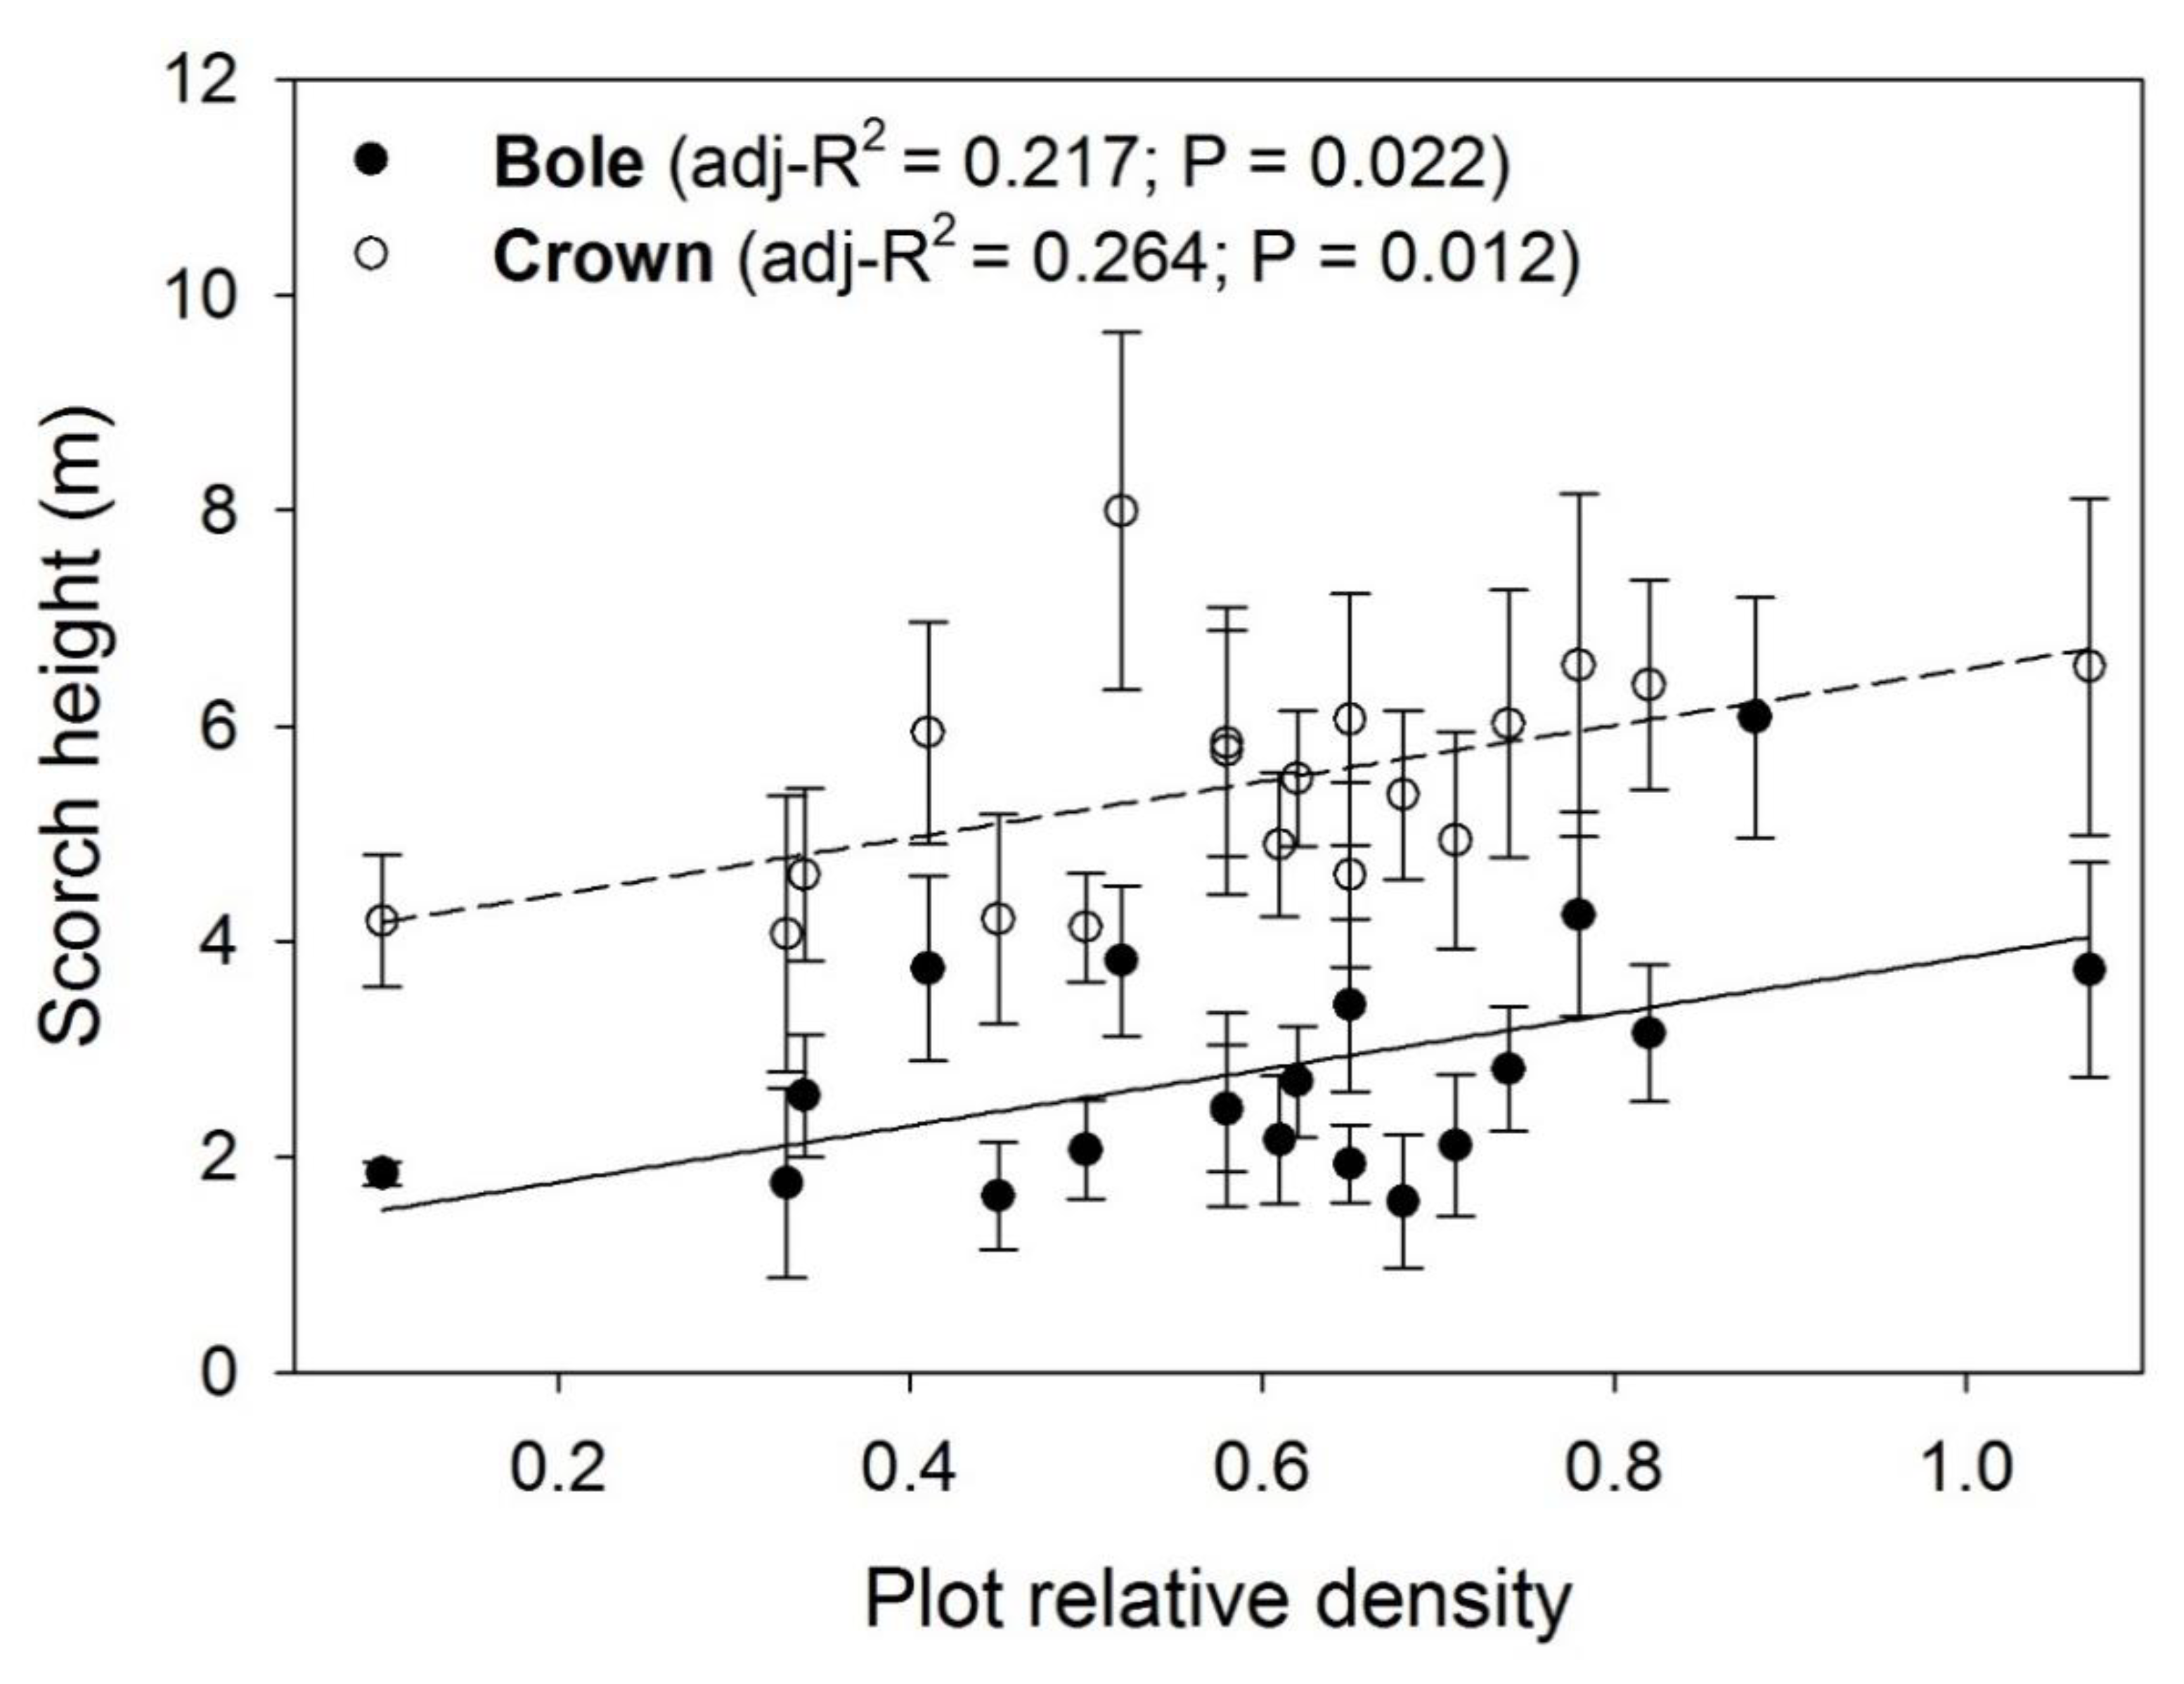
Bole scorch height measured on individual trees exhibited a wide range, from 0.30 to 8.23 m (Figure 3). The median bole scorch height for live and dead stems was 2.44 and 3.66 m, respectively. At bole scorch heights above 5.18 m, no pine trees survived, and 81% of all recorded mortality was associated with bole scorch heights ≥ 2.44 m. Summarized at the plot level, average bole and crown scorch heights increased with plot RD (Figure 4). The height of crown scorch consistently exceeded that of bole scorch, on average by ~2.74 m, obtained by subtracting the intercept terms for the linear regression models. There was no relationship between plot RD and the average height of pine trees on the same plot (n = 20, r = −0.141, p = 0.553).
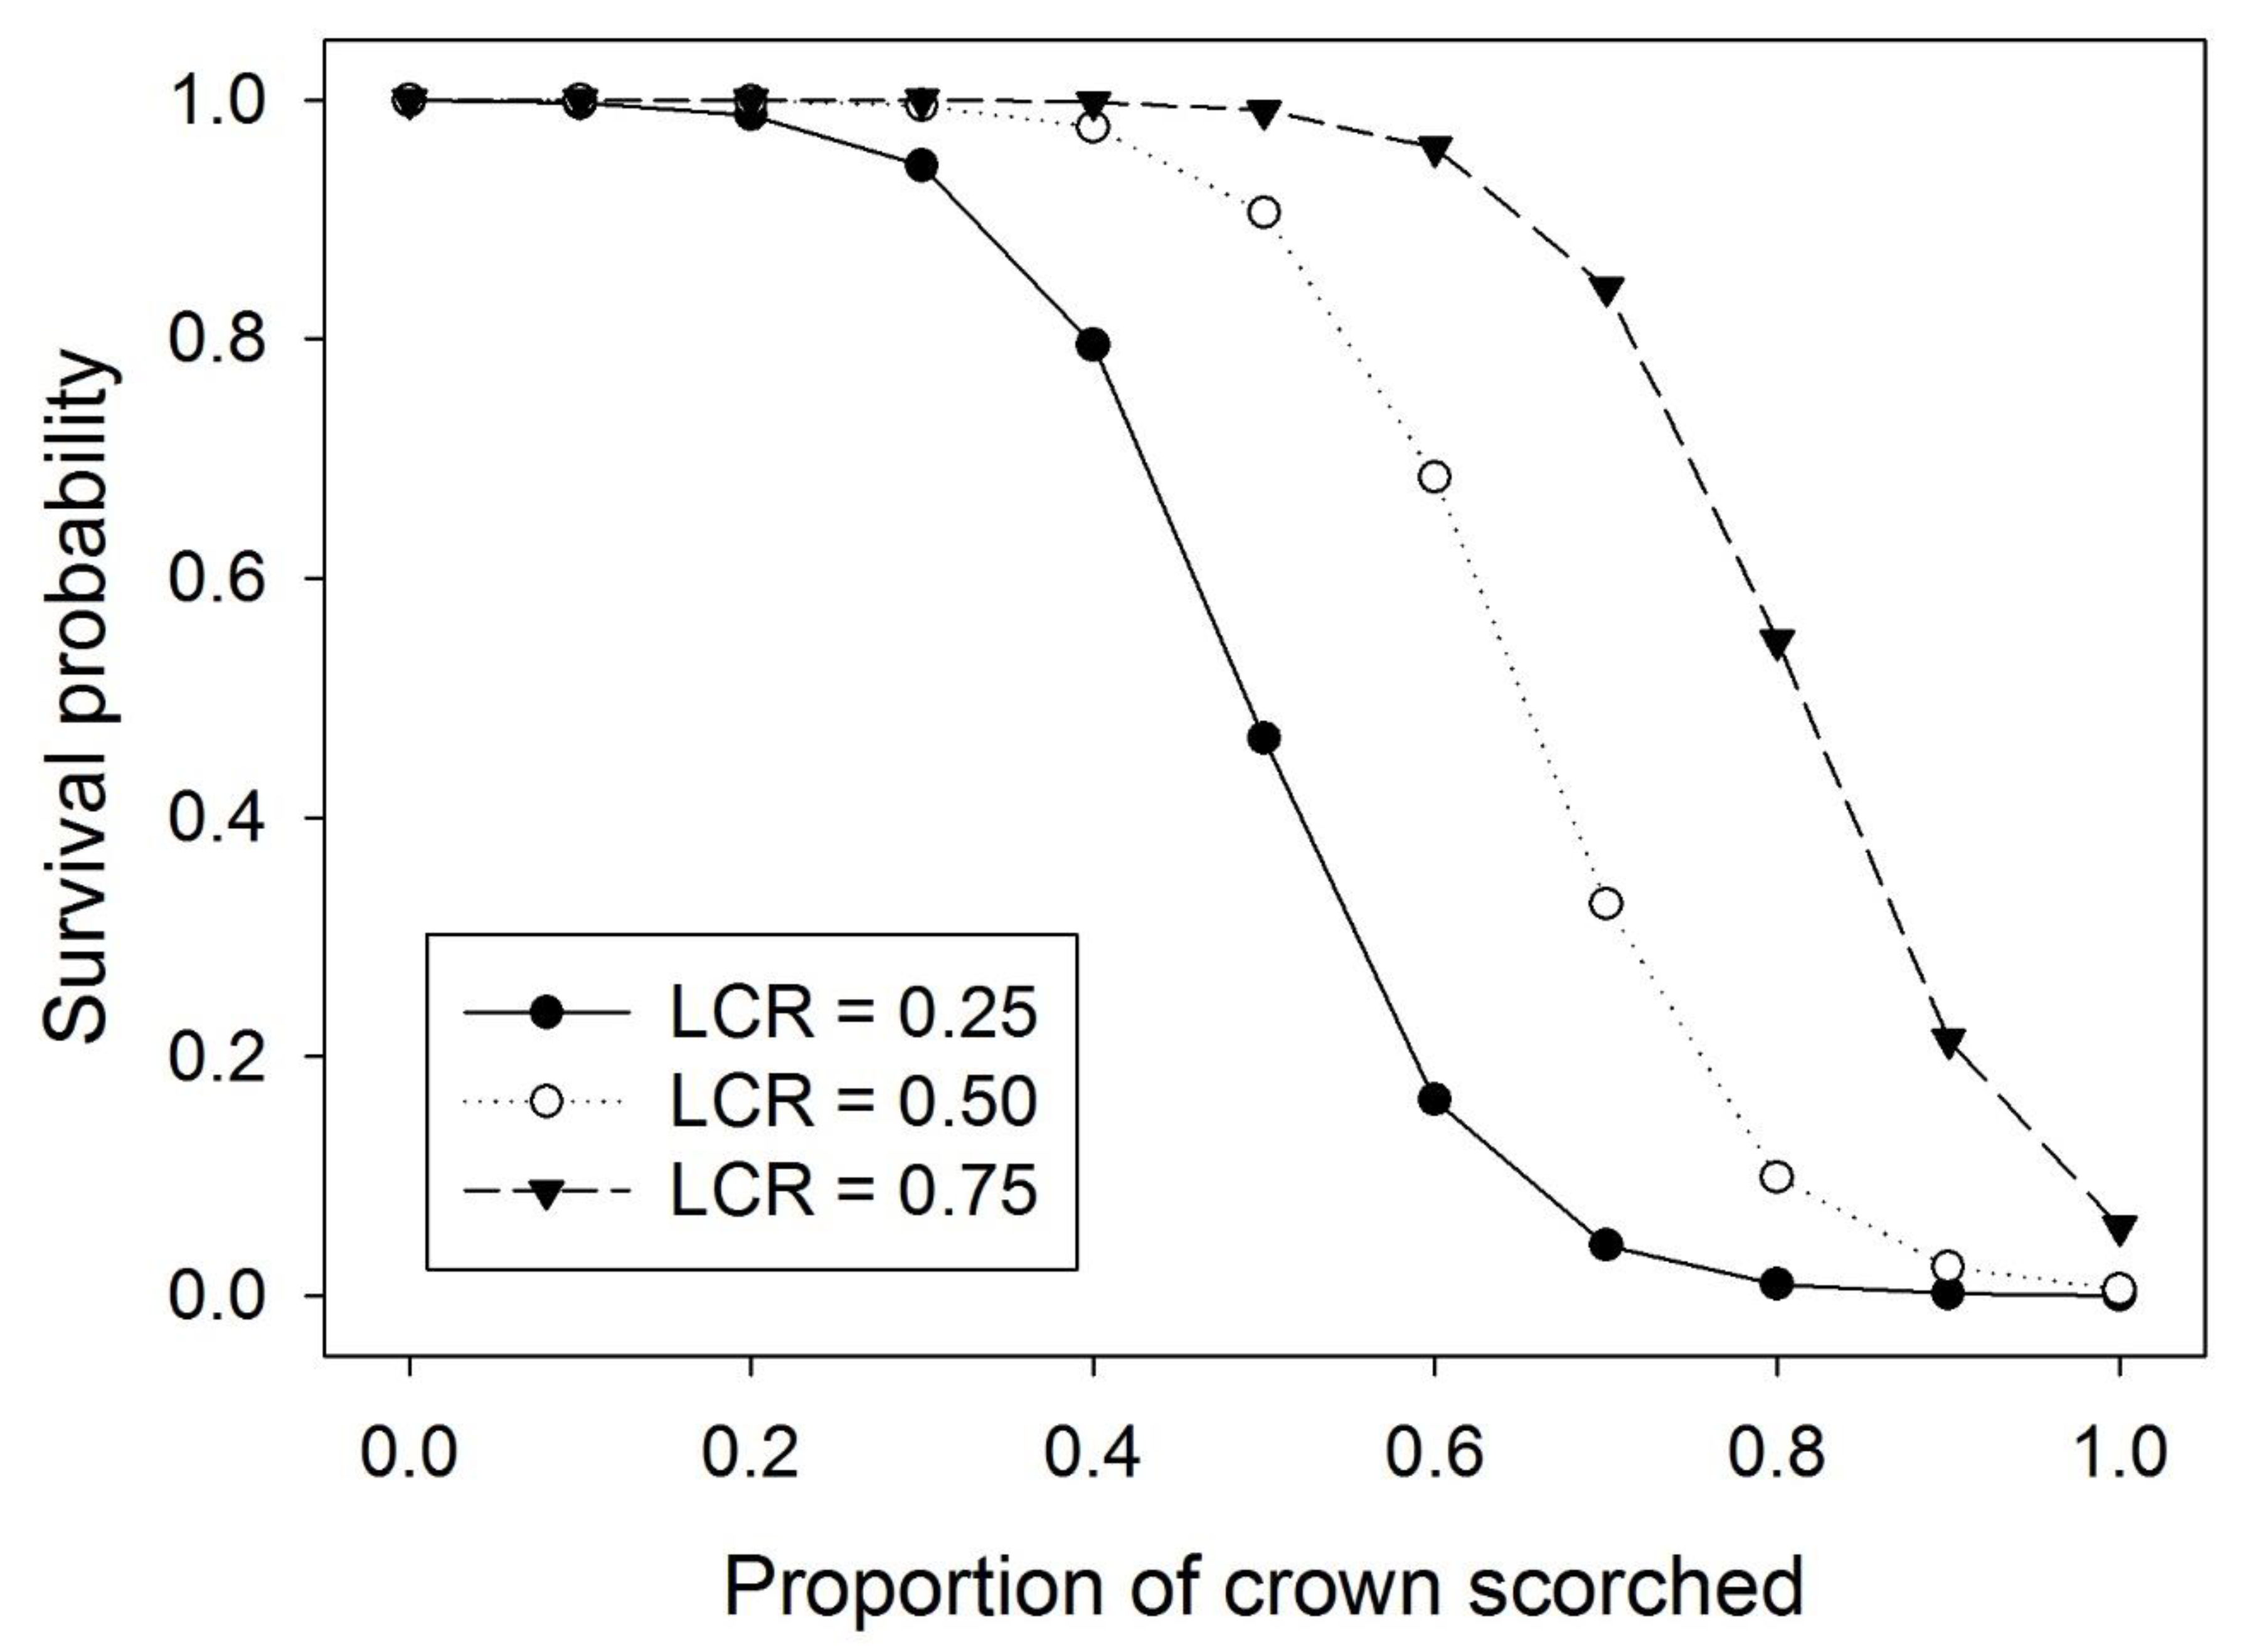
The likelihood of individual trees surviving the burn was reliably predicted with the majority of fitted logit models, where, when summarized across all 21 combinations of independent variables, McFadden’s Rho2 averaged 0.733 (min = 0.451, max = 0.787); prediction success rates averaged 0.898 (min = 0.756, max = 0.923); and receiver operating characteristic curve (ROC) values averaged 0.973 (min = 0.908, max = 0.982) (Table 2). The sample was well balanced in terms of representing live (46%) and dead (54%) trees. Contrary to expectations, the parameter differentiating the relative size of trees on plots was seldom significant, and the negative sign for the height to the base of the live crown parameter was counterintuitive, suggesting trees with larger distances to their crown bases were more vulnerable to mortality. We speculate that this is likely the result of plot density effects on tree structure, referenced at the beginning of this section, which were positively correlated with mortality (Figure 2). We selected model 8 (Table 2) as a parsimonious and intuitive regression which included independent variables describing the live crown ratio at the time of the burn (LCRPRE, p = 0.016) and the proportion of the crown that was scorched by the burn (pCS, p < 0.001). The positive coefficient for LCRPRE indicates trees with initially larger live crowns were more likely to survive, while the negative coefficient for pCS implies reduced survival with increasing scorch. Model predictions indicate that for pine trees with a range of initial LCR of 0.25, 0.50, and 0.75, there was a higher likelihood (prob > 0.5) of mortality when the proportion of the crown scorched by the fire reached 0.49, 0.65, and 0.81, respectively (Figure 5).
3.3. Remote Sensing of the Forest Canopy
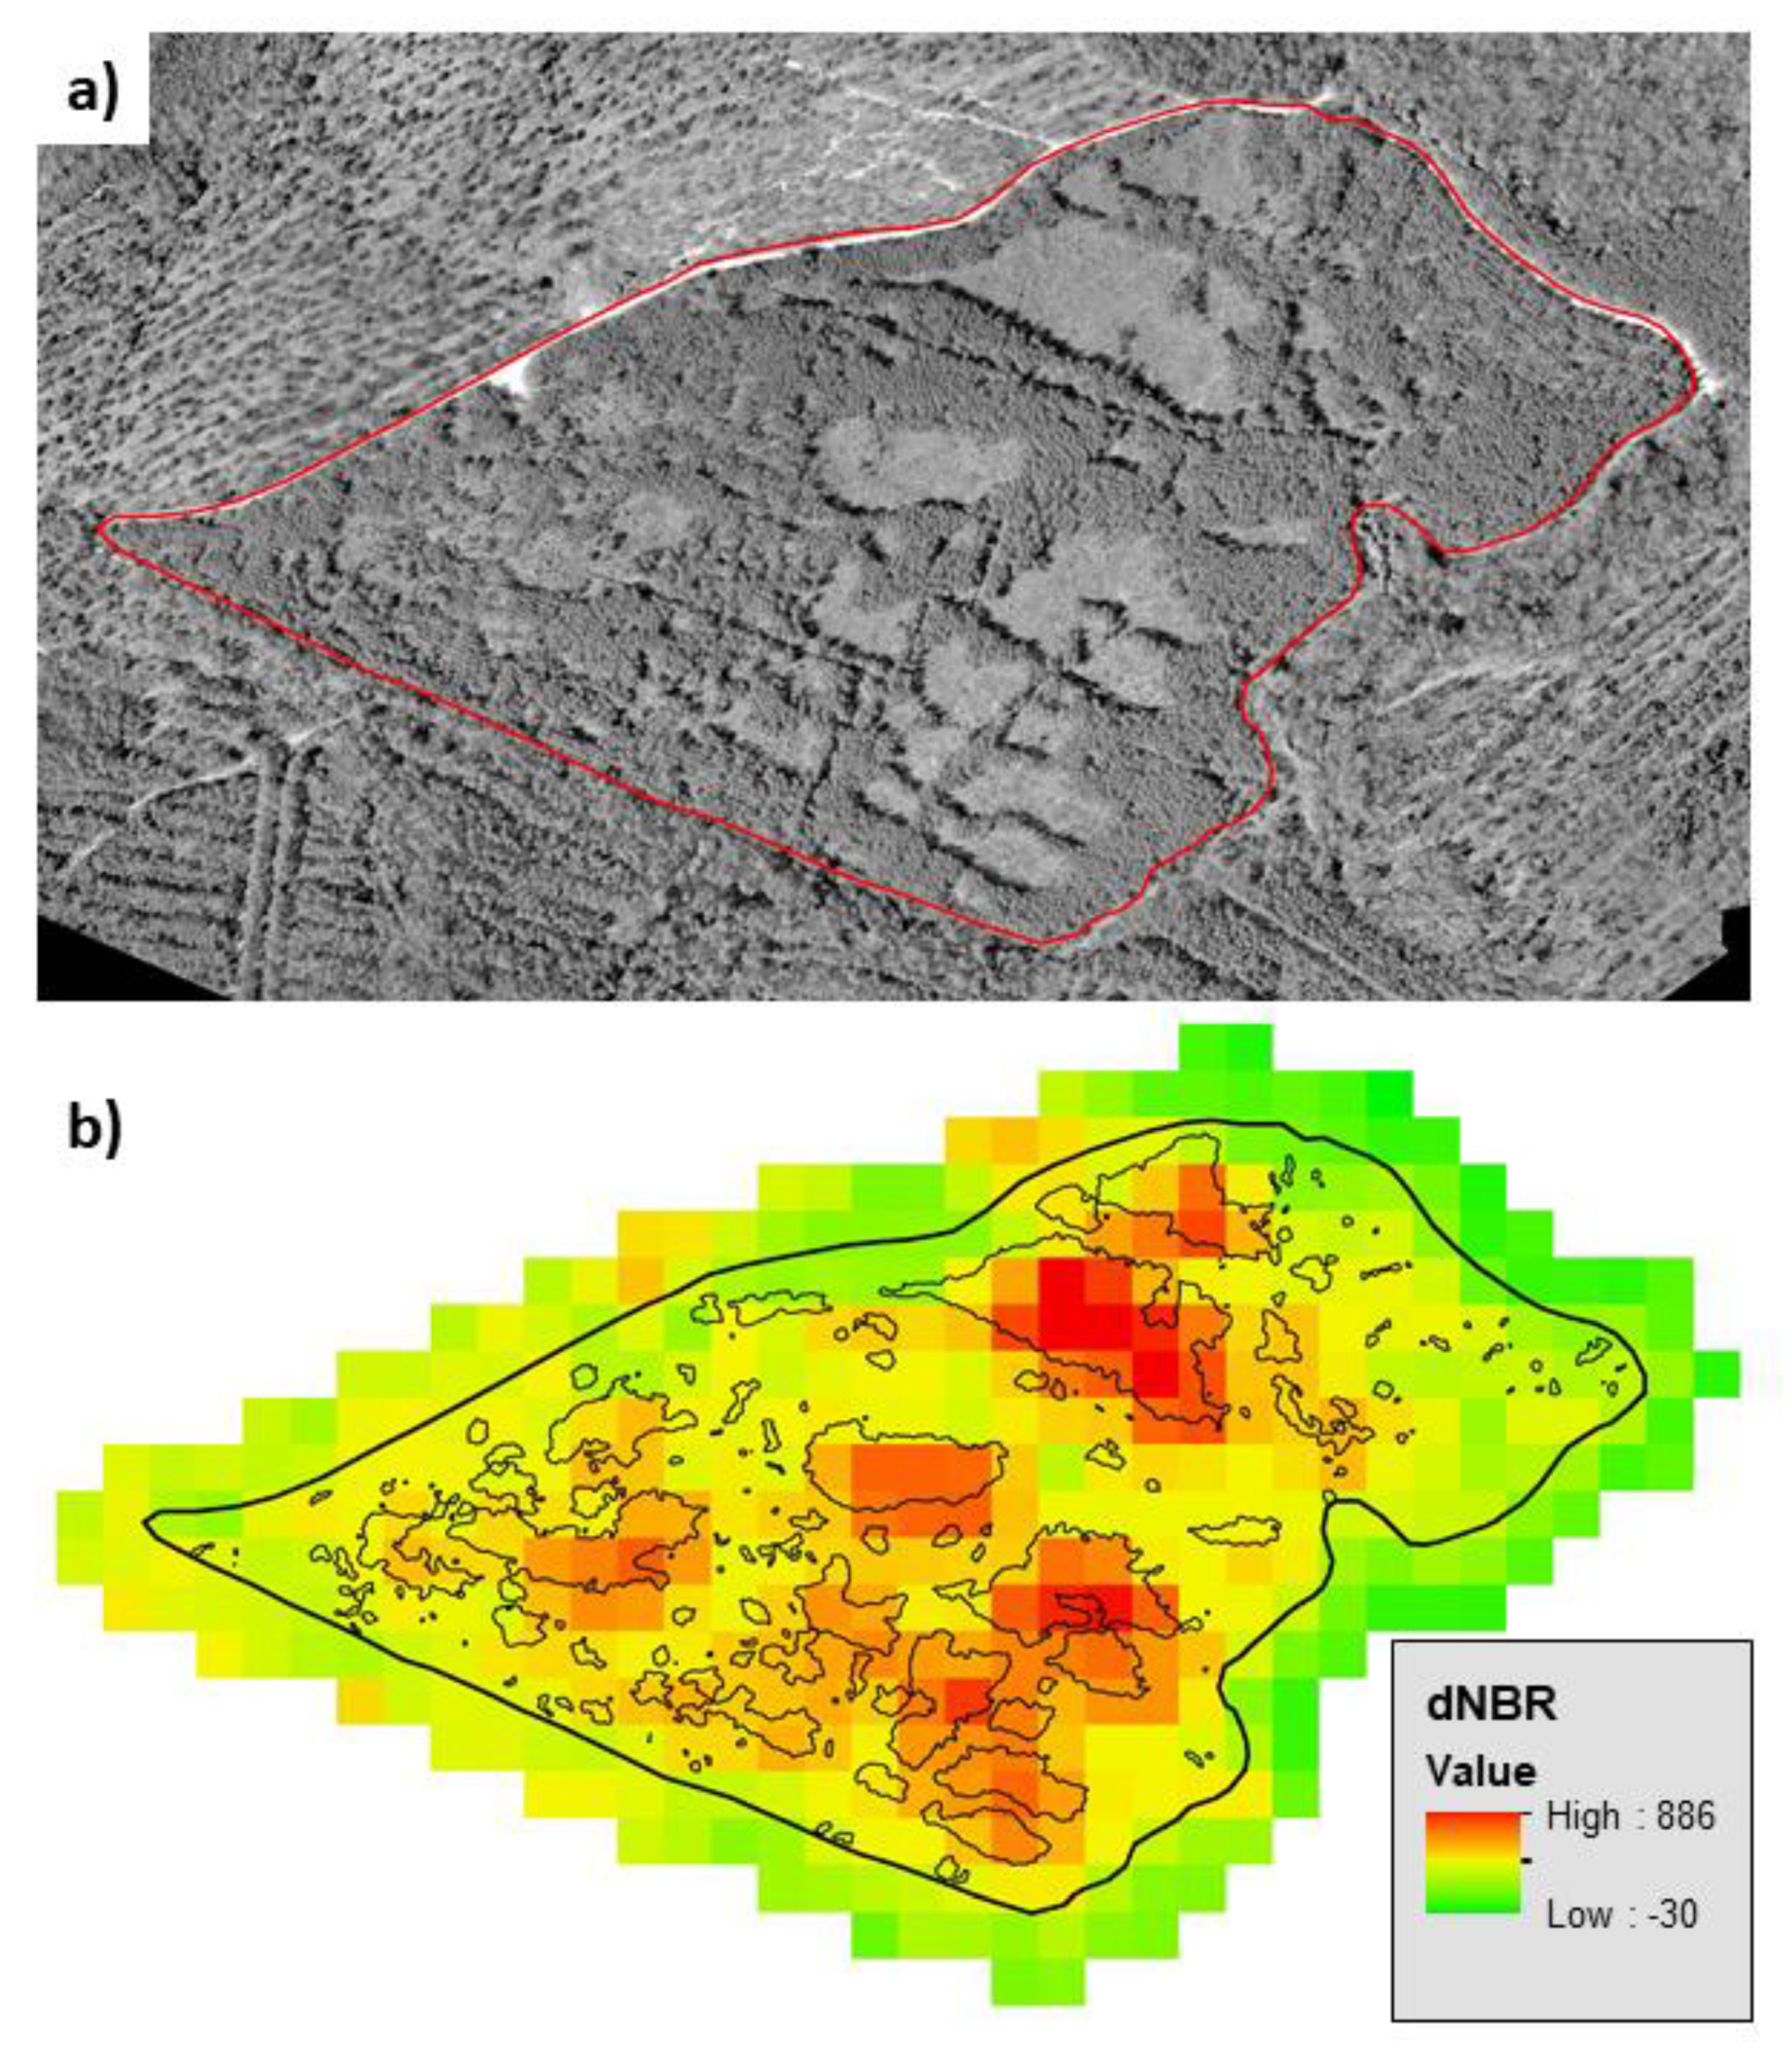
Canopy openings generated by the burn (n = 149) comprised 26% of the study area (6.4 ha) when mapped in 2016 (Figure 6a). The size distribution of these openings was strongly positively skewed, with a mean of 0.044 ha and median of 0.004 ha. The largest opening was 1.15 ha, and the 10 largest (7% of all mapped openings) accounted for ~70% of the total area of canopy openings. Additionally, we found good correspondence between the burn severity maps and the location of canopy openings of increasing size when the correlation analysis (r = 0.723, p = 0.005) was restricted to mapped openings at least as large as the area of a Landsat pixel (0.089 ha, n = 13; Figure 6b). We acknowledge that this approach does not account for areas outside the mapped openings where dNBR values were relatively high, yet canopy openings were not created.
4. Discussion
The structure of this young, rapidly developing loblolly pine forest was substantially altered by a mixed-severity prescribed burn conducted early in the growing season. Large canopy openings were generated across the area of premerchantable-sized trees, consistent with our management objectives and generally supporting the potential of this approach as a restoration tool. Mortality of relatively large overstory trees and development of canopy openings induced by mixed-severity wildfire gives rise to structurally diverse and ecologically important habitat conditions that are only beginning to be appreciated [10,11]. Statistical models were fit to the tree- and plot-level data which describe key aspects of the observed mortality response.
Absent direct measurement of fire behavior, we relied on relationships developed by other researchers (e.g., [41,42]), where knowledge of flame lengths informs estimation of fireline intensity. Working in similarly aged mixed loblolly and shortleaf pine plots, Cain [41] reported measured flame lengths as intermediate between bole and crown scorch heights recorded after the burn, and a larger difference between the two for head than backing fires. Waldrop and Van Lear [42] used bark char height as a proxy for flame length to calculate fire intensity, dividing it into three categories: corresponding upper limits of bole scorch height on pine trees of ~1 m for low, and 2 m separating medium from high intensity. We note that the primary reference for the fireline intensity calculation is Byram, cited in Brown and Davis [43], where they state that this relationship was derived in the context of low-intensity fires. With reference to our Figure 3, applying these criteria and assuming parity between bark scorch and flame length, 84% of all tree level observations suggest a high fireline intensity. Moreover, we recorded bole scorch heights up to 8.23 m, whereas those reported in the Waldrop and Van Lear [42] study topped out at 2.74 m. Similar to Cain [41], we found a clear separation between the heights of bole scorch and crown scorch on the permanent plots, and further, that average scorch heights followed a linear increasing trend with plot RD (Figure 4). Applying his observation that measured flame lengths are intermediate to the two scorch heights to our study has the effect of further increasing our retrospective estimate of fire intensity. Thus, available evidence supports the contention that this fire was of relatively high intensity.
The fate of individual loblolly pine trees was reliably predicted using crown damage variables in a logit model, consistent with findings from past works in other forest types [20,21,44]. Intuitively, we found that low-vigor trees, that is, those with relatively small crowns in intermediate and overtopped crown positions, were predisposed to mortality at lower levels of crown scorch than more vigorous dominants and codominants. Similar relationships were reported by Waldrop and Van Lear [42] and Lilieholm and Hu [22] working in slightly older/larger loblolly pine forests. In the context of our study looking at the effects of mixed-severity fire, however, this pattern of mortality concentrated within the smaller size classes was overlain by a tendency for trees of all sizes to be vulnerable to mortality when growing on densely stocked plots (i.e., RD > 0.6, Figure 2). Thus, while the overall trend was for smaller less competitive trees to be killed by the fire, crowded growing conditions contributed to nearly complete crown scorching and thus mortality even among upper-canopy trees.
The more densely stocked plots in this burn block had taller average heights to the base of the live crown, putting them father away from direct contact with the understory fire, though these plots were also associated with higher average bole and crown scorch heights (Figure 4). The possibility that dense tree canopies may act to trap or sufficiently slow the dissipation of heat associated with understory burning resulting in crown damage and tree mortality has been suggested (see [42] and references therein), while others [23] have expressed skepticism owing to an apparent abundance of openings in the canopy for heat to escape. In fully stocked even-aged stands, the development of canopy leaf area typically reaches a peak relatively early in stand development, at a time when branches of adjacent trees overlap prior to the onset of crown abrasion [45] or there is an opportunity to carry out commercial thinning, giving rise to openings in the canopy. Our observations from this young rapidly developing pine stand are consistent with the idea of crown damage resulting from heat trapping, noting also that surface wind speeds measured at the time of the burn were relatively low (3.2–8.0 km/h), potentially increasing the residence time of heated air below areas of dense canopy. Anecdotally, similar outcomes have been observed within larger stature pine forests on the same ownership, contrasting among blocks thinned to a range of residual densities when burned relatively intensely during the growing season (i.e., April to early June). Because we do not often observe crown torching fire behavior during these burns, nor find much evidence of charred crowns during postburn surveys, the question of mortality resulting from heat trapping by dense forest canopies may warrant further investigation.
The short-term implications of the observed tree mortality response were considerable in terms of live AGB, which declined by ~30% soon after the burn (Table 1). While this is proportionally similar to what would be removed in a commercial thinning at a later stage of stand development, the irregular spatial distribution of residual trees generated by the burn would not be expected to create optimal growing conditions sought by silvicultural thinnings. Additionally, the effects of crown scorch on the growth of surviving trees may contribute to a slower rate of recovery for AGB [23,46]. Despite the initial reduction in AGB, we found that accretion resulted in the return of AGB to approximately preburn levels within only four years, and that AGB averaged 23% above preburn values after seven years, when the study was concluded. The rapid rate of recovery for AGB may be explained by the early stage of forest development at the time of the burn, with surviving pines still capable of growing rapidly in both height and diameter. To provide a rough estimate of how AGB may have developed absent the burn, we used the Southeastern Variant of the Forest Growth Simulator (FVSsn, [47], methods and data not shown). According to model predictions, which fell within 10% of our calculated values (obs > pred) for AGB at plantation age 8 before the burn, the predicted AGB would have been approximately double what was measured at age 15 (pred = 143.8 t/ha vs. obs = 74.1 t/ha). Increased divergence in AGB over this timeframe (i.e., −30% to −50%) may be related to decreased growth among crown-damaged survivors. Given our primary objective of restoring open canopy woodland structure to these inland dune habitats, this outcome may be viewed as a desirable side-effect of the treatment. From this perspective, the model estimate provides a general sense of the potential “costs” of this type of treatment with possible relevance to alternative timber production or forest carbon management opportunities that could be undertaken in rapidly developing southern pine stands.
The high-resolution imagery enabled us to accurately map the locations and areal extent of the canopy openings generated by the burn (Figure 6a). Aggregated mortality gave rise to a network of variably sized openings distributed across the area in the years following the burn, and the location and extent of relatively large openings coincided with the dNBR fire severity reflectance metrics (Figure 6b). Lydersen et al. [30] reported good correspondence between burn severity maps and overstory mortality in a western mixed-conifer system, and that the incidence of burn-induced mortality was positively related to preburn stocking. One striking aspect of the larger openings was that almost no pine trees survived within those perimeters. Other researchers have reported difficulty or inconsistency in generating canopy openings with growing season burns in the Eastern United States ([9] and references therein). However, results of one recent landscape scale study suggest managers were able to create significant areas of open canopy and early successional habitat (11%–26% of the treatment area following one to three burns) in Central Appalachian mixed forest cover, where doing so was a stated objective of the prescribed burn program [32]. We speculate that our success in generating canopy openings is attributable to a combination of factors, including the relatively short stature of the overstory trees, generally high stocking (60% of plots had RD > 0.6), and the intentionally aggressive approach to burning.
5. Conclusions
The structure of this loblolly pine forest was dramatically altered by a mixed-severity prescribed burn carried out in the early growing season. Seven years of remeasurement data revealed that the mortality of canopy trees was evident within the first year, and while smaller stems were most severely impacted, larger trees accounting for substantial proportions of plot BA and AGB were also killed. Trees of all sizes were more vulnerable when growing on densely stocked plots, giving rise to aggregated mortality and relatively large and persistent canopy openings. Had this not been the case, our short-term objective of reducing canopy cover to benefit inland dune specialist species would not have been achieved. Recent studies looking at the use of prescribed fire as a restoration tool suggest that understory burning absent canopy density reduction is unlikely to be successful in re-establishing fire-adapted vegetation communities [7,48,49]. We acknowledge the limitations of this work, including the lack of replication at the treatment level, reliance on postburn reconstruction of preburn conditions, reliance on retrospective observations of fire behavior, and the need for longer-term monitoring to confirm the restoration of woodland habitat values. Nonetheless, our findings contribute a potentially useful data point on a type of fire management that is under-represented in the literature at the current time.
Author Contributions
The project was conceived by D.L. and D.G.R. Field methodology was developed and implemented by D.G.R. Statistical analysis was carried out by D.G.R. Writing—original draft preparation was undertaken by D.G.R. Writing—review and editing was led by D.L.
Funding
This research received no external funding.
Acknowledgments
We wish to extend our appreciation to the MD DNR Forest Service and USFWS whose expert assistance on the controlled burn made achieving our prescriptions possible. Bobby Clontz provided the inspiration and guidance on implementing the treatment. Thanks also to A. Sutton-Grier and G. Cahalan for comments, input, and guidance. Suggestions provided by anonymous reviewers on earlier versions of this manuscript helped improve the document.
Conflicts of Interest
The authors declare no conflict of interests.
References
- Hanberry, B.B.; Bragg, D.C.; Hutchinson, T.F. A reconceptualization of open oak and pine ecosystems of eastern North America using a forest structure spectrum. Ecosphere 2018, 9, 1–22. [Google Scholar] [CrossRef]
- Nowacki, G.J.; Abrams, M.D. The demise of fire and “mesophication” of forests in the Eastern United States. BioScience 2008, 58, 123–138. [Google Scholar] [CrossRef]
- Varner, J.M.; Gordon, D.R.; Putz, F.E.; Hiers, J.K. Restoring fire to long-unburned Pinus palustris ecosystems: novel fire effects and consequences for long-unburned ecosystems. Restor. Ecol. 2005, 13, 536–544. [Google Scholar] [CrossRef]
- Franklin, J.F.; Johnson, K.N.; Johnson, D.L. Ecological Forest Management; Waveland Press, Inc.: Long Grove, IL, USA, 2018; p. 646. [Google Scholar]
- Janowiak, M.K.; Swanston, C.W.; Nagel, L.M.; Brandt, L.A.; Butler, P.R.; Handler, S.D.; Shannon, P.D.; Iverson, L.R.; Matthews, S.N.; Prasad, A.; Peters, M.P. A practical approach for translating climate change adaptation principles into forest management actions. J. For. 2014, 112, 424–433. [Google Scholar] [CrossRef]
- Ryan, K.C.; Knapp, E.E.; Varner, J.M. Prescribed fire in North American forests and woodlands: history, current practice, and challenges. Front. Ecol. Environ. 2013, 11, e15–e24. [Google Scholar] [CrossRef]
- Livingston, A.C.; Varner, J.M.; Jules, E.S.; Kane, J.M.; Arguello, L.A. Prescribed fire and conifer removal promote positive understorey vegetation responses in oak woodlands. J. Appl. Ecol. 2016, 53, 1604–1612. [Google Scholar] [CrossRef]
- Van Lear, D.H. Recent advances in the silvicultural use of prescribed fire. In Fire and Forest Ecology: Innovative Silviculture & Vegetation Management; Moser, W.K., Moser, C.F., Eds.; Tall Timbers Research, Inc.: Tallahassee, FL, USA, 2002; pp. 183–189. [Google Scholar]
- Reilly, M.J.; Outcalt, K.; O’Brien, J.J.; Wade, D. Effects of repeated growing season prescribed fire on structure and composition of pine-hardwood forests in the Southeastern Piedmont, USA. Forests 2017, 8, 12. [Google Scholar] [CrossRef]
- Bond, M.L.; Siegel, R.B.; Hutto, R.L.; Saab, V.A.; Shunk, S.A. A new forest fire paradigm: The need for high-severity fires. Wildl. Prof. 2012, 46–49. [Google Scholar]
- DellaSala, D.A.; Hutto, R.L.; Hanson, C.T.; Bond, M.L. Accommodating mixed-severity fire to restore and maintain ecosystem integrity with a focus on the Sierra Nevada of California, USA. Fire Ecol. 2017, 13, 148–171. [Google Scholar] [CrossRef]
- Frost, C. Presettlement fire frequency regimes of the United States: a first approximation. In Fire in Ecosystem Management: Shifting the Paradigm from Suppression to Prescription; Pruden, T.L., Brennan, L.A., Eds.; Tall Timbers Fire Ecology Conference Proceedings. No. 20.; Tall Timbers Research Station: Tallahassee, FL, USA, 1998; pp. 70–81. [Google Scholar]
- Guyette, R.P.; Stambaugh, M.S.; Dey, D.C.; Muzika, R.M. Predicting fire frequency with chemistry and climate. Ecosystems 2012, 15, 322–335. [Google Scholar] [CrossRef]
- Landfire: Fire Regime Data Products (Percent of Mixed-Severity Fire). Available online: https://www.landfire.gov/pms.php (accessed on 7 May 2018).
- Stanturf, J.A.; Wade, D.D.; Waldrop, T.A.; Kennard, D.K.; Achtemeier, G.L. Fire in southern forest landscapes. In Southern Forest Resource Assessment; Wear, D.M., Greis, J., Eds.; USDA General Technical Report SRS-53; U.S. Dept. Ag, Forest Service, Southern Research Station: Asheville, NC, USA, 2002; pp. 607–630. [Google Scholar]
- Denny, C.S.; Owens, J.P. Sand dunes on the Central Delmarva Peninsula, Maryland and Delaware; Surface and shallow subsurface geologic studies in the emerged coastal plain of the Middle Atlantic States. Geological Survey professional paper 1067-C; U.S. Department of the Interior: Washington, DC, USA, 1979; p. 15.
- Newell, W.L.; Dejong, B.D. Cold-climate slope deposits and landscape modifications of the Mid-Atlantic Coastal Plain, Eastern USA. In Ice-Marginal and Periglacial Processes and Sediments; Martini, I.P., French, H.M., Alberti, A.P., Eds.; Special Publication 354; Geological Society: London, UK, 2011; pp. 259–276. [Google Scholar]
- Harrison, J.W. The Natural Communities of Maryland: 2016 Natural Community Classification Framework; Publication #03-662016-597; Maryland Department of Natural Resources, Wildlife and Heritage Service, Natural Heritage Program: Annapolis, MD, USA, 2016; pp. 1–35.
- NatureServe Explorer: An Online Encyclopedia of Life. Available online: http://www.natureserve.org/explorer (accessed on 15 July 2018).
- Grayson, L.M.; Progar, R.A.; Hood, S.M. Predicting post-fire tree mortality for 14 conifers in the Pacific Northwest, USA: model evaluation, development, and thresholds. For. Ecol. Manag. 2017, 399, 213–226. [Google Scholar] [CrossRef]
- Kobziar, L.; Moghaddas, J.; Stephens, S.L. Tree mortality patterns following prescribed fires in a mixed conifer forest. Can. J. For. Res. 2006, 36, 3222–3238. [Google Scholar] [CrossRef]
- Lilieholm, R.J.; Hu, S.C. Effect of crown scorch on mortality and diameter growth of 19-year-old loblolly pine. South. J. Appl. For. 1987, 11, 209–211. [Google Scholar]
- Wade, D.D.; Johansen, R.W. Effects of Fire on Southern Pine: Observations and Recommendations; USDA General Technical Report SE-41; USDA Forest Service Southeastern Forest Experiment Station: Ashville, NC, USA, 1986; p. 14.
- Varner, J.M.; Hiers, J.K.; Ottmar, R.D.; Gordon, D.R.; Putz, F.E.; Wade, D.D. Overstory tree mortality resulting from reintroducing fire to long-unburned longleaf pine forests: the importance of duff moisture. Can. J. For. Res. 2007, 37, 1349–1358. [Google Scholar] [CrossRef]
- Keyser, T.L.; McDaniel, V.L.; Klein, R.N.; Drees, D.G.; Burton, J.A.; Forder, M.M. Short-term stem mortality of 10 deciduous broadleaved species following prescribed burning in upland forests of the Southern US. Int. J. Wildland Fire 2017, 27, 42–51. [Google Scholar] [CrossRef]
- McNab, W.H. An overcrowded loblolly pine stand thinned with fire. South. J. Appl. For. 1977, 1, 24–26. [Google Scholar]
- Wade, D.D. Thinning young loblolly pine stands with fire. Int. J. Wildland Fire 1993, 3, 169–178. [Google Scholar] [CrossRef]
- Waldrop, T.A.; Lloyd, F.T. Precommercial thinning a sapling-sized loblolly pine stand with fire. South. J. Appl. For. 1988, 12, 203–207. [Google Scholar]
- Hoff, V.; Rowell, E.; Teske, C.; Queen, L.; Wallace, T. Assessing the relationship between forest structure and fire severity on the North Rim of the Grand Canyon. Fire 2019, 2, 10. [Google Scholar] [CrossRef]
- Lydersen, J.M.; Collins, B.M.; Miller, J.D.; Fry, D.L. Relating fire-caused change in forest structure to remotely sensed estimates of fire severity. Fire Ecol. 2016, 12, 99–116. [Google Scholar] [CrossRef]
- Picotte, J.J.; Robertson, K.M. Validation of remote sensing of burn severity in south-eastern US ecosystems. Int. J. Wildland Fire 2011, 20, 453–464. [Google Scholar] [CrossRef]
- Lorber, J.; Thomas-Van Gundy, M.; Croy, S. Characterizing Effects of Prescribed Fire on Forest Canopy Cover in the George Washington and Jefferson National Forests; Research paper NRS-31; Department of Agriculture, Forest Service, Northern Research Station: Newtown Square, PA, USA, 2018; p. 30.
- Butler-Leopold, P.; Iverson, L.; Thompson III, F.; Brandt, L.; Handler, S.; Janowiak, M.; Shannon, D.; Swanston, C.; et al. Mid-Atlantic Forest Ecosystem Vulnerability Assessment and Synthesis: A Report from the Mid-Atlantic Climate Change Response Framework Project; USDA General Technical Report NRS-181; U.S. Department of Agriculture, Forest Service, Northern Research Station: Newtown Square, PA, USA, 2018.
- Clark, K.L.; Skowronski, N.; Renninger, H. Climate change and fire management in the mid-Atlantic region. For. Ecol. Manag. 2014, 327, 306–315. [Google Scholar] [CrossRef]
- Mitchell, R.J.; Liu, Y.; O’Brien, J.J.; Elliott, K.J.; Starr, G. Future climate and fire interactions in the southeastern region of the United States. For. Ecol. Manag. 2014, 327, 316–326. [Google Scholar] [CrossRef]
- Walton, L.; (Vision Forestry, Salisbury, MD, USA). Personal communication, 2011.
- Scott, J.H.; Burgan, R.E. Standard Fire Behavior Fuel Models: A Comprehensive Set for Use with Rothermel’s Surface Fire Spread Model; USDA General Technical Report RMRS-GTR-153; U.S. Department of Agriculture, Forest Service, Rocky Mountain Research Station: Fort Collins, CO, USA, 2005; p. 72.
- McElligott, K.M.; Bragg, D.C. Deriving biomass models for small-diameter loblolly pine on the Crossett Experimental Forest. J. Ark. Acad. Sci. 2013, 67, 94–102. [Google Scholar]
- Robertson, K.M.; Ostertag, T.E. Biomass equations for hardwood resprouts in fire-maintained pinelands in the Southeastern United States. South. J. Appl. For. 2009, 33, 121–128. [Google Scholar]
- Reineke, L.H. Perfecting a stand-density index for even-aged forests. J. Agric. Res. 1933, 46, 627–638. [Google Scholar]
- Cain, M.D. Height of stem-bark char underestimates flame length in prescribed burns. USDA For. Serv. Fire Manag. Notes 1984, 45, 17–21. [Google Scholar]
- Waldrop, T.A.; Van Lear, D.H. Effects of crown scorch on survival and growth of young loblolly pine. South. J. Appl. For. 1984, 8, 35–40. [Google Scholar]
- Brown, A.A.; Davis, K.P. Forest Fire Control and Use, 2nd ed.; McGraw-Hill Book Co.: New York, NY, USA, 1973; p. 686. [Google Scholar]
- Garcia-Gonzalo, J.; Marques, S.; Borges, J.G.; Botequim, B.; Oliveria, M.M.; Tomé, J.; Tomé, M. A three-step approach to post-fire mortality modelling in maritime pine (Pinus pinaster Ait) stands for enhanced forest planning in Portugal. Forestry 2011, 84, 197–206. [Google Scholar] [CrossRef] [Green Version]
- Oliver, C.D.; Larson, B.C. Forest Stand Dynamics; Wiley: Hoboken, NJ, USA, 1996; p. 544. [Google Scholar]
- Weise, D.R.; Wade, D.D.; Johansen, R.W. Survival and growth of young southern pine after simulated crown scorch. In Proceedings of the 10th Fire and Forest Meteorology Conference, Ottawa, ON, Canada, 17 April 1989; MacIver, D.C., Auld, H., Whitewood, R., Eds.; pp. 161–168. [Google Scholar]
- Keyser, C.E. Southern (SN) Variant Overview – Forest Vegetation Simulator; Internal Report; U.S. Department of Agriculture, Forest Service, Forest Management Service Center: Fort Collins, CO, USA, 2018; p. 80.
- Brewer, J.S. Natural canopy damage and the ecological restoration of fire-indicative groundcover vegetation in an oak-pine forest. Fire Ecol. 2016, 12, 105–126. [Google Scholar] [CrossRef]
- Wilson, K.G.; Barefoot, C.R.; Hart, J.L.; Schweitzer, C.J.; Dey, D.C. Temporal patterns of ground flora response to fire in thinned Pinus-Quercus stands. Can. J. For. Res. 2018, 48, 1–13. [Google Scholar] [CrossRef]
Figure 1.
Diameter (a) and height (b) distributions of pine trees at the time of the burn, where stacked bars distinguish surviving stems from those that were killed by the fire, assessed in September 2011.
Figure 1.
Diameter (a) and height (b) distributions of pine trees at the time of the burn, where stacked bars distinguish surviving stems from those that were killed by the fire, assessed in September 2011.

Figure 2.
The relationship between preburn loblolly pine relative density (SDI/SDIMAX) and reductions in basal area (BA) due to fire-induced mortality (assessed in September 2011). A two-parameter power function was used to model these data, inset.
Figure 2.
The relationship between preburn loblolly pine relative density (SDI/SDIMAX) and reductions in basal area (BA) due to fire-induced mortality (assessed in September 2011). A two-parameter power function was used to model these data, inset.

Figure 3.
Frequency distribution of bole scorch height measured on individual loblolly pine trees following the burn. Stacked bars distinguish surviving stems from those that were killed by the fire (assessed in September 2011).
Figure 3.
Frequency distribution of bole scorch height measured on individual loblolly pine trees following the burn. Stacked bars distinguish surviving stems from those that were killed by the fire (assessed in September 2011).

Figure 4.
Relationship between plot-level relative density and average bole and crown scorch height (mean ± SD) in May 2011. Fit statistics for the linear regression models are presented in the legend.
Figure 4.
Relationship between plot-level relative density and average bole and crown scorch height (mean ± SD) in May 2011. Fit statistics for the linear regression models are presented in the legend.

Figure 5.
Predicted survival for loblolly pine trees one growing season after the burn, obtained from logistic regression model 8 (Table 2). Curves present differences among trees with different initial live crown ratios across a range of postburn crown scorch.
Figure 5.
Predicted survival for loblolly pine trees one growing season after the burn, obtained from logistic regression model 8 (Table 2). Curves present differences among trees with different initial live crown ratios across a range of postburn crown scorch.

Figure 6.
Overview of canopy openings created by the mixed-severity burn. The top panel (a) is high-resolution imagery of the treatment area acquired in mid-April 2016, five years after the burn, and the bottom panel (b) shows the distribution of canopy openings in relation to a fire severity index (dNBR) derived from pre- and postburn Landsat imagery.

Table 1.
Characteristics of permanent plots (n = 20) over time; values are means ± 95% confidence intervals (1.96*s.e.). The initial sample (date of the prescribed burn was 11 May 2011) consisted of 545 pine and 39 hardwood trees ≥ 2.54-cm diameter at breast height (DBH), whereas at the final tally (Feb 2018), there were 170 surviving pines, and 2 surviving and 60 ingrowth hardwoods. Dq is quadratic mean diameter and RD is relative density.
| Stem Density (trees/ha) | Basal Area (m2/ha) | Aboveground Biomass (t/ha) | Pine Stocking | |||||
|---|---|---|---|---|---|---|---|---|
| Date | Pines | Total | Pines | Total | Pines | Total | Dq (cm) | RD |
| May 2011 | 3366 ± 1369 | 3607 ± 1341 | 23.6 ± 3.6 | 23.9 ± 3.5 | 60.4 ± 10.0 | 61.0 ± 9.8 | 10.1 ± 1.2 | 0.60 ± 0.10 |
| Aug 2011 | 1445 ± 363 | 1457 ± 365 | 17.3 ± 4.5 | 17.3 ± 4.4 | 45.1 ± 12.0 | 45.2 ± 12.0 | 11.8 ± 1.6 | 0.43 ± 0.10 |
| Sept 2011 | 1346 ± 369 | 1359 ± 371 | 16.4 ± 4.4 | 16.4 ± 4.4 | 42.9 ± 11.8 | 42.9 ± 11.8 | 12.0 ± 1.6 | 0.40 ± 0.10 |
| July 2012 | 1204 ± 350 | 1204 ± 350 | 16.8 ± 4.9 | 16.8 ± 4.9 | 47.8 ± 14.2 | 47.8 ± 14.2 | 12.9 ± 1.8 | 0.40 ± 0.11 |
| Feb 2014 | 1161 ± 342 | 1161 ± 342 | 17.9 ± 5.5 | 17.9 ± 5.5 | 51.6 ± 15.9 | 51.6 ± 15.9 | 13.5 ± 1.9 | 0.42 ± 0.12 |
| Feb 2015 | 1149 ± 337 | 1297 ± 318 | 19.3 ± 5.9 | 19.5 ± 5.8 | 57.7 ± 18.4 | 58 ± 18.3 | 13.0 ± 1.6 | 0.45 ± 0.12 |
| Feb 2018 | 1040 ± 315 | 1437 ± 204 | 23.3 ± 7.3 | 23.8 ± 7.1 | 74.1 ± 23.7 | 75.1 ± 23.2 | 13.5 ± 2.1 | 0.51 ± 0.14 |
Table 2.
Model parameters for the eight best performing logistic regression models used to forecast the probability of individual pine tree survival after one growing season, based on selected plot and tree attributes. Reported fit statistics include: significance level of parameter estimate (0.05 *, 0.01 **, 0.001 ***), Akaike information criterion (AIC), Bayesian information criterion (BIC), McFadden’s pseudo R2 (Rho2), model prediction success rate (Predict), and the receiver operating characteristic curve value (ROC).
| Model | Equation | β0 | β1 | β2 | β3 | AIC | BIC | Rho2 | Predict | ROC |
|---|---|---|---|---|---|---|---|---|---|---|
| 1 | β0 + β1(RSP) + β2(LCRPRE) + β3(pCS) | 4.916 | −0.014 | 9.608 * | −14.902 *** | 152.8 | 169.4 | 0.779 | 0.920 | 0.981 |
| 2 | β0 + β1(RSP) + β2(LCRPRE) + β3(LCRPOST) | −7.512 ** | −0.317 | 6.318 * | 21.225 *** | 149.8 | 166.5 | 0.784 | 0.922 | 0.980 |
| 3 | β0 + β1(RSP) + β2(LCRPOST) | −3.95 *** | 0.942 | 22.445 *** | na | 153.3 | 165.8 | 0.776 | 0.919 | 0.978 |
| 4 | β0 + β1(RSP) + β2(pBS) | 1.578 * | 7.718 *** | −16.329 *** | na | 260.3 | 272.7 | 0.613 | 0.838 | 0.956 |
| 5 | β0 + β1(LCRPOST) | −3.423 *** | 23.246 *** | na | na | 151.8 | 160.1 | 0.775 | 0.919 | 0.980 |
| 6 | β0 + LCRPRE + LCRPOST | −7.505 ** | 6.050 * | 21.052 *** | na | 147.9 | 160.4 | 0.784 | 0.922 | 0.980 |
| 7 | β0 + β1(BLCPRE) + β2(LCRPOST) | −1.481 * | −0.307 ** | 23.135 *** | na | 147.5 | 160.0 | 0.785 | 0.922 | 0.982 |
| 8 | β0 + β1(LCRPRE) + β2(pCS) | 4.912 | 9.595 * | −14.896 *** | na | 150.8 | 163.3 | 0.779 | 0.920 | 0.981 |
Independent variables are coded as: tree relative size on plot (RSP), live crown ratio before (LCRPRE) and after the burn (LCRPOST), proportion of the live crown scorched (pCS), proportion of bole scorched (pBS), and height to the base of the live crown before the burn (BLCPR). Parameter estimates for the intercept (β0) and coefficient (β1- β3) terms are provided for each model.
© 2019 by the authors. Licensee MDPI, Basel, Switzerland. This article is an open access article distributed under the terms and conditions of the Creative Commons Attribution (CC BY) license (http://creativecommons.org/licenses/by/4.0/).
Share and Cite
MDPI and ACS Style
Ray, D.G.; Landau, D. Tree Mortality Following Mixed-Severity Prescribed Fire Dramatically Alters the Structure of a Developing Pinus taeda Forest on the Mid-Atlantic Coastal Plain. Fire 2019, 2, 25. https://doi.org/10.3390/fire2020025
AMA Style
Ray DG, Landau D. Tree Mortality Following Mixed-Severity Prescribed Fire Dramatically Alters the Structure of a Developing Pinus taeda Forest on the Mid-Atlantic Coastal Plain. Fire. 2019; 2(2):25. https://doi.org/10.3390/fire2020025
Chicago/Turabian StyleRay, David G., and Deborah Landau. 2019. "Tree Mortality Following Mixed-Severity Prescribed Fire Dramatically Alters the Structure of a Developing Pinus taeda Forest on the Mid-Atlantic Coastal Plain" Fire 2, no. 2: 25. https://doi.org/10.3390/fire2020025