Effect of Freeze-Thaw on the Stability of a Cutting Slope in a High-Latitude and Low-Altitude Permafrost Region


1
School of Engineering and Technology, China University of Geosciences (Beijing), Beijing 100083, China
2
Beijing Municipal Road & Bridge (Group) Co., Ltd., Beijing 100009, China
3
School of Civil Engineering, Zhoukou Vocational and Technical College, Zhoukou 466000, China
*
Author to whom correspondence should be addressed.
Appl. Syst. Innov. 2020, 3(3), 36; https://doi.org/10.3390/asi3030036
Submission received: 1 August 2020
/
Revised: 29 August 2020
/
Accepted: 31 August 2020
/
Published: 4 September 2020
Abstract
:In order to study the influence of freeze-thaw cycles on the stability of cutting slopes in high-latitude and low-altitude permafrost regions, we selected a cutting slope (the K105+700–800 section of National Highway 332) in the Elunchun Autonomous Banner in Inner Mongolia as the research object. Located in the Greater Xing’an Mountains, the permafrost in the Elunchun Autonomous Banner is a high-latitude and low-altitude permafrost. The area is also dominated by island-shaped permafrost, which increases the difficulty of dealing with cutting slopes, due to its morphological complexity. Surface collapse, caused by freeze-thaw erosion in this area, is the main reason for the instability of the cutting slope. Indoor freeze-thaw tests, field monitoring, and an ABAQUS numerical simulation model were conducted so as to quantify the decrease in rock strength and slope stability under freeze-thaw conditions. The following conclusions were drawn. (1) As the number of freeze-thaw cycles increased, the compressive strength of the rock specimens obtained from this slope gradually decreased. After 50 freeze-thaw cycles, the uniaxial compressive strength measured by the test decreased from 40 MPa to 12 MPa, a decrease of 37%. The elastic modulus value was reduced by 47%. (2) The safety factor of the slope—calculated by the strength reduction method under the dynamic analysis of coupled heat, moisture, and stress—gradually decreased. After 50 freeze-thaw cycles, the safety factor of the slope was only 0.74. (3) Reasonably reducing the number of freeze-thaw cycles, reducing the water content of the slope, slowing down the slope, and increasing the number of grading steps can effectively improve the stability of the slope. The results of this study can provide a reference for the design and stability analysis of slopes in permafrost regions of the Greater Xing’an Mountains.
1. Introduction
Permafrost refers to various rocks and soils containing ice below 0 °C [1]. Frozen soil is very sensitive to temperature. Due to the rich underground ice, frozen soil is rheological, and its long-term strength is much lower than its instantaneous strength [2]. Because of these characteristics, there are two major dangers when constructing slopes in permafrost regions, namely frost heave and thawing [3]. Slope instability in permafrost regions is closely related to the freeze-thaw cycle. The decrease in the shear strength of the slope after freezing and thawing is the main reason for the failure of the slope [4,5]. The effect of freezing water retention can reduce the stability of loess slopes in seasonal frozen soil areas by about 25% [6]. Li et al. [7] found that after freeze-thaw and dry–wet cycles, the safety of the slope decreased, especially in the early stage. The safety factor shows a negative correlation with the slope angle [8]. Through experiments, Zhang Yunlong et al. [9] observed that the safety factor of silty soil embankment slopes under freeze-thaw conditions was greatly reduced, with a maximum decrease of about 49%. Xu Jian et al. [10] found that as the number of freeze-thaw cycles increased, the safety factor of loess slopes showed an exponential decay trend. After studying the silty clay cutting slope of the Tongsan Expressway, Guo and Liu et al. [11,12] found that the cohesion in the slope decreased with the freeze-thaw cycles, and the cracks caused by cold shrinkage caused the water content of the shallow slope to be too high after the accumulation of water in the spring melting period, destroying the overall strength of the slope and causing landslides. Similarly, the K177+550 section of the Bei’an-Heihe Expressway also experienced landslides [13]. Matsuoka et al. [14] conducted seven years of monitoring near the lower limit of the permafrost regions in the Swiss Alps, finding that pebbles or smaller fragments were generated within the rock after the day–night freeze-thaw process, and shallow thawing creep (<10 cm) appeared on the debris slope. Moreover, after seasonal freezing and thawing, more debris, deeper freezing creep (<50 cm), thawing mud flow, and rock joints were produced. In addition, the long-melting snow water also accelerated the creep of the slope, thereby reducing the stability of the slope. Therefore, in reducing the stability of slopes in cold regions, the role of freezing and thawing cannot be underestimated.
However, the stability analysis of the slopes in the high-latitude and low-altitude permafrost areas of the Greater Xing’an Mountains under freeze-thaw conditions has not been reported. In this paper, we selected a cutting slope of the K105+700–800 section of National Highway 332 as our research object and conducted indoor freeze-thaw tests and an ABAQUS numerical simulation, concluding that the compressive strength of the slope specimens gradually became lower due to the increase in the number of freeze-thaw cycles, and the slope safety gradually decreased under the influence of coupled heat, moisture, and stress. The results of this study can provide a reference for the stability analysis of slopes in permafrost regions at high latitudes and low altitudes.
2. Project Overview
In order to study the stability of the slope under freeze-thaw conditions, a slope was selected as our research object. The proposed cutting slope is located at the K105+700–800 section of the National Highway 332 line of the Elunchun Autonomous Banner, lying at the east foot of the middle section of the Greater Xing’an Mountains, belonging to a high-latitude and low-altitude permafrost area. The area has large daily and annual temperature differences, the amount of sunshine is 2500~3100 h/year, and the sunshine rate is 65–71%. The annual average temperature is −2.7 °C to −1 °C, the annual average rainfall is 450–500 mm, and the freezing period is from October to May of the following year. The maximum frozen soil depth is 3.5 m. The slope is 10 m high and the slope angle is 45°. The surface layer of the slope is filled with gravel and fine-grained soil, and the lower layer is fully weathered volcanic breccia. In addition, the bedrock fissure ice and interlayer ice are extremely developed in the slope, and soil-bearing ice layers and pure ice layers are developed five meters below the excavation surface. Moreover, the skeleton of the rock mass is broken, the rock mass is low in hardness, and the remaining solid particulate matter after melting is less than 20%. After thawing, there are many collapsed veins on the slope surface. When the surface layer is disturbed, obvious traces of ice veins can be seen, and the frozen soil in this location has strong thawing or sinking properties. The stability of the slope in this location will inevitably decrease due to the above characteristics. In order to quantify the reduction in slope stability, on-site core sampling and indoor freeze-thaw tests were conducted. Furthermore, the compressive strength and elastic modulus of specimens after different freeze-thaw cycles were measured. Then, using experimental data and a numerical simulation model, the stability of the slope under various design conditions was analyzed.
3. Changes in Compressive Strength of Specimens before and after Freeze-Thaw
After on-site drilling and sampling, the specimens were transported back to the laboratory for cutting and grinding. The size of the specimens finally obtained was φ 50 mm × 100 mm. The specimens met the relevant requirements in the Engineering Rock Mass Test Method Standard [15] in terms of size and accuracy. In the freeze-thaw test, a state of being saturated with water after vacuuming was used. One freeze-thaw cycle lasted 12 h, including 6 h low-temperature freezing and 6 h thawing. All samples underwent 50 freeze-thaw cycles. In this paper, the specimens that underwent 0, 10, and 50 freeze-thaw cycles and the corresponding uniaxial compressive strength values were selected and compared, as shown in Figure 1 and Figure 2 below.
The uniaxial compression tests were conducted on the specimens under different freeze-thaw conditions. The test results are shown in Table 1 below.
After 50 freeze-thaw cycles, the specimens became fragmented and the strength decreased by a relatively large amount, for the following reasons: (1) when the temperature is below 0 °C, the water freezes, the volume increases by about 9%, the cracks extend and deepen, then the specimens are broken after multiple freeze-thaw cycles; (2) the expansion coefficients of various minerals in the specimens are different, then the uneven expansion and contraction due to the temperature change cause the specimens to rupture.
When the freeze-thaw test was completed, the measured uniaxial compressive strength value decreased from the initial 38.92 GPa (N = 0) to 0.73 GPa (N = 50), a decrease of 97%. At the same time, the value of the elastic modulus was also reduced by 98%. Therefore, the overall bearing capacity and the safety factor of the slope were reduced, then the risk of shallow collapse was increased, which was consistent with the conclusions of the safety factor shown in Figure 3, Figure 4, Figure 5 and Figure 6.
4. Calculation Example of Slope Stability under Freeze-Thaw Conditions
4.1. Slope Stability Method under Freeze-Thaw
In the analysis of slope stability under freeze-thaw, the strength reduction method is used [16]. While keeping the external load constant, the ratio of the maximum shear strength exerted by the slope to the actual shear stress generated by the external load inside the slope is the strength reduction factor [17].
In the calculation, the shear strength parameters C (cohesive force) and φ (internal friction angle) of the slope are first reduced by a certain coefficient Fr, which is recorded as Cm and φm, and then Cm and φm are substituted into the ABAQUS slope model for calculation under the condition that the external load remains unchanged. We then continuously increase Fr until the slope is unstable under a certain reduction factor. The value of the reduction factor before the overall failure of the slope is recorded as the slope safety factor Fr. The calculation equations of parameters Cm and φm are as follows:
Cm = C/Fr
φm = arctan(tanφ/Fr)
In the freeze-thaw environment, when the stability analysis of the slope is carried out using the strength reduction method, the standard of slope instability is generally as follows: (1) trend of displacement at the shoulder of the slope; (2) penetration of the equivalent plastic zone of the slope; and (3) failure to converge within the specified number of iterations. In the calculation of ABAQUS, it is more practical to use the convergence as the slope instability criterion. Therefore, in this paper, the slope safety factor Fr we studied was calculated based on the third criterion.
4.2. Numerical Calculation Model
The numerical calculation model of the cutting slope to be analyzed is shown in Figure 2. The finite element model was established according to the principle of plane strain. A total of 50 freeze-thaw cycles were performed, each lasting for 12 h, with a temperature range 22 °C to −20 °C. The specified constraints were as follows: the left and right sides of the slope constrained the horizontal displacement, the bottom of the slope was hinged, and the rest of the slope consisted of free boundaries. The film coefficient in this model was chosen as 25 W/m2 × °C. This paper mainly studied the effects of freeze-thaw cycles, initial water content, slope coefficient, and grading progression on slope stability. The influencing factors are shown in Table 2.
4.3. Mechanical Parameters Required for Numerical Simulation
The physical and mechanical parameters of the specimens in the simulated slope were obtained through experiments, as shown in Table 3. In the thermal parameter tests, the specimens were in powder form when the thermal conductivity was measured. The sample size was φ 30 mm × 80 mm when the specific heat capacity was measured, and the sample size was 10 mm × 10 mm × 50 mm when the thermal expansion coefficient was measured.
4.4. Analysis of Calculation Results
4.4.1. Influence of Freeze-Thaw Cycles on Slope Stability
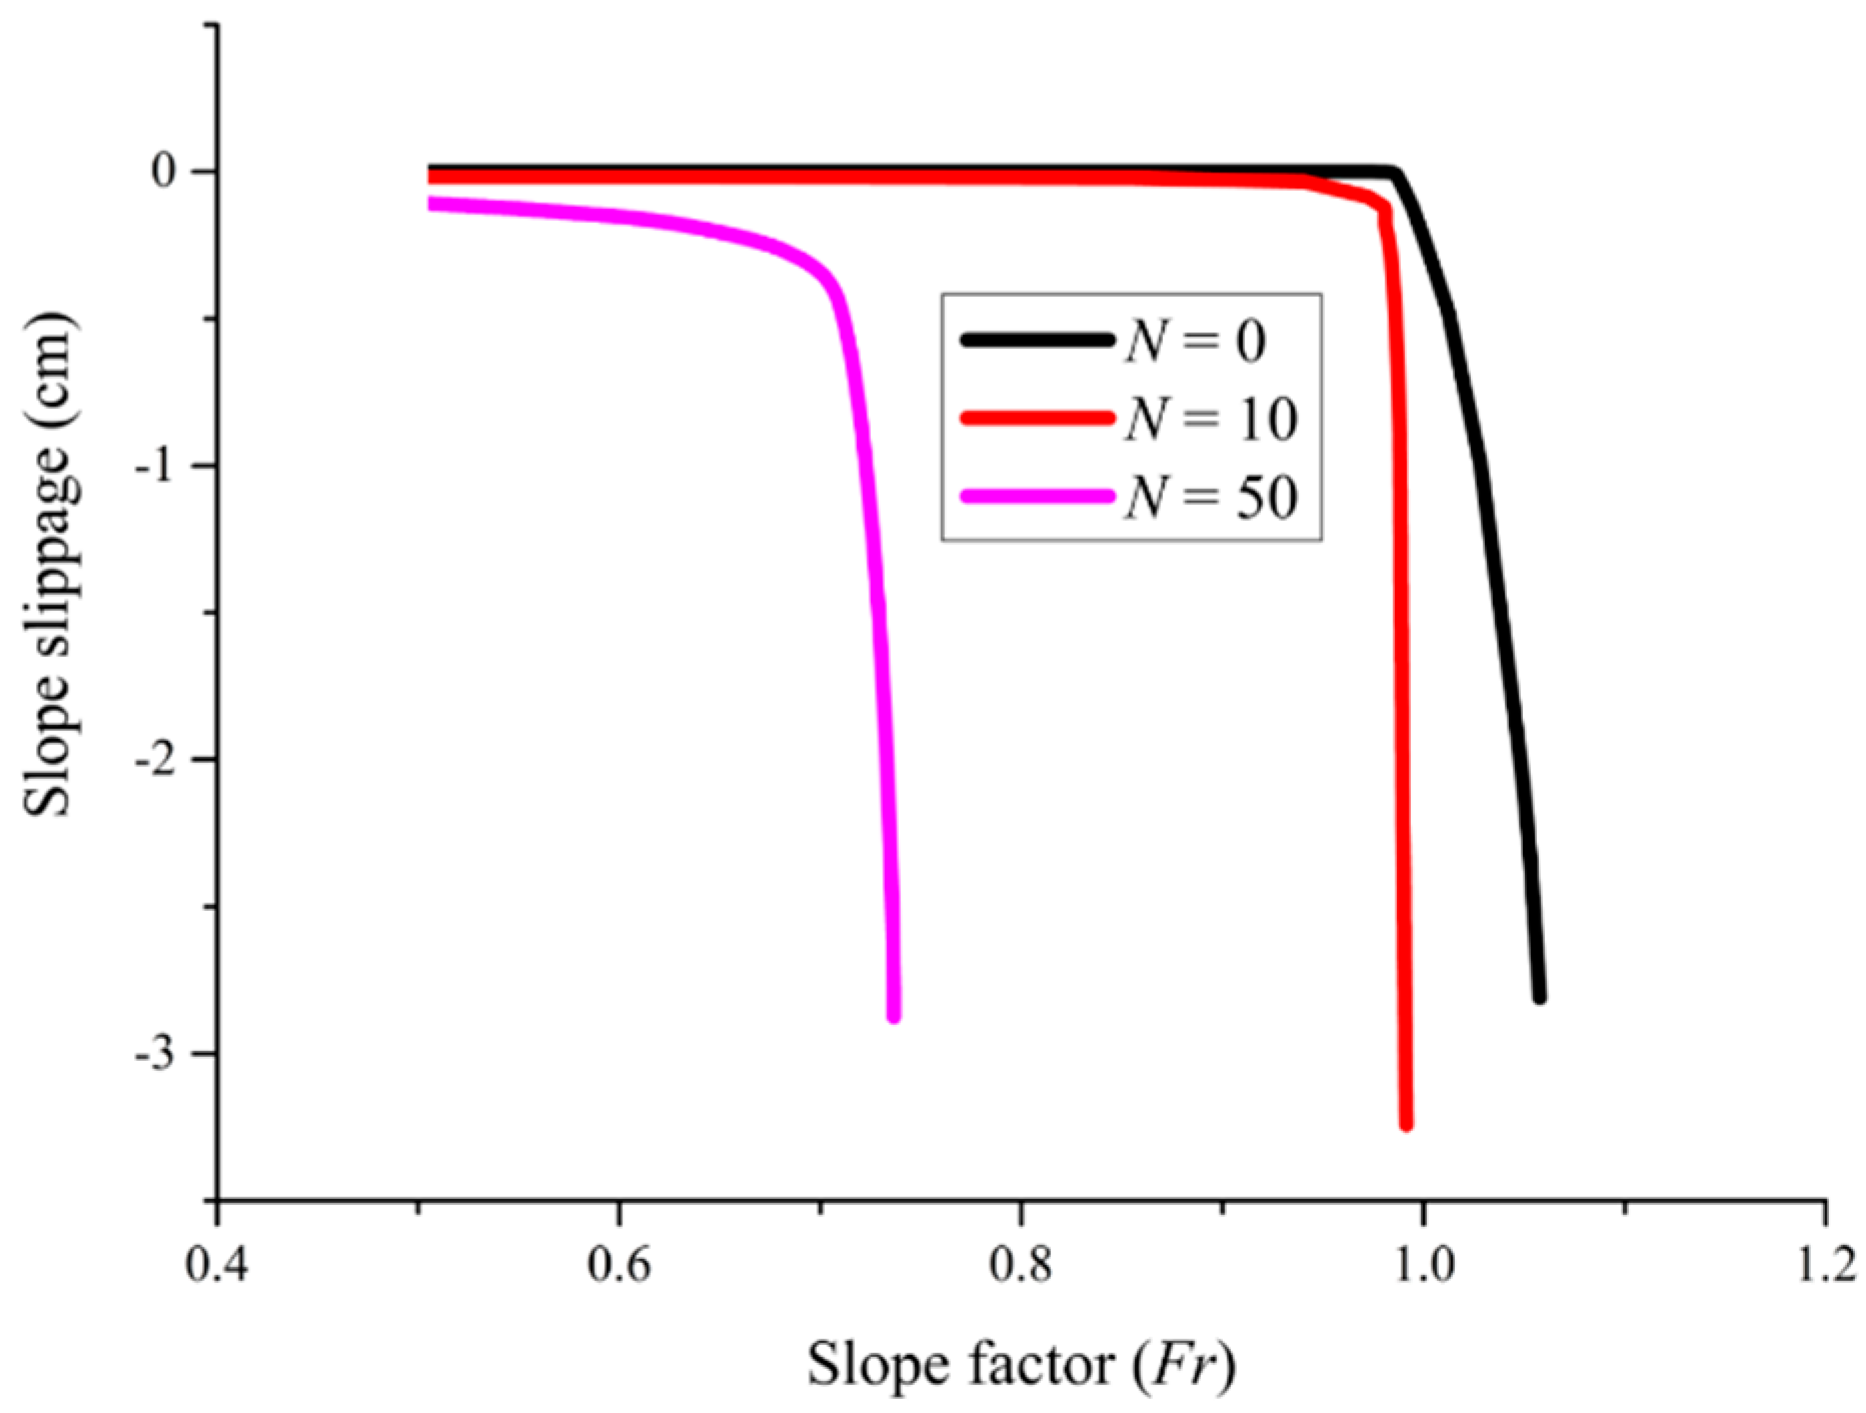
Figure 3 shows the effect of freeze-thaw cycles on slope stability. It can be seen that the safety factor of the cutting slope gradually decreases as the number of freeze-thaw cycles increases, then the reduction amplitude decreases gradually and finally remains at a stable value. After 50 freeze-thaw cycles, the safety factor of the slope is 0.74. When the slope has not undergone a freeze-thaw cycle, the slippage of the slope UN=0 is zero before the slope reaches the limit equilibrium state; and when the slope reaches the limit equilibrium state, the slope begins to slip. As time goes on, the amount of slippage UN=0 gradually increases and eventually stabilizes. Before and after the freeze-thaw cycle, the change of slope slip is obviously different. As can be seen in Figure 3, when the slope does not reach the limit equilibrium state, both UN=10 and UN=50 are greater than zero, indicating that slippage has begun before the slope reaches the limit equilibrium state, and the greater the number of freeze-thaw cycles, the greater the slippage and its rate. Therefore, the freeze-thaw cycle plays a role in accelerating the slope slippage, and the influence of the freeze-thaw cycle on the slope cannot be ignored.
4.4.2. Effect of Initial Moisture Content on Slope Stability under Freeze-Thaw
Figure 4 shows the law of the influence of initial moisture content on the safety factor of the cutting slope under freeze-thaw. It can be seen that as the initial moisture content of the soil increases, the safety factor decreases in sequence and the decreasing amplitude increases gradually. The reason for this is that the porosity and water content of the slope increases after freezing and thawing, and the cohesive force decreases with the increase in the water content, resulting in a decrease in the shear strength of the slope, which gradually reduces the slope safety factor.
4.4.3. Effect of Slope Coefficient on Slope Stability under Freeze-Thaw Conditions
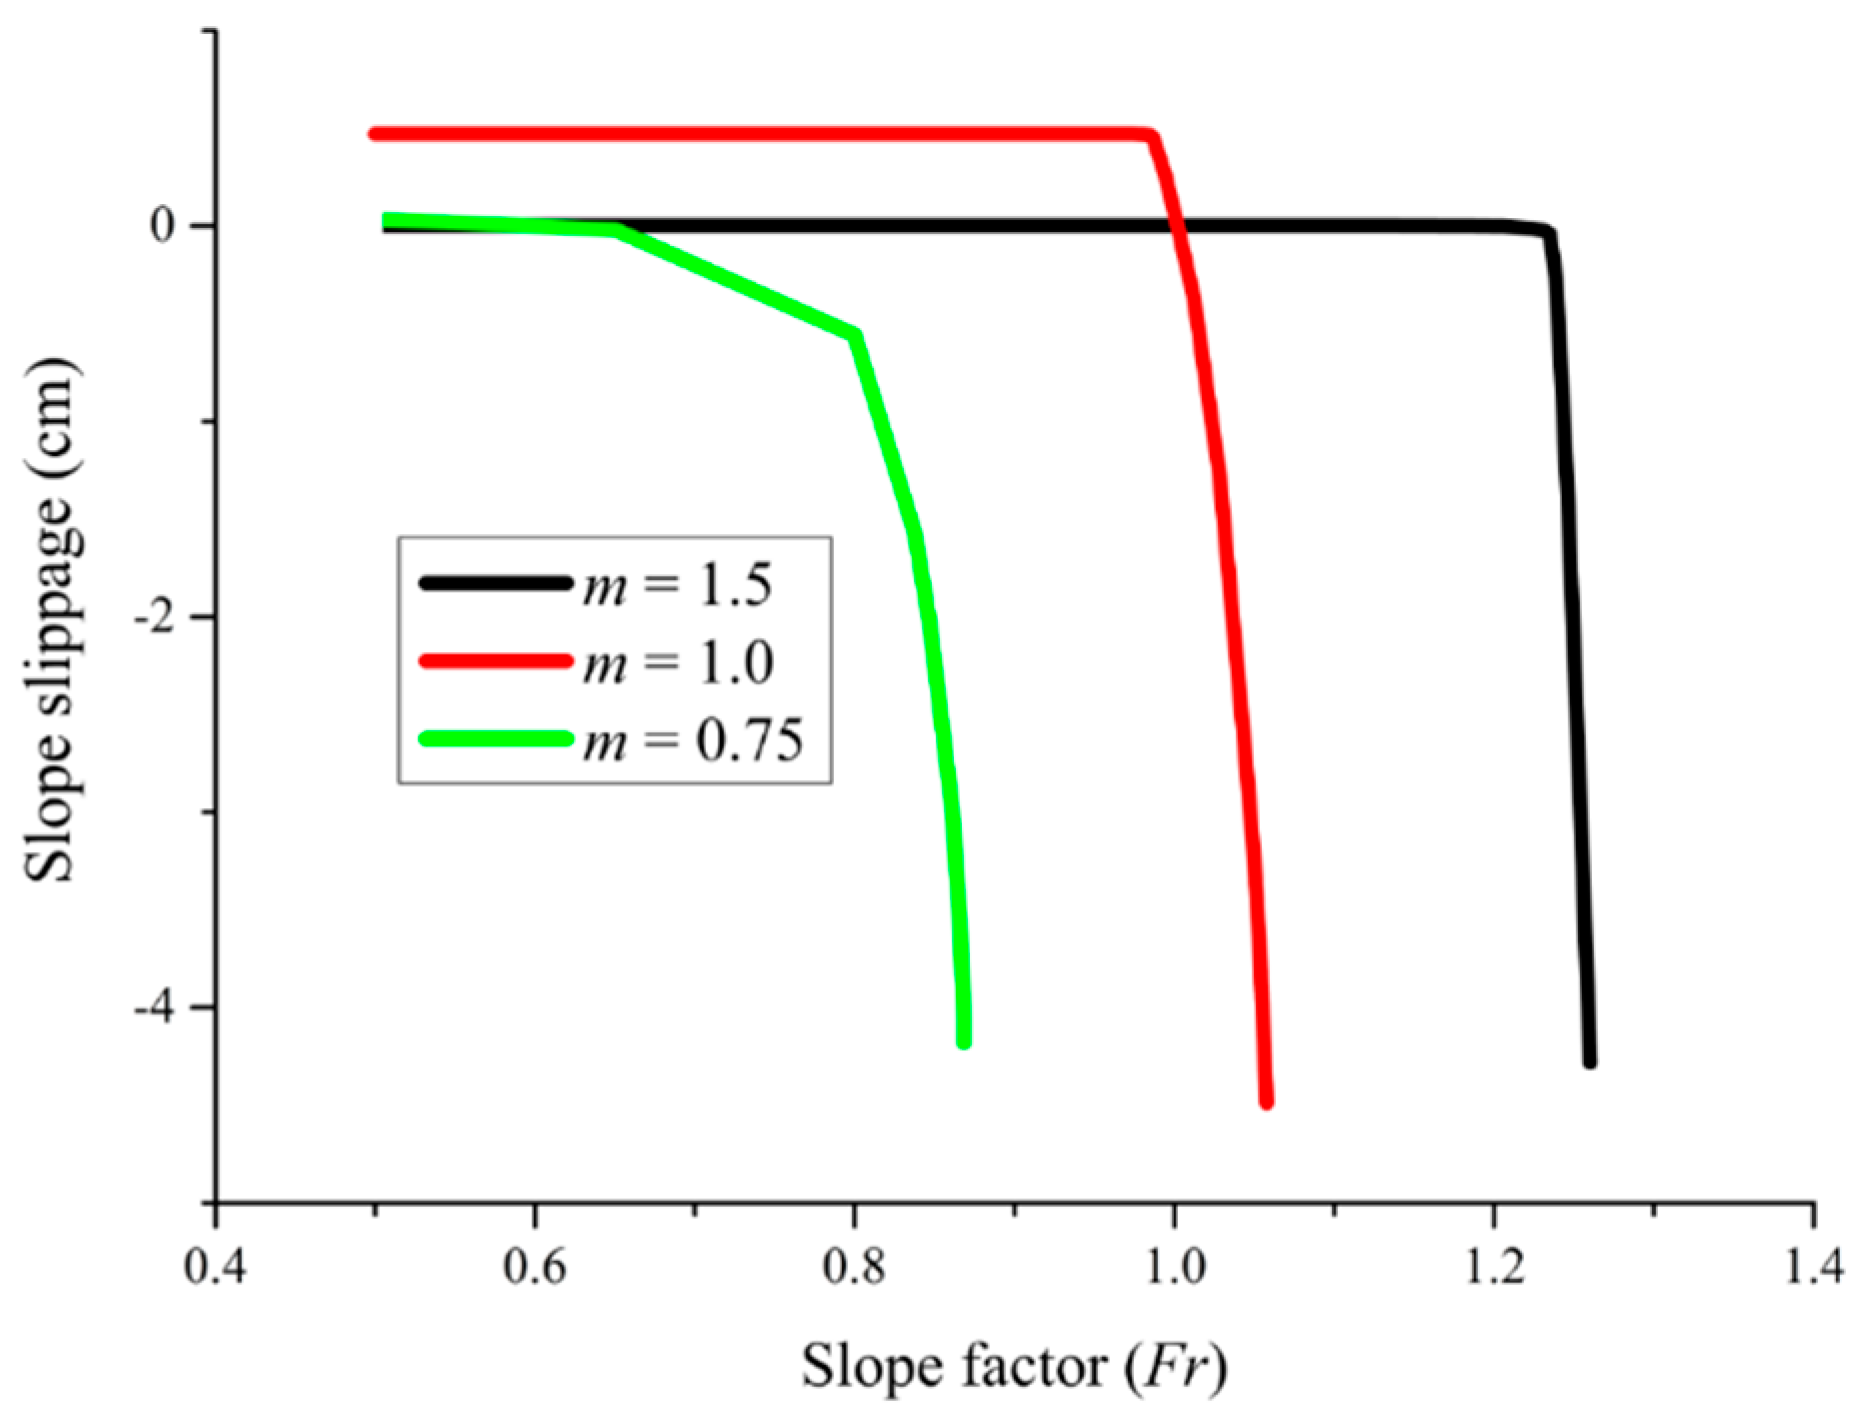
We usually call the ratio of the horizontal width of the slope to the vertical height of the slope as the slope coefficient m. The slope coefficient m and the slope are reciprocal to each other. In the spring melting season, when the resistance of the slope is greater than the sliding force, the shallow debris on the slope is stabilized at a certain place on the slope after sliding down a certain distance. After a period of accumulation and consolidation, the slope safety factor Fr is improved. When the slope is graded, the slope safety factor Fr increases most obviously. When there are progressively more shallow slump deposits, and the sliding force exceeds the friction resistance, then the second slip begins. Repeatedly, the safety factor Fr of the slope changes in stages, and the lower the slope factor Fr, the more obvious the characteristics, as shown in Figure 5. When the other conditions remain unchanged, and the sliding amount of the shallow slope reaches a certain value, then the slope stabilizes and the slope safety factor Fr remains at a certain value.
It can be seen from Figure 5 that when the gradient coefficient m increases, the slope safety factor Fr increases accordingly after freeze-thaw cycles. When m = 0.75, Fr = 0.87; when m = 1.0, Fr = 1.06; and when m = 1.5, Fr = 1.27. The reason for the change in the slope safety factor is that when the slope coefficient m increases, the slope slows down, the shallow slip of the slope decreases after freeze-thaw, then the safety of the slope increases, and the safety factor Fr of the slope increases accordingly. Therefore, the reasonable reduction of slope rate is a countermeasure to prevent freezing and thawing disasters in cold regions.
4.4.4. Effect of Grading Series on Slope Stability under Freeze-Thaw Conditions
In cold regions, when the spring temperature rises, the freezing and thawing active layer on the slope melts, the slope is loose, then the cohesion, bearing capacity, and shear resistance are reduced. During this time, shallow freezing and thawing disasters are more likely to occur. In order to improve the stability of the slope, the slope platform is usually set up at a certain height of the slope to form a secondary or multi-grade slope.
It can be seen in Figure 6 that when the slope grade increases, the slope safety factor Fr also increases. The safety factor Fr of the first-grade slope is 1.26, the safety factor Fr of the second-grade slope is 1.63, and the safety factor Fr of the third-grade slope is 1.71. The reason for the change in the slope safety factor is that when the slope grade increases, the number of platforms also increases. The platforms between slopes can not only share the load, but also prevent the slope from being washed and damaged by rain. When a shallow landslide occurs in the slope after freeze-thaw cycles, the resistance provided by the platform between the slopes slows down the sliding of the slope. In other words, the more the slope grades, the greater the resistance to shallow sliding, the better the stability of the slope and the greater the safety factor Fr. Therefore, designing the slope grades reasonably can effectively improve the safety factor Fr of the slope. The setting of graded slopes and platforms is an effective engineering measure to prevent freezing and thawing disasters in cold regions.
4.4.5. Analysis of Instability Characteristics of Cutting Slope under Freeze-Thaw Conditions
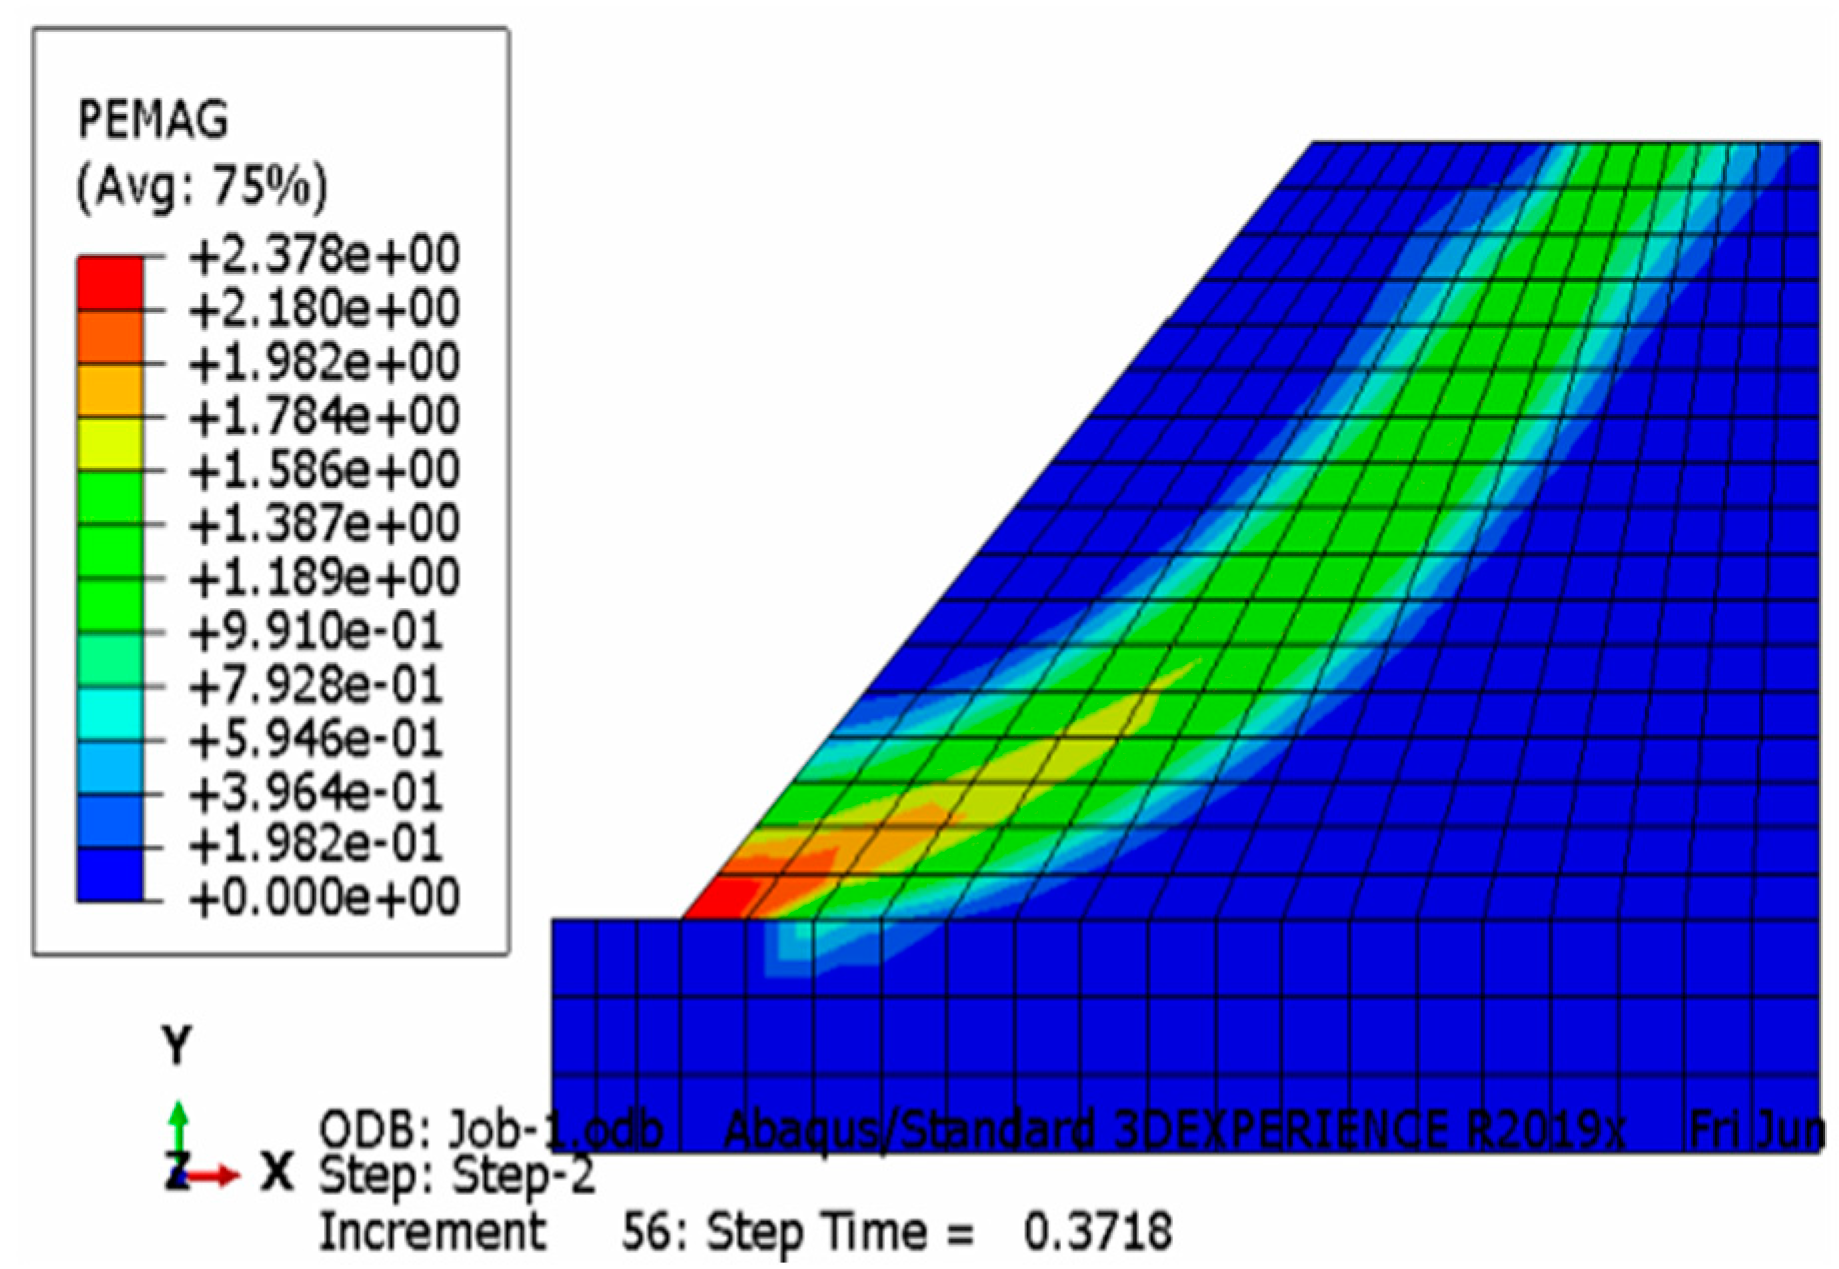
It can be deduced from Figure 7 and Figure 8 that, compared with slopes that have not undergone freezing and thawing, the location of the sliding surface of the slope after 50 freeze-thaw cycles is closer to the front side and the foot of the slope. Moreover, the width of the sliding belt is narrowed, the roundness is reduced, and there is a notch. Furthermore, the plastic zone starts to penetrate upward from the foot of the slope, but it does not completely penetrate to the top of the slope. This is because the cutting slope has increased fatigue and reduced reliability under long-term fatigue load and freeze-thaw cycles, resulting in fatigue damage and destruction when the slope is far below its bearing capacity. Therefore, the slope is more prone to instability.
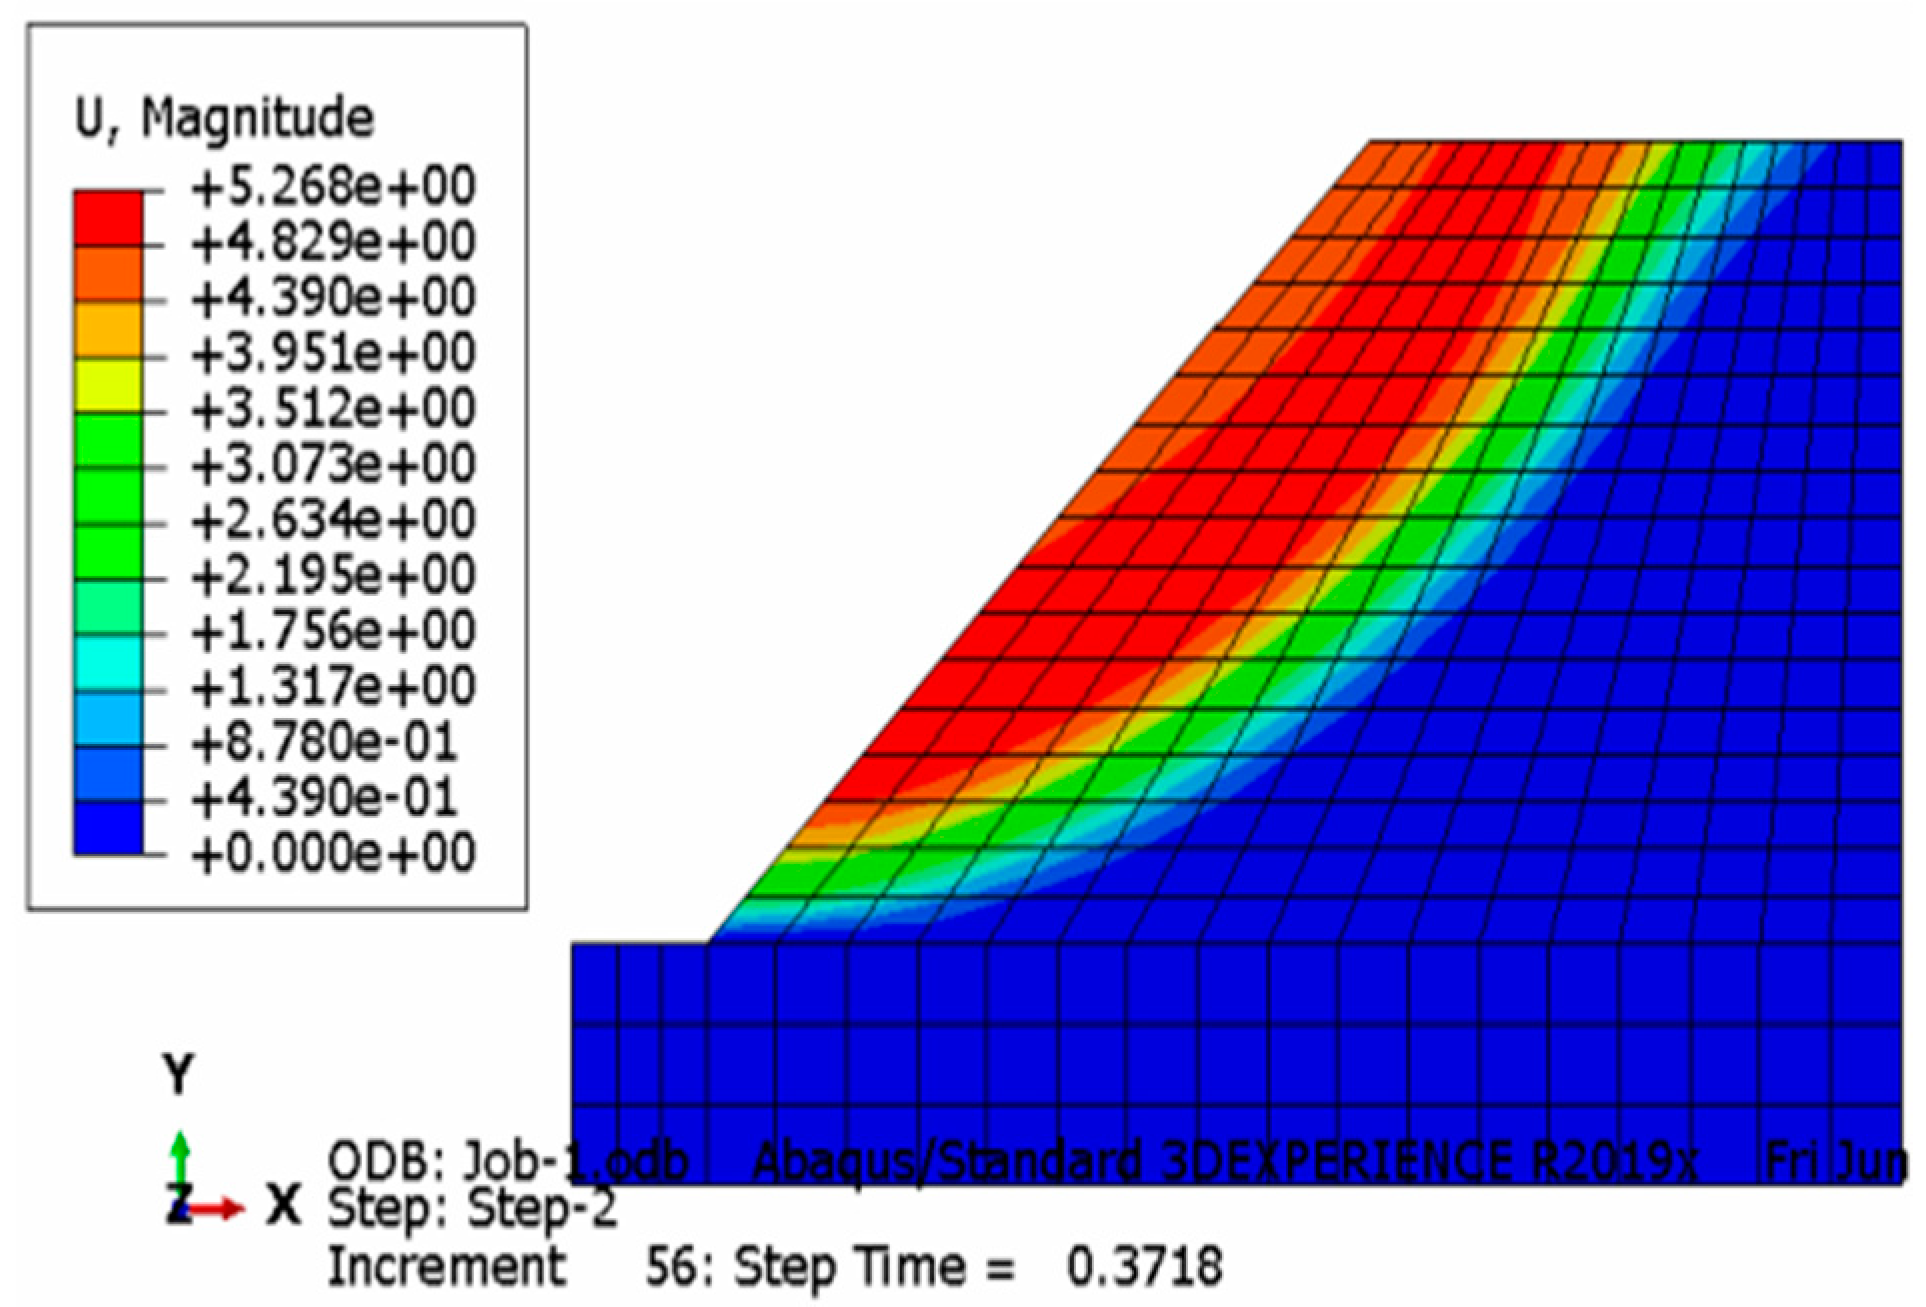
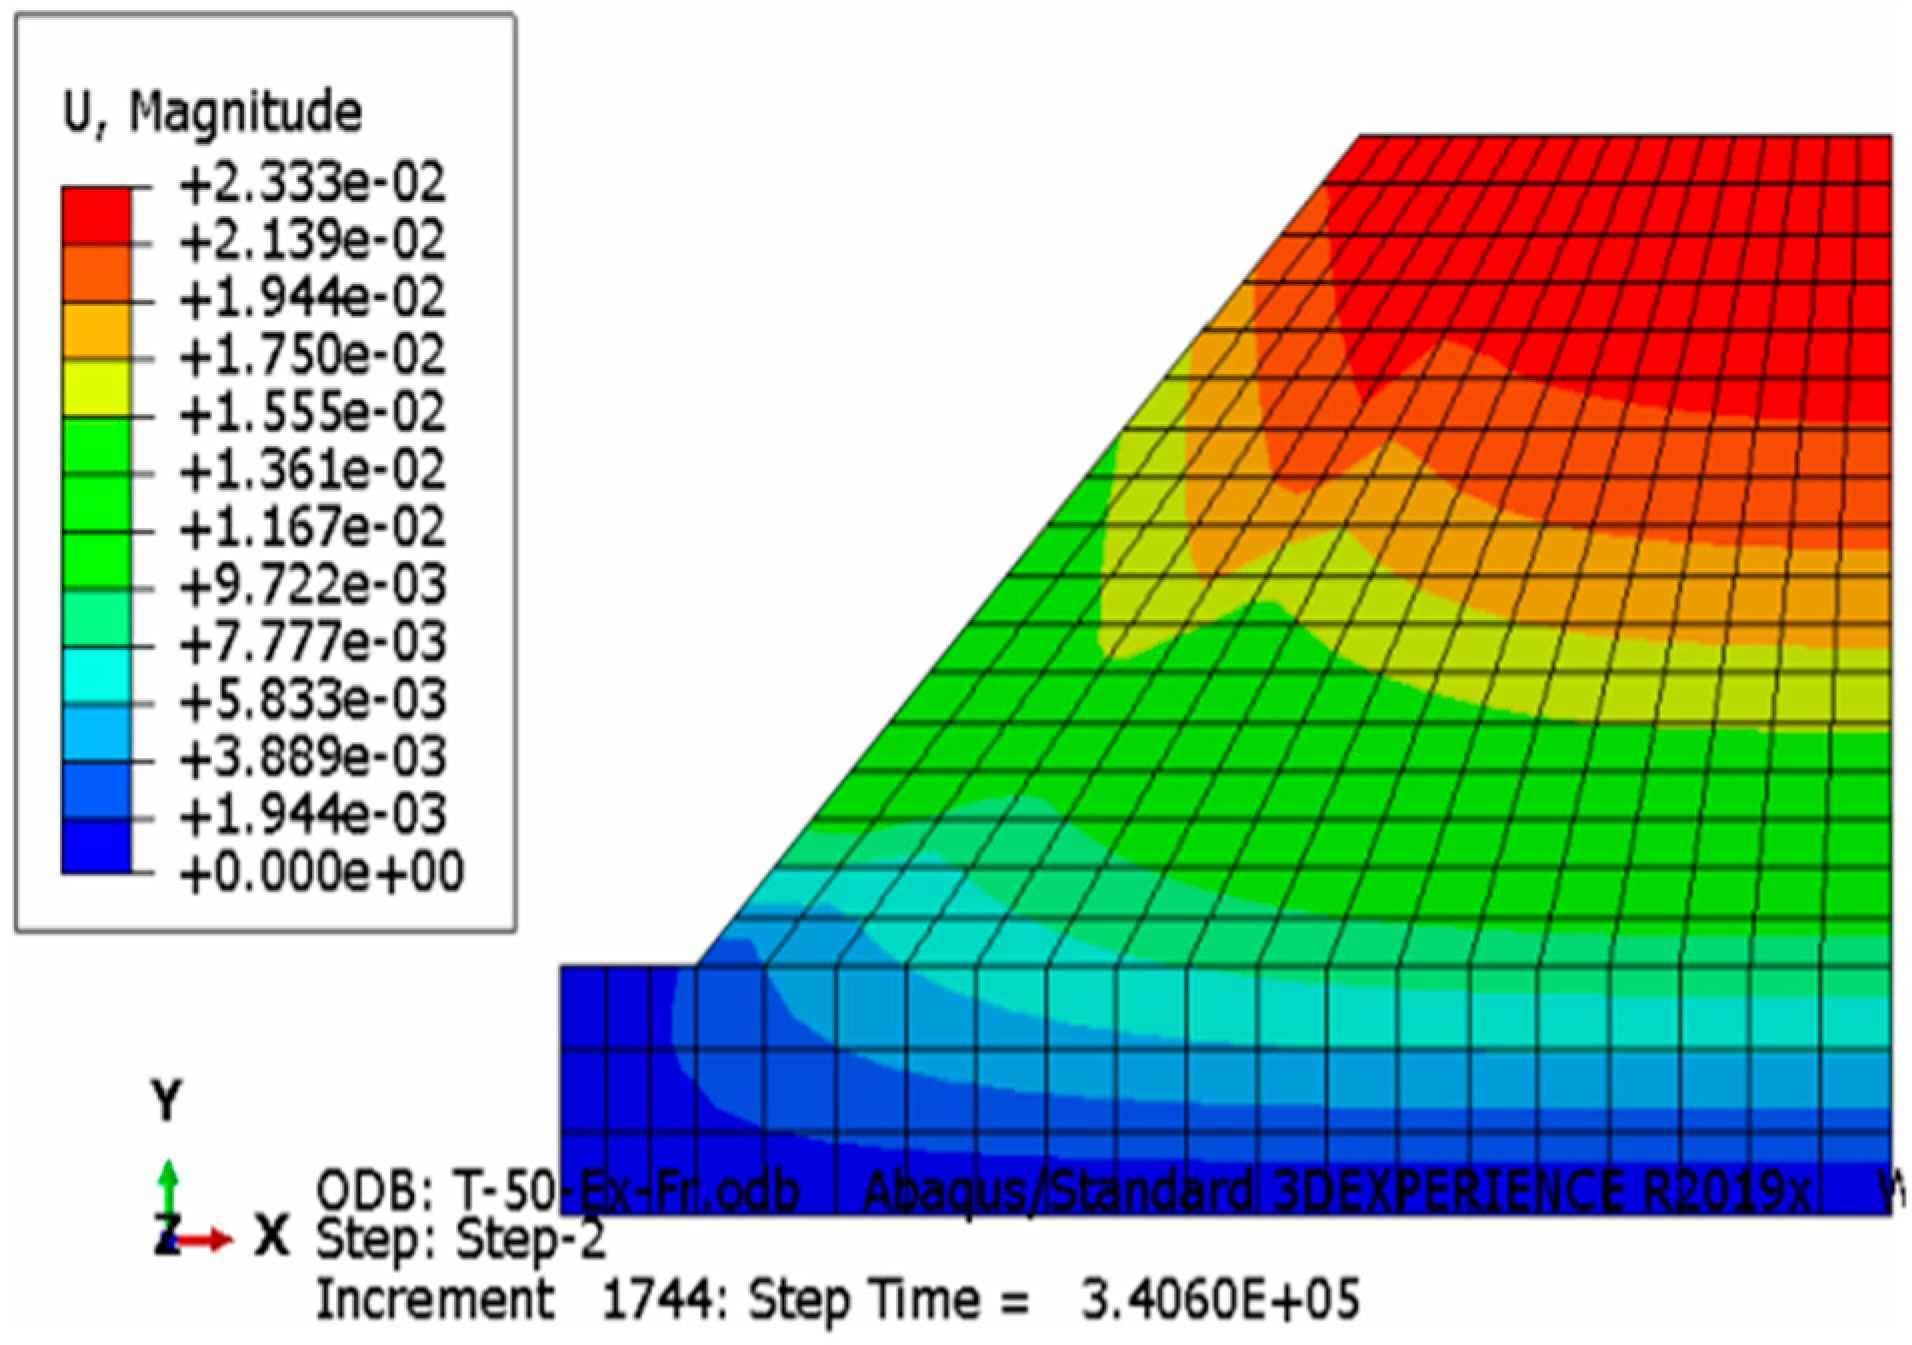
Figure 9 and Figure 10 are displacement cloud diagrams of the slope after 0 and 50 freeze-thaw cycles, respectively. The two figures show clearly contrasting results. In Figure 9, the displacement of the slope changes in an arc shape, which is consistent with the change of the sliding belt, the displacement only changes above the sliding belt, and there is no change in the displacement below the sliding belt. In Figure 10, the displacement of the slope shows a layered wave-like change, and from the top to the bottom of the slope, the displacement of the slope gradually decreases due to the reaction force of the support. What is different from Figure 9 is that the displacement of the slope after freezing and thawing changes not only above the slip zone, but also below the slip zone. During the freeze-thaw cycle, the entire slope is in a dynamic process of change. The repeated freeze-thaw cycles increase the internal porosity of the slope, then its structure is loose, and the bearing capacity is reduced, so freezing and thawing disasters are more likely to occur under conditions that are far below the slope’s carrying capacity.
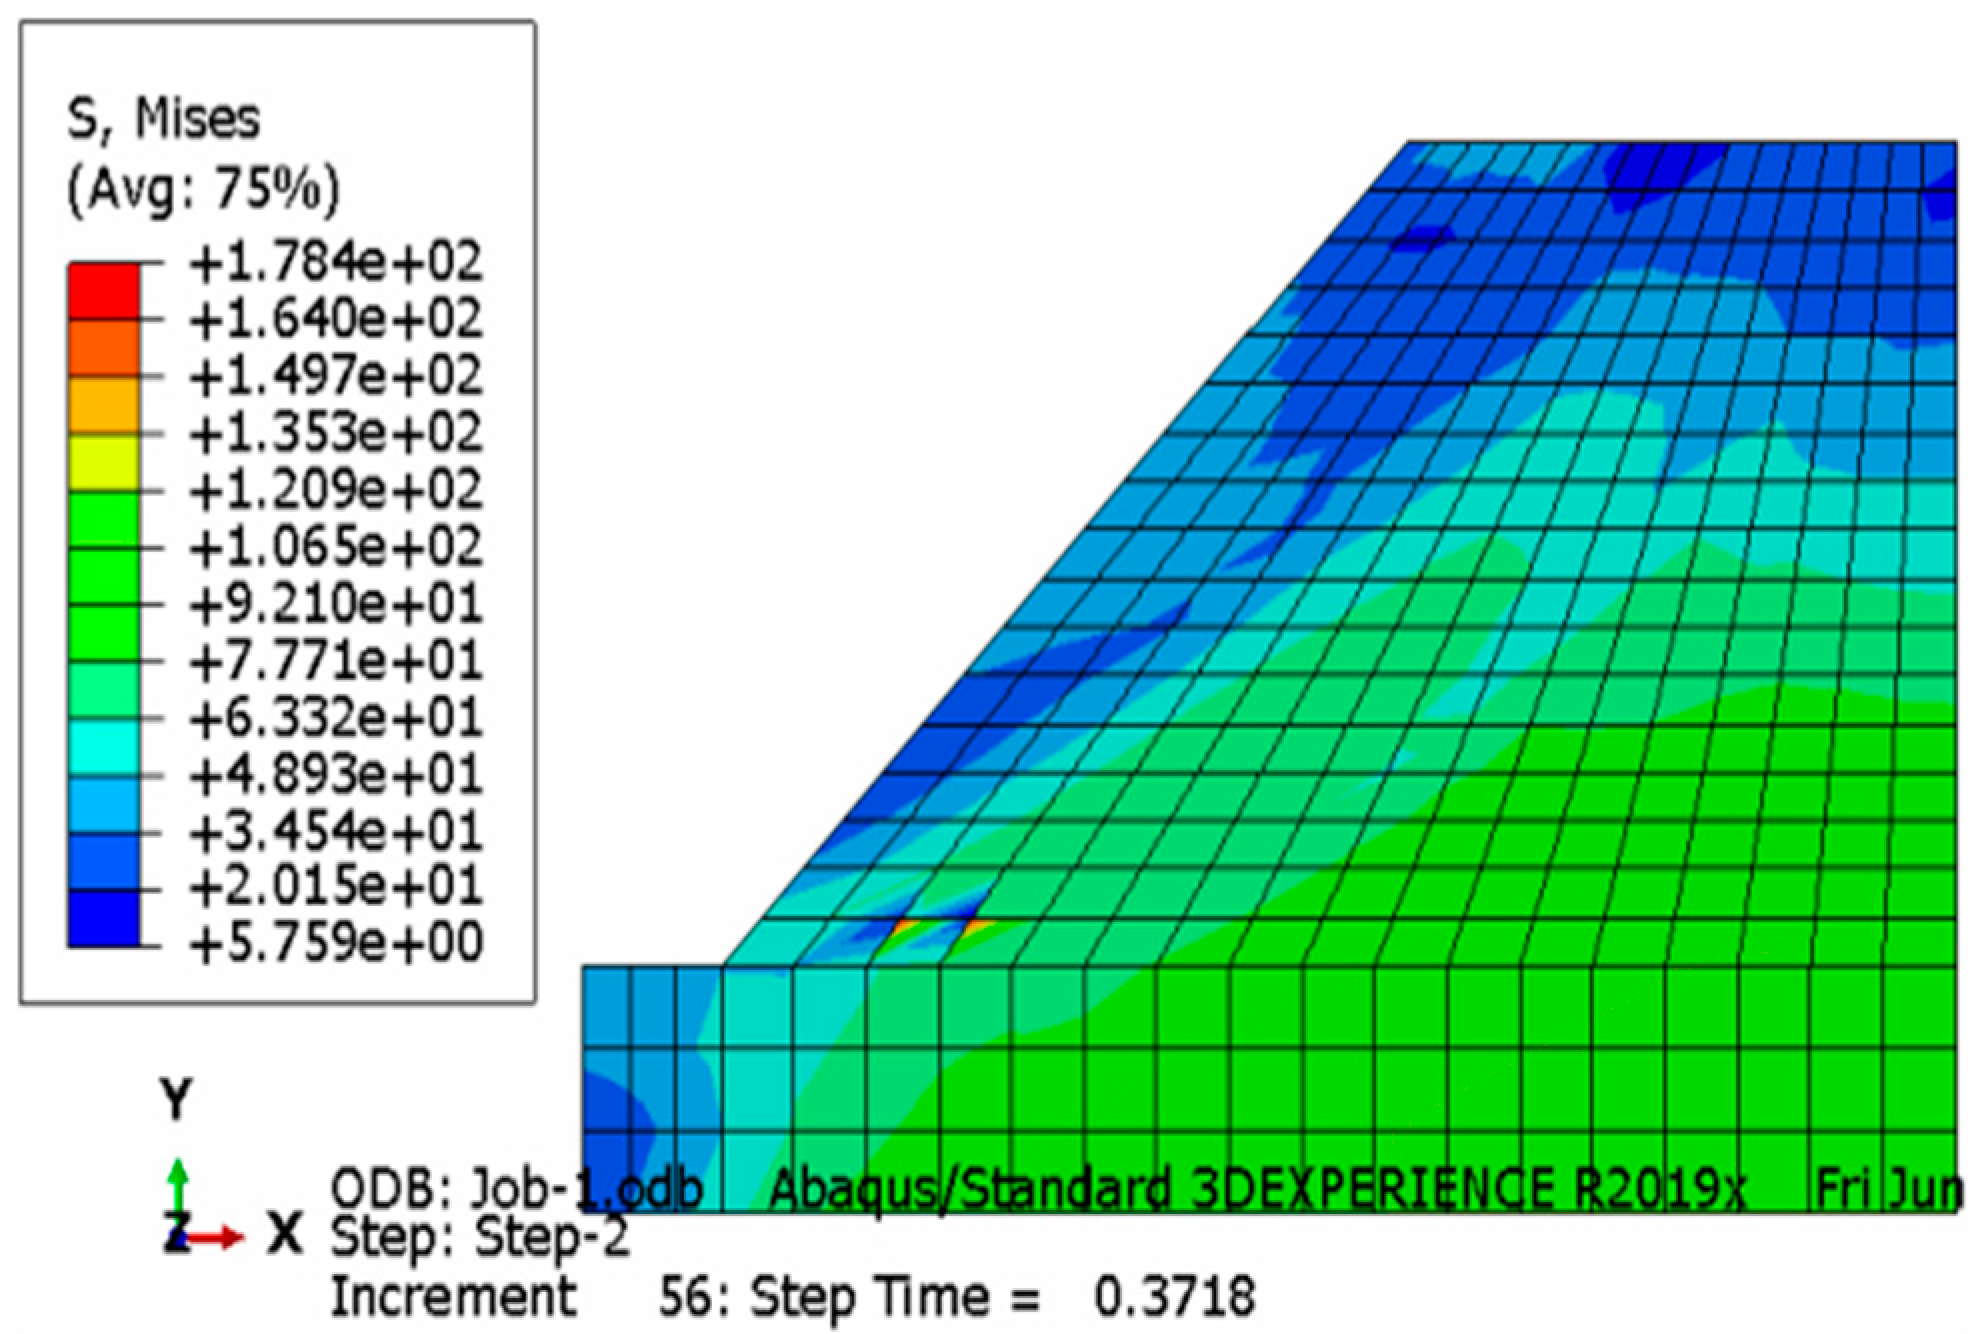
Figure 11 and Figure 12 show the changes in slope stress at 0 and 50 freeze-thaw cycles, respectively. Comparing these with Figure 9 and Figure 10, we can observe the opposite changes of stress and displacement. From the top to the bottom of the slope, the stress gradually increases—this is because constraints are set at the bottom, left, and right sides of the slope. In Figure 11, the maximum stress appears near the slope foot, so the fracture occurs first at the slope foot, which is consistent with the change in Figure 7. In Figure 12, the stress shows a layered wave-like change, and the change direction is contrary to the trend of the displacement. During the freezing and thawing process, the periodic changes in temperature cause huge temperature stress in the slope, and the slope is more likely to be unstable due to the coupling of heat, moisture, and stress.
5. Discussion
After each freeze-thaw cycle, the soil and rock particles on the slope move down a short distance along the hillside. There are many shallow trenches and cracks on the slope surface, which are traces left by creep. Creep is a significant deformation feature of frozen soil. In cold regions, the freeze-thaw process is the leading cause of creep, especially when the temperature rises after rain and snow, and the ice in the surface layer of the slope melts. Under such conditions, the decline of the soil and rock particles on the slope is more serious, as shown in Figure 13a. Over time, shallow sliding on the slope surface occurs, which is illustrated in Figure 13c.
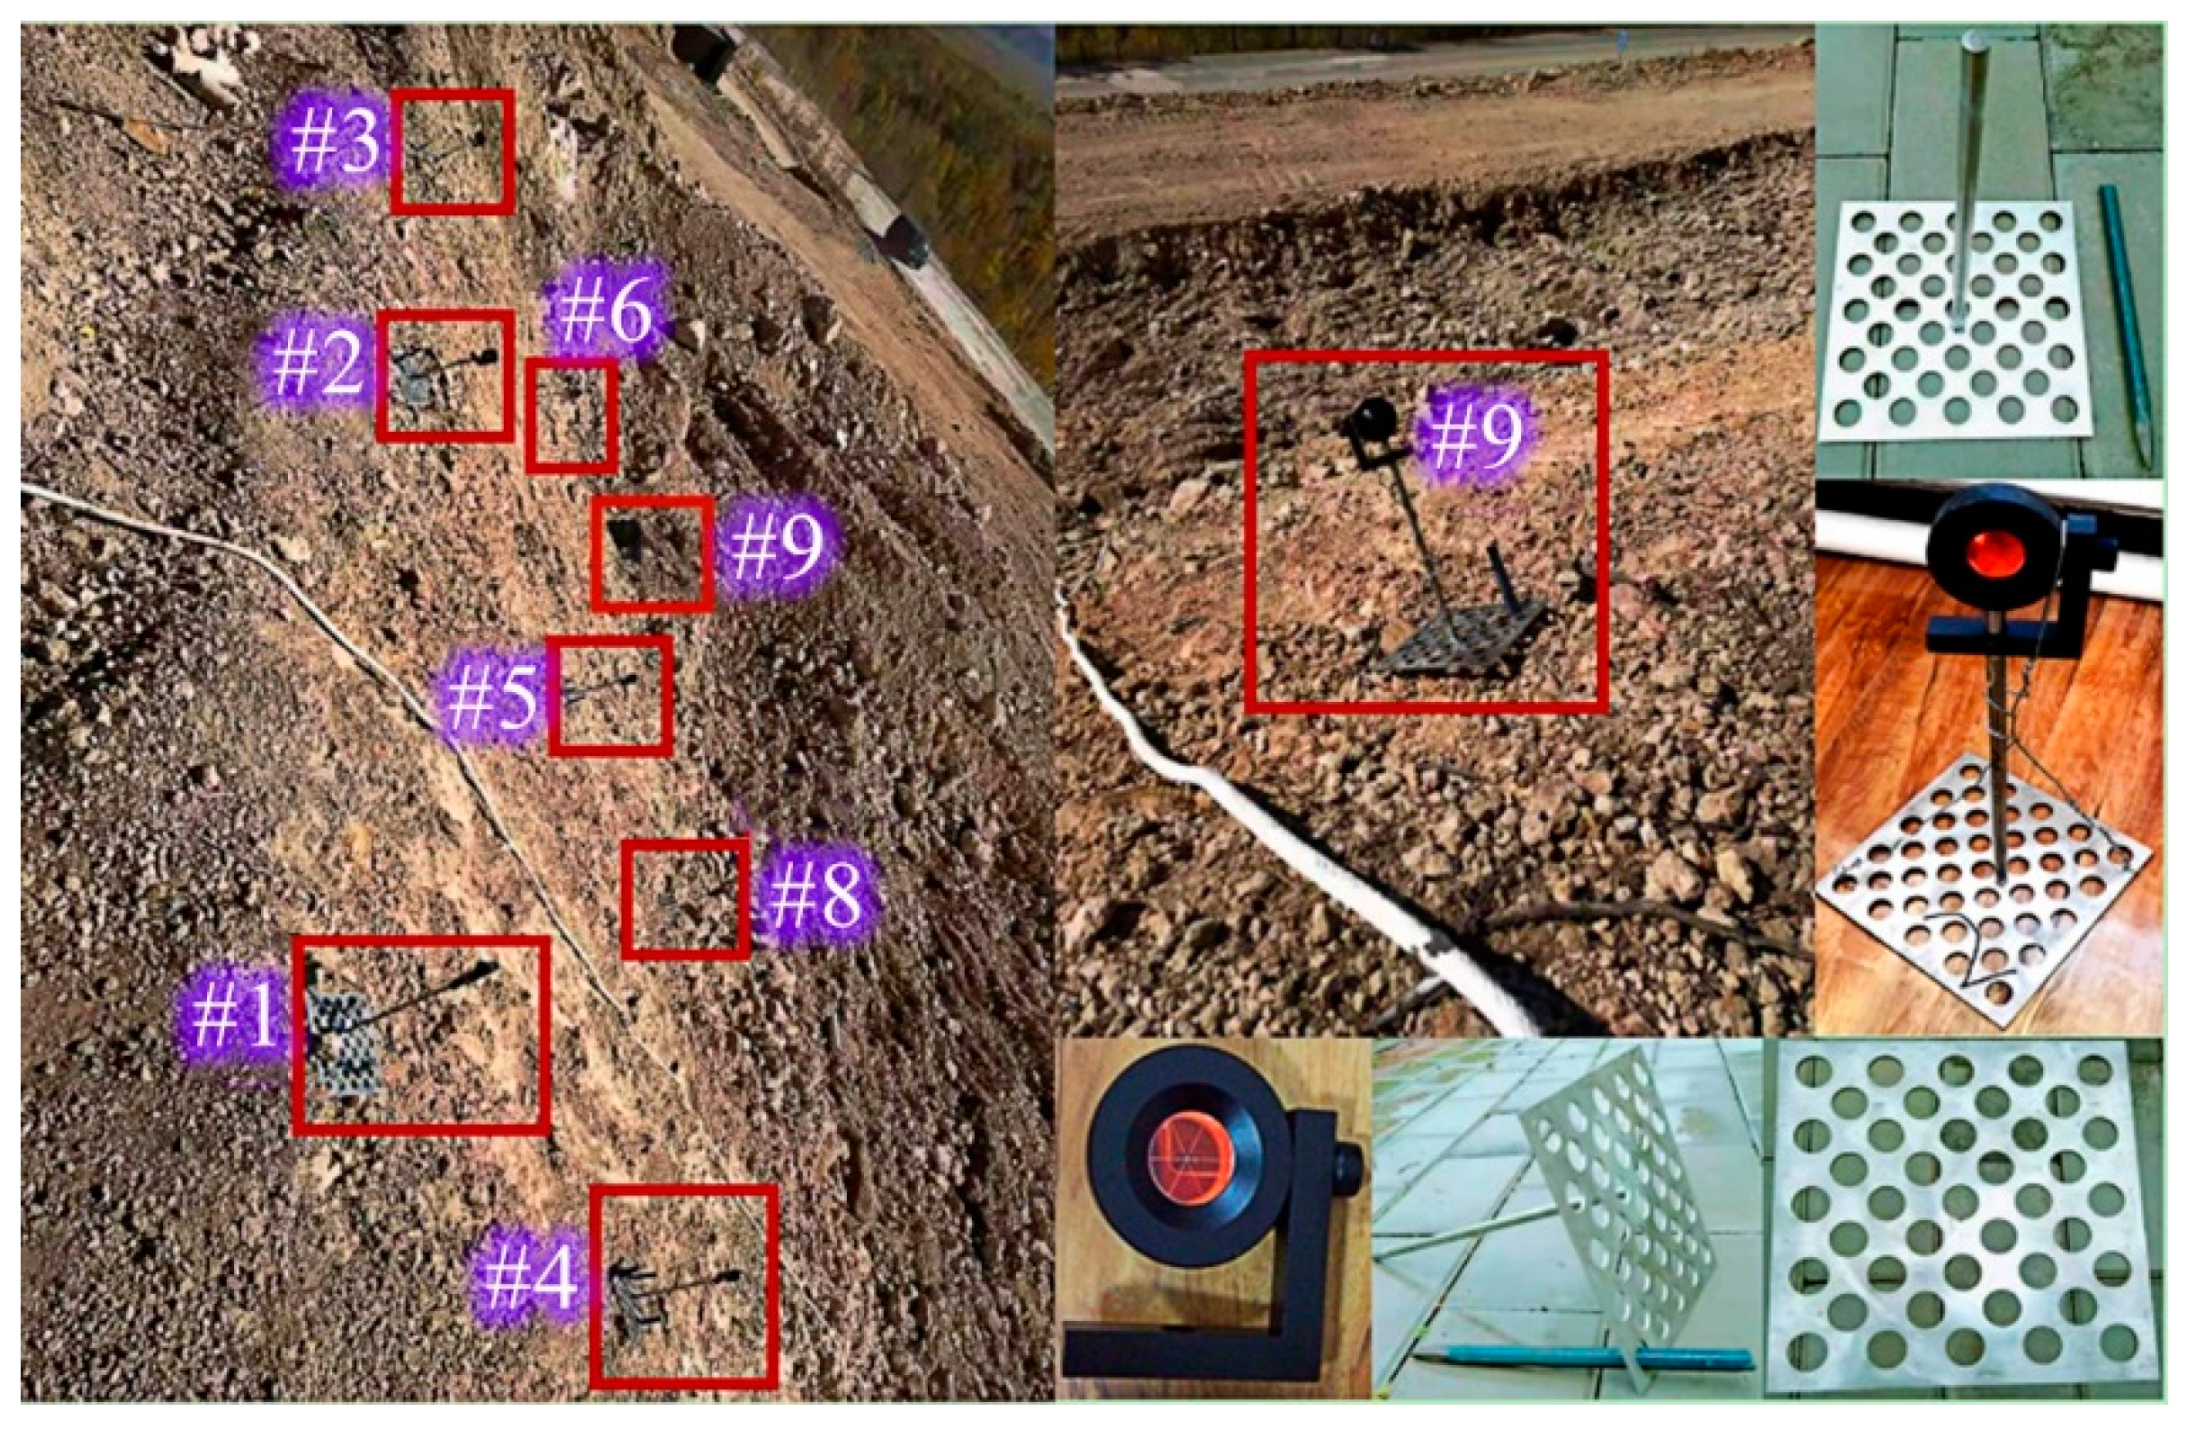
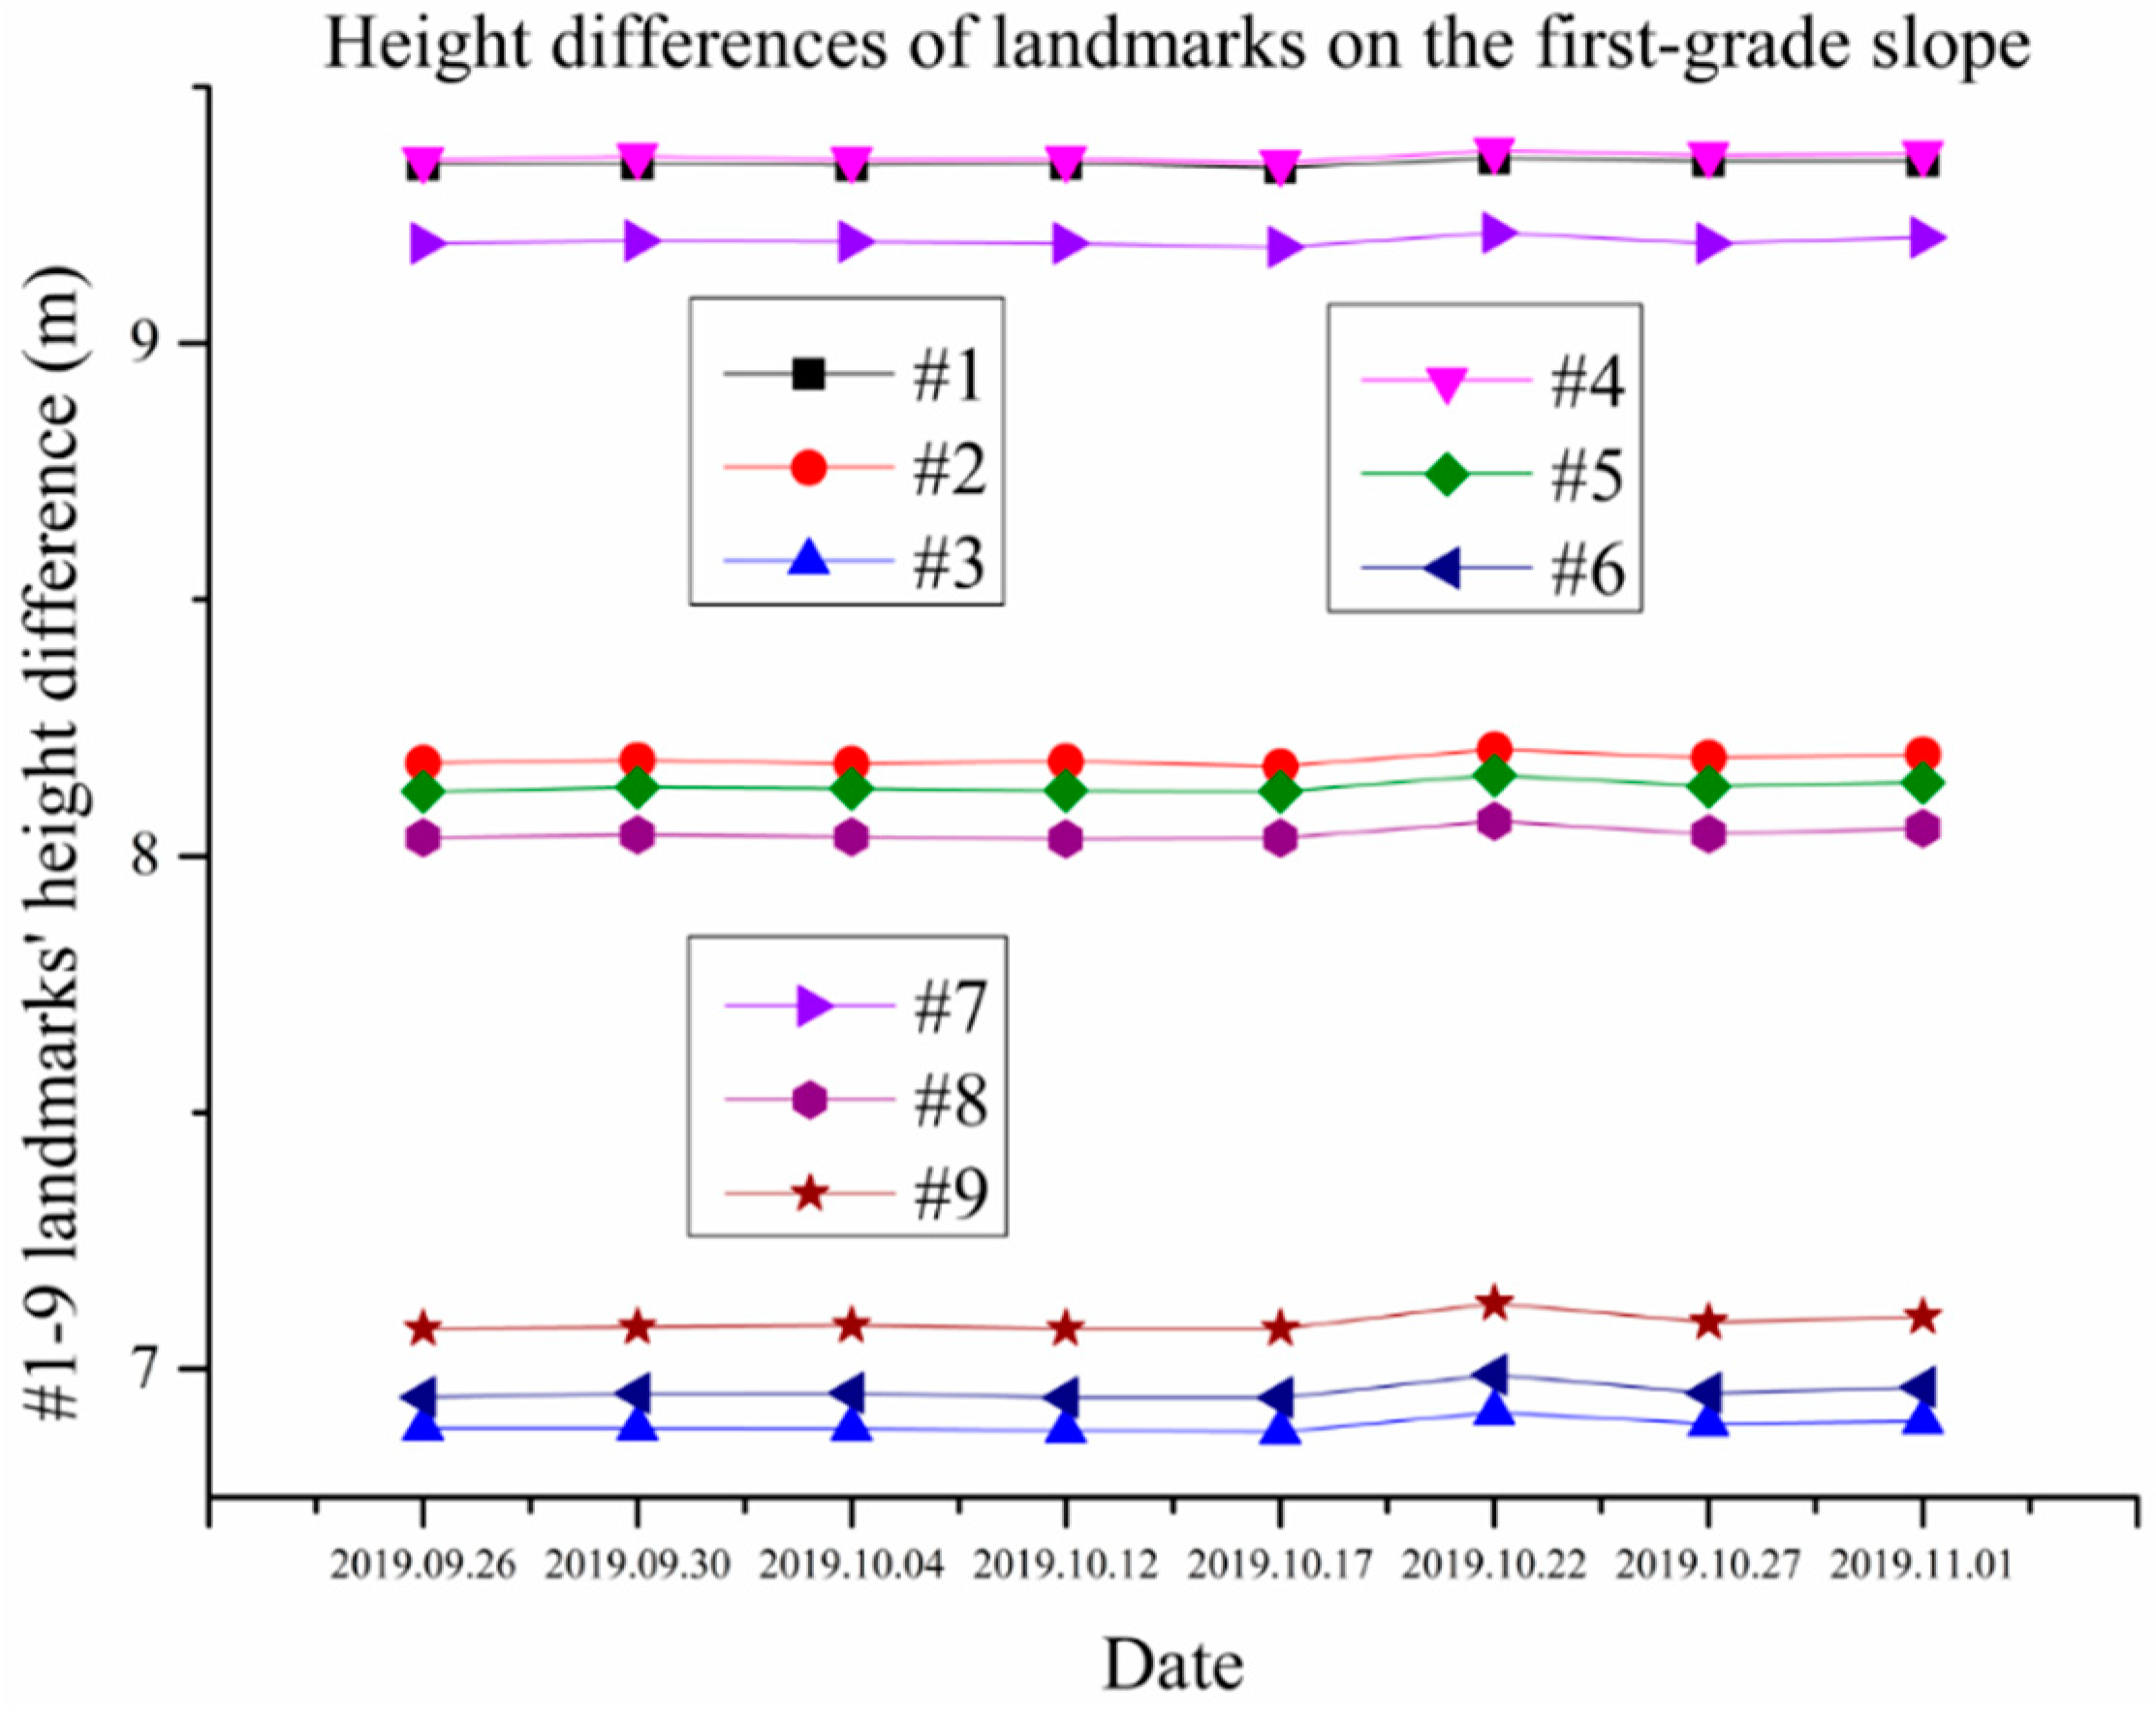
The road cutting slope is difficult to construct and has a high landslide risk. We thus arranged nine landmarks on the first-grade slope to grasp the dynamic change of the slope, as shown in Figure 14. After collecting the continuous data of the vertical angle and height difference of the slope, it was found that the slope is in freeze-thaw cycles, as shown in Figure 15 and Figure 16, which is consistent with the results of numerical simulation. At the same time, this also illustrates the rationality of the numerical simulation results.
6. Conclusions
As the number of freeze-thaw cycles increases, the uniaxial compressive strength of the specimens in the slope gradually decreases. After 50 freeze-thaw cycles, the uniaxial compressive strength measured by the test decreases from 40 MPa to 12 MPa, a decrease of 37%. The elastic modulus value is reduced by 47%, the overall bearing capacity of the slope is reduced, and thus the risk of shallow freezing and thawing slips increases.
By studying the stability of the slope under different freeze-thaw cycles, as well as the initial water content, slope coefficient, and grading series, and using the strength reduction method to calculate the safety factor of the slope under the influence of coupled heat, moisture, and stress, the results show that with the increase in the number of freeze-thaw cycles and the initial moisture content, the safety factor of the cutting slope gradually becomes smaller and eventually stabilizes at a certain value, and the safety factor of the slope is only 0.74 after 50 freeze-thaw cycles. Furthermore, the freeze-thaw cycle accelerates the slope slippage, and the influence of the change of the slope coefficient on the slope safety factor is very significant.
When the slope coefficient increases, the slope safety factor also increases. Therefore, appropriately slowing down the slope rate is an effective measure to prevent the freezing and thawing disasters in cold regions. In addition, the slope safety factor increases with the slope grading series—the safety factors of the first-, second-, and third-grade slope were 1.26, 1.63, and 1.71, respectively. Therefore, an effective engineering measure to prevent the freezing and thawing disasters in slopes in cold regions is to perform multi-level grading, and to set up multiple grading platforms in the cutting slope.
This study can provide guidance and reference for the design and construction of road cutting slopes in high-latitude and low-altitude permafrost regions.
7. Patents
Chinese invention patent:
Invention patent name: Supporting device for high water-containing slope and construction method thereof
Application publication number: CN109056756A
Applicant: China University of Geosciences (Beijing)
Inventor: Yuxia Zhao
Invention patent abstract: The invention discloses a supporting device for a high water-containing slope, which comprises a plurality of transverse and longitudinal steel bars arranged in a network, and an anchor post is provided at the overlap of the transverse and longitudinal steel bars. An anchor head is fixed at the bottom of the anchor post, and a blind hole is provided in the inner hole. An inner sleeve is movably inserted in the blind hole. The inner sleeve is provided with two through holes that are perpendicular to each other. A mating block is provided in the inner sleeve. The top of the inner sleeve is connected to the first adjusting rod through a first bearing. The first adjusting rod and the inner sleeve are provided with through-thread holes. The second adjusting rod, the bottom of the second adjusting rod is axially connected to the pressing block through the second bearing, the pressing block is crimped to the transverse reinforcing bar, and a protective net is connected between the transverse reinforcing bar and the longitudinal reinforcing bar. The invention can improve the shortcomings of the prior art, improve the protection effect on the slope, reduce soil erosion of the slope, and protect the ecological environment.
Author Contributions
Conceptualization, Y.Z. and L.W.; methodology, Y.Z.; software, Y.Z. and H.L.; validation, L.W.; investigation, Y.Z., L.W., and H.L.; resources, L.W.; data curation, Y.Z. and L.W.; writing—original draft preparation, Y.Z.; writing—review and editing, Y.Z. and H.L.; project administration, L.W.; project financial acquisition, L.W., Y.Z., and H.L. All authors have read and agreed to the published version of the manuscript.
Funding
This research was funded by China University of Geosciences (Beijing) and the Beijing Municipal Road & Bridge (Group) Co., Ltd., project grant number 3-4-2020-003, and the APC was funded by the Beijing Municipal Road & Bridge (Group) Co., Ltd.
Acknowledgments
We gratefully acknowledge the School of Engineering and Technology, China University of Geosciences (Beijing), and the Beijing Municipal Road & Bridge (Group) Co., Ltd. for the financial support, surveyed data and comments of the project (Key Techniques of Frozen Soil Road Construction in High-Latitude and Low-Altitude Forest Areas) they worked together on. We would also like to thank the Guang’xi Road and Bridge Engineering Group Co., Ltd. and others in this collaborative project who have helped us with drilling, sampling, equipment, transportation, and accommodation. This support is greatly appreciated.
Conflicts of Interest
The authors declare no conflict of interest.
References
- Yersov, З.Д.; Liu, J.; Tong, B. Principles of Permafrost, 2nd ed.; Lanzhou Publishing House: Lanzhou, China, 2015; pp. 137–256. [Google Scholar]
- Qiu, Y.; Qi, W. Application of flake ventilation layer in highway subgrade in permafrost area. West. Chin. Explor. Eng. 2010, 11, 225–238. [Google Scholar]
- Cristescu, N.D.; Hunsche, U. Time Effects in Rock Mechanics, 1st ed.; Wiley: Manhattan, NY, USA, 1998; pp. 68–90. [Google Scholar]
- Han, J.; Wang, X.; Shi, C.; Wang, D. Erosion and failure modes of highway slopes in seasonally frozen areas. J. Chang’an Univ. 2008, 28, 41–45. [Google Scholar]
- Li, G.; Wang, F.; Ma, W.; Fortier, R.; Mu, Y.; Mao, Y. Variations in strength and deformation of compacted loess exposed to wetting–drying and freeze-thaw cycles. Cold. Reg. Sci Technol. 2018, 151, 159–167. [Google Scholar] [CrossRef]
- Wang, N.; Luo, D. Surface freezing effect and stability response of loess slope (side) slope. J. Eng. Geol. 2010, 18, 760–765. [Google Scholar]
- Li, L.; Zhang, K.; Zhang, Q.; Mao, Y.; Li, G. Experimental study on strength deterioration characteristics of loess under the action of dry, wet and freeze-thaw cycles. J. Glaciol. Geocryol. 2016, 38, 1142–1149. [Google Scholar]
- Li, B. The Influence of Freeze-Thaw Cycles and Dry–Wet Cycles on the Mechanical Properties of Loess and its Application in Slope Engineering. Master’s Thesis, Lanzhou University of Technology, Lanzhou, China, 2017. [Google Scholar]
- Zhang, Y.; Zhou, L.; Wang, J.; Wu, C.; Lv, X. Effect of freeze-thaw on the mechanical properties of silty soil and the stability of embankment slopes. J. Jilin Univ. 2019, 49, 1531–1538. [Google Scholar]
- Xu, J.; Zheng, X.; Zhang, H. Analysis on the mechanism and stability of slope freeze-thaw spalling in loess area. J. Univ. Xi’an Univ. Archit. Technol. 2018, 50, 477–484. [Google Scholar]
- Liu, H.; Guo, Y.; Shan, W.; Tao, X.; Sun, Y. Instability of soil cutting slopes caused by freeze-thaw and reinforcement mechanism by vegetation. Chin. J. Geotech. Eng. 2011, 33, 1197–1203. [Google Scholar]
- Guo, Y.; Shan, W. Monitoring and experiment on the effect of freeze-thaw on soil cutting slope stability. In Proceedings of the International Conference on Environmental Science and Information Application Technology, Wuhan, China, 12 November 2011; pp. 1115–1121. [Google Scholar]
- Zhang, W. Experimental Study on the Physical and Mechanical Indexes of the K177+550 Landslide Soil of Bei’an to Heihe Highway. Master’s Thesis, Northeast Forestry University, Harbin, China, 2013. [Google Scholar]
- Matsuoka, N.; Ikeda, A.; Hirakawa, K.; Watanabe, T. Contemporary periglacial processes in the Swiss Alps: Seasonal, inter–annual and long–term variations. Permafrost 2003, 2, 735–740. [Google Scholar]
- Zhang, X.; Yang, F.; Leng, Y.; Xue, Y. Permafrost Test and Frost Damage Investigation, 3rd ed.; Science Press: Beijing, China, 2013; pp. 51–96. [Google Scholar]
- Huang, J.; Zhao, J.; Duan, R.; Zhang, J. Reliability analysis of anti–slide pile reinforced slope based on strength reduction method. J. Civil Environ. Eng. 2020, 5, 40–50. [Google Scholar]
- Liang, Y.; Zhao, G. Study on the methods of determining the potential slip surface of slope. Subgrade Eng. 2007, 135, 47–49. [Google Scholar]
Figure 1.
Apparent morphology of specimens under different freeze-thaw cycles. (a) Before freeze-thaw cycles, the surface of the specimen was covered with tiny spidery cracks due to the high ice content. (b) After 10 freeze-thaw cycles, the pits and fine pores on the specimen surface gradually increased and deepened, the deterioration degree of the specimen was aggravated progressively. (c) The exfoliation of the specimen gradually increased after 50 freeze-thaw cycles, and finally the lower part of the specimen broke first. Moreover, the color of the specimen gradually deepened, changing from the initial brown–red–white to the brown–black peat color.
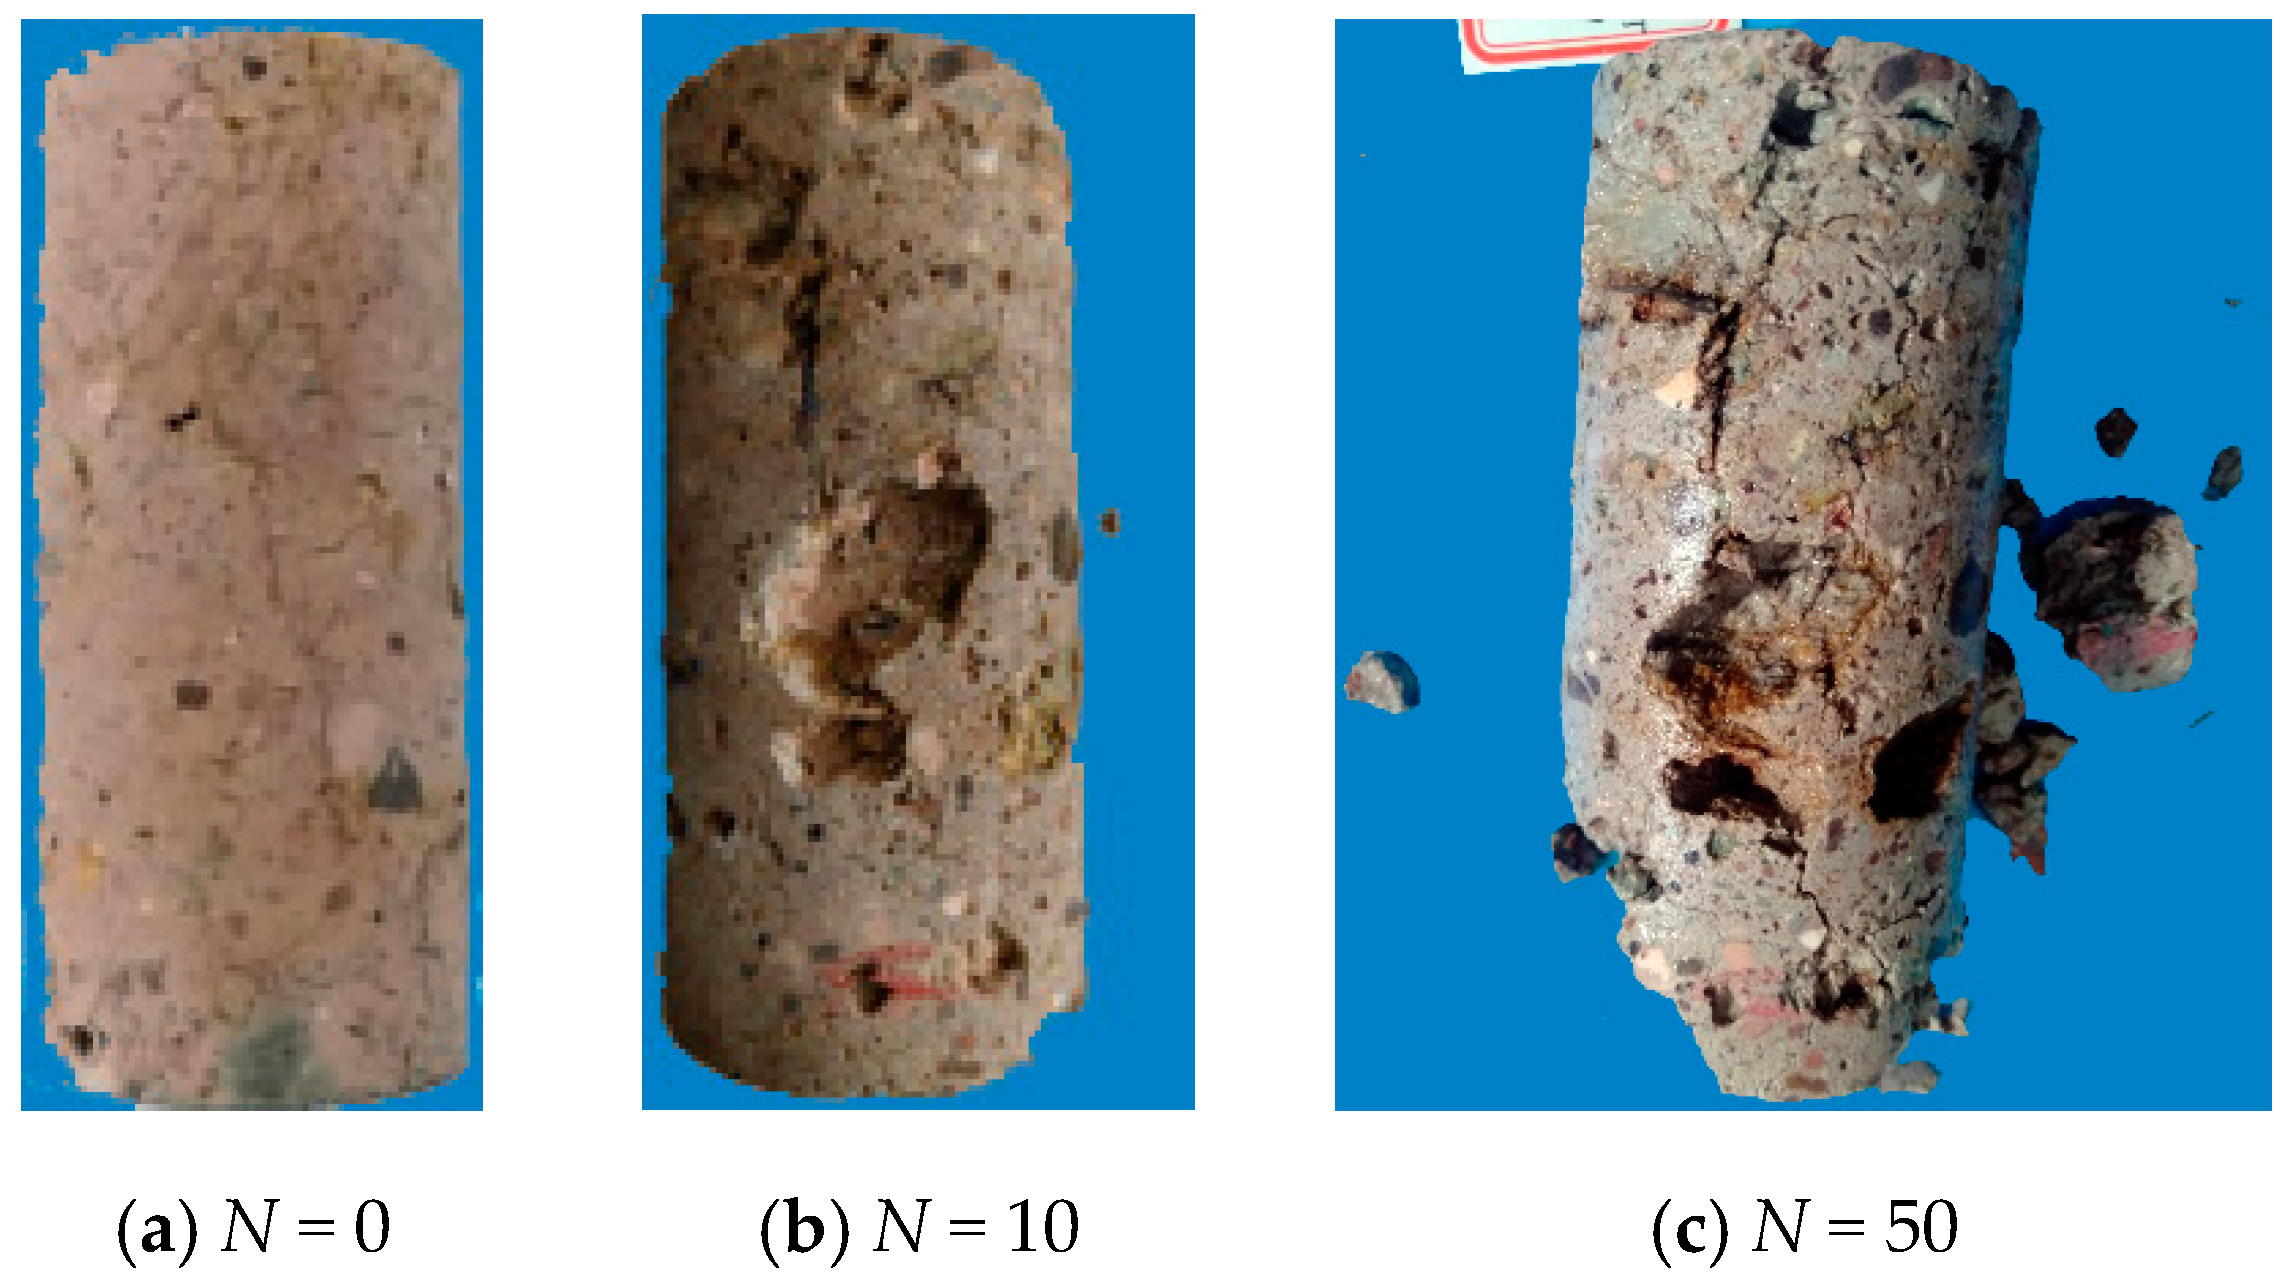
Figure 2.
Numerical calculation model of the cutting slope (unit: m).
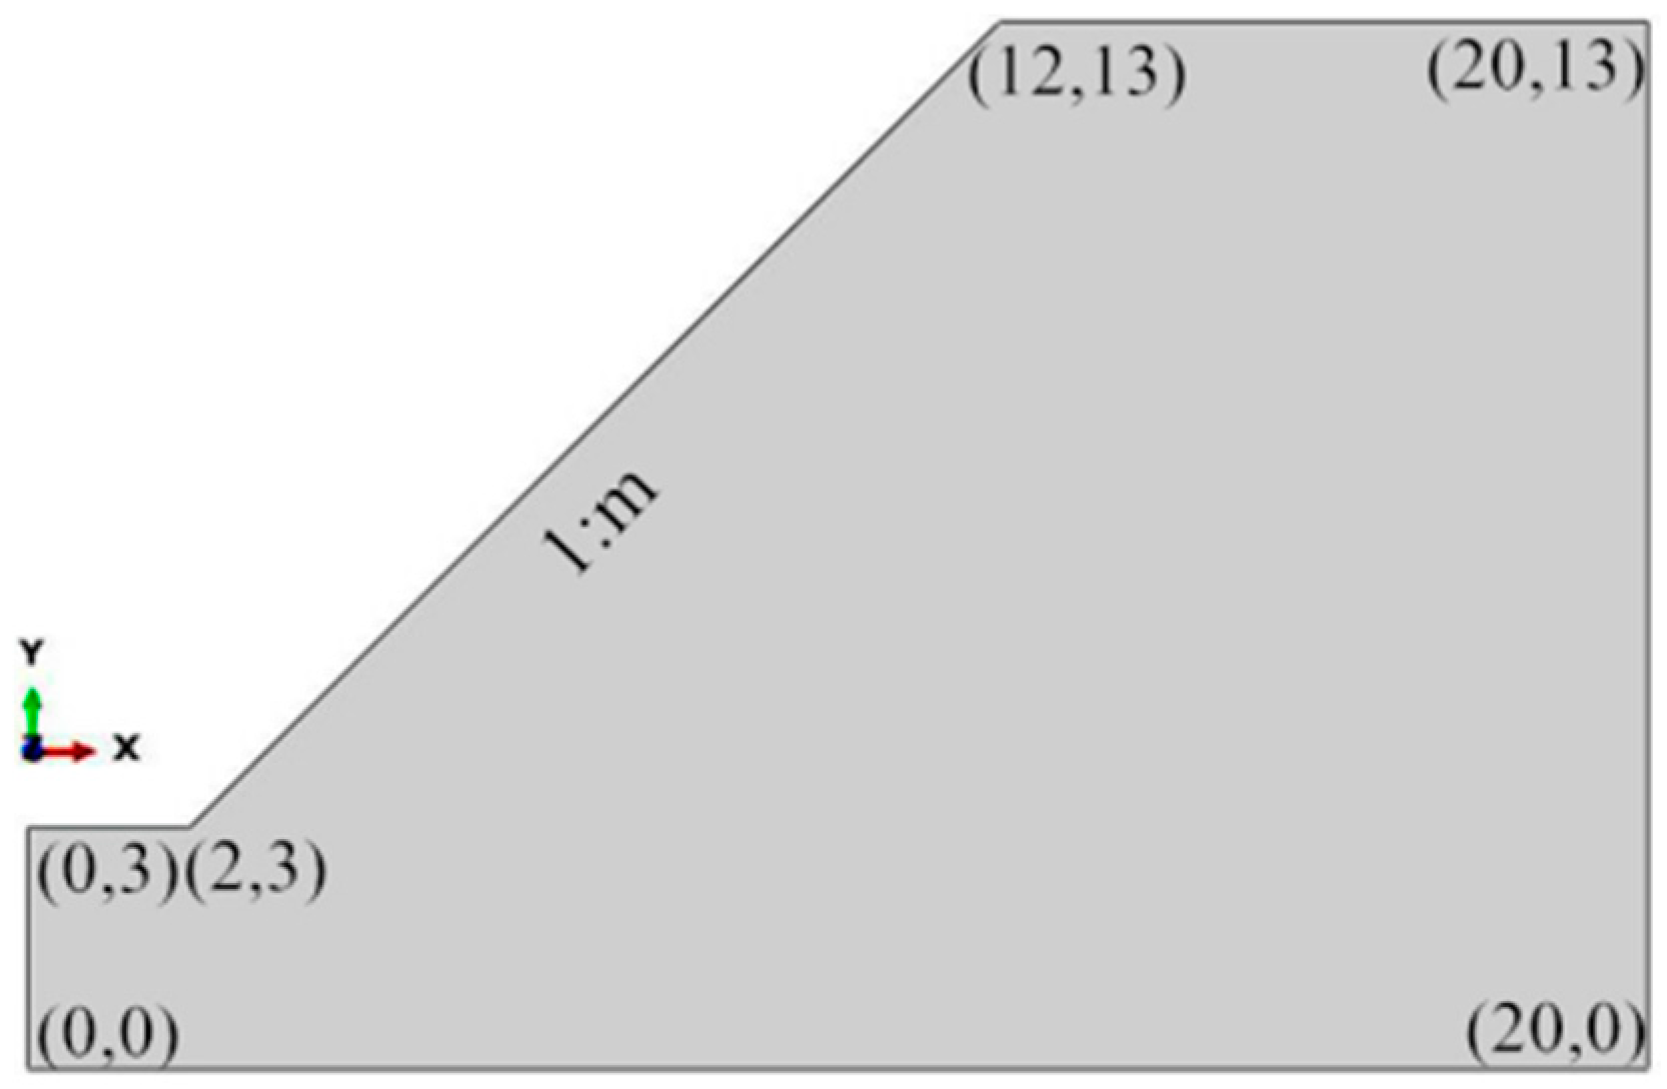
Figure 3.
Trend graph of slope safety factor Fr with freeze-thaw cycles N.

Figure 4.
Trend graph of slope safety factor Fr with initial moisture content w.
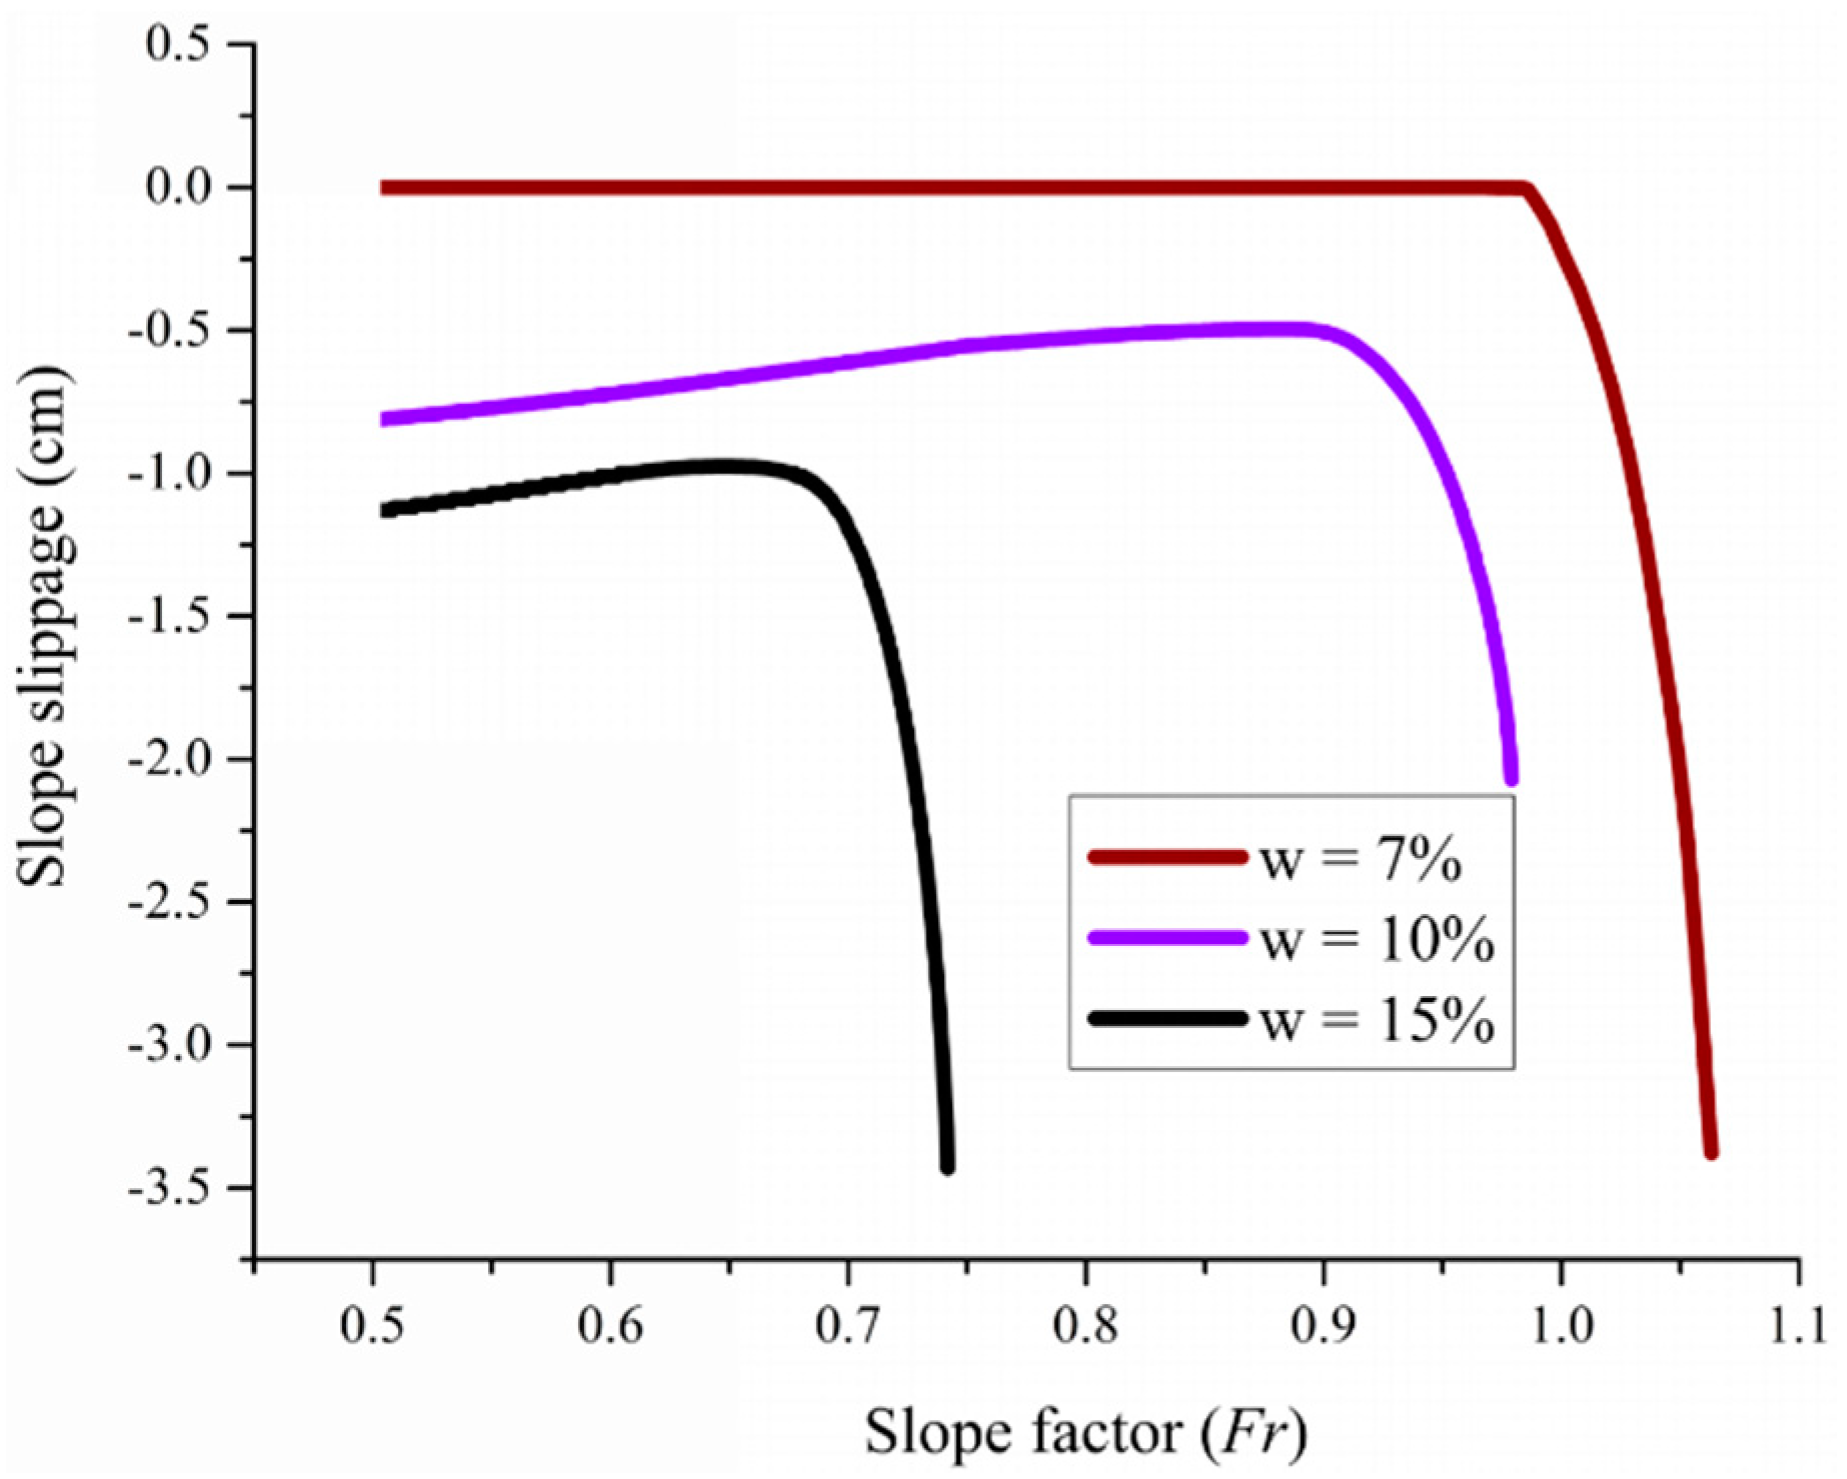
Figure 5.
Trend graph of slope safety factor Fr with gradient m.

Figure 6.
Trend graph of slope safety factor Fr with grading series.
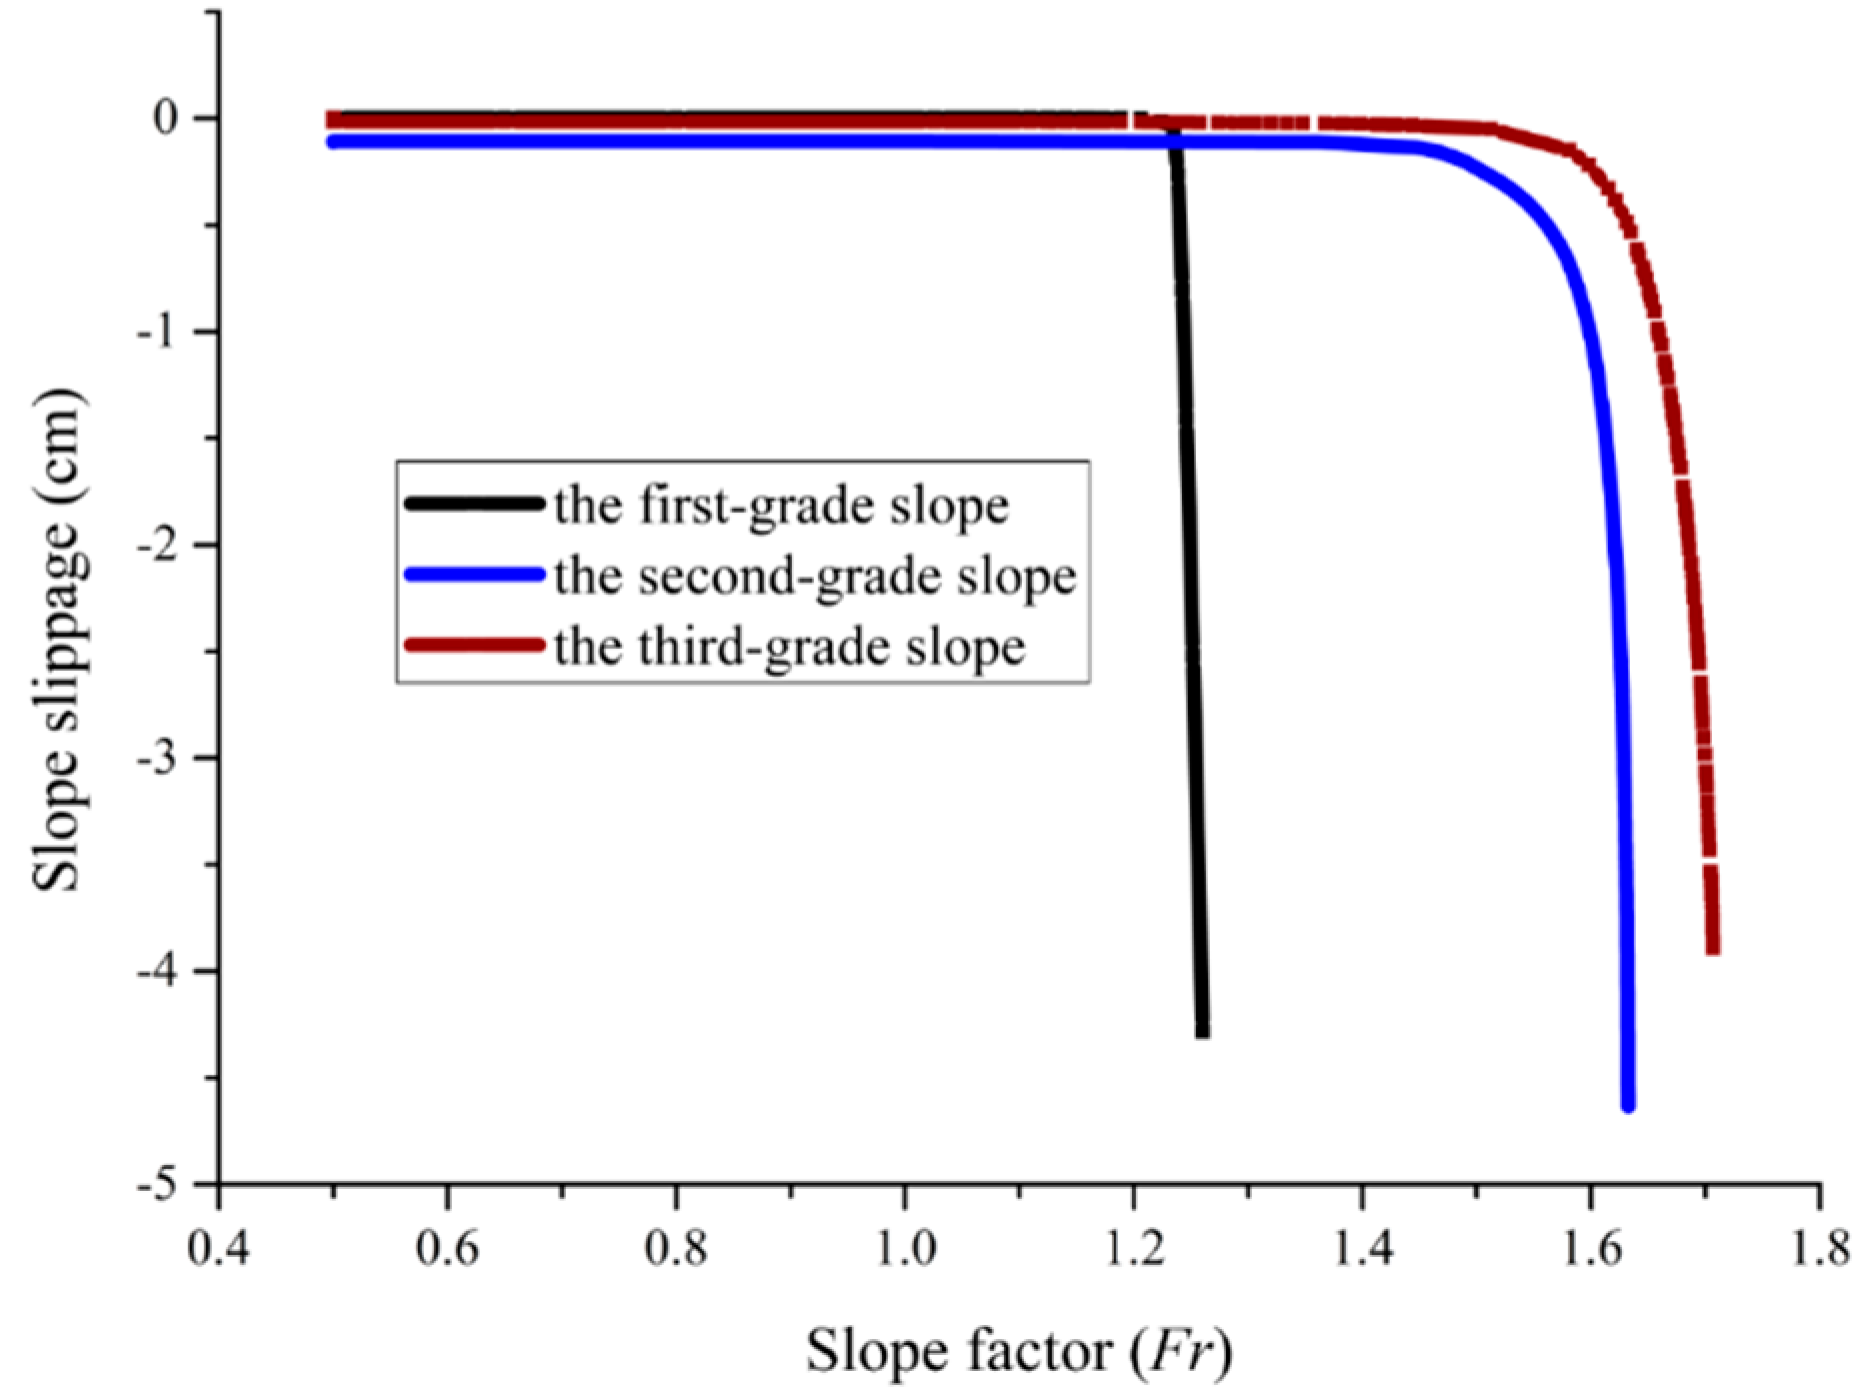
Figure 7.
Cloud map of equivalent plastic zone of instability of cutting slope at room temperature.

Figure 8.
Cloud map of equivalent plastic zone of instability of cutting slope after 50 freeze-thaw cycles.
Figure 8.
Cloud map of equivalent plastic zone of instability of cutting slope after 50 freeze-thaw cycles.
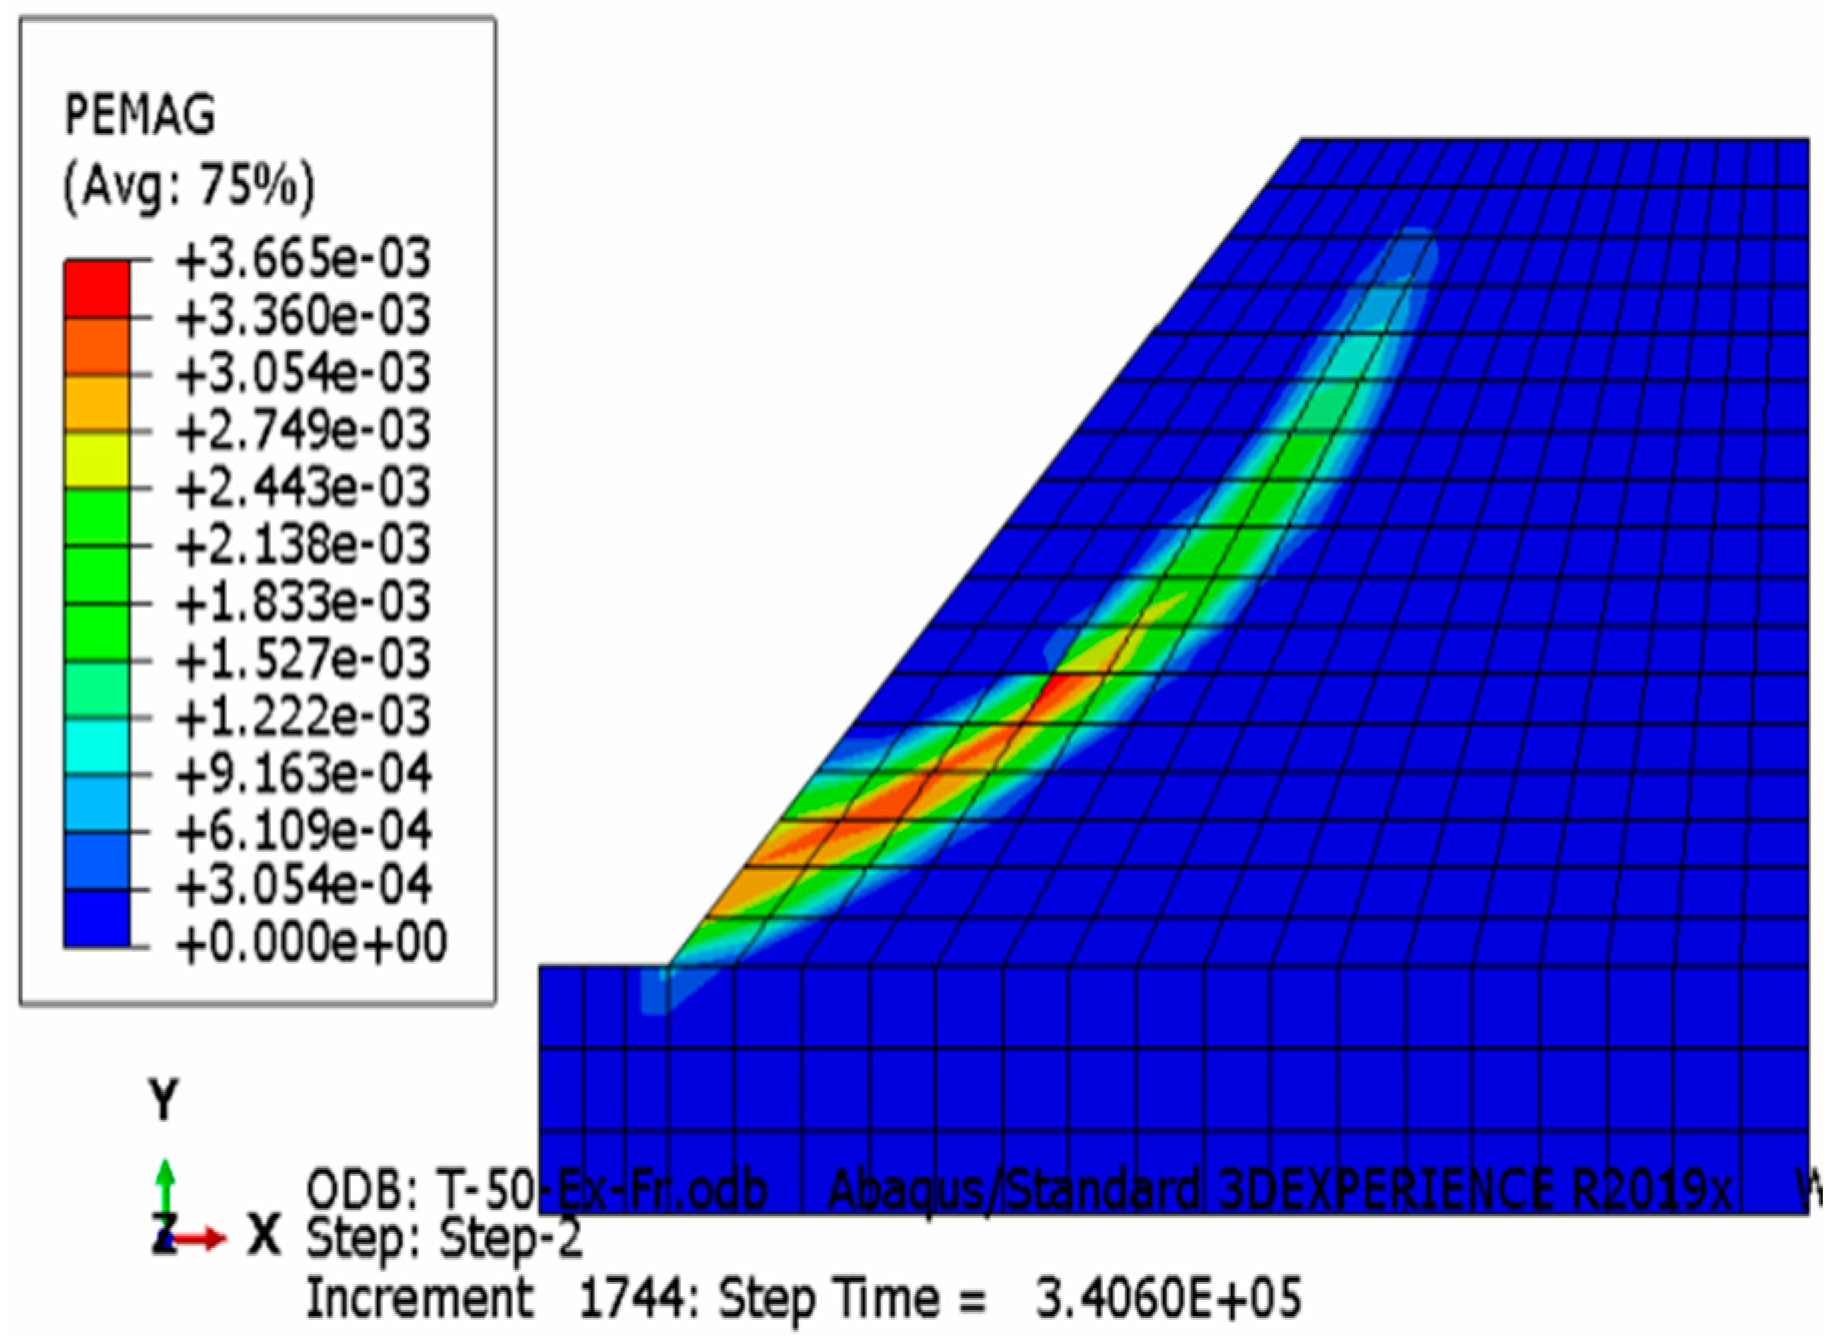
Figure 9.
Displacement cloud diagram when slope is unstable at room temperature.

Figure 10.
Displacement cloud diagram when slope is unstable after 50 freeze-thaw cycles.

Figure 11.
Stress cloud diagram of slope instability at room temperature.

Figure 12.
Stress cloud diagram of slope instability after 50 freeze-thaw cycles.
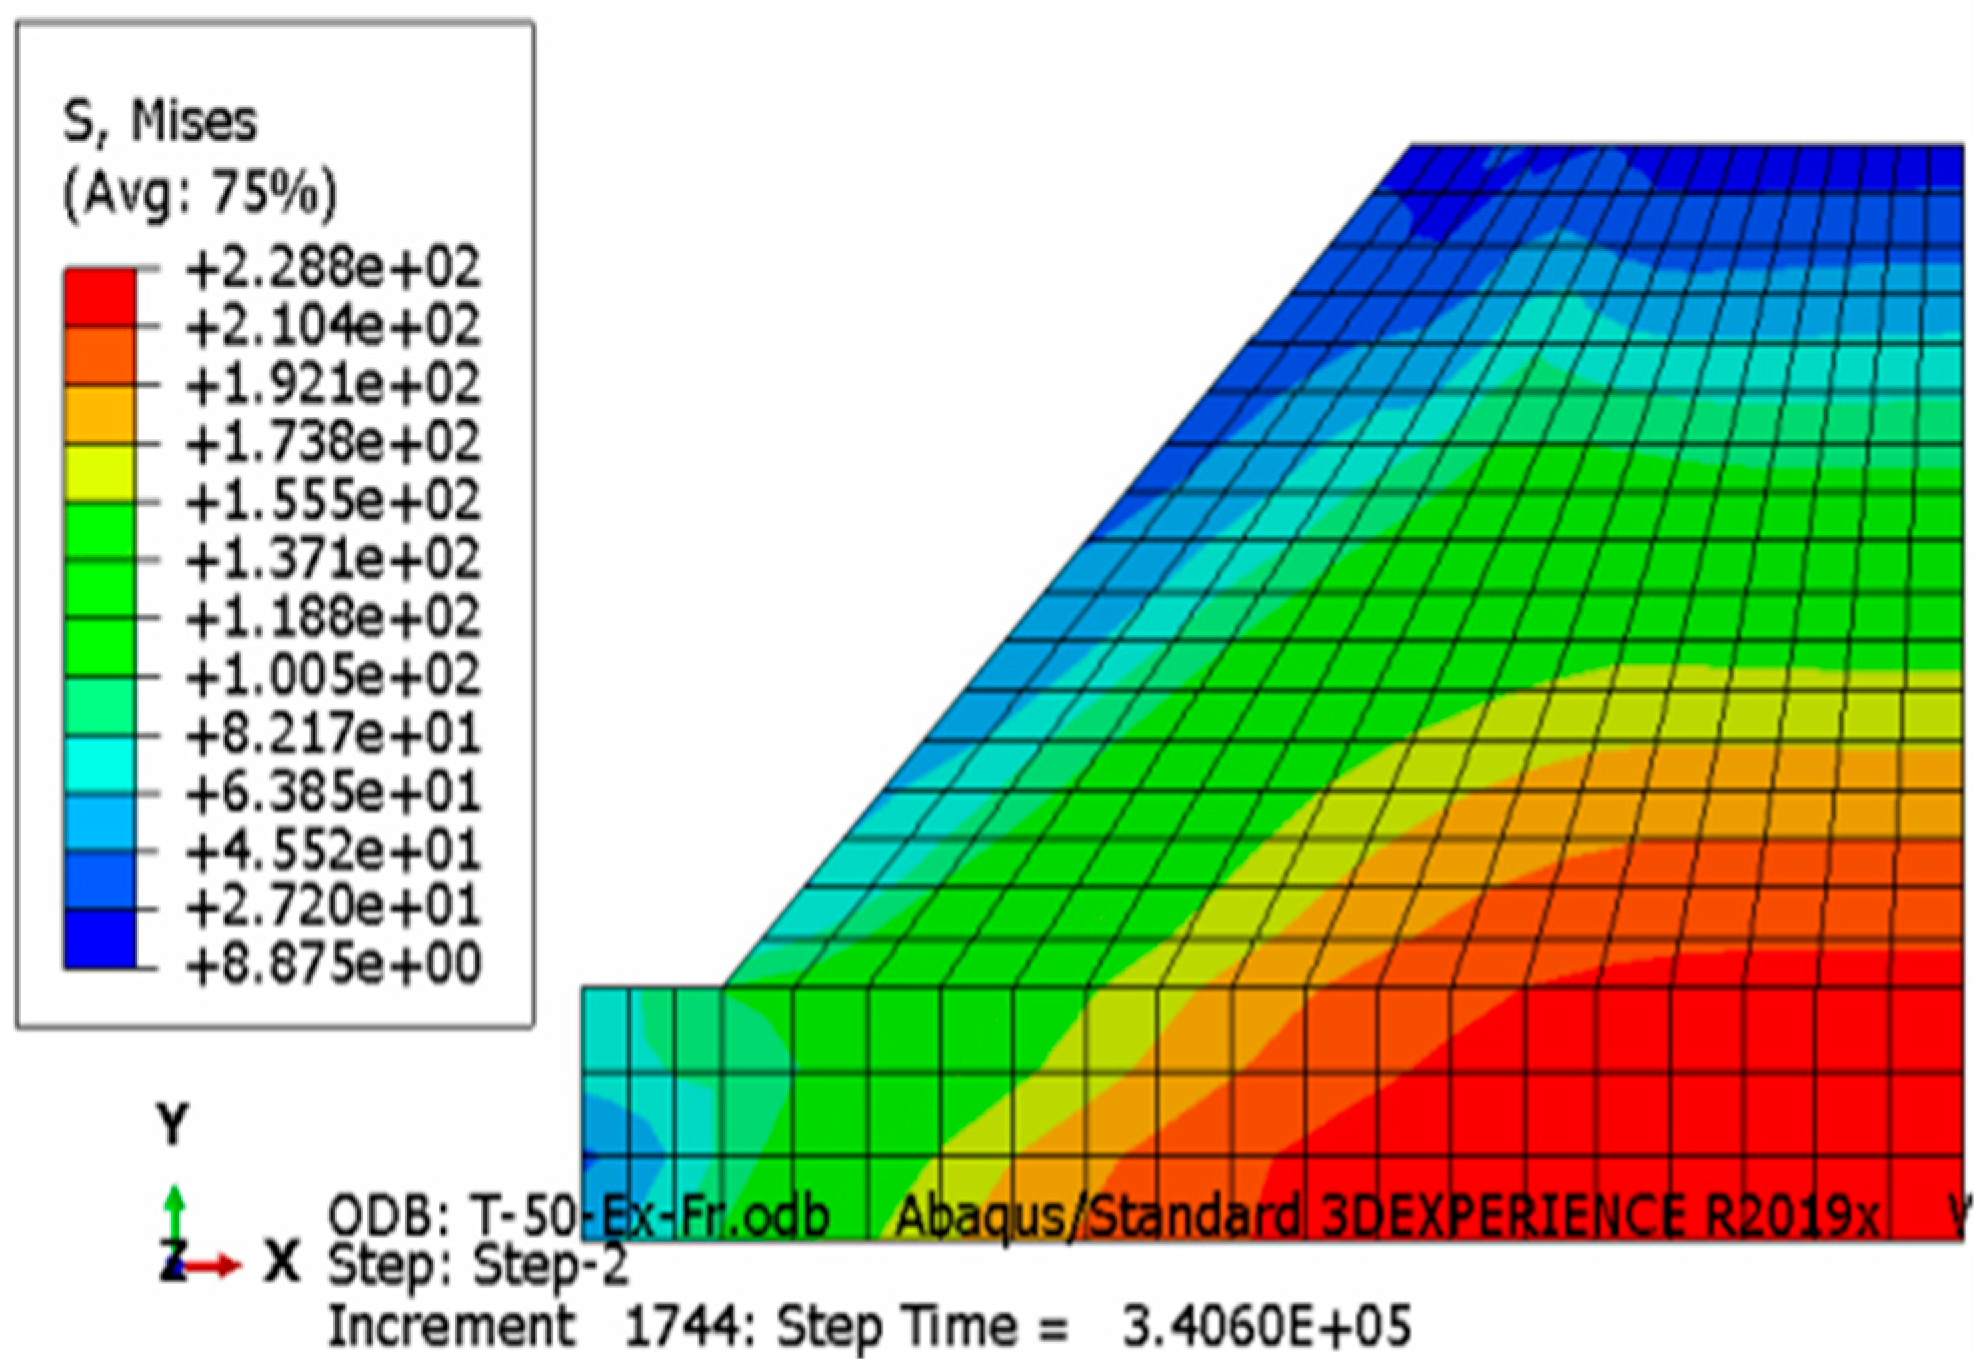
Figure 13.
Physical map of the cutting slope. (a) The exposed ice can still be seen in the slope in summer due to the high ice content. At the same time, this also illustrates a serious problem, that is, the slope is melting. (b) In order to capture the dynamic change process of the slope during the freeze-thaw cycles, we set landmarks on the slope and continued to collect data throughout the year, including winter. (c) The freeze-thaw cycles result in a down-slope creeping of the shallow soil layer, leading to progressive slope failure.
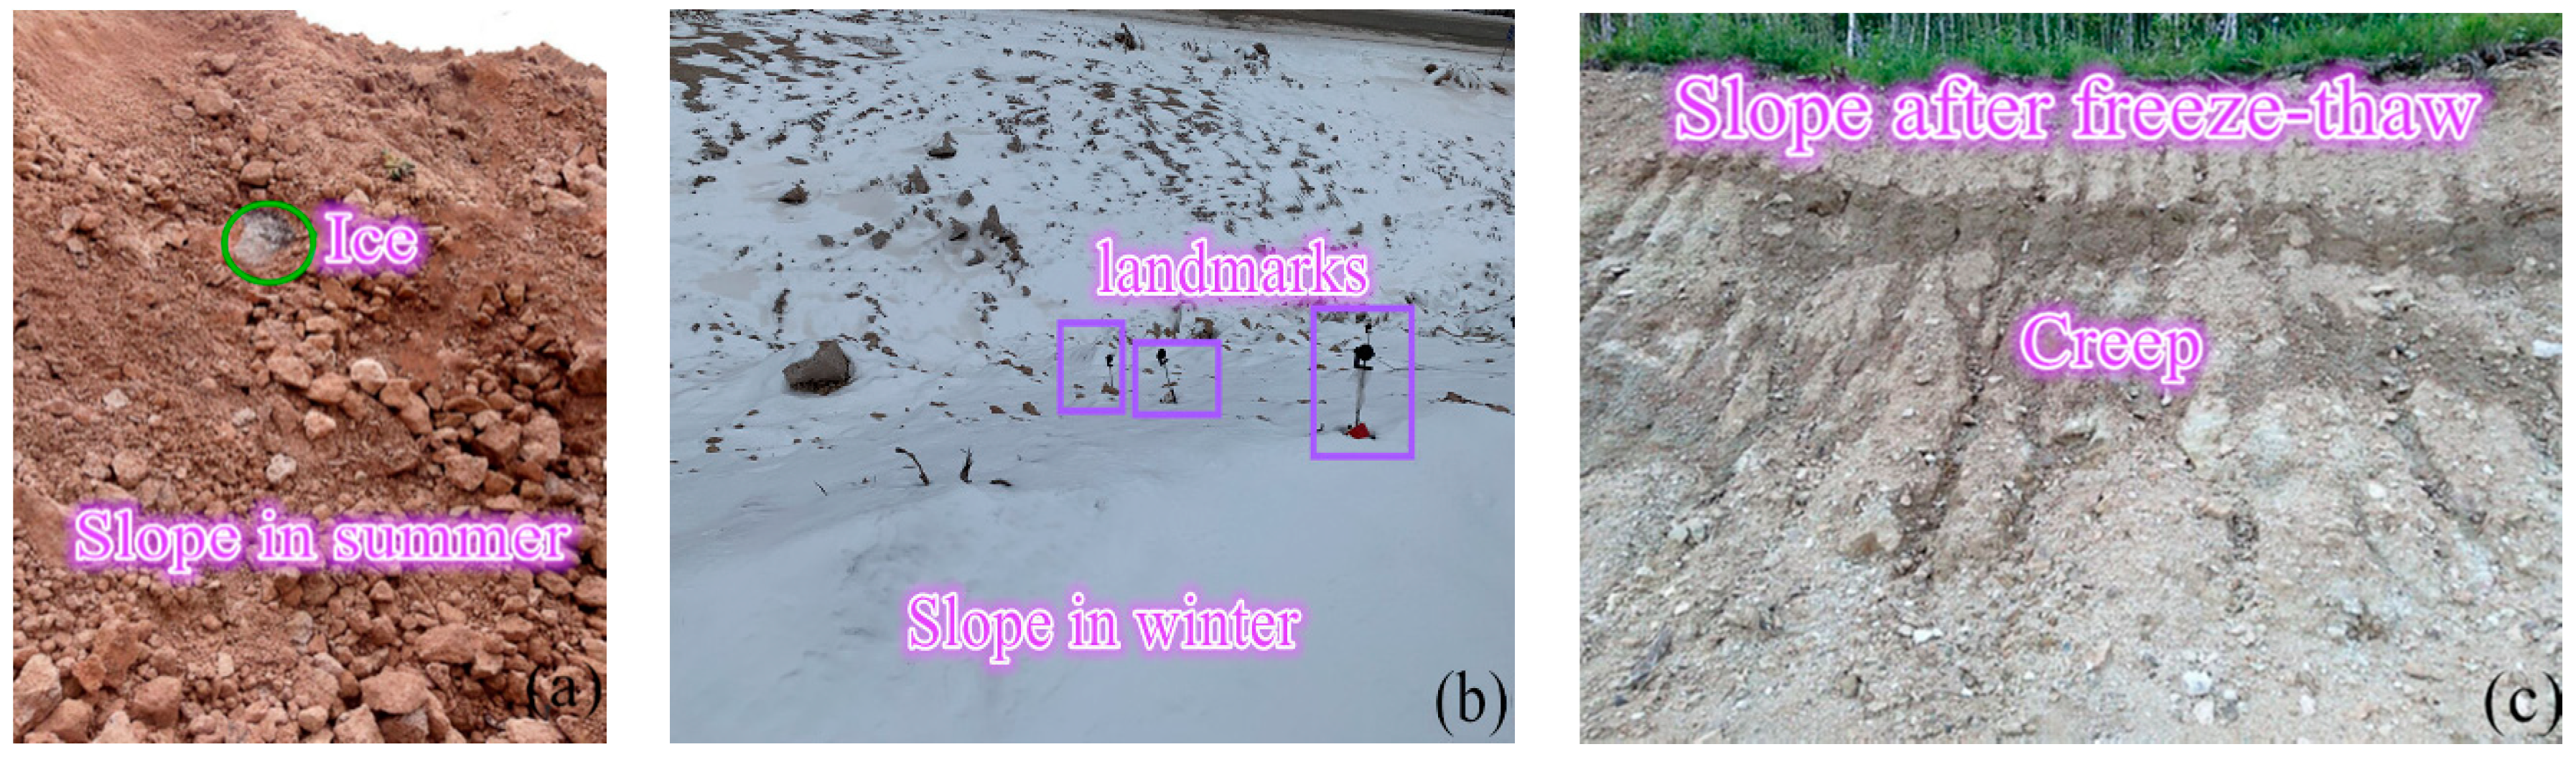
Figure 14.
Landmarks placed on the first-grade slope.

Figure 15.
Vertical angle change charts of landmarks on the first-grade slope.

Figure 16.
Height difference change charts of landmarks on the first-grade slope.


Table 1.
Strength values of specimens after different freeze-thaw cycles.
| Number of Freeze-Thaw Cycles (N) | Compression Modulus E (GPa) | Maximum Force (KN) | Compression Strength (GPa) |
|---|---|---|---|
| N = 0 | 2.51 | 68.68 | 38.92 |
| N = 10 | 1.89 | 39.43 | 20.91 |
| N = 20 | 1.43 | 22.83 | 11.63 |
| N = 30 | 0.28 | 10.5 | 5.35 |
| N = 40 | 0.24 | 9.86 | 4.69 |
| N = 50 | 0.03 | 1.36 | 0.73 |
Table 2.
Factors affecting slope stability.
| Influencing Factors | Impact Factor 1 | Impact Factor 2 | Impact Factor 3 |
|---|---|---|---|
| Number of freeze-thaw cycles | 2.51 | 68.68 | 38.92 |
| Initial moisture content | 1.89 | 39.43 | 20.91 |
| Slope factor | 1.43 | 22.83 | 11.63 |
| Grading series | 0.28 | 10.5 | 5.35 |
Table 3.
Physical and mechanical parameters of specimens in slope.
| Density/(kg/m3) | Water Content/(%) | Cohesion/(kPa) |
| 1967 | 6.92 | 2.88 |
| Internal Friction Angle/(°) | Linear Expansion Coefficient/(10–6) | Thermal Conductivity/(W/m × K) |
| 27.3 | 9.73 | 0.48 |
| Specific Heat Capacity/J/(g °C) | Elastic Modulus/(GPa) | Compressive Strength/(GPa) |
| 0.856 | 2.51 | 38.92 |
© 2020 by the authors. Licensee MDPI, Basel, Switzerland. This article is an open access article distributed under the terms and conditions of the Creative Commons Attribution (CC BY) license (http://creativecommons.org/licenses/by/4.0/).
Share and Cite
MDPI and ACS Style
Zhao, Y.; Wang, L.; Li, H. Effect of Freeze-Thaw on the Stability of a Cutting Slope in a High-Latitude and Low-Altitude Permafrost Region. Appl. Syst. Innov. 2020, 3, 36. https://doi.org/10.3390/asi3030036
AMA Style
Zhao Y, Wang L, Li H. Effect of Freeze-Thaw on the Stability of a Cutting Slope in a High-Latitude and Low-Altitude Permafrost Region. Applied System Innovation. 2020; 3(3):36. https://doi.org/10.3390/asi3030036
Chicago/Turabian StyleZhao, Yuxia, Liqun Wang, and Han Li. 2020. "Effect of Freeze-Thaw on the Stability of a Cutting Slope in a High-Latitude and Low-Altitude Permafrost Region" Applied System Innovation 3, no. 3: 36. https://doi.org/10.3390/asi3030036