The Predictive Value of Data from Virtual Investment Communities


1
Information Systems & Information Management, Goethe University, 60323 Frankfurt, Germany
2
Information Systems & E-Services, Darmstadt University of Technology, 64289 Darmstadt, Germany
*
Author to whom correspondence should be addressed.
Mach. Learn. Knowl. Extr. 2021, 3(1), 1-13; https://doi.org/10.3390/make3010001
Submission received: 23 November 2020
/
Revised: 15 December 2020
/
Accepted: 19 December 2020
/
Published: 23 December 2020
(This article belongs to the Section Data)
Abstract
:Optimal investment decisions by institutional investors require accurate predictions with respect to the development of stock markets. Motivated by previous research that revealed the unsatisfactory performance of existing stock market prediction models, this study proposes a novel prediction approach. Our proposed system combines Artificial Intelligence (AI) with data from Virtual Investment Communities (VICs) and leverages VICs’ ability to support the process of predicting stock markets. An empirical study with two different models using real data shows the potential of the AI-based system with VICs information as an instrument for stock market predictions. VICs can be a valuable addition but our results indicate that this type of data is only helpful in certain market phases.
1. Introduction
Related research that focuses on prediction models for stock markets shows regularly unsatisfactory performance of these models [1] and in consequence such inaccurate predictions can lead to economic losses. Investors therefore have an interest in accurate predictions that not only minimize their losses but are also able to generate economic value. As a result, we observe in business practice a technological arms race that tries to improve prediction models [2]. Accurately predicting stock prices is a key basis for investment decisions by institutional investors [3]. However, the problem is that financial markets are very complex, which makes it difficult to develop appropriate prediction models [4].
For these models new pieces of information could be relevant for prediction. Especially sources of information that have not been examined yet seem promising. Virtual Investment Communities (VICs) have the ability, as an information platform, to influence investor decisions [5] or can be used to significantly improve portfolio allocation [6] and could thus serve as additional source of information for prediction models. We define VICs as a virtual community where communication technologies are used [7] to share knowledge [8] with respect to investing topics. Examples for such VICs are “Sharewise”, “Swipestox” or “Wikifolio”. Previous information systems (IS) research has largely focused on VICs Networks. However, there is as yet little understanding of the information content in VICs in the context of prediction. The objective of this paper is therefore to close this gap. The aim of this paper is to assess the predictive value of data that users in VICs share. To answer this question, we compare the predictive performance of a deep learning model that uses VIC information to a baseline model that does not use these data. Although recent studies have examined the community features of VICs, we are the first to assess the predictive value of VICs information.
The remainder of the paper proceeds as follows: The next section focuses on previous research on VICs and proposes a theoretical framework. The section called “Methods” describes our empirical approach and our model that we apply to forecast the S&P 500 Index. After that, the section called “Results” presents the findings of the model. The last section offers the implications and a discussion of this research.
2. Previous Research
Previous IS research on VICs focuses strongly on the community aspects and is now rather well-understood. For example, Park et al. [5] examines the impact of stock recommendations on investors. This work shows that investors exhibit confirmation bias, whereby they preferentially react on messages from VICs that support their prior beliefs. The work of Nofer and Hinz [9] examines the performance of recommendations in VICs versus analysts’ recommendations. The results show that users make an annual return based on VIC recommendation that is on average 0.59% higher than annual returns based on recommendations by banks, brokers and professional analysts.
Most relevant to this study is the work by Gottschlich and Hinz (2014) [6], that shows that data from VICs can lead to a superior portfolio allocation. The authors suggest a decision support system that enables investors to include the VICs recommendations in their investment decisions and use it to manage a portfolio which ultimately leads to higher absolute returns.
These results indicate that VICs can be seen as a source of private information that the market has not fully incorporated. As a result, individual investors, unlike institutional investors, have access to relevant information for the relevant share [5] and these platforms can act as a source of information and can thus be seen as an aggregator of private information. Therefore, it seems plausible that these pieces of private information might improve the predictive accuracy of the corresponding prediction models [10].
Previous research reveals that users share their insights in VICs because they are interested in gaining recognition and reputation, and are less motivated by monetary incentives [6]. The willingness of people to share knowledge for non-monetary reasons is already reflected in earlier research, for example because of a sense of belonging [11], motivation through extrinsic appreciation [12] and the joy of helping and for reasons of reciprocity [13].
Content-wise it is notable that previous research examines the comparability between the recommendations make by professional analysts and recommendations that origin from VICs. Barber et al. (2001) [14] find that purchasing stocks with the most favourable consensus recommendations, in conjunction with daily portfolio rebalancing and a timely response to recommendation changes, yield annual abnormal gross returns greater than 4%. In contrast Barniv et al. [15] and Bradshaw et al. [16] arrive at the opposite results. Against this background, it seems questionable whether it makes sense to equate the analysts’ classic work with the platforms’ collective system approach or in other words whether data from VICs carry additional predictive value above and beyond the information that is already in the market, e.g., which is reflected in the analysts’ recommendation.
Moreover, a central question that needs to be addressed in this context is the question whether predictions are possible at all. The efficient market hypothesis by Fama [17] leads to the question to what extent predictions of financial markets are possible at all. The authors suggest that the current price of an asset is the sum of all available and relevant information for market participants [17]. It can thereby be deduced that a pricing process that feeds on new information establishes the price of an asset. The capital market thus instantaneously incorporates new information. The efficiency market hypothesis thus attributes the pricing process to the availability of market-relevant information. This work makes a distinction between three forms of market efficiency: the strong-form efficiency, the weak-form efficiency and the semi-strong-form efficiency.
Grossmann and Stiglitz [18] emphasize that the strong-form is only of theoretical relevance but cannot be found in real markets. Further research shows that we can observe a weak-form efficiency on real capital markets. For instance, the work by Oztekin et al. [19] or Malkiel [20] provides evidence for this finding. However, Neely et. al [21] or Campbell and Thompson [22] discuss the possibility of a semi-strong-form efficiency. In line with this discussion we follow the idea of Essendorfer et al. [2], that technological arms races can make capital markets more efficient. That means that markets transform from one form to another form. Based on these considerations, it is likely that information efficiency in capital markets is undergoing a dynamic development towards the strong-form but has not arrived there yet.
From a research perspective, it is essential to note that both forms allow meaningful prediction models. The difference between the weak-form and the semi-strong-form is the availability of information. We test if VICs information can be classified as a partially private information source. With this assumption, even the semi-strong form would allow for valuable prediction models.
3. Methods
The consideration of the market efficiency hypothesis allows meaningful prediction models if the weak-form efficiency or the semi-strong-form is assumed. In this paper, we start with the assumption that predictions on capital markets are possible. A plethora of papers deal with prediction models in the context of capital markets and use traditional time series analyses or methods from AI for this purpose [23].
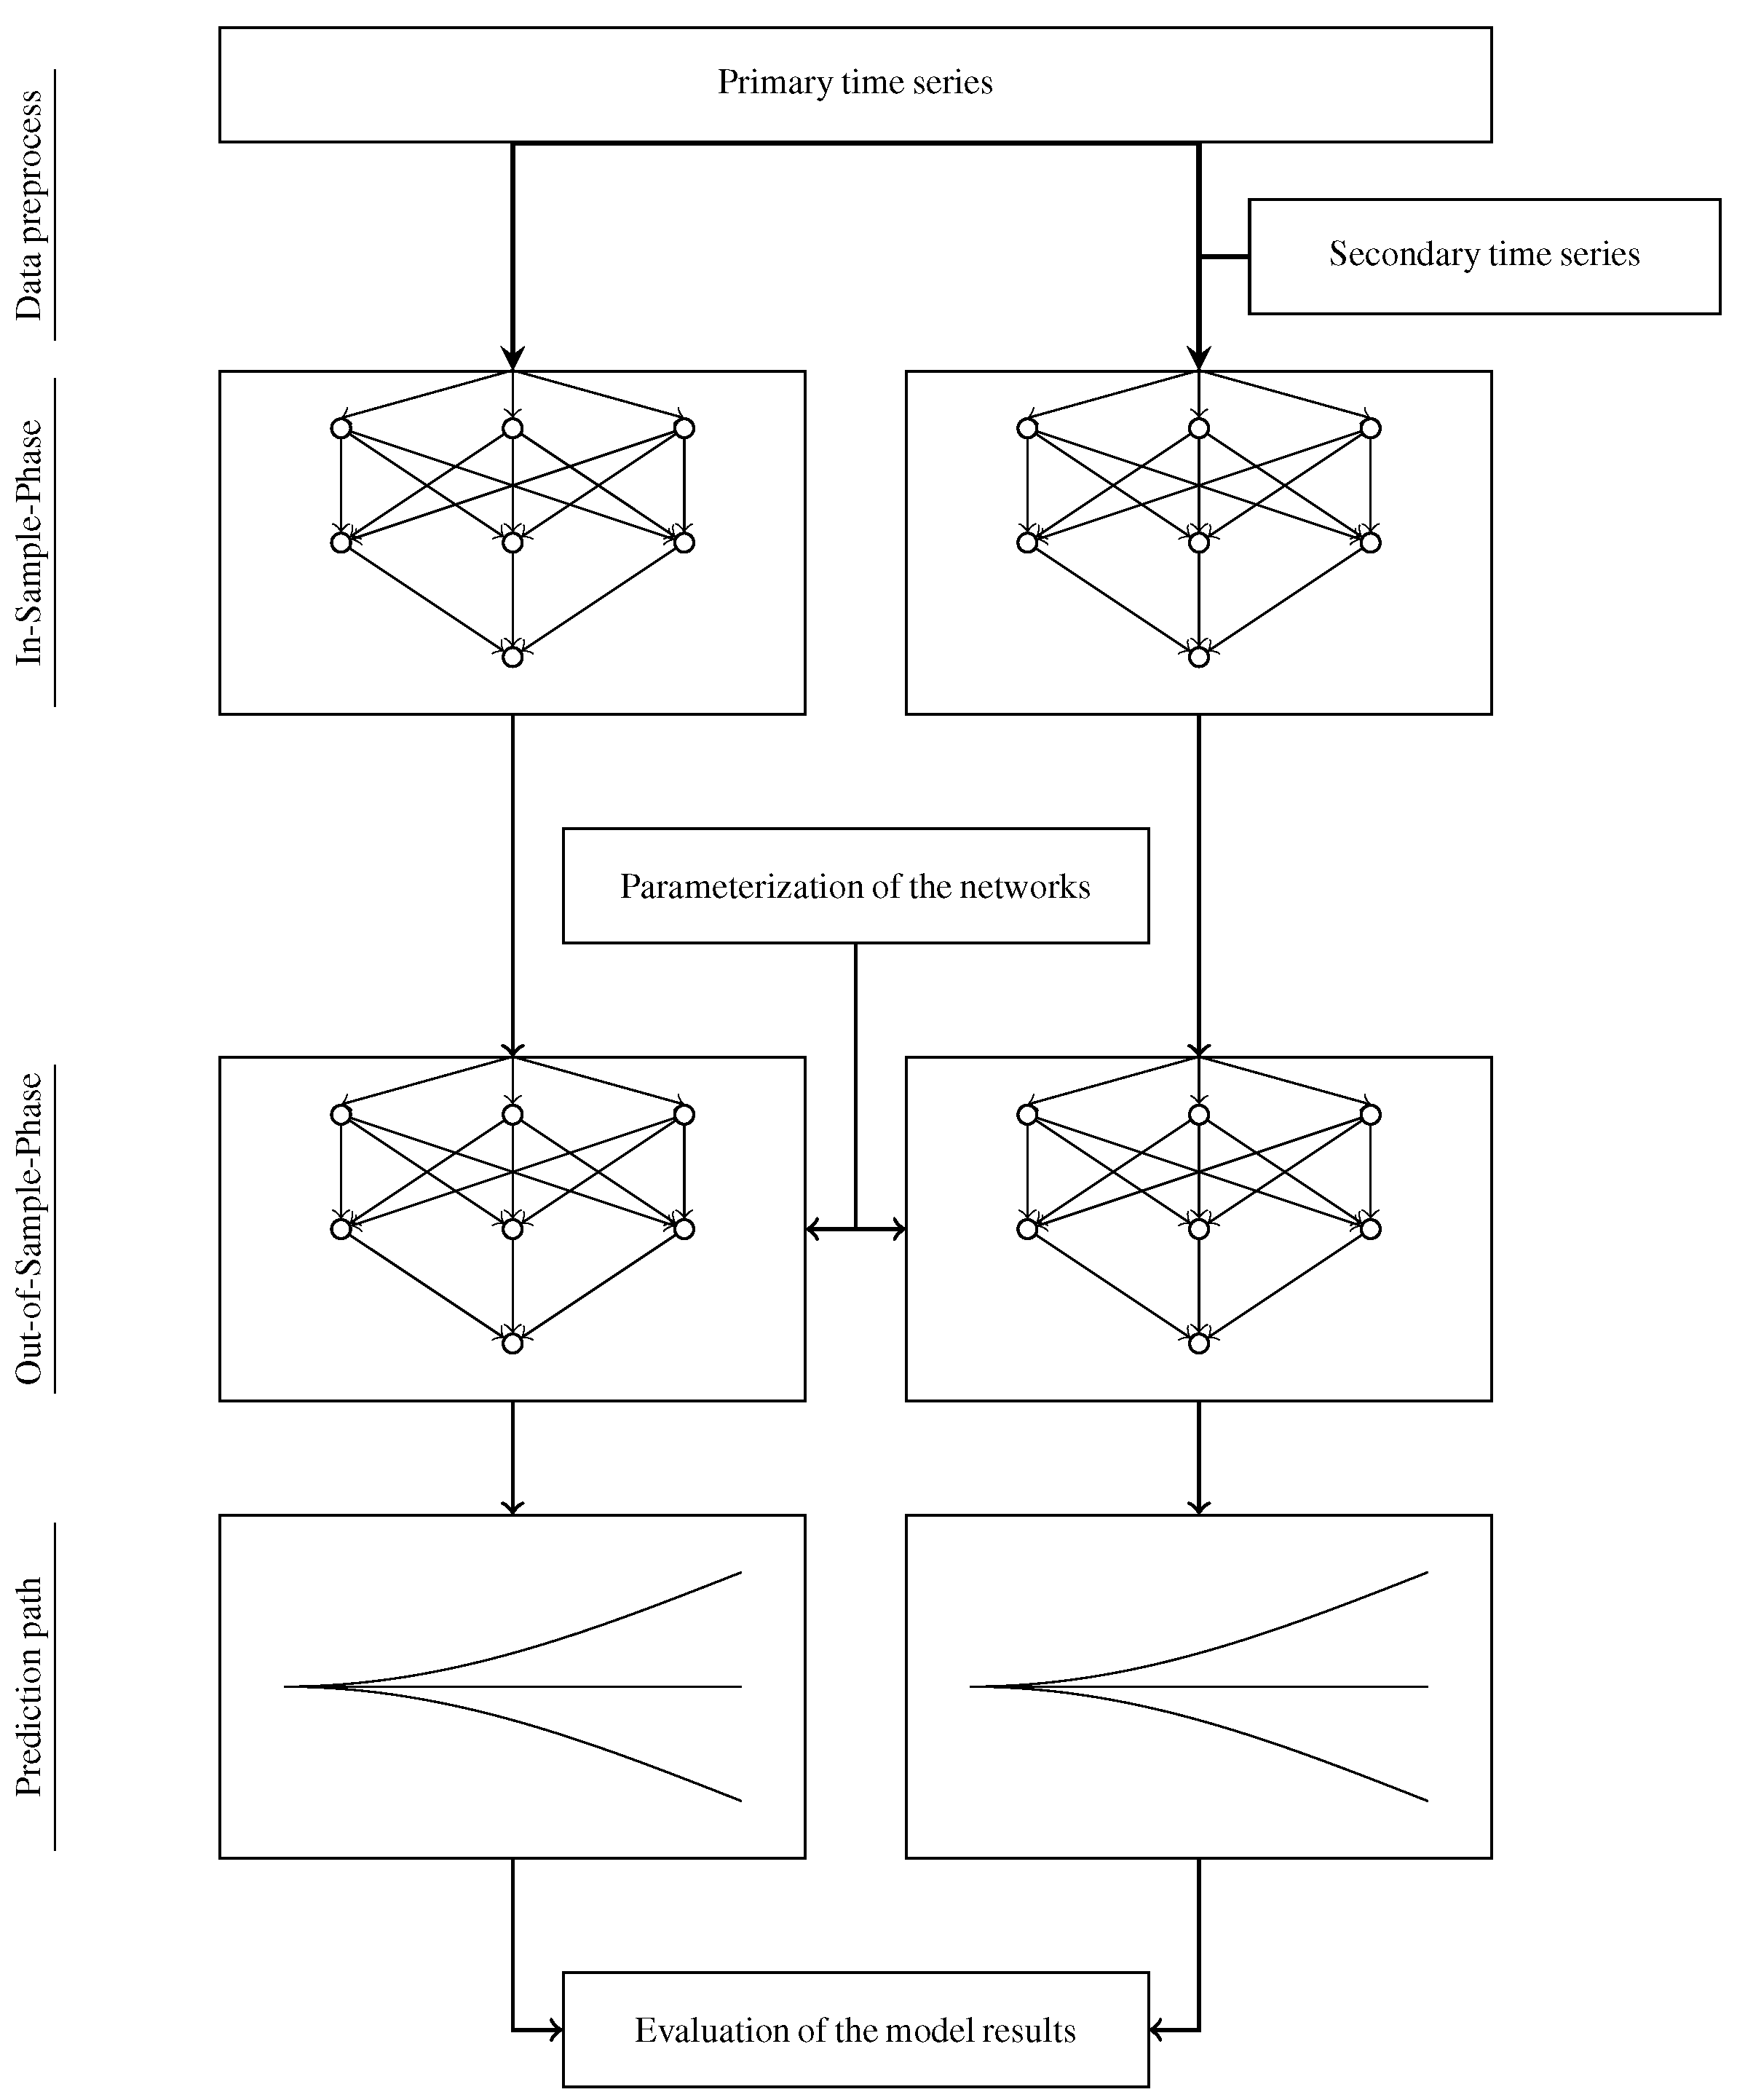
In this paper, we compare a prediction model that uses data from VICs with a baseline model that does not make use of this type of information. The two models are based on Historical Consistent Neural Networks (HCNN) and we assess the impact of VIC data on the performance of the two models. We call the two models Type A (baseline) and Type B (extension). Therefore, Type B gets the additional VIC time series. Figure 1 shows the setup that allows us to compare the two models.
According to Figure 1, this paper compares two structurally equivalent HCNN models to identify the added value of VICs information in the context of stock market prediction. Therefore, HCNN is at the center of both models. The advantage of HCNN, like all machine learning methods, is the ability to learn [24] and these methods demonstrate a superior performance with respect to predictions. The raise of computing power opens up new fields of application for these methods [25], such as face recognition [26], vehicle control [27], program code creation [28] and the ability to recognize human speech and to respond appropriately [29]. Decision makers also use these methods increasingly for decisions on capital markets [30].
The HCNN uses the basic mathematical operation of units to operationalize complex systems. The HCNN premise is to look at a system as a multitude of smaller systems and to anticipate their behaviors [31]. If we transfer this approach to a capital market, it can be broken down as a sum of its individual capital market components in order to explain it. The special feature is the closed modelling of systems according to the premise. The advantage of this model concept is that not every element has to be modelled because the necessary information is provided by the subsystems themselves. In contrast to other approaches, such as multi-agent systems, this does not necessarily simulate a respective capital market players and their trading interactions in a capital market. Starting from the intended modelling of a closed system as sum of its partial systems, the system description is the sum of its observables [32]. The state variables can be understood as a vector combination. Thus, the sum of the vectors produces the total system, in our case the capital market. Also each vector is the result of the specific time series.
Each of these time series thus results in an observable . The introduction of hidden state variables derives from the need to capture potential interactions that are not described explicitly by the time series. The complexity of a system can be minimized by the divide-and-conquer process in which the capital market is the complete system. This complete system is also the sum of the interaction of various subsystems. However, previous literature is relatively quiet on the determination of a suitable number of hidden neurons which leaves some degrees of freedom for the modeller.
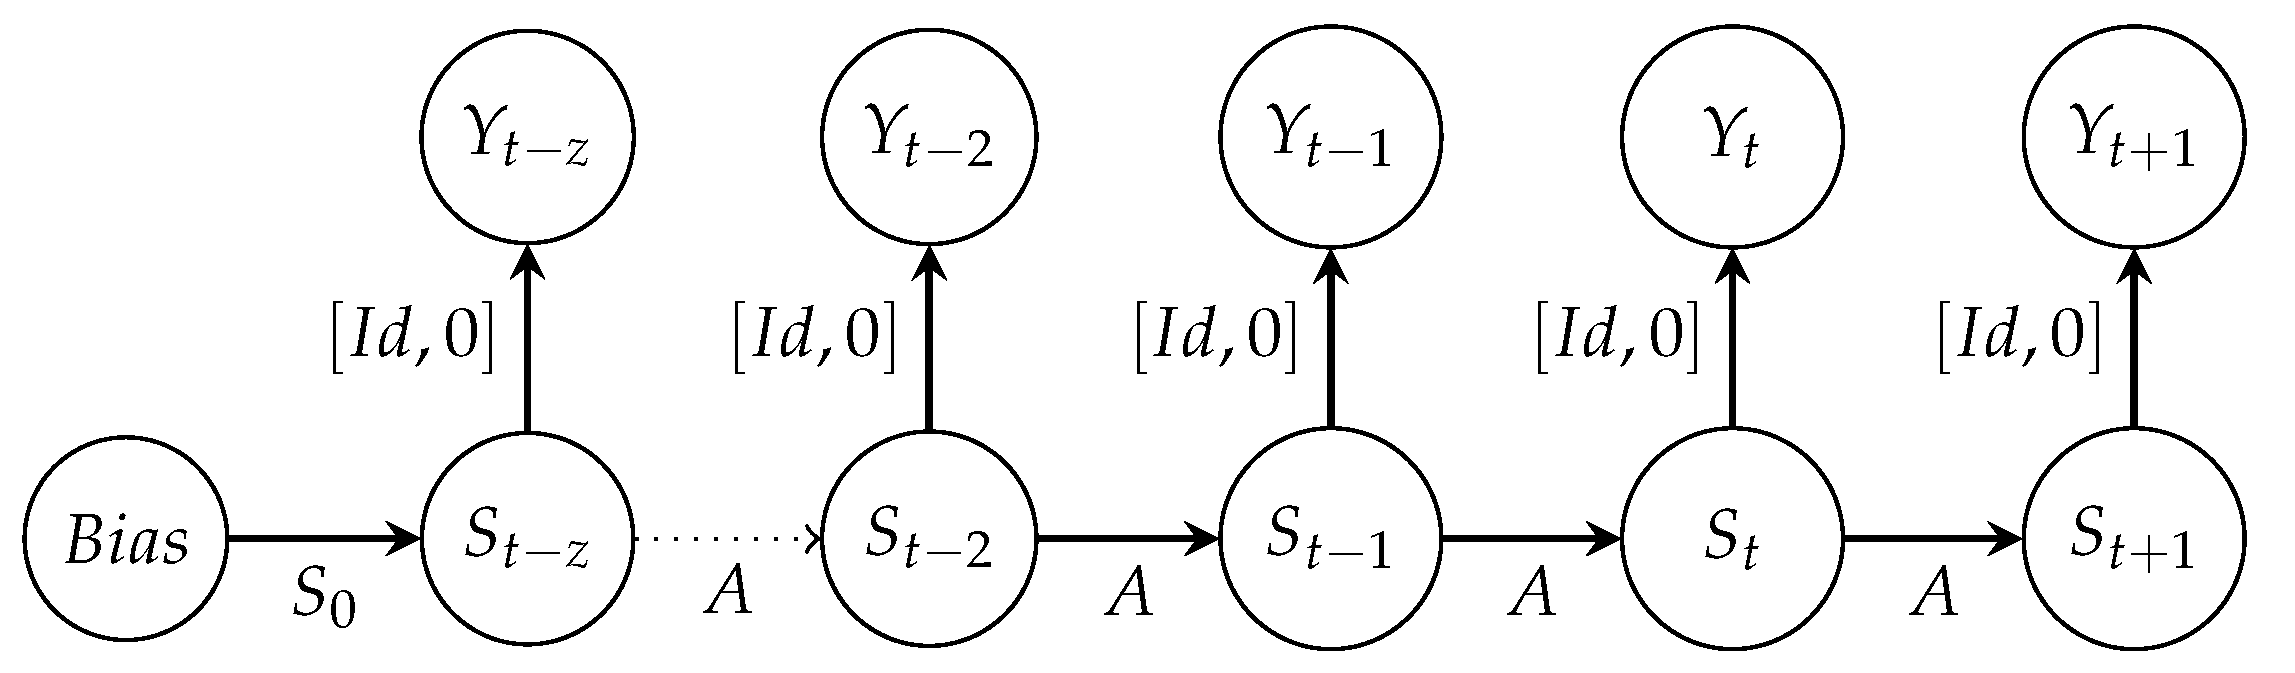
The combinations of and at any given time result in the total system in their addition. Thus, the dynamics of the entire system derive from the historical observations by the HCNN [33]. The state of the total system is the result of the combination of the vectors and at a particular time. The next system state obtains by multiplying the respective observable by the -dimensional weighting matrix A.
Figure 2 illustrates the implementation of the system transitions at the neuron level.
Figure 2 depicts that each system state results from the previous system states. Here, we extract the explicit observables via the extended identity matrix . These individual components make up the entire network architecture. We use this network architecture for our prediction models. In the in-sample phase, this paper follows the standard pre-processing to find caps or to reduce the estimation variance [36].
It is important to know that HCNN belongs to the family of Deep learning models. Deep learning is a collective term for a particular type of machine learning method [37]. Deep learning is usually based on Artificial Neural Networks (ANNs) with multiple layers of neurons. An ANN is a computer-simulated system of neurons connected by weighted links [38] where the neurons are an elementary component. These neurons exchange information with other neurons via direct connection after activation. Researchers and business practitioners controversially discuss these new methods because their black box approach often does not lead to theoretical or managerial insights. However, in this work, we assume that if this deep learning yields an additional gain by incorporating VICs, this will be reflected in better prediction values. This premise enables the automation of the evaluation of large amounts of data.
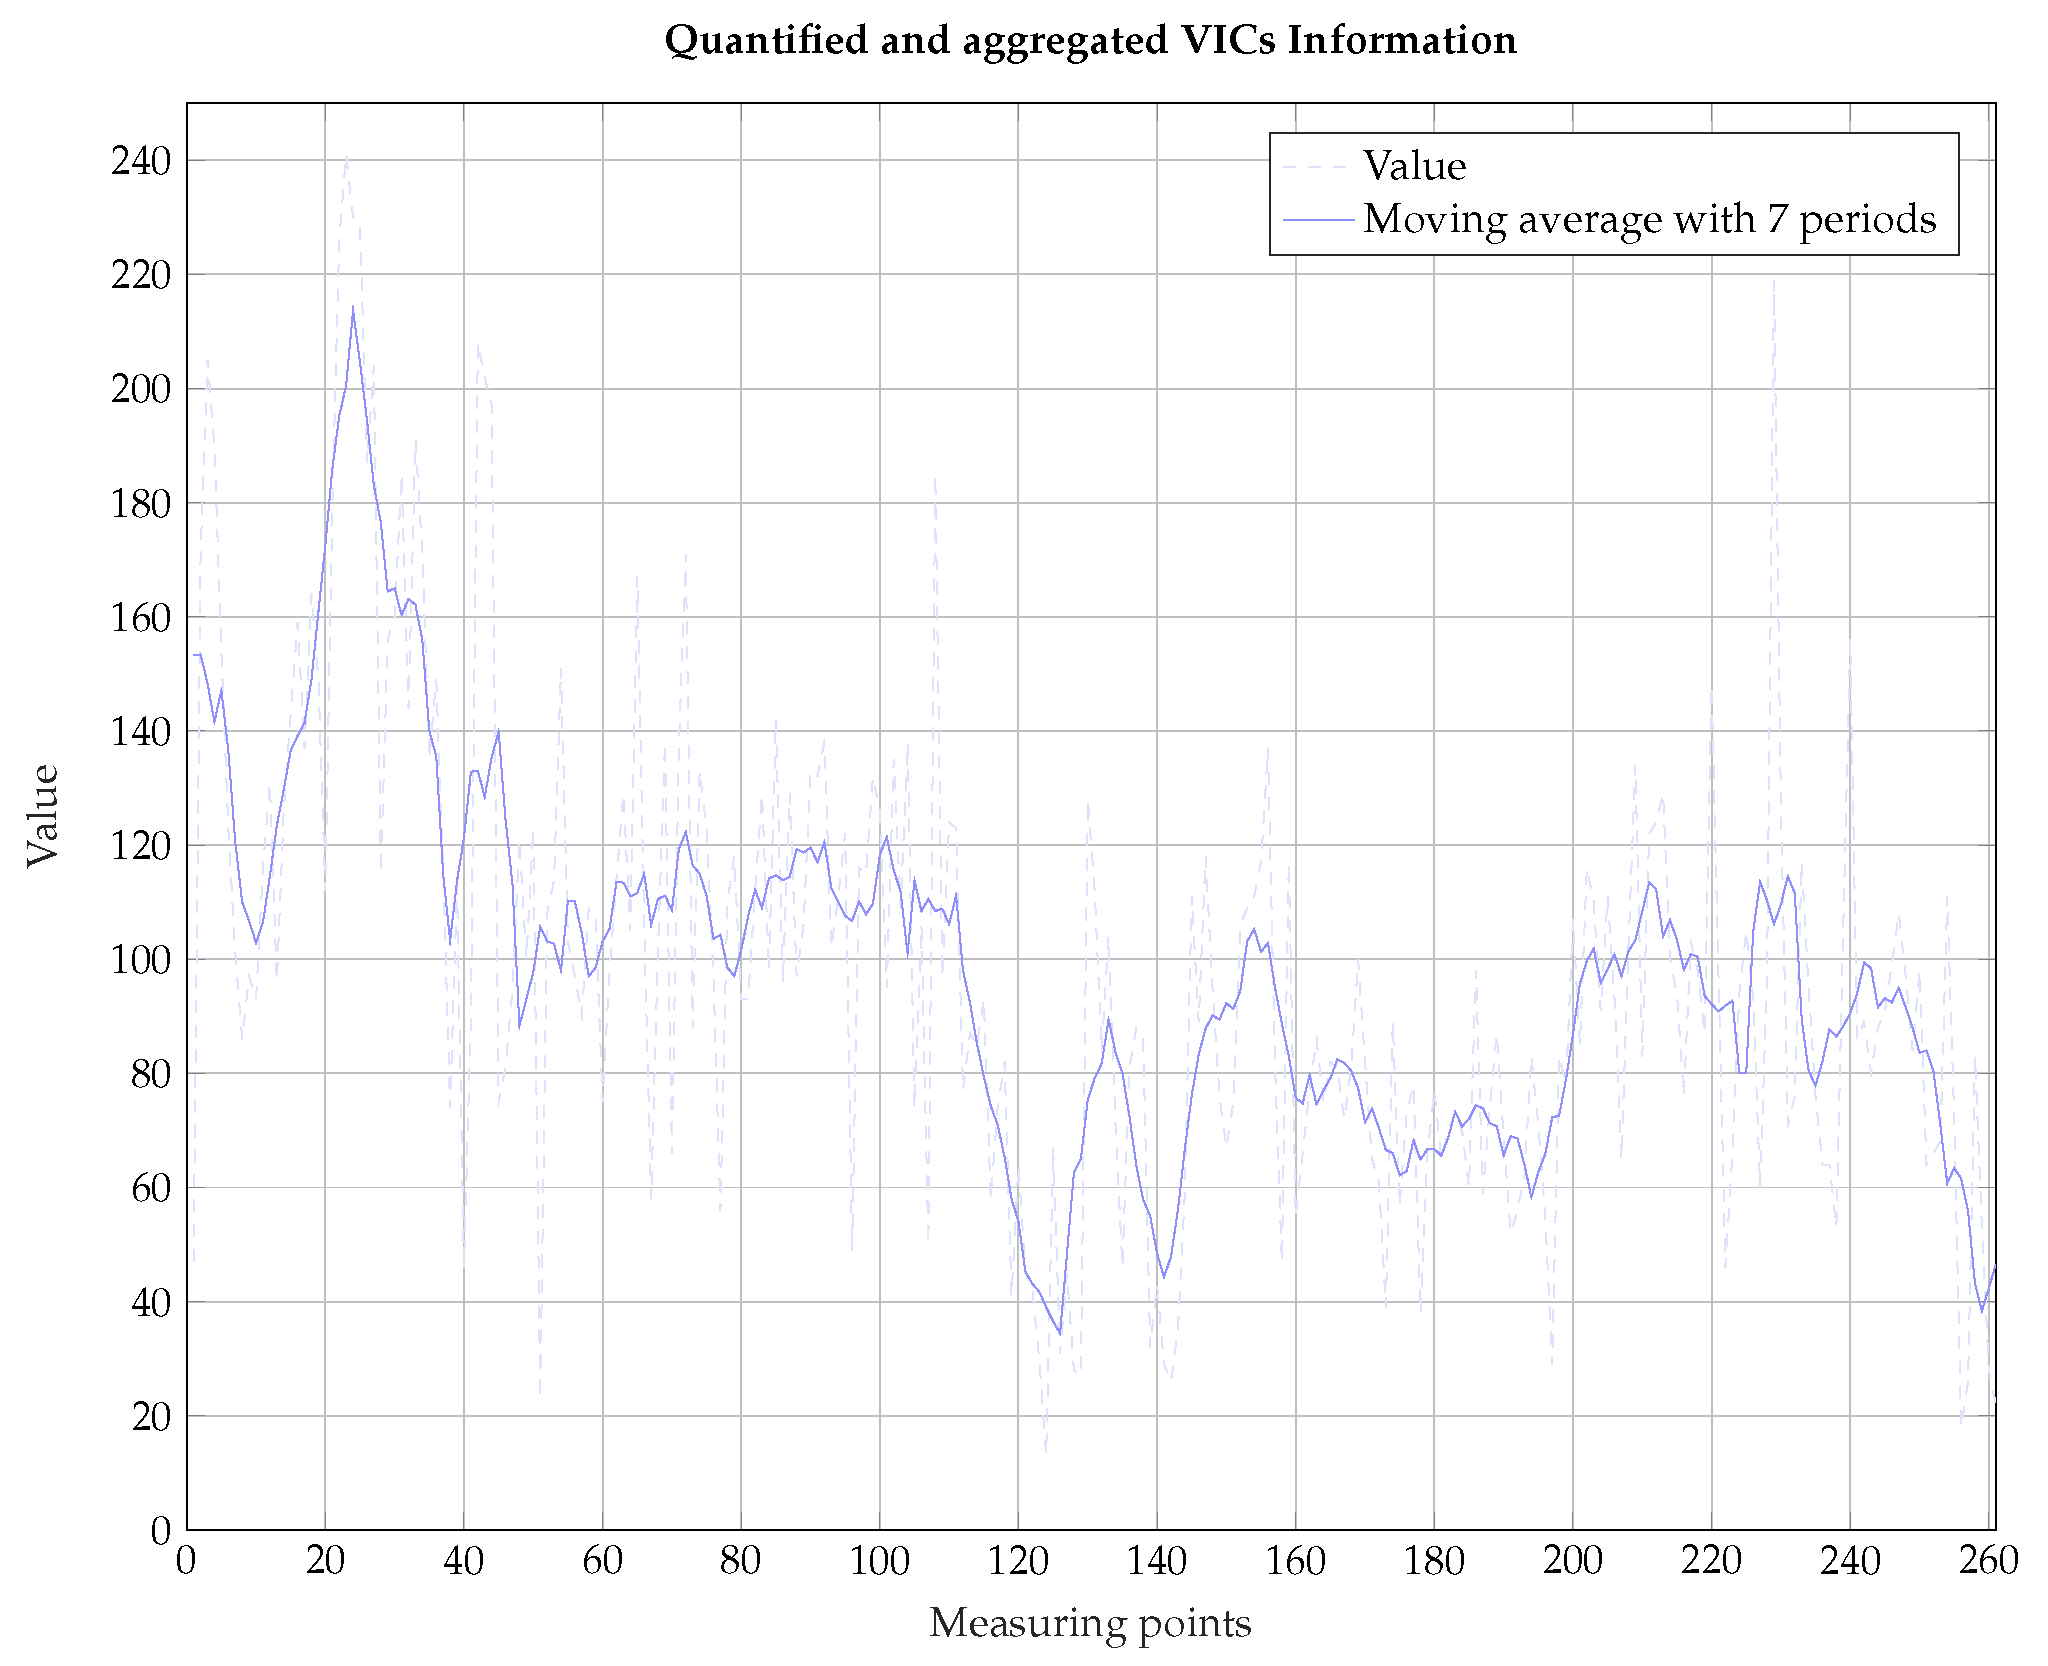
Our study uses data from a VIC called “Sharewise”. We use recommendations from “Sharewise” to see if they comprise information with additional predictive value. The recommendations can be “strong sell”, “sell”, "hold", “buy” and “strong buy” which we transform to values between −2 and +2. Critical is the aggregation of all available opinions about the totality of assets at a time in order to derive a general market sentiment from them. On the one hand, subjective influence will be normalized. On the other hand, this procedure aggregates the availability VICs-data to approximate the S&P 500 index. The use of specific recommendations for this index is important for the prediction of the S&P 500. However, these data are not available at the time of research because the aggregated opinions on the S&P 500 are not saved according to the information provided by “Sharewise”. Figure 3 shows the quantified and aggregated VICs information for all shares in the S&P 500 index from “Sharewise”.
The aggregated sentiment based on VICs recommendations starts to drop () at the beginning of the year and then it strives for an euphoric climax (). We observe a high volatility and use the moving averages to depict the trend in the data. Overall the sentiment appears to be getting worse over time. To understand the predictive value of the aggregated sentiment based on VICs recommendations, we predict the S&P 500 for the year 2010. This stock index includes the 500 relevant US companies. Users in the focal VICs discuss the S&P 500 therefore intensively and make a sufficiently large number of recommendations for the stocks in the S&P 500. Thus, the state variables used for this work result from the time series information in the form of the continuous returns r directly. We use values from literature to calibrate the HCNN-network. Table 1 shows the statistical key figures of the data set on a return basis, Table 2 shows the chosen parameters for the HCNN-network ensemble.
To determine the accuracy of the forecasts in the out-of-sample phases, we use the following goodness-of-fit measures. The first measure is the mean square error (MSE) which is given by Formula (3) [40].
Second, we examine the hit ratio which reflects the number of correctly predicted up and down movements.
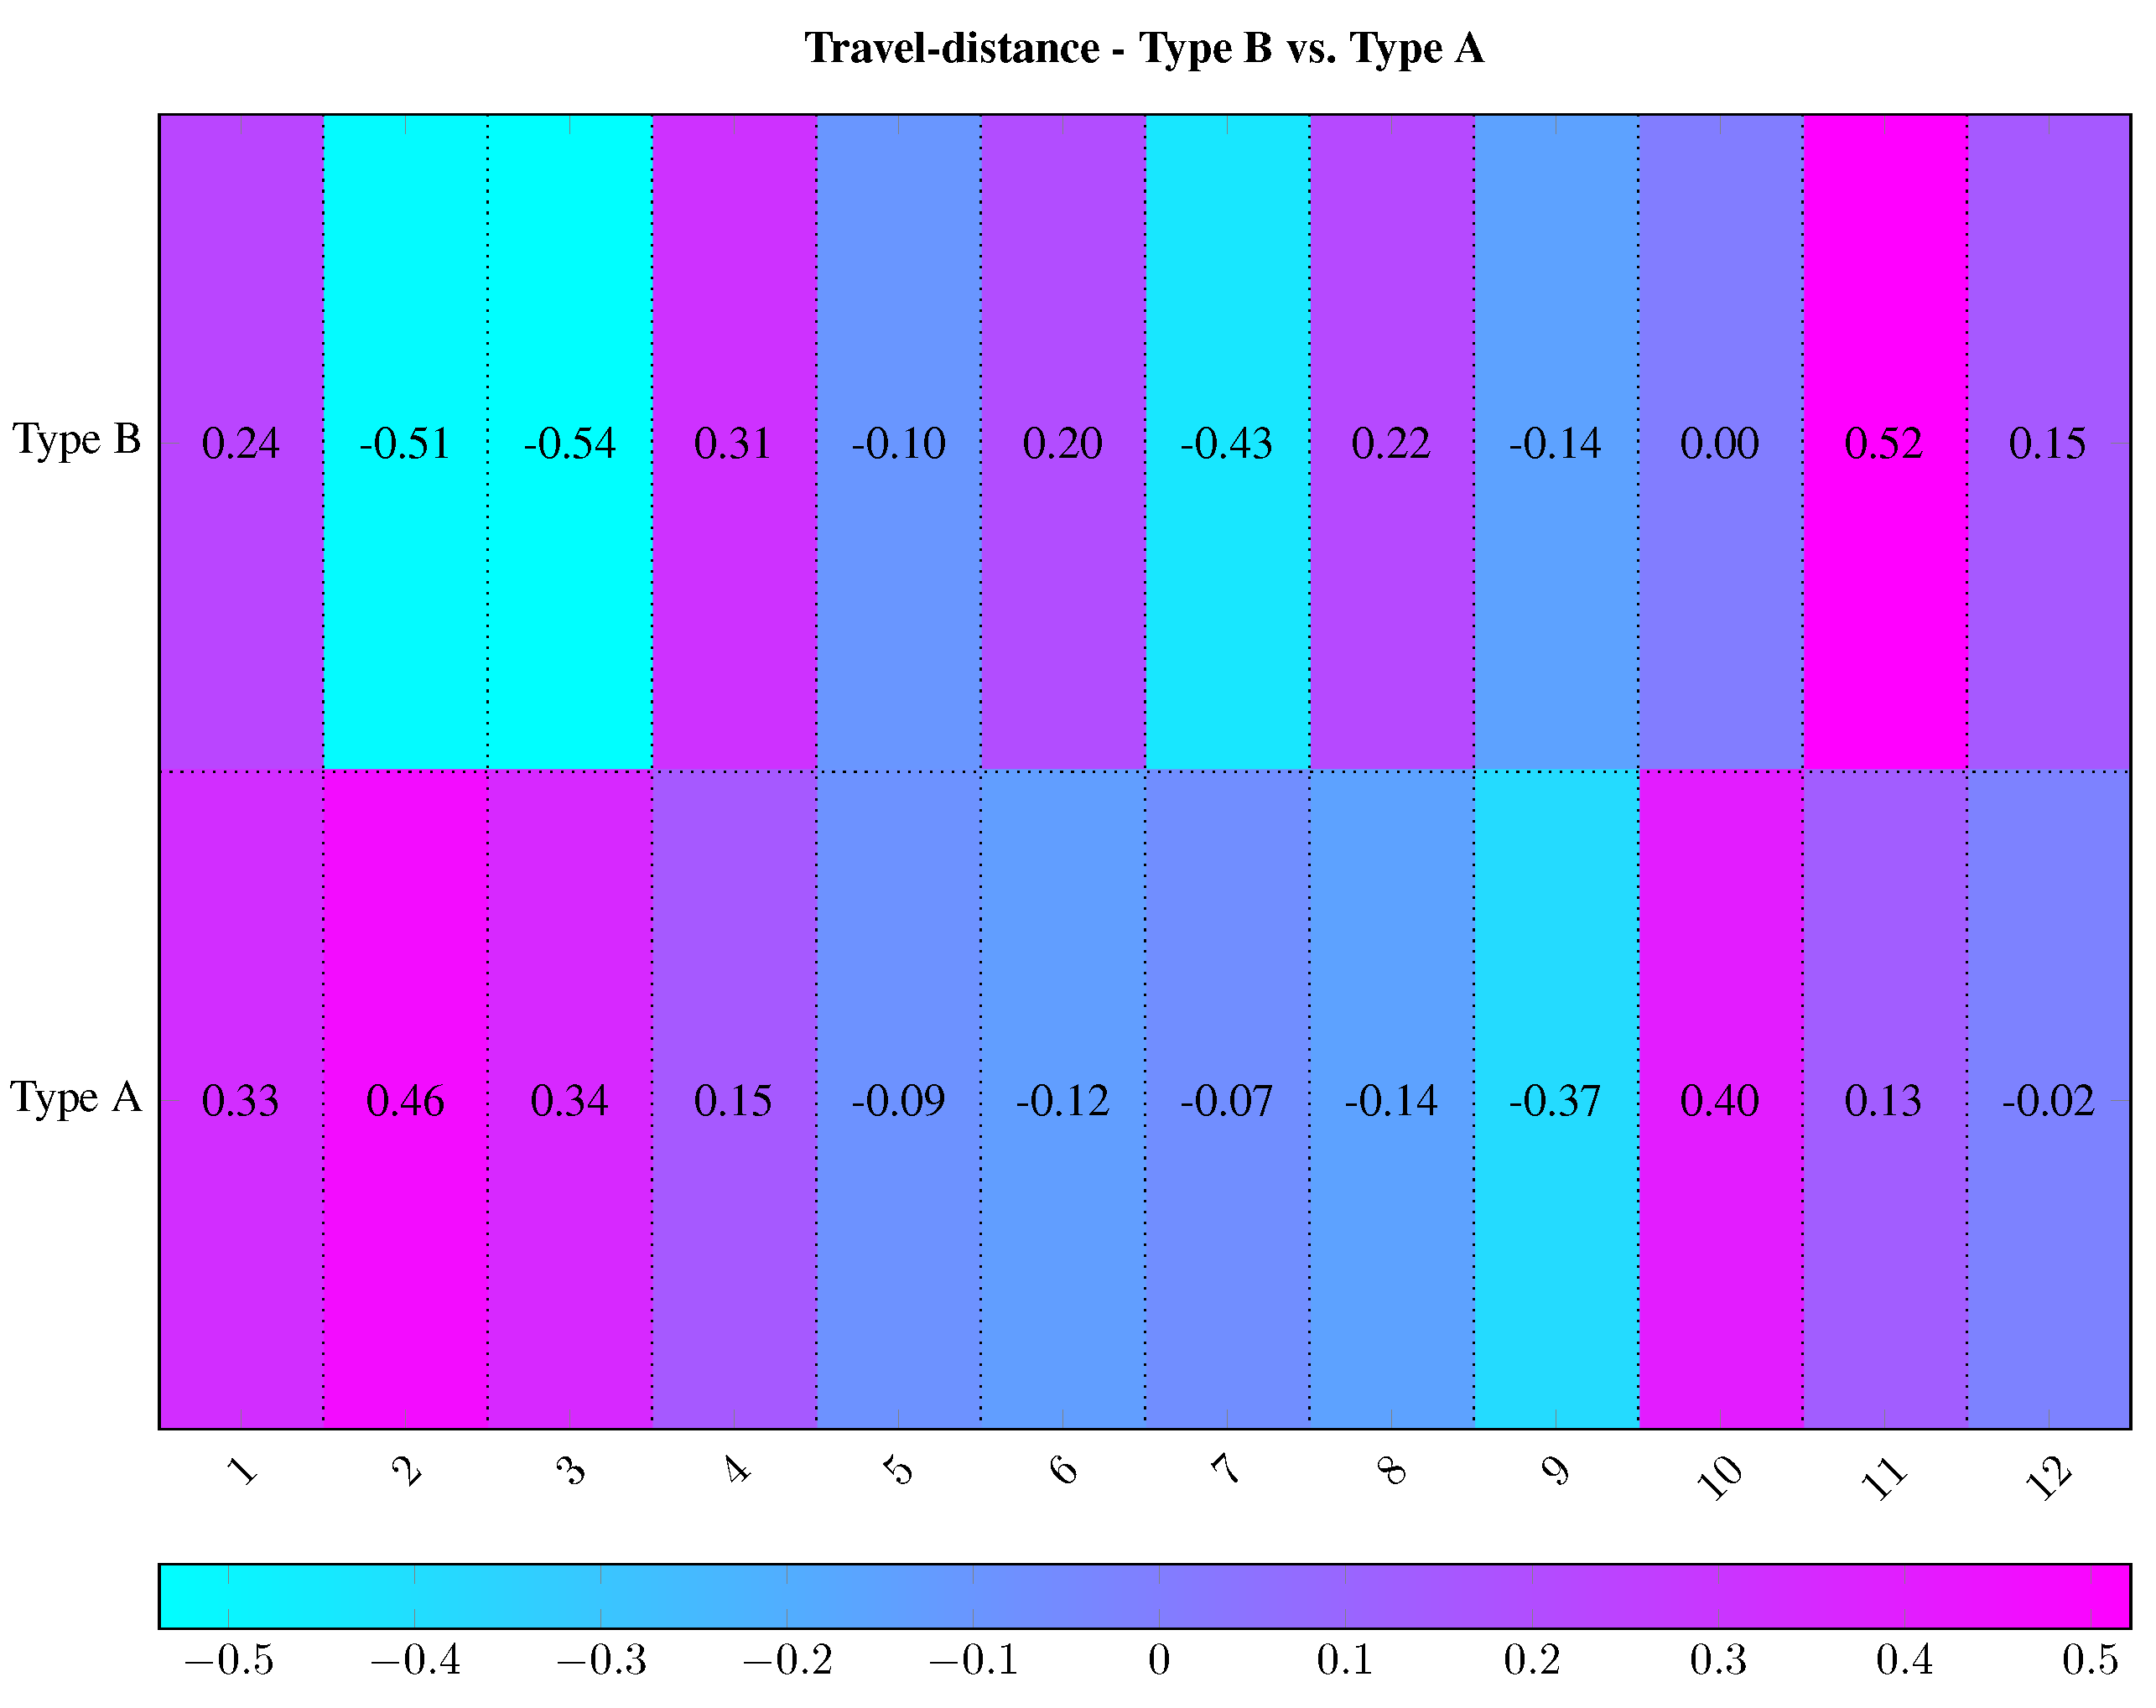
The correlation coefficient r according to Bravais and Pearson is a normalized measure and lies in the interval between and . This metric indicates the degree of linear relationship between the predicted values and the true values [41]. We also used the travel-distance as standardized measure in the interval from −1 to +1, thus providing a suitable interpretation of price prediction value () and the observation y.
A travel-distance of +1 indicates a “perfect” forecast model, which exactly forecasts every future value. A value of −1 indicates a “contra model”. A value of 0 indicates that there is no correlation between prediction and actual movement [42]. The focus of this metrics are the signs of prognosis and the true market values.
We determine these measures with the help of a rolling time window which is the typical learning process using historical data. Subsequently, the generation of the forecast path for the next time and the above-mentioned quality measures are determined. After the forecast is completed, the window scrolls one time step further. This starts the next evaluation step of the forecast. The choice of a suitable window length is not easy. The use of a window that is rather small could lead to inaccurate results because too few learning data points are available. However, if the window is too large, it can lead to an increasing degree of persistence [43]. This problem is also referred to as “overfitting”. We use 20 days to predict the next time step in line with [33,35,39].
4. Results
The following Table 3 presents the results. Subsequently, the first prediction period is used as an example to introduce some characteristics and explain the further results over time.
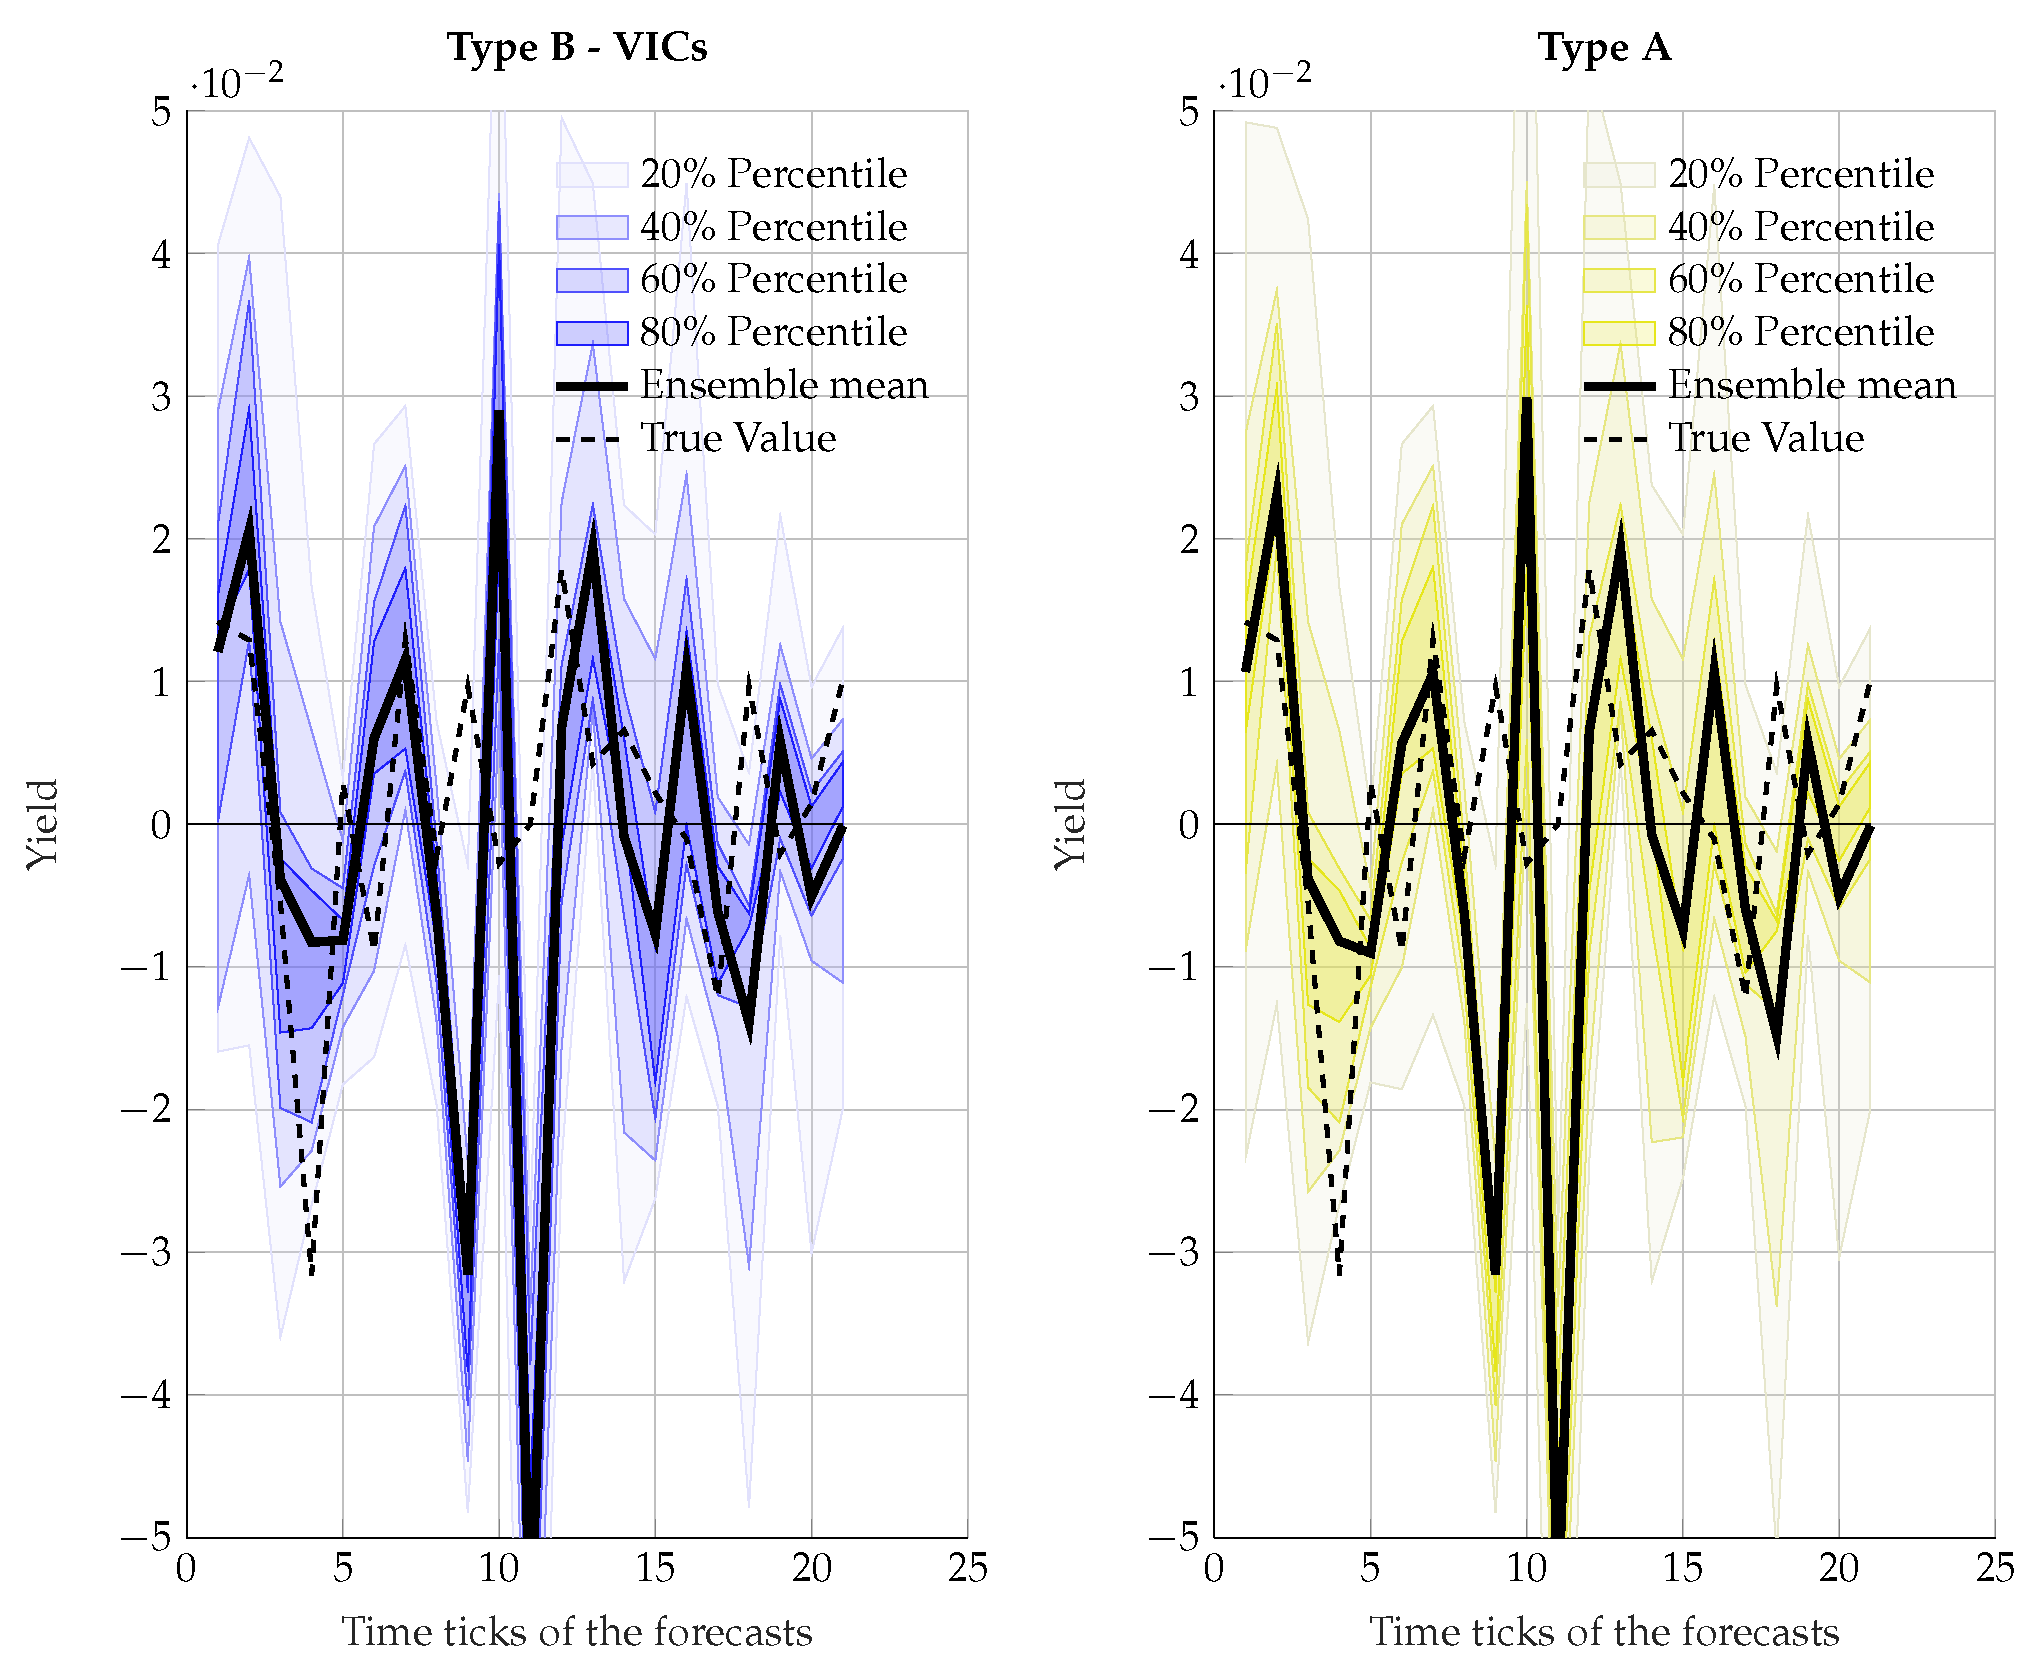
Figure 4 compares the two prediction models with respect to quality of the ensembles of network Type A (baseline HCNN) and network Type B (extended network considering additional VICs data) for the first trading month based on Table 3.
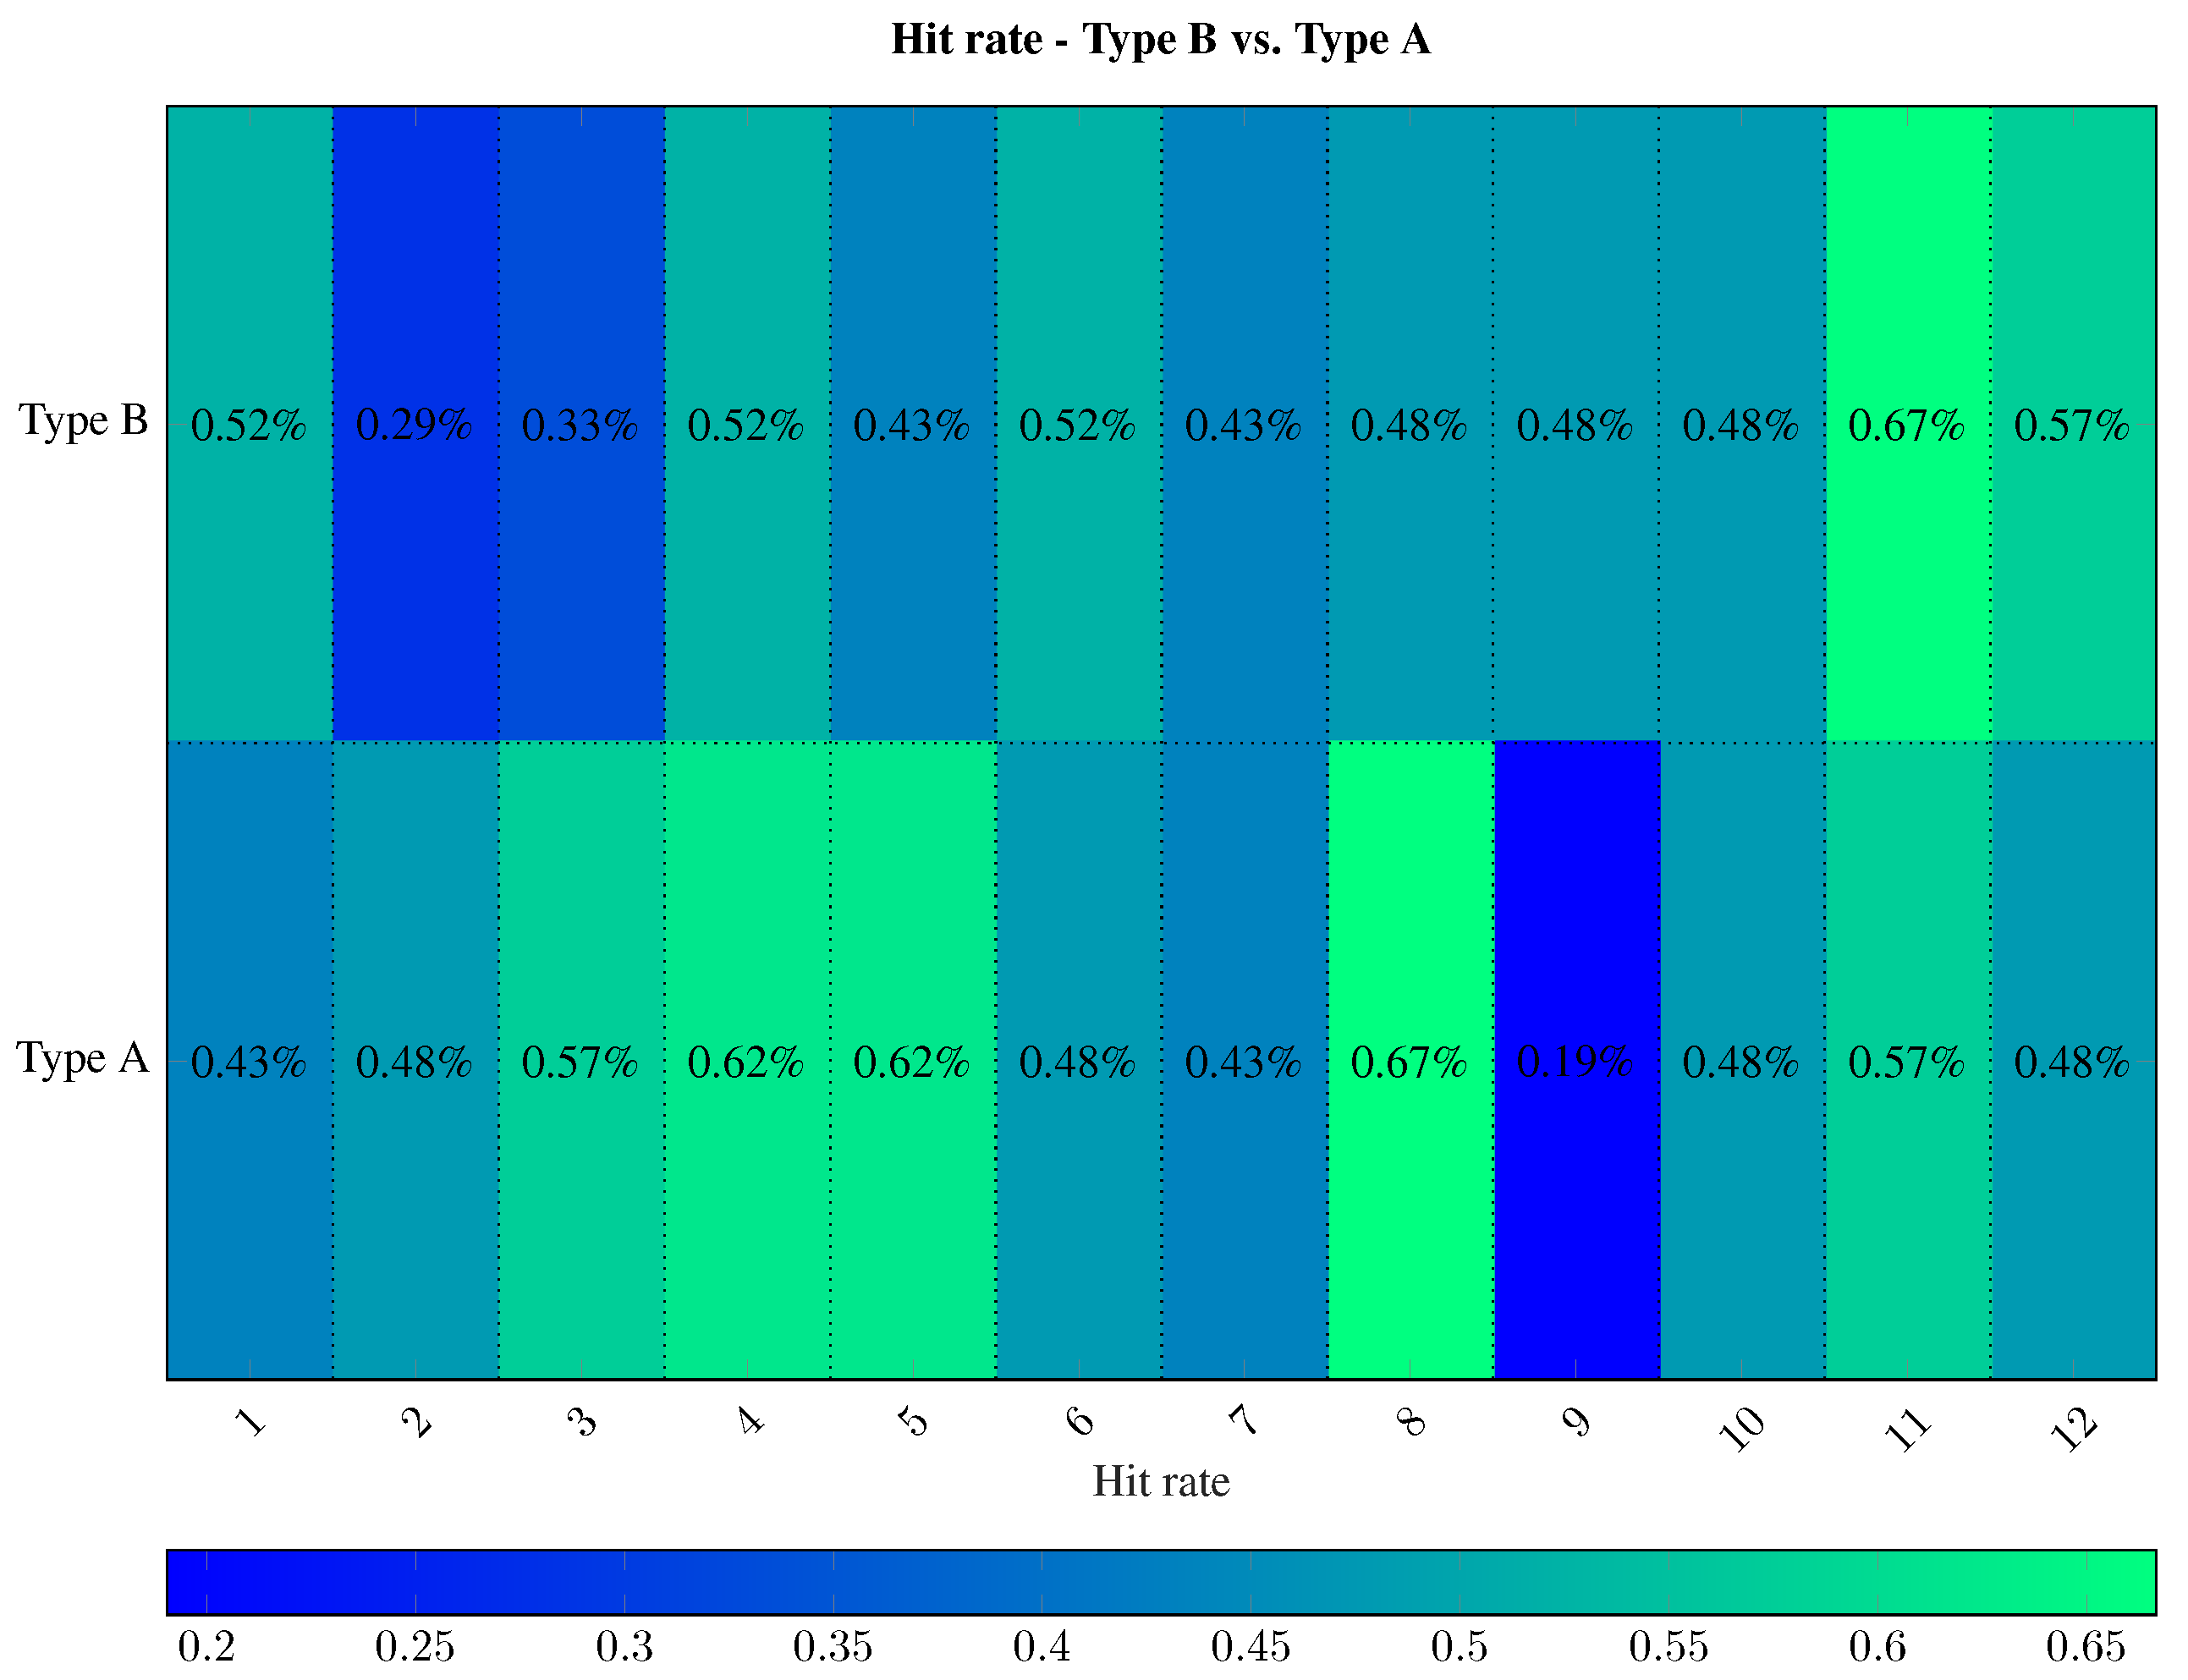
The MSE is narrowly distributed around zero. These values coincide with the measurement results in [1] (2008). However, the analysis of the MSE distribution of the Type B shows a slightly increased value. From this, a higher adjustment error can be derived. This adjustment error is a bit smaller for Type A HCNN. The MSE results of type A seem better, but the differences are minimal. The comparison shows that there is no significant difference between the MSEs. In the first period, the hit rate of the ensemble with the additional information is higher (Type B (%) than the hit rate from the ensemble without these pieces of information (Type A %). The much smaller distance of the Type B (%) is also a sign for a smaller deviation from the true values. Figure 5 shows the hit rate for each model.
Here, the strength of the Type B in 6 of 12 months, compared to the Type A prediction model, is emphasized. Especially in the first month, it turns out that the sentiment index is a helpful indicator for trend recognition. However, a diametrical picture emerges afterwards. Periods 3, 4 and 5 seem to be particularly problematic for the Type B, as the forecast results in the form of the hit rate of the HCNN without VICs data show on average a 10% higher prediction quality. Only later in the time series forecast (periods 10, 11, 12) is the hit rate of the Type B better by about 6.33%. The analysis of the distance results in a relative view of the hit rate (Figure 6).
Figure 6 shows a relation of the seemingly high performance. Due to the routes, false forecasts (1-hit rate) weight significantly higher in the context of a practice-oriented forecast. The distances of the Type A (HCNN % and %) are the shortest. The Type B model beats the other model for this period (HCNN % and %). The circumstance of the negative sign of the route quantifies the prediction of a wrong trend direction. This is particularly devastating for a practice-oriented application
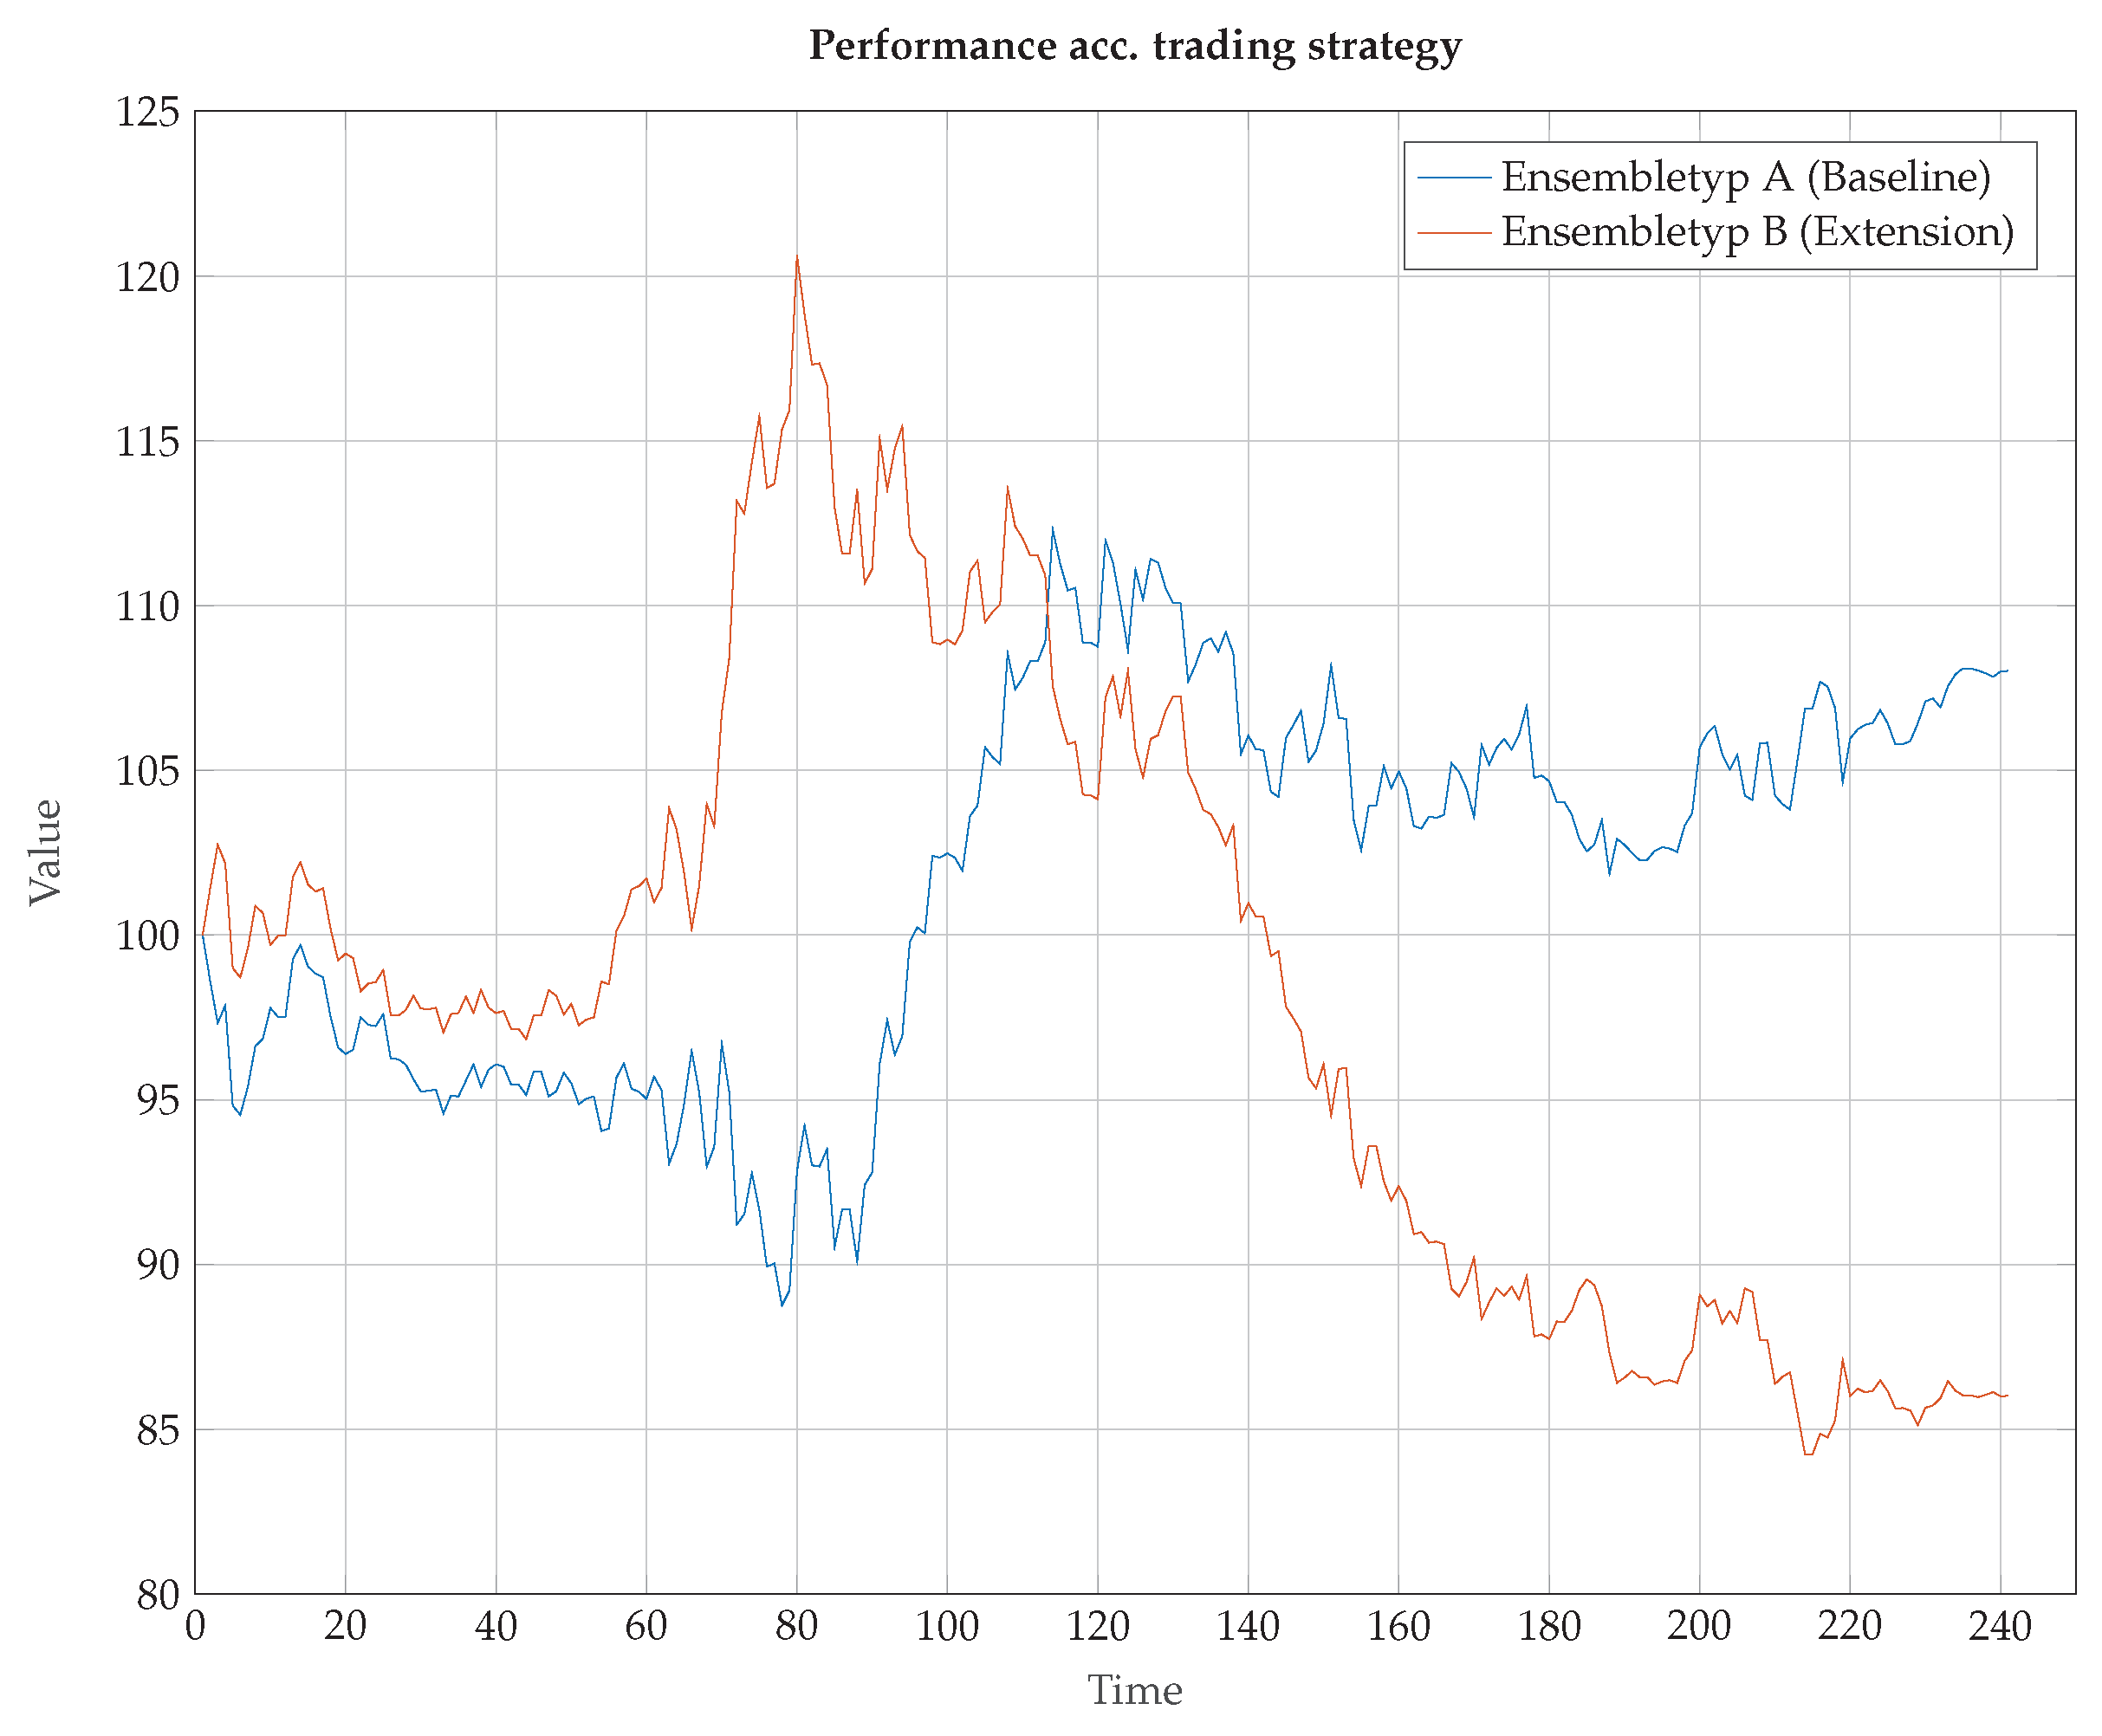
The correlation coefficient shows an amazing picture. In contrast to the Type B model, the correlation coefficient of Type A is positive. This suggests that this model can best cope with this data set as the market phases change. However, the value interval of r is highlighted critically. The values between the lower quartiles (0.25-quantile) and the upper quartiles (0.75-quantile) move with asymmetric variance around a zero value. Against this background, these correlation values are only interpretable conditionally based on the theoretical advantages of HCNN according to Zimmermann et al. [35]. Based on these results, we use a simple trading strategy to illustrate the prediction performance. The underlying trading strategy is a naive strategy. When the predicted market situation is “long”, than the system will buy shares. In the case of a predicted market situation “short”, the system will sell the shares. Figure 7 shows the result of each model in a trading simulation.
The results may be interpreted to indicate that VICs have the ability to improve the prediction models. Our findings strongly support the view that VICs contain a temporary informational content and can therefore be valuable to predict stock price series.
The HCNNs functionality, with or without the VICs data as a prediction model, should be emphasized. The results show a certain punctual form of the superiority of the type B model. However, the results are not systematically better when compared to the selected type A model. However, Figure 7 shows the advantages of the type B model in a trading strategy in the second part of the year.
The unsystematic results can have different reasons. Presumably, the aggregation of a mood picture in the form of the sentiment index formed here is only an indicator and maybe subject to a certain error rate due to human subjectivity and the general market uncertainty. Thus, we assume that the overall opinion over time by the underlying particular assessments makes insufficient statements for the respective future market phase. The problem derives from the results in highly volatile market phases. The type B model shows weaker prediction performance than the type A model, especially in the market phases with very high uncertainty. However, this circumstance revolves in the other periods when the opinion index stabilizes too. This stabilization of the index, with the increase in the prediction quality of the type B, suggests a potential useful informational content. Based on the findings, the HCNN is a sufficient prediction model for practical application. The term “sufficient” is chosen here because the VICs data contribute to the prediction in the context of machine processing in particular market phases. However, in this selected set of time series, there are periods that cannot be better predicted by incorporating data from a VIC. The HCNN sensitivity seems to be higher than that of the classical mean model. This speaks for a potential for adaptation to the chosen markets.
The challenge of prediction bases on the complexity of the capital markets. The premise of the HCNN, however, gives the possibility to minimize the complexity by the divide-and-conquer process, in which the capital markets is regarded as a complete system and understood as the interaction of various subsystems. Based on the premise, the HCNN, as a neural network offers the property of approximating various functions. Additionally, this approach is realized in this work as part of a practical implementation.
The results indicate the possibility of time series prediction based on an HCNN model. Adding additional information from VICs can potentially provide added value. The analysis shows this marginal utility for some trading periods. The type B (%) model, which makes use of additional time series information from VICs, arrives at better results than the type A (%) and the classical mean value model (%). This result indicates that VICs can serve as an additional source of information and can selectively improve forecasts.
5. Implications
Our findings have important consequences for theory and practices. From a theoretical view, this paper offers a deeper understanding of the information benefit from VICs data for prediction purposes. We illustrate in our paper that VICs can improve the predictions under certain circumstances. Previous studies of VICs in IS research have scarcely considered whether the data can be used to create meaningful prediction models. This paper is, to the best of our knowledge, the first to use VICs data for prediction. It thus contributes to literature by studying prediction in a yet underexplored context and advance the VICs literature by highlighting the possibilities as a prediction source. More broadly, our findings point towards the potential of the data from VICs to improve financial market predictions.
Based on the presented concept, HCNNs can be used to create useful prediction systems. Data from VICs can be a valuable addition but our results indicate that this type of data is only helpful in certain market phases. However, our results also reveal that there are market phases that cannot be better predicted using VICs data. In phases of high market uncertainty, the sensitivity of HCNN models seems to be higher than that of the classical mean value model. Future research needs to better understand this relationship.
Given that predicting stock prices is key for investment decisions by institutional investors [3], our results have also important implications for practice. In prediction models, it is important to use adequate information sources. Moreover, the benefits of new information need to outweigh the costs for acquiring the information. For example information from providers such as Bloomberg or analysts’ reports are very expensive while data from VICs can constitute a cheap but yet valuable alternative. In summary, our results indicate that HCNN with and without access to data from VICs can serve as a promising prediction instrument for financial markets. The results thus show that both approaches are complementary and should be used together. The HCNN thus offers potential for further practical application, with appropriate further development.
6. Limitations, Conclusions and Future Research
As with any study, there are some limitations that provide opportunities for future research. First, based on our proposed prediction model, we use an aggregation approach to collect the VICs information for the S&P 500 index which potentially limits the predictive power of the VICs data. For IS research, the information pre-process part is a particularly interesting point for further research. For example, the aggregation of data from VICs could be adapted and other means of aggregation could be used. Second, we use the typical rolling window back test, which is a commonly used scientific approach but which is not used very often in business practice. Future research could verify our findings in a more realistic setting and could consider a longer time frame. Finally, future work may extend our research prediction models by using elaborate methods for the network architecture of HCNN. Parameters such as the number of learning epochs, the number of neurons and layers used, would be a promising starting point.
As [1] shows, predicting financial markets is a complex undertaking. The premise of the HCNN to minimize the complexity of a given financial market by using a divide and conquer approach is useful and gives new opportunities. This approach is therefore valuable by delivering an understanding of different subsystems in a complex system such as the financial market [35] and an understanding of the time series. Thus, the processes on the financial markets can theoretically be simulated based on such an approach. HCNN as a special form of ANN are the proper instrument for such an analysis.
The results show the possibility of time series prediction with the HCNN model. The advantage of additional information from the VICs can offer a potential added value. This is shown in some trading periods in direct comparison with the chosen reference models. The extended HCNN (TQ ≈ 0.5238%), which has additional time series information, delivers better results than the HCNN (TQ ≈ 0.4286%) and the classic mean value model (TQ ≈ 0.3010%) on average. Thus, the VICs offer the potential to serve as an additional source of information and can lead to improvements with regards to forecasts at least in relatively stable market phases.
However, HCNN and data from VICs do not perform significantly better in general. Therefore, we advise to be cautious. The high variance of prediction accuracies should be evaluated systematically before the model can be applied in business practice. A further circumstance is the complexity of the HCNN as a prediction instrument in this context. However, the listed imitations of this paper could be a great start for future work. An aspect for future investigation is the modelling of other time series such as stock prices of different stocks instead of an index price. In the context of model training, it would be useful to carry out analysis of the hyperparameters of the HCNN to get a deeper understanding, for example concerning the learning epochs, number of neurons, and layers.
To conclude, we believe that VICs have a great potential as a prediction source. We hope that this paper gives fresh impetus to researchers to focus on these interesting platforms. This work offers an interesting technological approach and may perhaps counteract the neo-phobia and the aversion to new technologies.
Author Contributions
Conceptualization, O.H. and A.B.; methodology, B.M.A.-K.; software, B.M.A.-K.; validation, A.B. and O.H.; formal analysis, A.B. and O.H. All authors have read and agreed to the published version of the manuscript.
Funding
This research received no external funding.
Institutional Review Board Statement
The study not involving humans or animals.
Informed Consent Statement
Informed consent was obtained from all subjects involved in the study.
Acknowledgments
The authors thank TU-Lichtwiese calculation server headquarters for the provision of computing power.
Conflicts of Interest
The authors declare no conflict of interest.
References
- Welch, I.; Goyal, A. A Comprehensive Look at The Empirical Performance of Equity Premium Prediction. Rev. Financ. Stud. 2008, 21, 1455–1508. [Google Scholar] [CrossRef]
- Essendorfer, S.; Diaz-Rainey, I.; Falta, M. Creative destruction in Wall Street’s technological arms race: Evidence from patent data. Technol. Forecast. Soc. Chang. 2015, 99, 300–316. [Google Scholar] [CrossRef]
- Kashefia, M.A. Effect of salvage market on strategic technology choice and capacity investment decision of firm under demand uncertainty. J. Bus. Econ. Manag. 2016, 17, 140–155. [Google Scholar] [CrossRef] [Green Version]
- Lahmiri, S. Intraday stock price forecasting based on variational mode decomposition. J. Comput. Sci. 2016, 12, 23–27. [Google Scholar] [CrossRef]
- Park, J.H.; Konana, P.; Gu, B.; Kumar, A. Information Valuation and Confirmation Bias in Virtual Communities: Evidence from Stock Message Boards. Inf. Syst. Res. 2013, 24, 1050–1067. [Google Scholar] [CrossRef]
- Gottschlich, J.; Hinz, O. A decision support system for stock investment recommendations using collective wisdom. Decis. Support Syst. 2014, 59, 52–62. [Google Scholar] [CrossRef]
- Lin, H.F. Determinants of successful virtual communities: Contributions from system characteristics and social factors. Inf. Manag. 2008, 45, 522–527. [Google Scholar] [CrossRef]
- Sun, Y.; Fang, Y.; Lim, K.H. Understanding sustained participation in transactional virtual communities. Decis. Support Syst. 2012, 51, 12–22. [Google Scholar] [CrossRef]
- Nofer, M.; Hinz, O. Are crowds on the internet wiser than experts? The case of a stock prediction community. J. Bus. Econ. 2014, 84, 303–338. [Google Scholar] [CrossRef]
- Bollen, J.; Mao, H.; Zeng, X. Twitter mood predicts the stock market. J. Comput. Sci. 2011, 2, 1–8. [Google Scholar] [CrossRef] [Green Version]
- Ma, M.; Agarwal, R. Through a Glass Darkly: Information Technology Design, Identity Verification, and Knowledge Contribution in Online Communities. Inf. Syst. Res. 2007, 18, 42–67. [Google Scholar] [CrossRef]
- Chiu, C.M.; Hsu, M.H.; Wang, E.T. Understanding knowledge sharing in virtual communities—An integration of social capital and social cognitive theories. Decis. Support Syst. 2006, 42, 1872–1888. [Google Scholar] [CrossRef]
- Wasko, M.M.; Faraj, S. It is what one does: Why people participate and help others in electronic communities of practice. J. Strateg. Inf. Syst. 2000, 9, 155–173. [Google Scholar] [CrossRef]
- Barber, B.; Lehavy, R.; McNichols, M.; Trueman, B. Can Investors Profit from the Prophets? Security Analyst Recommendations and Stock Returns. J. Financ. 2001, 56, 531–563. [Google Scholar] [CrossRef]
- Barniv, R.; Hope, O.; Myring, M.J.; Thomas, W.B. Do Analysts Practice What They Preach and Should Investors Listen? Effects of Recent Regulations. Account. Rev. 2009, 84, 1015–1039. [Google Scholar] [CrossRef]
- Bradshaw, M.T. Analyst Information Processing, Financial Regulation, and Academic Research. Account. Rev. 2009, 84, 1073–1083. [Google Scholar] [CrossRef]
- Fama, E.F. Efficient Capital Markets - A Review of Theoriy and Empirical Work. J. Financ. 1970, 25, 383–417. [Google Scholar] [CrossRef]
- Grossmann, S.J.; Stiglitz, J.E. On the Impossibility of Informationally Efficient Markets. Am. Econ. Rev. 1980, 70, 393–408. [Google Scholar]
- Oztekin, A.; Kizilaslanb, R.; Freundc, S.; Iserid, A. A data analytic approach to forecasting daily stock returns in an emerging market. Eur. J. Oper. Res. 2016, 253, 697–710. [Google Scholar] [CrossRef]
- Malkiel, B.G. The Efficient Markt Hypothesis and Its Critics. J. Econ. Perspect. 2003, 17, 59–82. [Google Scholar] [CrossRef] [Green Version]
- Neely, C.J.; Weller, P.A.; Ulrich, J.M. The adaptive markets hypothesis: Evidence from the foreign exchance market. J. Financ. Quant. Anal. 2009, 44, 467–488. [Google Scholar] [CrossRef] [Green Version]
- Campbell, J.Y.; Thompson, S.B. Predicting Excess Stock Returns Out of Sample: Can Anything Beat the Historical Average? Rev. Financ. Stud. 2008, 21, 1509–1531. [Google Scholar] [CrossRef] [Green Version]
- Kim, H.; Han, S.T. The Enhanced Classification for the Stock Index Prediction. Procedia Comput. Sci. 2016, 91, 284–286. [Google Scholar] [CrossRef] [Green Version]
- Mjolsness, E.; Coste, D.D. Machine Learning for Science - State of the Art and Future Prospects. Science 2001, 293, 2051–2055. [Google Scholar] [CrossRef]
- Delen, D.; Zaim, H.; Kuzey, C.; Zaim, S. A comparative analysis of machine learning systems for measuring the impact of knowledge management practices. Decis. Support Syst. 2013, 54, 1150–1160. [Google Scholar] [CrossRef]
- Oh, B.S.; Oh, K.; Teoh, A.B.J.; Lin, Z.; Toh, K.A. A Gabor-based network for heterogeneous face recognition. Neurocomputing 2016, 261, 253–265. [Google Scholar] [CrossRef]
- Fernandes, L.C.; Souza, J.R.; Pessin, G.; Shinzato, P.Y.; Sales, D.; Mendes, C.; Prado, M.; Klaser, R.; Magalhaes, A.C.; Hata, A.; et al. CaRINA Intelligent Robotic Car: Architectural design and applications. J. Syst. Archit. 2014, 60, 372–392. [Google Scholar] [CrossRef]
- Rayche, V.; Vechev, M.; Yahav, E. Code completion with statistical language models. In Proceedings of the 35th ACM SIGPLAN Conference on Programming Language Design and Implementation, Edinburgh, UK, 9–11 June 2014; pp. 419–428. [Google Scholar]
- Siniscalchi, S.M.; Svendsen, T.; Lee, C.H. An artificial neural network approach to automatic speech processing. Neurocomputing 2014, 140, 326–338. [Google Scholar] [CrossRef]
- Eilers, D.; Dunis, C.L.; von Mettenheim, H.J.; Breitner, M.H. Intelligent trading of seasonal effects: A decision support algorithm based on reinforcement learning. Decis. Support Syst. 2014, 64, 100–108. [Google Scholar] [CrossRef]
- Zimmermann, H.G.; Gortmann, R.; Schäfer, R.; Tietz, C. Modelling Large Dynamical Systems with Dynamical Consistent Neural Networks. In New Directions in Statistical Signal Processing: From Systems to Brain; Haykin, S., Principe, J.C., Sejnowski, T.J., McWhirter, J., Eds.; The MIT Press: Cambridge, UK, 2006; pp. 203–242. [Google Scholar]
- Zimmermann, H.G.; Bertolini, L.; Grothmann, R.; Schäfer, A.M.; Tietz, C. A Technical Trading Indicator Based on Dynamical Consistent Neural Networks. In Artificial Neural Networks—ICANN 2006; Springer: Berlin/Heidelberg, Germany, 2005; pp. 654–663. [Google Scholar]
- Zimmermann, H.G.; Grothmann, R.; von Mettenheim, H.J. Planning Purchase Decisions with Advanced Neural Networks. In Business Intelligence and Performance Management-Theory, Systems and Industrial Applications; Rausch, P., Sheta, A.F., Ayesh, A., Eds.; Springer: London, UK, 2013; pp. 125–141. [Google Scholar]
- Zimmermann, H.G.; Tietz, C.; Grothmann, R. Forecasting with Recurrent Neural Networks: 12 Tricks-Second Edition. In Neural Networks: Tricks of the Trade; Lecture Notes in Computer Science 7700; Springer: Berlin/Heidelberg, Germany, 2012; pp. 687–707. [Google Scholar]
- Zimmermann, H.G.; Tietz, C.; Grothmann, R. Historical Consistent Neural Networks: New Perspectives on Market Modeling, Forecasting and Risk Analysis. In Advances in Intelligent Signal Processing and Data Mining; Georgieva, P., Mihaylova, L., Jain, L.C., Eds.; Springer: Berlin/Heidelberg, Germany, 2013. [Google Scholar]
- Kunz, T.P.; Crone, S.F.; Meissner, J. The effect of data preprocessing on a retail price optimization system. Decis. Support Syst. 2016, 84, 16–27. [Google Scholar] [CrossRef]
- Yann, L.; Yoshua, B.; Geoffrey, H. Deep learning. Nature 2015, 521, 436–444. [Google Scholar]
- Dhar, V.; Geva, T.; Oestreicher-Singer, G.; Sundararajan, A. Prediction in Economic Networks. Inf. Syst. Res. 2014, 25, 264–284. [Google Scholar] [CrossRef]
- Köpp, C.; von Mettenheim, H.J.; Breitner, M.H. Decision Analytics with Heatmap Visualization for Multi-step Ensemble Data—An Application of Uncertainty Modeling to Historical Consistent Neural Network and Other Forecasts. Bus. Inf. Syst. Eng. 2014, 6, 131–140. [Google Scholar] [CrossRef]
- Guresen, E.; Kayakutlu, G.; Daim, T.U. Using artificial neural network models in stock market index prediction. Expert Syst. Appl. 2011, 38, 10389–10397. [Google Scholar] [CrossRef]
- Galvez, R.H.; Gravano, A. Assessing the usefulness of online message board mining in automatic stock prediction systems. J. Comput. Sci. 2017, 19, 43–56. [Google Scholar] [CrossRef]
- Poddig, T.; Varmaz, A.; Fieberg, C. Computational Finance-Eine Matlab, Octave und Freemat basierte Einführung; Uhlenbruch Verlag: Bad Soden, Germany, 2015. [Google Scholar]
- Clark, T.E.; McCracken, M.W. Improving forecast accuracy by combining recursive and rolling forecasts. Int. Econ. Rev. 2010, 50, 363–395. [Google Scholar] [CrossRef]
Figure 1.
Our Prediction Comparison Model.

Figure 2.
System Transitions at Neuron Level [35].
Figure 2.
System Transitions at Neuron Level [35].

Figure 3.
Aggregated Sentiment based on VICs Recommendations of Trading Year 2010.

Figure 4.
Comparison of the Forecast Results of the Ensembles from Network Type A (HCNN Baseline) and the Network Type B (Extended Network with the Data of the VICs).
Figure 4.
Comparison of the Forecast Results of the Ensembles from Network Type A (HCNN Baseline) and the Network Type B (Extended Network with the Data of the VICs).

Figure 5.
Comparison Hit Rate.

Figure 6.
Comparison Routes.

Figure 7.
The VICs Prediction Information in a Trading Strategy.


Table 1.
Statistical Key Figures of the Data set on a Return Basis. IQR = Interquartile range (0.75-quartiles—0.25-quartiles).
Table 1.
Statistical Key Figures of the Data set on a Return Basis. IQR = Interquartile range (0.75-quartiles—0.25-quartiles).
| Measure | S & P 500 | Dow J. | US-Bonds | Copper | Ex. Rate |
|---|---|---|---|---|---|
| Average | 0.0005 | 0.0004 | 0.0000 | 0.0010 | −0.0001 |
| Median | 0.0006 | 0.0005 | 0.0000 | 0.0028 | −0.0004 |
| Variance | 0.0001 | 0.0001 | 0.0000 | 0.0003 | 0.0000 |
| Stand. Dev. | 0.0112 | 0.0100 | 0.0030 | 0.01789 | 0.0062 |
| Minimum | −0.0398 | −0.0367 | −0.0108 | −0.0688 | −0.0194 |
| Maximum | 0.0430 | 0.0383 | 0.0084 | 0.0610 | 0.0205 |
| Span | 0.0828 | 0.0749 | 0.0191 | 0.1297 | 0.0399 |
| IQR | 0.0101 | 0.0080 | 0.0041 | 0.0210 | 0.0079 |
| Skew | −0.2106 | −0.1762 | −0.1566 | −0.5756 | 0.1145 |
| Curvature | 5.1161 | 5.2600 | 3.3686 | 4.4937 | 3.4821 |
Table 2.
HCNNs Parametrization.
| Used Parameterization for the HCNNs | ||
|---|---|---|
| Parameter | Configuration | Source |
| Occupancy rate A | 12.5% | Analogous to [33] |
| Learning period | 20 days | Analogous to [39] und [33] |
| Tolerance condition | (own research) | |
| learning iterations | 1000 | (own research) |
| Input neurons | 6 (expanded) bzw. 5 | (own research) |
| Hidden neurons | 60 | (own research) |
| Bias neurons | yes | (own research) |
| Ensemble members | 100 | (based on computer power) |
Table 3.
Evaluation of Prediction Models. Rolling out-of-sample forecasts measured by MSE = mean square error, = hit rate, travel-distance and r = correlation coefficient. The period in trading days of the record is divided into the start of the initial start of the learning process in the respective in-sample phase (IS) and the actual out-of-sample phase (OOS) for prediction using a rolling time window with a length of 20 periods.
| Out-of-Sample Prediction | ||||||||
|---|---|---|---|---|---|---|---|---|
| Extended HCNN (Type B) | HCNN (Type A) | |||||||
| Period (IS|OOS) | MSE | MSE | ||||||
| 2010 (1) 1–20|20–40 | 0.0088 | 0.5238 | 0.2392 | 0.1484 | 0.0004 | 0.4286 | 0.3300 | 0.1330 |
| 2010 (2) 20–40|40–60 | 0.0157 | 0.2857 | −0.5086 | −0.3230 | 0.0003 | 0.4762 | 0.4608 | 0.1563 |
| 2010 (3) 40–60|60–80 | 0.0094 | 0.3333 | −0.5370 | −0.4160 | 0.0001 | 0.5714 | 0.3434 | 0.2006 |
| 2010 (4) 60–80|80–100 | 0.0099 | 0.5238 | 0.3121 | 0.1444 | 0.0001 | 0.6190 | 0.1489 | 0.4267 |
| 2010 (5) 80–100|100–120 | 0.0213 | 0.4286 | −0.0963 | −0.2034 | 0.0013 | 0.6190 | −0.0883 | −0.0810 |
| 2010 (6) 100–120|120–140 | 0.0093 | 0.5238 | 0.2019 | 0.1416 | 0.0010 | 0.4762 | −0.1242 | −0.3396 |
| 2010 (7) 120–140|140–160 | 0.0130 | 0.4286 | −0.4256 | −0.1368 | 0.0005 | 0.4286 | −0.0706 | −0.1523 |
| 2010 (8) 140–160|160–180 | 0.0193 | 0.4762 | 0.2155 | 0.2467 | 0.0005 | 0.6667 | −0.1408 | 0.1311 |
| 2010 (9) 1160–180|180–200 | 0.0182 | 0.4762 | −0.1407 | −0.3107 | 0.0004 | 0.1905 | −0.3735 | −0.1920 |
| 2010 (10) 180–200|200–220 | 0.0183 | 0.4762 | 0.0038 | −0.0578 | 0.0001 | 0.4762 | 0.3992 | 0.1809 |
| 2010 (11) 200–220|220–240 | 0.0202 | 0.6667 | 0.5214 | 0.0046 | 0.0001 | 0.5714 | 0.1333 | 0.1409 |
| 2010 (12) 220–240|240–260 | 0.0148 | 0.5714 | 0.1526 | 0.1793 | 0.0002 | 0.4762 | −0.0232 | −0.1974 |
| Average | 0.0148 | 0.4762 | −0.0051 | −0.0485 | 0.0004 | 0.5000 | 0.0829 | 0.0339 |
Publisher’s Note: MDPI stays neutral with regard to jurisdictional claims in published maps and institutional affiliations. |
© 2020 by the authors. Licensee MDPI, Basel, Switzerland. This article is an open access article distributed under the terms and conditions of the Creative Commons Attribution (CC BY) license (http://creativecommons.org/licenses/by/4.0/).
Share and Cite
MDPI and ACS Style
Abdel-Karim, B.M.; Benlian, A.; Hinz, O. The Predictive Value of Data from Virtual Investment Communities. Mach. Learn. Knowl. Extr. 2021, 3, 1-13. https://doi.org/10.3390/make3010001
AMA Style
Abdel-Karim BM, Benlian A, Hinz O. The Predictive Value of Data from Virtual Investment Communities. Machine Learning and Knowledge Extraction. 2021; 3(1):1-13. https://doi.org/10.3390/make3010001
Chicago/Turabian StyleAbdel-Karim, Benjamin M., Alexander Benlian, and Oliver Hinz. 2021. "The Predictive Value of Data from Virtual Investment Communities" Machine Learning and Knowledge Extraction 3, no. 1: 1-13. https://doi.org/10.3390/make3010001