Mechanical Strength of Bamboo Filled PLA Composite Material in Fused Filament Fabrication


Mechanical Engineering Department, South Dakota State University, Brookings, SD 57007, USA
*
Author to whom correspondence should be addressed.
J. Compos. Sci. 2020, 4(4), 159; https://doi.org/10.3390/jcs4040159
Submission received: 22 September 2020
/
Revised: 20 October 2020
/
Accepted: 23 October 2020
/
Published: 26 October 2020
(This article belongs to the Special Issue Characterization and Modelling of Composites)
Abstract
:Through the past two decades, there has been a continued push for renewable resources and future sustainability of materials and processes. This has prompted more developments of providing environmentally friendly practices and products, both in terms of higher recyclability and greater use of renewable resources. An important area of interest are materials for construction and manufacturing purposes, specifically “green” sustainable reinforcement materials for thermoplastic composite materials. During this time, there has also been an evolution in manufacturing methods. Additive manufacturing (AM) has continued to grow exponentially since its inception for its extensive benefits. This study aims to investigate an additive manufactured composite material that is a greener alternative to other composites that are not reinforced by natural fibers. A bamboo filled polylactic acid (PLA) composite manufactured by fused filament fabrication was evaluated in order to gather mechanical strength characteristics by means of tensile, flexure, compression, impact, and shear tests. In this material, the bamboo reinforcing material and the PLA matrix material can both be sourced from highly renewable resources. In this study, a variety of test samples were manufactured at different manufacturing parameters to be used for mechanical testing. The results were recorded with respect to varying manufacturing parameters (raster angle orientation). It was found that the 0° raster angle orientation performed the best in every category except tensile. Additively manufactured bamboo filled PLA was also seen to have comparable strength to certain traditionally manufactured bamboo fiber reinforced plastics.
1. Introduction
Growing demand for renewable resources and environmentally friendly practices have prompted research in many different areas [1,2,3]. One of which includes the mechanics (or strength) of materials. Plastics are especially notorious for negative environmental impact. Plastics are polymers, which consist of repeated monomers (simple molecules) that are covalently bonded to one another in a chain like structure. The benefits of such polymers are widely known and utilized, such as excellent strength to weight ratio as well as resistance to corrosion. In order to further increase the strength of the material while retaining the benefits of polymers, composite materials have been created to attempt to combine the advantageous properties of multiple materials while minimizing the disadvantages. One type of composite material incorporates continuous or chopped fibers of a strengthening material within a matrix polymer. Many polymer-matrix composites have been investigated and they have been widely used across many industrial applications. One of the most common is carbon fiber reinforced polymers (CFRP). However, with growing demand for sustainable and biodegradable materials, carbon fiber is not ideal, because much of it is manufactured using a petroleum-based product [4,5]. Additionally, it is manufactured using a variety of other costly materials and methods, making it not economical for many applications. Using natural fibers in composites provides a sustainable reinforcement material that could potentially address the growing demand for renewable environmentally friendly materials [6].
The cellulosic fibers found in bamboo is a natural fiber that can address this demand [7,8]. Bamboo is a perennial flowering plant in the grass family [9]. Bamboo is often referred to as a tree for its tree-like appearance and size. It is also known as one of the fastest growing plants and is easily harvested which make them especially attractive for sustainability and renewability [7]. Some stronger species of bamboo have structural properties that are similar to high grade hardwoods [10]. However, there are some difficulties that are seen when using bamboo fibers in composites. The extraction of consistent quality bamboo fibers due to brittleness, as well as variations of strength, depending on the well-being of the plant harvested, are just a few reasons for fiber strength variability [11,12]. Another challenge that has been seen is forming interphase between the polymer-matrix and bamboo fibers [5]. Adding an agent to promote bonding between the two phases has become standard for bamboo fiber reinforced polymers [5,11].
The manufacturing of composites can sometimes prove to be challenging, depending upon the reinforcement filler, matrix material, manufacturing structure, and others. Automating this task through additive manufacturing (AM) can relieve some of the challenges seen while also providing the additional benefits of AM. Additive manufacturing is the process in which a part is created by depositing material layer by layer. Some of the major and widely known benefits of additive manufacturing process are rapid prototyping, increased geometric complexity possibilities, low volume production affordability, etc. The process of fused filament fabrication (FFF) has been a major building block in AM polymer-matrix composites. FFF is the process in which a thermoplastic filament is heated and extruded through a nozzle that moves around a build plate to construct a layer of a part. Next, the nozzle moves vertically up by one layer thickness and the next layer is added on top of the previous layer. This continues until the part is fully constructed. Many composites have been investigated and successfully manufactured while using FFF. Some machines incorporate continuous reinforcement fibers placed in between layers of polymer [13,14,15], while other AM composites are produced using a filament in which already incorporates a chopped or ground reinforcement material [16,17,18,19,20]. A variety of types of natural reinforcement materials have been evaluated for FFF, such as cork and hemp [21,22]. One such FFF filament is a bamboo filled polylactic acid (PLA). Utilizing an AM process to produce a bamboo filled PLA component fulfills renewable and biodegradable requests for new materials by creating a material that is fully biodegradable and made from renewable materials.
Research has been completed on areas, such as mechanical and thermal properties of bamboo fiber reinforced epoxy and polymer composites manufactured by traditional means [23,24,25,26,27]. Research has also been conducted on the preparation of a bamboo filled PLA material intended for AM [28]. However, no research could be found on the mechanical properties of AM bamboo filled composite material. Presenting the mechanical strength of an AM bamboo filled PLA will result in readily available data, which could aid in the comparison and future advancement of modern manufacturing techniques of bamboo reinforced polymer composites. Anisotropy is regularly apparent in the parts produced due to the nature of the AM process. This requires the evaluation of material properties with respect to the AM build parameters. This paper aims to evaluate the mechanical properties of AM bamboo filler reinforced PLA properties accounting for varying raster orientation (orientation angle at which print infill lines are deposited). Testing utilized in the evaluation includes density, tensile, flexural, compression, impact, and shear.
2. Materials and Methods
2.1. Materials
All of the specimens used in this study were manufactured using a Flashforge Creator Pro (Zhejiang Flashforge3D Technology Co., Jinhua, China) with a 0.6mm nozzle. This nozzle size is slightly larger than usual nozzle sizes used for non-filled polymers, but is in line with common recommendations for composite materials that were used in FFF. Makerbot Desktop slicing software (Makerbot Desktop, Makerbot, Brooklyn, NY, USA) [29] was used for G-code compilation. Depending on the mechanical test, the following raster orientation were evaluated: 0°, 90°, alternating 0°/90°, and alternating −45°/45°. The bamboo filled PLA filament was manufactured by eSUN and is sold under the material name EBamboo [30]. Table 1 presents all of the relevant build parameters for the specimens.
Limited information pertaining to the bamboo filled PLA filament was available from the manufacturer. In order to gain a better understanding of the composition of the filament, the percentage of bamboo filler to PLA matrix was estimated by testing samples of the bamboo filament and recording volume measurements taken on Micromeritics AccuPyc II 1340 pycnometer (Micromeritics Instrument Corporation, Norcross, GA, USA). The mass of the samples was then recorded and used to calculate the density of the filament. This process was also completed with standard PLA filament available from eSUN, assumed to be the same as the EBamboo matrix material. An average density of 0.9 g/cm3 was assumed for bamboo. The percentage of bamboo filler in the material was determined to be 11.8% using Equation (1).
FFF of the bamboo filled PLA composite produced satisfactory high-quality parts with limited defects and it was easily printed. It has a light brown color similar to bamboo with a woody-like texture and aroma, very similar to other wood-filled polymers available for FFF. Figure 1 displays magnified cross sectional views of the filament with the right side of the figure being powder size distribution measurements. Darker brown spots are the bamboo particles that are infused into the composite material. Through image processing, the bamboo could be isolated from the PLA matrix, and powder size measurements were taken. Assuming the measured areas to be circular, the powder sizes ranged from 5 μm to 35 μm in diameter. Figure 2 shows an average representation of print quality of Bamboo/PLA FFF printed parts. As can be seen, the parts printed well and were of high quality. Few defects were present and only in areas where the nozzle started/stopped. These problems can likely be reduced/removed by fine-tuning retraction settings and/or by using a Z-hop maneuver.
One potential cause for concern was the degradation of bamboo during the AM process. The filament was extruded at a temperature of 230 °C in this study. Prior research has evaluated thermal degradation of bamboo reinforced epoxy composites through Thermogravimetric Analysis (TGA). It was found that degradation occurred at 250 °C independent upon filler percentage. Contrary, specifically, Bambusa vulgaris fibers showed low thermal stability and degradation occurring at 220 °C [31]. It should be noted that, during TGA, the temperature was increased at a rate of 10 °C/min. Being that the TGA process slowly heated the material (10 °C/min), it cannot be directly compared to the AM extrusion process where the filament is heated to 230 °C and then immediately starts cooling. However, we could expect very little bamboo degradation during the FFF process that was based on the previous research [31].
2.2. Mechanical Testing
Each specimen’s cross-sectional area was measured at multiple locations along the test section prior to conducting testing, as per the American Society for Testing and Materials (ASTM) testing standard for each test type. These cross-sectional area measurements were then averaged and used to calculate stress/strain for each test. Tensile, flexural and shear tests were all conducted using an MTS Insight load frame with a 5 kN MTS load cell. Compression testing was completed on an MTS Landmark load frame with a 100 kN load cell.
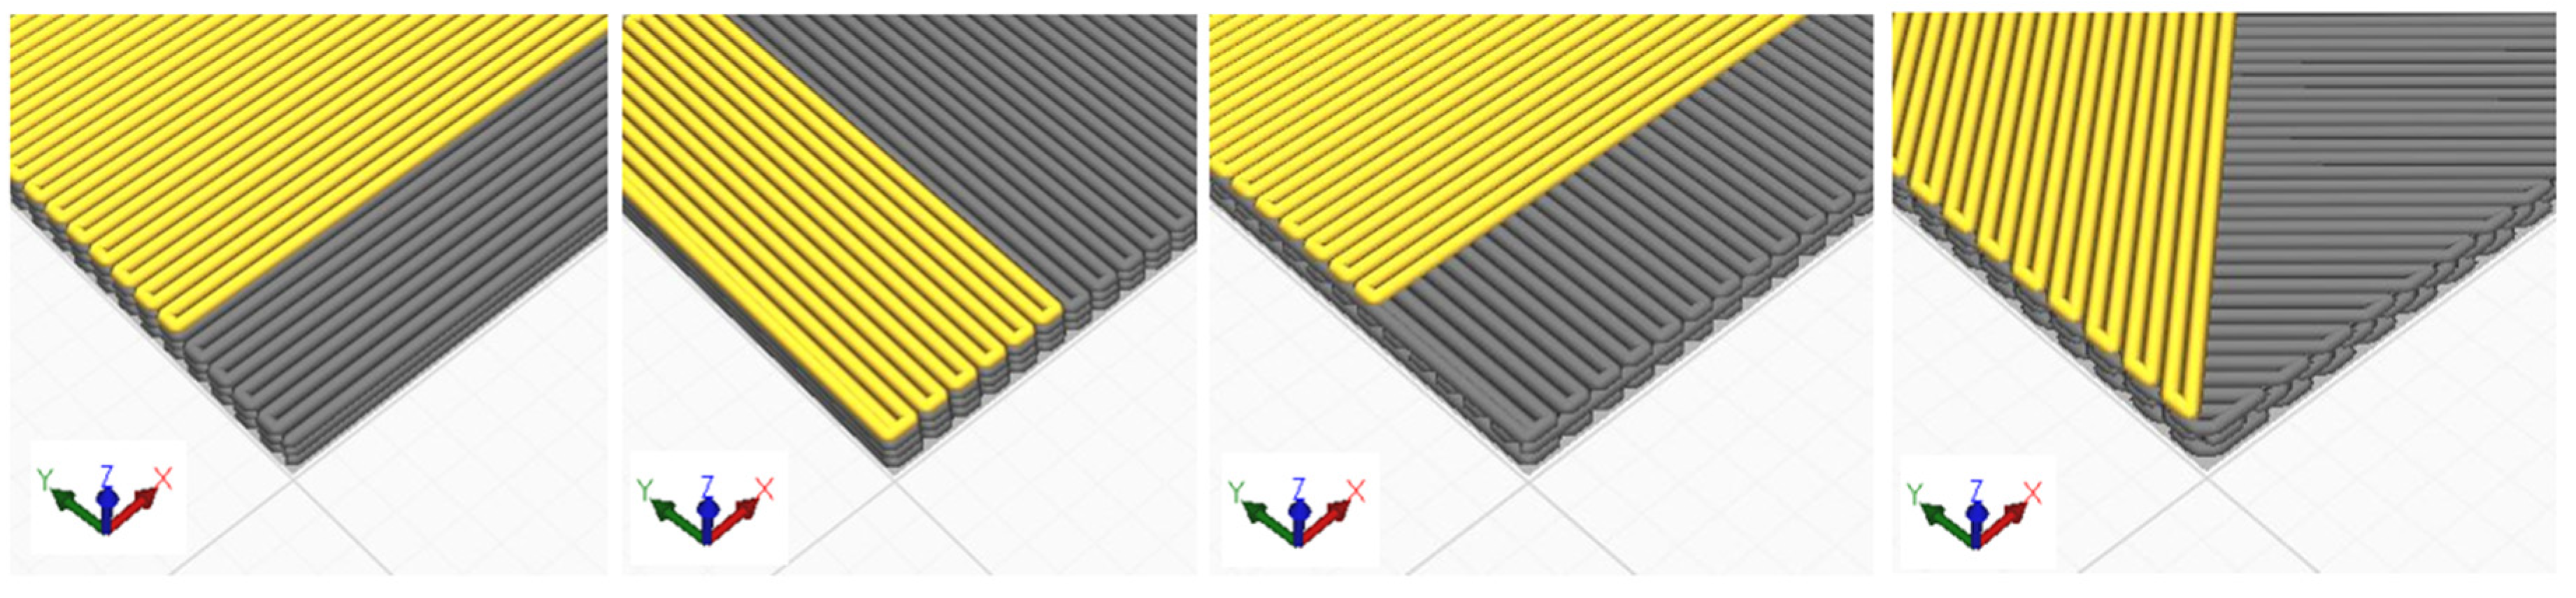
For each type of mechanical test conducted, samples from a variety of raster angles were tested, similar to [32]. In all cases, raster angles of 0° are the printing orientation that aligns the toolpath in the lengthwise direction (strongest orientation). The orientation angle increases in the CCW direction that was measured from the specimen’s longitudinal axis. The different raster angles employed in this study are shown in Figure 3, where the x-axes represent the specimen’s longitudinal axis.
2.2.1. Tensile
Tensile tests were conducted in accordance to ASTM D638 Standard Test Methods for Tensile Properties of Plastics [33]. Tensile tests were displacement controlled at a rate of 5 mm/min. while data (force, grip displacement, and strain) was collected at a rate of 100 Hz. Strain was measured using an MTS Model 634.31F-24 extensometer (MTS, Eden Prairie, MN, USA). Six specimens of each of the four raster orientations were tested. The dimensions of the tensile specimens follow Type IV in ASTM D638, which means cross sectional areas of approximately 6 mm × 4 mm.
2.2.2. Flexural
Flexural specimens were tested in accordance to ASTM D790 Standard Test Methods for Flexural Properties of Unreinforced and Reinforced Plastics and Electrical Insulating Materials [34]. Flexural tests were conducted using an MTS 3-point flexure fixture with a support span of 5 cm, while displacement controlled at a rate of 1.3 mm/min. Following the recommendations for specimen size in ASTM D790 leads to samples of cross-sectional area of 4 mm × 12.7 mm.
2.2.3. Compression
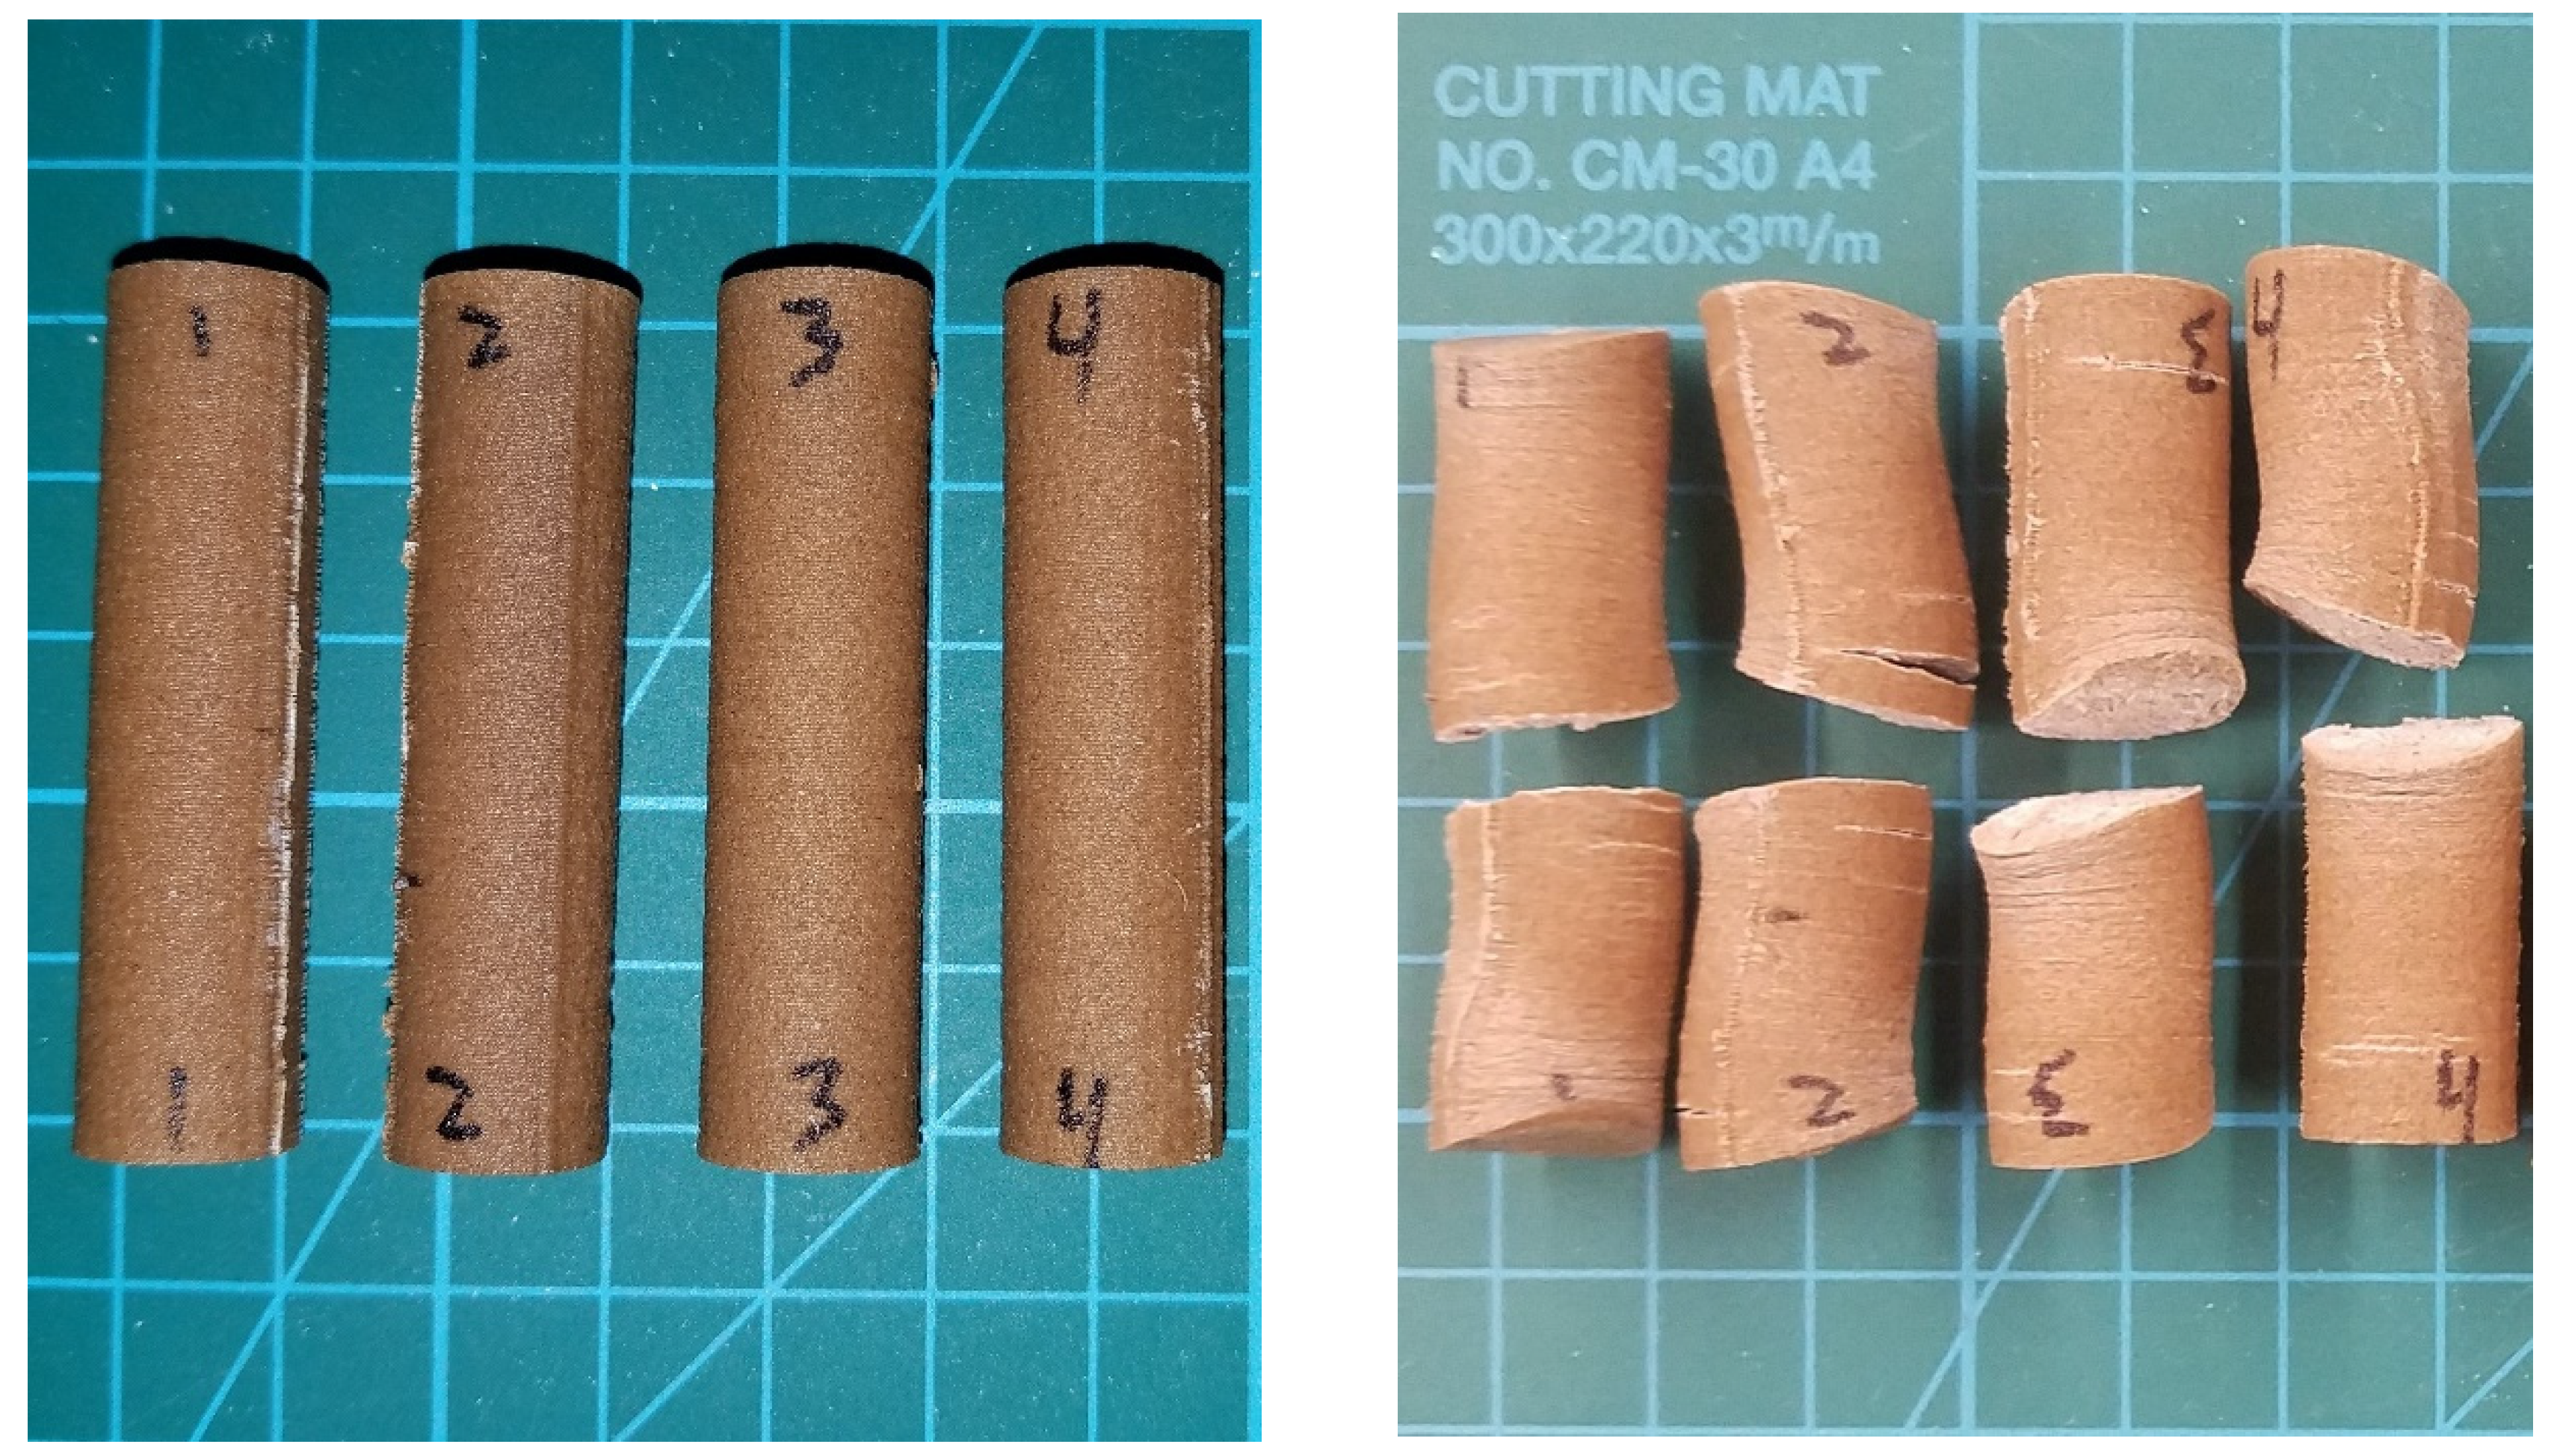
Compression tests were completed in accordance to ASTM D695 Standard Test Method for Compressive Properties of Rigid Plastics [35]. Two platens that were attached to each grip were used to apply the compressive load while the displacement of each specimen was measured with the built-in linear variable differential transformer (LVDT). The tests were displacement controlled at a rate of 1.3 mm/min. Specimens were round cylinders measuring approximately 12.75 mm in diameter and 50 mm in length. Due to the simplicity/symmetry of the geometry, the 0° and 90° as well as the 0°/90° and −45°/45° raster orientations were effectively the same. Therefore, six specimens of just two orientations (0° and −45°/45°) were tested (see Figure 4).
2.2.4. Impact
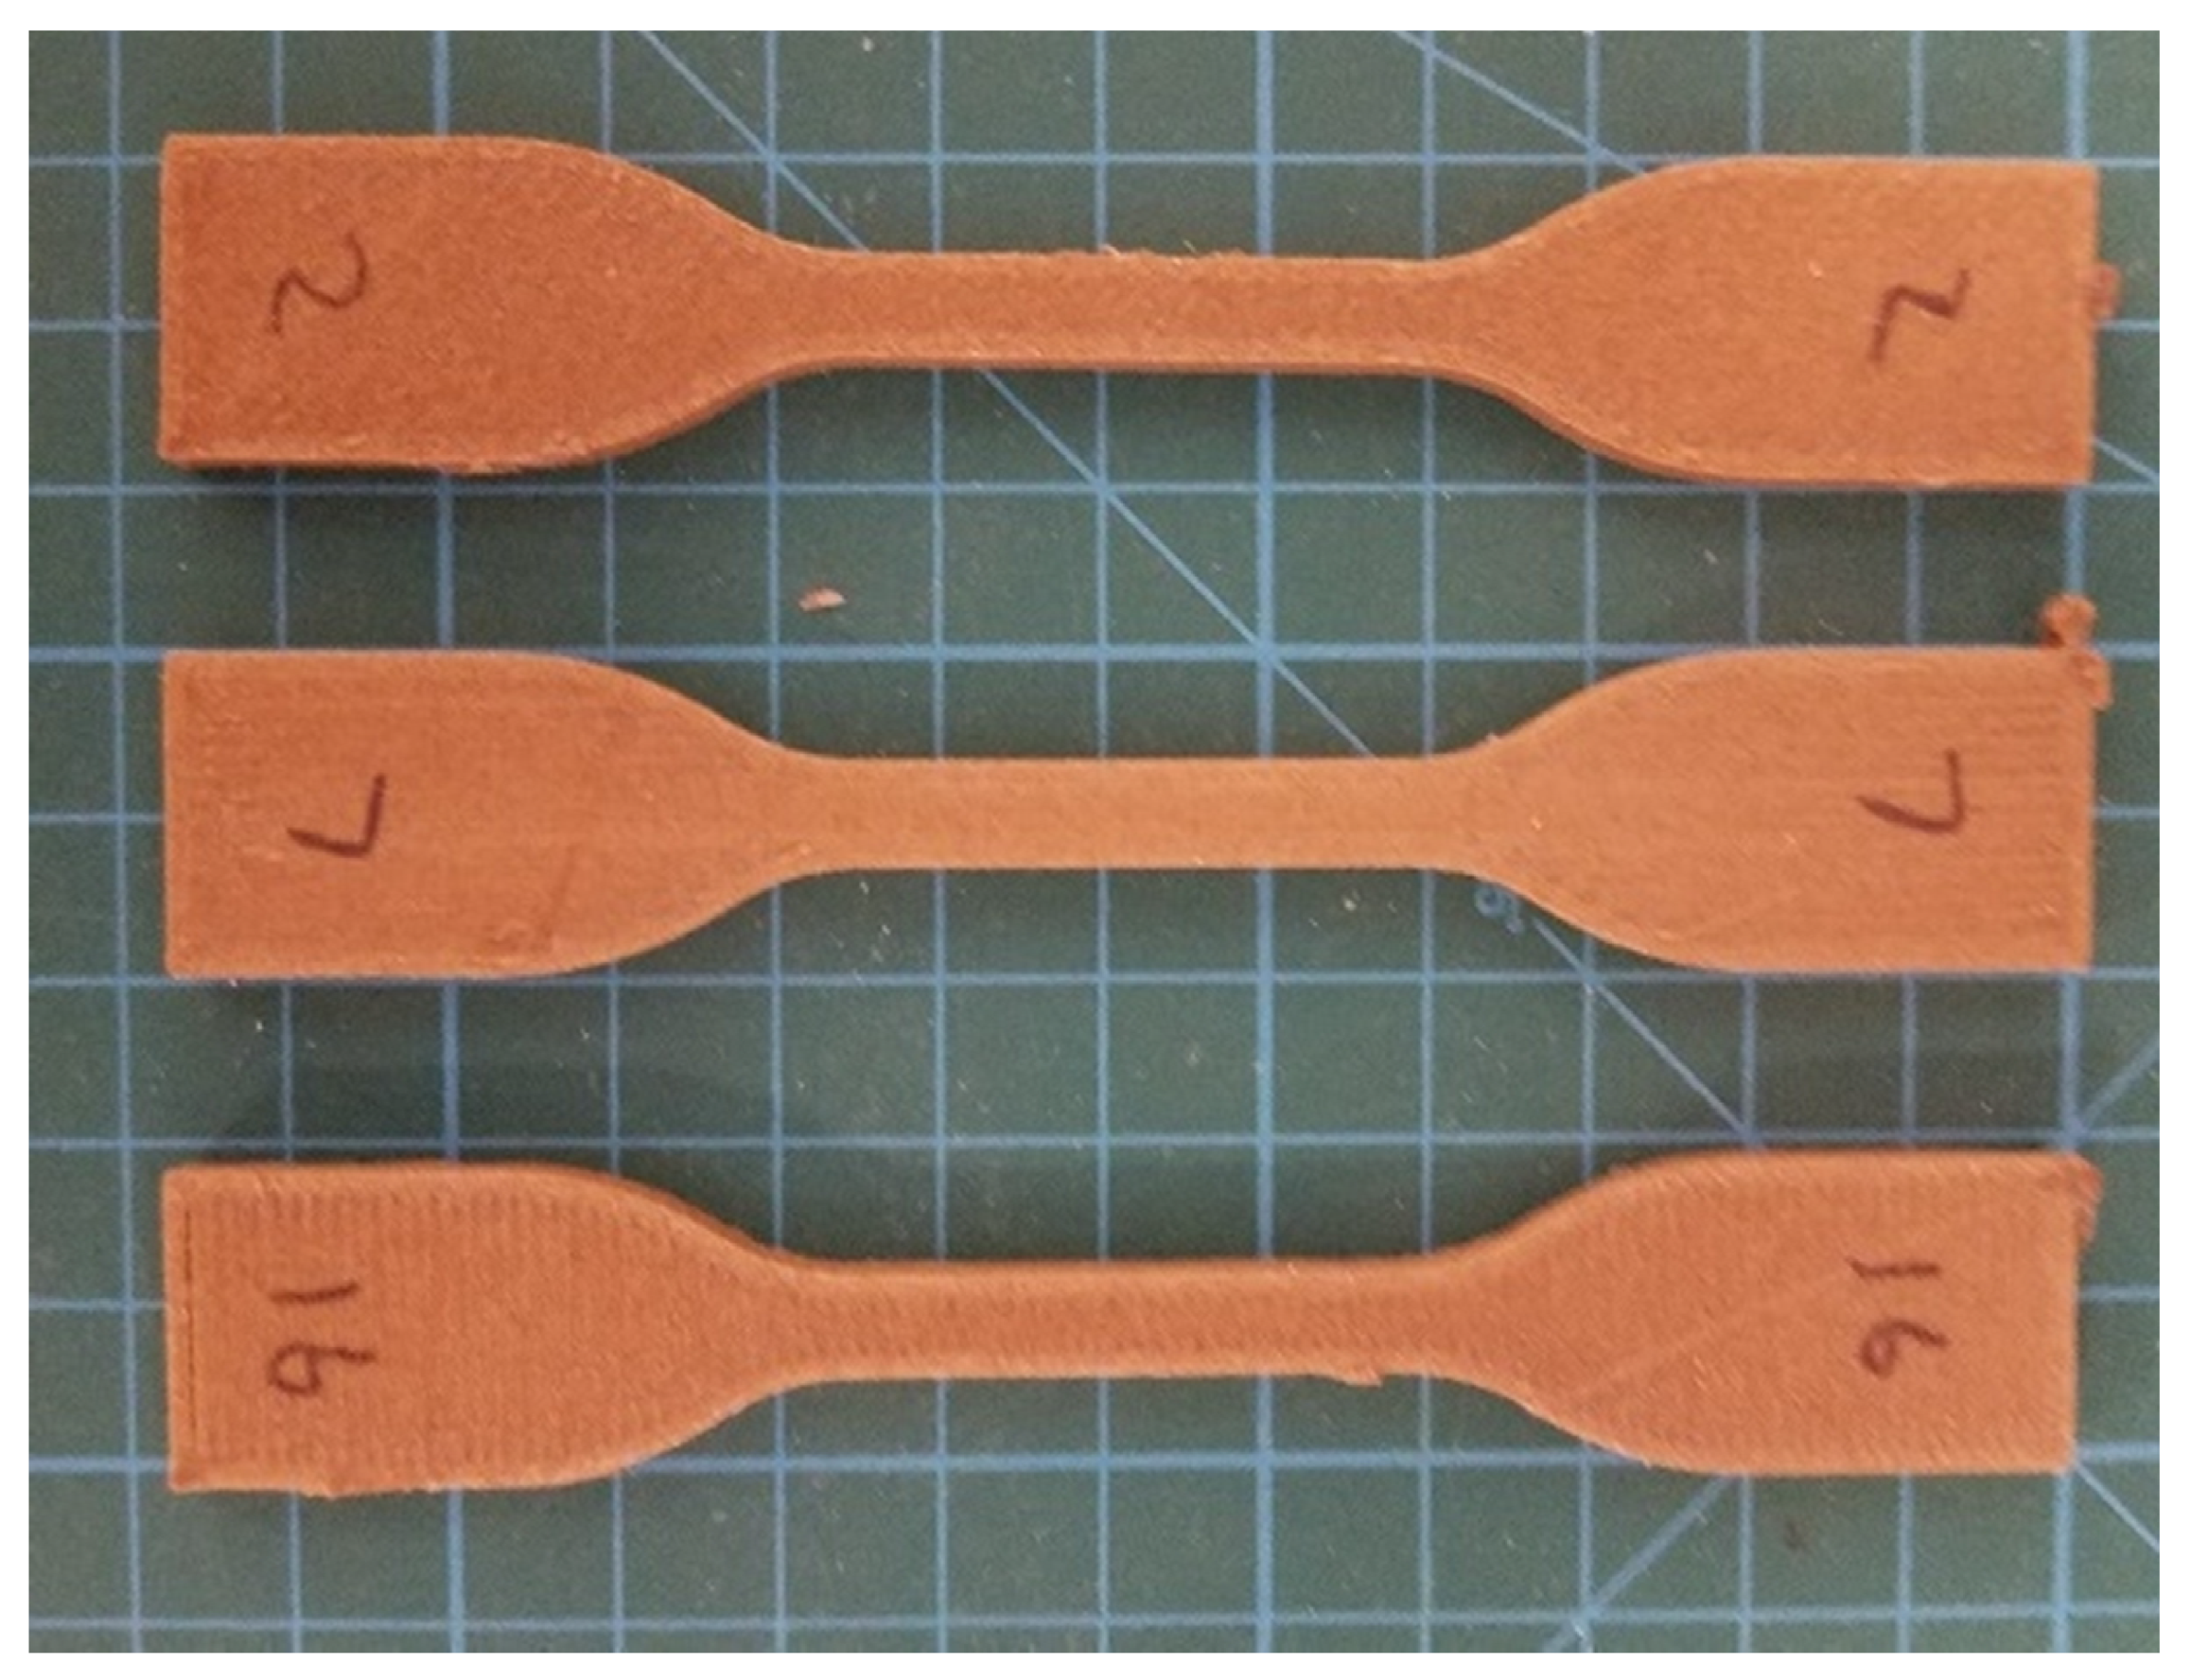
The impact tests were conducted in accordance to ASTM D256 Standard Test Methods for Determining the Izod Pendulum Impact Resistance of Plastics while using a calibrated custom build Izod Impact tester [36]. Figure 5 shows a picture of the Impact testing setup along with an example of impact specimens. Six specimens of 0°, 90°, and −45°/45° raster orientations were tested.
2.2.5. Shear
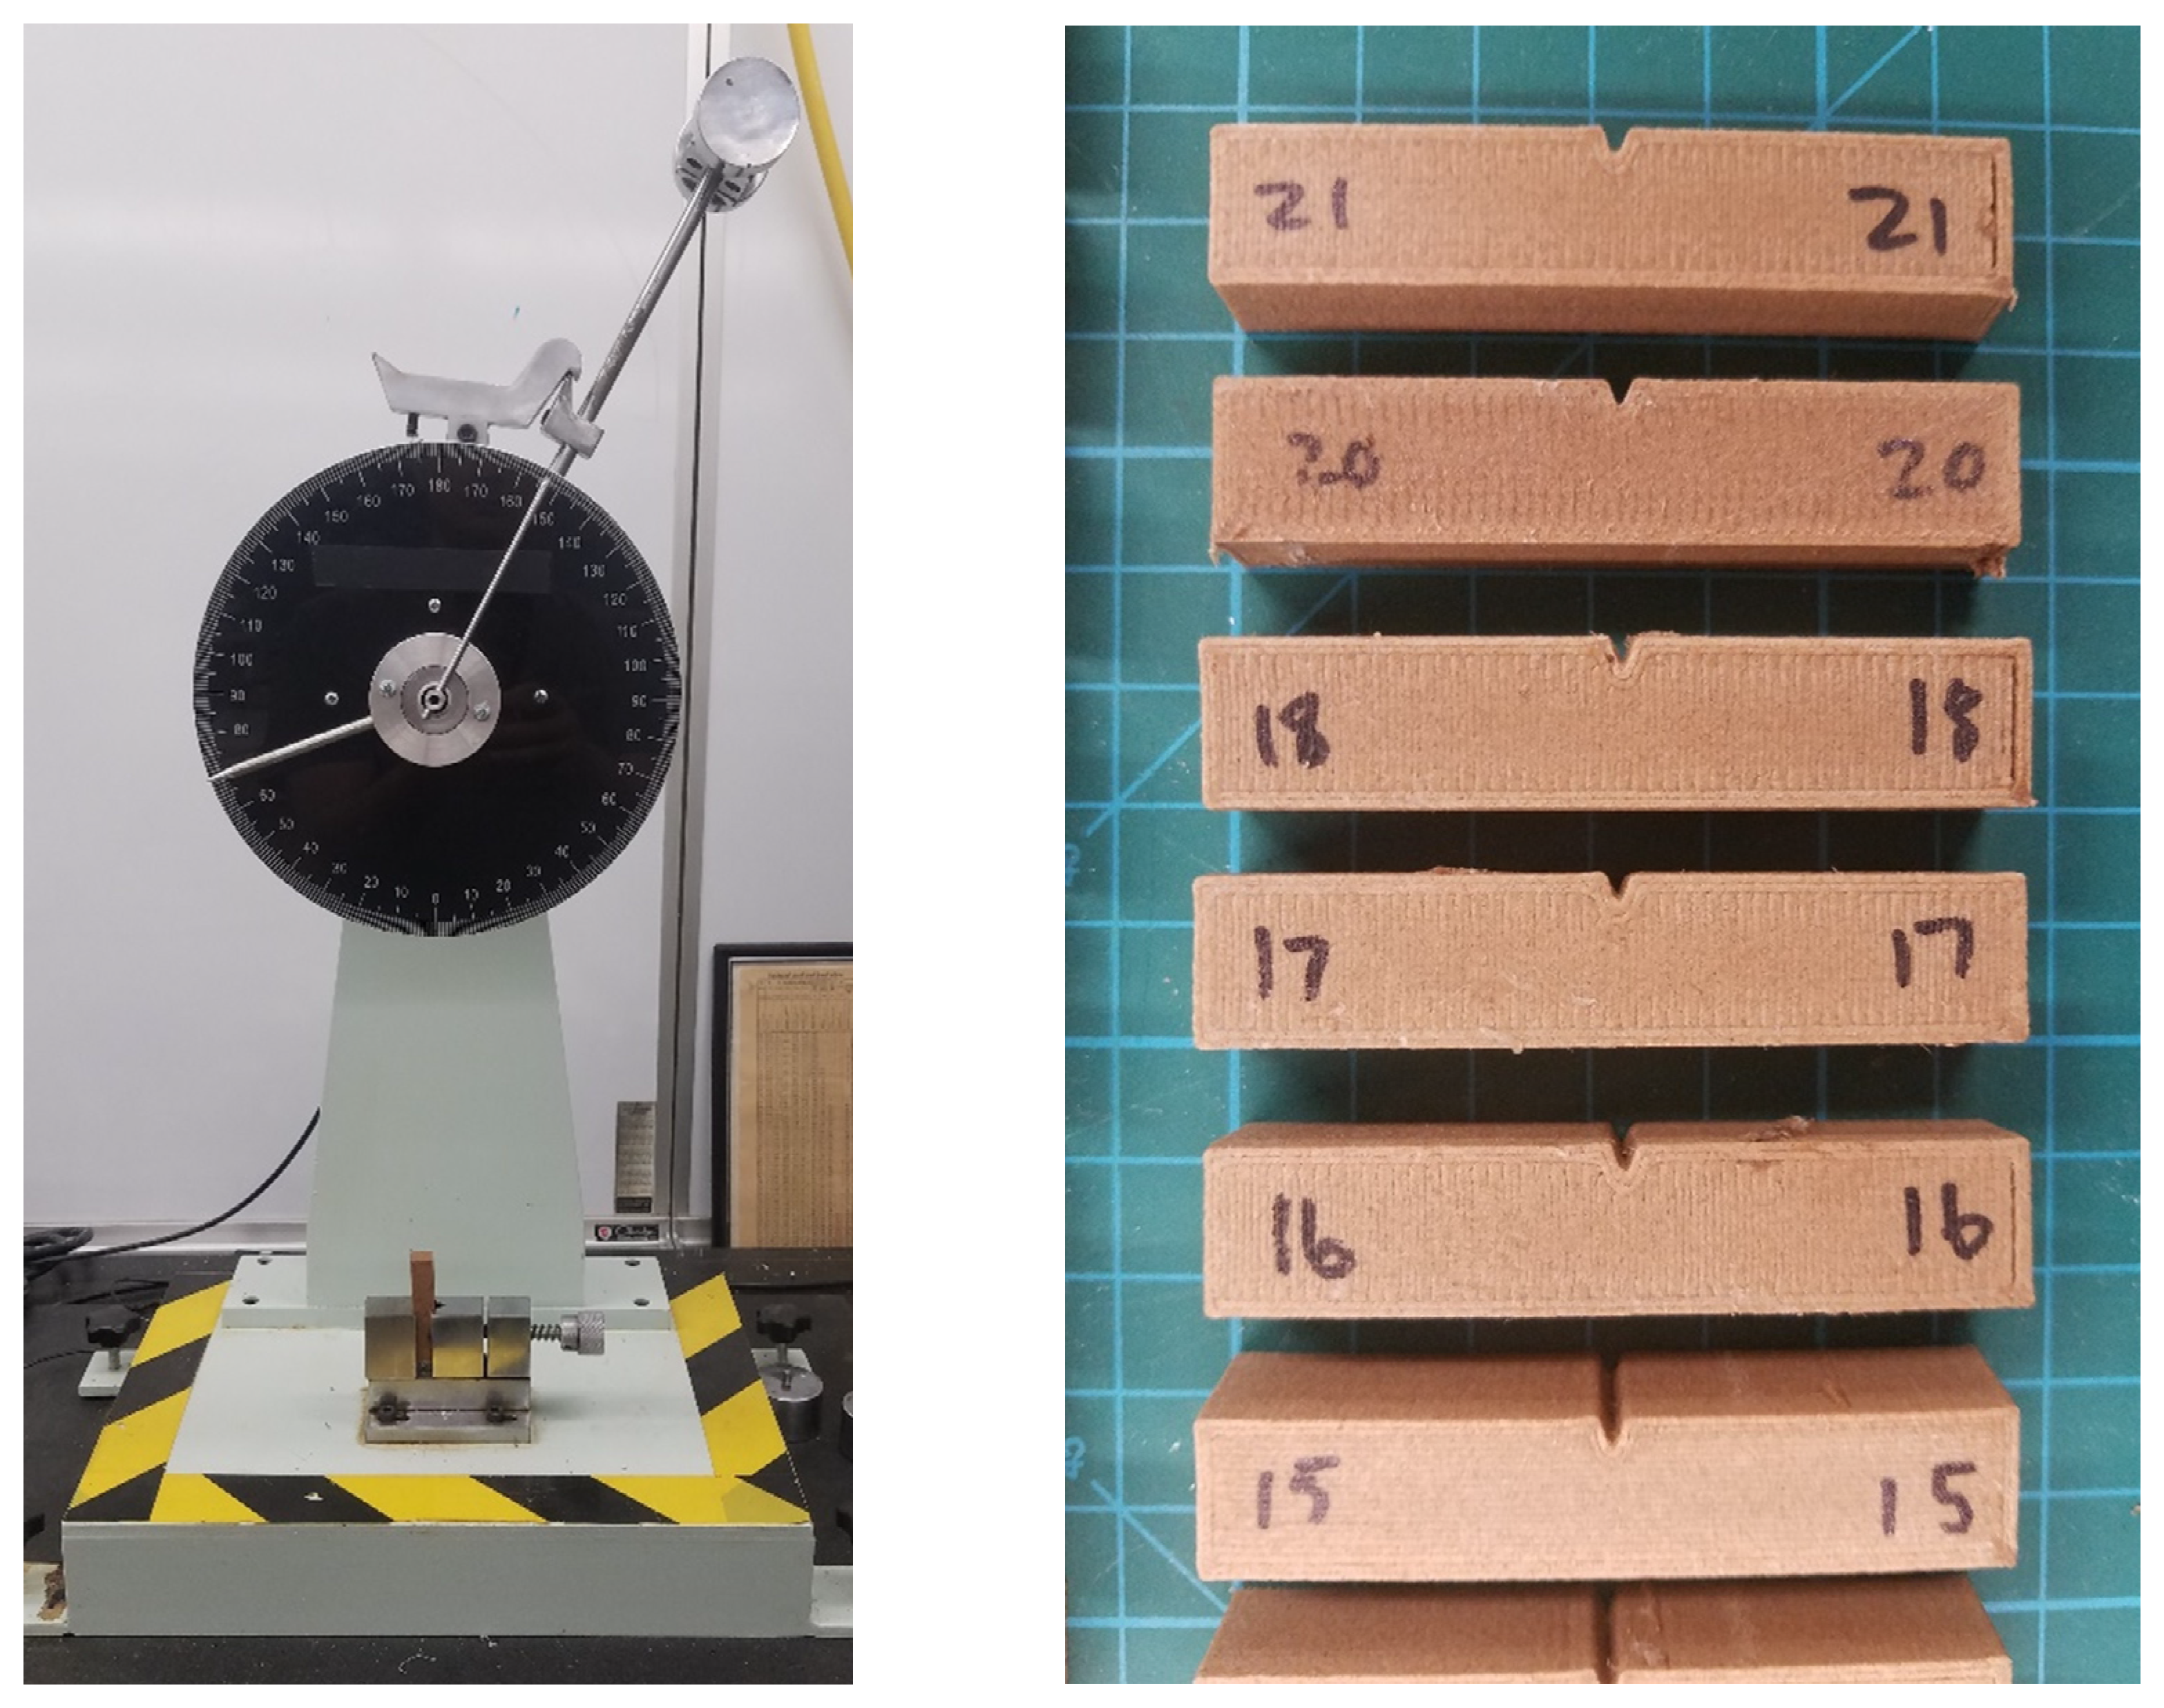
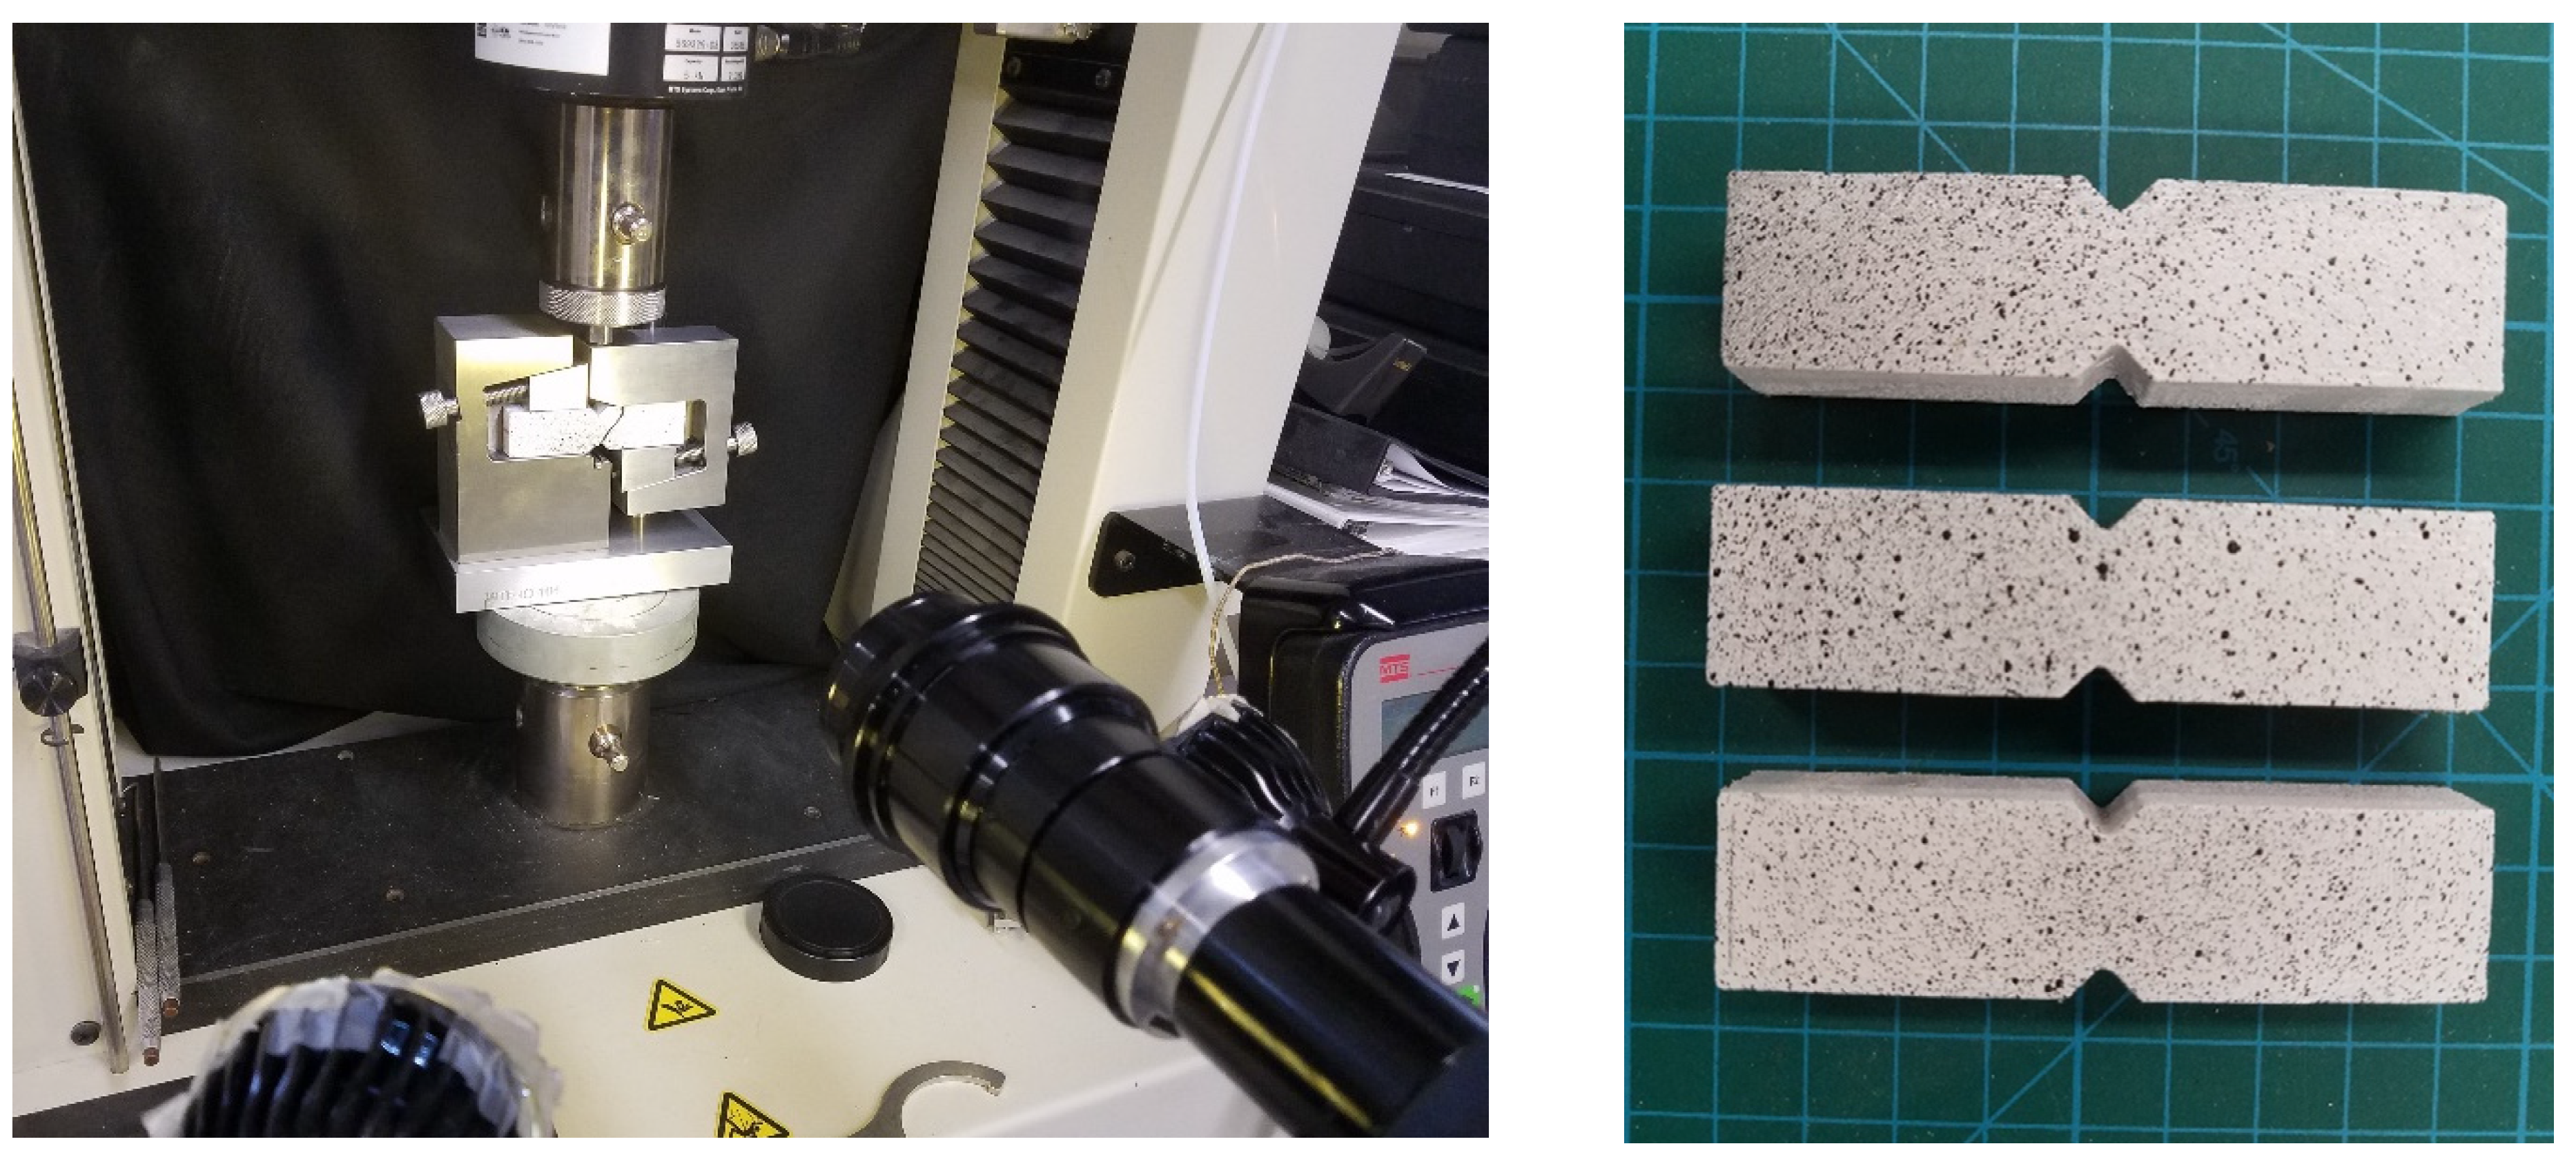
The shear tests were conducted in accordance to ASTM D5379-19 Standard Test Method for Shear Properties of Composite Materials by the V-Notched Beam Method using a v-notched beam test fixture as shown in Figure 6 [37]. Prior to testing, the specimens were prepped for digital image correlation (DIC) strain measurement by spray painting a fully white background and then black speckles were applied by spray paint can. The speckles would be tracked by DIC software. Three specimens of 0°, 90°, and −45°/45° raster orientations were tested.
Strain data were collected while using a custom created DIC capture system. This system uses a LabView program that captures and image and a load cell measurement simultaneously. The pictures are captured using an Allied Vision Technologies Marlin F-046 camera (Allied Vision Technologies, Stadtroda, Thuringia, Germany). Pictures and corresponding load values are then converted into stress/strain values using GOM Correlate [38].
3. Results
3.1. Tensile
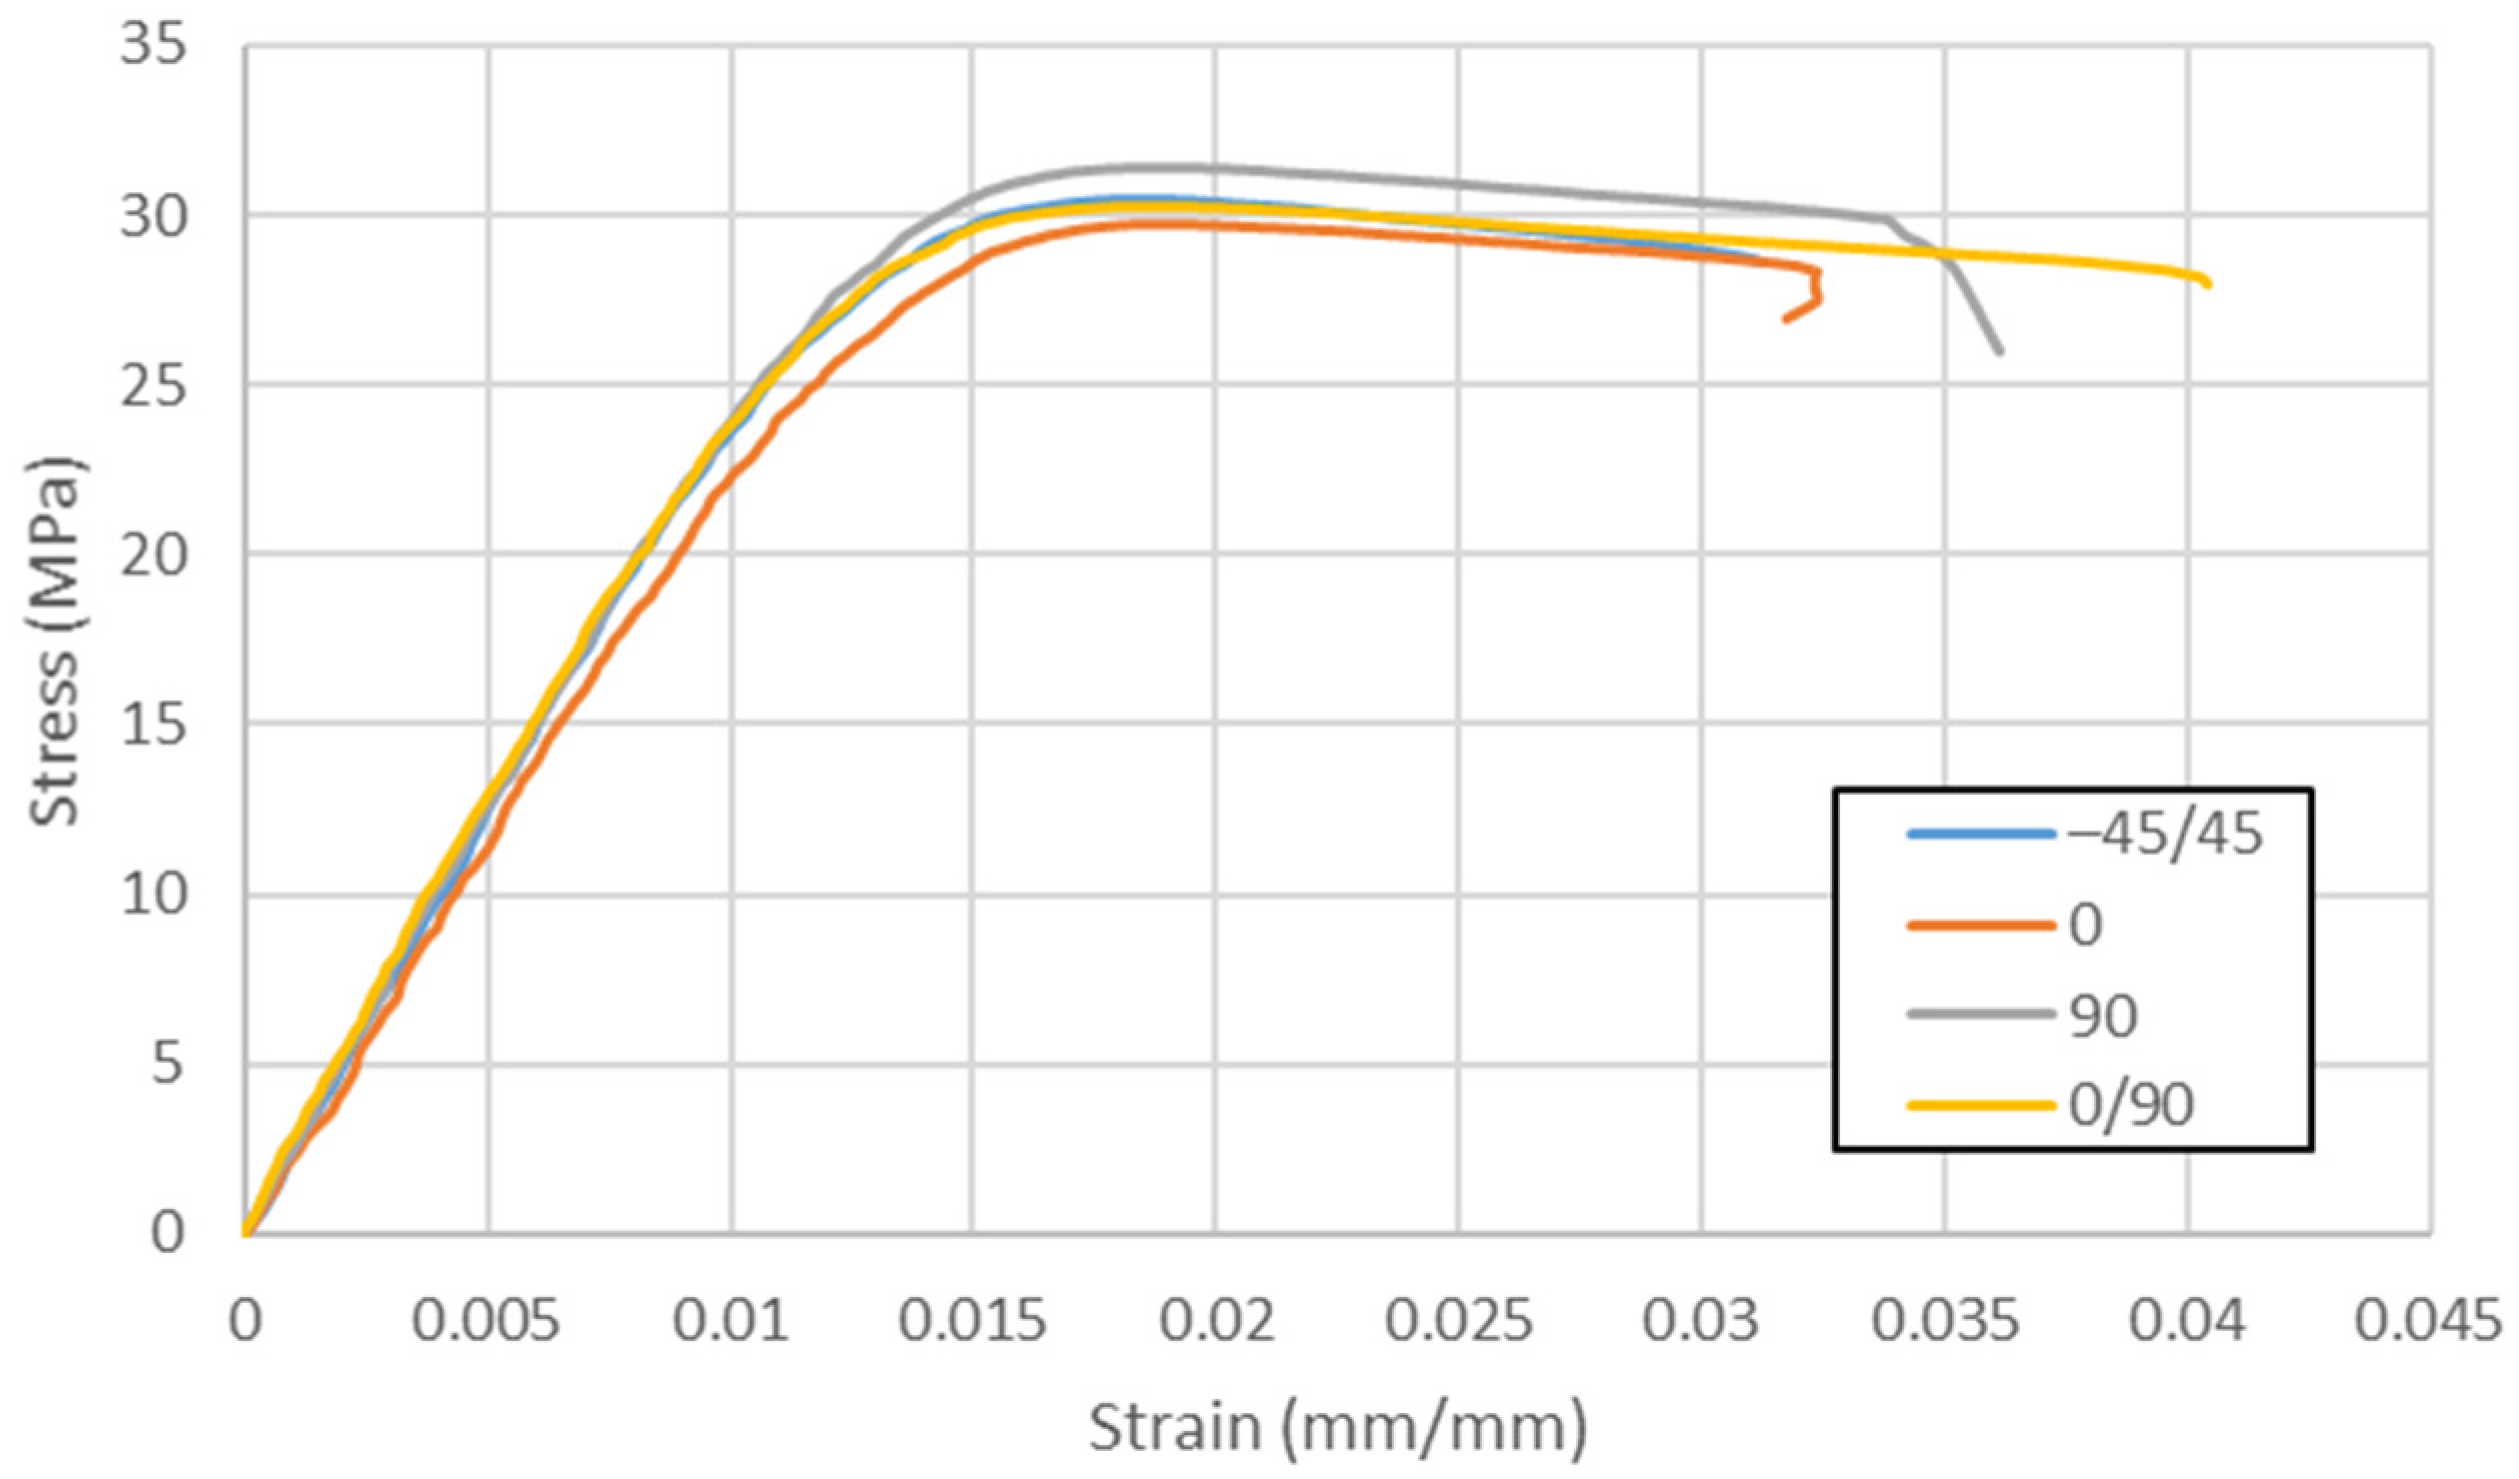
The average tensile testing results with standard deviations are shown for each raster orientation in Table 2. Figure 7 shows representative stress-strain curves of each raster orientation.
All of the raster orientations resulted in comparable ultimate tensile strengths with variations between the four orientations. However, there was a notable difference seen in the ductility of the material, depending on raster orientation. The 0°/90° orientation was found to be the most ductile.
3.2. Flexural
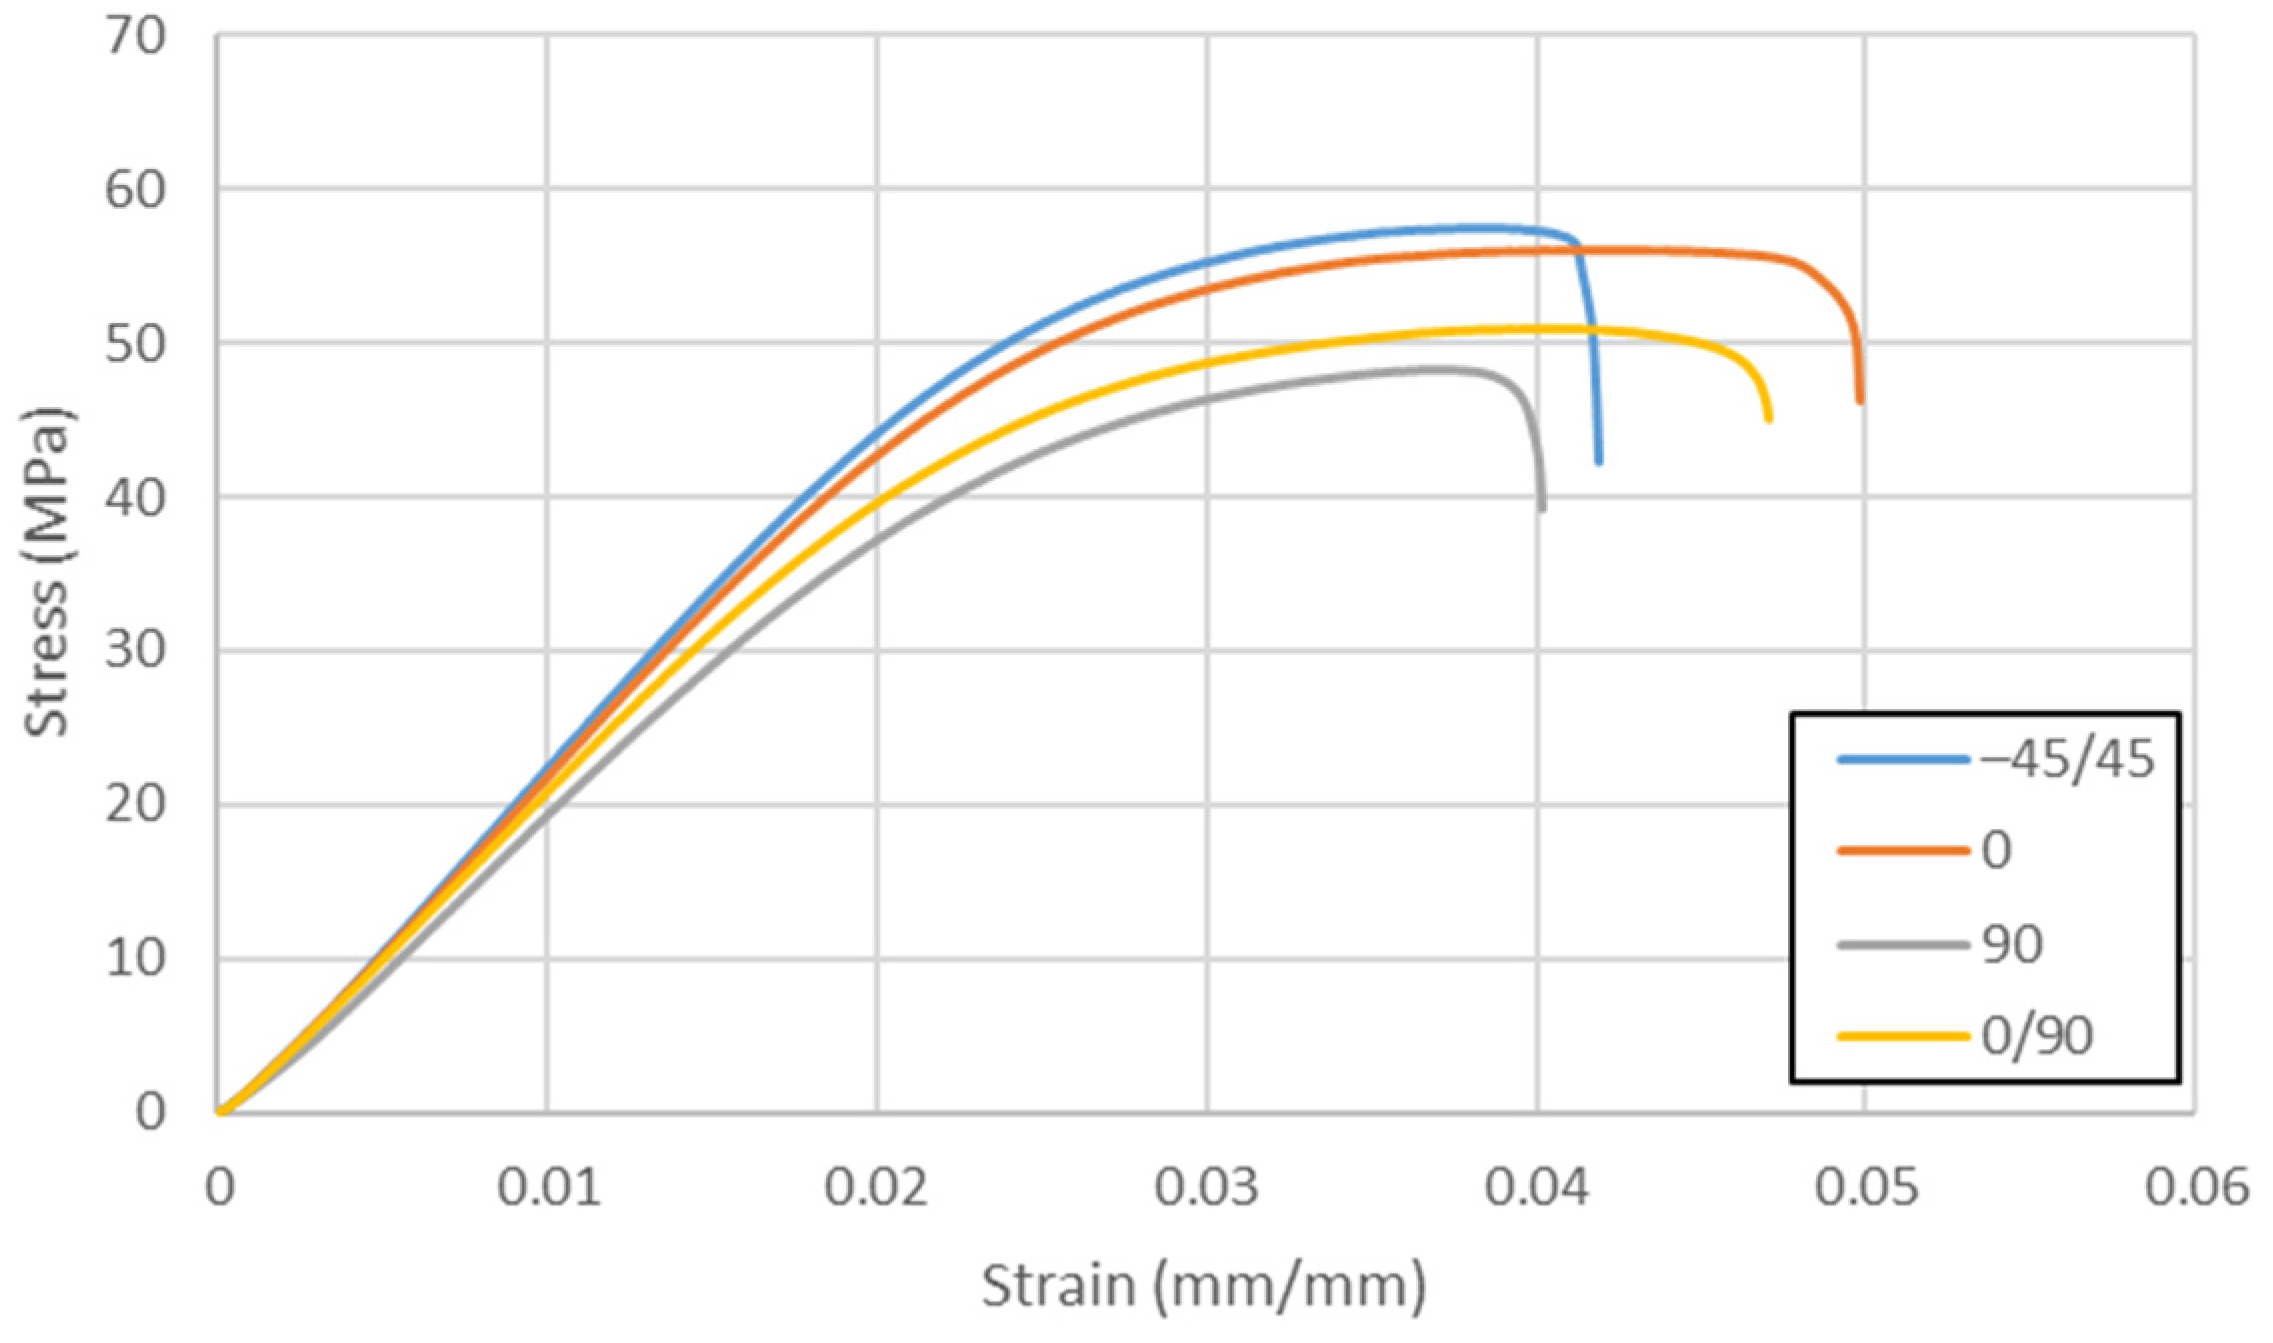
Table 3 shows the average flexural testing results and standard deviations for each raster orientation. Figure 8 displays representative stress-strain curves from the flexural testing for each raster orientation.
The 90° orientation resulted in the lowest ultimate flexural strength as well as the least ductility. This result matches intuition. Because it should be expected that side by side bonding would be not as strong as continuous length of material extruded (as in the 0° direction). The 0° and −45°/45° orientation produced higher ultimate flexural strengths. Alternating orientation of 0°/90° had lower strength at the benefit of better ductility. Overall, the 0° orientation had the best fracture toughness by having comparable strength to the best results, while also being the most ductile.
3.3. Compression
3.4. Impact
Izod impact tests were conducted in order to record the energy absorption of the material before fracturing in a fast impact fracture. Table 5 shows the average results and standard deviation for various raster orientations. Significant differences were seen between the varying orientations. The 0° orientation clearly performed the best with an impact energy absorption double the −45°/45° and triple the 90°.
3.5. Shear
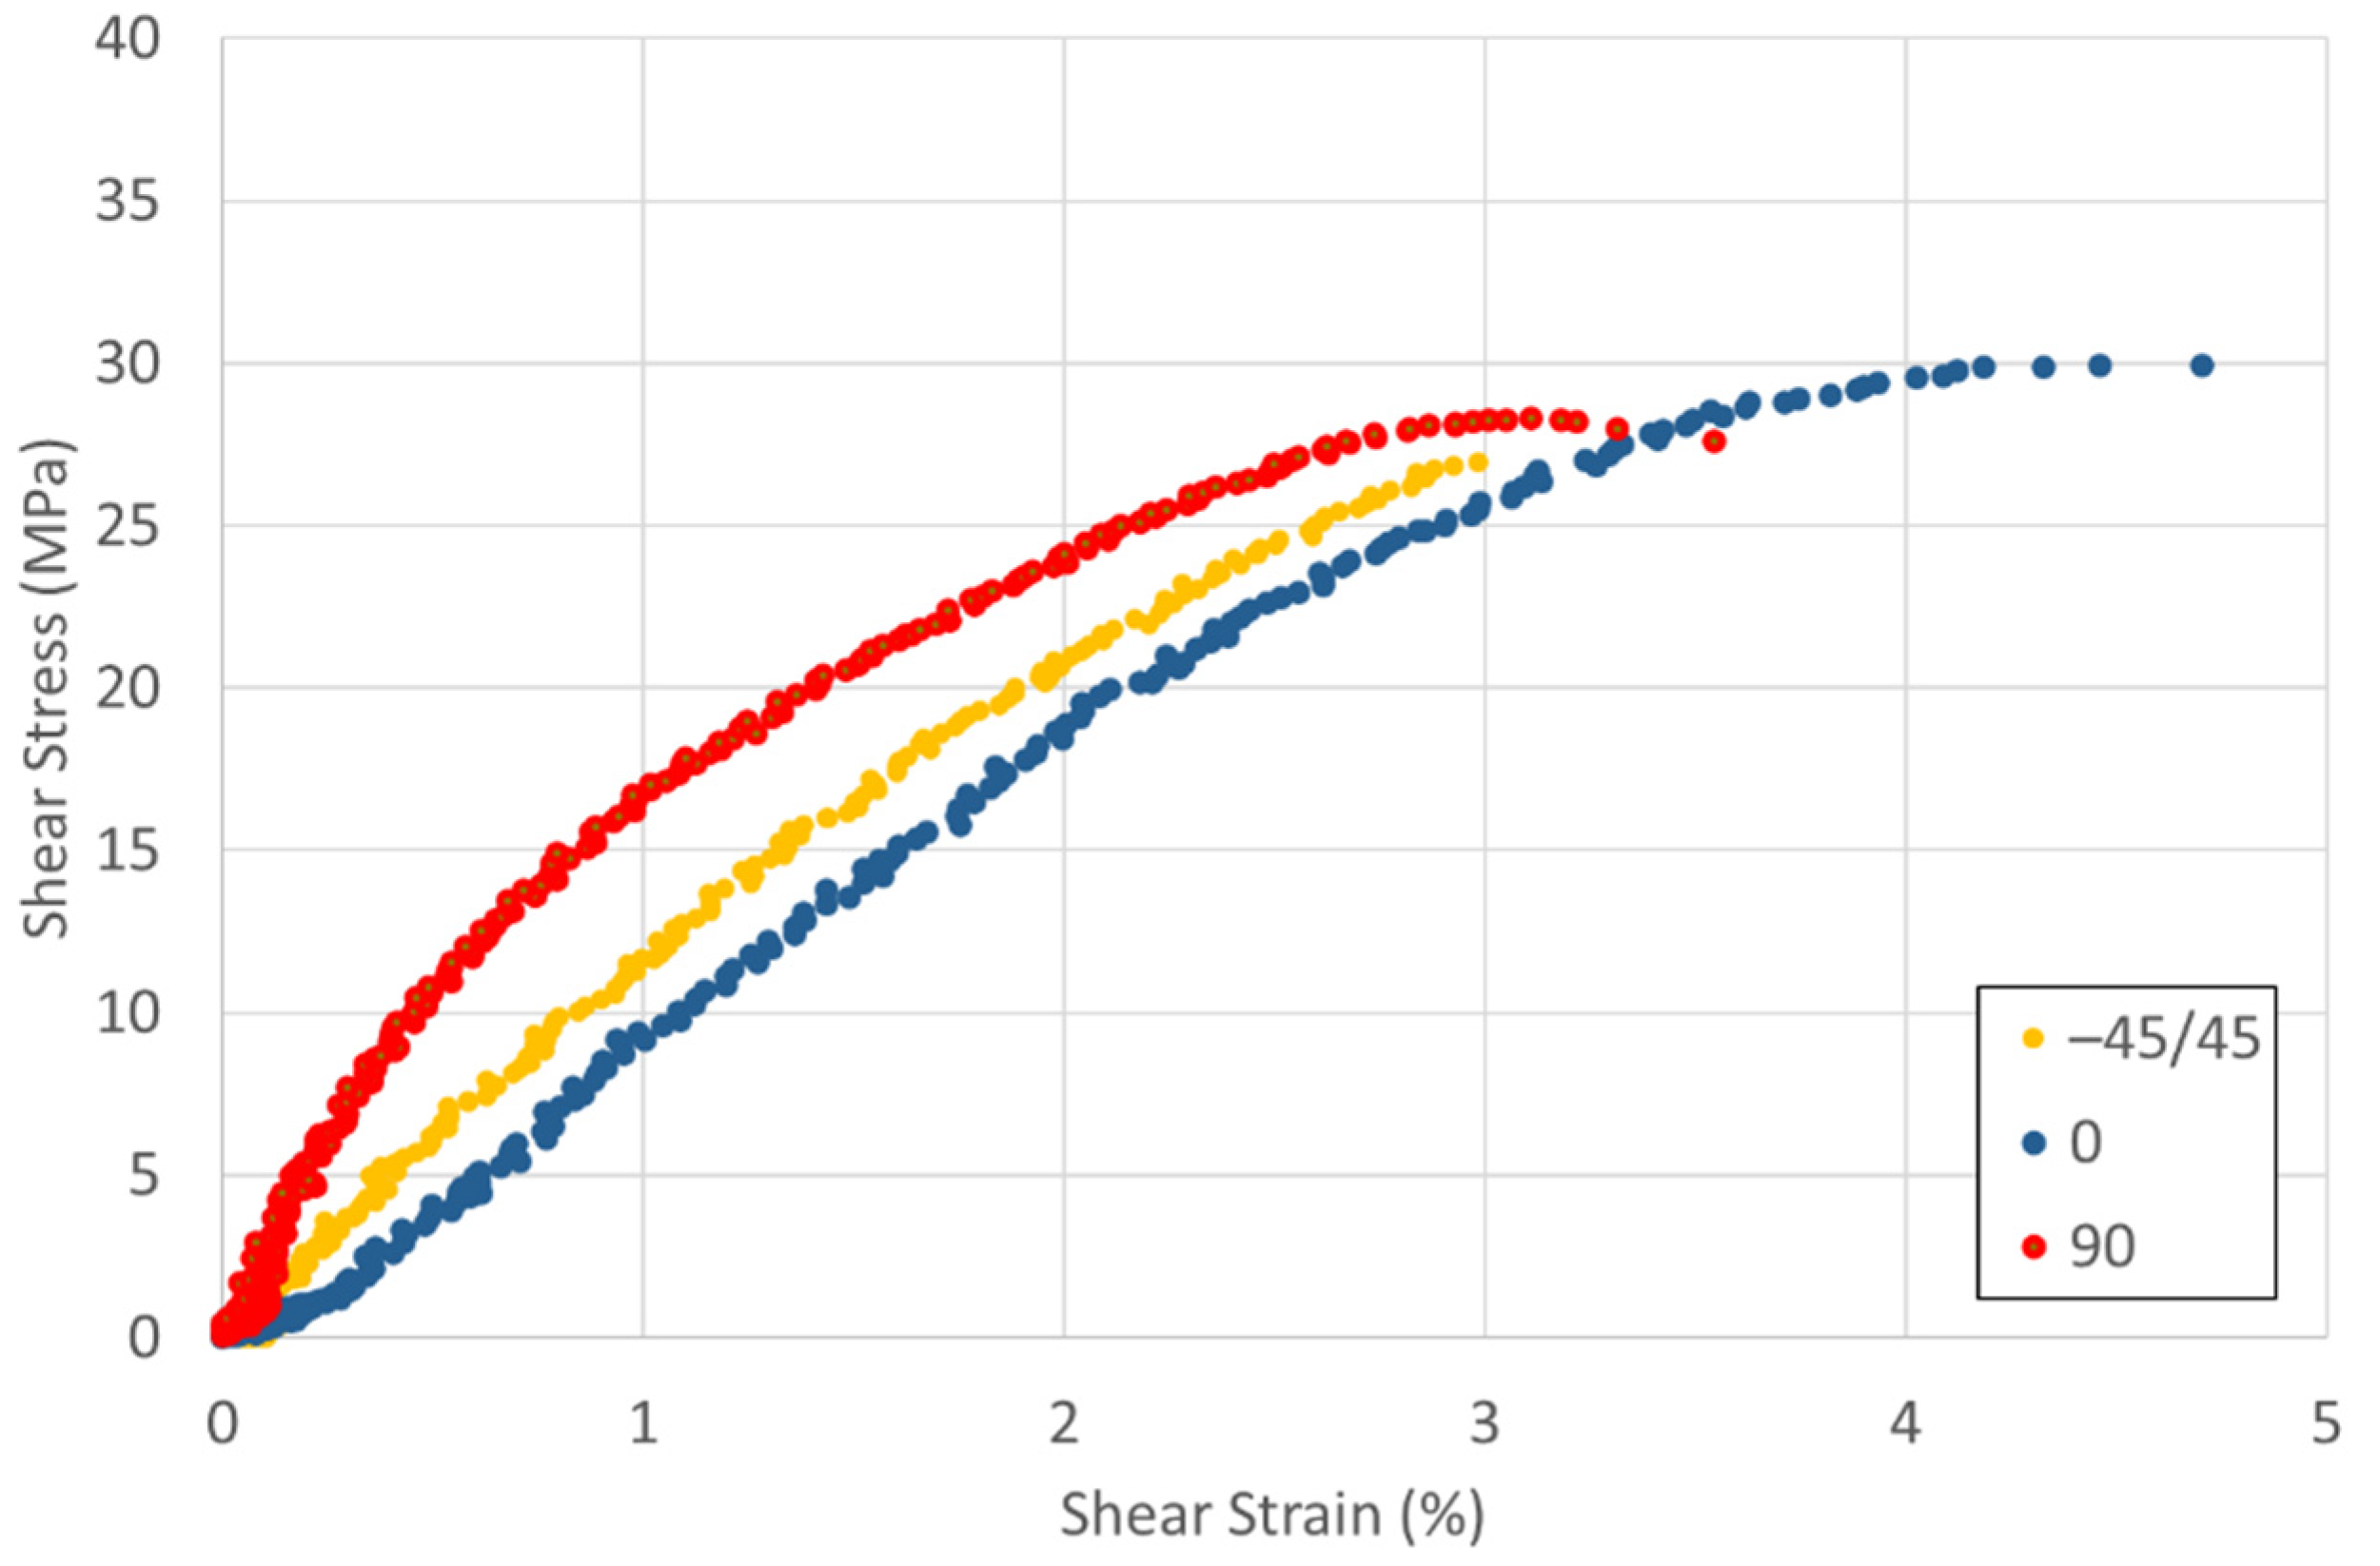
The ultimate shear strength and shear chord modulus of elasticity were recorded from shear tests. Table 6 shows the results. Figure 10 shows shear stress–strain curves. It can be noted that all of the shear tests show brittle behavior. The 0° orientation had the highest ultimate shear strength (29 MPa) when compared to the other orientations, as expected. The −45°/45° orientations had the lowest ultimate shear strength at 25 MPa. Interestingly, the 0° orientation also had the lowest shear modulus of elasticity.
4. Discussion
The composite material that was evaluated in this study used bamboo as a reinforcement material, not fibers, but a bamboo powder filler. Bamboo’s sustainable natural reinforcement fibers provides an environmentally friendly option to compete with other composites. Specifically, bamboo infused PLA for AM is a topic that has limited data available.
From the results of the testing in this study, orientation had little effect on ultimate tensile strength with all orientations being within 3 MPa of each other. However, a more notable change in ductility was seen in different orientations. The 0° orientation was seen to be the least ductile at a maximum elongation of 2.428 ± 0.49%, while the 0°/90° orientation was the most ductile at 5.074 ± 1.23%. Flexural testing showed slight changes that were based on orientation. The 0° orientation was determined in order to perform the best under flexure, for it had nearly the highest ultimate flexure strength while also being the must ductile, providing the highest fracture toughness. Compression testing concluded that there were no notable differences in mechanical strength between orientations and similar results can be expected independent upon orientation. Impact testing found that nearly triple the amount of impact energy can be absorbed in the 0° orientation when compared to the 90° and double the amount of impact energy when compared to the −45°/45°. Shear testing found that the composite material was extremely brittle in shear and no notable differences were seen in the ultimate shear strength, while, again, the 0° orientation still had a slight advantage over the other orientations.
When comparing the AM bamboo filled PLA to other bamboo fiber reinforced polymer composites made from tradition methods, it was found to have comparable if not better (assuming 11.8% bamboo filler as calculated in Equation (1)) tensile and flexural strength [25]. The AM of the material was also found to produce satisfactory parts of limited defects with relative ease. Reviewing neat PLA, the AM bamboo/PLA composite produced strength that was nearly half that of neat PLA in tensile and flexural testing [32]. However, the bamboo/PLA looked to be less mechanically susceptible to print orientations differences, which could be of use when used in applications of varying loading directions. Overall, the results of this study found that the AM of bamboo filled PLA composite is an effective means of producing an environmentally friendly, recyclable, and sustainable bamboo reinforced polymer-matrix composite.
5. Conclusions
Bamboo filled PLA composite material was AM using FFF. Four raster orientation angles (0°, 90°, 0°/90°, and −45°/45°) were evaluated for anisotropic effects. Tensile, flexure, compression, impact, and shear tests were all conducted in order to provide mechanical strength characteristics. It was found that the raster orientation had the largest effect on ductility and impact energy absorption. The 0° orientation was found to perform the best in all categories, except tensile testing, where it was found to have the least strength and ductility of the four orientations.
AM bamboo filled PLA was found to produce satisfactory parts with limited defects. The AM bamboo composites were also seen to have similar mechanical properties to certain bamboo fiber reinforced plastics, of which were traditionally manufactured and have nearly half the strength of neat PLA. Future work could include a mechanistic analysis of bamboo percentage affects. The material is also an environmentally friendly option when compared to other polymer-matrix composites due to the natural and sustainable reinforcement fibers that bamboo offers.
Author Contributions
Conceptualization, T.L.; methodology, T.L.; analysis, T.L. and S.L.; data curation, T.L. and S.L.; writing—original draft preparation, S.L.; writing—review and editing, T.L. and S.L.; visualization, T.L. and S.L. Both authors have read and agreed to the published version of the manuscript.
Funding
Funding to purchase Esun Ebamboo filament was provided by the SD Space Grant Consortium. The Mechanical Engineering Department at South Dakota State University provided the use of material testing equipment.
Acknowledgments
The authors would like to thank the Mechanical Engineering Department and the Materials and Evaluation Testing Laboratory at South Dakota State University for the use of the material testing equipment.
Conflicts of Interest
The authors declare no conflict of interest.
References
- Jiménez-González, C.; Poechlauer, P.; Broxterman, Q.B.; Yang, B.-S.; Ende, D.A.; Baird, J.; Bertsch, C.; Hannah, R.E.; Dell’Orco, P.; Noorman, H.; et al. Key Green Engineering Research Areas for Sustainable Manufacturing: A Perspective from Pharmaceutical and Fine Chemicals Manufacturers. Org. Process. Res. Dev. 2011, 15, 900–911. [Google Scholar] [CrossRef]
- Jang, Y.-S.; Lee, J.; Malaviya, A.; Seung, D.Y.; Cho, J.H.; Lee, S.Y. Butanol production from renewable biomass: Rediscovery of metabolic pathways and metabolic engineering. Biotechnol. J. 2012, 7, 186–198. [Google Scholar] [CrossRef]
- Mohanty, A.K.; Wibowo, A.; Misra, M.; Drzal, L.T. Development of renewable resource-based cellulose acetate bioplastic: Effect of process engineering on the performance of cellulosic plastics. Polym. Eng. Sci. 2003, 43, 1151–1161. [Google Scholar] [CrossRef]
- Johnson, T. All about Carbon Fiber and How It’s Made. Available online: https://www.thoughtco.com/how-is-carbon-fiber-made-820391 (accessed on 27 August 2020).
- Kannan, R.; Ahmad, M.M.H.M. A review on mechanical properties of bamboo fiber reinforced polymer composite. Aust. J. Basic Appl. Sci. 2013, 7, 247–253. [Google Scholar]
- Faruk, O.; Bledzki, A.K.; Fink, H.-P.; Sain, M. Progress Report on Natural Fiber Reinforced Composites. Macromol. Mater. Eng. 2014, 299, 9–26. [Google Scholar] [CrossRef]
- Delgado, P.S.; Lana, S.L.B.; Ayres, E.; Patrício, P.O.S.; Oréfice, R.L. The potential of bamboo in the design of polymer composites. Mater. Res. 2012, 15, 639–644. [Google Scholar] [CrossRef] [Green Version]
- Verma, D.; Jain, S.; Zhang, X.; Gope, P.C. (Eds.) Green Approaches to Biocomposite Materials Science and Engineering; IGI Global: Hershey, PA, USA, 2016; p. 322. [Google Scholar]
- Chand, N.; Fahim, M. Bamboo Reinforced Polymer Composites. In Tribology of Natural Fiber Polymer Composites; Elsevier: Amsterdam, The Netherlands, 2008; pp. 162–179. [Google Scholar]
- Kaminski, S.; Lawrence, A.; Trujillo, D. Structural use of bamboo: Part 1: Introduction to bamboo. Struct. Eng. 2016, 94, 40–43. [Google Scholar]
- Song, K.; Ren, X.; Zhang, L. Bamboo Fiber-Polymer Composites: Overview of Fabrications, Mechanical Characterizations and Applications. Green Energy Technol. 2017, 209–246. [Google Scholar] [CrossRef]
- Kaur, N.; Saxena, S.; Gaur, H.; Goyal, P. A review on bamboo fiber composites and its applications. In Proceedings of the 2017 International Conference on Infocom Technologies and Unmanned Systems (ICTUS 2017), Dubai, UAE, 18–20 December 2017; pp. 843–849. [Google Scholar]
- Metal and Carbon Fiber 3D Printers for Manufacturing|Markforged. Available online: https://markforged.com/ (accessed on 15 October 2020).
- Sauer, M. Evaluation of the Mechanical Properties of 3D Printed Carbon Fiber Composites. Master’s Thesis, South Dakota State University, Brookings, SD, USA, 2018. [Google Scholar]
- Caminero, M.; Chacón, J.; García-Moreno, I.; Rodríguez, G. Impact damage resistance of 3D printed continuous fibre reinforced thermoplastic composites using fused deposition modelling. Compos. Part B Eng. 2018, 148, 93–103. [Google Scholar] [CrossRef]
- Hu, Z.; Thiyagarajan, K.; Bhusal, A.; Letcher, T.; Fan, Q.H.; Liu, Q.; Salem, D.; Kaushik, T. Design of ultra-lightweight and high-strength cellular structural composites inspired by biomimetics. Compos. Part B Eng. 2017, 121, 108–121. [Google Scholar] [CrossRef]
- Coughlin, N.; Drake, B.; Fjerstad, M.; Schuster, E.; Waege, T.; Weerakkody, A.; Letcher, T. Development and Mechanical Properties of Basalt Fiber-Reinforced Acrylonitrile Butadiene Styrene for In-Space Manufacturing Applications. J. Compos. Sci. 2019, 3, 89. [Google Scholar] [CrossRef] [Green Version]
- Wang, X.; Jiang, M.; Zhou, Z.; Gou, J.; Hui, D. 3D Printing of Polymer Matrix Composites: A Review and Prospective; Elsevier Ltd.: Amsterdam, The Netherlands, 2017; Volume 110, pp. 442–458. [Google Scholar]
- Compton, B.G.; Lewis, J.A. 3D-Printing of Lightweight Cellular Composites. Adv. Mater. 2014, 26, 5930–5935. [Google Scholar] [CrossRef]
- 3DXTECH. CarbonX™ CF-PLA 3D Printing Filament. Available online: https://www.3dxtech.com/tech-data-sheets-safety-data-sheets/ (accessed on 15 October 2020).
- Daver, F.; Lee, K.P.M.; Brandt, M.; Shanks, R. Cork–PLA composite filaments for fused deposition modelling. Compos. Sci. Technol. 2018, 168, 230–237. [Google Scholar] [CrossRef]
- Xiao, X.; Chevali, V.S.; Song, P.; He, D.; Wang, H. Polylactide/hemp hurd biocoposites as sustaainable 3D printing feedstock. Compos. Sci. Technol. 2019, 184, 107887. [Google Scholar] [CrossRef]
- Prabhu, R.; Joel, C.; Bhat, T. Development and Characterization of Low Cost Bamboo Fibre Reinforced Polymer Composites. Am. J. Mater. Sci. 2017, 2017, 130–134. [Google Scholar]
- Okubo, K.; Fujii, T.; Yamamoto, Y. Development of bamboo-based polymer composites and their mechanical properties. Compos. Part A Appl. Sci. Manuf. 2004, 35, 377–383. [Google Scholar] [CrossRef]
- Xian, Y.; Ma, D.; Wang, C.; Wang, G.; Smith, L.; Cheng, H. Characterization and Research on Mechanical Properties of Bamboo Plastic Composites. Polymers 2018, 10, 814. [Google Scholar] [CrossRef] [PubMed] [Green Version]
- Zhang, K.; Wang, F.; Liang, W.; Wang, Z.; Duan, Z.; Yang, B. Thermal and Mechanical Properties of Bamboo Fiber Reinforced Epoxy Composites. Polymers 2018, 10, 608. [Google Scholar] [CrossRef] [Green Version]
- Shah, A.U.M.; Sultan, M.T.; Jawaid, M.; Cardona, F.; Abu Talib, A.R. A Review on the Tensile Properties of Bamboo Fiber Reinforced Polymer Composites. Bioressources 2016, 11. [Google Scholar] [CrossRef] [Green Version]
- Zhao, D.X.; Cai, X.; Shou, G.Z.; Gu, Y.Q.; Wang, P.X. Study on the preparation of bamboo plastic composite intend for additive manufacturing. Key Eng. Mater. 2016, 667, 250–258. [Google Scholar] [CrossRef]
- MakerBot. MakerBot—Sofware and Apps. Available online: https://www.makerbot.com/3d-printers/apps/ (accessed on 15 October 2020).
- eSUN. eSUN eBamboo 3D Filament. Available online: http://www.esun3d.net/products/208.htmll (accessed on 15 October 2020).
- Shah, A.U.M.; Sultan, M.T.; Cardona, F.; Jawaid, M.; Abu Talib, A.R.; Yidris, N. Thermal Analysis of Bamboo Fibre and Its Composites. Bioresources 2017, 12, 2394–2406. [Google Scholar] [CrossRef] [Green Version]
- Letcher, T.; Waytashek, M. Material Property Testing of 3D-Printed Specimen in PLA on an Entry-Level 3D Printer. In ASME International Mechanical Engineering Congress and Exposition; American Society of Mechanical Engineers: New York, NY, USA, 2014. [Google Scholar]
- ASTM. ASTM D638-14 Standard Test Method for Tensile Properties of Plastics; ASTM International: West Conshohocken, PA, USA, 2014. [Google Scholar]
- ASTM. ASTM D790-17 Standard Test Methods for Flexural Properties of Unreinforced and Reinforced Plastics and Electrical Insultating Materials; ASTM International: West Conshohocken, PA, USA, 2017. [Google Scholar]
- ASTM. ASTM D695-15 Standard Test Method for Compressive Properties of Rigid Plastics; ASTM International: West Conshohocken, PA, USA, 2015. [Google Scholar]
- ASTM. ASTM D256-10 Standard Test Methods for Determining the Izod Pendulum Impact Resistance of Plastics; ASTM International: West Conshohocken, PA, USA, 2010. [Google Scholar]
- ASTM. ASTM D5379/D5379M—19 Standard Test Method for Shear Properties of Composite Materials by the V-Notched Beam Method; ASTM International: West Conshohocken, PA, USA, 2019. [Google Scholar]
- GOM. GOM Correlate—Software for 3D Testing Data. Available online: https://www.gom.com/3d-software/gom-correlate.html (accessed on 15 October 2020).
Figure 1.
150× Magnified Top View of Filament (Left) and Process Image for Bamboo Powder Size Evaluation (Right).
Figure 1.
150× Magnified Top View of Filament (Left) and Process Image for Bamboo Powder Size Evaluation (Right).

Figure 2.
Example of representative printed part quality.

Figure 3.
Raster Orientations 0°, 90°, 0°/90°, −45°/45°, respectively from left to right.

Figure 4.
Example Compression Specimens Before (Left) and After (Right) Testing.

Figure 5.
Impact Testing Setup (Left) and Examples of Impact Testing Specimens (Right).

Figure 6.
Shear Test Setup after Specimen Failure (Left) and Prepped Specimens for Shear Test (Right).
Figure 6.
Shear Test Setup after Specimen Failure (Left) and Prepped Specimens for Shear Test (Right).

Figure 7.
Representative Tensile Stress-Strain Curves.

Figure 8.
Representative Flexural Stress-Strain Curves.

Figure 9.
Representative Compressive Stress-Strain Curves.

Figure 10.
Representative Shear Stress-Strain Curves.


Table 1.
Print Parameters Used for All Specimen Creation.
| Parameter | Value |
|---|---|
| Infill Style | Lines |
| Infill % | Solid (100%) |
| Nozzle | 0.6 mm |
| Layer Height | 0.2 mm |
| Contours/Shells | 2 |
| Nozzle Temperature | 230 °C |
| Build Plate Temperature | 50 °C |
| Print Speed | 60 mm/s |
Table 2.
Tensile Testing Results.
| Raster Orientation | Ultimate Tensile Strength (MPa) | Modulus of Elasticity (GPa) | Yield Stress (MPa) | Maximum Elongation (%) |
|---|---|---|---|---|
| −45°/45° | 32.50 ± 0.92 | 2.63 ± 0.16 | 30.33 ± 1.22 | 3.161 ± 0.64 |
| 0° | 29.21 ± 0.98 | 2.36 ± 0.09 | 27.64 ± 0.75 | 2.428 ± 0.49 |
| 90° | 31.10 ± 1.53 | 2.49 ± 0.15 | 29.38 ± 1.63 | 3.502 ± 0.96 |
| 0°/90° | 30.00 ± 1.23 | 2.49 ± 0.14 | 27.50 ± 1.52 | 5.074 ± 1.23 |
Table 3.
Flexural Testing Results.
| Raster Orientation | Ultimate Flexural Strength (MPa) | Modulus of Flexure (GPa) | Yield Stress (MPa) | Maximum Elongation (%) |
|---|---|---|---|---|
| −45°/45° | 56.76 ± 3.00 | 2.40 ± 0.14 | 48.50 ± 2.77 | 4.224 ± 0.22 |
| 0° | 54.57 ± 1.44 | 2.26 ± 0.05 | 46.33 ± 1.96 | 4.581 ± 0.49 |
| 90° | 49.35 ± 1.65 | 2.15 ± 0.12 | 41.50 ± 2.55 | 4.001 ± 0.36 |
| 0°/90° | 52.38 ± 0.82 | 2.22 ± 0.04 | 44.45 ± 2.26 | 4.481 ± 0.46 |
Table 4.
Compression Testing Results.
| Raster Orientation | Ultimate Compressive Strength (MPa) | Compressive Modulus (GPa) |
|---|---|---|
| −45°/45° | 48.55 ± 4.31 | 1.89 ± 0.05 |
| 0° | 48.07 ± 2.43 | 1.95 ± 0.09 |
Table 5.
Izod Impact Testing Results.
| Raster Orientation | Impact Energy (J/m) |
|---|---|
| −45°/45° | 21.01 ± 0.84 |
| 0° | 42.94 ± 1.22 |
| 90° | 13.94 ± 2.68 |
Table 6.
Shear Testing Results.
| Raster Orientation | Ultimate Shear Strength (MPa) | Shear Chord Modulus of Elasticity (GPa) |
|---|---|---|
| −45°/45° | 25.11 ± 4.371 | 1.32 ± 0.25 |
| 0° | 29.13 ± 0.97 | 1.13 ± 0.34 |
| 90° | 26.84 ± 2.06 | 2.07 ± 0.68 |
Publisher’s Note: MDPI stays neutral with regard to jurisdictional claims in published maps and institutional affiliations. |
© 2020 by the authors. Licensee MDPI, Basel, Switzerland. This article is an open access article distributed under the terms and conditions of the Creative Commons Attribution (CC BY) license (http://creativecommons.org/licenses/by/4.0/).
Share and Cite
MDPI and ACS Style
Landes, S.; Letcher, T. Mechanical Strength of Bamboo Filled PLA Composite Material in Fused Filament Fabrication. J. Compos. Sci. 2020, 4, 159. https://doi.org/10.3390/jcs4040159
AMA Style
Landes S, Letcher T. Mechanical Strength of Bamboo Filled PLA Composite Material in Fused Filament Fabrication. Journal of Composites Science. 2020; 4(4):159. https://doi.org/10.3390/jcs4040159
Chicago/Turabian StyleLandes, Scott, and Todd Letcher. 2020. "Mechanical Strength of Bamboo Filled PLA Composite Material in Fused Filament Fabrication" Journal of Composites Science 4, no. 4: 159. https://doi.org/10.3390/jcs4040159