1. Introduction
Fibres are fundamental constituents of many composites that carry nearly the entire load in polymer matrix composites as well as in ceramic matrix composites after saturation of matrix damage. Multifilament tows are pertinent with respect to the length scale for fracture. Furthermore, testing fibre tows is a powerful technique owing to the wide variability in fracture strengths exhibited by glass and ceramic filaments. A single test on a multifilament tow can provide hundreds or thousands of data points, while testing hundreds or thousands of single-fibre specimens would require many weeks to months of careful sample preparation and tests. For these reasons, tow testing is an attractive technique which drew the attention of many researchers [
1,
2,
3,
4,
5,
6,
7,
8,
9,
10,
11,
12,
13,
14,
15,
16,
17,
18]. In the past, most of the work was devoted to fast fractures and the statistical distribution of strengths [
1,
2,
3,
4,
5,
6,
7,
8,
9]. Recently, emphasis was placed on the resistance to static fatigue [
10,
11,
12,
13,
14,
15,
16,
17,
18]. In [
15], it was shown that static fatigue testing of fibre tows under constant deformation is a very powerful technique for the investigation of slow crack growth in filaments activated by environment. Each fibre is subject to constant stress during the entire test. However, the control of deformations during a long period is an essential prerequisite for sound analysis.
Several inorganic fibres are sensitive to subcritical crack growth activated by the environment. Many papers have investigated the phenomenon of the slow crack growth mechanism in glass notched specimens [
19,
20,
21,
22,
23,
24,
25]. The phenomenon results from reaction between a strained Si-O-Si bond and water at notch/crack tip [
16,
17,
18,
19]. The power function
V = A·KIn has been shown to provide a sound description of subcritical crack propagation, although the exact relationship between crack velocity
V and stress intensity factor
KI was not established [
22,
26]. A wide scatter in
n values for glass has been reported in the literature. Values between 12 and 40 measured on single filaments have been collected in [
22].
n = 15 was extracted from static fatigue tests on tows of E-glass using a complex model [
25]. In [
23,
24] it was argued that there should be a relationship between
n and applied stress. Then, it was suggested that a variety of flaw sizes and shapes, as well as a variation in residual stresses and inert strength, results in a similar variability in fatigue behaviour [
22]. In a previous paper [
15], the crack propagation diagrams
V =
V*(
KI/KIC)
n were found to consist of two distinct curves characterized by the following values of constants (
n ≈ 30,
V* ≈ 10
−6 m/s) and (
n ≈ 12,
V* ≈ 10
−9 m/s). This unusual diagram results from the presence of two families of fibres: a family of weak fibres with short life, and a family of stronger fibres with long life. The family of weak fibres was present only under small deformations.
Most research on slow crack growth in materials considered essentially the extension of a crack from the tip of a notch. However, in small diameter brittle inorganic fibres, such as glass fibres, cracks initiate instead from submicron-sized flaws having random distribution [
27,
28]. Characteristics and locations of the critical flaws are not known. As a consequence they are random variables and crack initiation is a stochastic event, as well as crack propagation [
27,
28]. The present paper proposes an approach to the investigation of the stochastic features of the behaviour of multifilament tows in static fatigue. For this purpose, the database for slow crack growth and fast fracture produced on E-glass fibre tows, was used together with stress-probability-time equations for the predictions and investigation of lifetime and residual behaviour in various conditions.
2. Theory
2.1. Single Filaments
2.1.1. Slow Crack Growth under Constant Stress
The subcritical crack growth model is based on the simple power form of crack velocity versus stress intensity factor, which is usually employed to describe the slow propagation of cracks caused by environment under load in ceramics and glass materials [
21,
22,
23,
24]:
where
V is the crack velocity,
a is the crack length,
t is time,
KI is the stress intensity factor,
KIC is the critical stress intensity factor, and
V* and
n are constants depending, respectively, on the environment and material. The environment dependence of
V* is assumed to be defined by the Arrhenius law:
where
T is the temperature,
V0* is the temperature-independent material parameter,
Ea is the activation energy (
Table 1),
R = 8.314 J·K
−1·mol
−1.
2.1.2. Filament Residual Strength
During time period
tF under constant stress
σ on the filament, cracks propagate from the initial flaw size
ai to length
aR, and the stress intensity factor increases from
KIi to
KIR. The basic equation for the time period
tF is derived from Equation (1):
where
Y is the flaw shape parameter
(for a penny-shaped crack).
The expression of residual strength
σR is derived from Equation (3):
where
σf is the initial filament strength measured at room temperature in inert conditions. Filament strengths display wide variability, as a result of the random distribution of fracture inducing flaws. Filament initial strength
σf generally follows a Weibull statistical distribution:
where
P is the failure probability,
m and
σ0 are statistical parameters,
v is the volume of a single filament,
vo is the reference volume (
vo = 1 m
3 in the present paper), strengths being ordered from smallest to largest. The reference strength of the
jth filament with failure probability
Pj is derived from Equation (5):
2.1.3. Filament Lifetime
Failure occurs when filament residual strength
σR has decreased to the applied stress σ. Filament lifetime is derived from Equation (4)
σR =
σ:
The Strength-Probability-Time relation for filaments is derived from the combination of Equations (6) and (7) [
22]:
where
P(
t,
σ,
v) is the failure probability at time
t, under constant stress
σ, for a filament with volume
v.
t* is a stress dependent scale factor:
2.2. Stress-Rupture Time Diagrams for Tows
Slow Crack Growth in Fibre Tows
The bundle model [
1,
17,
29] describes the behaviour of a population of parallel, independent and identical filaments under a tensile load. When a filament breaks the surviving filaments carry equally the applied load. The corresponding force on tow is:
where
σ is the stress on surviving filaments. Note that
σ ≥ the strengths of those
N filaments that failed.
Sf is he filament cross-sectional area;
N0 is the initial number of filaments carrying the load.
α = N/N0 is the fraction of fibres broken individually, which represents the failure probability
P of the
Nth filament, filament strengths being in ascending order.
Under constant and uniform applied strain
εa, the stress on surviving filaments is constant according to equation:
where
Ef is the filament’s Young’s modulus. The force carried by tow decreases when filaments break (Equation (10)). The lifetime of tow is reached when
F = 0 and
N =
N0. It is given by Equation (7) for the extreme value of
σf.
Under constant force
F, according to Equation (10)
σ increases when a filament fails. That filament that exhibits the longest lifetime dictates the lifetime of tow. It is referred to as critical filament. Under constant strain, this is the strongest filament in the tow. Under constant force, when the filaments fail one after one, it is defined by the following expression of failure probability associated with this filament strength in the filament strength distribution [
26]:
The lifetime of a tow is obtained by introducing the value of probability that defines the critical filament into Equation (13) derived from Equation (8):
3. Approach and Experimental Procedures
Fast and delayed failure parameters were estimated from the outcome of tensile and static fatigue tests. Calculations using strength probability time equations from the theory provided insight into the static fatigue behaviour of tows in water. The fast and delayed failure parameters were then introduced into Equations (7), (8) and (13) to determine filament lifetime distributions, stress-time-probability (STP) diagrams and size effects on lifetime, respectively. Lifetime distributions, STP diagrams and size effects for tows were derived by considering the critical filaments for constant strain or force conditions.
In the second step, the analysis of static fatigue of tows was refined on the basis of distributions of residual filament strengths derived from experimental residual tensile curves for tows obtained after an interrupted fatigue test. Finally, the residual behaviour of tows and the distributions of residual filament strengths were predicted using theoretical equations and the database in
Table 1.
3.1. Testing Procedure on E-Glass Fibre Bundles
Tensile tests were carried out on tows at room temperature:
Under monotonous loading (displacement rate = 2 μm/s) and inert environment for determination of initial behaviour and residual behaviour after static fatigue; and
In water under constant deformation (static fatigue).
The procedures for specimen preparation and testing were detailed in previous papers [
15]. The E-glass fibre bundles contained about 2000 filaments with 14 ± 2 μm diameter each. The precise number of fibres was determined from the initial slope of the stress-strain curve. Main fibre characteristics are given in
Table 1.
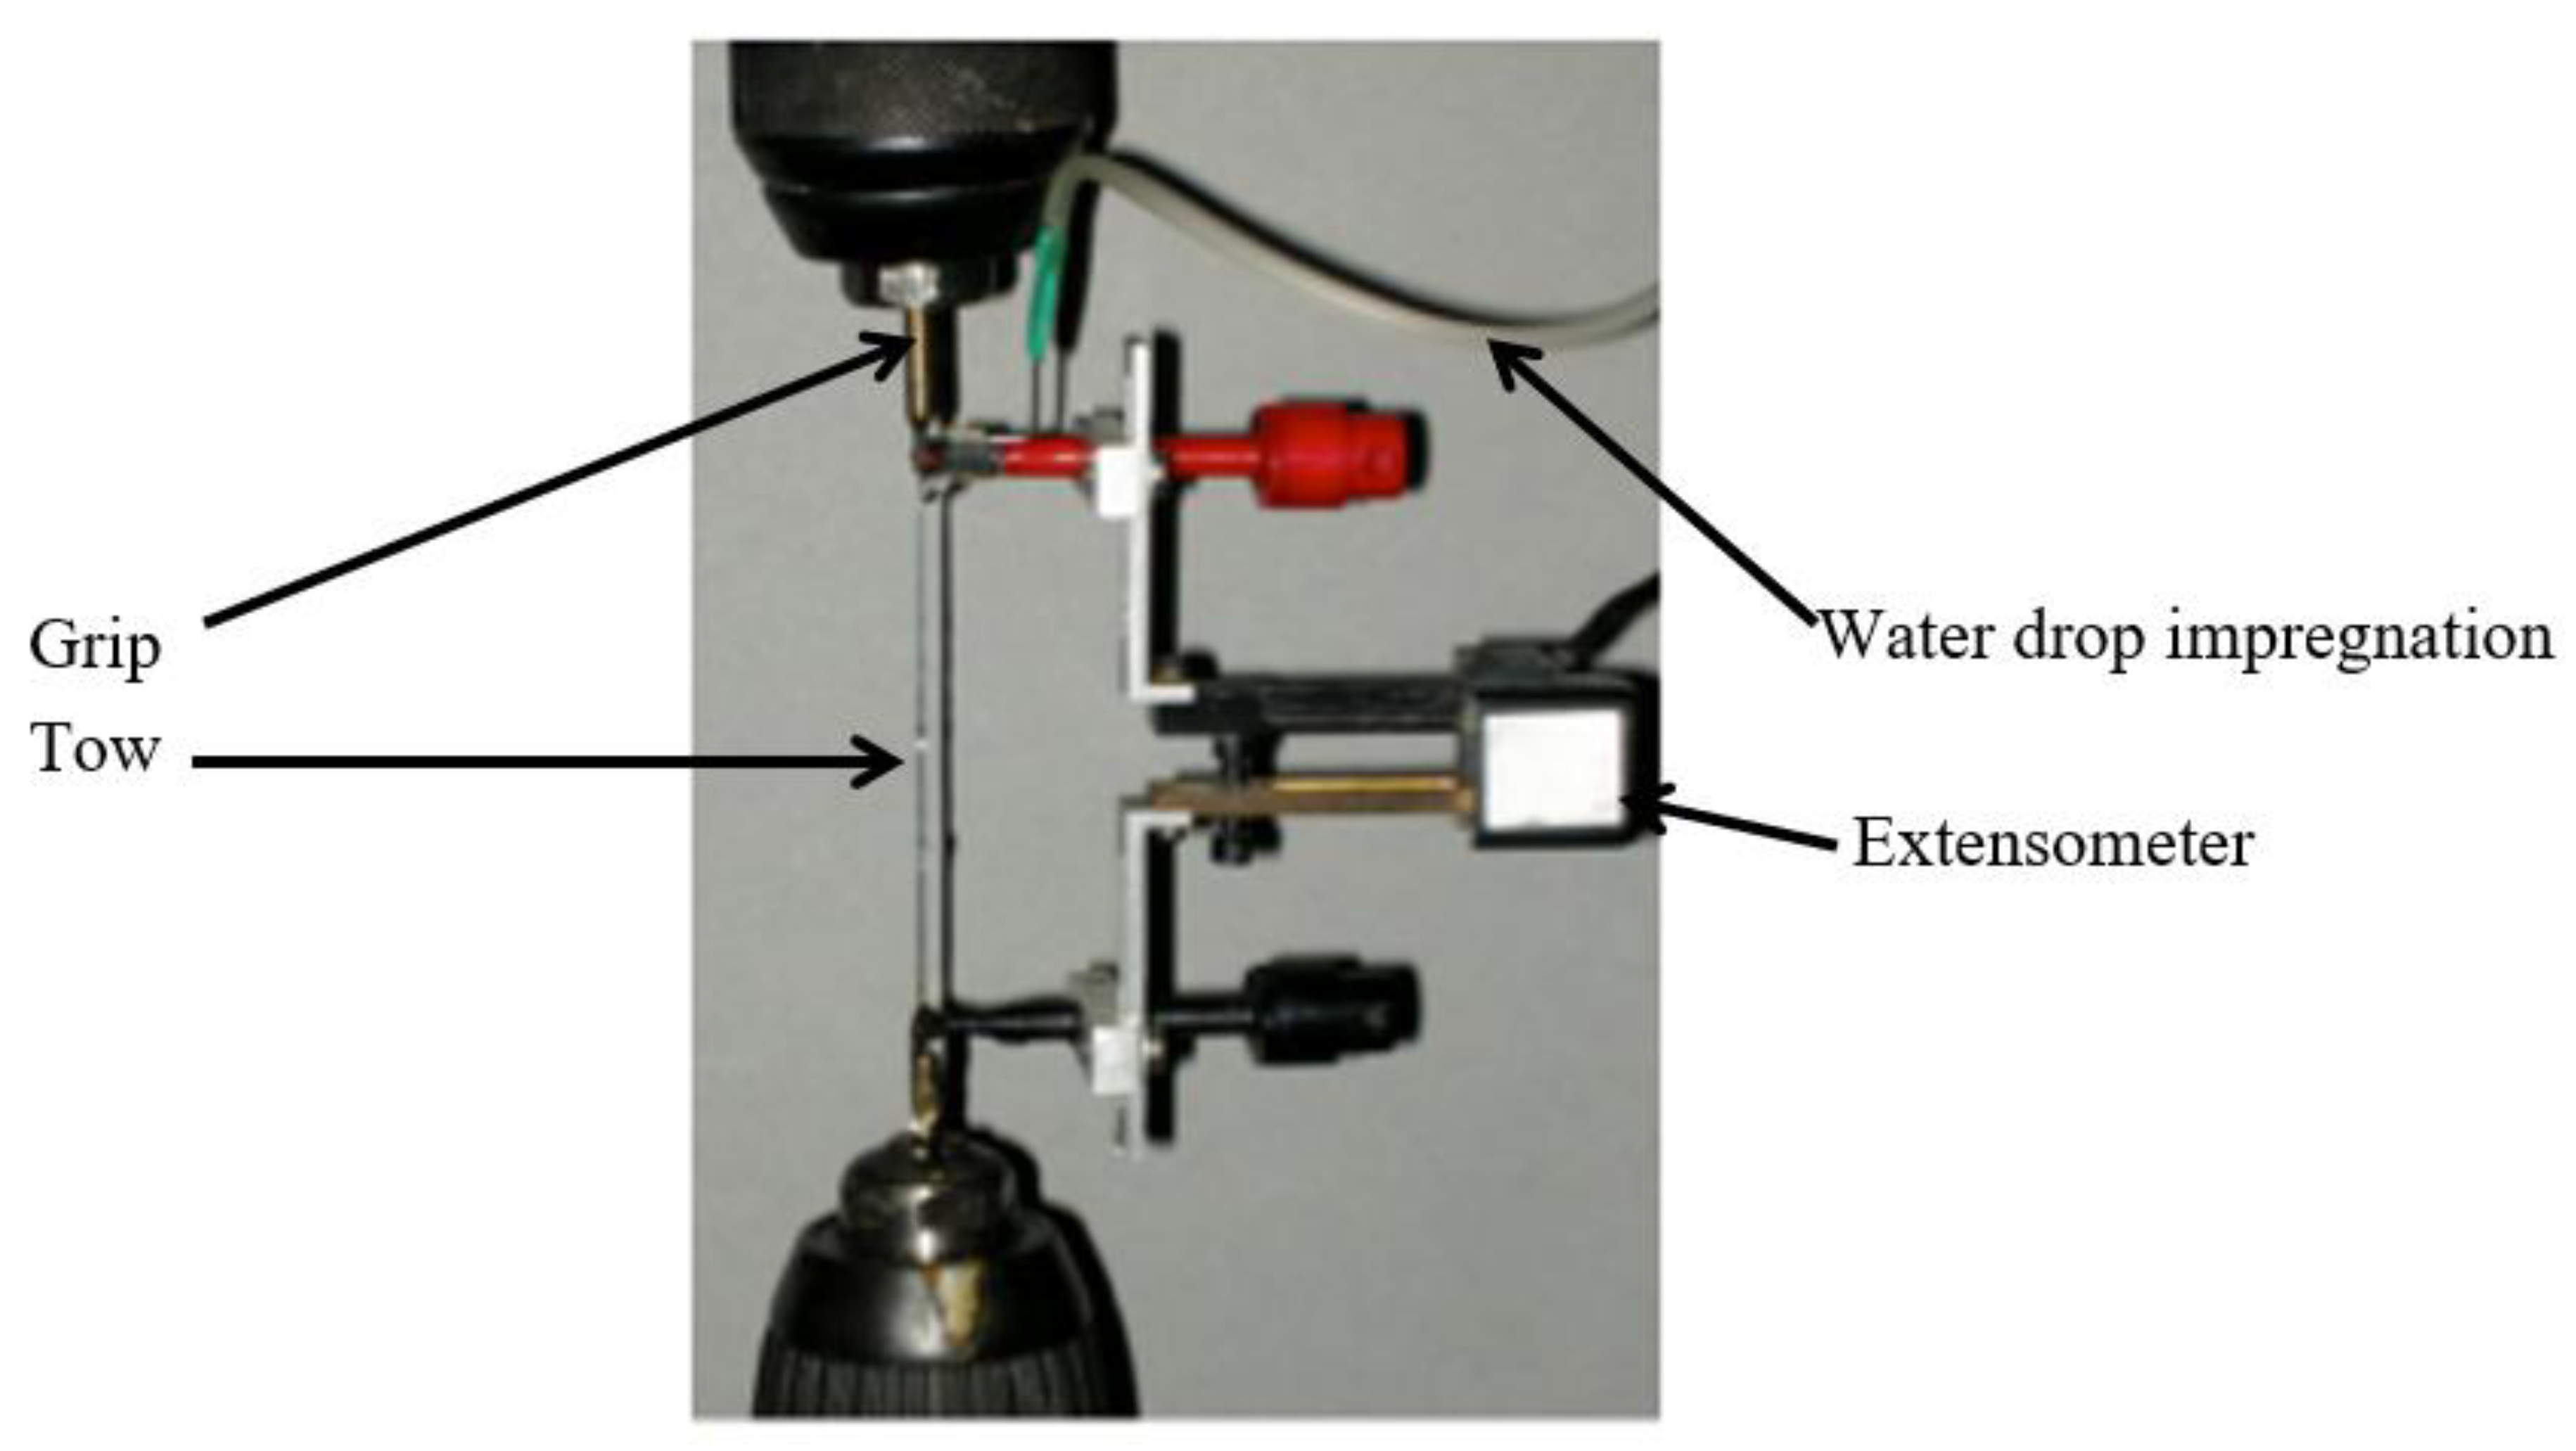
A servo-pneumatic testing machine that had been designed and built in-house was used. It was equipped with a 500 N load cell. Displacement control of the cross head for long-term tests was ensured through pneumatic cushions. Deformations were measured using a contact extensometer (with a ± 2.5 mm elongation displacement transducer) that was attached to the specimen. Two 4-mm long thermo-retractable rings were threaded on the bundle to allow the extensometer to be clamped. They were located close to the grips in order to avoid possible bending introduced by the extensometer. The inner distance between the rings defined the gauge length (~60 mm). Thus, the strain measurement was direct and unpolluted by load train deformations. A view of the experiment with a fibre bundle, the mechanical extensometer and water drop impregnation device is shown in
Figure 1.
During the tensile tests in inert environment, lubricant oil was used to avoid friction between the fibres, which could cause fibre interactions leading to premature fracture.
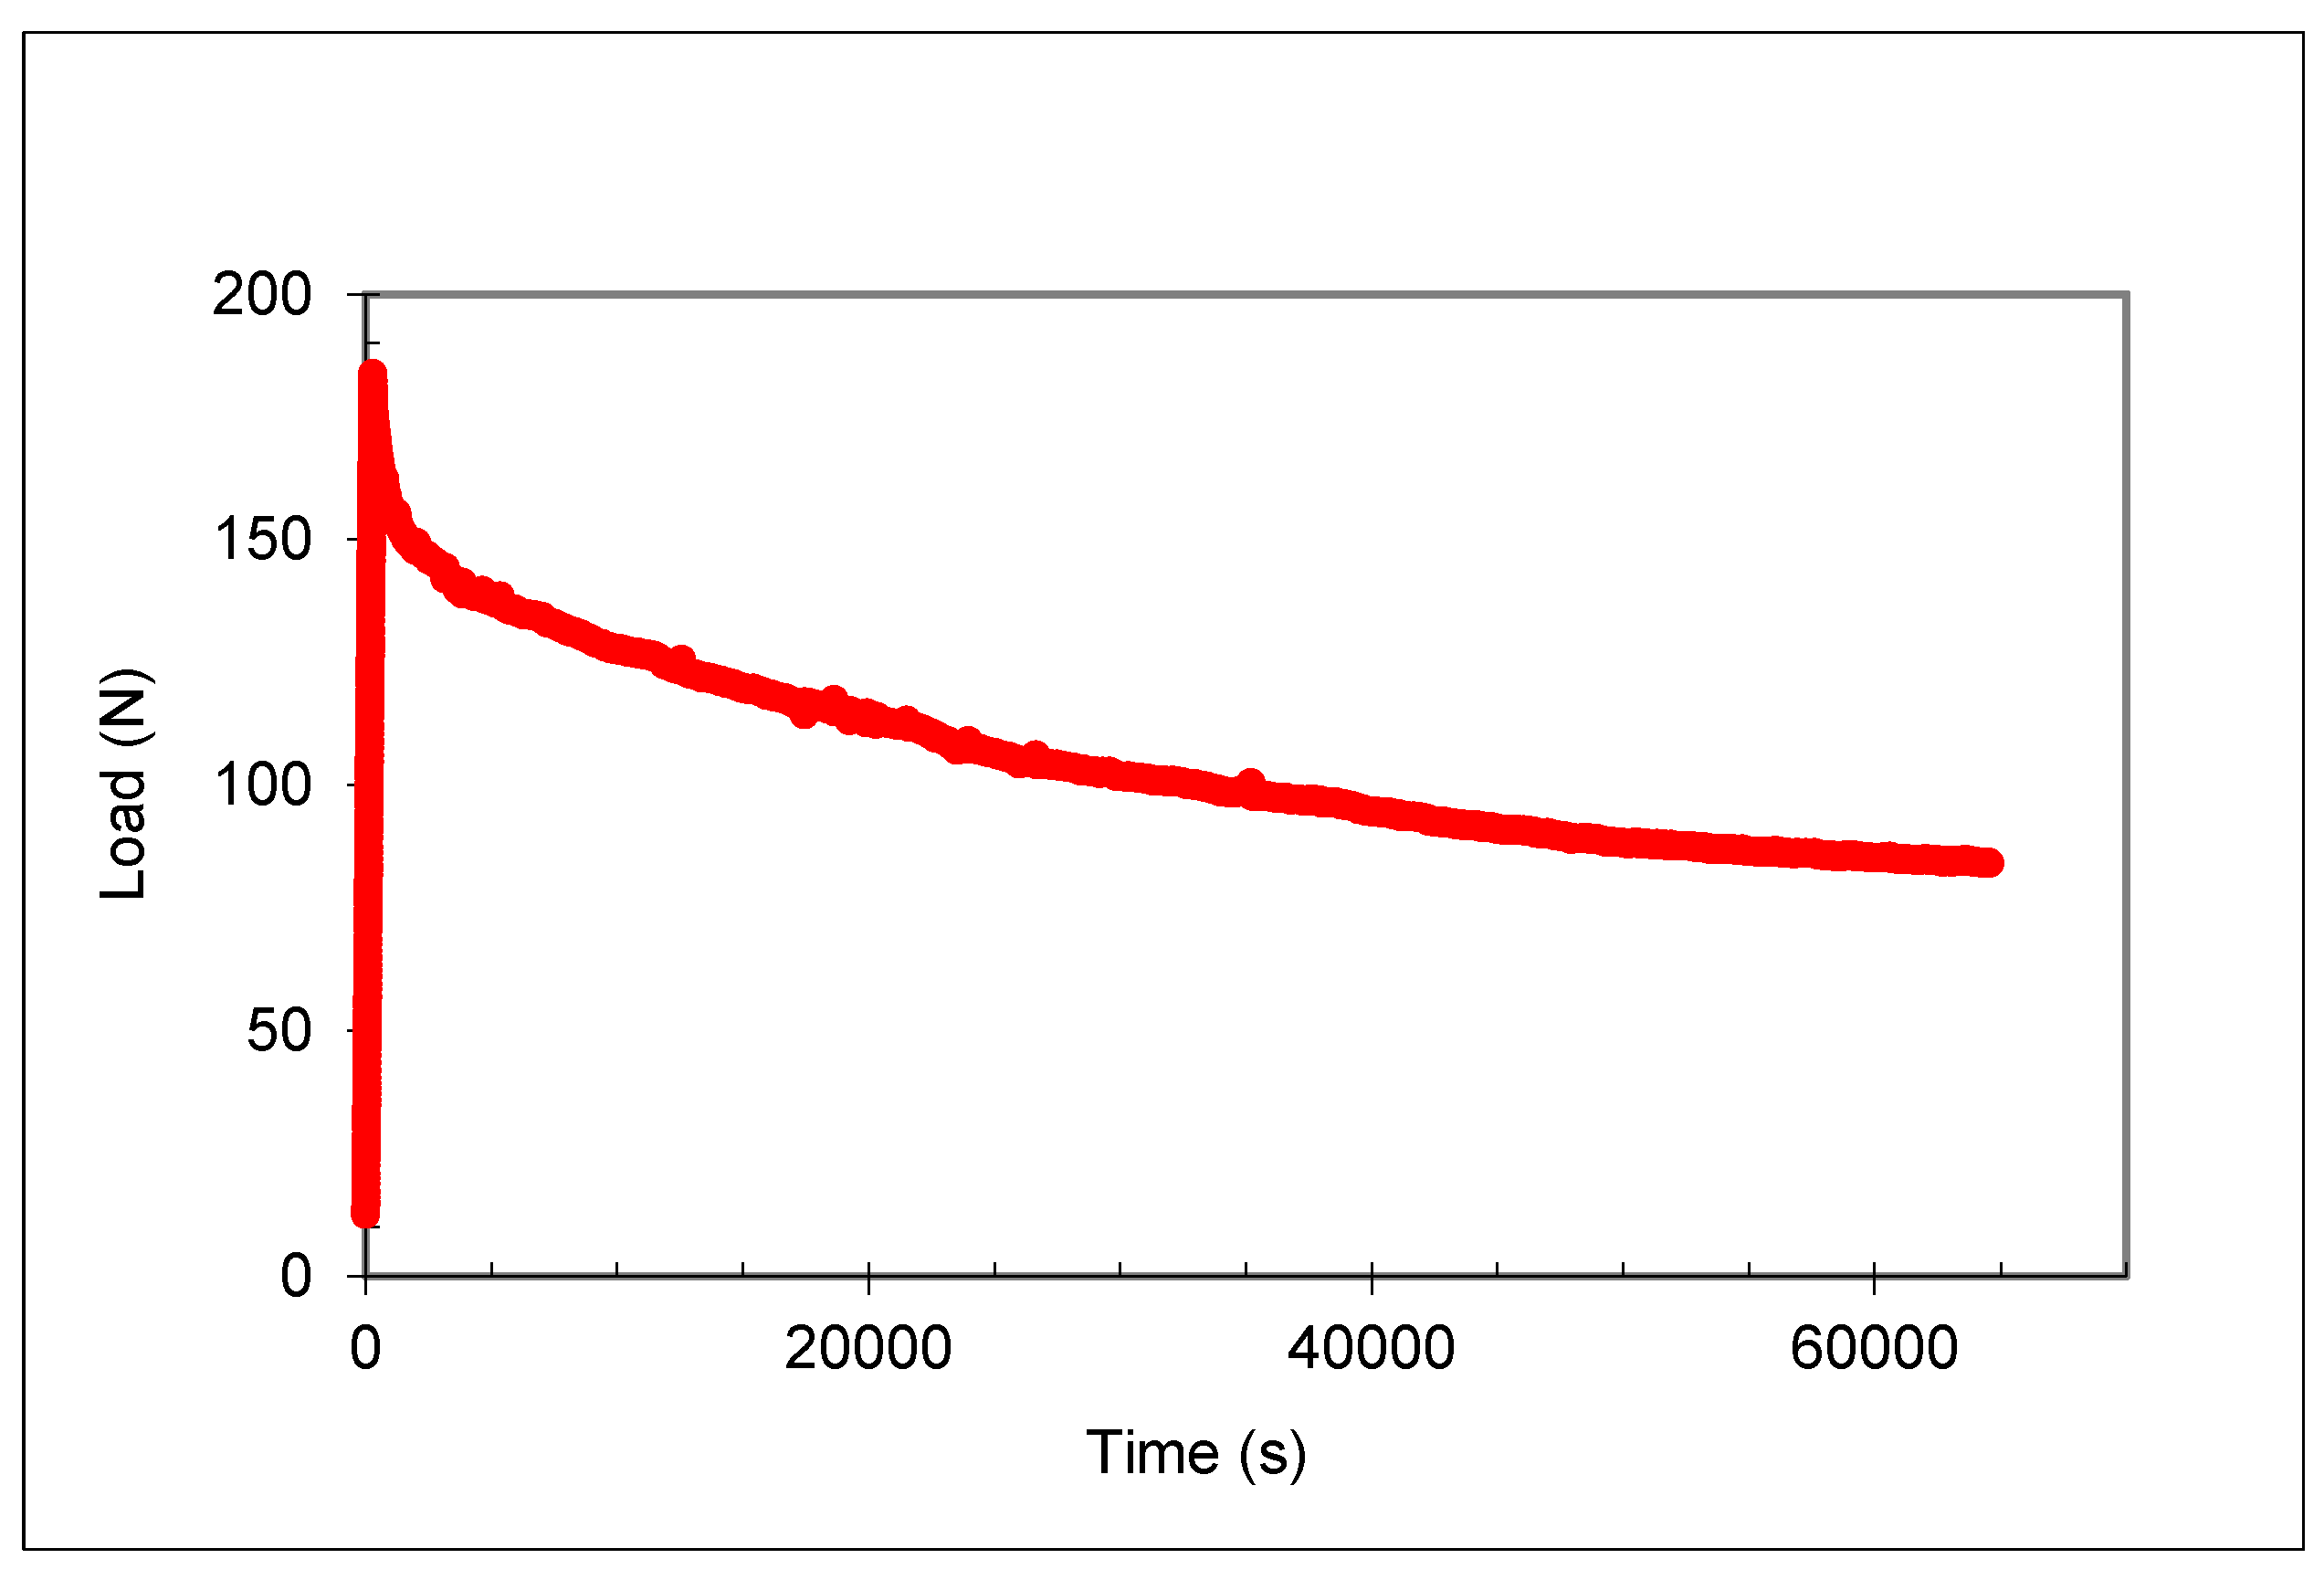
During static fatigue tests, the strain was controlled directly by the mechanical extensometer. Specimens were first impregnated with water and then loaded at 5 µm/s displacement rate to the test deformation. Then the strain was kept constant. A typical curve of load relaxation versus time is shown on
Figure 2.
3.2. Determination of Fast and Delayed Filaments Fracture Data
The above fundamental relations for analysis and computation of static fatigue behaviour depend of filament fast fracture statistical parameters (m, σ0) and slow crack growth constants (n, V*). These parameters were derived from the tensile and static fatigue behaviour of tows.
3.2.1. Fast Fracture
The parameters of statistical distributions of filament strengths were estimated by adjustment of equation of tensile behaviour to experimental force-strain curve, which provides a substantial sample size of about 2000 strength data. The force-strain equation is derived from Equation (10) as:
where
Ef is filament Young’s modulus.
P(
ε) is the failure probability at deformation
ε:
where
ε0 =
σ0/Ef.
The Weibull equation is a satisfactory approximation of filament tensile strength distribution [
8]. Fitting of force-strain curve by Equation (14) is exemplified in the subsequent section on the tensile behaviour of tows. Note the stable failure mode of the bundles up to complete fracture, which reflects the successive and individual fracture of all the filaments. It can be noticed that the force decrease beyond the maximum compares fairly well with that obtained experimentally. It cannot be concluded that it is steeper, as it is obtained when groups of filaments fail [
7].
3.2.2. Delayed Failure in Static Fatigue
Typical strain and load vs. time curves are shown on
Figure 2. The force decreases gradually as a result of successive fractures of individual fibres caused by slow crack growth. It can be noticed that the strain remained nicely constant. The absence of accidental variation demonstrates the efficiency of strain monitoring and it suggests that individual fibre failures proceeded smoothly.
The subcritical crack growth constants
n and
V* can be derived by fitting the force-time relation
F(
t) =
Bσn derived from combined Equations (7) and (10) to the experimental load relaxation curve (for
n determination), and by fitting Equation (19) to the plot of time data
tj vs. (σ
fj/σ)
n−2 for high values of
σfj/σ (for the determination of
V*).
tj correspond to the
jth datum
σfj in the filament strength distribution [
7]. Pertinent fibre failure data are given in
Table 1.
4. Results and Discussion
4.1. Lifetime in Fatigue
4.1.1. Distributions of Rupture Times for Glass Filaments
Figure 3 shows the statistical distributions of filament rupture times computed for various tensile stresses using Equation (8). It shows that rupture times display a wide variability, and they span about five orders of magnitude under a given constant stress: for instance, from 10 h for the weakest filaments to 10 million hours for the strongest filament under 400 MPa. Performances decay as the applied stress increases. The lifetime of tows is indicated by the value of the lifetime for the critical fibre defined by
P = 0.99 under constant strain, and
P =
αt = 0.16 under constant force.
Figure 3 shows that tow lifetime is highly dependent on fatigue loading conditions. Lifetime under constant force is about 100 times as short as the lifetime under constant strain, when filaments fail one after another. As discussed in [
18],
P =
αt corresponds to an upper bound for lifetime under constant force owing to possible artefacts, such as interfibre friction, which can cause premature failure. Interfibre friction during experiments was minimized through careful preparation and handling of specimens in order to avoid the presence of loose filaments, and through the presence of water, which acted as a lubricant.
4.1.2. Stress-Rupture-Time Diagrams
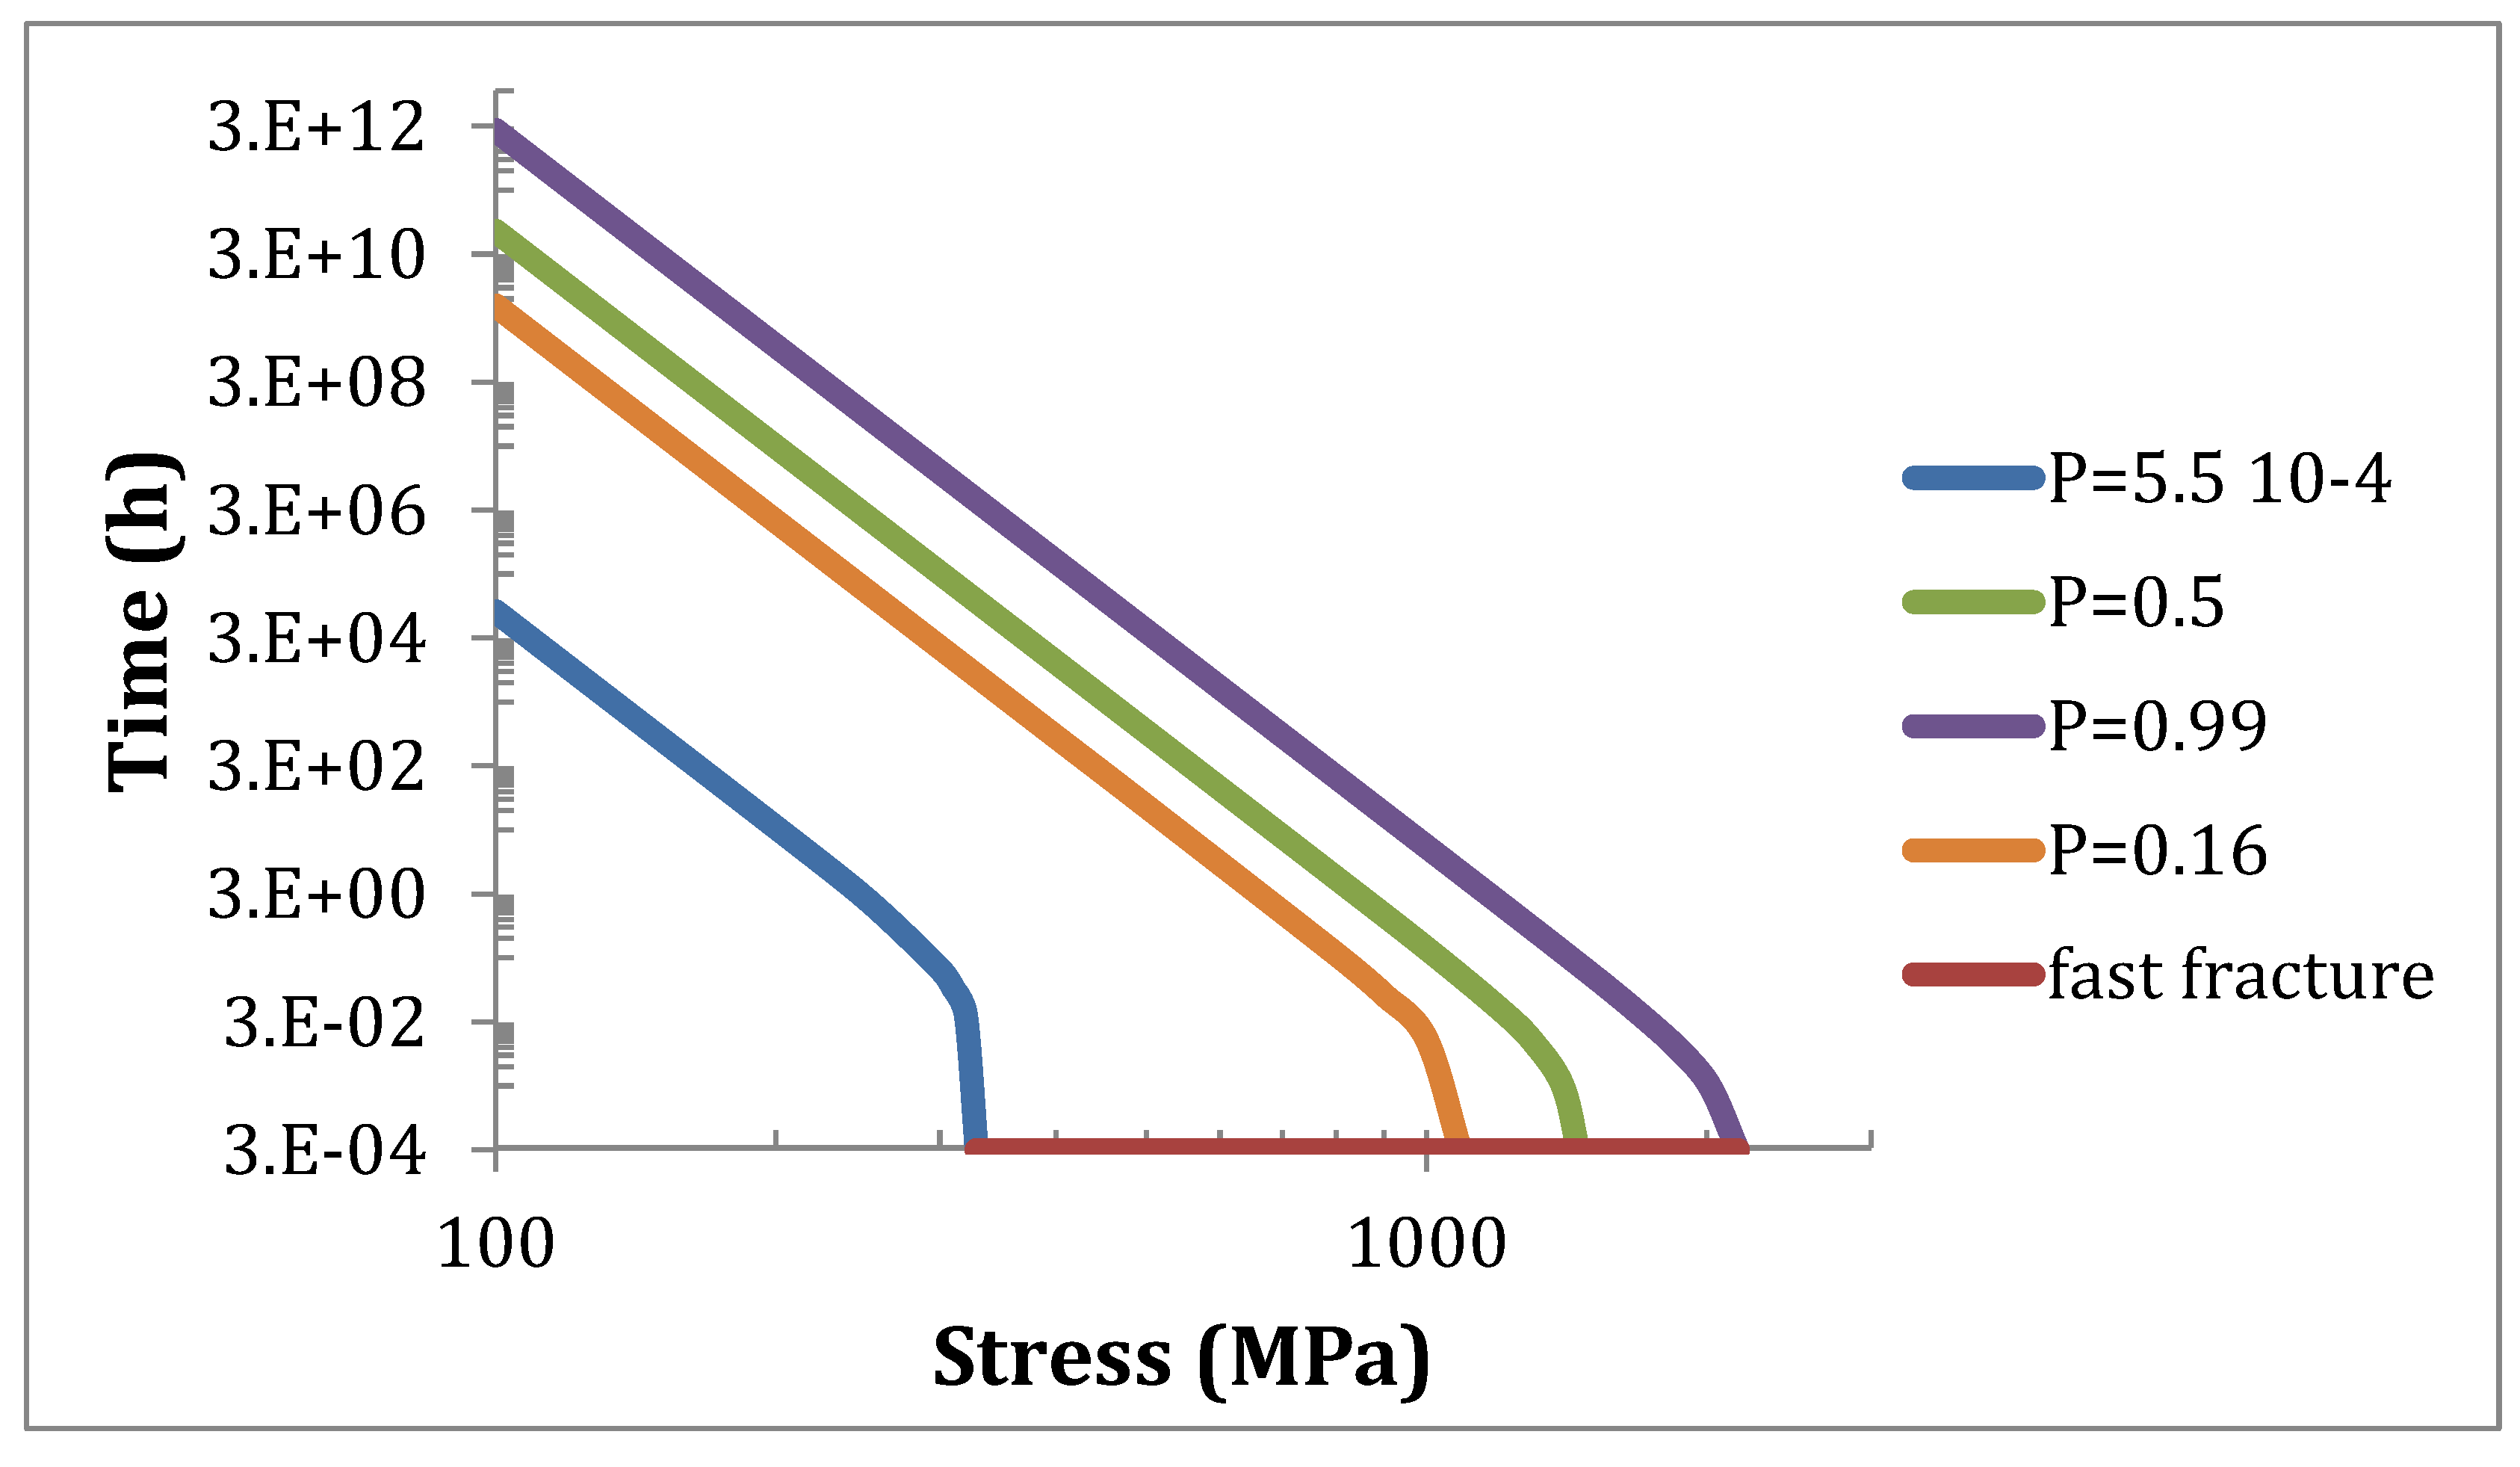
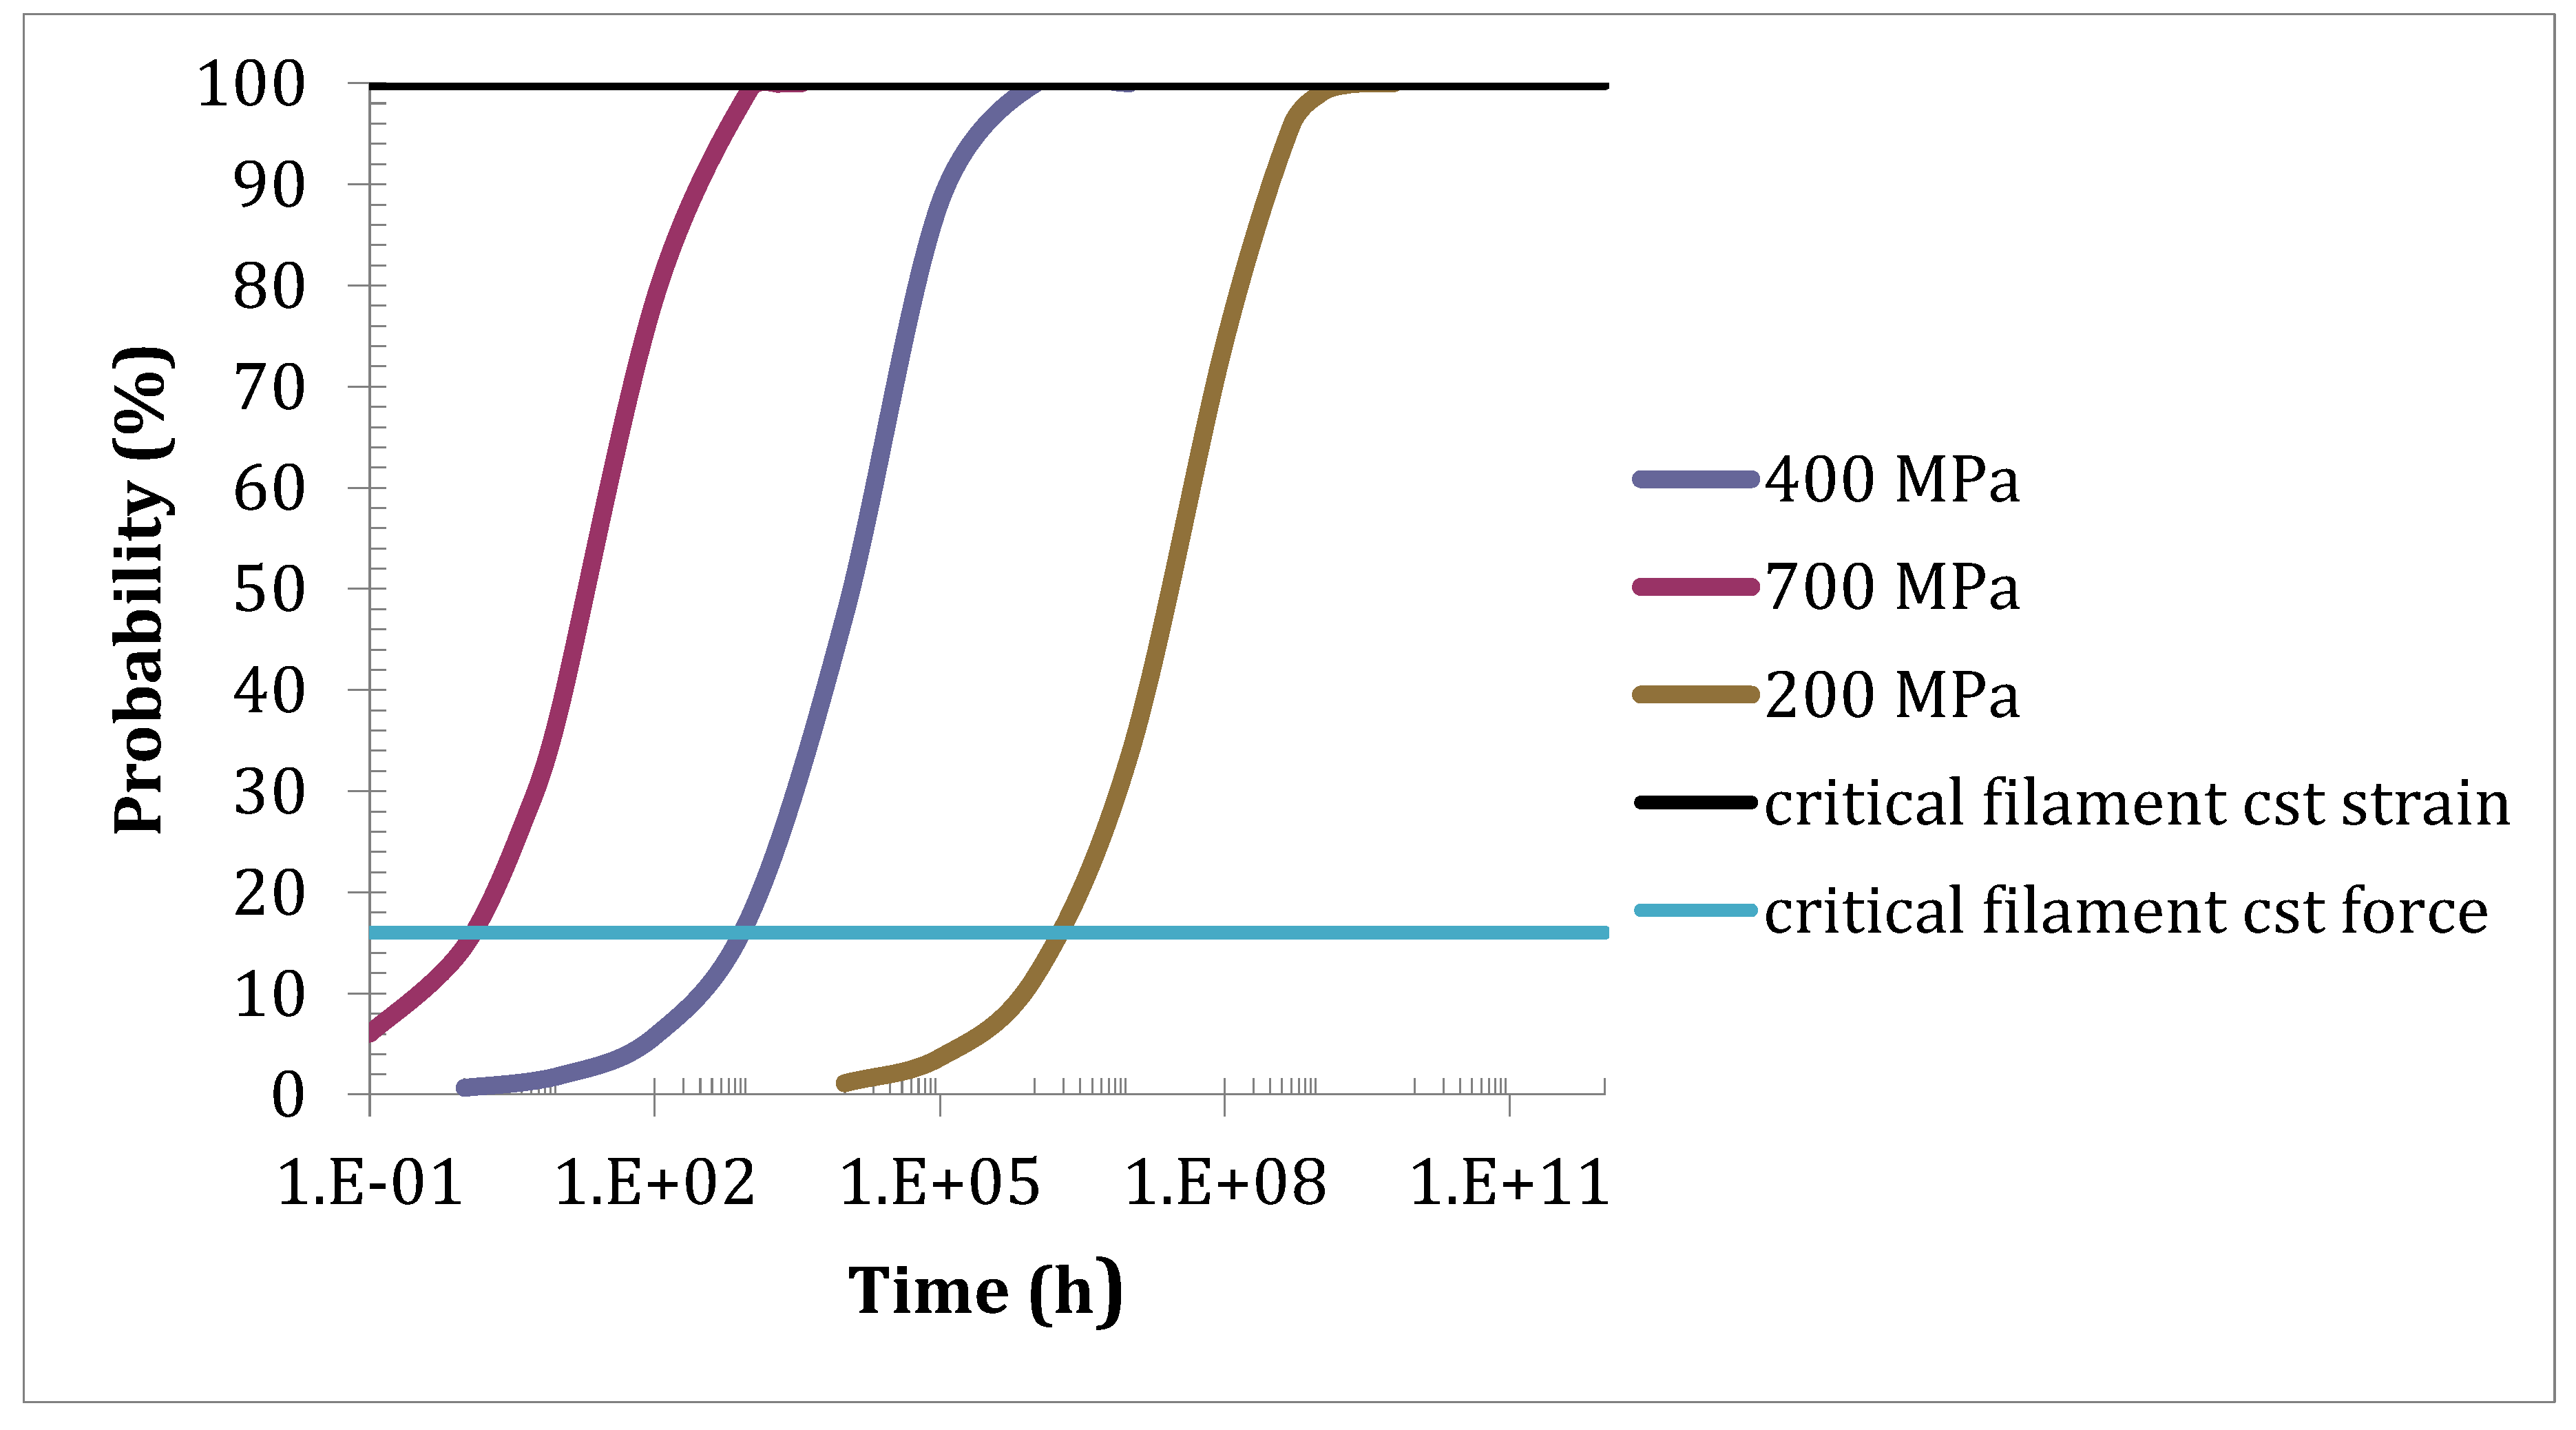
Figure 4 shows the Strength-Probability-Time (SPT) curves for specific filaments calculated using Equations (13). It depicts the dependence of lifetime on stress for filaments and tows. The filaments are identified by fast fracture probability in inert conditions, as indicated earlier.
P = 5.5 × 10
−4 corresponds to the weakest filament in a tow of 1824 filaments. It delineates the domain of no failure, for filaments and tows.
P = 0.99, which corresponds to the strongest filament, bounds the domain of certain failure for any filament and loading conditions. In between is the domain of random failure, where failure depends on the filament considered. Since the strength of any filament cannot be known a priori, filament failure is a random event. Under constant deformation, the strongest filament is the critical filament that dictates the failure of tow [
15]. For tows under constant deformation, the no-failure domain is delineated by
P = 0.99. Under constant force,
P =
αt = 0.16 defines the critical filament, when the filaments fail one after one [
18]. In this case, the tow no-failure domain is bounded by this particular value
P =
αt = 0.16. However, as pointed out above, this domain may be reduced due to artefacts. Under mixed mode loading conditions, the lifetime will depend on the respective contribution of each mode.
The above performances were anticipated for a gauge length of 64 mm. The influence of size effects on rupture time is examined in the subsequent section.
This section may be divided by subheadings. It should provide a concise and precise description of the experimental results, their interpretation, as well as the experimental conclusions that can be drawn.
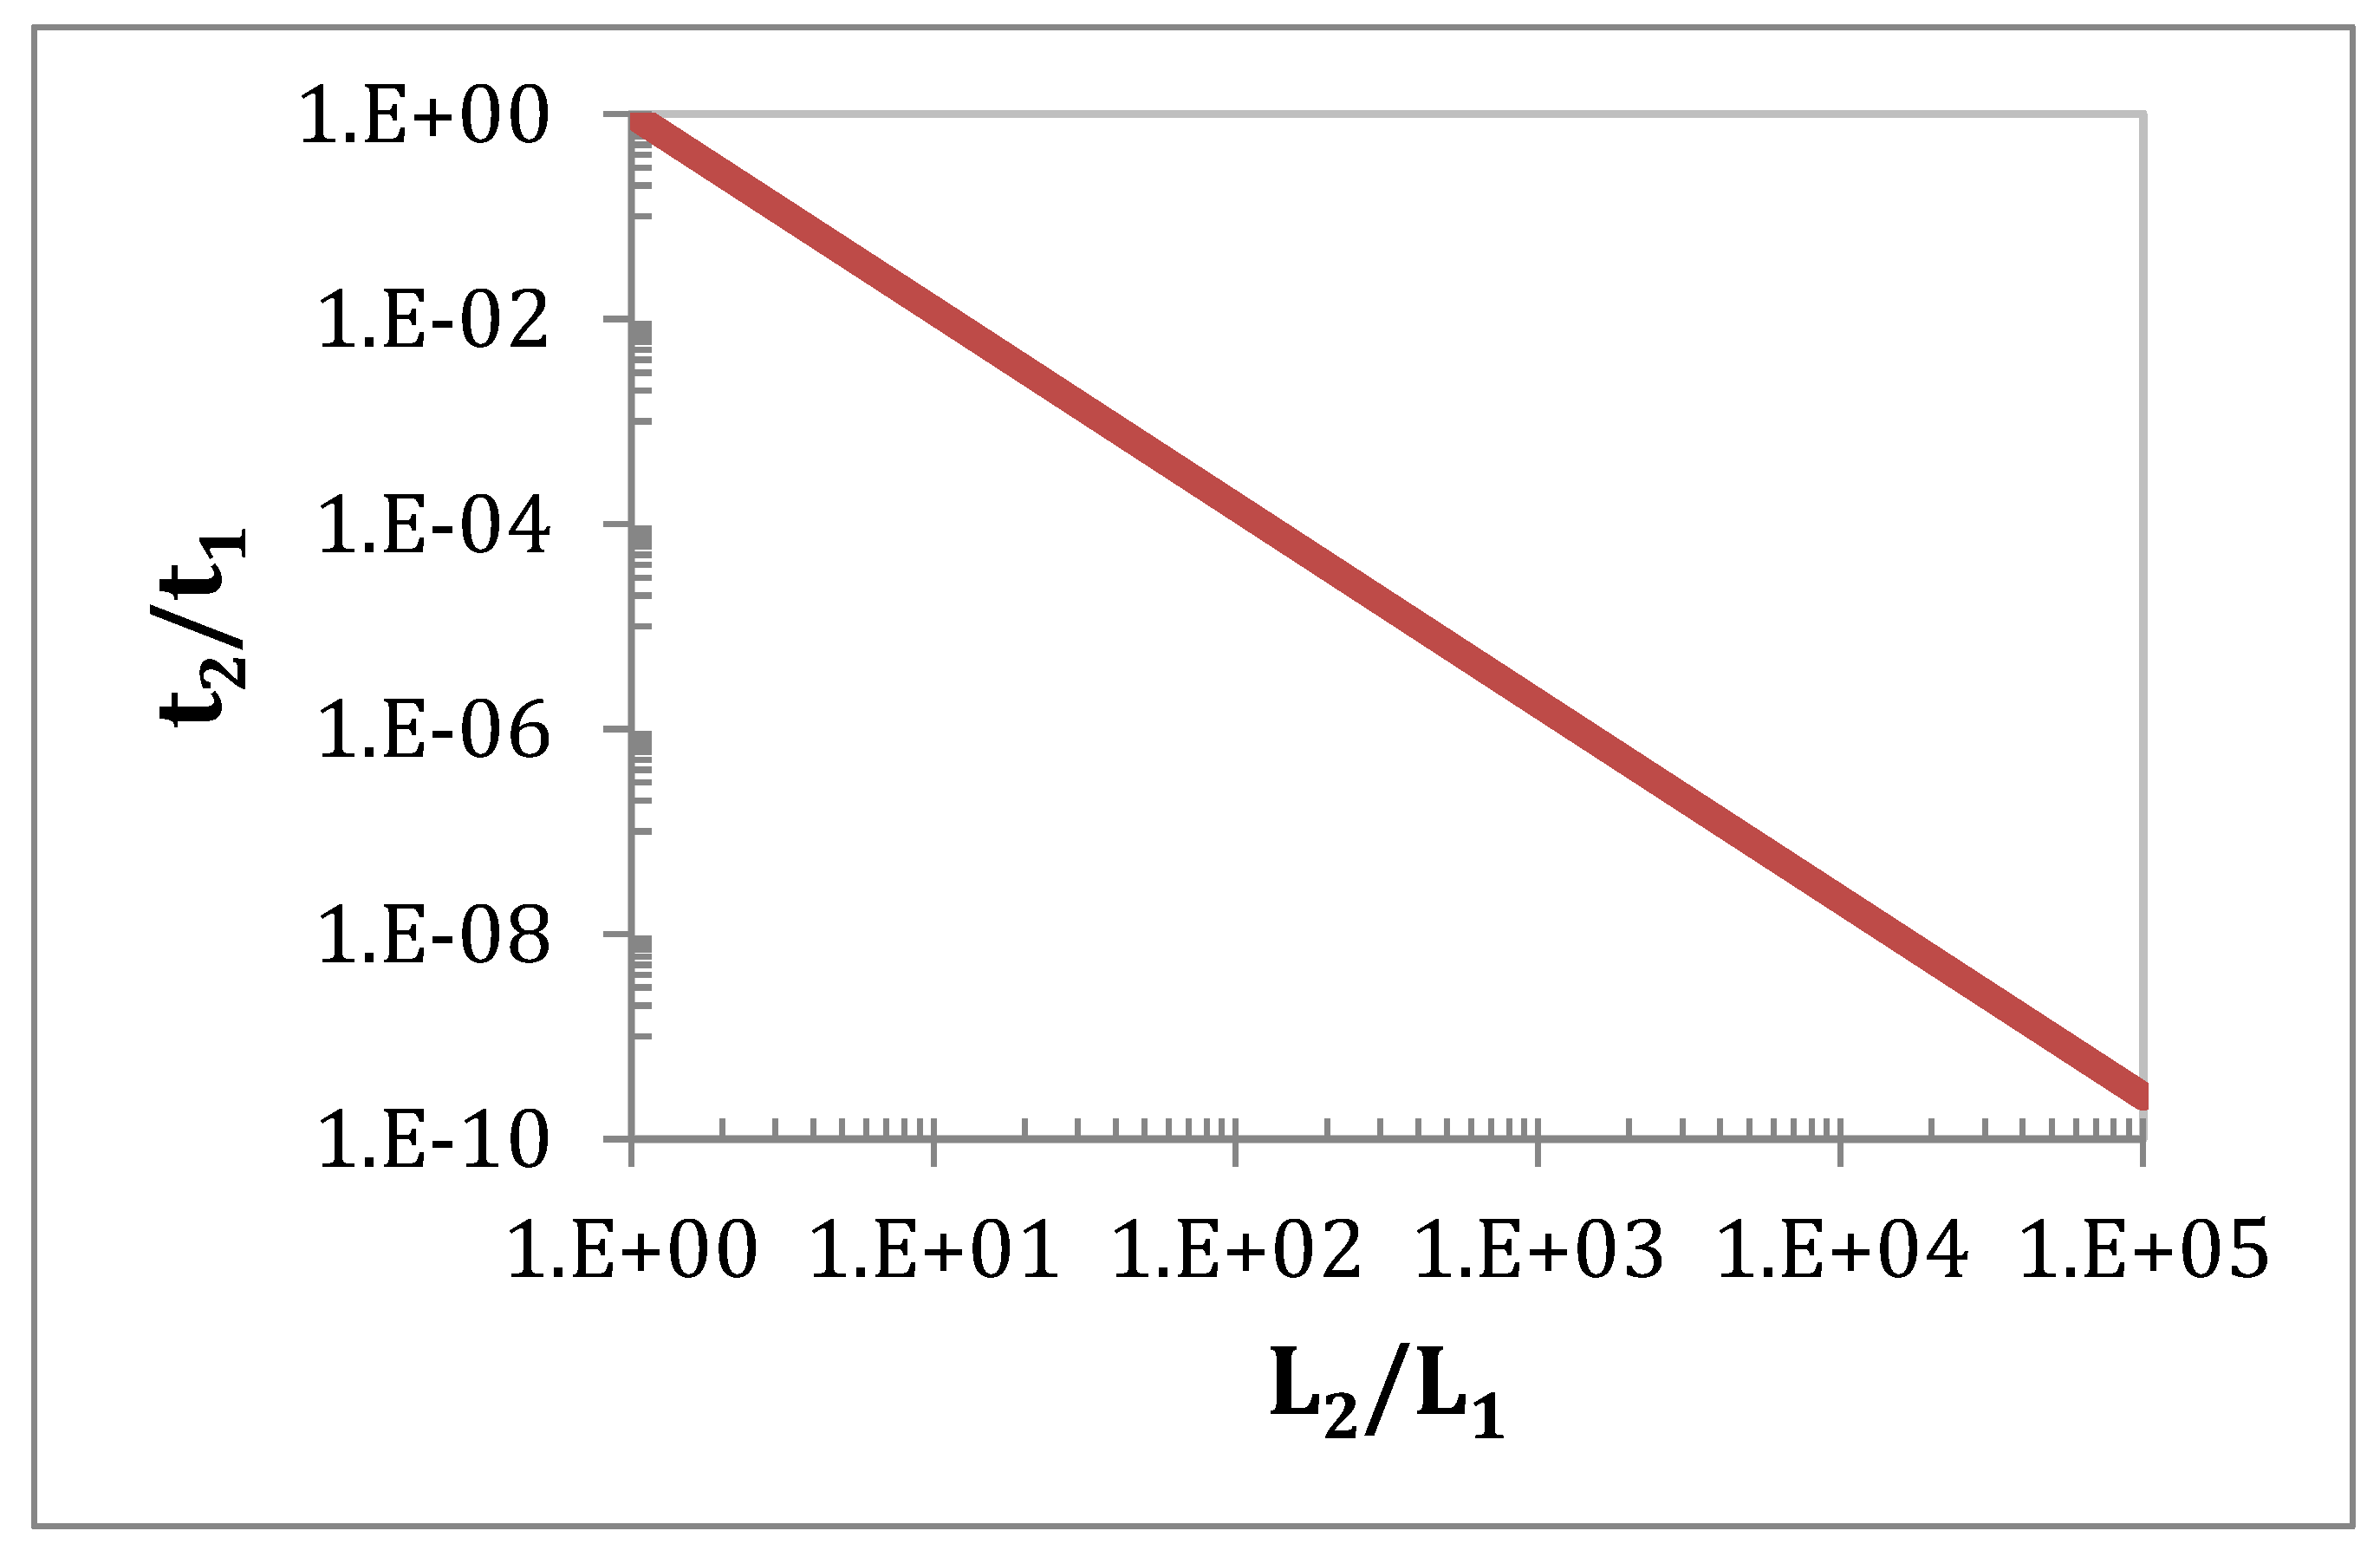
4.1.3. Size Effects
Equating probabilities of failure given by Equation (8) for constant stress
σ and rupture times
t1 and
t2 corresponding to stressed volumes
v1 and
v2, we use:
Computations have shown that
t >>
t*. Thus, Equation (16) for specimen size rupture time dependence reduces to the following equations:
where
L1 and
L2 are the fibre stressed lengths.
Figure 5 illustrates the drastic fibre rupture time dependence on fibre length. Thus, the lifetime of a fibre is hundred times as short when it is ten times as long. According to Equation (18), the size effect is decreased with lower values of the
n exponent, and larger values of Weibull modulus
m, which implies a lower rate of slow crack growth according to Equation (1), and a lower sensitivity to flaws (large
m values). As it is considered that tow rupture is dictated by a critical filament, this trend applies to tows.
4.2. Strength Degradation in Fatigue
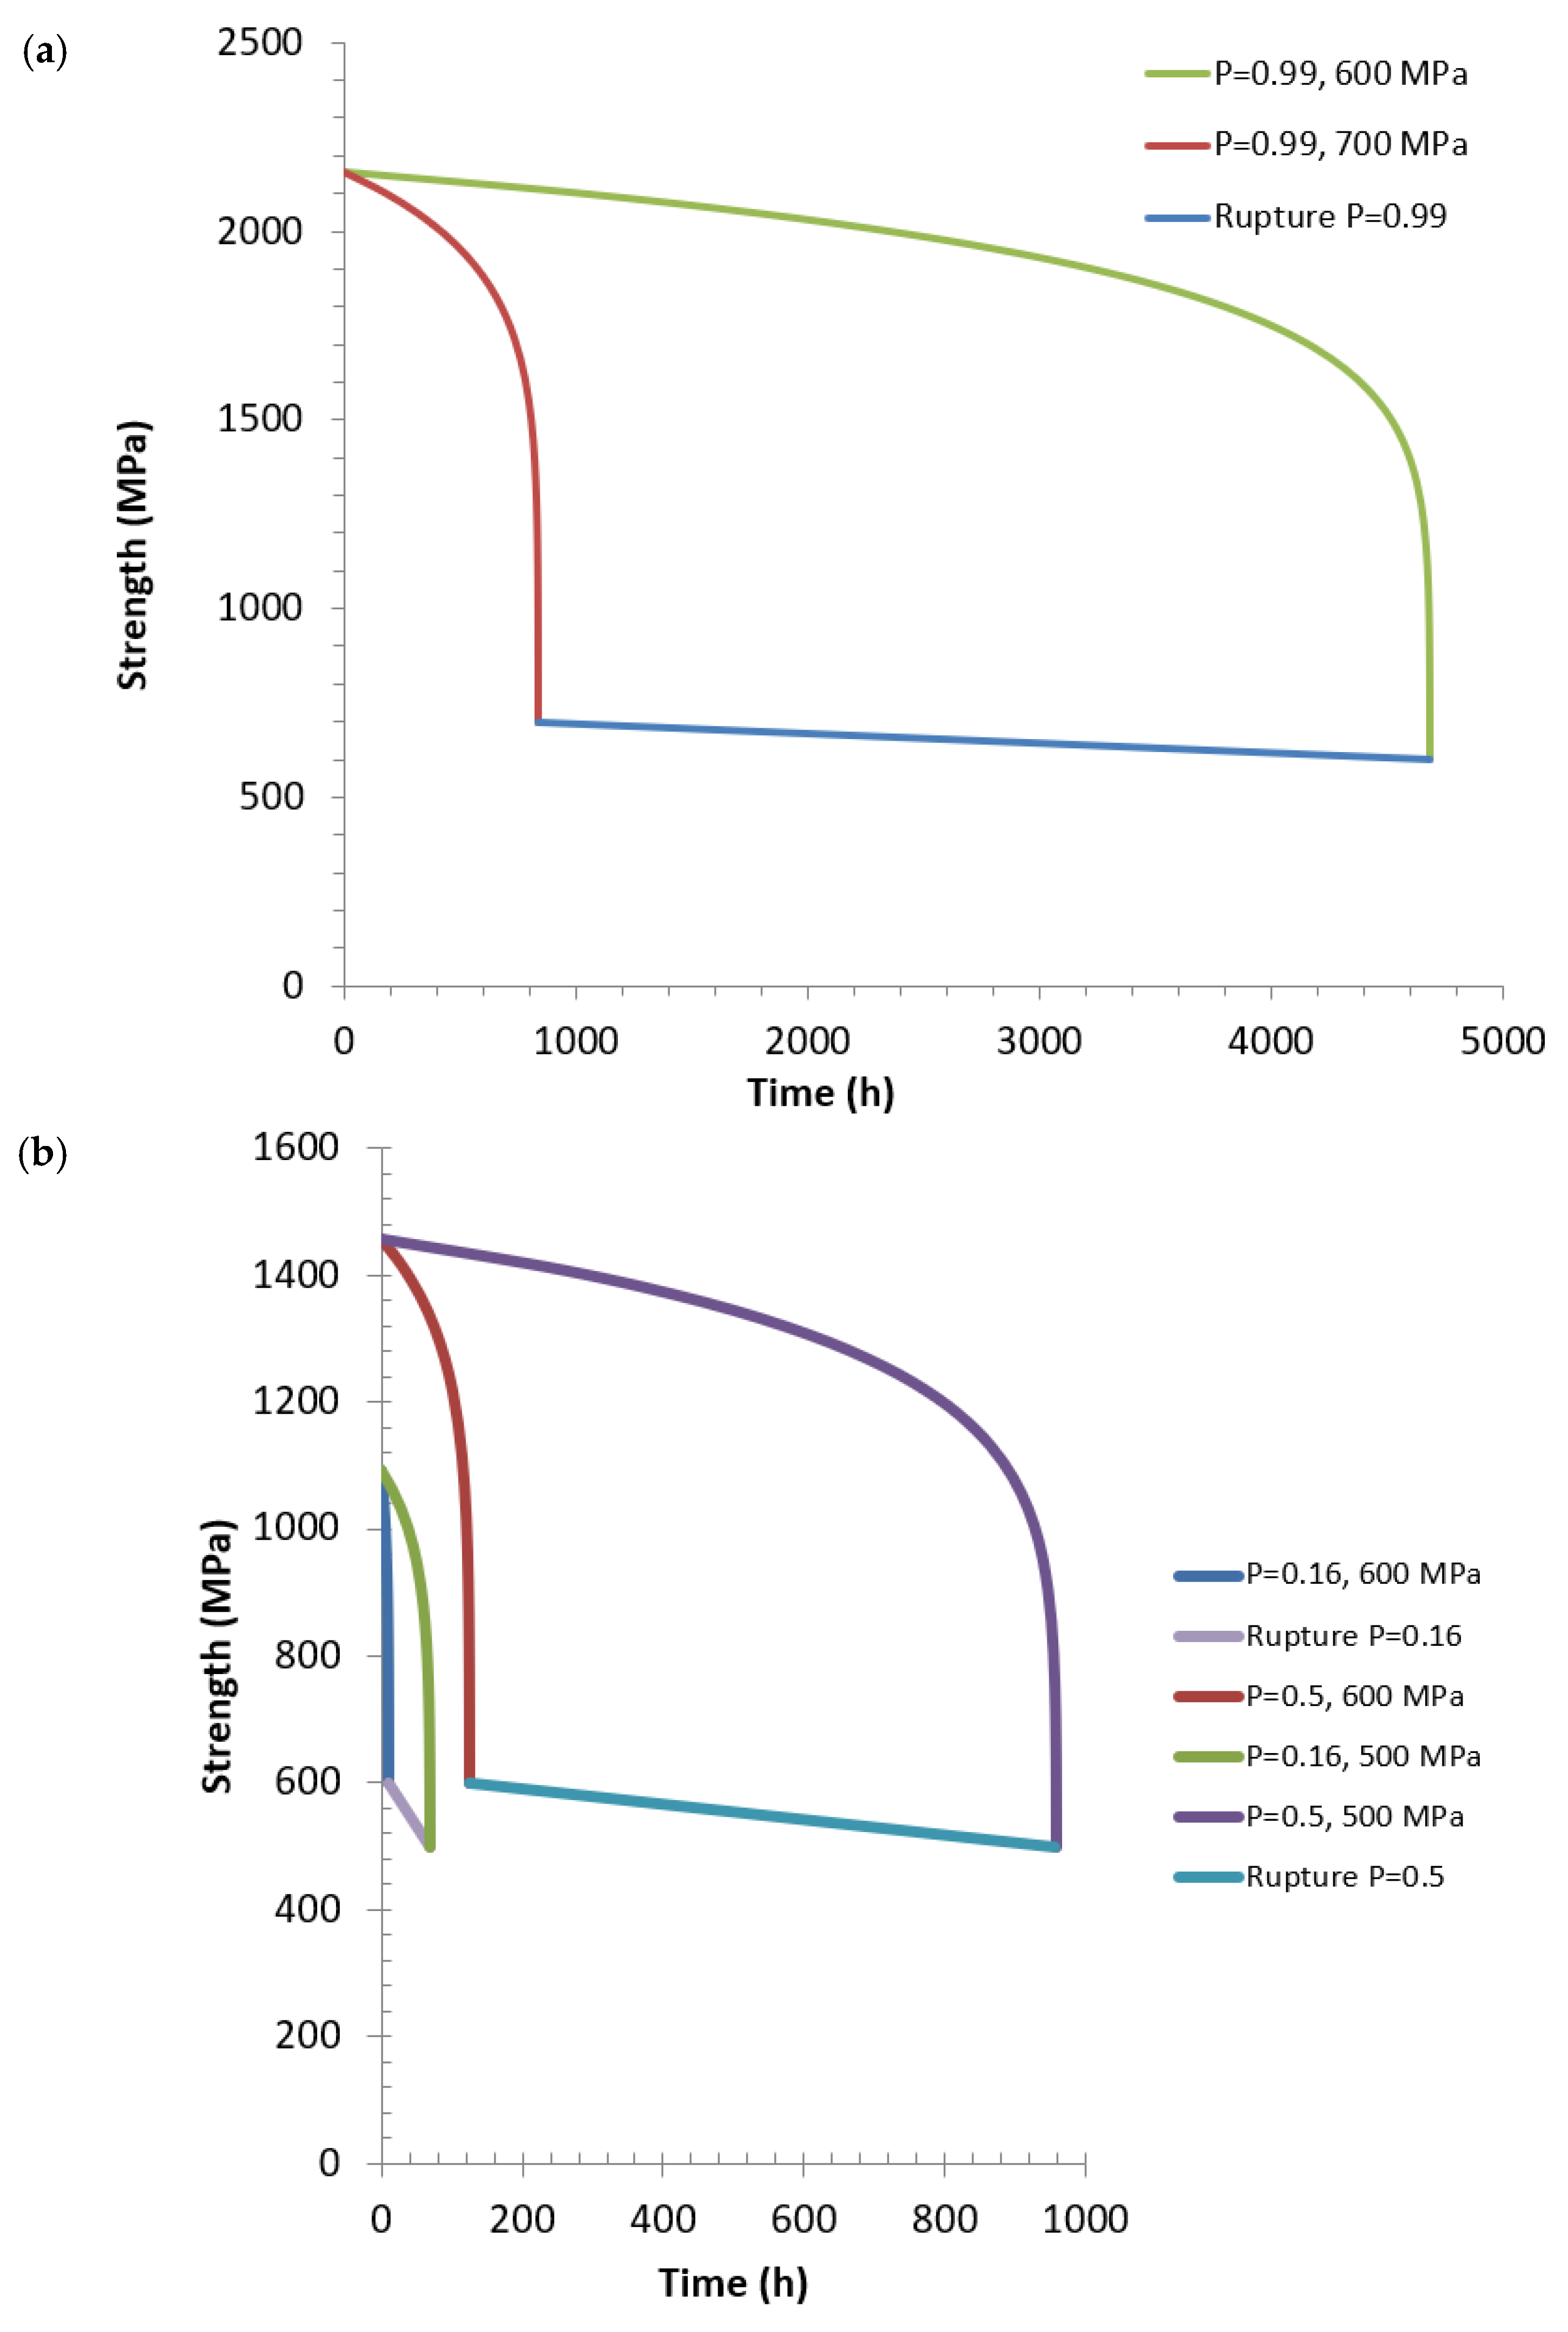
4.2.1. Strength Degradation for Filaments
Figure 6 depicts the degradation of strength during static fatigue under various stresses, for specific filaments defined by values of failure probability in inert fast fracture conditions as indicated above. The strength degradation presents interesting features. The degradation rate depends on the applied stress, and on the filament initial strength. It is enhanced with increasing applied stress. It is faster for weak filaments, and slower for stronger filaments. This trend has a corollary: filament lifetime is commensurate with reference strength.
Figure 6 also shows the variability in strength degradation when filaments are subjected to identical stress. This situation is encountered in tows under constant strain. The strength degradation curve is bounded by the stress-rupture time curve, where the strength reaches the applied stress.
4.2.2. Experimental Residual Behaviour of Tows after Static Fatigue
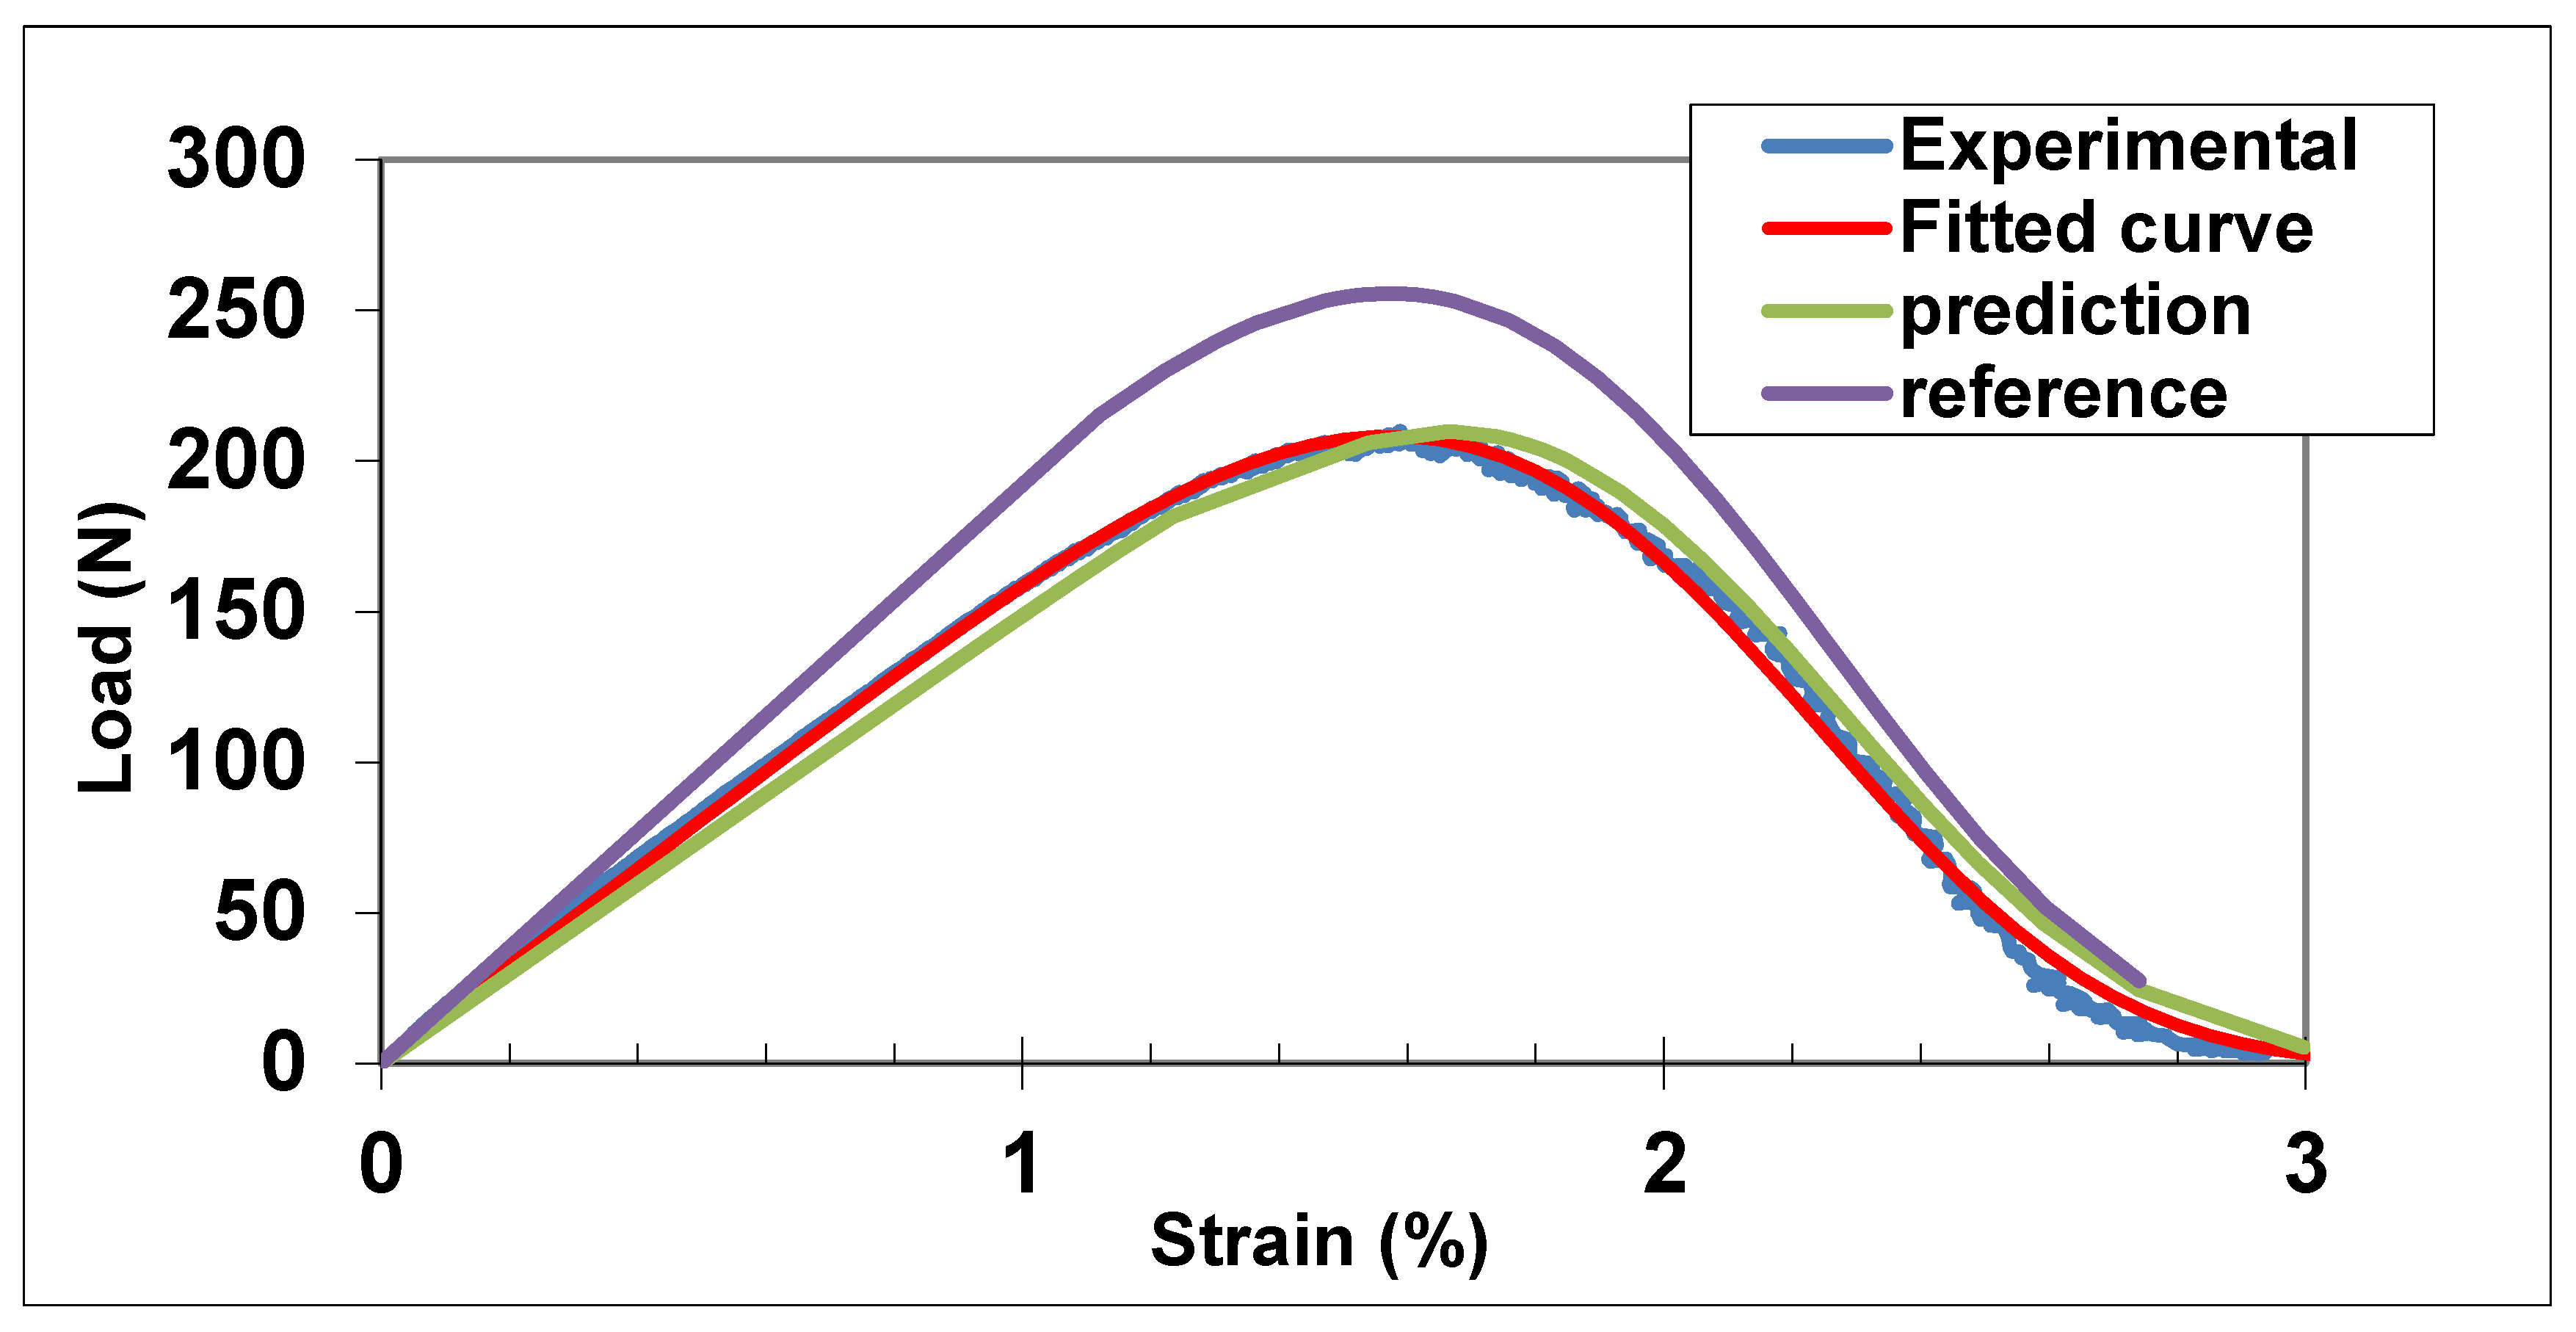
Figure 7 compares the residual behaviour after fatigue during 5.5 h under constant strain (0.93%) and stress (670 MPa) (referred to as test #4 in [
15]) to the reference behaviour measured on a tow in an inert atmosphere. It can be noted that the force carrying capacity of the tow was degraded after fatigue, although deformations were not affected. The invariability of deformations is typical of localized damage, like slow crack growth, which does not affect the filament elastic modulus, as opposed to generalized degradation like corrosion. It also indicates that groups of filaments did not fail simultaneously during residual test. Fitting the force-strain Equation (14) by adjustment of statistical parameters is also shown. The following estimates were obtained:
m = 5.1,
σ0 = 10.8 MPa.
4.2.3. Predictions of Residual Behaviour of Tows after Static Fatigue
Residual strengths (
σR) of filaments after static fatigue during time period
tF under constant stress
σ were calculated using Equation (4) for the database given by
Table 1. The following force-strain relation gives the corresponding residual tensile behaviour:
where
NR is the number of filaments that survived fatigue, i.e., those fibres with
σR > 0 given by Equation (4):
With (
N0·αcin) the number of fibres broken during time period
tF.
PR is the failure probability for a filament with residual strength
σR > 0. It is related to the reference failure probability
Pi =
P(σ
f) by the truncation equation:
The residual behaviour that was predicted using equation for slow crack growth parameters is in good agreement with the experimental curve (
Figure 7).
Table 2 highlights the quality of predictions of characteristics of residual behaviour, i.e., the maximum force (
FRmax), the number of surviving fibres after fatigue (
NR), the deformation at peak force, the fraction of fibres broken at maximum force (
αcR), and the statistical parameters of the cumulative distribution of residual strengths (
m, σ0). The agreement with experimental values is excellent for most characteristics, which assesses the values of the slow crack growth parameters as well of the reference statistical parameters and the other fibre properties given in
Table 1. Furthermore, this also indicates that there were probably no significant fibre interactions during the residual tests on tow, since the experimental behaviour coincides with the experimental one, while the results from residual tests were not used for predictions, as indicated by Equations (19)–(22).
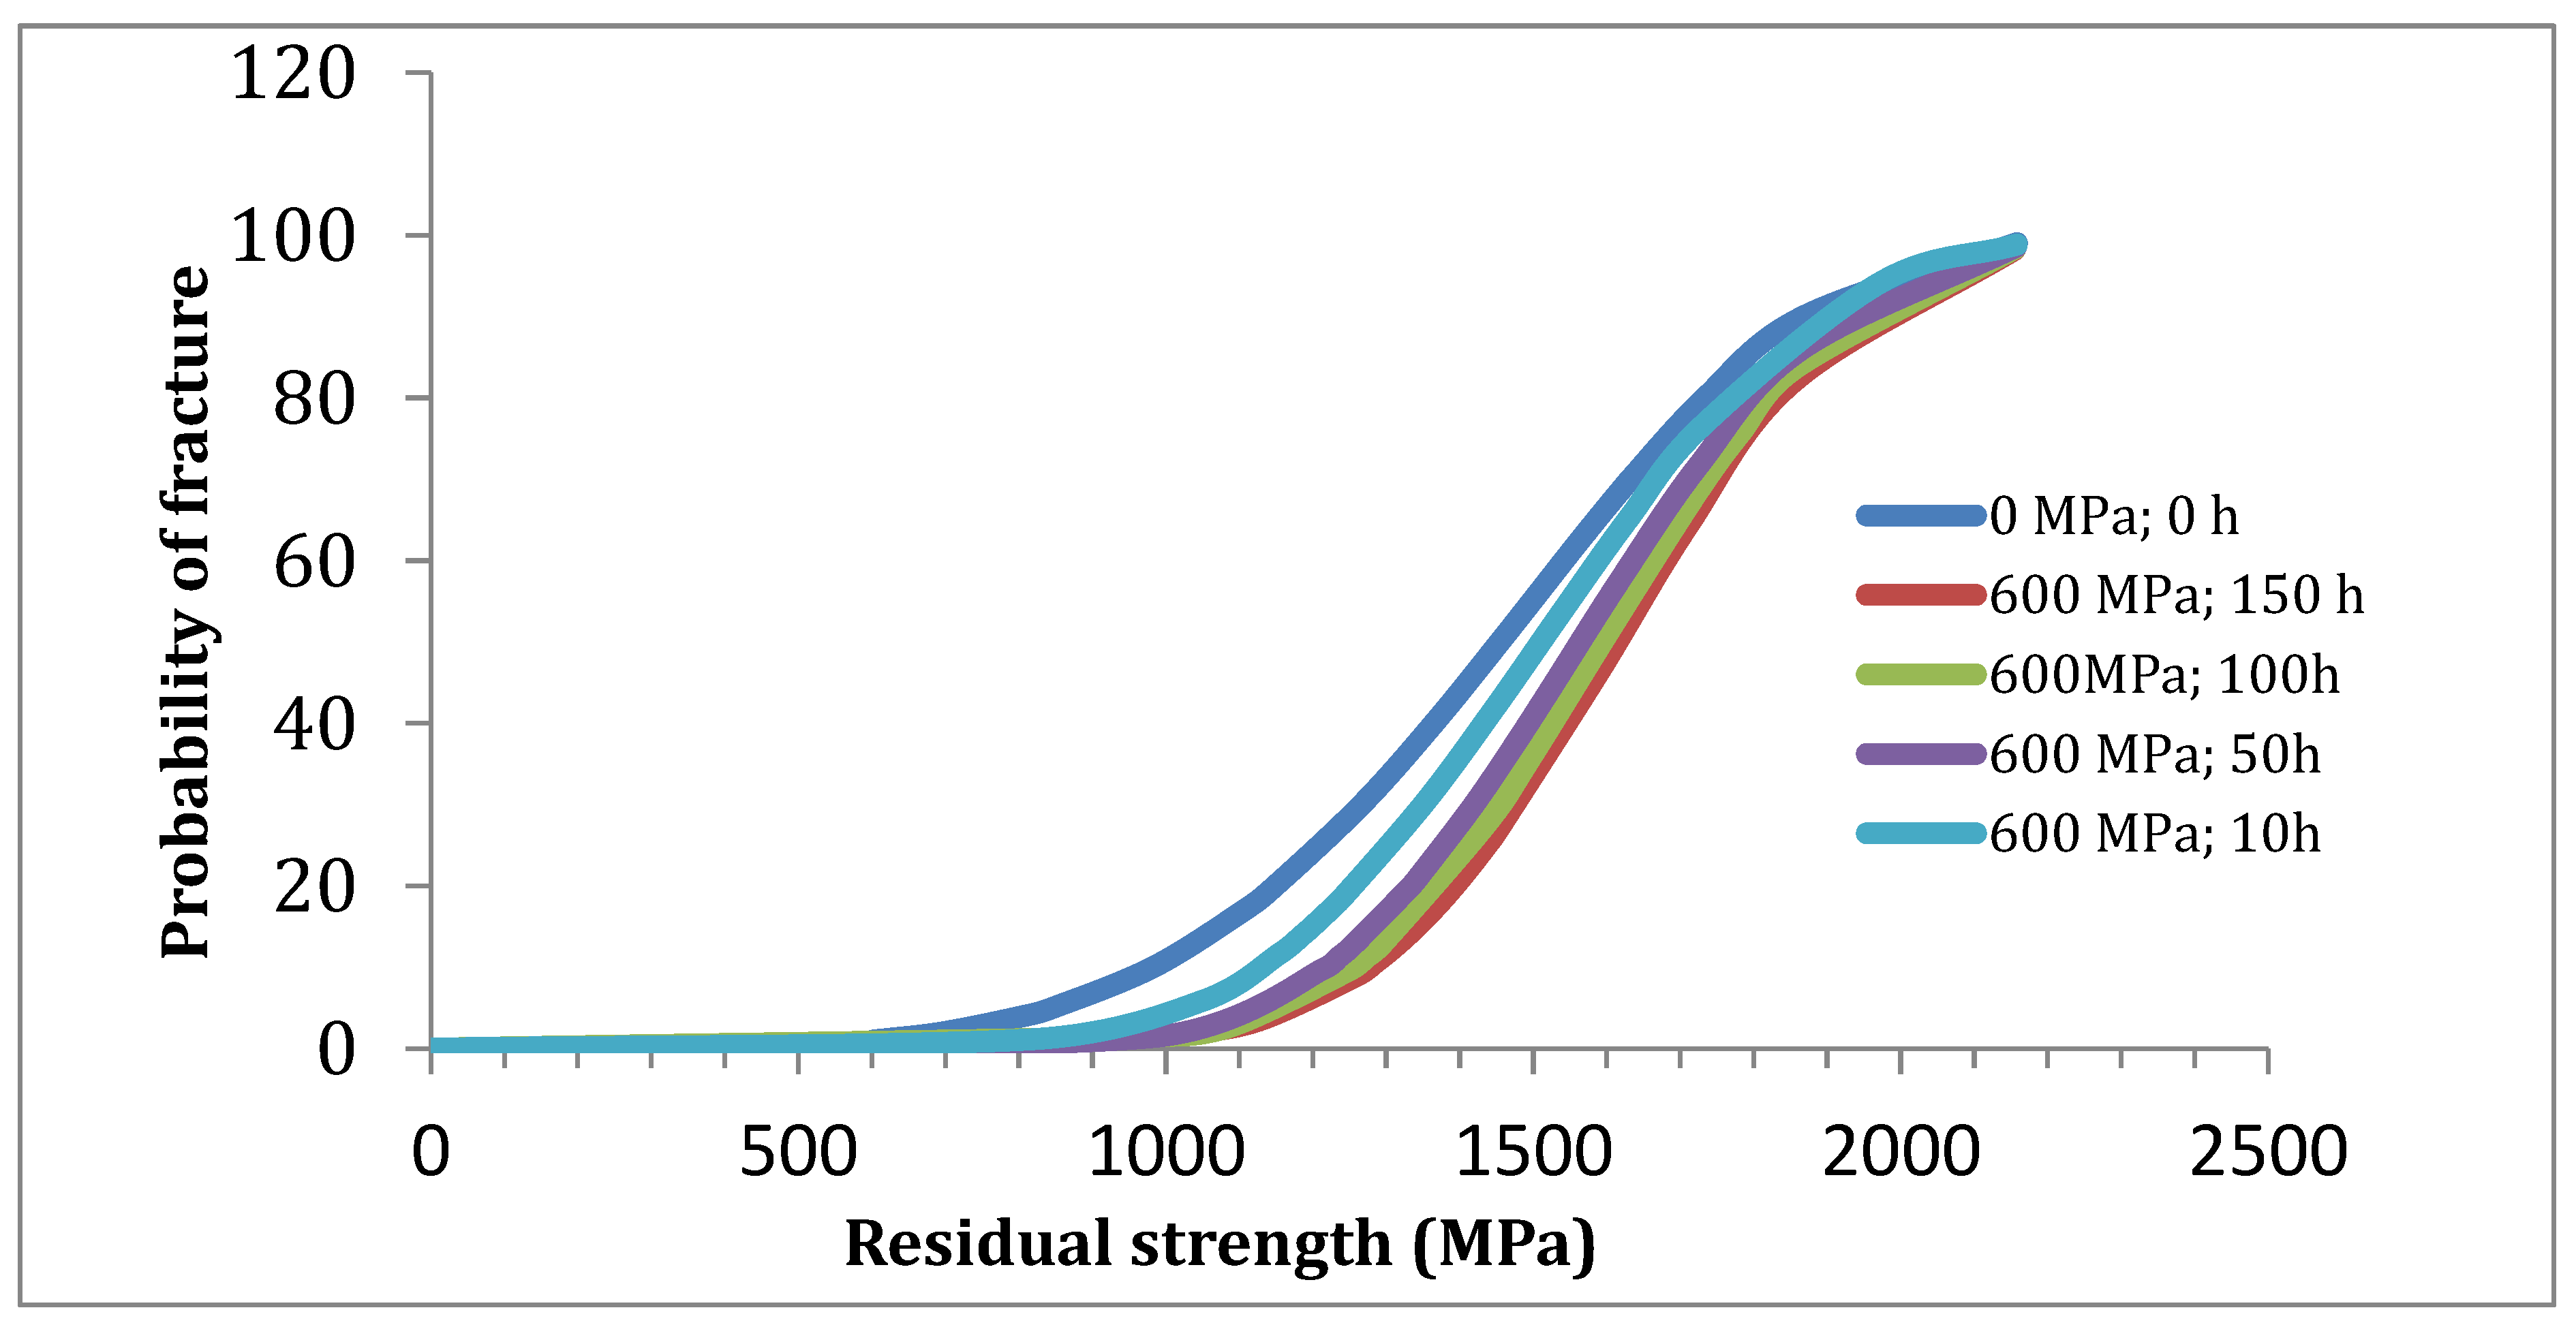
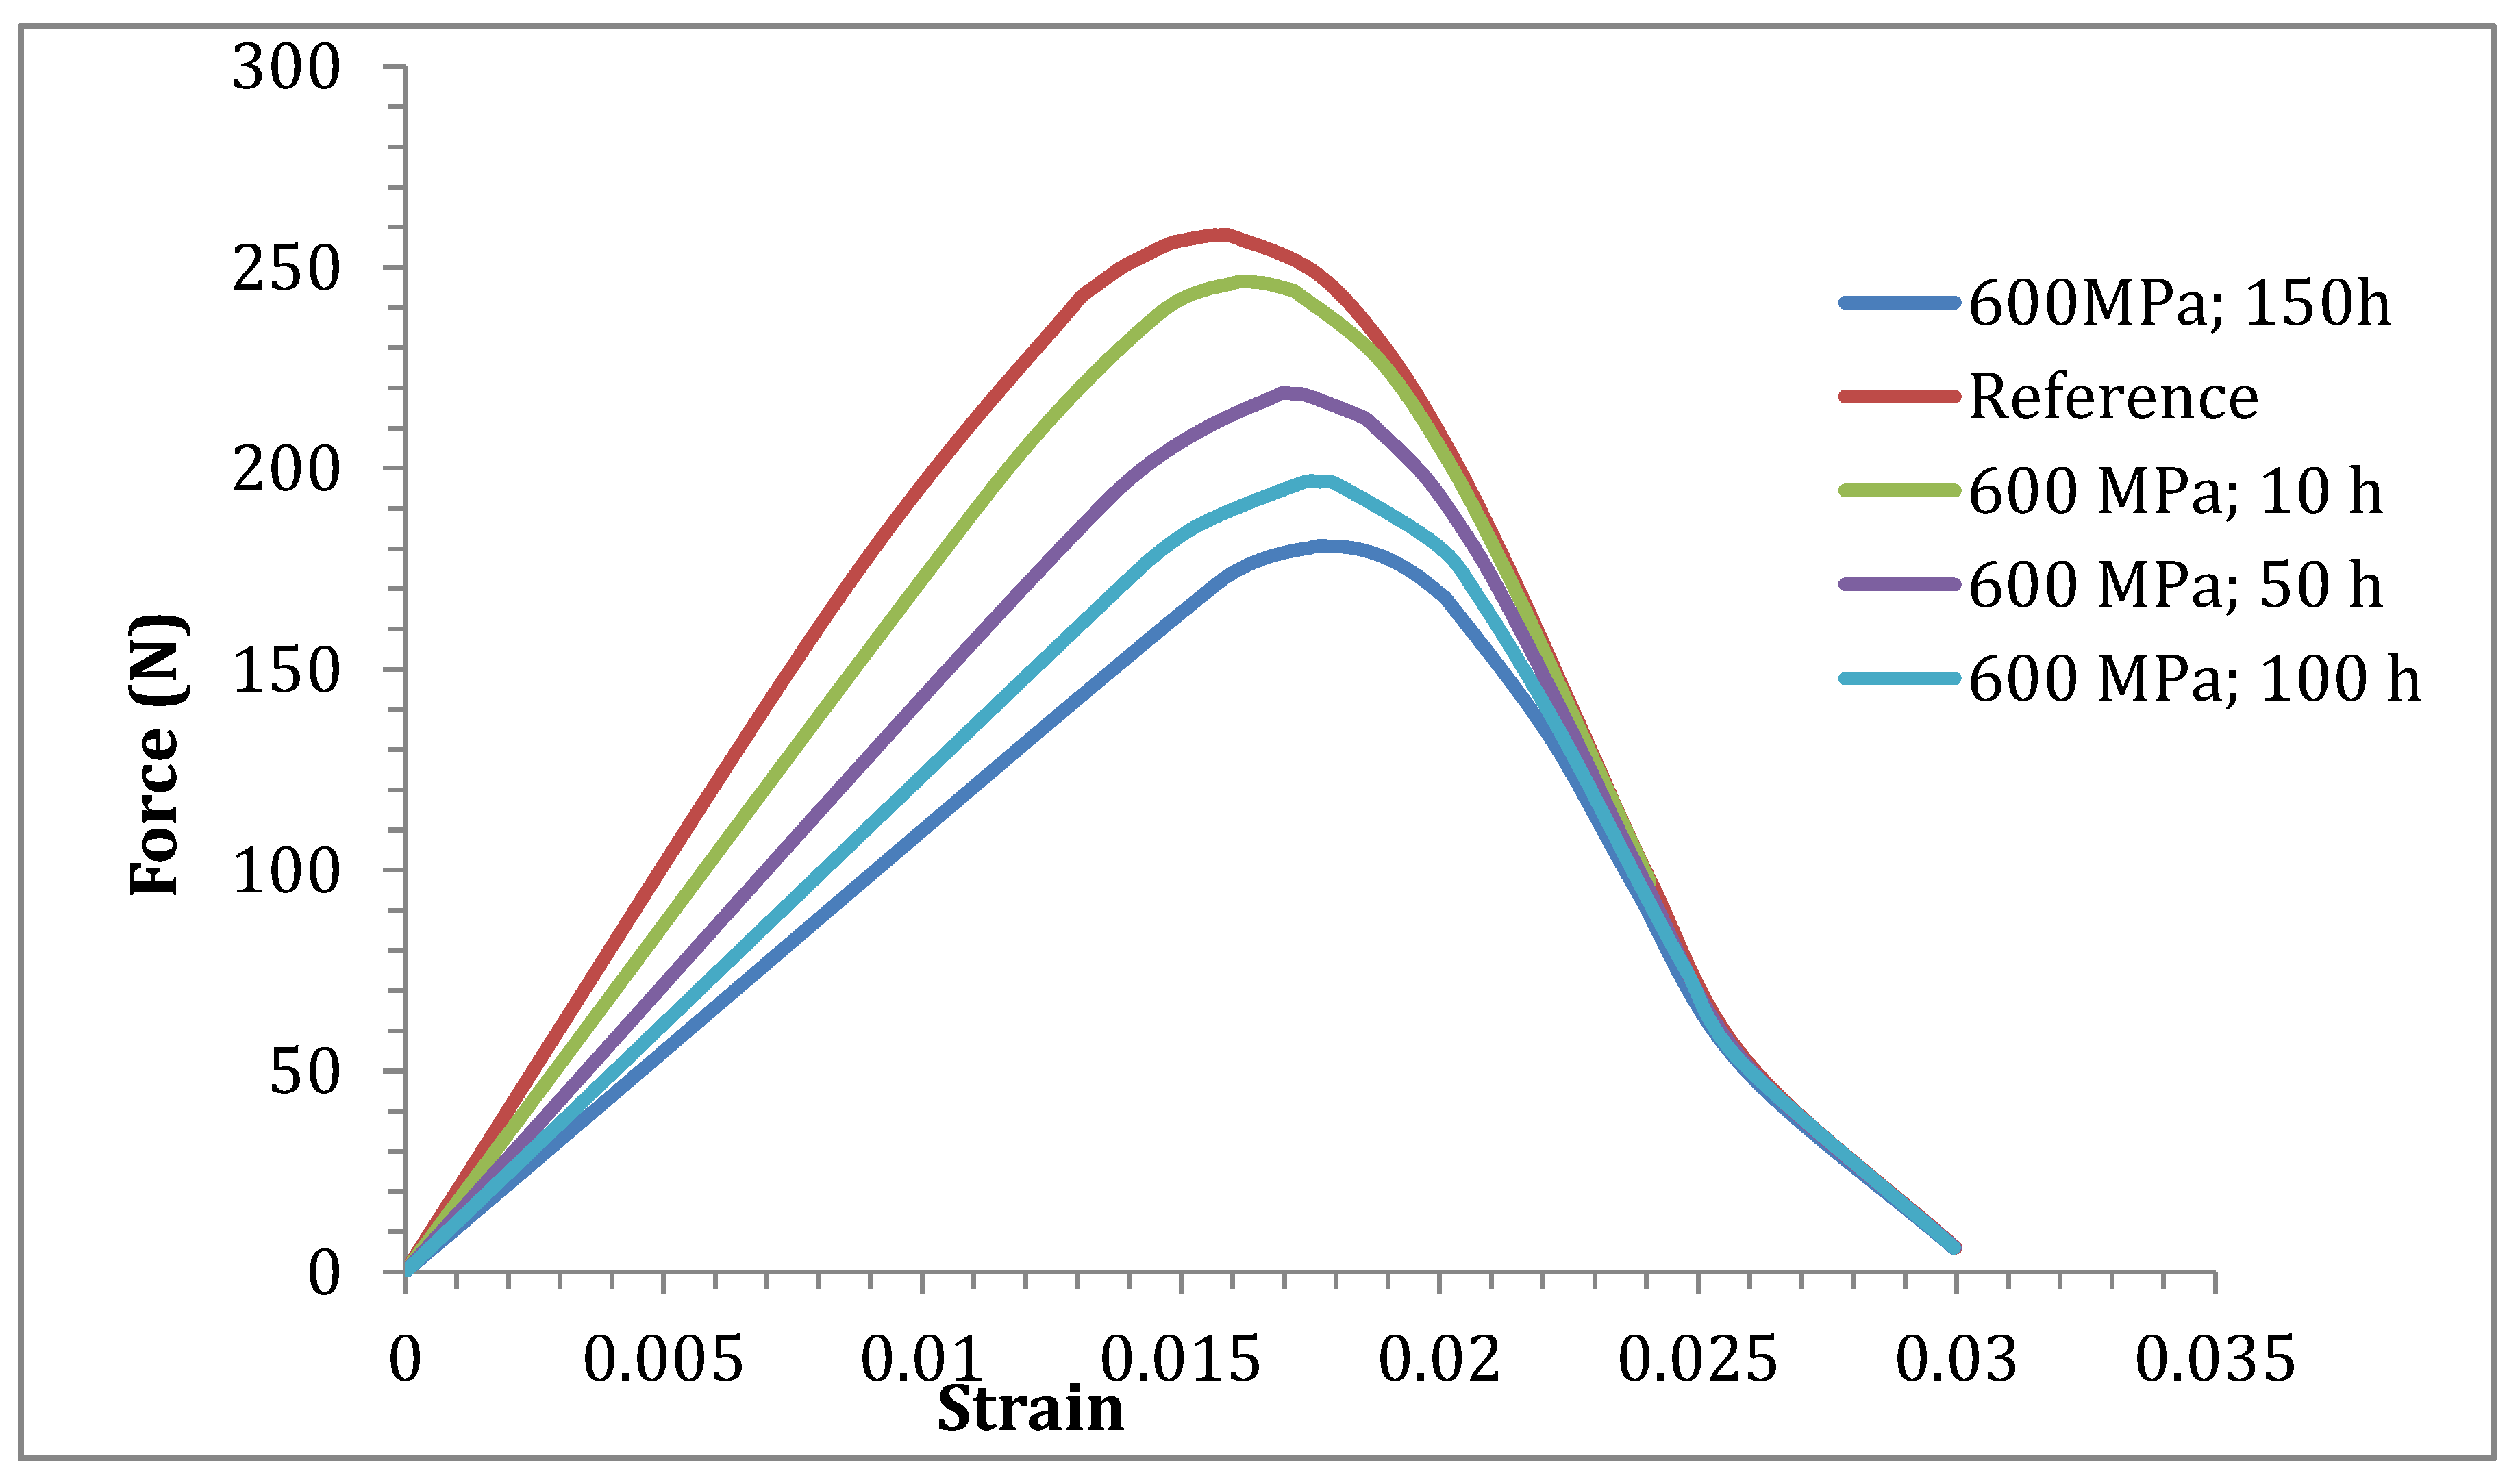
Figure 8 shows prediction of the evolution of residual behaviour after static fatigue during various duration times. It represents the intrinsic behaviour, since independent filaments were considered. The decrease in number of filaments after fatigue is reflected by the decrease of the slope of the initial linear domain, whereas the weakening of filaments is indicated by the decrease in residual strengths shown by the evolution of total distributions of residual strengths depicted in subsequent
Section 4.2.5.
4.2.4. Experimental Cumulative Distribution of Filament Residual Strengths
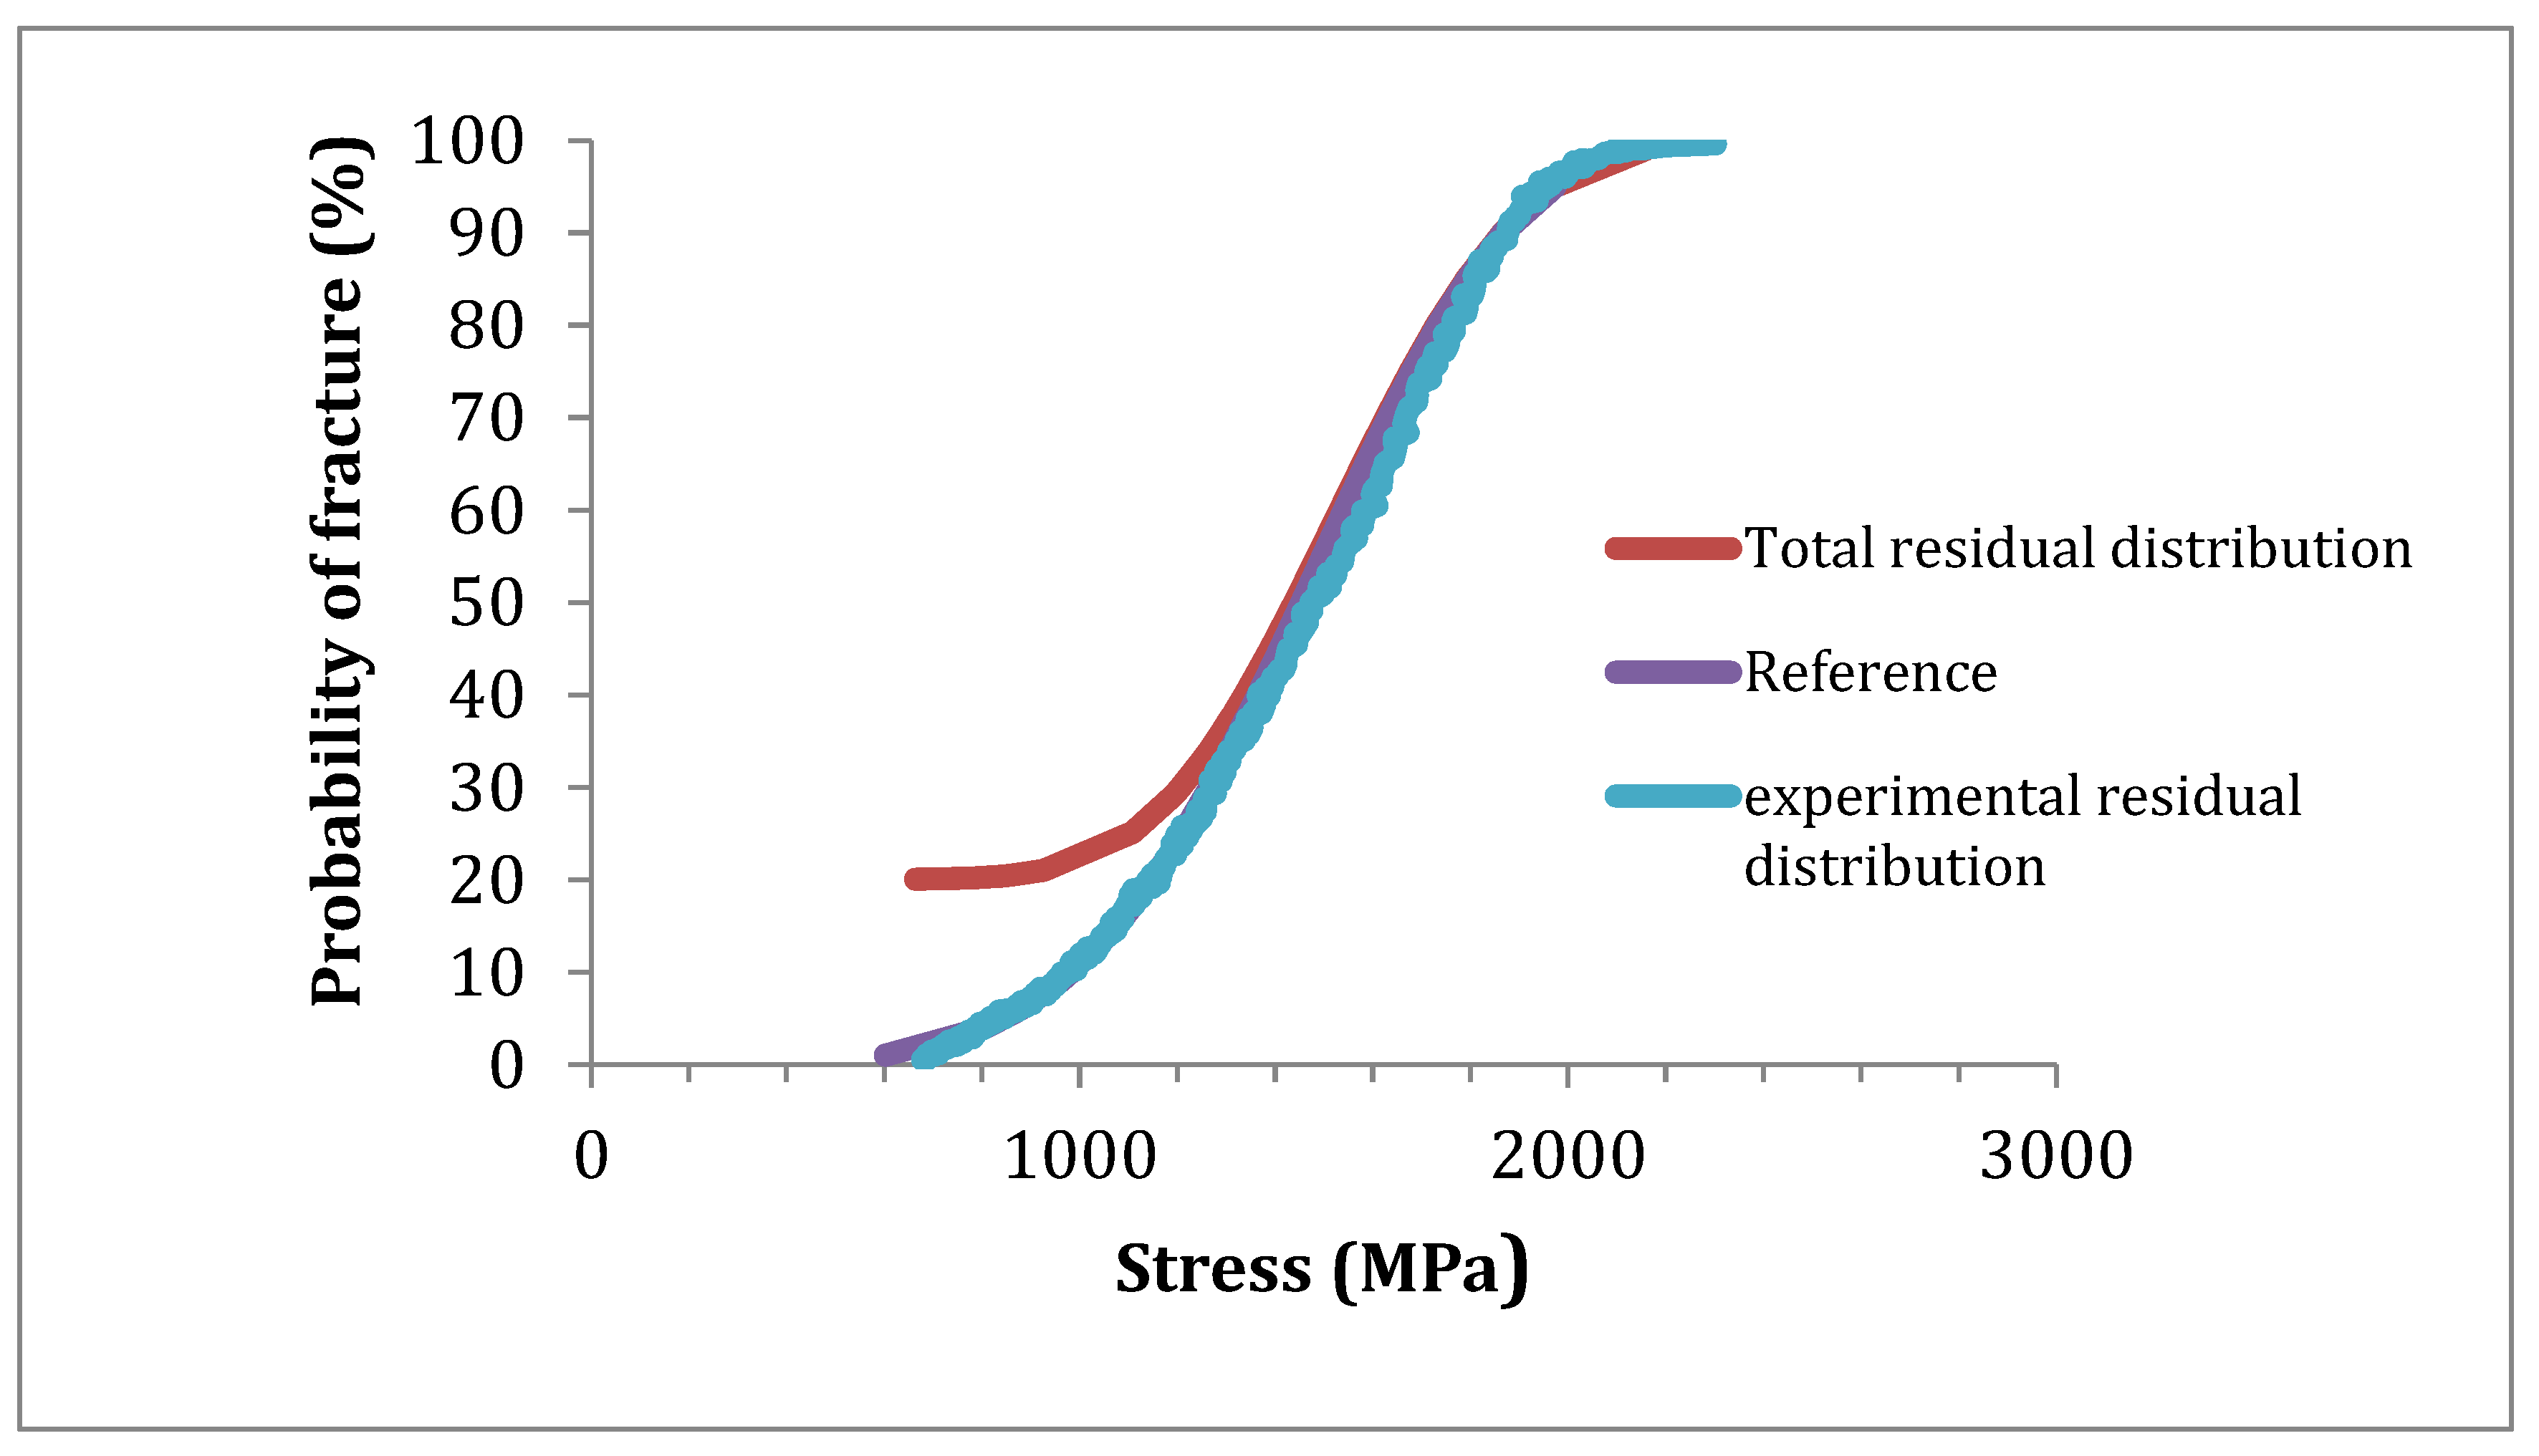
Figure 9 shows the residual distribution constructed from the experimental strain data extracted from the residual force/strain curve. Strains being in ascending order, corresponding failure probabilities were determined using the following estimator
P(
εj) = (
j − 0.5)/
N where
N is sample size. The distribution was satisfactorily fitted by the Weibull equation. The estimated statistical parameters
m = 4.9;
σ0 = 8.8 MPa are very close to the previous ones obtained by fitting the force-strain curve. Both are slightly larger than the reference ones (
Table 1 and
Table 2).
Figure 9 also shows that the experimental distribution of residual strengths coincides with the reference one. Therefore, the distribution of residual strengths does not reflect the loss in load carrying capacity displayed by the tow force strain curves after static fatigue.
4.2.5. Prediction of Cumulative Distributions of Filament Residual Strengths
Two cumulative distributions of predicted residual strengths were calculated:
First, the total distribution that includes residual strengths of all the fibres present in a tow, e.g., the filaments broken during fatigue and the surviving ones. In the following it is referred to as total distribution. The residual strength of filament with rank j is obtained from Equation (22), derived from Equation (4):
where
j is the rank of the filament in the distribution of reference strengths. The corresponding failure probability was calculated using the Weibull Equation (5) for
σRj > 0 (surviving filaments) and for
σRj = 0 (broken filaments).
Then, the residual cumulative distribution for residual strengths > 0. The failure probability of residual strength with rank
k in the residual distribution is derived from the rank
i of corresponding reference strength using the truncation equation:
Comparison of the total distribution of predicted residual strengths to the reference (
Figure 9) reflects tow weakening during fatigue, caused by filament failures (first 20% of the population) and slow crack growth (subsequent 20% of the population). The rest of the population does not seem to have been significantly affected. Then, the experimental residual distribution seems to be shifted slightly towards a narrow interval of larger strengths. Consequently, it is characterized by larger statistical parameters when compared to the reference. This effect does not reflect a strength increase; instead it results from the elimination of the broken filaments which makes probabilities decrease for the surviving filaments. This interesting effect shows that increase in statistical parameters cannot be interpreted systematically as a strengthening. This phenomenon is magnified by predictions of filament residual strengths (
Figure 6). The strength decrease is slower for the strong filaments, and rupture times are commensurate with reference strengths, as suggested by Equation (4).
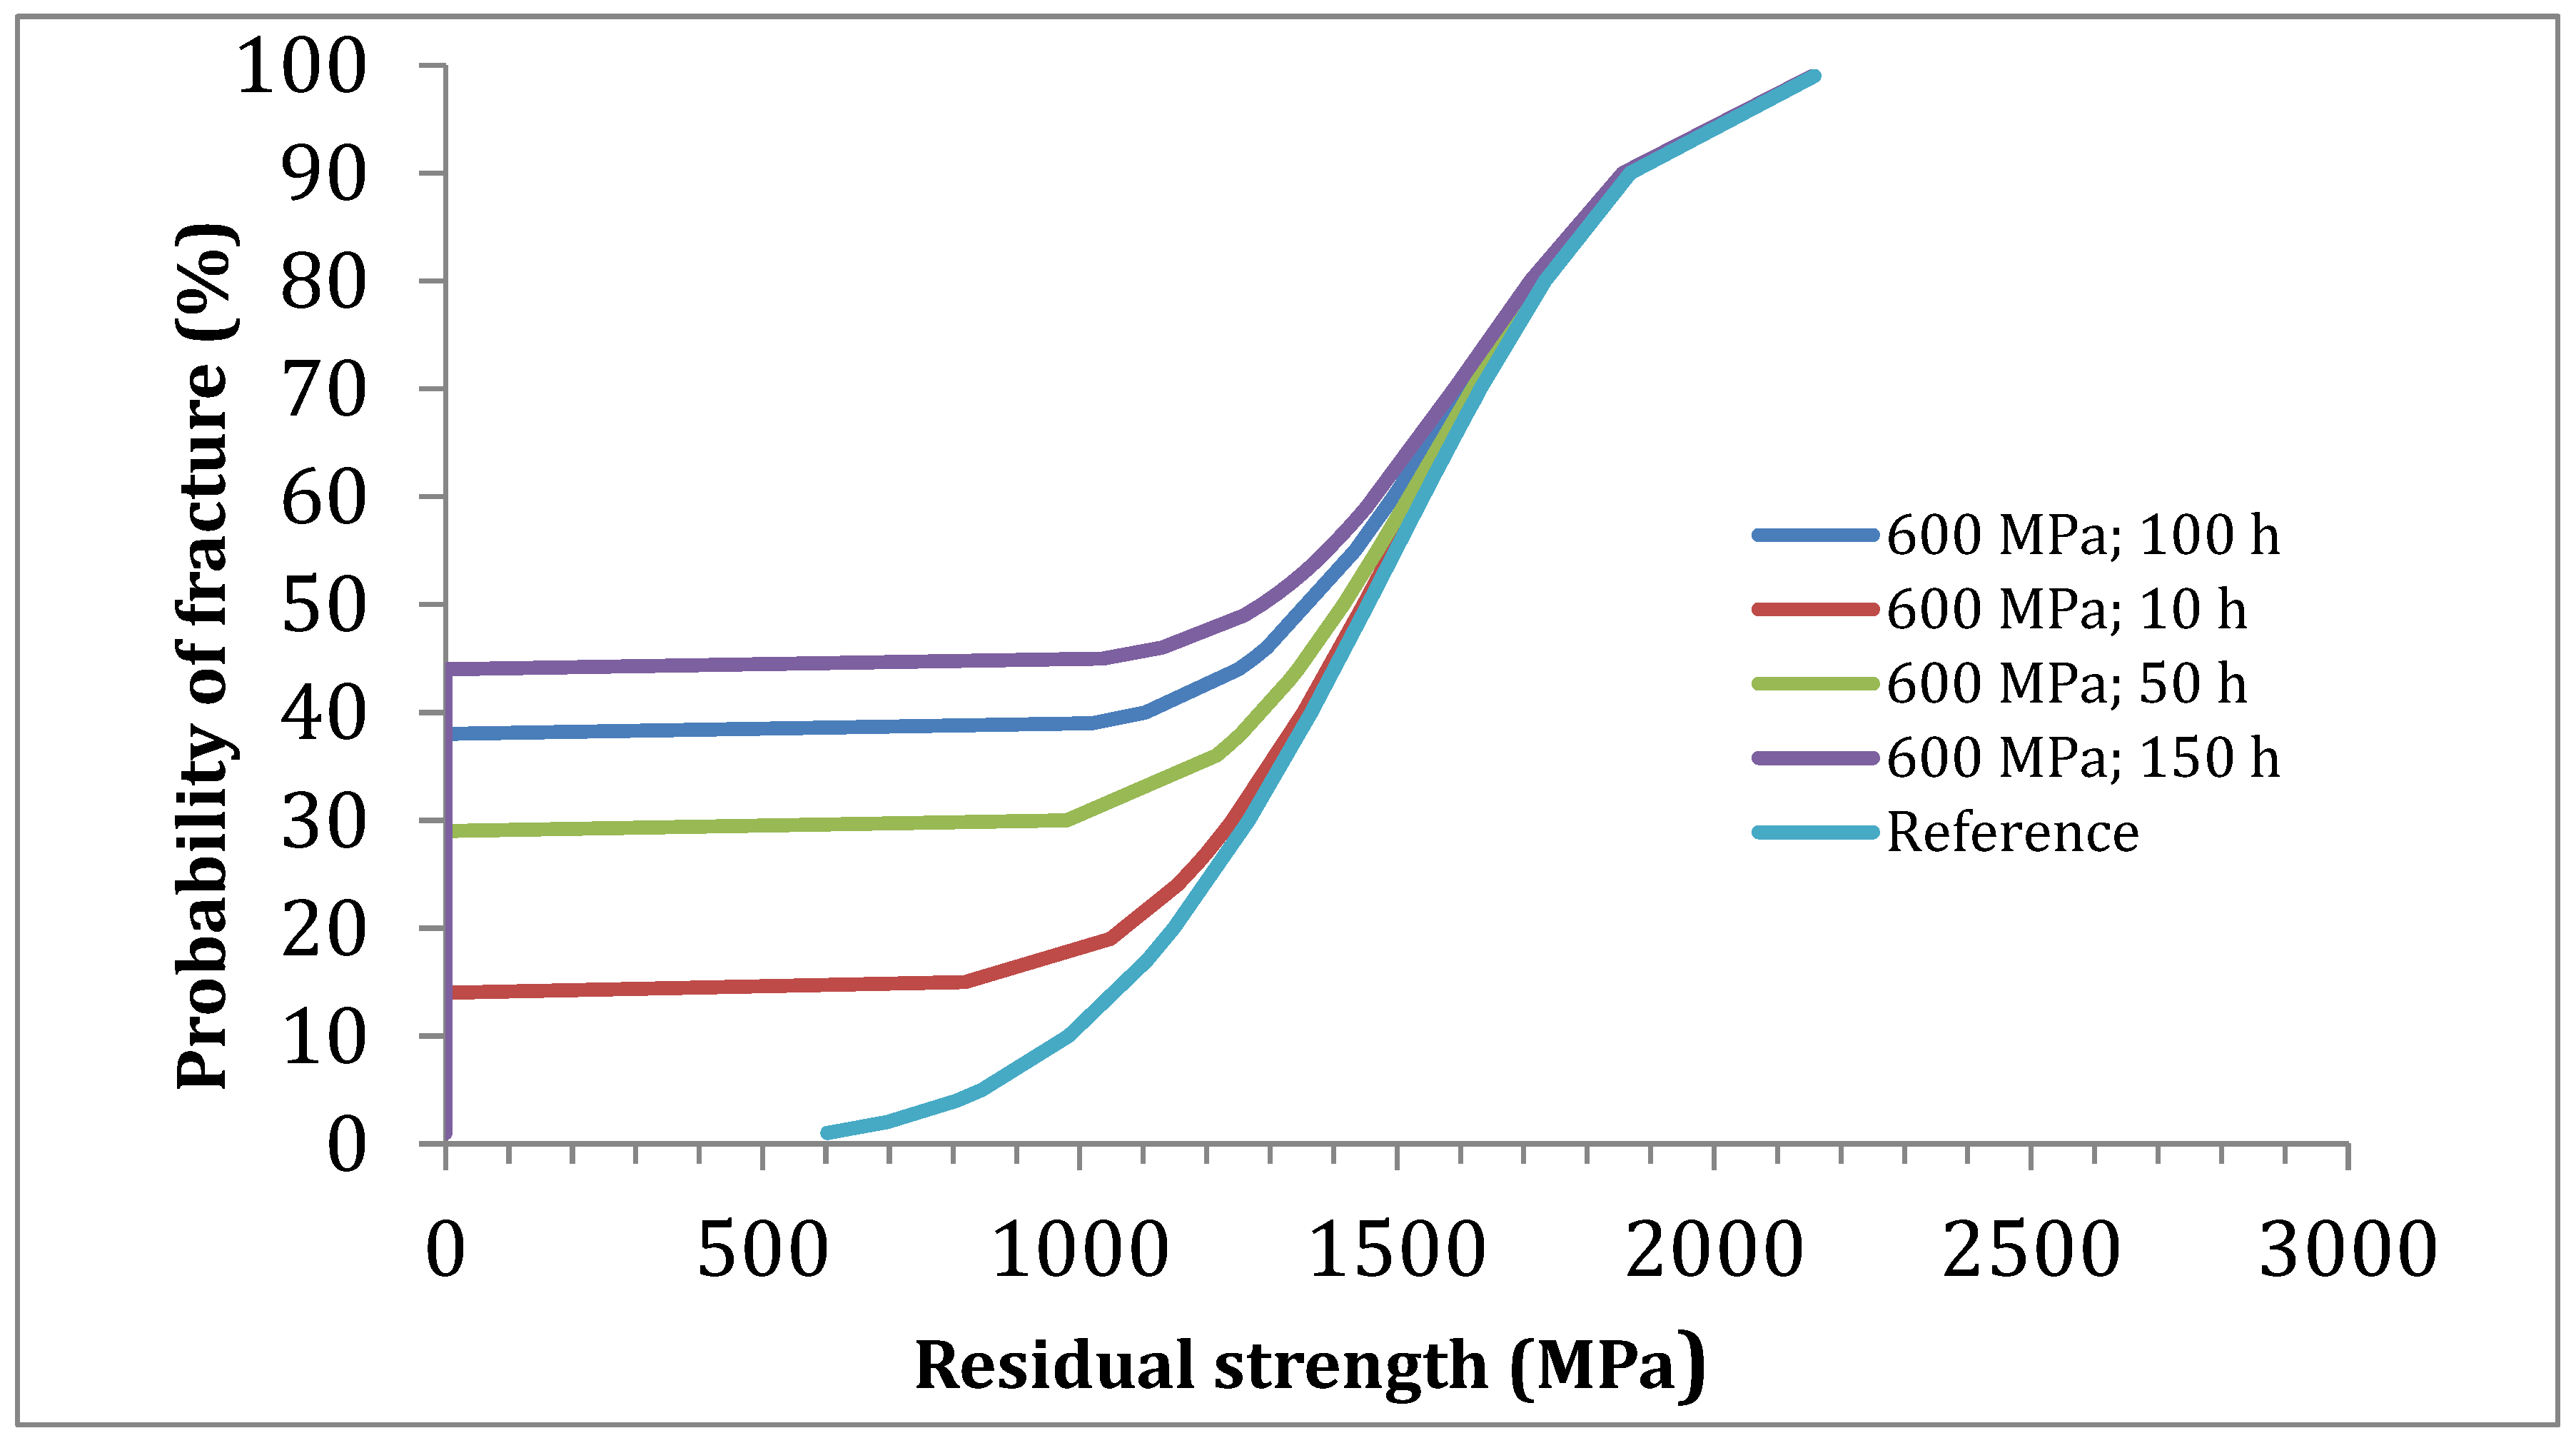
Predictions of total distributions of residual strengths after increasing fatigue time periods (
Figure 10) highlight the fracture of weaker filaments and the weakening of filaments during fatigue, while the filaments at the high strength extreme were not significantly damaged by slow crack growth. This behaviour is evidenced by
Figure 6.
Figure 10 also shows that, at a given probability (which defines the same filament) the residual strength decreases, and that the interval of residual strengths shrinks with fatigue duration. These evolutions do not contradict the slight Weibull modulus increase mentioned earlier in
Section 4.2.3.
In
Figure 11, the statistical distribution of residual strength considers only the surviving filaments. Note that the residual strengths are higher after increasing fatigue duration. This trend is not at variance with filament weakening shown by previous results. It results from the truncation of distributions. Unlike in the total distributions, the successive strength values at given probability do not characterize the same filament, due to the elimination of increasing numbers of weaker filaments during fatigue. The sample size is constant for the total distribution, whereas it decreases with time for the population of surviving filaments. At this stage, it is worth pointing out that tests on individual filaments would lead to a wrong interpretation of fatigue effect because the fibres broken during fatigue would be discarded, so that the strength distribution shift would be considered to reflect strengthening.
Analysis of residual strength distributions showed that m increased slightly unlike
σ0 [
18]. The question can be raised whether the residual strengths follow a Weibull distribution, since no evident closed form expression of residual strength distribution was derived from Equation (4). However, the answer to this question is brought by the excellent agreement between the experimental force-strain curve and predictions using Weibull Equations (5) and (14) or (15) (
Figure 7 and
Figure 9).
5. Concluding Remarks
E-glass filament fracture data, including the strength for fast fracture and the lifetime for delayed failure (in static fatigue), display a wide variability. Statistical distributions of filament strengths and lifetimes allowed a sound analysis of tow static fatigue behaviour in water.
Damage of tows is dictated by the successive failures of filaments from fracture inducing flaws. Ultimate fracture is dictated by a critical filament, the fracture of which is followed by instability (fast fracture of tow). The critical filament depends on loading conditions: monotonous loading, fatigue, force or strain controlled loading conditions. A filament in a tow is defined by the relation between the fracture probability and the strength in inert conditions.
In static fatigue, the critical filament depends on the loading mode: constant force or constant deformation. The loading mode induces a variability as wide as two orders of magnitude to the critical filament lifetime. Constant force is the most severe mode.
The investigation of variability generally requires a large number of specimens. This issue was solved by the proposed approach that uses (i) tests on multifilament tows for the determination of fracture statistical parameters and slow crack growth constants, and (ii) a fracture statistics-based model for the prediction of filaments and tow behaviour during and after static fatigue. Several features have been evidenced and quantified such as the statistical distributions of filament rupture times, the statistical distributions of residual strengths, the dependence of lifetime on stress (STP diagrams) and on the size of filaments and tows.
The residual behaviour of tows was quite well predicted which assesses the database and the model. Decreases of the load carrying capacity of tows after static fatigue were predicted for various static fatigue durations. It was also shown that the degradation of a filament during fatigue depends on its initial strength.


