Evaluation of Critical Parameters in Tensile Strength Measurement of Single Fibres


MINES ParisTech, PSL University, Centre des Matériaux (CMAT), CNRS UMR 7633, BP 87 91003 Evry CEDEX, France
*
Author to whom correspondence should be addressed.
J. Compos. Sci. 2019, 3(3), 69; https://doi.org/10.3390/jcs3030069
Submission received: 8 May 2019
/
Revised: 25 June 2019
/
Accepted: 7 July 2019
/
Published: 9 July 2019
(This article belongs to the Special Issue Feature Papers in Journal of Composites Science in 2019)
Abstract
:Mechanical properties of fibre reinforced composites are primarily dependent on those of fibres. Fibre properties are used for estimating the damage and strength behaviour of composite materials and structures. Tensile strength of fibres is commonly determined by single fibre tensile tests, which is challenging and is prone to measurement errors. In this study, different possible sources of errors due to experimental limitations in the fibre testing process were identified. Their effect on fibre tensile strength was analytically modelled. This model was used to evaluate the uncertainty in experimentally determined fibre strength. A sensitivity analysis was conducted to rank the relative significance of input quantities on the calculated fibre strength. Since composite models require fibre properties determined at very small gauge lengths, the results of the sensitivity analysis were extrapolated to determine critical parameters for tests done at those small gauge lengths of a few millimetres. It was shown that, for sufficiently long fibres, their strength depends mainly on the diameter and failure force; however, for shorter gauge lengths, the effects of misalignment become very significant. The knowledge of uncertainty would be useful in estimating the reliability of the predictions made by composite strength models on the damage and failure behaviour of composite materials and structures. Minimising the influence of critical parameters on fibre strength would help in designing improved single fibre testing systems capable of determining fibre strength more accurately.
1. Introduction
Fibre reinforced composite materials are ideal to be used for structural applications in the automotive and aerospace industry due to their lightweight and high specific strength. The mechanical properties of fibre reinforced composites are strongly dependent on those of the fibres as they are the principal load bearing constituents of the structure [1]. For high performance composite material applications, reliability-based designs and lifetime assessments are needed. Previous work at the research centre has been focussed on developing such reliable composite strength and damage models [2,3]. High reliability of the model predictions is required so that the predictions can be used with confidence in industrial applications [4]. The properties of fibres are used as an input in composite strength models for evaluating the damage and failure behaviour of composite materials and structures [5]. It is therefore essential to use accurate fibre properties to determine a representative behaviour of structures. Fibre tensile strength is commonly determined by conducting single fibre tensile tests using an appropriate experimental setup. The very small cross-section of fibres make them very delicate to handle leading to a very challenging and cumbersome process of fibre specimen preparation and testing [6]. These challenges significantly affect the accuracy of the prepared specimen and may lead to inaccurate fibre strength measurements [7,8].
The “strength” of a structure is defined as its ability to withstand an applied load without breaking. For a given single fibre, to assess its strength, a monotonic longitudinal load is applied to the fibre until its failure. This failure load is then normalised by the cross-section, possibly at the breaking point, to obtain the “tensile strength” of the fibre. Nevertheless, strength is not an intrinsic material property and structures or materials break from their weakest point. Due to their inherently high aspect ratio, fibres can be compared to chains and as a chain—only as strong as its weakest link—fibre tensile strength depends on the tested length also called the “gauge length”. The longer is the fibre, the lower is the applied load needed to break it and the lower is the strength. Even for a given gauge length, there is obviously a variation in the strength of individual fibres due to the distribution of defects in the volume or on the surface of fibres. Fibre strength cannot be described by a single average value and is typically represented by using a statistical function which characterises the intrinsic variation in its strength [9]. If inaccurate fibre strength data were recorded, the corresponding statistical function would not be able to accurately capture the actual strength behaviour of the fibres [10]. When such a fibre strength function is used as an input for composite models, the predictions made by the models for strength and damage behaviour of the corresponding composite structures would also be inaccurate [11,12]. To assess the predictions made by composite strength and damage models, worldwide failure exercises have been conducted [13,14]. The predictions made by the different models analysed were found to spread over a large range, thus suggesting the reason for the lack of confidence in such models. A small change in input data can cause a significant variation in model predictions such as the failure strength or the time to failure of a composite structure. This behaviour has been highlighted in one of the previous works, where the time to failure for composite structures has been shown to depend strongly on the uncertainty in input data [15]. For example, the time to failure for the composite specimen studied increased by a factor of ten on decreasing the standard deviation of fibre strength distribution to a third of its initial value. Therefore, it is of paramount importance that the input data, mainly the fibre strength, are determined accurately with minimum uncertainty. However, it has been found that there has been discrepancy in fibre strength properties, and, even for the same type of fibre, different authors have reported different results [8]. These differences could be due to a combination of many factors such as measurement and experimental errors and uncertainty, non-representativeness of the chosen sample, method of analysis, etc. Mentioning the associated uncertainties has not been a usual practice when reporting fibre strength properties, although it has been established that accurate fibre strength properties are vital for the reliability of composite strength model predictions [16]. Among the different possible causes of uncertainty, the first objective of this study was to determine the uncertainty in fibre strength arising during experimentation, which has been left unnoticed by most previous studies.
Another requirement for composite strength models is that the fibre properties should be defined at specific gauge lengths. The required lengths are usually smaller when compared to the gauge length usually used for experimentation, mainly because practical limitations make it difficult to conduct experiments at very short gauge lengths. For most models, fibre properties for gauge lengths in the range of a few hundred micrometres to a few millimetres are required [2,17,18]. However, almost all experimental results available are for fibre gauge lengths in the range of a few tens of milimetres [8]. The usual practice is thus to use results generated using long gauge lengths and then to extrapolate the properties to shorter gauge lengths using appropriate statistical methods and models. This extrapolation may further introduce uncertainty in results as the models used for extrapolation may not always be accurate or valid for all gauge lengths. If fibre properties were generated at shorter gauge lengths, it might be more appropriate and useful as then the properties can directly be used as input for the models without the need for any extrapolation or predictions. However, tests done at shorter gauge lengths of a few millimetres may be more susceptible to experimental errors and uncertainties. To minimise these uncertainties, the effects of critical quantities that contribute to these uncertainties have to be minimised. The most critical quantities leading to uncertainties for tests conducted at different gauge lengths were also determined in this work, which was the second objective of this study.
There are many possible sources of errors in experimental determination of fibre tensile strength, some of which were studied in this study. To determine fibre strength, a tensile test was done using a single filament and different input quantities were measured, which were used for calculation. However, no measurement is perfectly accurate and there is some degree of uncertainty associated with every measurement. Uncertainties can arise from many sources such as improperly prepared fibre specimens, limited precision of the measurement tool, experimental limitations, etc. Section 2 presents the different possible sources of errors due to experimental limitations in the fibre testing process that were identified. Their effect on fibre tensile strength was analytically modelled. This model was used to statistically evaluate the uncertainties in experimentally determined fibre strength following the recommendations established by the “Guide to the expression of uncertainty in measurement” [19]. To determine the effect of the measurement uncertainty of input quantities on the calculated fibre strength, tensile tests using T700 carbon fibres were conducted. T700 fibres are very commonly used as reinforcements in composites used for structural applications. In Section 3, a sensitivity analysis is presented to understand the influence of different input parameters on the calculated fibre strength, for different gauge lengths. This would help in identifying the critical parameters, which introduces errors and affects the accuracy of the calculated fibre strength. Minimising the effect of these critical parameters would help in generating accurate fibre tensile strength data, which would increase the capability of composite strength models for providing more accurate results.
2. Fibre Tensile Strength
Although fibre tensile strength is most commonly determined using processes such as the single fibre tensile tests [20], as mentioned in the Introduction, other methods can also be used with varying levels of accuracy. These are, for example, the methods of fibre fragmentation tests [21] and fibre bundle tests [22]. In the most basic form, a single fibre (or single fibre composite in the case of fibre fragmentation tests or a fibre bundle in the case of bundle tests) is subjected to a longitudinal and monotonic tensile load until failure. A single failure value leading to the evaluation of the fibre strength is recorded for the single fibre test but a more complex analysis is required for fragmentation or bundle tests, which provides a large amount of failure data during the test. For the present study, the single fibre testing method was used as it is the most popularly used methodology for the determination of fibre tensile strength.
2.1. Single Fibre Testing
Before subjecting the fibres to a tensile load, fibre specimens need to be carefully prepared. As described in [23], several techniques for the preparation and mounting of fibres exist. These include processes of sticking, pinching or even knotting the fibre to prepare the specimen. Irrespective of the process used, all these techniques share the following same challenges:
- aligning the fibre with the loading direction as perfectly as possible; and
- controlling the gauge length as accurately as possible, since fibre strength is length dependent.
To illustrate these points, the thick paper frame method was used for this study and is detailed with a schematic of the prepared specimen, as shown in Figure 1a. A single fibre was extracted from a bundle and loaded horizontally on top of a card frame, as shown. There is a central opening in the paper frame, the length of which determines the gauge length of the fibre specimen, as shown in the schematic in Figure 1a and in the actual paper frame shown in Figure 2. The available holes at the ends are for attaching the frame to the machine with proper alignment. Two points of glue are affixed to the edges of the central opening. The sides of the frame are cut before subjecting the fibre to a tensile load. The load at which the fibre breaks is recorded [24]. In fact, it is very difficult to align the fibres perfectly to the centreline and also to fix the gauge length accurately, as can be seen from Figure 1b. This leads to angular misalignment of the fibre specimen and inaccurate measurement of gauge length, respectively (see Figure 1c). The tensile machine itself may have a slight offset of the jaws. This is a common error and should be avoided by the tester. This could also lead to alignment inaccuracy between the fibre and the loading direction. For the continuation of this work, no distinction will be made between these different sources of inaccuracies and the concerned quantities will be treated in such a way as to encompass all possible sources. The misalignment parameter is therefore treated as a whole. In particular, no mention will be made of the different fixing techniques and the results would be independent of the machines used for conducting single fibre tensile tests.
2.2. Determination of Tensile Strength
Fibre strengths are not measured directly but are calculated using measured quantities, precisely by dividing the force to failure (the one recorded by the system) by the cross-sectional area A of the fibre. Depending on the nature of the fibre, the section area can be constant (as for most synthetic fibres) or it may vary along the length as is the case for natural fibres and for which case the A-section should correspond to the section at the break point. Unless this breaking section measure can be done in-situ or post-mortem, these data are often inaccessible and, most of the time, a “mean” cross-section is used, which is the case in the present study. Given the high slenderness or aspect-ratio of the tested fibres and the very small sections considered, the notion of average over the length is still questionable. Assumptions which are discussed below in this work must always be considered. Nevertheless, the basic functional relationship for calculating fibre strength (or any stress at time t, i.e., corresponding to the load ; in that case, Equation (1) will become ) is given by Equation (1).
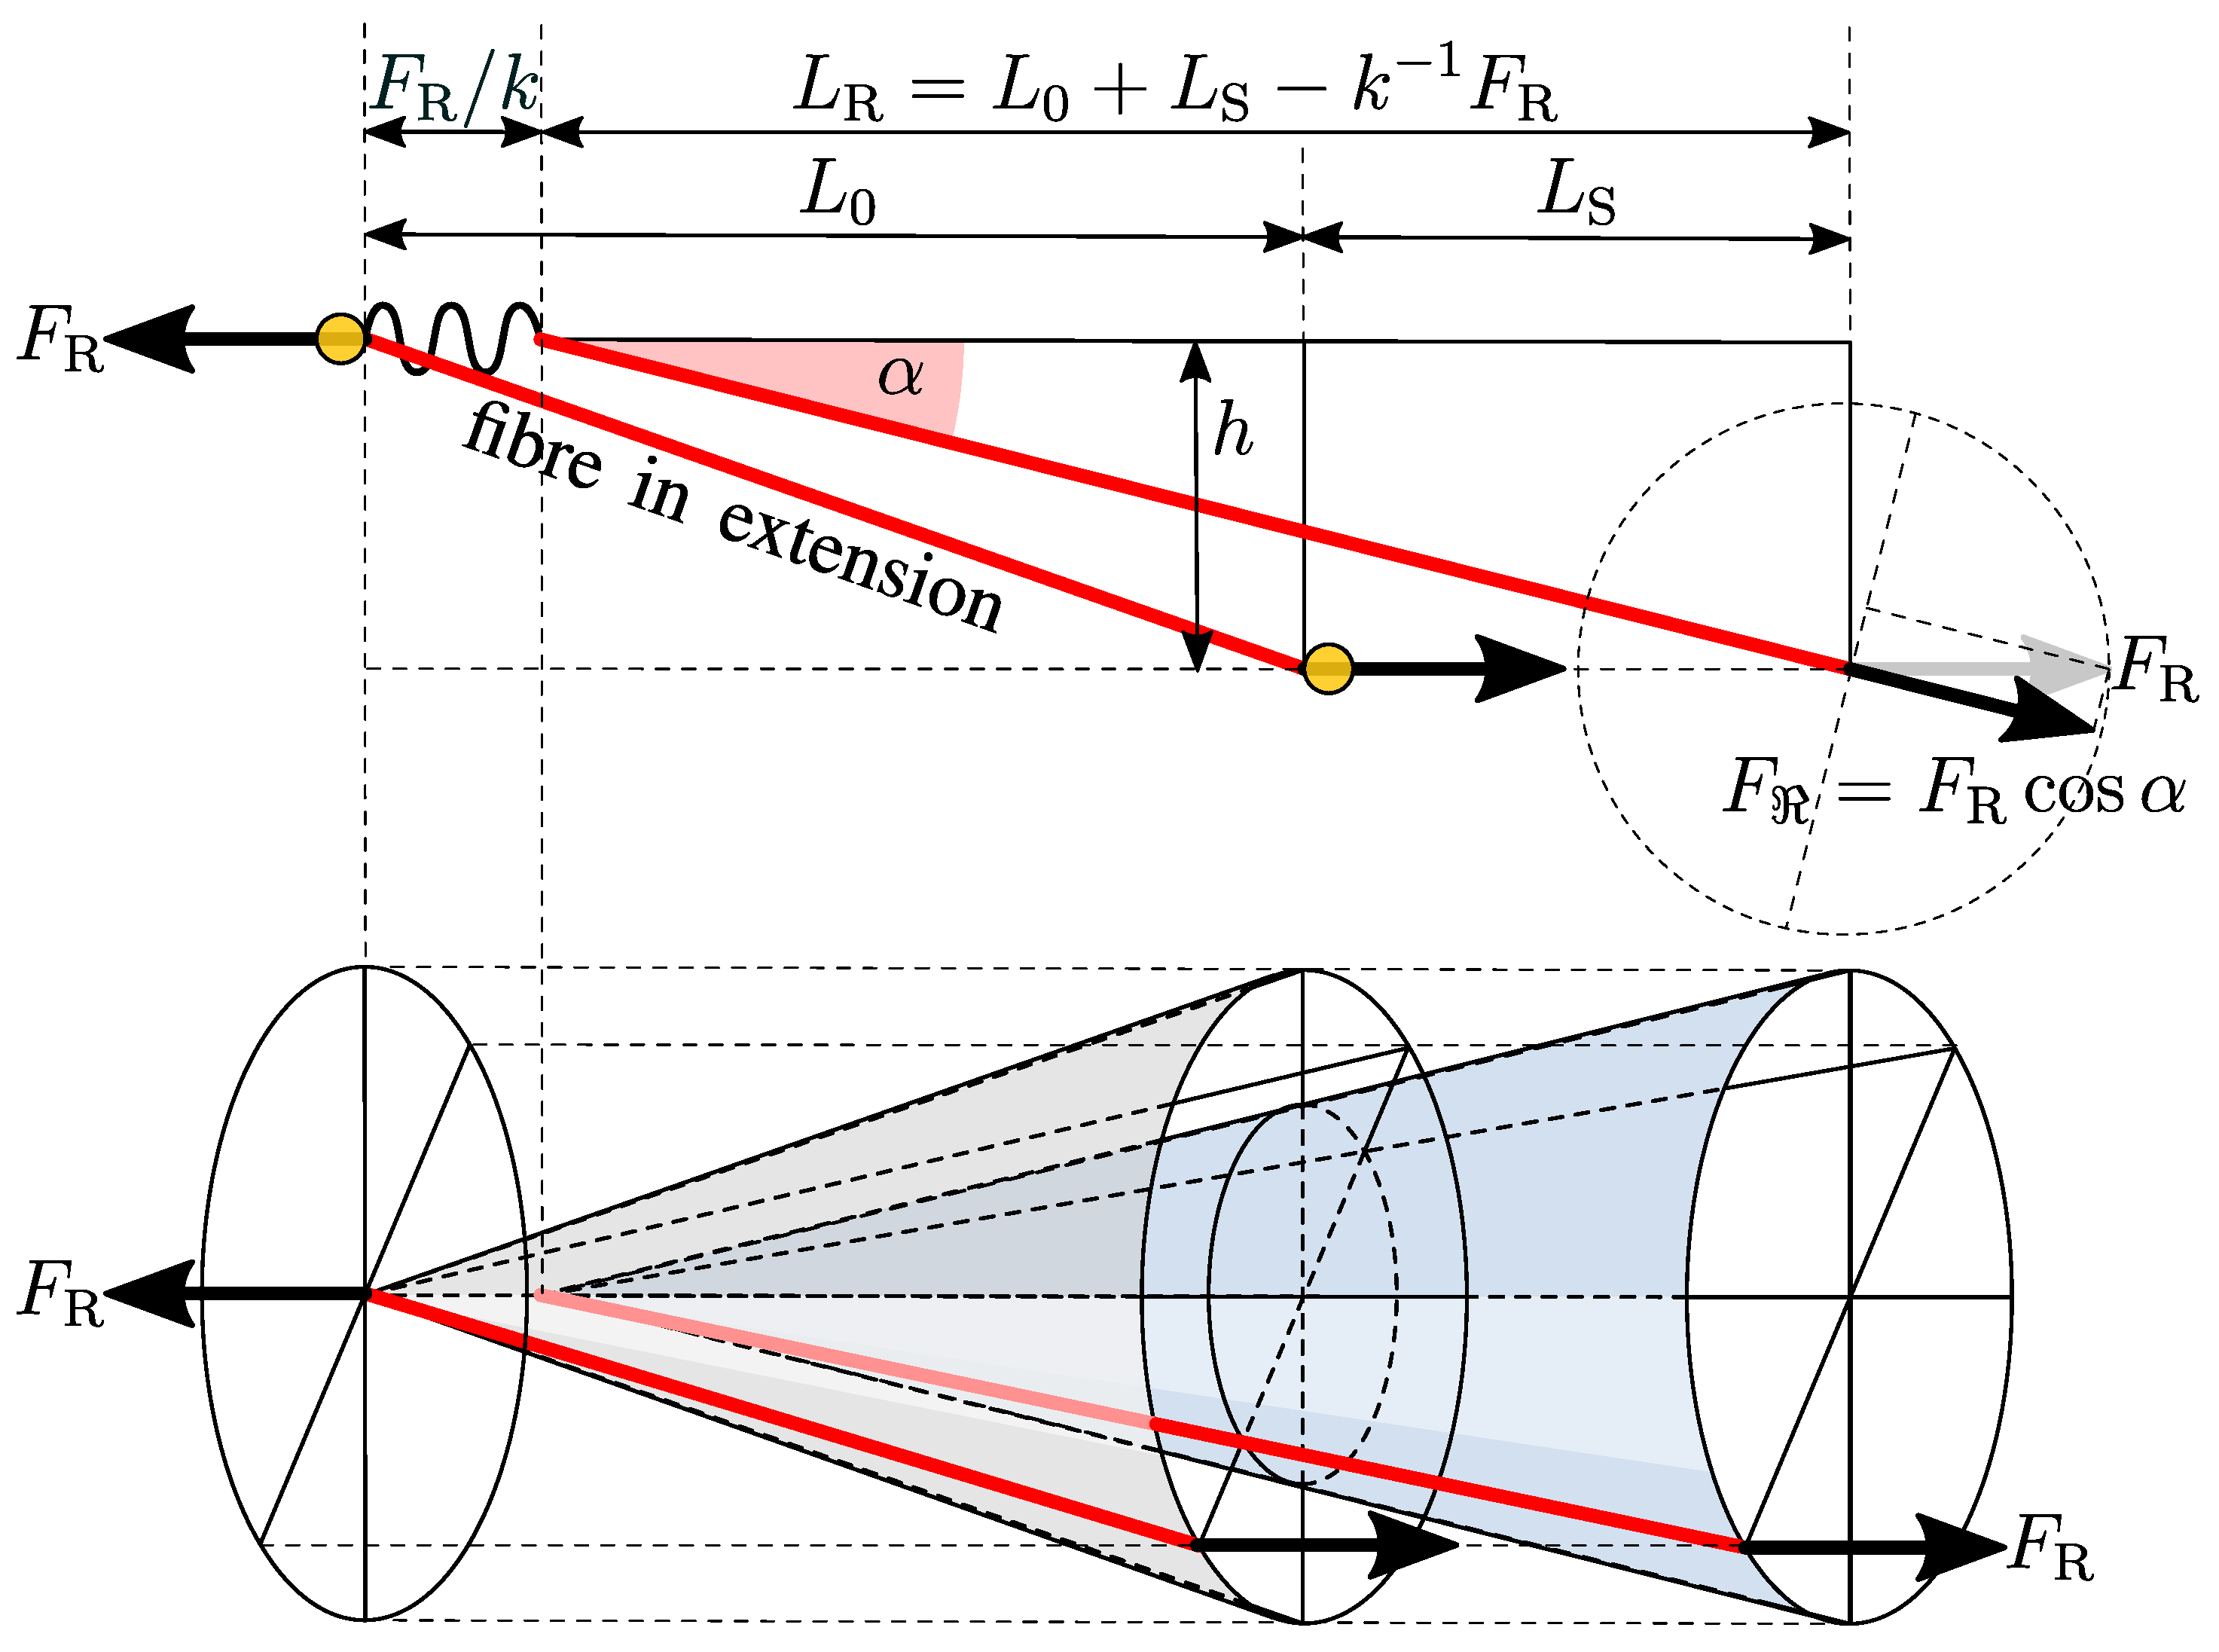
During the testing process, however, the fibres may not always be perfectly aligned to the direction in which the external load is applied, as explained previously. Due to this misalignment, the entire load applied during the test may not be successfully transferred to the fibre. The effective load applied on the fibre would depend on the conic angle of misalignment . Figure 3 shows the influence of misalignment on the effective force transferred to the fibre. Only a component of the applied force is successfully subjected onto the fibre, which would vary depending on the misalignment angle. For a given angle of misalignment , the effective force transferred to the fibre is and the corresponding fibre strength would be obtained by Equation (2). If an assumption of perfect circularity can be made for the fibre cross-section, A value can be derived from the measurement of the diameter D (Very often, only the “apparent” diameter is accessible to measurement and non-convex cross-sections lead to more challenges to determine A.), which results in Equation (3).
The misalignment angle can further be resolved in terms of the misaligned distance h and using the laws of trigonometry and is given by Equations (4) and (5). is the recorded length of the fibre specimen and depends on the instantaneous separation of the cross-heads. The misalignment can be in any direction, depending upon the conical angle , as shown in Figure 3. From Equations (3) and (5), the expression for fibre strength in terms of the measured quantities is obtained and is given by Equation (6).
can be replaced by if instantaneous values F and are used, since the alignment of the fibre would change with time as the jaws are separated from each other. It is dependent on the initial gauge length of the fibre , on fibre elongation due to application of tensile stress , and on the stiffness of the testing system k (or compliance ) and is given by Equation (7). This is also shown in Figure 3. From Equations (6) and (7), the expression for fibre strength is obtained, and is given by Equation (8).
The stiffness k of the experimental setup is determined by taking the inverse of the system compliance, which is measured as per the guidelines mentioned in the standard [25]. The stiffness for the experimental setup used, including the fibre fixing system, is calculated to be around N/m. Such a high stiffness has a negligible influence on the recorded failure length of the fibre, especially for tests done using fibres up to 30 mm initial gauge length, as in the present case. For such gauge lengths and the T700 fibres considered as example, the different contributions to are as follows: for almost 98%, for about 2% and less than 0.01%. These contributions clearly depend on the gauge length and if 5 mm gauge lengths were now considered, the system compliance contribution to would only be around 0.5% as a first approximation. It is clear that the term can be ignored from the fibre strength expression for the present case since it is compared with . This is also justified because its contribution to the output is about an order of magnitude smaller than the next significant quantity. These considerations would be completely different if a measure of the failure strain was desired. Indeed, in that case, failure strain and the system compliance contributes greatly (about 25% contribution to the total extension in the case of a gauge length of 5 mm) to the extension measurement.
The final expression for fibres strength after ignoring the system compliance contribution is given by Equation (9).
It can be seen from Equation (9) that fibre strength is calculated using a number of measured input quantities. These quantities, already introduced, are force measurement from the load cell , estimated misalignment distance h, initial gauge length of the fibre , extension in fibre measured from the displacement sensor , and the measured value of the diameter D coming from an appropriate technique. Each input quantity has some level of measurement uncertainty, as no measuring instrument is perfectly accurate. As a result, the calculated tensile strength of the fibre will also have an uncertainty associated with it. Since fibre strength is typically represented using Weibull parameters generated using a set of such fibre strength data points determined in a similar way, the overall uncertainty in the statistical parameters of the Weibull distribution can be very significant. This is also the subject of the ongoing study.
2.3. Measurement Uncertainty
The word “uncertainty” stands for doubt, and thus in a generic sense “measurement uncertainty” means doubt about the validity of a result of a measurement [19]. It reflects the lack of knowledge on the value of the measured quantity. This uncertainty in measurement of any quantity would also influence other parameters that are calculated using these measured quantities. The measurement uncertainty for any given parameter can be calculated statistically if the variations are known for all quantities on which this parameter depends. This is evaluated by using a mathematical model for the parameter of interest (Y), which is a function of all input quantities on which it depends , as also represented by Equation (10).
Each measured input quantity by itself has some uncertainty associated with it. The uncertainty is determined from a distribution of the possible values for a given quantity. This is usually estimated from a series of observations for this quantity, i.e., a frequency based estimation. This method of evaluation of uncertainty based on frequency distributions is termed as Type A evaluation in statistics. The other method of evaluating uncertainty is from a priori distribution, which is based on some prior knowledge about the quantity. Evaluation of uncertainty based on priori distributions are termed as Type B evaluation. It is recommended to use quantitative data wherever possible for the evaluation of uncertainty, i.e., following the Type A evaluation method. However, either type of uncertainty is treated in the same way while evaluating the combined effect on the output.
2.4. Experimentation
Single fibre tensile tests were conducted following the procedure described in ASTM C1557-14 [25] to determine the strength of T700 carbon fibres. The equations proposed in this paper remain of course valid for other types of fibres, as long as the few assumptions which have been made are applicable. The universal tensile tester was used for conducting the experiments. It was developed by Bunsell [26] and has been improved over the years with the introduction of more advanced transducers and sensors and a change from the vertical position to the horizontal position of the system. Those changes have for example made it possible to study the effect of temperature on fibre strength and this improved setup has been used very extensively to study many kinds of technical, natural and textile fibres [27,28,29,30,31]. Single fibres were extracted from the fibre bundles and mounted on paper frames containing cut-out slots of 30 mm in the middle which fixed the gauge length (as close as possible to 30 mm) .
The diameter of each individual fibre specimen was measured at different locations along the fibre length before the fibre was subjected to the tensile test. A Mitutoyo laser scanning micrometre (LSM500) system was used for the measurements. This system allows rapid, non-contact, and accurate fibre dimensional measurements. The fibre is fixed between two grips and a perpendicular laser beam scans across the fibre. The time of obstruction of the light is recorded and the diameter is calculated. A total of 30 fibres were measured following the same procedure and tested as per the given standard. A constant displacement rate of 1 mm/min was applied to stretch the fibres until failure. The failure load was recorded using a 150 g Sensotec Model 31 load-cell and the fibre extension was measured using an LVDT displacement transducer ACT1000A from RDP Electronics Ltd.
Since the stress–strain behaviour of carbon fibres is (almost) linear, the failure load was taken to be the load at which the fibre fracture occurs. Table 1 shows the measured values of all input quantities for one fibre tensile test example. Using these quantities and Equation (9), the best estimate value (the value determined experimentally or calculated analytically, i.e., without considering any uncertainties) of fibre strength for the given example was calculated as follows:
2.5. Evaluation of Measurement Uncertainty in Input Quantities
All quantities necessary for calculating fibre strength were determined through experimental measurements following the method described in the previous section. Each measurement had some amount of uncertainty associated with it. Measured quantities thus are sometimes reported as given by Equation (12) where x is the quantity being measured, is the best estimate or the measured value and is the corresponding measurement uncertainty.
For each tensile test, the best estimate and the corresponding uncertainty for each input quantity was determined. For fibre diameter, the best estimate was determined by taking the average of all the multiple measurements taken at different locations along the fibre length. For the other quantities, i.e., applied force , misalignment distance h, initial gauge length and elongation in fibre , the best estimate was determined from the only measurement for the fibre tensile test.
Measurement uncertainty in fibre diameter was determined using the Type A method. The standard deviation was calculated from the different diameter values measured along the length of a fibre, for each specimen. When multiple trials are performed to obtain the best estimate of a quantity, the standard deviation of the mean is an appropriate choice for representing the uncertainty in the measurement [19]. For example, from the multiple measurements of the fibre diameter, the best estimate was determined by taking the average of all measurements, , and the uncertainty, , was provided by the corrected standard deviation divided by the square root of the number of measures as given by Equations (13)–(15).
For the given example, was evaluated at mm from four recorded values mm and uncertainty in diameter measurement was calculated to be mm.
On the other hand, since, for the other quantities, i.e., , h, and , the best estimate was taken from the only measurement coming from the instruments, their corresponding uncertainty was estimated using the Type B method. For this, the limiting precision or the estimation error or the tolerances of the measurement tool was used. The uncertainty for these quantities was estimated on the assumption of the rectangular probability distribution of the measurement tolerances or estimation errors, and can be given by Equation (16).
where can be replaced with , , and , which are the measurement uncertainties for force, misalignment distance, initial gauge length, fibre extension, respectively, while can be replaced with , , and , which are the measurement tolerances or estimation errors for the corresponding quantities.
The measurement uncertainty for all the quantities for the given fibre tensile test example is given in Table 2. For many commercial and industrial applications, it is suggested to also calculate an expanded uncertainty , which is a measure of the required quality for the given quantity of interest x. The expanded uncertainty is determined for a required level of confidence using Equation (17).
where is a coverage factor for a 95% level of confidence. For critical applications, the recommended level of confidence is 95% [19]. The value of is 1.96 if the calculation is based on a very large number of measured quantities, i.e., . It should be noted that, if the number n of measurements is small, the coverage factor should be taken from the T-distribution table for degrees of freedom. This leads for example to a coverage factor of about 3.18 for , which is the case for diameters measurements (). Table 2 includes these expanded uncertainty values for the given input quantities.
For certain other applications, an even higher level of confidence may be required; a confidence level of 99% is also commonly used. The coverage factor depends on the confidence level used and can be determined from the T-distribution table, as explained above. For a 99% confidence level, the coverage factor is 2.58 for and 5.84 for . The expanded uncertainty values of all input quantities for the given fibre tensile test example, for a confidence level of 99%, are also given in Table 2.
Measurement uncertainties in these input quantities would also be propagated into the calculated fibre strength. The uncertainty propagated into fibre strength can be evaluated by combining the measurement uncertainties for each input quantity. The evaluation of this combined standard uncertainty is described in Section 2.6.
2.6. Propagation of Uncertainty to Fibre Tensile Strength
The standard uncertainty for a given parameter that is obtained from the determined uncertainties of a number of other quantities is known as combined standard uncertainty. It is estimated by appropriately combining the uncertainties of the input quantities using the law of propagation of uncertainty, as described in [19]. It is an estimated standard deviation of the parameter and characterises the dispersion in its values. It is obtained by taking the positive square root of the combined variance of the fibre strength. The combined standard uncertainty for fibre strength as obtained from the combined variance is given by Equation (18).
Each is a partial derivative or sensitivity coefficient of fibre strength for each of the input quantities on which it depends. It describes how the output estimate, i.e., fibre strength, varies with changes in each input quantity. Each is a standard uncertainty for an input quantity , as described in Section 2.5. Variation in fibre strength arising due to uncertainty in an input quantity is given by . The combined variance on fibre strength can be given by the sum of all variances generated due to uncertainties in each individual quantity , as given by Equation (18). This expression is valid when there is no correlation between the quantities on which the parameter depends, as in the present case. The expression for the combined standard uncertainty of fibre strength given by Equation (18) can be expanded in terms of individual quantities and is given by Equation (19).
where, is combined standard uncertainty for fibre strength, is sensitivity coefficient of fibre strength for applied force, is sensitivity coefficient of fibre strength for misaligned distance, is sensitivity coefficient of fibre strength for initial gauge length, is sensitivity coefficient of fibre strength for fibre extension, is sensitivity coefficient of fibre strength for measured fibre diameter, is measurement uncertainty in applied force, is measurement uncertainty in misaligned distance, is measurement uncertainty in gauge length, is measurement uncertainty in fibre extension and is measurement uncertainty in fibre diameter.
The different sensitivity coefficients are determined as partial derivatives of fibre strength with respect to each input quantity and are given by Equations (20)–(24).
For the given fibre tensile test example, the sensitivity coefficient for each quantity is determined using Equations (20)–(24) and input data from Table 1, and the results are given in Table 3. The combined standard uncertainty for the calculated fibre strength can then be evaluated from Equation (19), using measurement uncertainty from individual quantities from Table 2 and sensitivity coefficient values from Table 3.
The standard uncertainty for fibre strength for the given example was calculated to be:
Fibre strength for the given tensile test example can now be represented as a combination of the best estimate and the calculated uncertainty , shown as follows:
Following the determination of combined standard uncertainty using Equation (19), the expanded uncertainty was also calculated. It was determined by using Equation (17), as explained above. The values of the coverage factors and as determined from the T-distribution table for 95% and 99% level of confidence are 1.96 and 2.58, respectively. Using and , the expanded uncertainties were calculated from Equation (17) as and . It is necessary to mention the values of coverage factor and level of confidence were used when results are reported in the form of expanded uncertainties. The fibre strength can then be reported as the best estimate along with its expanded uncertainties and as follows:
For all 30 fibre tensile tests conducted, the best estimate for fibre strength and the corresponding measurement uncertainty is shown in Table 4, in increasing order of strength values. The scatter in failure stress (fibre strength) vs. failure strain is shown in Figure 4. The strength of fibres vary significantly with each other and hence the strength of fibres cannot be represented using a single average value because not all fibres possess a similar strength. Fibre strength behaviour is therefore typically represented by using an appropriate statistical distribution function such as the one proposed by Weibull [9]. This distribution considers the inherent variation in strength of fibres due to the stochastic nature of defects present inside them. To determine the parameters of this statistical distribution function, a set of fibre strength data such as the one generated for the present study, was used. Therefore, a sufficient number of fibre tensile tests had to be conducted to generate a representative fibre strength dataset.
3. Sensitivity Analysis
As mentioned above, uncertainty analysis focuses on quantifying the uncertainty in a model output, i.e., fibre tensile strength in the present study. An uncertainty analysis is ideally followed by what is known as a sensitivity analysis. While uncertainty analysis assesses the uncertainty in a model output that derives from uncertainty in inputs, a sensitivity analysis assesses the individual contributions of the inputs to the total uncertainty in outcomes of the analysis. An input can be classified as anything which causes a variation in the output of the model. Sensitivity analysis highlights the relative importance of inputs in determining the outputs. A sensitivity analysis was conducted for single fibre tensile strength tests to determine the relative influence of the different input quantities on fibre strength and is described in Section 3.1.
3.1. Sensitivity Analysis for Fibre Tensile Strength
For the fibre strength model given by Equation (9), the input consists of the different quantities which determine the strength. Of the different known methods for sensitivity analysis, the method of derivatives is the most widely used [32]. According to this method, sensitivity of a given output Y for an input X, is a function of the derivative . To normalise the sensitivity for all quantities, this sensitivity is multiplied and divided by the standard deviations of the output and input, respectively, as given by Equation (25).
where is the sensitivity of the output for an input quantity X and normalised by the standard deviations; is the standard deviation of the input; is the standard deviation of the output; and is the partial derivative of the output for the given input quantity. It is also recommended to report the square of the sensitivity measure since the sum of squares of the sensitivity neatly normalises to 1 for r different quantities, as given by Equation (26) [32].
For the given fibre tensile test example discussed in Section 2, the sensitivity values for all five input quantities were calculated using Equation (25). The modulus of the calculated sensitivity values for each input quantity along with its relative rank of influence is given in Table 5.
Sensitivity measures of input quantities were also calculated for all the 30 tensile tests shown in Table 4. From the obtained results, the modulus of the average sensitivity value for each quantity was calculated and is given in Table 6.
From the sensitivity analysis, it can be seen that the measured fibre diameter D is the most sensitive or critical parameter for the determination of fibre strength from the single fibre tensile testing process. This is followed by the measured force of fibre failure . The other parameters are relatively much less significant and do not contribute much to the accuracy of the calculated fibre strength. It is however very important to note that these sensitivity indices have been calculated for single fibre tensile strength tests conducted at a gauge length of 30 mm. However, since different researchers have chosen different gauge lengths varying from 1 to 50 mm for determining fibre tensile strength, it would be useful to estimate the relative sensitivities of the input quantities for tensile tests conducted at other gauge lengths as well. For a different gauge length, the relative sensitivity of all the input quantities may change. Sensitivity measures of input quantities for fibre tensile tests at other gauge lengths are discussed in Section 3.2.
3.2. Estimation of Sensitivity for Tensile Strength at Other Gauge Lengths
As mentioned previously, fibre properties determined at smaller gauge lengths may be more appropriate to be used as input for composite strength and damage models. However, tests done at smaller gauge lengths are susceptible to experimental errors and uncertainties. To minimise these uncertainties, the effects of critical quantities that contribute to these uncertainties have to be minimised. These may be different for tests at different gauge lengths. The most critical quantities leading to uncertainties for tests conducted at different gauge lengths have been determined in this subsection.
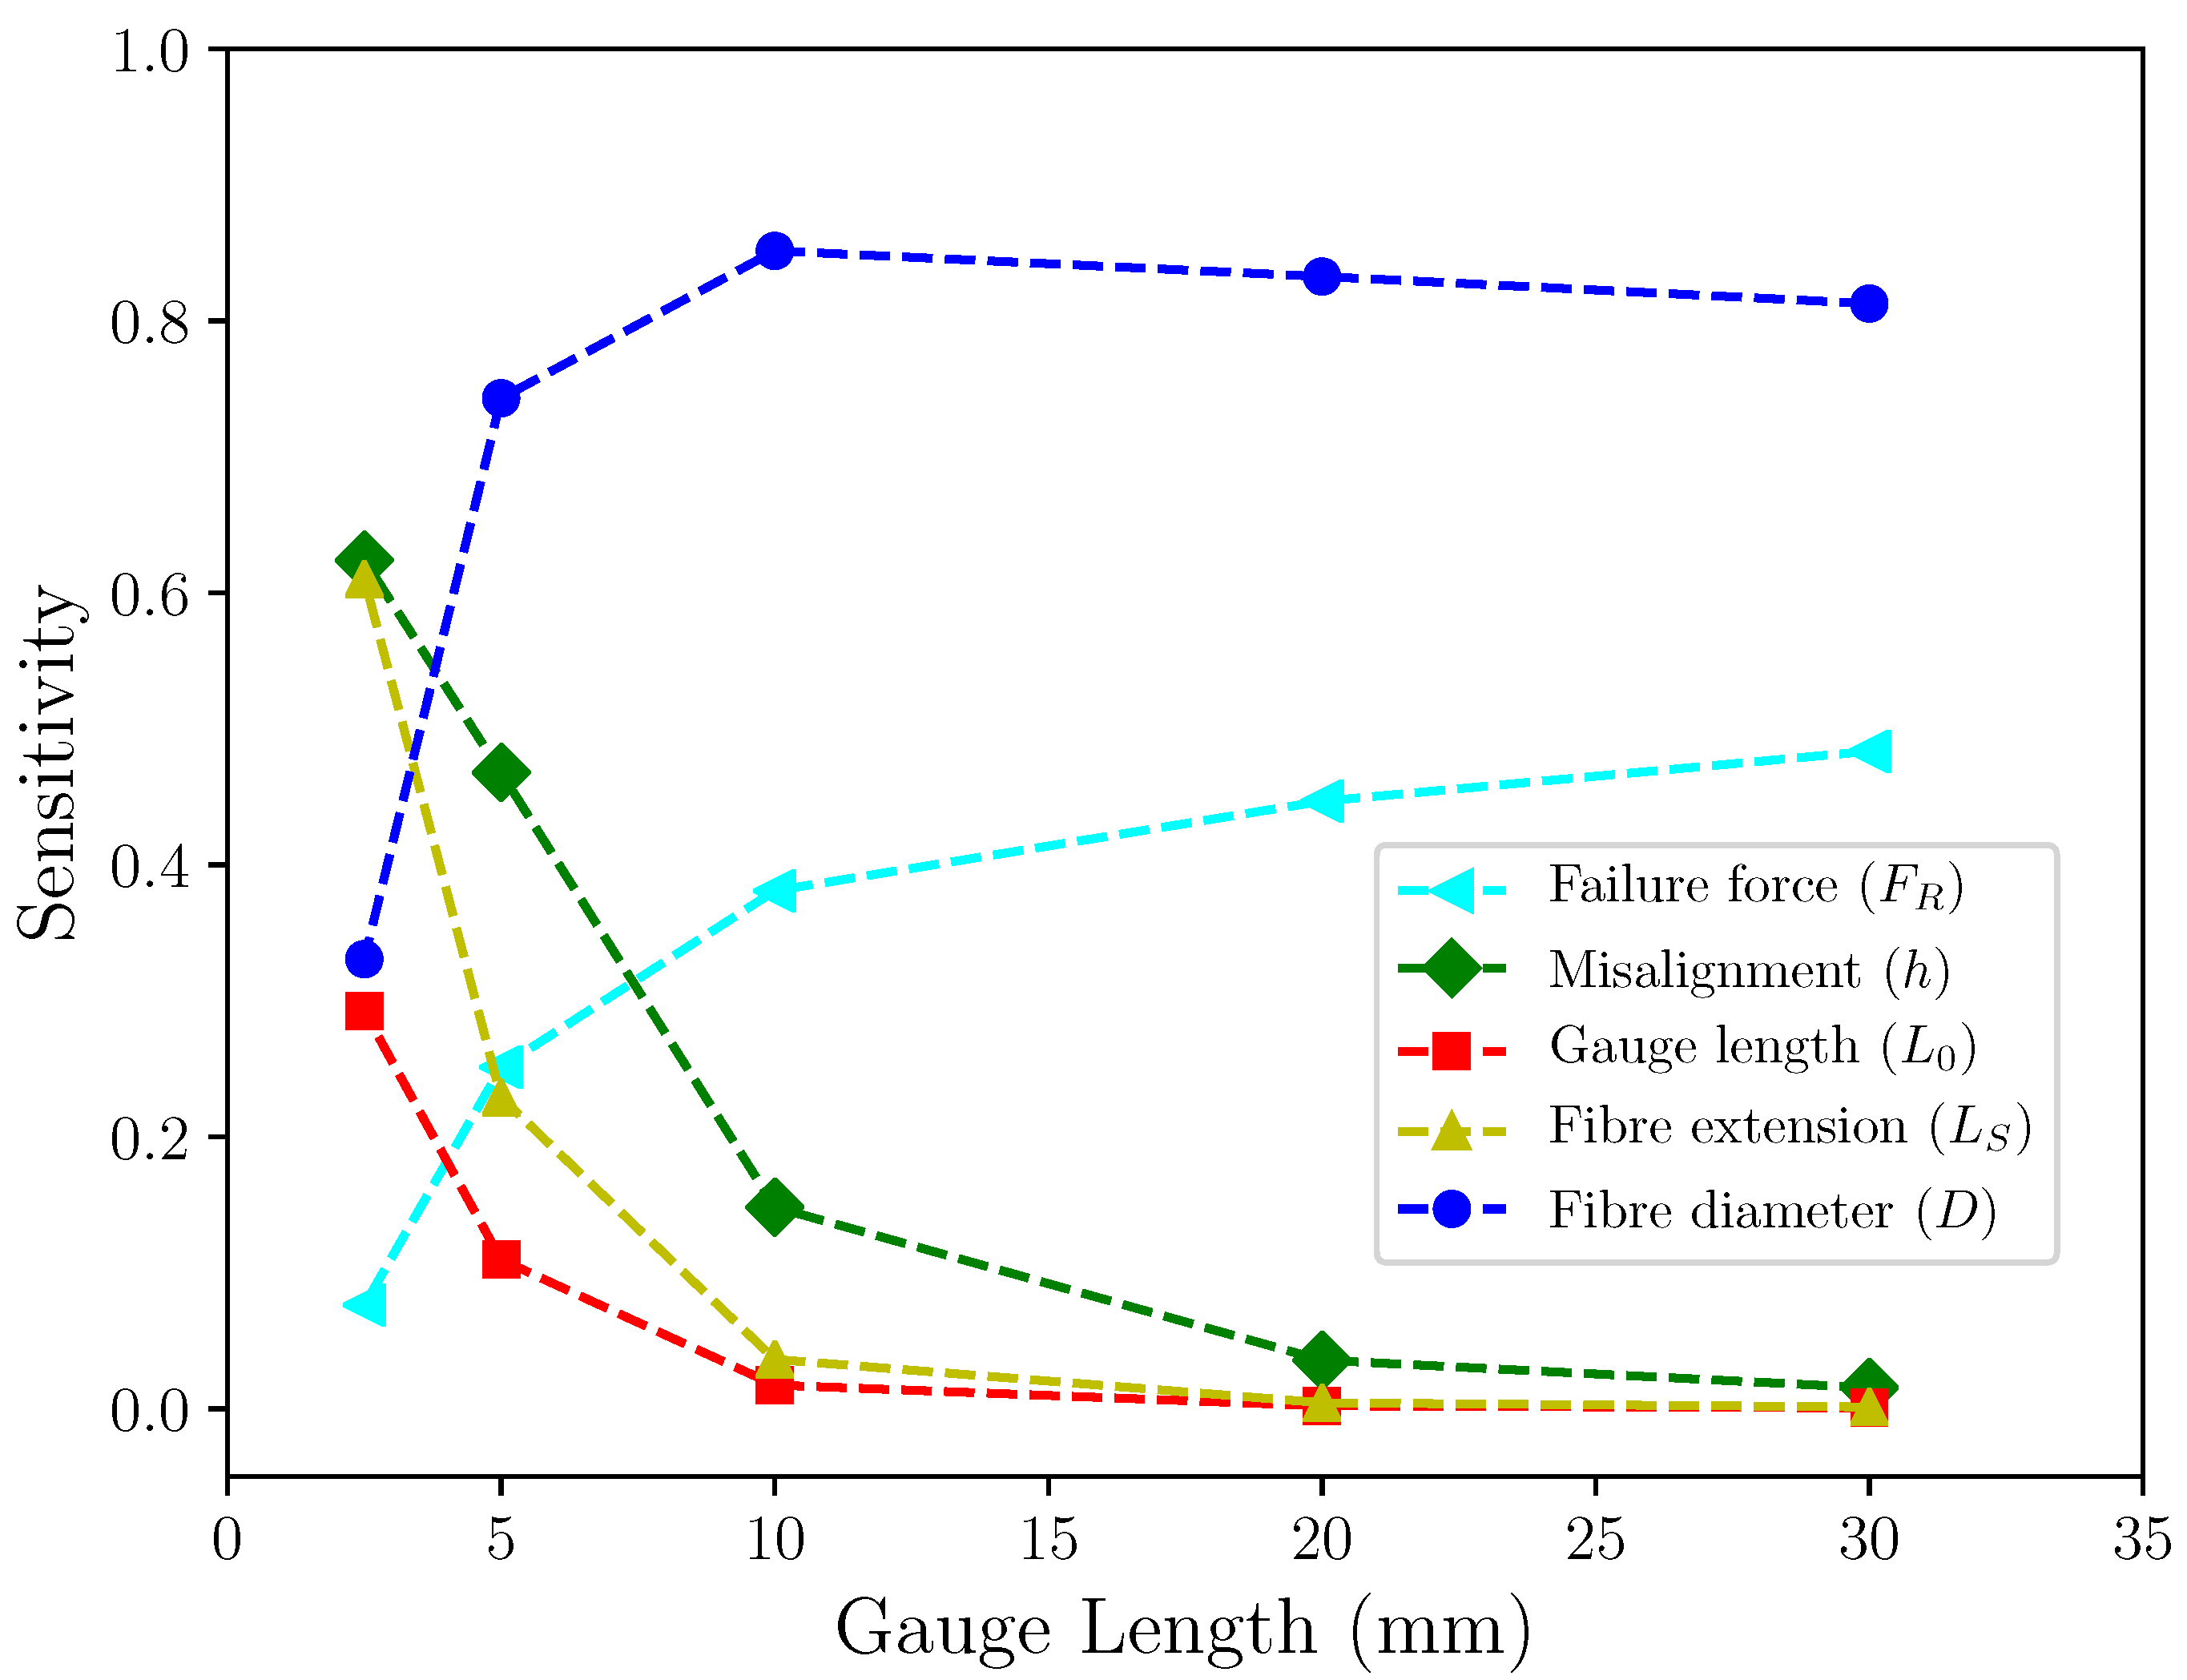
For the determination of sensitivity indices for all input quantities at different gauge lengths, the experimentally generated fibre strength data in Table 4 were used. Since the tensile strengths of brittle fibres are known to follow the Weibull weakest link theory, the fibre failure forces for all 30 tensile tests were extrapolated to different shorter gauge lengths using the Weibull scaling function [8]. This extrapolation was made under the assumption that the fibre cross-sectional area remains constant during the test, which permits the extrapolation of failure loads to fibres of shorter gauge lengths. The other assumption was that the failure strain of the fibres remain the same for all gauge lengths. Both assumptions are realistic and already well established in the literature. Using the extrapolated data, fibre strength and the corresponding uncertainty were calculated for all the fibres using Equation (9) and the method described in Section 2.3, respectively. This was followed by the calculation of sensitivity measures for all quantities as already described. The sensitivity indices for all input quantities and for different gauge lengths are given in Table 7 and depicted graphically in Figure 5. It can be seen that, as the gauge length was decreased from 30 to 20 mm, the sensitivity measures for all quantities remained fairly consistent. However, fibre misalignment h, which was relatively insignificant for tests at 30 mm gauge length, increased in significance and could no longer be ignored. For a shorter gauge length of 10 mm, fibre misalignment became even more significant. The other quantities, i.e., measured fibre extension and measured fibre gauge length , were observed to slightly increase in significance. On further reducing the gauge length to 5 mm, the sensitivity of fibre misalignment increases further and it became one of the most critical parameters. The significance of fibre extension and fibre gauge length was also observed to increase. Since the sensitivity measure is a relative quantity, this increase comes at a cost of a decrease in sensitivity for the other major quantities, i.e., fibre diameter and failure force, which were both observed to decrease in relative significance. If the gauge length were reduced to 2.5 mm, the significance of the input quantities, fibre misalignment, fibre extension and fibre gauge length, further continued to increase substantially, due to which the significance of the other quantities, i.e., failure force and fibre diameter, continued to decrease drastically.
Taking into consideration the results from the sensitivity analysis, it would not be recommended to conduct any experimental studies with the single fibre testing methodology using fibres of very short gauge lengths. This is to avoid unwanted errors in measured fibre tensile strength due to fibre misalignment, improper measurement of fibre gauge length and fibre extension since it becomes very difficult to accurately control these quantities when fibres of a very small gauge length are used. The sensitivity of fibre tensile strength to these quantities is very high and even small measurement errors in these input quantities may lead to large inaccuracies in estimated strength.
4. Conclusions
In this study, different possible sources of errors due to experimental limitations in the fibre testing process were identified. Their effect on fibre tensile strength was analytically modelled. This model was used to statistically evaluate the uncertainties in experimentally determined fibre strength. When such a set of fibre tensile strength data is represented with the help of a statistical function, these uncertainties in individual fibre strength values are also propagated into the resulting function, and thus add uncertainty to the parameters of the statistical distribution function. Since fibre strength data are used as an input in composite strength models for predicting the material and structural behaviour, the predictions they make would also be unreliable. The knowledge of uncertainty in fibre strength would thus help in estimating the reliability of the predictions made by the composite strength models. A sensitivity analysis was conducted using a differential method, to rank the relative significance of input quantities on the calculated fibre strength. It was shown that, for fibres of a sufficiently large gauge length, the measured fibre diameter is the most sensitive or critical parameter for the estimation of fibre tensile strength. This is followed by the measured force of fibre failure. The other parameters were found to be relatively much less critical. However, composite strength and damage models require fibre properties for small gauge lengths. The sensitivity analysis showed that, for tests done at shorter gauge lengths, the other quantities, especially the fibre misalignment become very significant. This makes the fibre strength measurement susceptible to unwanted errors, as it becomes very difficult to accurately control these quantities when fibres of very small gauge length are used for tensile testing, and hence very small gauge lengths should be avoided. The influence of critical parameters on experimental fibre strength would also help in designing improved single fibre testing systems capable of determining fibre strength more accurately.
Author Contributions
Data curation, F.I.; Formal analysis, F.I.; Funding acquisition, S.J.; Investigation, F.I.; Methodology, F.I. and S.J.; Project administration, S.J. and L.L.; Resources, S.J.; Supervision, S.J. and L.L.; Validation, L.L.; Visualisation, F.I. and S.J.; Writing—original draft, F.I.; and Writing—review and editing, F.I., S.J. and L.L.
Funding
The research leading to these results was done within the framework of the FiBreMoD project and received funding from the European Union’s Horizon 2020 research and innovation programme under the Marie Sklodowska-Curie grant agreement No 722626.
Conflicts of Interest
The authors declare no conflict of interest.
References
- Galkin, S.; Kunze, E.; Kärger, L.; Böhm, R.; Gude, M. Experimental and Numerical Determination of the Local Fiber Volume Content of Unidirectional Non-Crimp Fabrics with Forming Effects. J. Compos. Sci. 2019, 3, 19. [Google Scholar] [CrossRef]
- Thionnet, A.; Chou, H.Y.; Bunsell, A. Fibre Break Failure Processes in Unidirectional Composites. Part 2: Failure and Critical Damage State Induced by Sustained Tensile Loading. Appl. Compos. Mater. 2015, 22, 141–155. [Google Scholar] [CrossRef]
- Blassiau, S.; Thionnet, A.; Bunsell, A. Micromechanisms of load transfer in a unidirectional carbon fibre–reinforced epoxy composite due to fibre failures. Part 1: Micromechanisms and 3D analysis of load transfer: The elastic case. Compos. Struct. 2006, 74, 303–318. [Google Scholar] [CrossRef]
- Bunsell, A.; Thionnet, A. Life prediction for carbon fibre filament wound composite structures. Philos. Mag. 2010, 90, 4129–4146. [Google Scholar] [CrossRef] [Green Version]
- Sitnikova, E.; Li, D.; Wei, J.; Yi, X.; Li, S. On the Representativeness of the Cohesive Zone Model in the Simulation of the Delamination Problem. J. Compos. Sci. 2019, 3, 22. [Google Scholar] [CrossRef]
- Watanabe, J.; Tanaka, F.; Okuda, H.; Okabe, T. Tensile strength distribution of carbon fibers at short gauge lengths. Adv. Compos. Mater. 2014, 23, 535–550. [Google Scholar] [CrossRef]
- Ilankeeran, P.; Mohite, P.; Kamle, S. Axial Tensile Testing of Single Fibres. Mod. Mech. Eng. 2012, 2, 151–156. [Google Scholar] [CrossRef] [Green Version]
- Swolfs, Y.; Verpoest, I.; Gorbatikh, L. A review of input data and modelling assumptions in longitudinal strength models for unidirectional fibre-reinforced composites. Compos. Struct. 2016, 150, 153–172. [Google Scholar] [CrossRef]
- Weibull, W. A Statistical Distribution Function of Wide Applicability. J. Appl. Mech. 1951, 18, 293–297. [Google Scholar]
- Islam, F.; Joannès, S.; Bucknell, S.; Leray, Y.; Bunsell, A.; Laiarinandrasana, L. Towards accurate and efficient single fibre characterization to better assess failure strength distribution. In Proceedings of the 18th European Conference on Composite Materials (ECCM-2018), Athens, Greece, 25–28 June 2018. [Google Scholar]
- Hwang, T.K.; Hong, C.S.; Kim, C.G. Size effect on the fiber strength of composite pressure vessels. Compos. Struct. 2003, 59, 489–498. [Google Scholar] [CrossRef]
- Chen, H.; Baird, D.G. Prediction of Young’s Modulus for Injection Molded Long Fiber Reinforced Thermoplastics. J. Compos. Sci. 2018, 2, 47. [Google Scholar] [CrossRef]
- Kaddour, A.; Hinton, M. Maturity of 3D failure criteria for fibre-reinforced composites: Comparison between theories and experiments: Part B of WWFE-II. J. Compos. Mater. 2013, 47, 925–966. [Google Scholar] [CrossRef]
- Bunsell, A.; Gorbatikh, L.; Morton, H.; Pimenta, S.; Sinclair, I.; Spearing, M.; Swolfs, Y.; Thionnet, A. Benchmarking of strength models for unidirectional composites under longitudinal tension. Compos. Part A Appl. Sci. Manuf. 2018, 111, 138–150. [Google Scholar] [CrossRef] [Green Version]
- Chou, H.; Thionnet, A.; Mouritz, A.; Bunsell, A.R. Stochastic factors controlling the failure of carbon/epoxy composites. J. Mater. Sci. 2016, 51, 311–333. [Google Scholar] [CrossRef]
- Shah, S.; Karuppanan, S.; Megat-Yusoff, P.; Sajid, Z. Impact resistance and damage tolerance of fiber reinforced composites: A review. Compos. Struct. 2019, 217, 100–121. [Google Scholar] [CrossRef]
- Swolfs, Y.; Verpoest, I.; Gorbatikh, L. Issues in strength models for unidirectional fibre-reinforced composites related to Weibull distributions, fibre packings and boundary effects. Compos. Sci. Technol. 2015, 114, 42–49. [Google Scholar] [CrossRef] [Green Version]
- Thionnet, A.; Chou, H.Y.; Bunsell, A. Fibre Break Failure Processes in Unidirectional Composites. Part 1: Failure and Critical Damage State Induced by Increasing Tensile Loading. Appl. Compos. Mater. 2015, 22, 119–140. [Google Scholar] [CrossRef]
- JCGM 100: Evaluation of Measurement Data—Guide to the Expression of Uncertainty in Measurement. 2008. Available online: https://www.bipm.org/en/publications/guides/gum.html (accessed on 9 July 2019).
- Yu, W.; Yao, J. Tensile strength and its variation of PAN-based carbon fibers. I. Statistical distribution and volume dependence. J. Appl. Polym. Sci. 2006, 101, 3175–3182. [Google Scholar] [CrossRef]
- Yavin, B.; Gallis, H.E.; Scherf, J.; Eitan, A.; Wagner, H.D. Continuous monitoring of the fragmentation phenomenon in single fiber composite materials. Polym. Compos. 1991, 12, 436–446. [Google Scholar] [CrossRef]
- Chi, Z.; Chou, T.W.; Shen, G. Determination of single fibre strength distribution from fibre bundle testings. J. Mater. Sci. 1984, 19, 3319–3324. [Google Scholar] [CrossRef]
- Bunsell, A.R.; Joannès, S.; Marcellan, A. Handbook of Properties of Textile and Technical Fibres; Woodhead Publishing: Cambridge, UK, 2018. [Google Scholar]
- Islam, F.; Joannès, S.; Bucknell, S.; Leray, Y.; Bunsell, A.; Laiarinandrasana, L. Improvements in determination of carbon fibre strength distribution using automation and statistical data analysis. In Proceedings of the Fiber Society’s Spring 2018 Conference, Tokyo, Japan, 12–14 June 2018. [Google Scholar]
- ASTM C1557-14: Standard Test Method for Tensile Strength and Young’s Modulus of Fibers; ASTM Standards: West Conshohocken, PA, USA, 2014.
- Bunsell, A.R.; Hearle, J.W.S. A mechanism of fatigue failure in nylon fibres. J. Mater. Sci. 1971, 6, 1303–1311. [Google Scholar] [CrossRef]
- Marcellan, A.; Bunsell, A.; Laiarinandrasana, L.; Piques, R. A multi-scale analysis of the microstructure and the tensile mechanical behaviour of polyamide 66 fibre. Polymer 2006, 47, 367–378. [Google Scholar] [CrossRef]
- Wollbrett-Blitz, J.; Joannès, S.; Bruant, R.; Le Clerc, C.; Romero De La Osa, M.; Bunsell, A.; Marcellan, A. Multiaxial mechanical behavior of aramid fibers and identification of skin/core structure from single fiber transverse compression testing. J. Polym. Sci. Part B Polym. Phys. 2016, 54, 374–384. [Google Scholar] [CrossRef]
- Jauzein, V.; Bunsell, A. Bio-composite aspects of silk: The sericin sheath acting as a matrix. J. Mater. Sci. 2012, 47, 3082–3088. [Google Scholar] [CrossRef]
- Ramirez, J.M.H.; Bunsell, A.R.; Colomban, P. Microstructural mechanisms governing the fatigue failure of polyamide 66 fibres. J. Mater. Sci. 2006, 41, 7261–7271. [Google Scholar] [CrossRef]
- Le Clerc, C.; Monasse, B.; Bunsell, A.R. Influence of temperature on fracture initiation in PET and PA66 fibres under cyclic loading. J. Mater. Sci. 2007, 42, 9276–9283. [Google Scholar] [CrossRef]
- Saltelli, A.; Ratto, M.; Andres, T.; Campolongo, F.; Cariboni, J.; Gatelli, D.; Saisana, M.; Tarantola, S. Global Sensitivity Analysis. The Primer; John Wiley and Sons, Ltd.: Hoboken, NJ, USA, 2008. [Google Scholar]
Figure 1.
(a) Schematic diagram of a single fibre mounted on a card frame; (b) major issues with sample preparation leading to inaccurate measurement of gauge length; and (c) angular misalignment in the fibre specimen.
Figure 1.
(a) Schematic diagram of a single fibre mounted on a card frame; (b) major issues with sample preparation leading to inaccurate measurement of gauge length; and (c) angular misalignment in the fibre specimen.
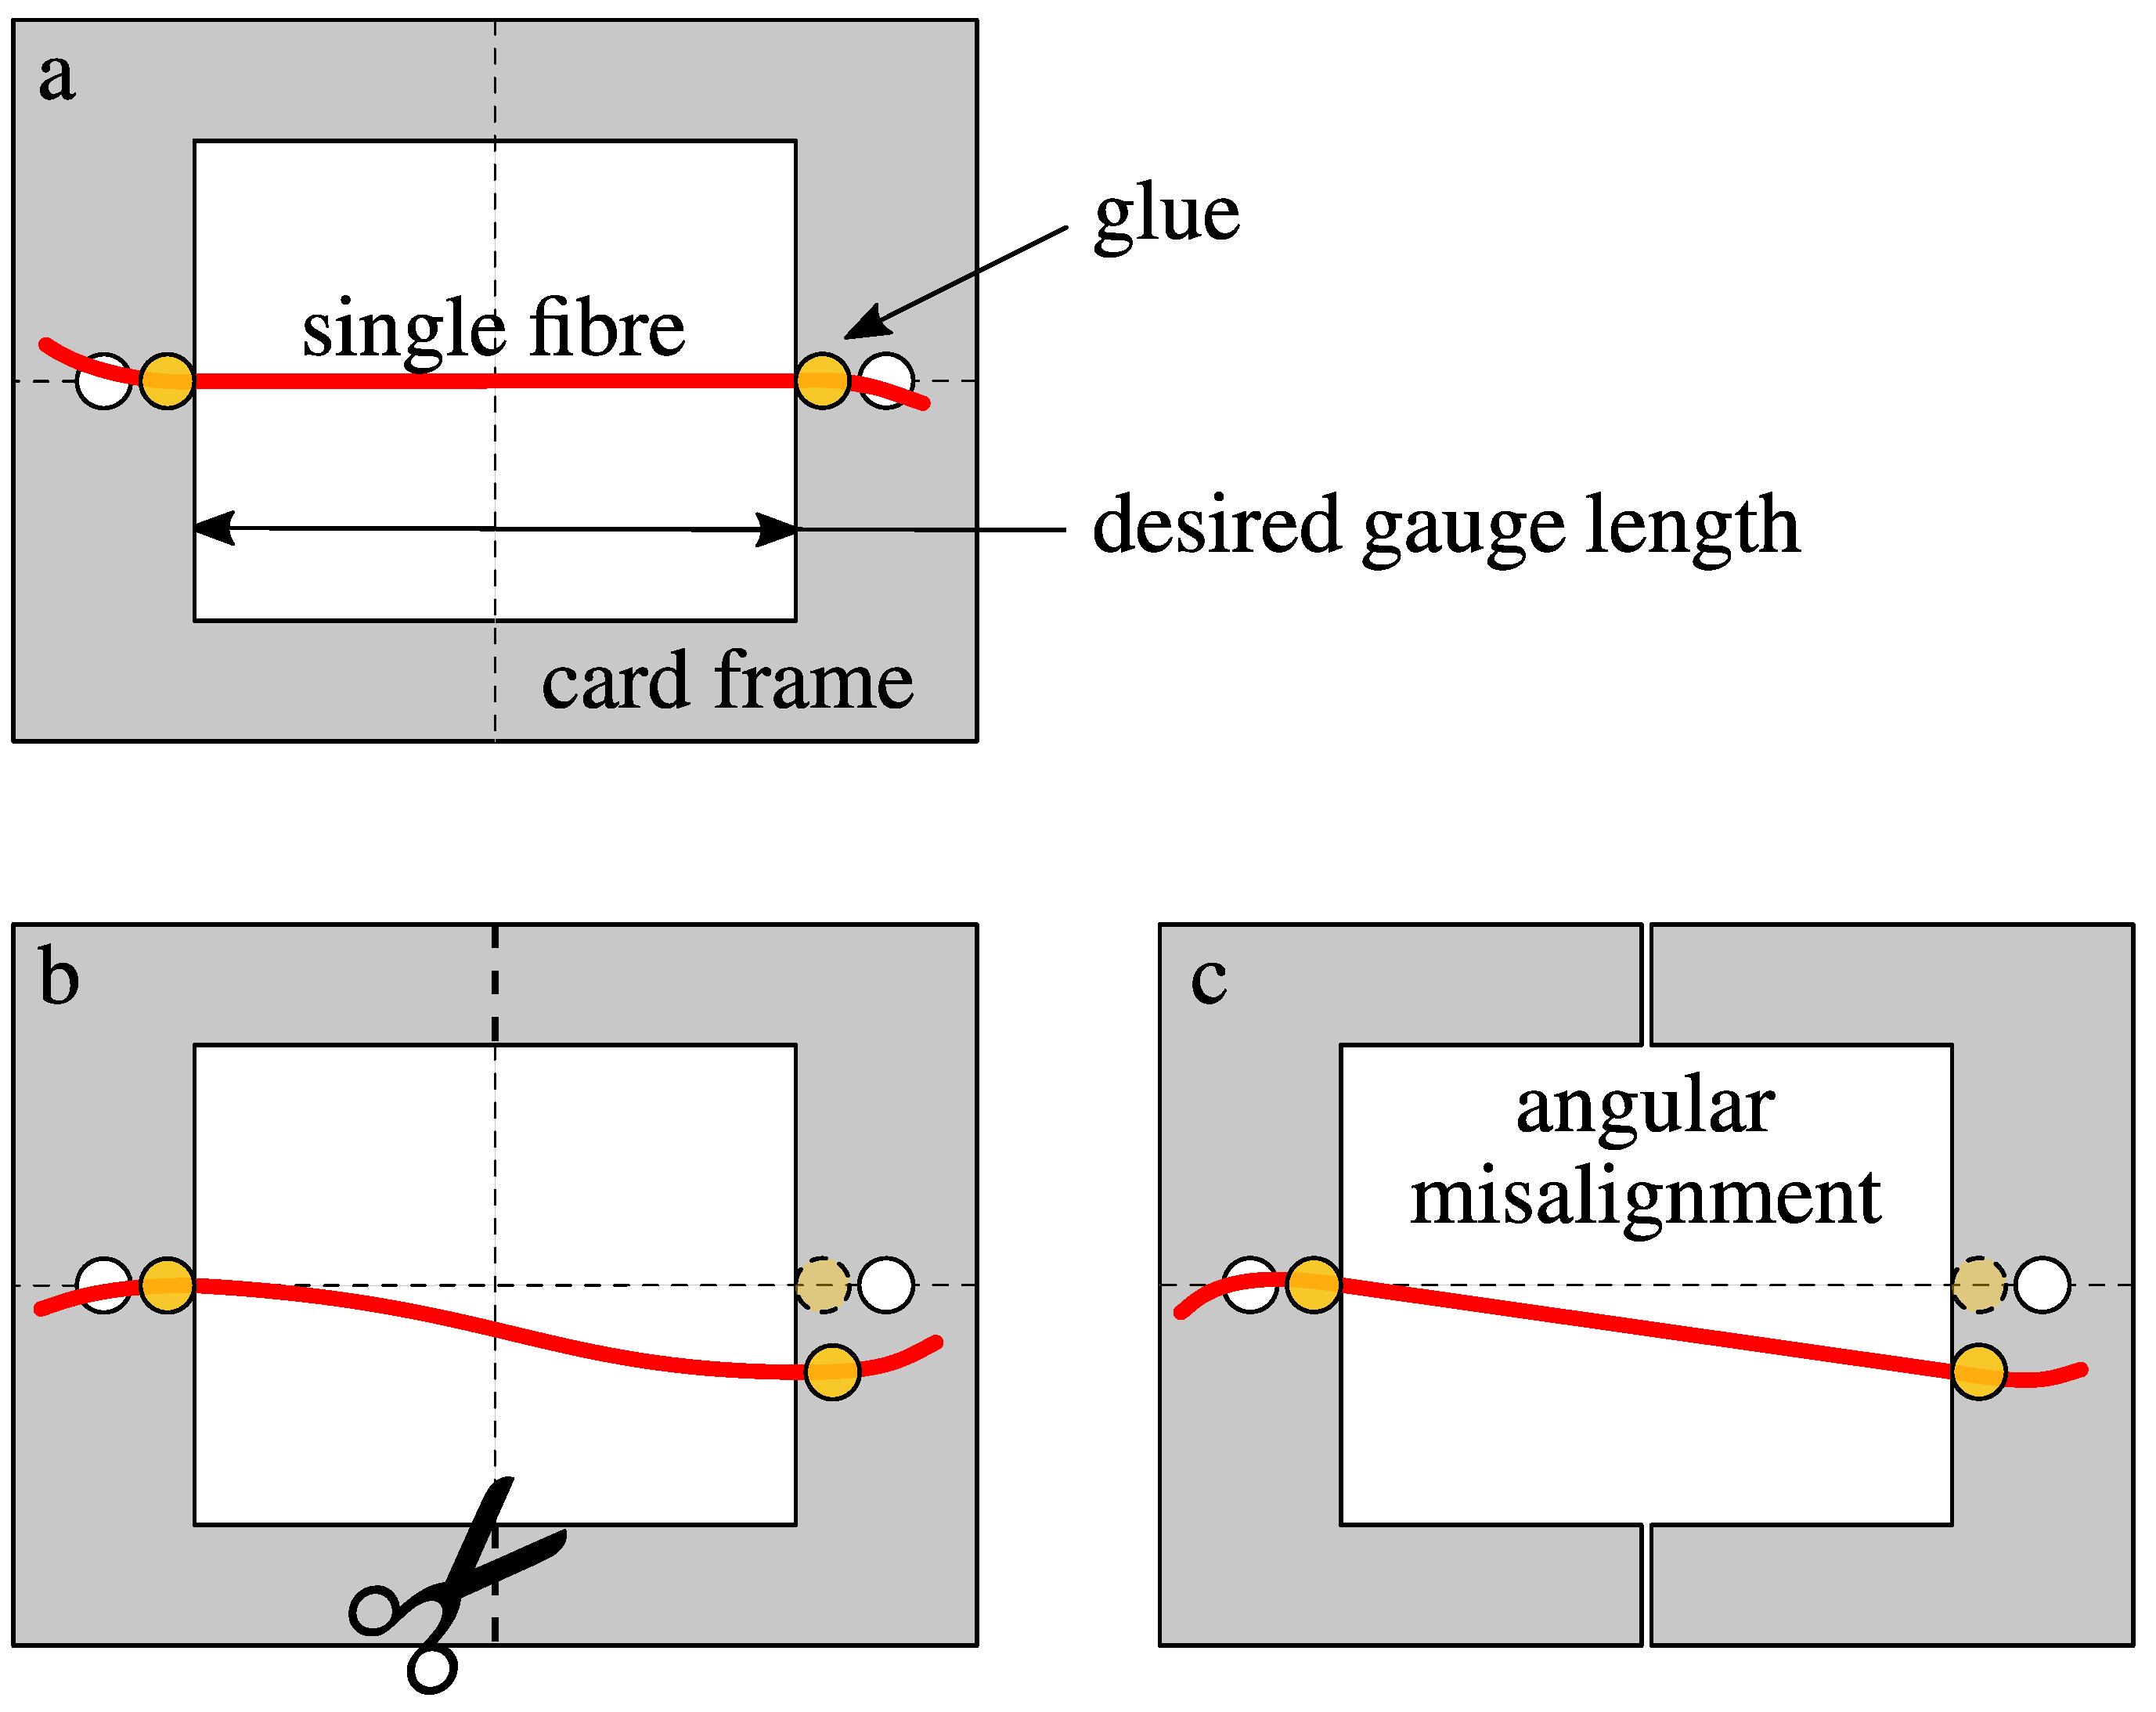
Figure 2.
The actual card frame used for preparing the fibre specimens.
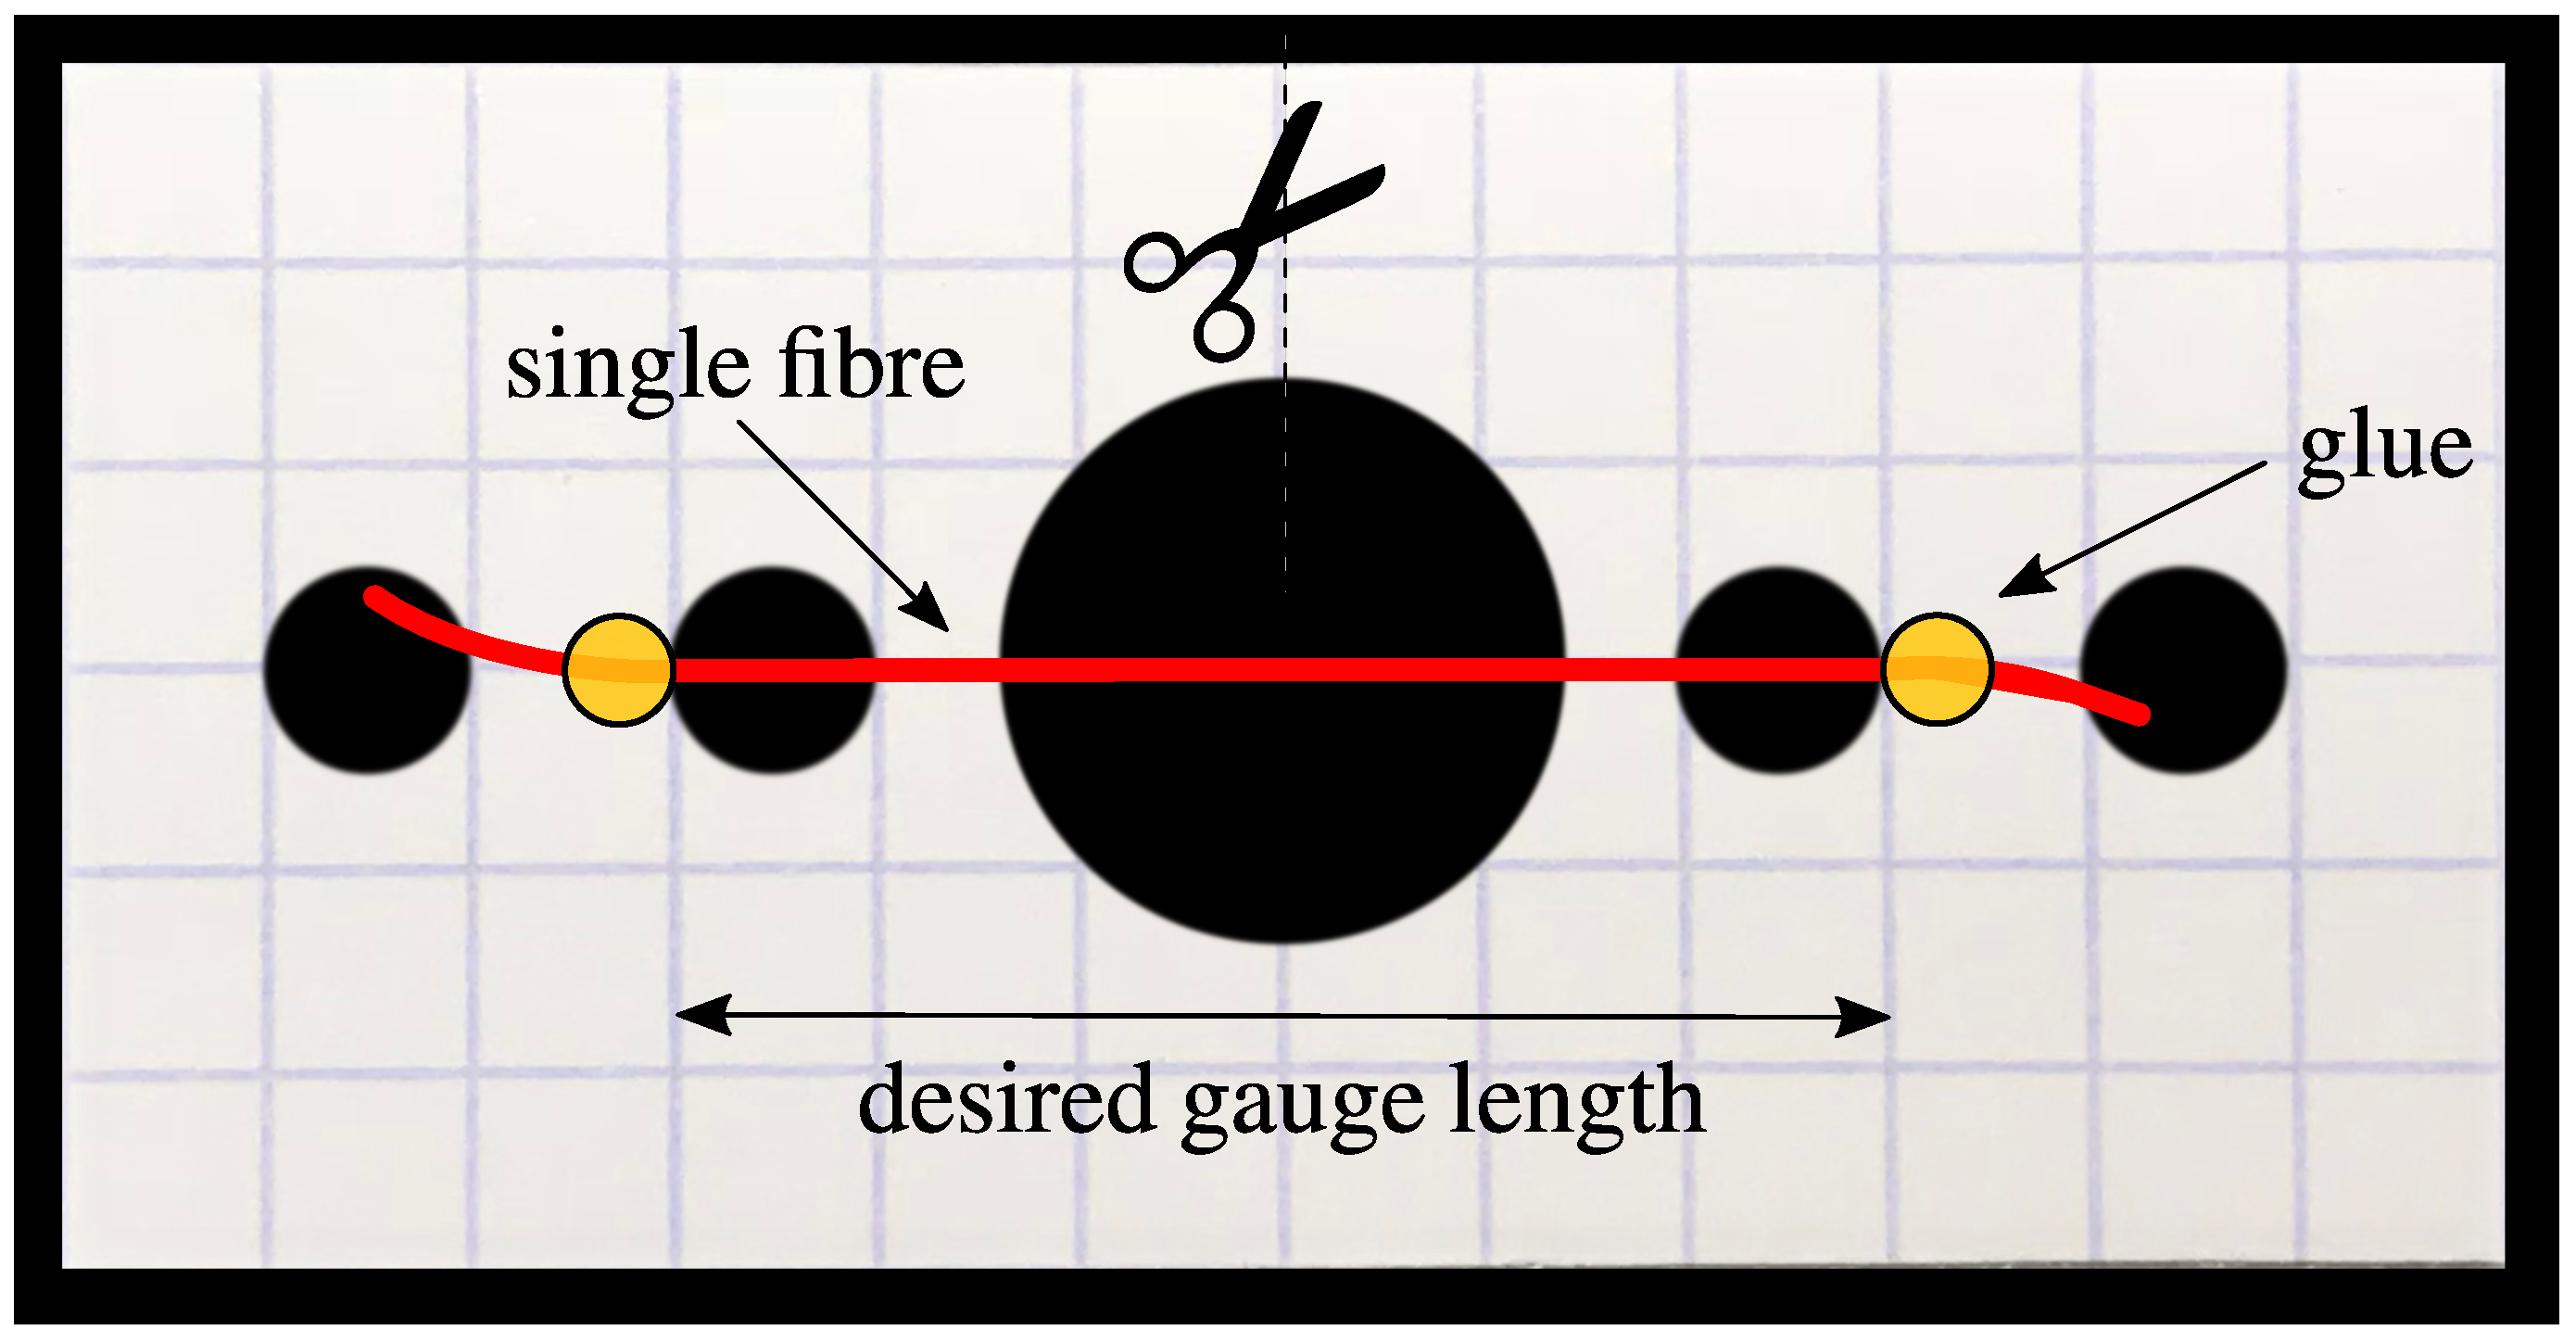
Figure 3.
Schematic diagram showing the effect of fibre misalignment on the effective load on the fibre. (Top) The effect of fibre elongation and system compliance on the instantaneous gauge length of the fibre, as measured by the displacement transducer. (Bottom) Fibre misalignment can occur in any direction in three dimensions, i.e., the fibre can be positioned anywhere inside a cone of angle .

Figure 4.
Failure stress vs. failure strain scatterplot for all fibre tensile tests.
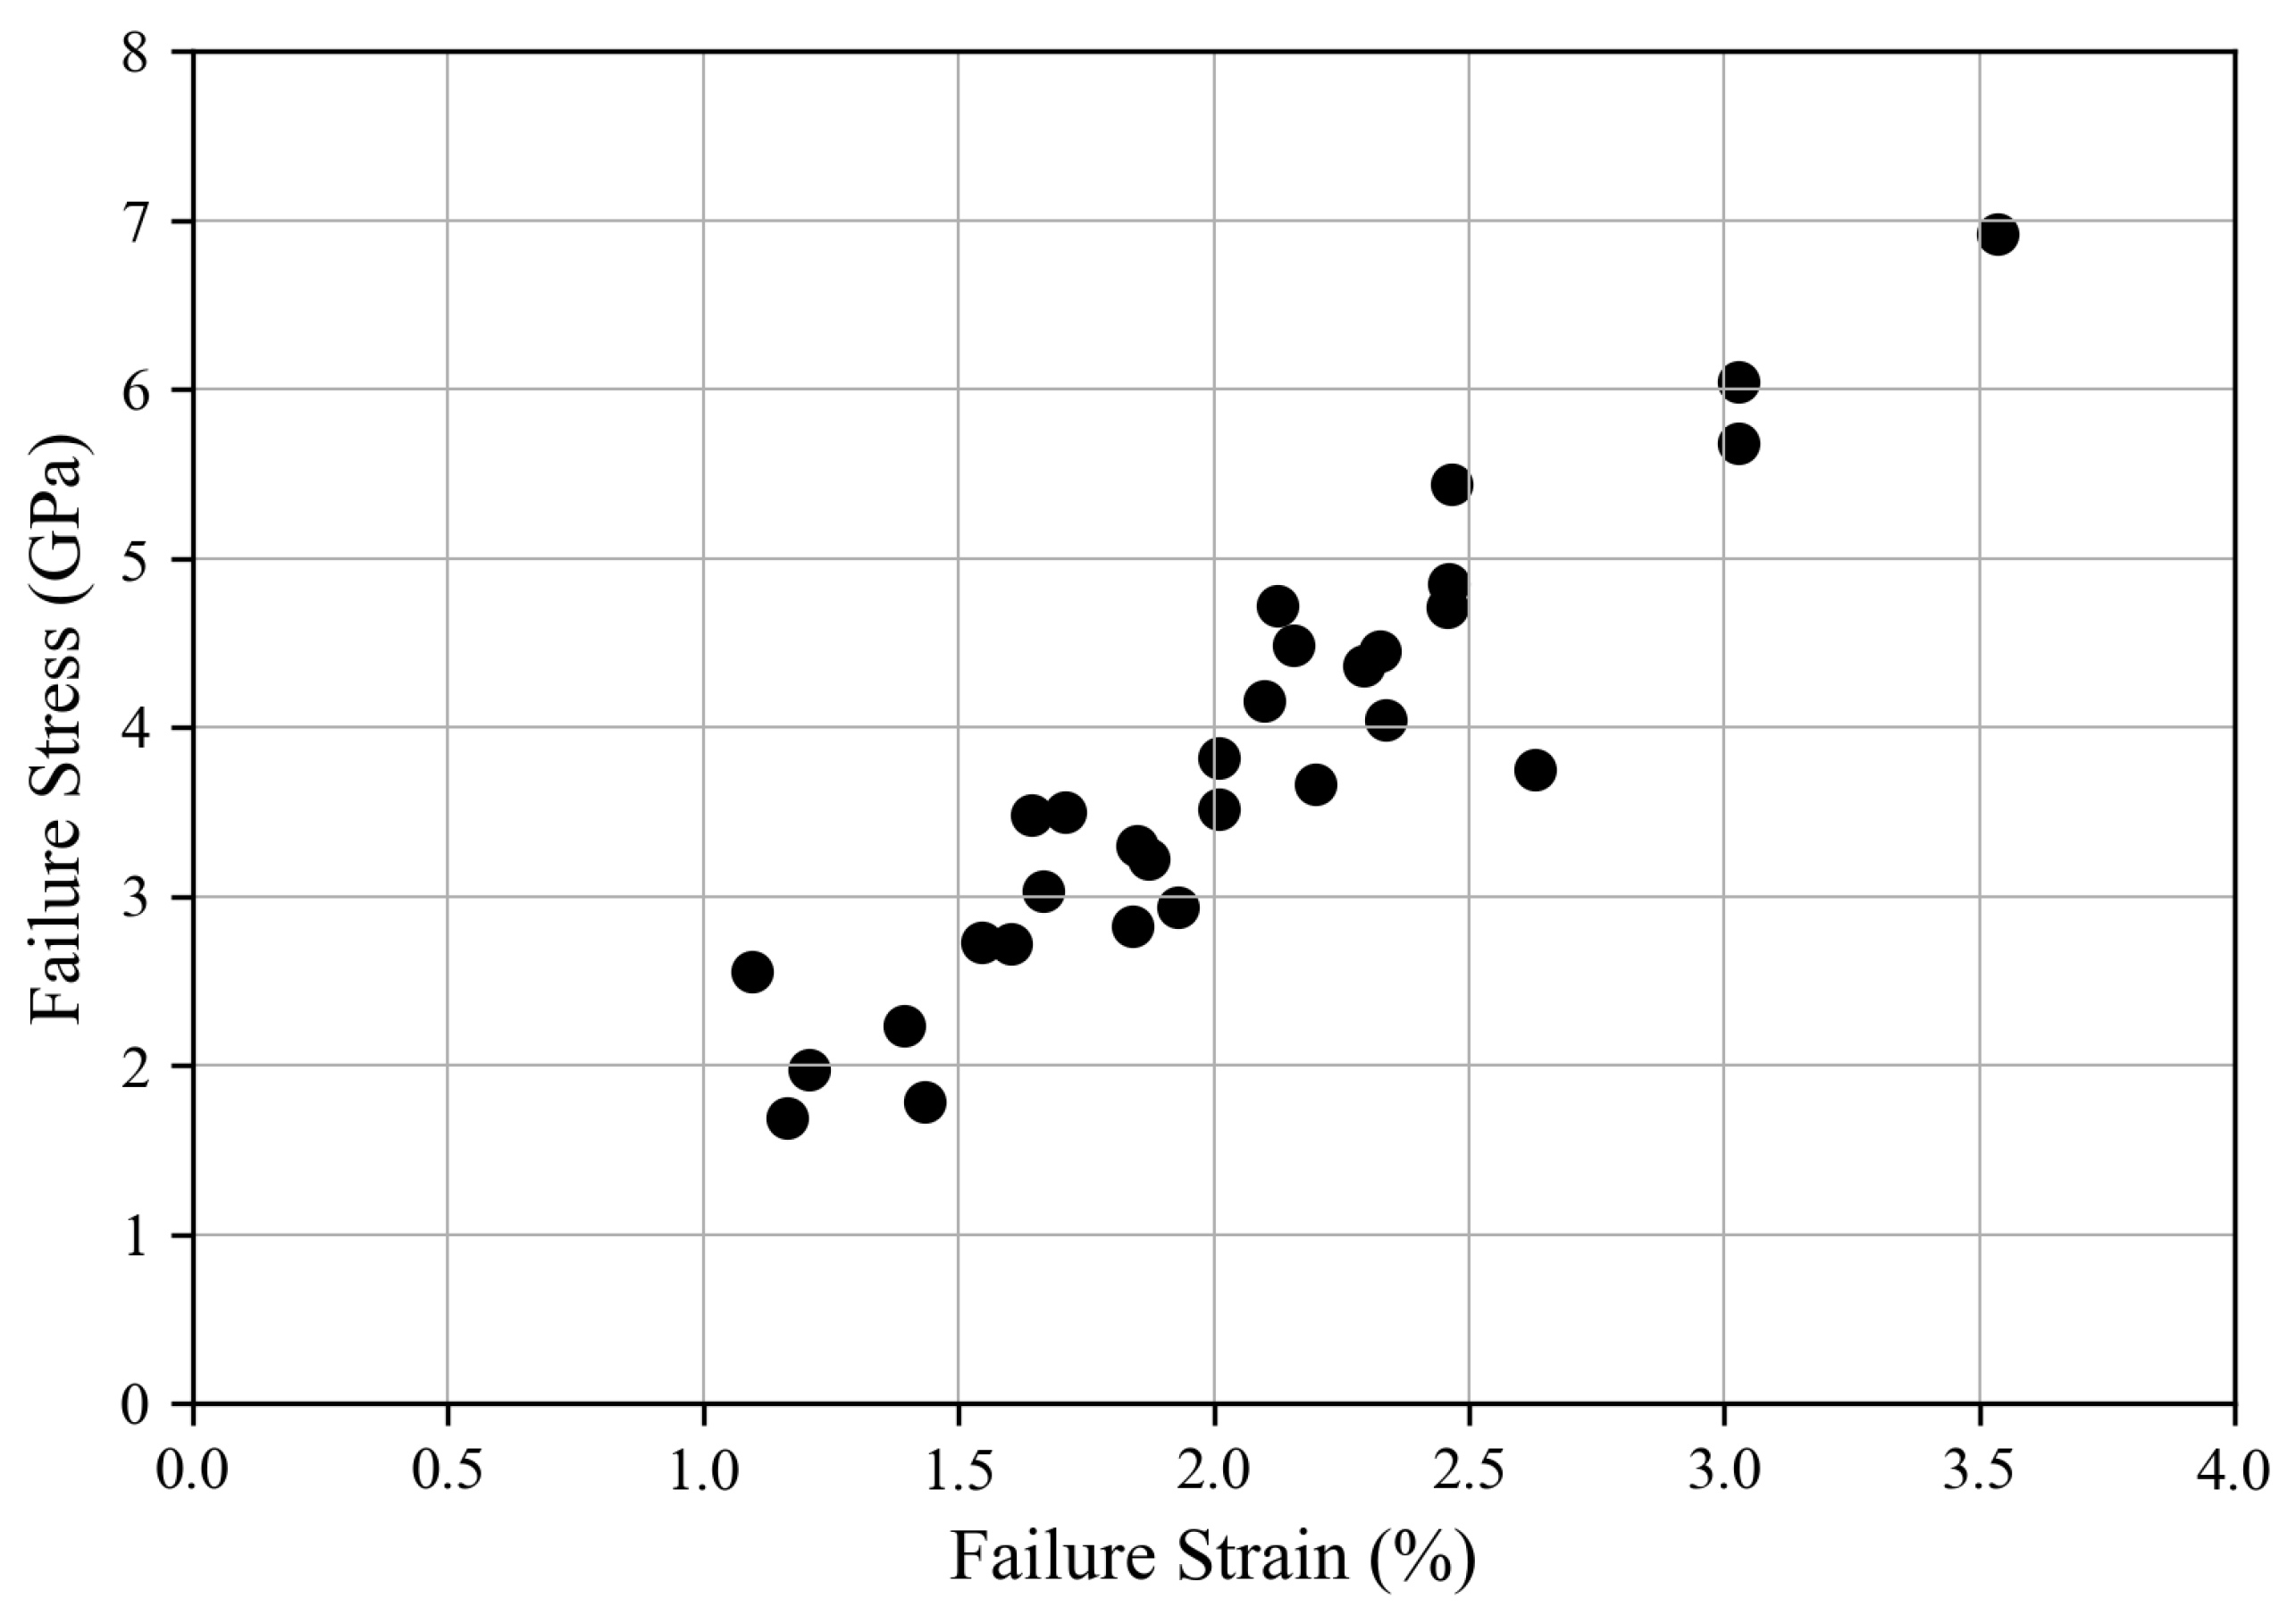
Figure 5.
Sensitivity indices of different input quantities in tensile strength measurement of fibres at different gauge lengths.
Figure 5.
Sensitivity indices of different input quantities in tensile strength measurement of fibres at different gauge lengths.

Table 1.
Best estimate values of all quantities for one single fibre tensile test.
| S.N. | Quantity | Value | Unit |
|---|---|---|---|
| 1 | 0.16 | N | |
| 2 | h | 1 | mm |
| 3 | 30 | mm | |
| 4 | 0.69 | mm | |
| 5 | D | 6.7 × | mm |
Table 2.
Measurement uncertainty values of all input quantities for the given fibre tensile test example, along with expanded uncertainty for a confidence level of 95% and 99%.
Table 2.
Measurement uncertainty values of all input quantities for the given fibre tensile test example, along with expanded uncertainty for a confidence level of 95% and 99%.
| S.N. | Measurement Uncertainty | Value | Expanded Uncertainty | Value | Expanded Uncertainty | Value | Unit |
|---|---|---|---|---|---|---|---|
| 1 | N | ||||||
| 2 | mm | ||||||
| 3 | mm | ||||||
| 4 | mm | ||||||
| 5 | mm |
Table 3.
Sensitivity coefficient values of all quantities.
| S.N. | Quantity | Value | Unit |
|---|---|---|---|
| 1 | m | ||
| 2 | N·m | ||
| 3 | N·m | ||
| 4 | N·m | ||
| 5 | N·m |
Table 4.
Best estimates and measurement uncertainty of fibre strength for 30 tensile tests.
| S.N. | (GPa) | (GPa) | S.N. | (GPa) | (GPa) | S.N. | (GPa) | (GPa) |
|---|---|---|---|---|---|---|---|---|
| 1 | 1.69 | 0.07 | 11 | 3.23 | 0.10 | 21 | 4.36 | 0.08 |
| 2 | 1.78 | 0.07 | 12 | 3.28 | 0.11 | 22 | 4.45 | 0.12 |
| 3 | 1.97 | 0.06 | 13 | 3.48 | 0.08 | 23 | 4.49 | 0.05 |
| 4 | 2.23 | 0.03 | 14 | 3.50 | 0.18 | 24 | 4.72 | 0.09 |
| 5 | 2.56 | 0.06 | 15 | 3.52 | 0.17 | 25 | 4.73 | 0.12 |
| 6 | 2.72 | 0.03 | 16 | 3.68 | 0.14 | 26 | 4.85 | 0.06 |
| 7 | 2.73 | 0.05 | 17 | 3.75 | 0.09 | 27 | 5.44 | 0.31 |
| 8 | 2.82 | 0.05 | 18 | 3.82 | 0.07 | 28 | 5.68 | 0.08 |
| 9 | 2.93 | 0.06 | 19 | 4.04 | 0.06 | 29 | 5.99 | 0.17 |
| 10 | 3.03 | 0.09 | 20 | 4.15 | 0.12 | 30 | 6.92 | 0.10 |
Table 5.
Sensitivity measures of each input quantity for the given single fibre tensile test example.
Table 5.
Sensitivity measures of each input quantity for the given single fibre tensile test example.
| Rank | Input | ∣Sensitivity∣ | Sensitivity |
|---|---|---|---|
| 1 | D | 0.79 | |
| 2 | 0.20 | ||
| 3 | h | 1.63 × | 2.67 × |
| 4 | 1.33 × | 1.76 × | |
| 5 | 6.35 × | 4.03 × |
Table 6.
Average sensitivity measures for each input quantity for the set of 30 single fibre tensile test.
Table 6.
Average sensitivity measures for each input quantity for the set of 30 single fibre tensile test.
| Rank | Input | ∣Sensitivity∣ | Sensitivity |
|---|---|---|---|
| 1 | D | 0.66 | |
| 2 | 0.23 | ||
| 3 | h | 0.02 | 2.33 × |
| 4 | 1.26 × | 1.58 × | |
| 5 | 6.03 × | 3.64 × |
Table 7.
Sensitivity indices (S) of different input quantities in tensile strength measurement of fibres at different gauge lengths.
Table 7.
Sensitivity indices (S) of different input quantities in tensile strength measurement of fibres at different gauge lengths.
| Input ↓ | 30 mm S | 20 mm S | 10 mm S | 5 mm S | 2.5 mm S |
|---|---|---|---|---|---|
| D | 0.81 | 0.83 | 0.85 | 0.74 | 0.33 |
| 0.48 | 0.45 | 0.38 | 0.25 | 0.08 | |
| h | 0.02 | 0.04 | 0.15 | 0.47 | 0.62 |
| 1.26 × | 4.36 × | 0.04 | 0.23 | 0.61 | |
| 6.03 × | 2.09 × | 0.02 | 0.11 | 0.29 |
© 2019 by the authors. Licensee MDPI, Basel, Switzerland. This article is an open access article distributed under the terms and conditions of the Creative Commons Attribution (CC BY) license (http://creativecommons.org/licenses/by/4.0/).
Share and Cite
MDPI and ACS Style
Islam, F.; Joannès, S.; Laiarinandrasana, L. Evaluation of Critical Parameters in Tensile Strength Measurement of Single Fibres. J. Compos. Sci. 2019, 3, 69. https://doi.org/10.3390/jcs3030069
AMA Style
Islam F, Joannès S, Laiarinandrasana L. Evaluation of Critical Parameters in Tensile Strength Measurement of Single Fibres. Journal of Composites Science. 2019; 3(3):69. https://doi.org/10.3390/jcs3030069
Chicago/Turabian StyleIslam, Faisal, Sébastien Joannès, and Lucien Laiarinandrasana. 2019. "Evaluation of Critical Parameters in Tensile Strength Measurement of Single Fibres" Journal of Composites Science 3, no. 3: 69. https://doi.org/10.3390/jcs3030069