Article

Size Effects on Process-Induced Porosity in Ti6Al4V Thin Struts Additively Manufactured by Laser Powder-Bed Fusion

by
Nismath Valiyakath Vadakkan Habeeb
* and
Kevin Chou
Department of Industrial and Systems Engineering, University of Louisville, Louisville, KY 40292, USA
*
Author to whom correspondence should be addressed.
J. Manuf. Mater. Process. 2025, 9(7), 226; https://doi.org/10.3390/jmmp9070226
Submission received: 30 May 2025 / Revised: 18 June 2025 / Accepted: 25 June 2025 / Published: 2 July 2025

Abstract

Laser powder-bed fusion (L-PBF) additive manufacturing has been widely explored for fabricating intricate metallic parts such as lattice structures with thin struts. However, L-PBF-fabricated small parts (e.g., thin struts) exhibit different morphological and mechanical characteristics compared to bulk-sized parts due to distinct scan lengths, affecting the melt pool behavior between transient and quasi-steady states. This study investigates the keyhole porosity in Ti6Al4V thin struts fabricated by L-PBF, incorporating a range of strut sizes, along with various levels of linear energy densities. Micro-scaled computed tomography and image analysis were employed for porosity measurements and evaluations. Generally, keyhole porosity lessens with decreasing energy density, though with varying patterns across a higher energy density range. Keyhole porosity in struts predictably becomes severe at high laser powers and/or low scan speeds. However, a major finding reveals that the porosity is reduced with decreasing strut size (if less than 1.25 mm diameter), plausibly because the keyhole formed has not reached a stable state to produce pores in a permanent way. This implies that a higher linear energy density, greater than commonly formulated in making bulk components, could be utilized in making small-scale features to ensure not only full melting but also minimum keyhole porosity.

1. Introduction

Cellular lattice structures are used in various industries for thermal insulation, weight reduction, acoustics, vibrations, shock damping, etc. [1]. The most common applications of cellular structures are in the biomedical sector for the manufacturing of customized implants and stents. The lattice structures fulfill both the mechanical and biological requirements of prosthetic devices. Young’s modulus of lattice structures can be engineered to match tissue compatibility, which is impossible with bulk metallic devices [2]. Metallic cellular lattice structures also have wide acceptance in the aerospace industry for the weight reduction of parts without compromising the strength [3]. Thin struts are the building units of complex cellular lattice structures and metallic foams [4]. Conventional subtractive manufacturing processes have limitations in controlling the fine features such as thin struts [5].
Laser powder-bed fusion (L-PBF) additive manufacturing is highly suitable for producing thin features because of the extensive design freedom and higher dimensional accuracy of the process. The layer-by-layer fabrication of freeform geometries from CAD designs allows the customization of parts with much less complexity [6]. Studies have reported better dimensional accuracy and lower surface irregularities for the L-PBF thin struts than those made by electron beam melting (EBM) [7]. However, the inherent process-induced defects in L-PBF parts, such as porosity, dimensional inaccuracy (relative to the nominal design), and surface irregularities, limit their mass production capability [8]. Porosity causes a deterioration of the mechanical properties of the parts, as they can act as crack initiation and growth points [9]. Porosity adversely affects the fatigue performance at cyclic loading conditions [10]. Post-processing treatments can improve fatigue performance; however, for biomedical applications, as-built parts are preferred for better mechanical interlocking and tissue regeneration [11,12]. Hence, the porosity evaluation in as-built thin features fabricated by the L-PBF process is inevitable and not well addressed yet.
L-PBF is a highly complex process due to the large temperature gradients and temporally and spatially transient heat transfer caused by the interaction of the laser and the powder bed [8]. The melt pool fluctuations under the above-mentioned constantly changing physical phenomena cause porosity defects. The melt pool variations across different layers depend largely on the process parameters. Gong et al. [12] distinguished the process window in L-PBF into insufficient, conduction, and over-melting zones. Insufficient melting causes the lack of fusion porosity, while over-melting causes keyhole porosity. An insufficient energy input or large hatch distance causes melt pool discontinuity or the lack of overlap between scan lines. This causes a lack of fusion pores distributed along the hatch lines. Excess energy input causes the entrapment of gas bubbles in the melt pool and results in near-spherical keyhole pore formation.
The ex-situ porosity characterization can be both destructive and non-destructive. Destructive methods include taking cross-sections of specimens and characterization using various optical microscopy techniques [13]. Non-destructive methods are more convenient, allowing the user to utilize the specimens for various other tests or applications. X-ray computed tomography (XCT) is an advanced technique to characterize the features in AM metallic parts [14]. XCT is mostly used to detect internal defects, dimensional accuracy, pore distribution, pore morphometry, etc. It helps in the quantitative and qualitative analysis of porosity using 2D and 3D image data. Several studies have shown that the statistical data quality and image accuracy obtained from XCT are significantly better compared to conventional non-destructive methods [15,16]. The high pixel resolution and user-friendly interfaces for reconstruction and image processing make it convenient for research studies [17].
Thin features have distinct characteristics compared to the bulk parts, built under the same process conditions, due to the shorter scan length, often stated as the size effect. Because the scan length is a significant factor affecting the melt pool geometry, the melt pool fails to reach a quasi-steady state at shorter scan lengths. A wider melt pool with a low bead height before the quasi-steady state on single-track scans of a scan length less than 2 mm was reported [18]. Another study on the effect of surface morphology on multi-track depositions showed that scan length has a significant effect on track width and height. Smaller scan lengths showed an increase in track height [19]. The transient length before which the melt pool reaches a steady state is, hence, an important determining factor for the thin feature fabrication [19]. The size of the thin features also affects the thermal history, which in turn affects the morphological and mechanical properties of the parts. When compared to bulk parts, thin features are subjected to significant thermal dissipation from the powder bed. This results in cracks and pore formation, particle attachment, and surface roughness. Apart from the thin strut size, the thermal history could be affected by the process parameters, scan strategy, powder characteristics, etc. [20,21]. The mechanical properties of miniature struts are also different from bulk-sized parts. Pehlivan et al. [22] reported differences in the yield strength of the small CP-Ti Grade 2 struts built at different orientations to be around 79% when the cross-sectional area is less than 1.5 mm2 and around 6% when the area is larger than 1.5 mm2.
Several studies have been found on the manufacturability and dimensional accuracy of thin struts, but very little work has been focused on their inherent porosity defects. Qiu et al. [23] investigated the effect of process parameters on the dimensional accuracy and porosity of AlSiMg thin struts. They reported an oversizing of the struts compared to the designed geometry and found that the strut size is affected by the laser power and scan speed. However, this work evaluated the porosity on only one set of laser powers and scan speeds. In Yan et al.’s [24] study using AlSi10Mg cellular lattice structures, the strut sizes of L-PBF structures were higher than the nominal designed ones mainly due to attached powder particles. Another study with Ti64 micro-pillars and micro-plates built using various processing conditions in SLM confirmed the presence of attached powder particles on the micro-sized parts through scanning electron microscopy [25]. Van Bael et al. [26] also noticed increased strut sizes compared to the designed values in SLM-manufactured Ti6Al4V porous structures. The struts were built with a 45° angle, and hence, the staircase effect contributed to the increased strut thickness in this study. Studies have also shown that the downward-facing surface, which is built directly on the powder bed, has more surface irregularities [27,28]. Even though the surface irregularities are challenging, several studies have proven that the contour scanning strategy could highly improve the surface defects and dimensional accuracy of thin struts [29,30]. Liang et al. [31] studied the size effect on the forming quality of Ti6Al4V solid struts and proposed the usage of high scan speeds for better dimensional accuracy of struts with sizes less than 1 mm.
The orientation of struts during fabrication affects the dimensional accuracy and surface morphology of the thin features to a great extent. A considerable amount of literature is available on the effects of the L-PBF build orientation on the properties of small struts. Suard et al. [32] studied the influence of build orientations on single struts properties and found that the porosity is low on inclined struts when compared to vertical ones. However, the study did not expand on the effects of process parameters on the porosity of those thin struts. Murchio et al. [33] extensively studied the effects of inherent defects on the fatigue performance of miniature struts fabricated by L-PBF. Surface texture and geometrically induced surface defects were the principal determining factors for the fatigue performance of the struts. The detected porosity was small in their study, and hence, they could not conclude what the contribution of porosity to fatigue performance was. Another study compared the tensile properties of small struts built at different orientations and concluded that the differences arise from microstructural variations in the struts [22]. A study of Ti6Al4V micro-struts built at different orientations compared their morphology and mechanical properties and found that lower angle struts have worse morphology with high surface roughness and less dimensional accuracy [34]. Nevertheless, to the best of our knowledge, no studies have been performed extensively to investigate the effects of strut size, strut shape, and process parameters on the porosity of thin features.
This study aims to analyze the porosity characteristics of thin struts fabricated by the L-PBF process at a wide range of processing conditions. The three-dimensional Ti6Al4V thin struts were printed using the repetitive deposition of single tracks along multiple layers. Different-sized struts of circle and square shapes were fabricated at various linear energy densities. The porosity was characterized by using a Bruker SkyScan 1173 Micro-scaled computed tomography (micro-CT) scanner (Bruker, Kontich, Belgium). The average pore volume, porosity percentage, and number of pores were evaluated from the results, along with 2D and 3D image analysis.

2. Materials and Methods

2.1. Specimen Fabrication

Thin struts of five different sizes and two shapes, as listed in Table 1, were designed to study the effect on porosity. All struts have a height of 4 mm and are built on a semi-spherical substrate as shown in Figure 1. The semi-spherical substrate allows effective heat dissipation during printing due to a gradually increasing scan area, along with avoiding the residual heat effects due to the absence of sharp corners [35,36]. The substrate design also helps to minimize errors during CT scanning [37]. The substrate cross-sectional size is 10 mm for all cases, and the struts were placed inside a 7 mm diameter to ensure proper transmission of the X-ray during the CT scan. A thin wall of 0.5 mm thickness and 1 mm height from the substrate is built around the struts for easy handling during the scanning. A maximum possible number of struts was placed on each of the substrate with a sufficient gap between them to reduce the residual heat effect [38]. Each substrate only has struts of the same size but has both square and circular struts.
The specimens were fabricated using an EOS M270 LPBF system (EOS GmbH, Krailling/Munich, Germany) and Ti6Al4V powder sourced from Carpenter Technology Corporation (Philadelphia, PA, USA), with the chemical composition (as received) listed in Table 2.
A scan strategy with only raster scans in one direction was used. This strategy allows for the effective study of the pore distribution along the scan length. The use of contour scans might hinder the ability to study the transient region and porosity formation at the start and end of the laser scan path. To study the effect of the process parameters, a wide range of linear energy density (LED; LED = laser power/scan speed) is selected based on some initial experiments, where the transient melt pool behavior in a single track was evaluated [18,38]. This initial study suggested that the transient length of the melt pool is directly proportional to the laser power, P, and indirectly proportional to the scan speed, V. Hence the P and V values were selected based on these preliminary results to evaluate if the porosity in thin struts is directly related to the transient length of the melt pool. Additionally, a set of specimens was built at the default parameters recommended by the machine manufacturer for raster scanning on Ti6Al4V material, which are P = 170 W and V = 1250 mm/s. The selection of the process parameters prioritized the coverage of the conduction and keyhole porosity regime, with emphasis on higher values than typically used for bulk processing. While this DOE matrix does not constitute a full factorial design and limits the ability to perform comprehensive statistical analyses or assess parameter interactions, it was chosen to efficiently explore the process–structure relationship in thin struts within practical constraints. All selected parameters are listed in Table 3. The laser beam diameter and hatch spacing are 100 µm for all cases. The powder layer thickness is 30 µm, and the powder size distribution is 15–45 µm.
A block support of 3 mm height with the machine default support parameter was used during fabrication. The substrate was placed over the support, and the same parameters were set up for substrates and thin struts. Three replicates of each specimen were fabricated in the same build to ensure the repeatability of the process. The total number of various fabricated struts is listed in Table 4. The replicates were placed on various locations of the build plate and at different orientations with respect to recoater movement to avoid location-dependent effects.

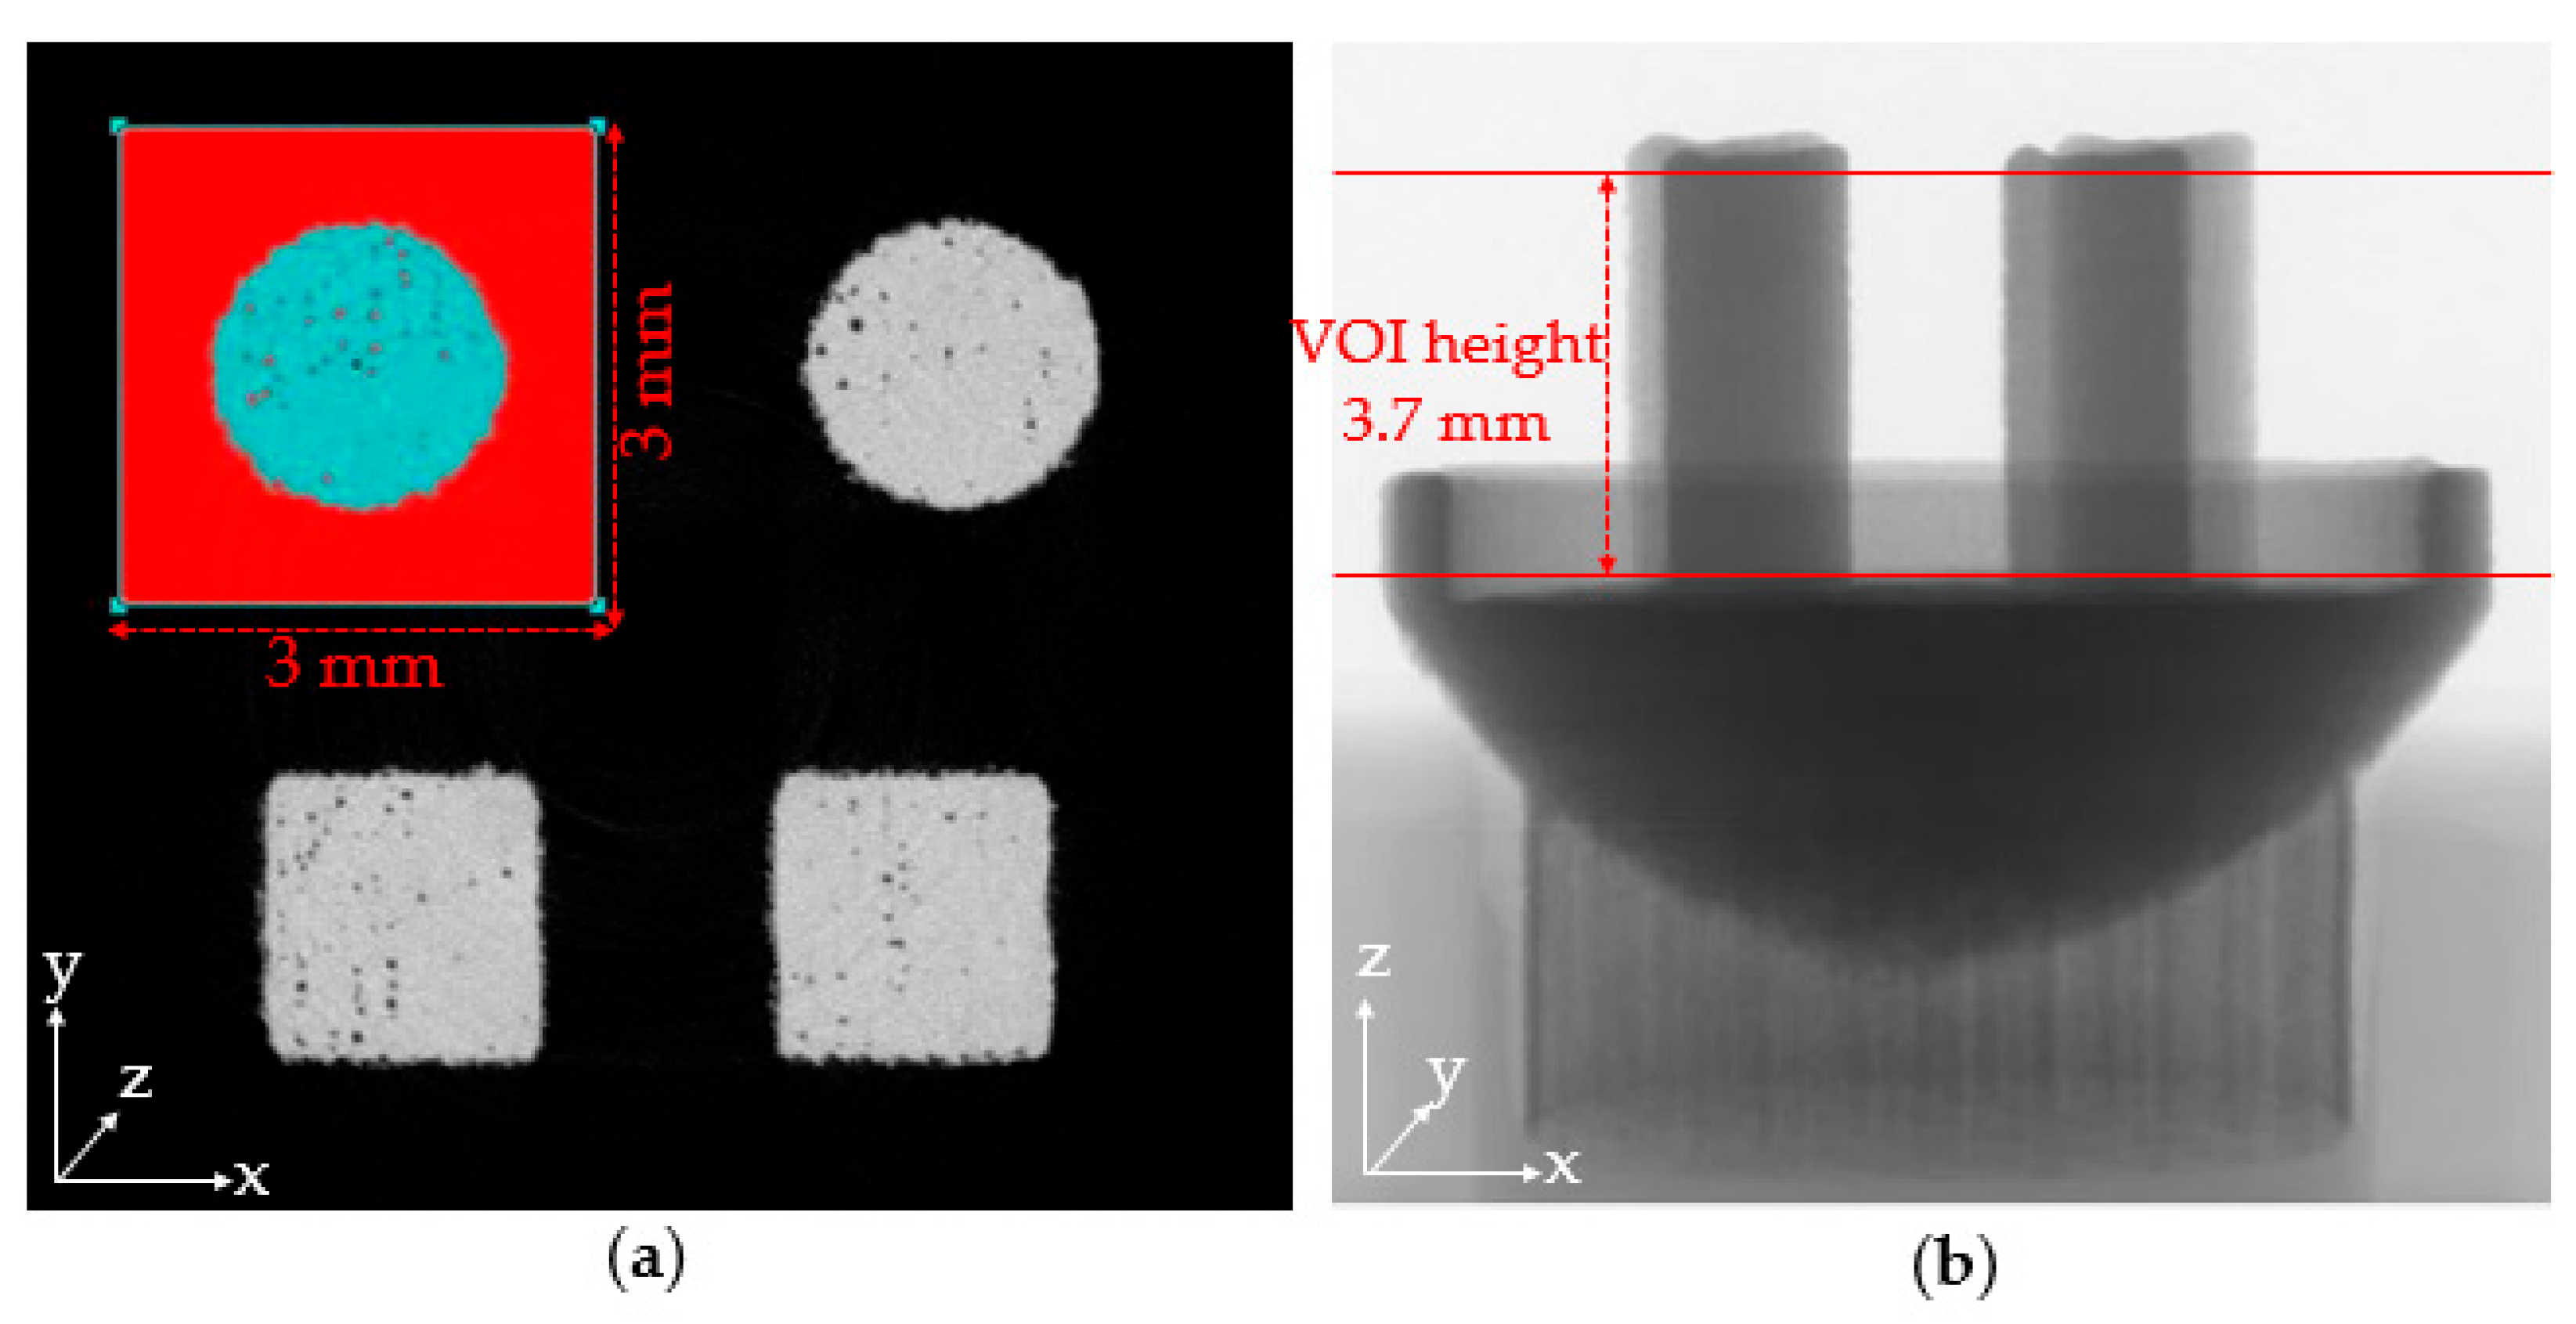
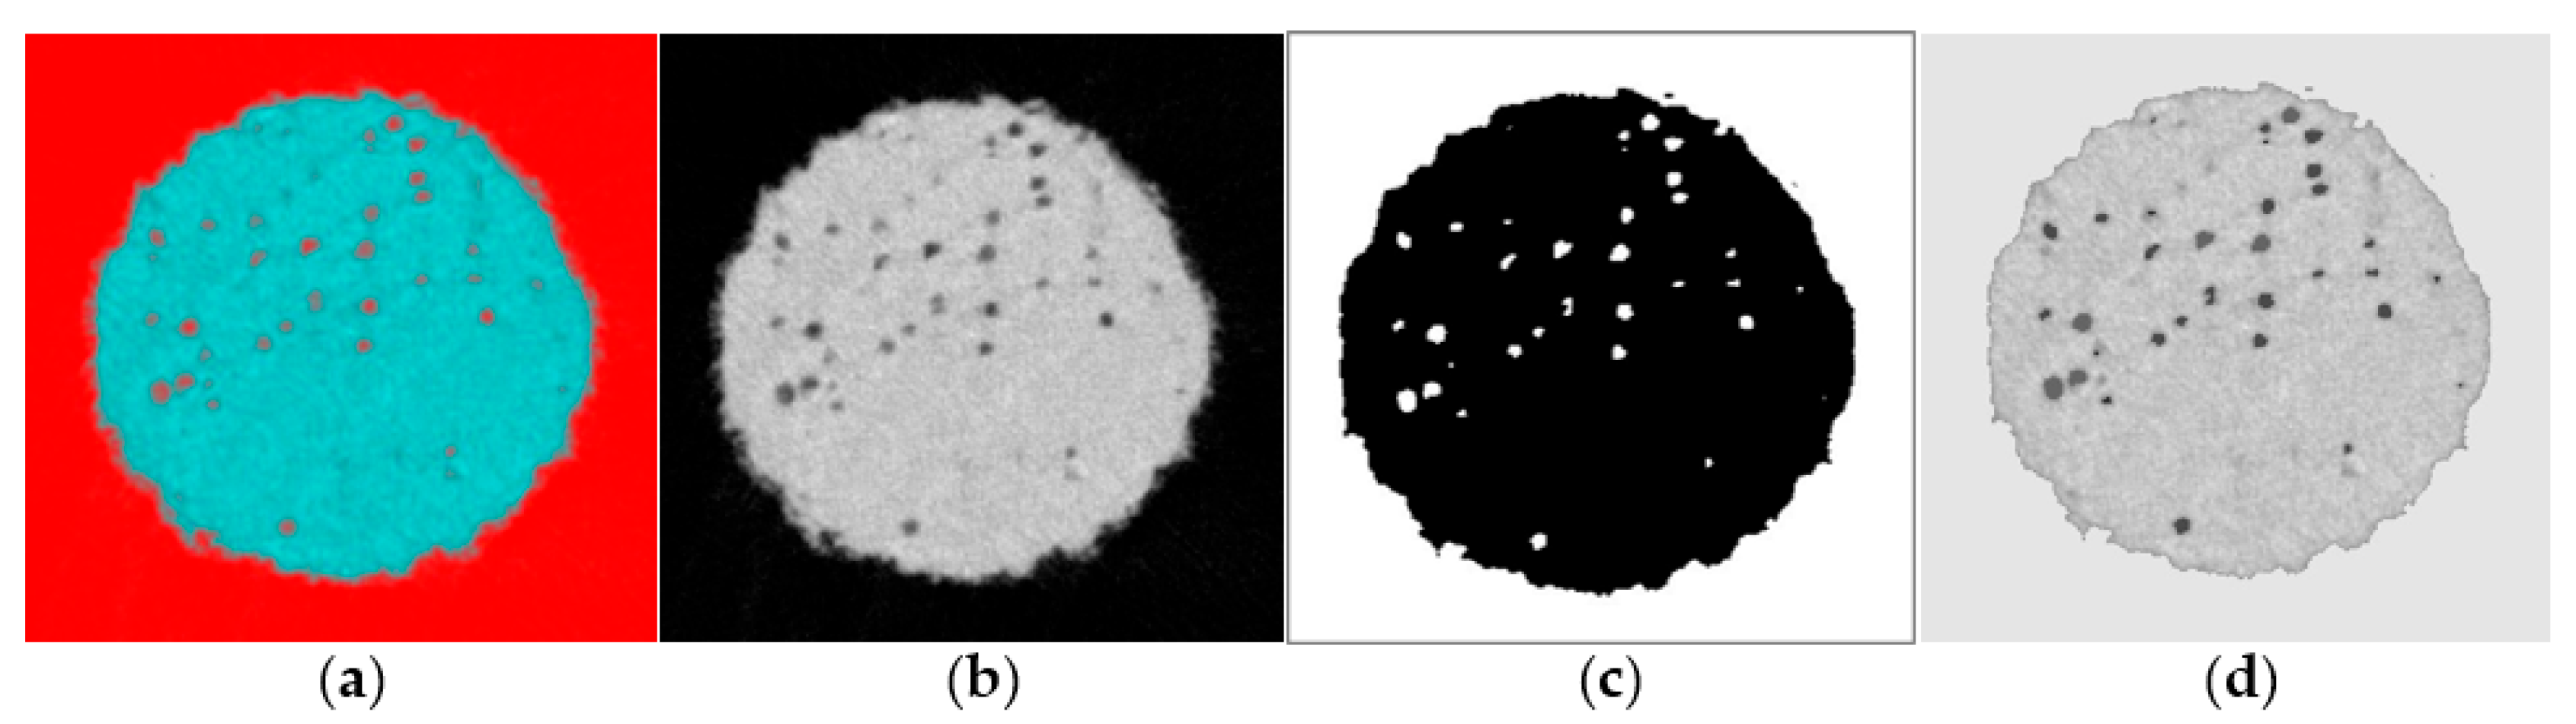
2.2. Porosity Evaluation

The fabricated specimens were scanned using a Bruker SkyScan 1173 micro-CT scanner (Bruker, Kontich, Belgium). Each specimen was placed firmly on a plastic specimen holder and mounted on a brass screw located on the stage inside the machine, as shown in Figure 2. The holder keeps the specimen steady inside the machine to avoid artifacts caused by movement and rotation during scanning.
The X-ray source is polychromatic and emits a conical beam. The Ti6Al4V material has a high absorption; hence, the highest possible setup with 130 kV X-ray was used for the scanning. A 0.25 mm brass filter absorbs low-energy X-rays (below 90 kV). This filter is necessary while scanning dense materials to reduce the beam hardening artifact. Otherwise, as the X-ray is polychromatic, low-energy X-rays get absorbed near the outer edges of specimens and will appear denser compared to the inner region of the part. The scanning was performed with a 7.1 µm voxel resolution and 2000× magnification. A rotation step of 0.2° was set up, which resulted in 1800 raw images with a 360° rotation during scanning. The scan setup was performed using SkyScan 1173 software (Version 1.5), and the raw images were reconstructed using NRecon software (Version 1.7.1.0) (Skyscan, Bruker micro-CT, Kontich, Belgium). The reconstruction of raw images consists of beam hardening correction, ring artifact reduction, and misalignment compensation. Fine-tuning these parameters helps in reducing the blurring effects and ring artifacts during scanning.
The reconstructed images from CT scan data were used for porosity analysis. The quantitative parameters from the reconstructed datasets were measured using CTAn software (Version 1.17.7.2, Skyscan, Bruker micro-CT, Kontich, Belgium). For each strut, a volume of interest (VOI) was chosen by creating a rectangular region of interest of 3 mm × 3 mm size in the xy-plane and by selecting the strut height of 3.7 mm in the z-plane (Figure 3). The VOI height was selected to avoid the possible defects on the top and bottom of the struts.
The projection images of struts in selected VOIs were then converted to binary images for measuring the porosity as shown in Figure 4. Binary images contain only black and white pixels, representing the non-selected (solid) and selected regions (object), respectively. The binarization of the raw images is performed by a process called thresholding. Thresholding values should be chosen to accurately represent the pore characteristics in the raw images. Superimposition of raw images on their corresponding binary image is an effective way to match them to the highest accuracy (Figure 4d). After selecting an appropriate thresholding value, despeckling is performed to remove the noise voxels from images. This step will remove floating black voxels surrounded by white voxels, which are smaller than 7 microns and do not represent the pore characteristics.
The morphometric porosity analysis is performed by CTAn on white pixels, which the software identifies as “objects”. In the images, CTAn identifies the pores as the number of white pixels surrounded by black pixels. It can identify both closed and open pores. Closed pores are the volume of white voxels fully surrounded by the black voxels in all three dimensions. The open pores are the volume of white voxels inside the solid and have connections to the region outside the solid. This study focuses on the closed pores inside the struts for consistency in pore volume calculations. The morphometry analysis provides several output parameters, of which the VOI volume (selected volume where the black region represents the solid part and the white region represents the objects), object volume (white region, which includes closed pores and the void region surrounding the solid), pore volume, and pore number are extracted for further analysis in this study.
The total pore volume, actual part volume and porosity percentage (%) are calculated by Equations (1)–(3), respectively. The number of pores in each strut is also considered for analysis. The pore size is evaluated in terms of average pore volume.
Total pore volume = Total object volume − Volume of the void region surrounding the solid
Actual part volume = Total VOI volume − Total object volume + Total pore volume
Porosity% = (Total pore volume/Actual part volume) × 100%
Sphericity (ψ) is a measure of how close a body is to the mathematically perfect sphere, which can be calculated by using Equation (4), where Vp is the volume of the pore, and Ap is the surface area. Sphericity can be used to differentiate between pores formed due to low energy density and high energy density [39]. The sphericity of all pores is hence recorded for analysis.
S p h e r i c i t y ,   ψ = π 1 3 ( 6 V p ) 2 3 A p
The 2D and 3D images of the struts were taken using DataViewer (Version 1.5.4.0) and CTVox software (Version 3.3.0 r1403) (Skyscan, Bruker micro-CT, Kontich, Belgium). The effects of the size and shape of struts, as well as the process parameters, are thus evaluated both qualitatively and quantitatively in this research study.

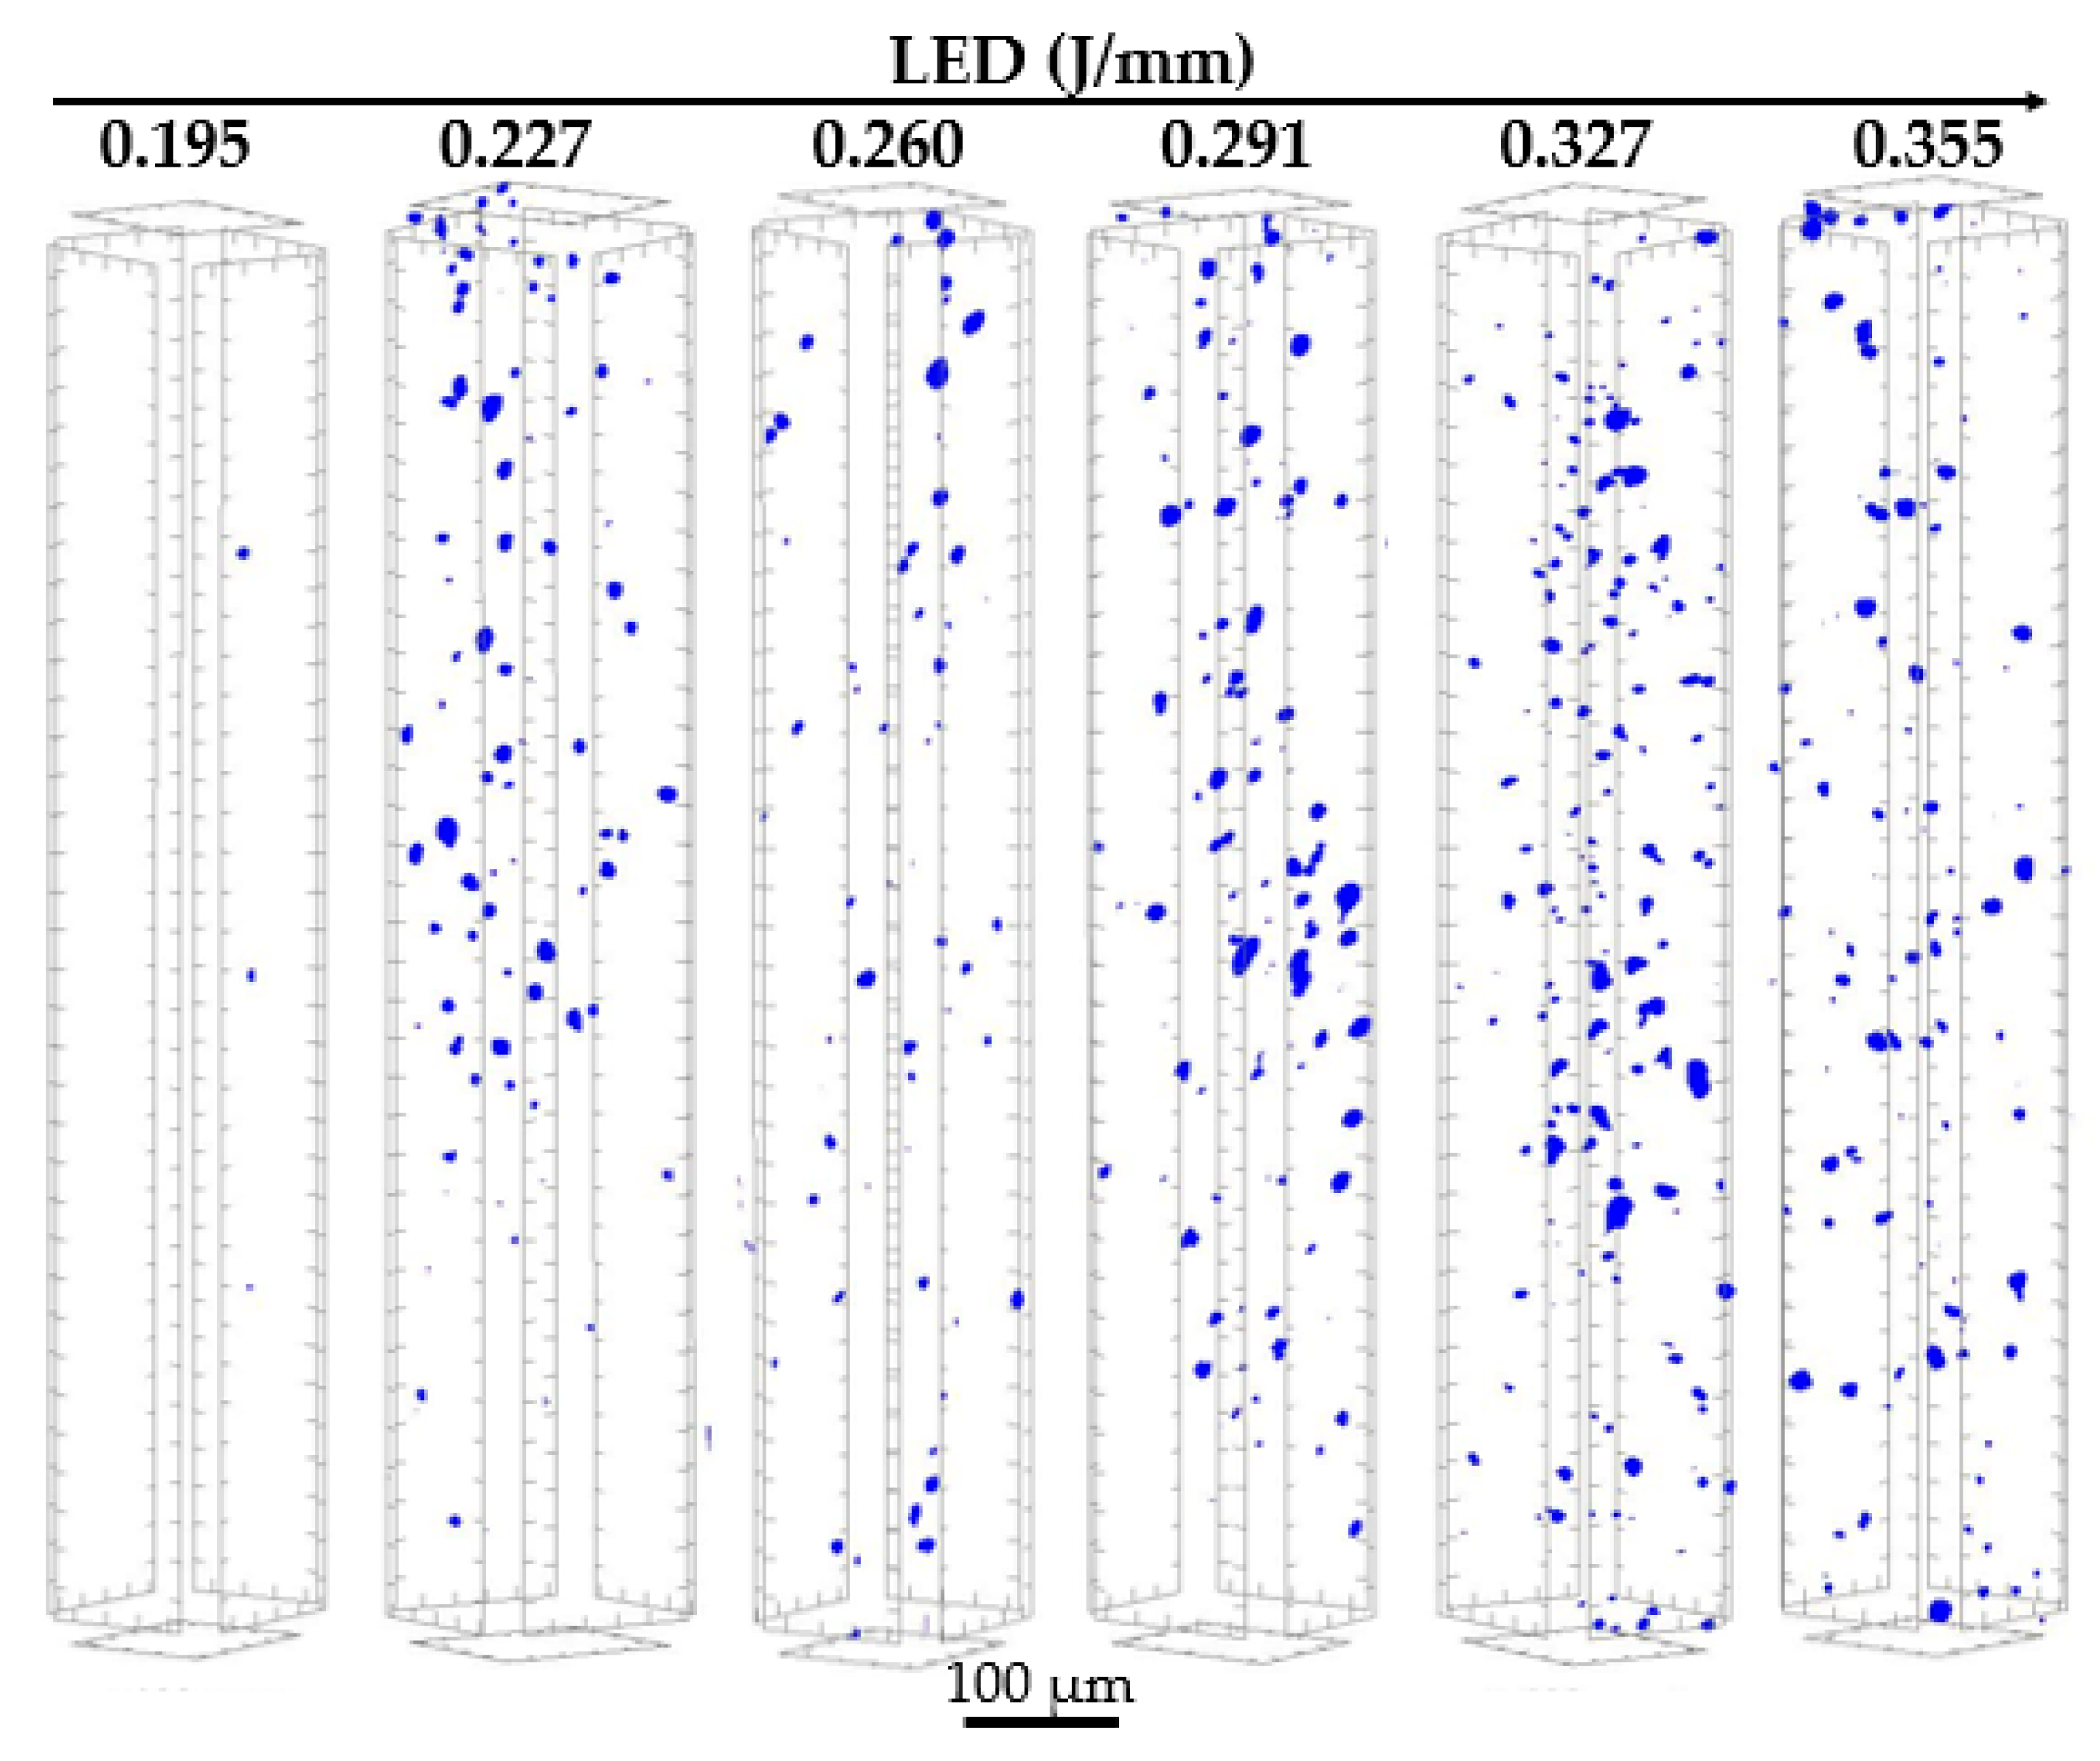
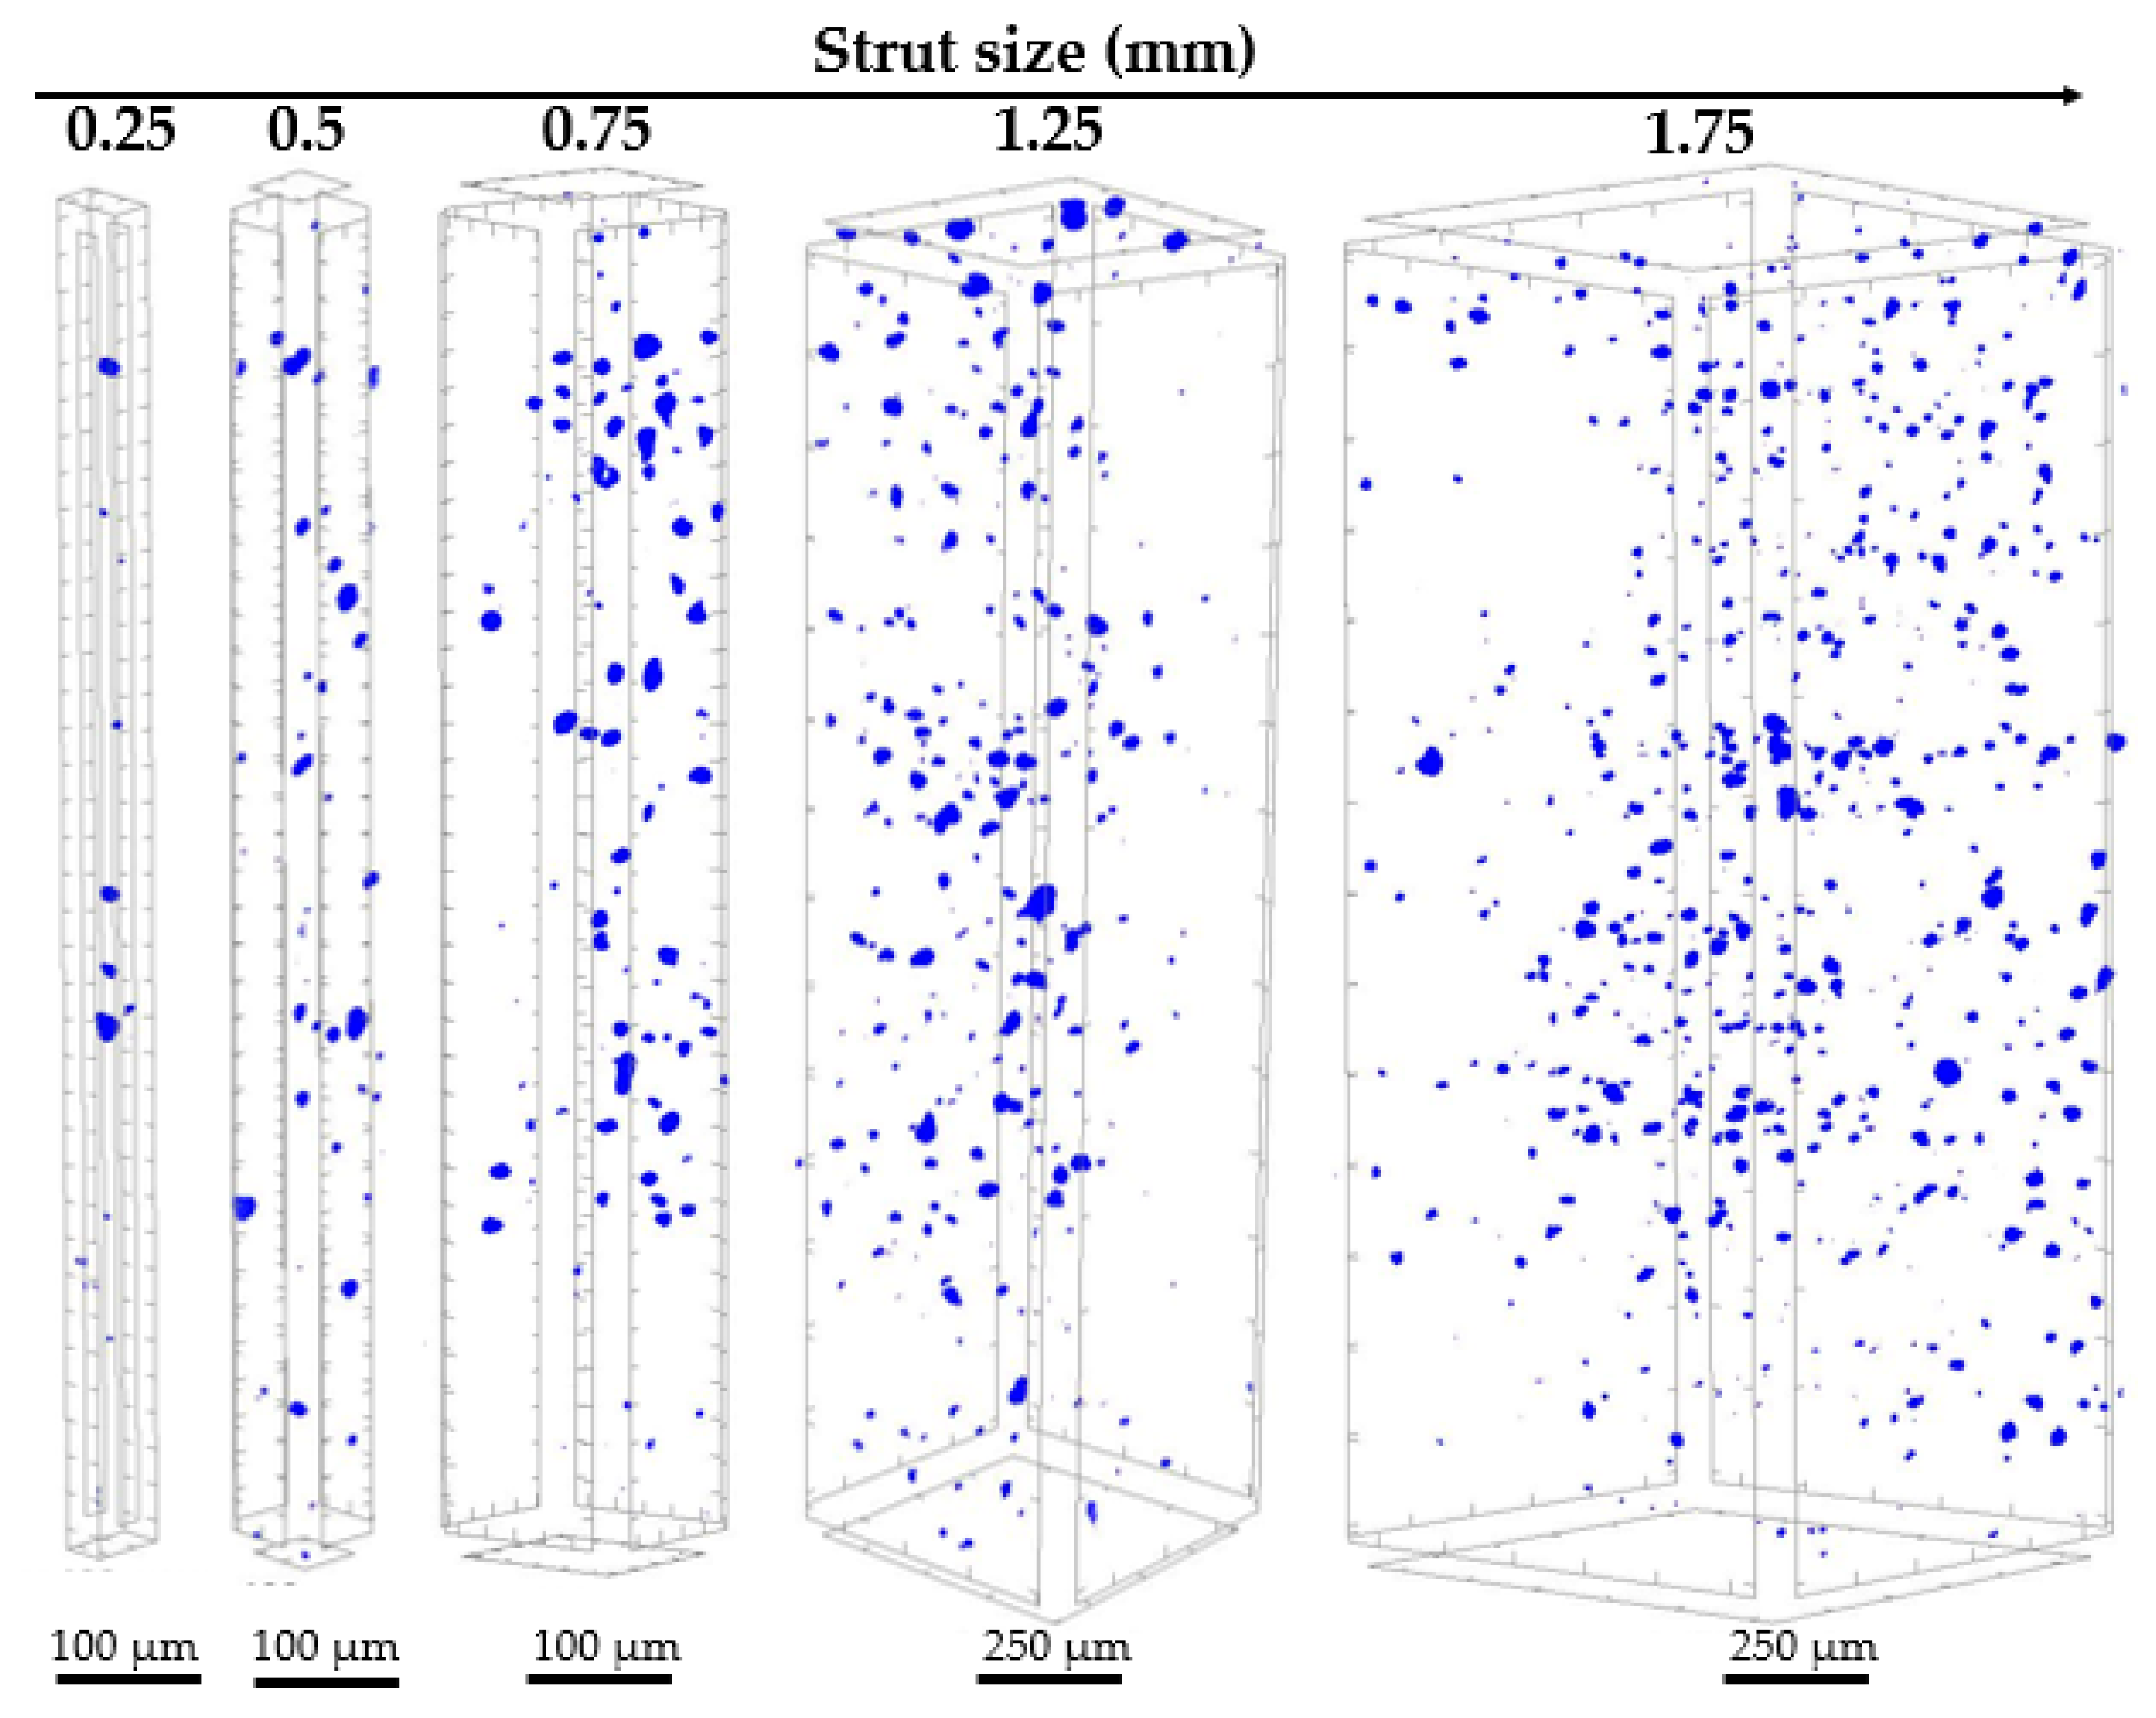
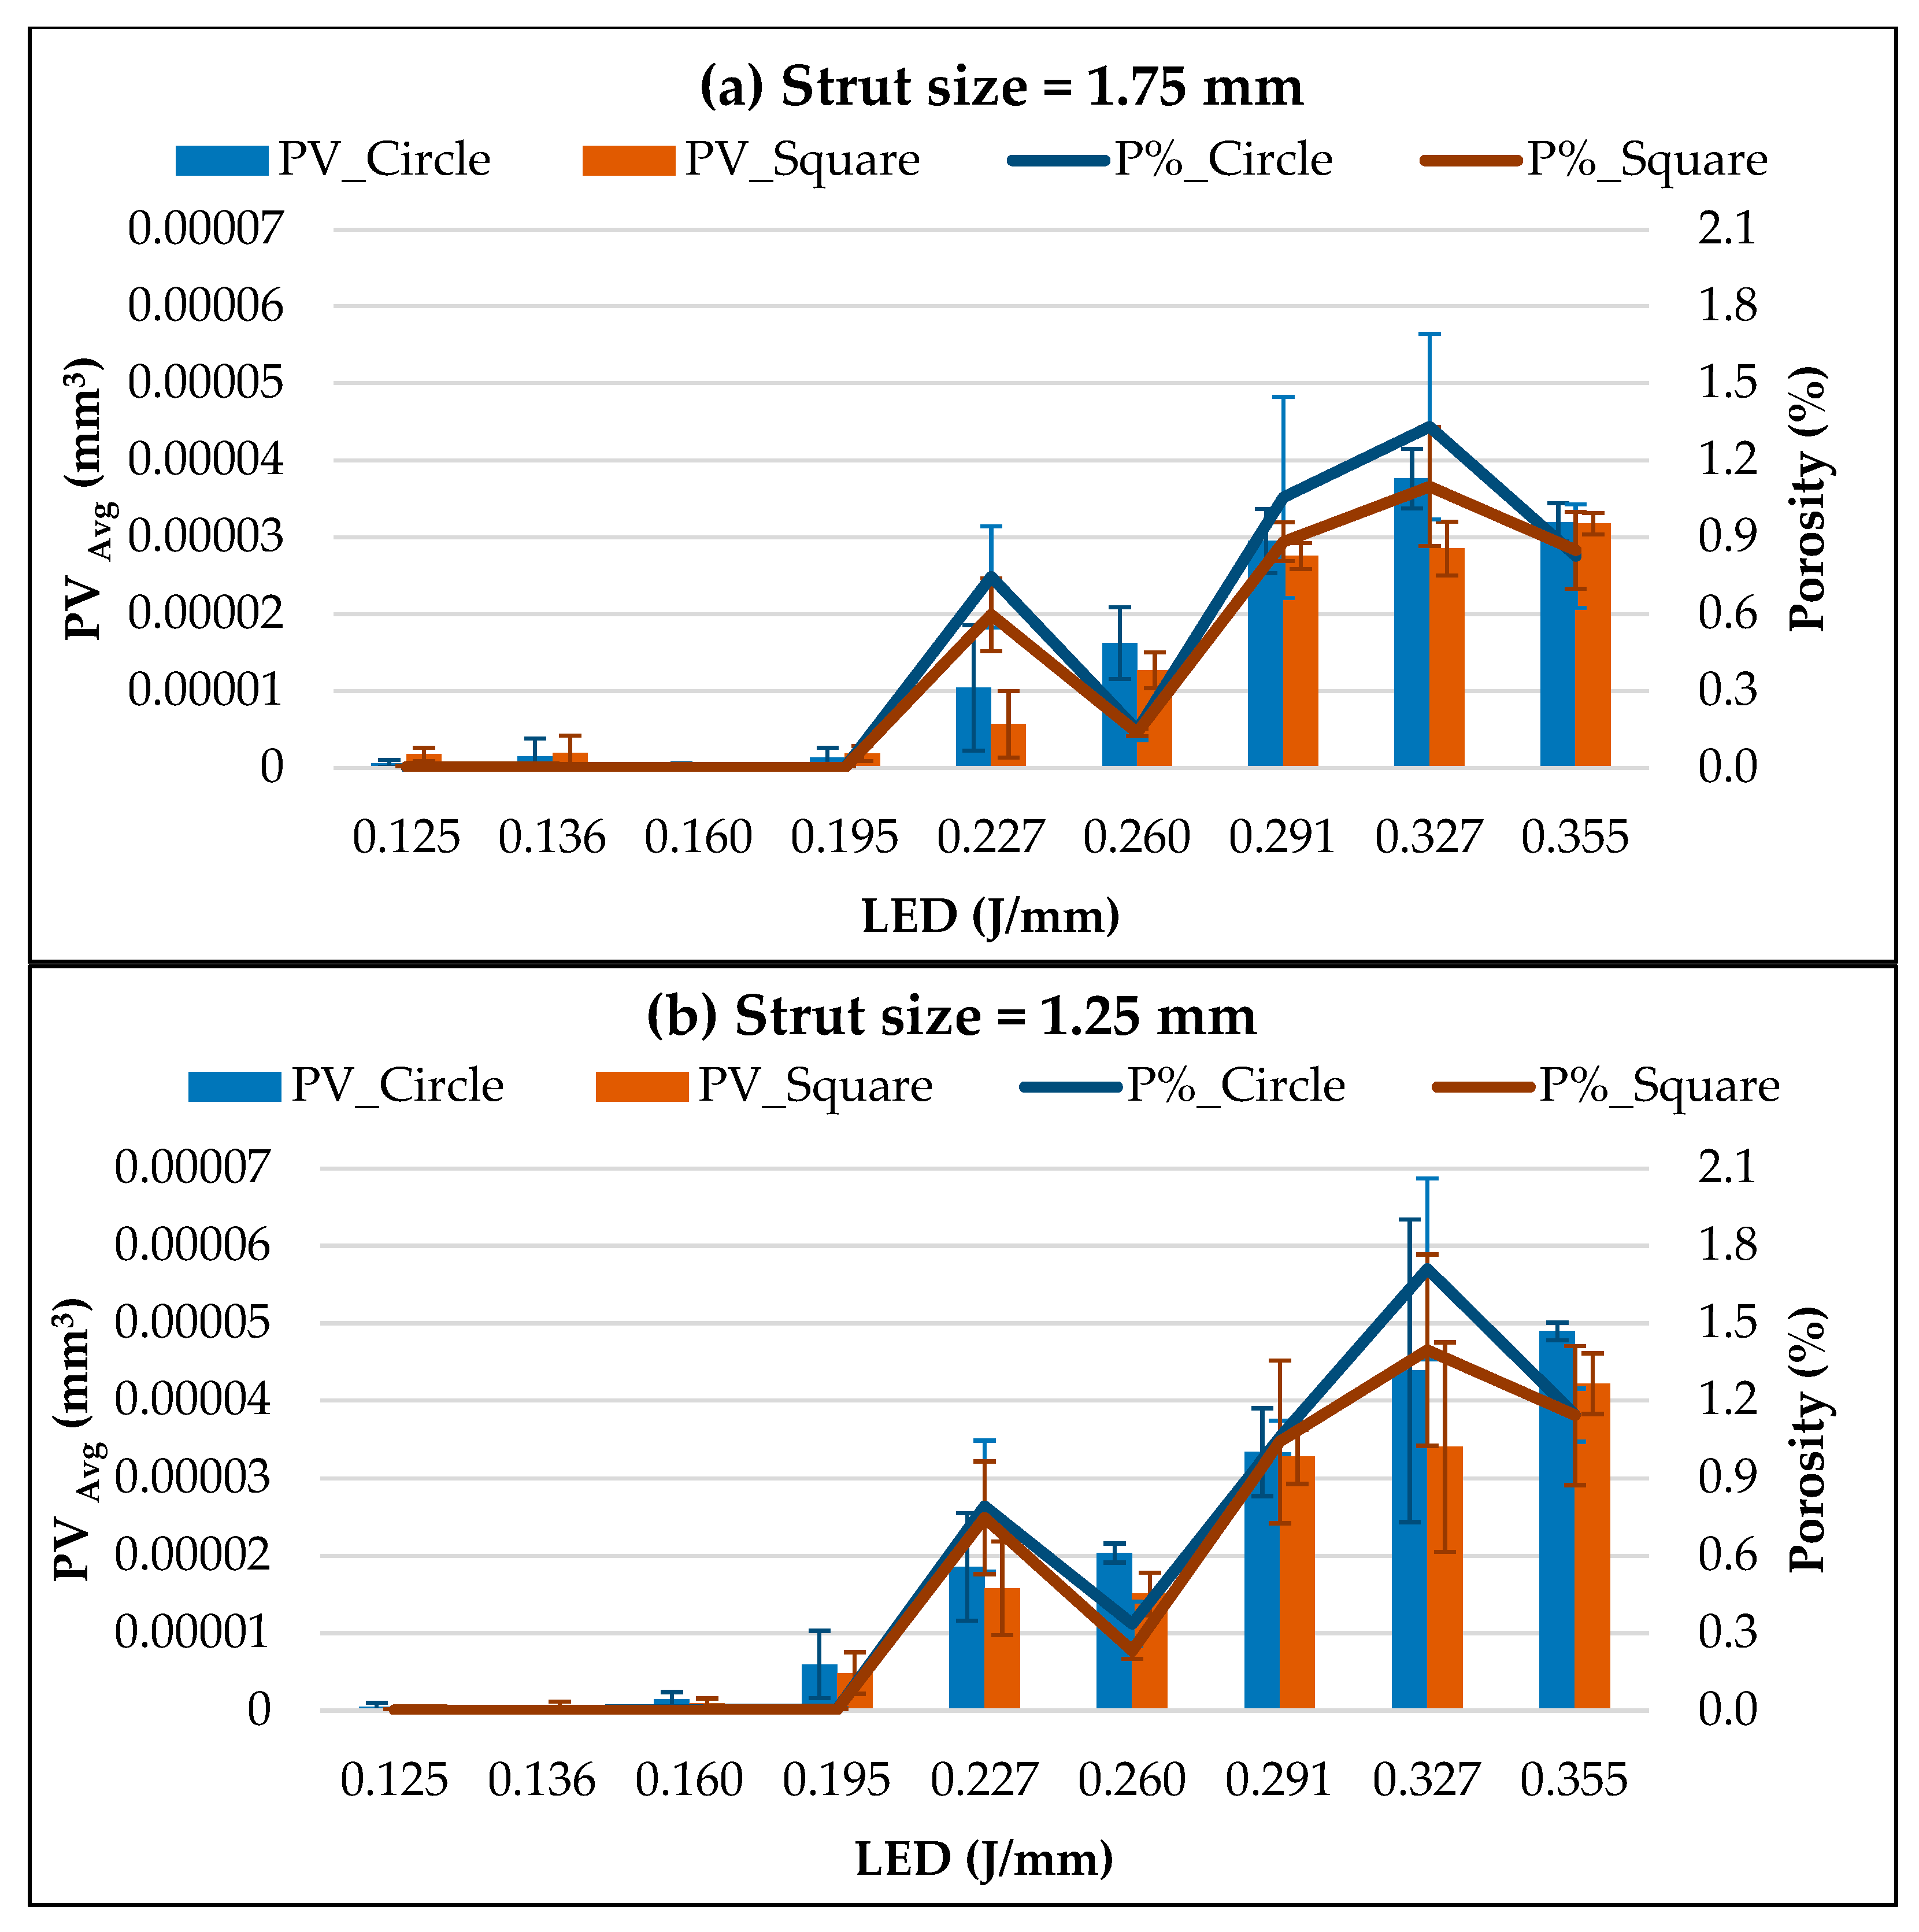
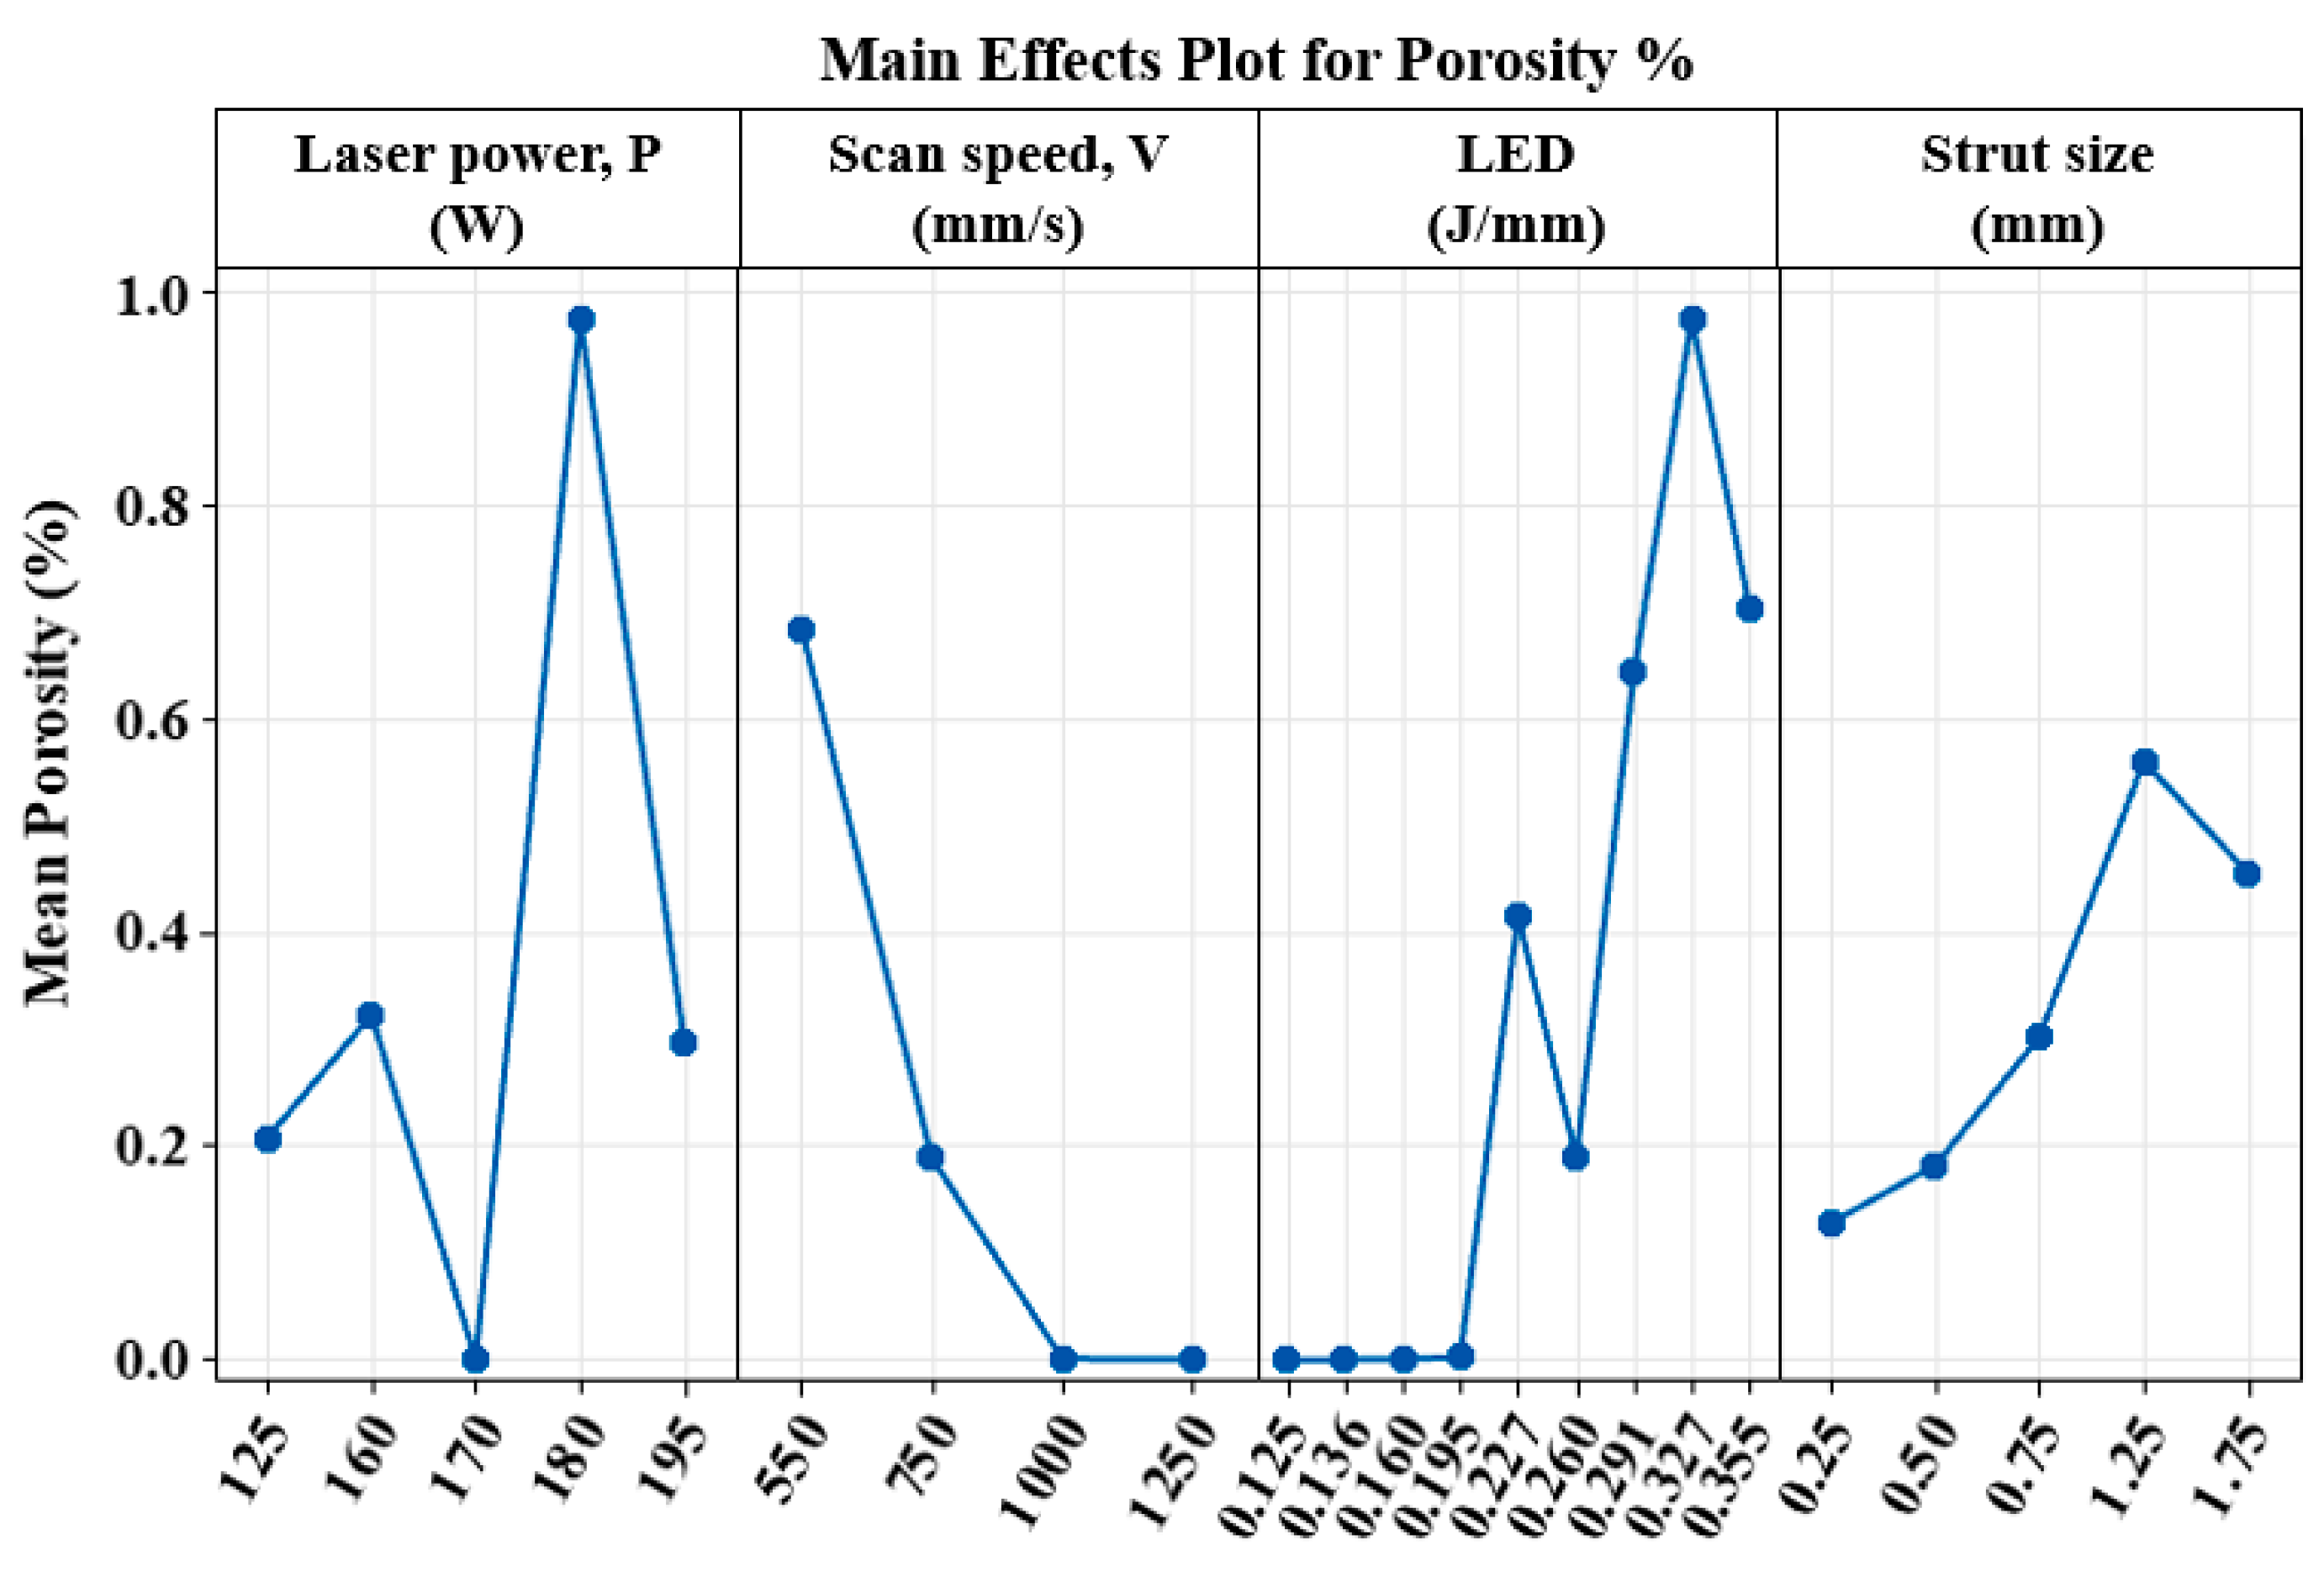
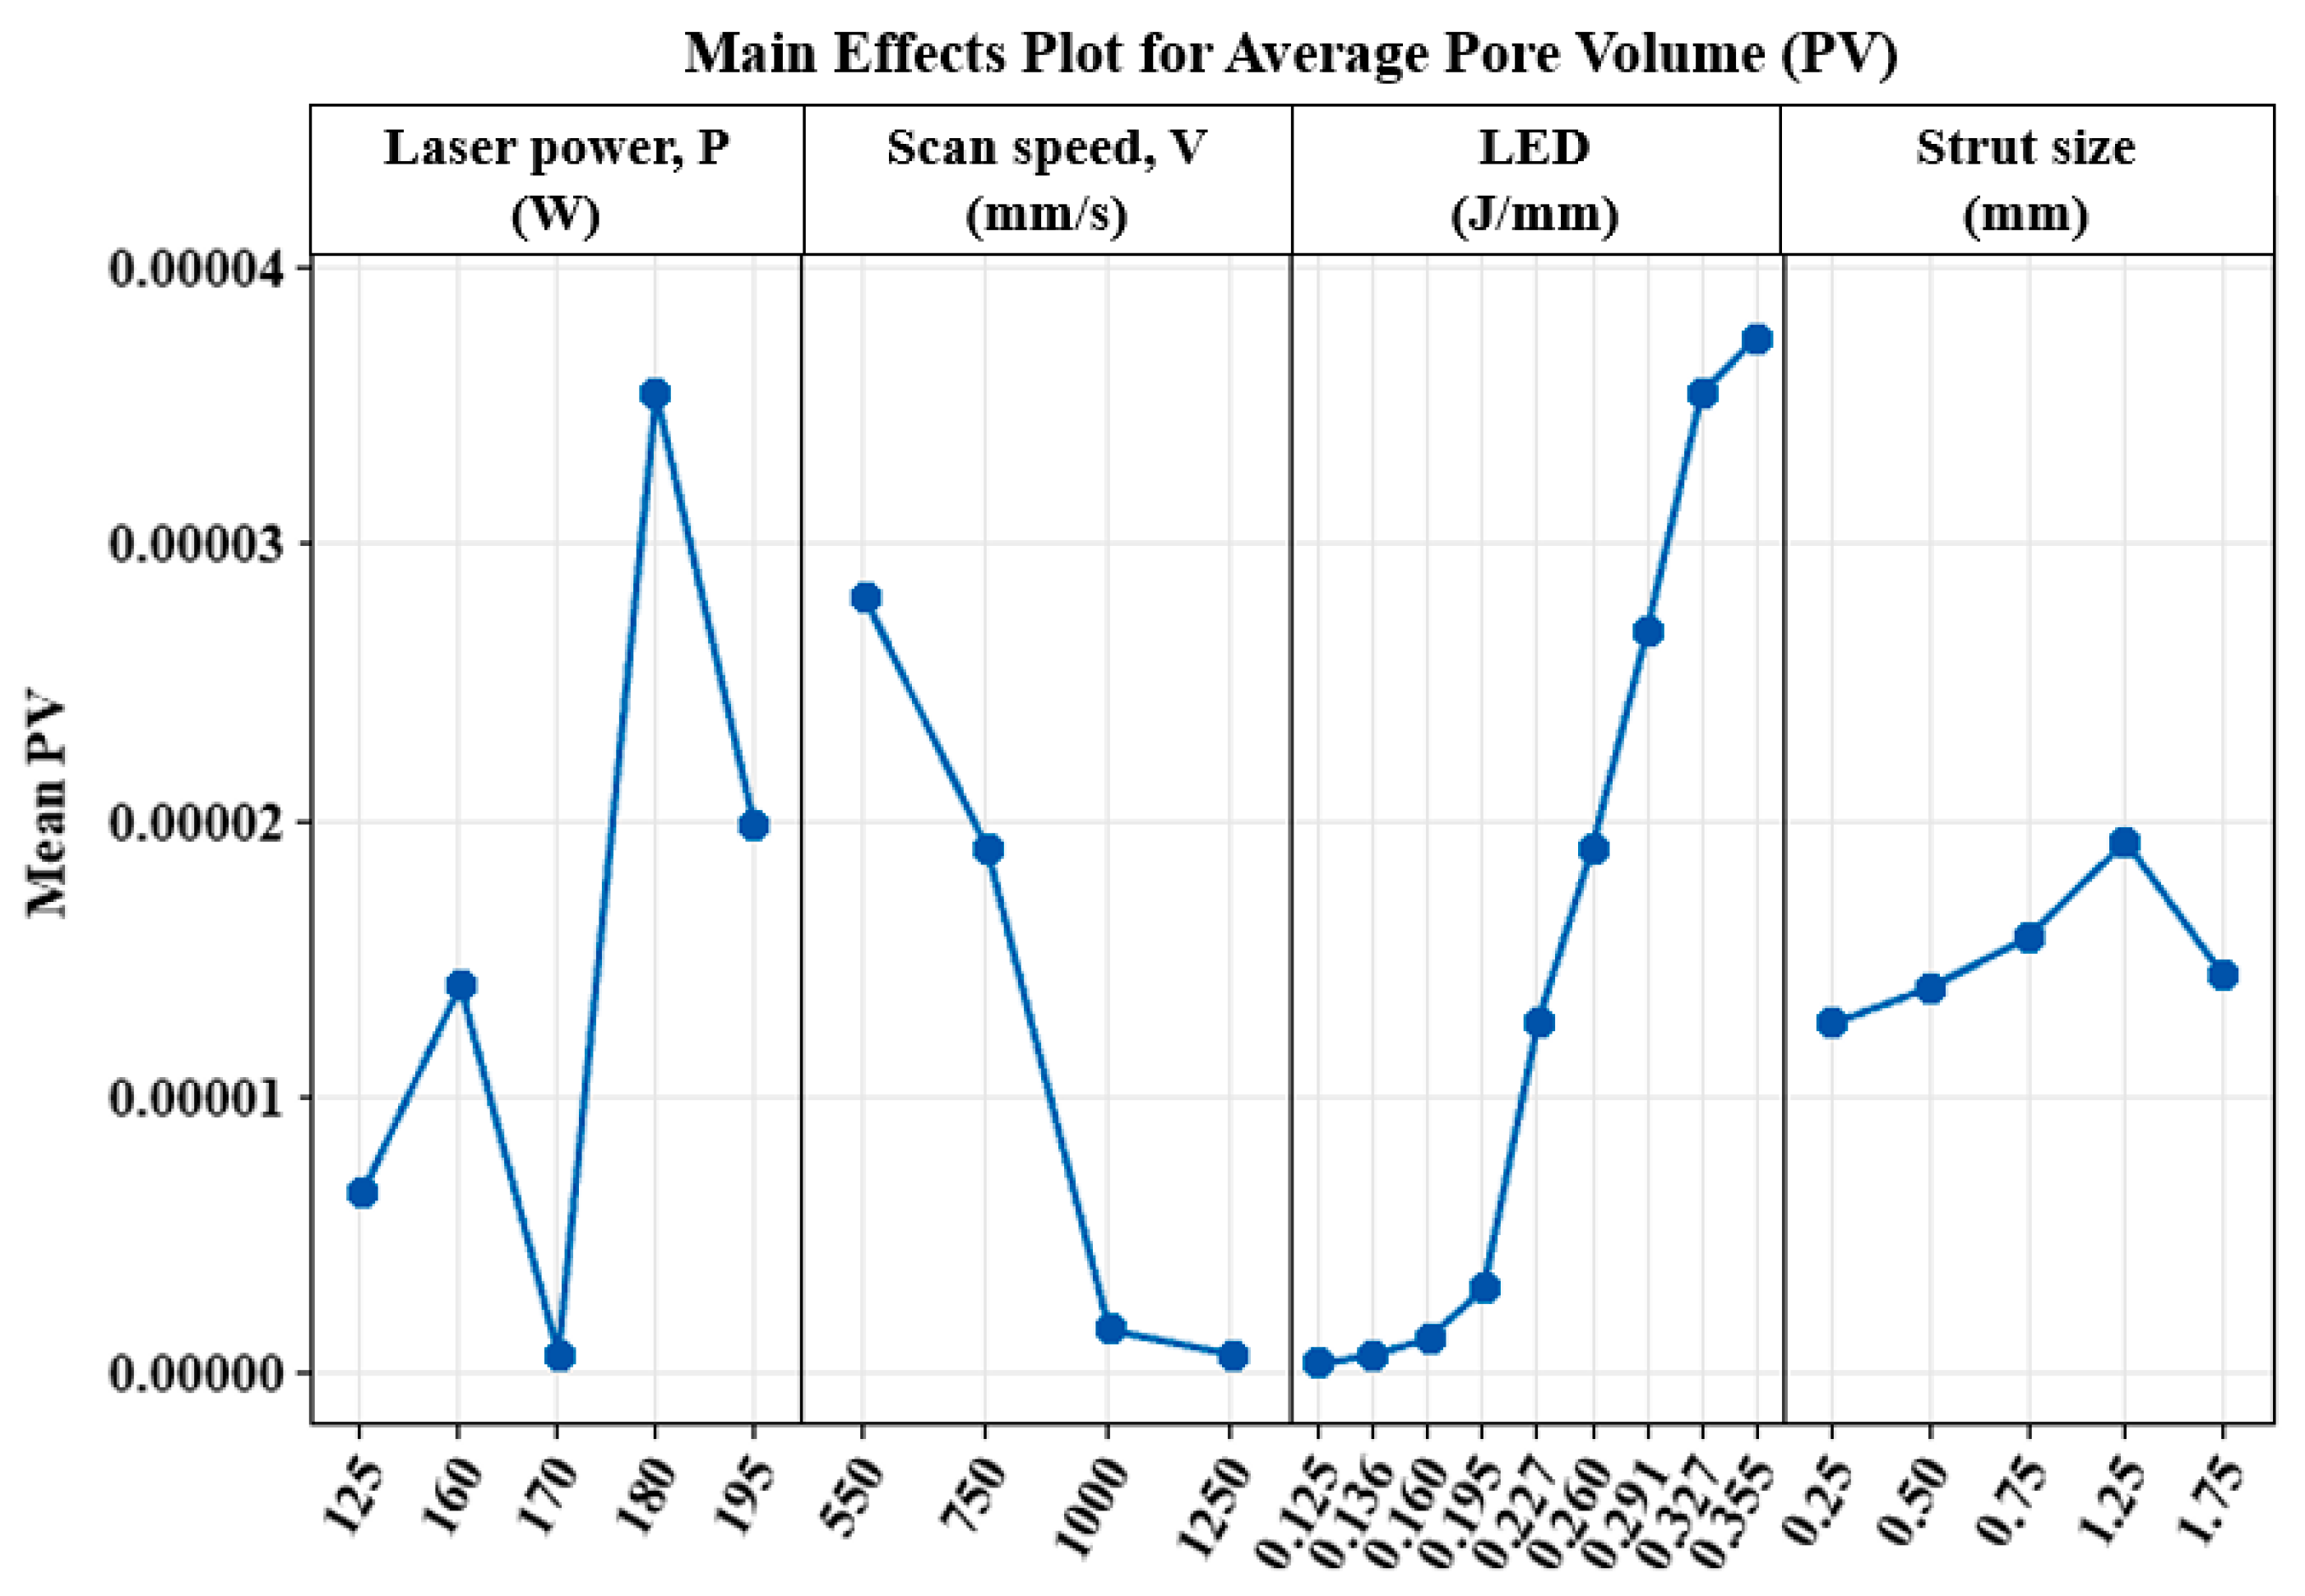
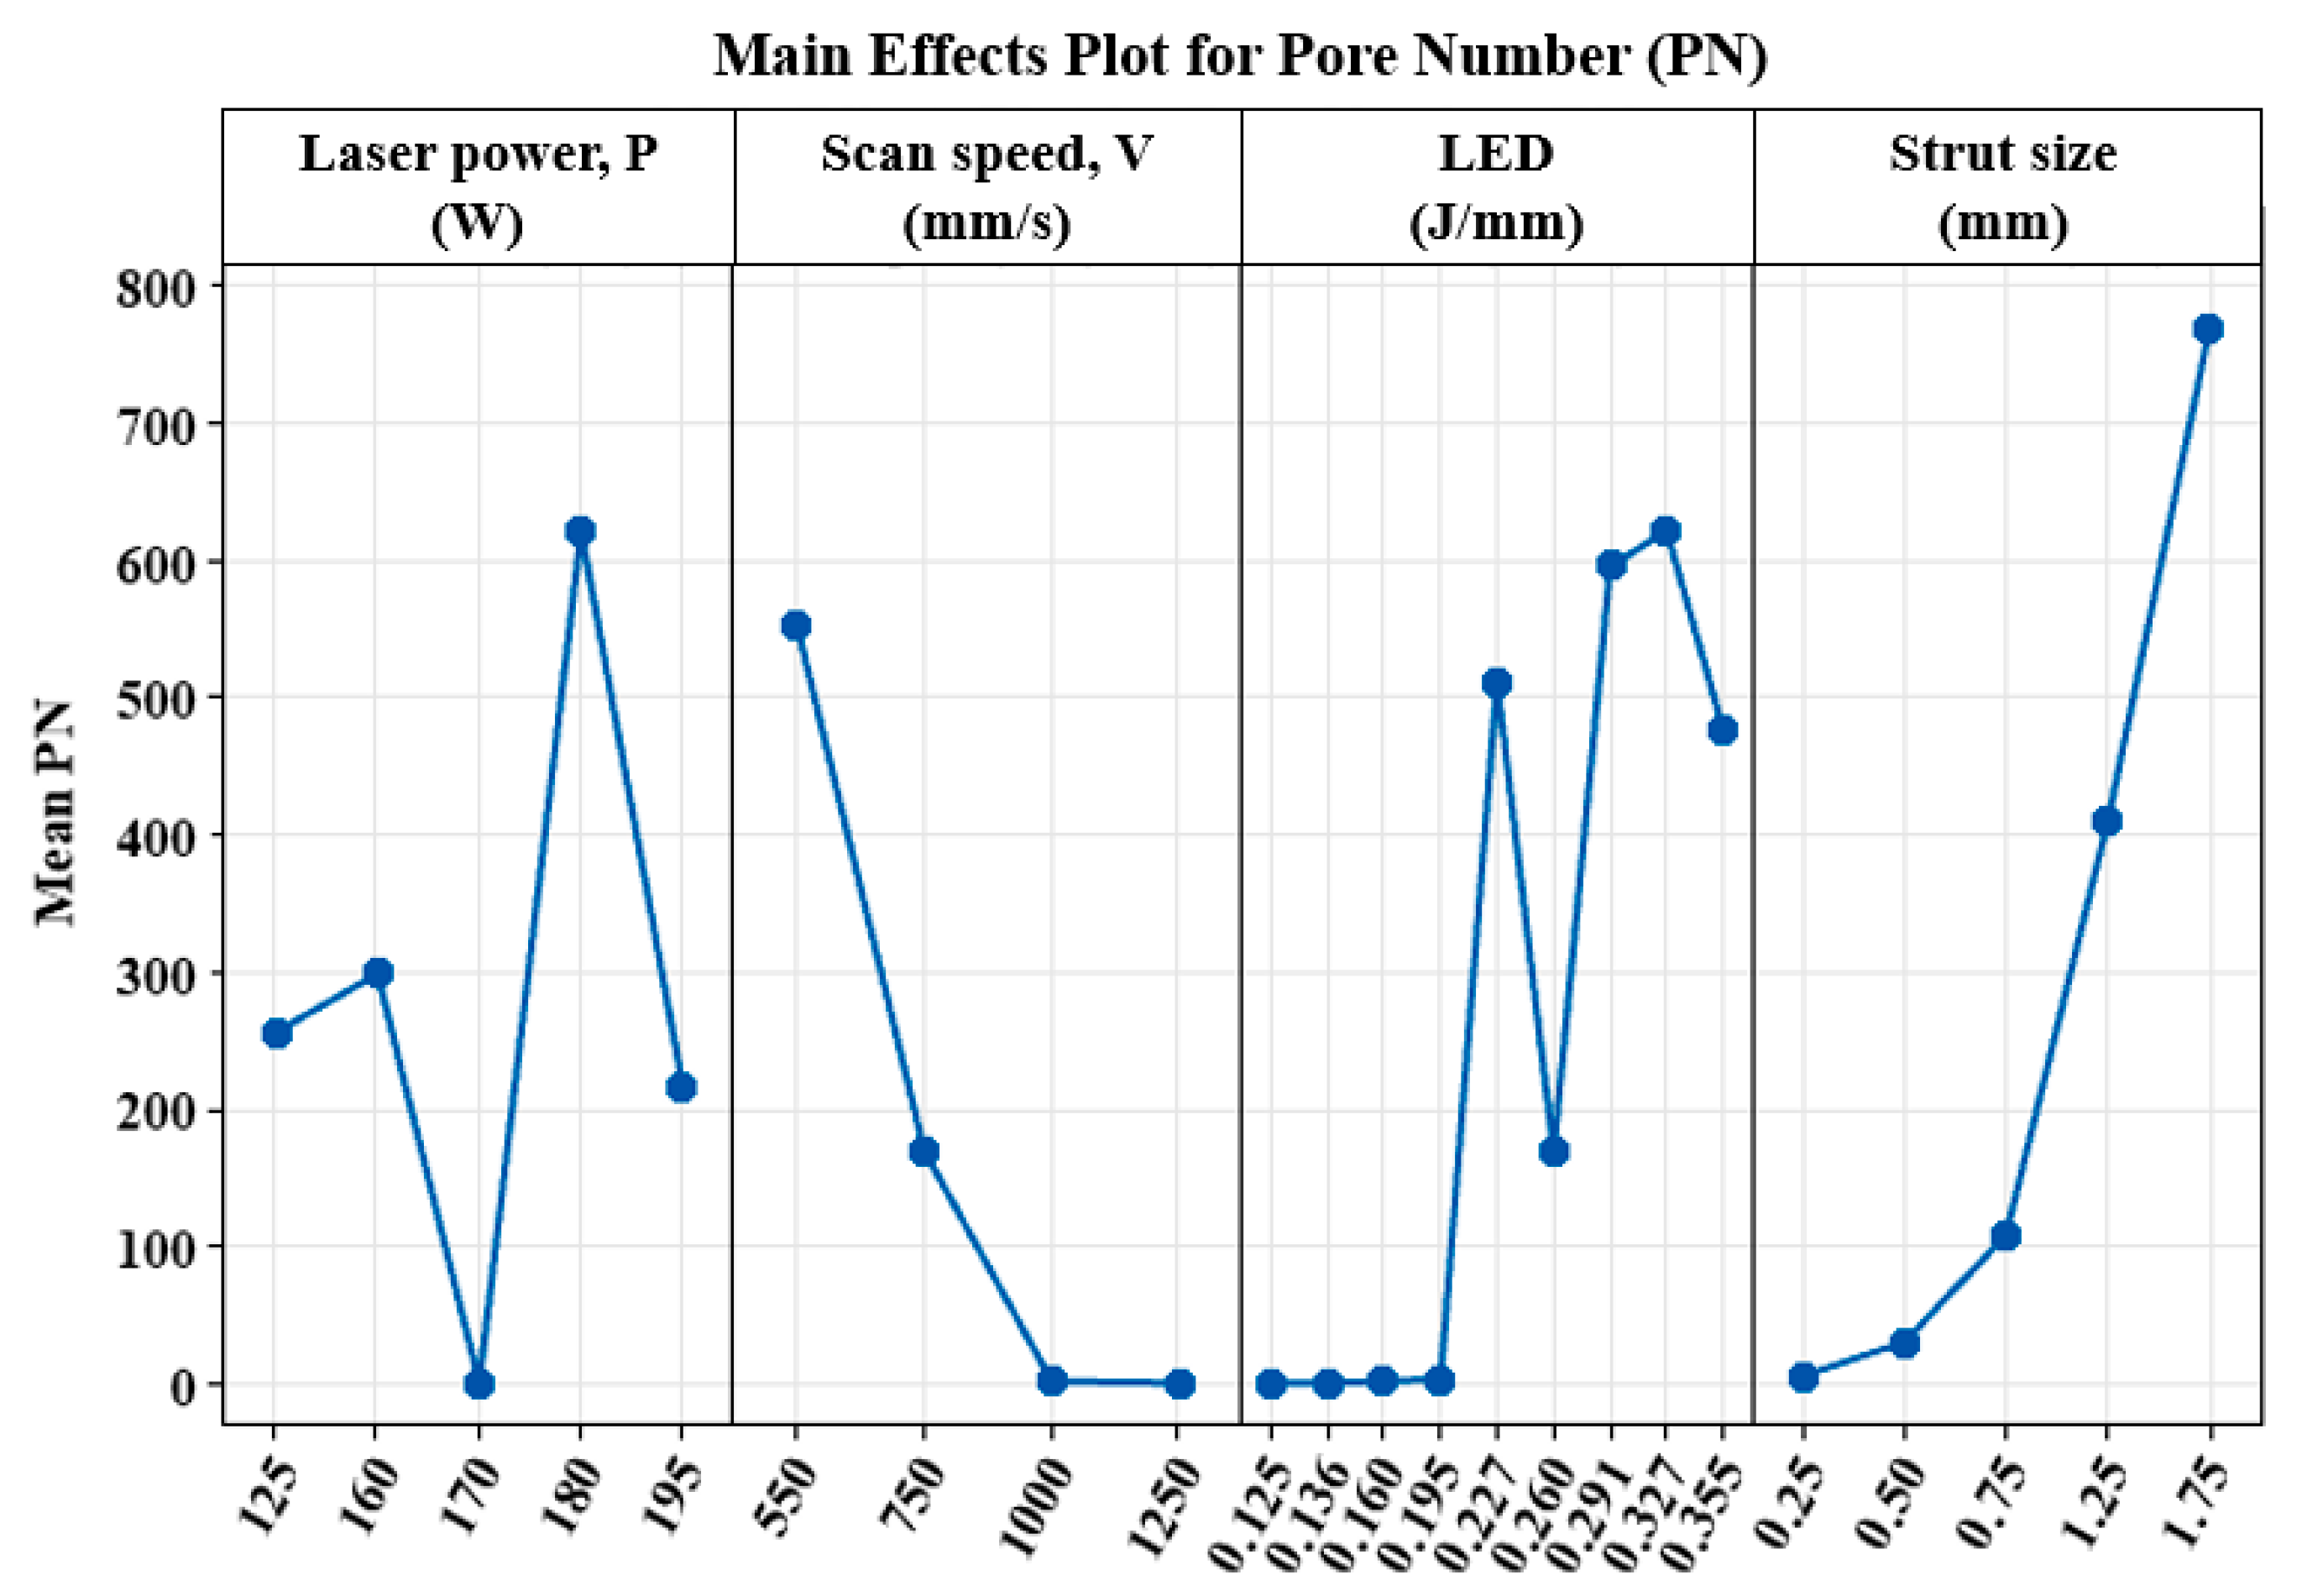
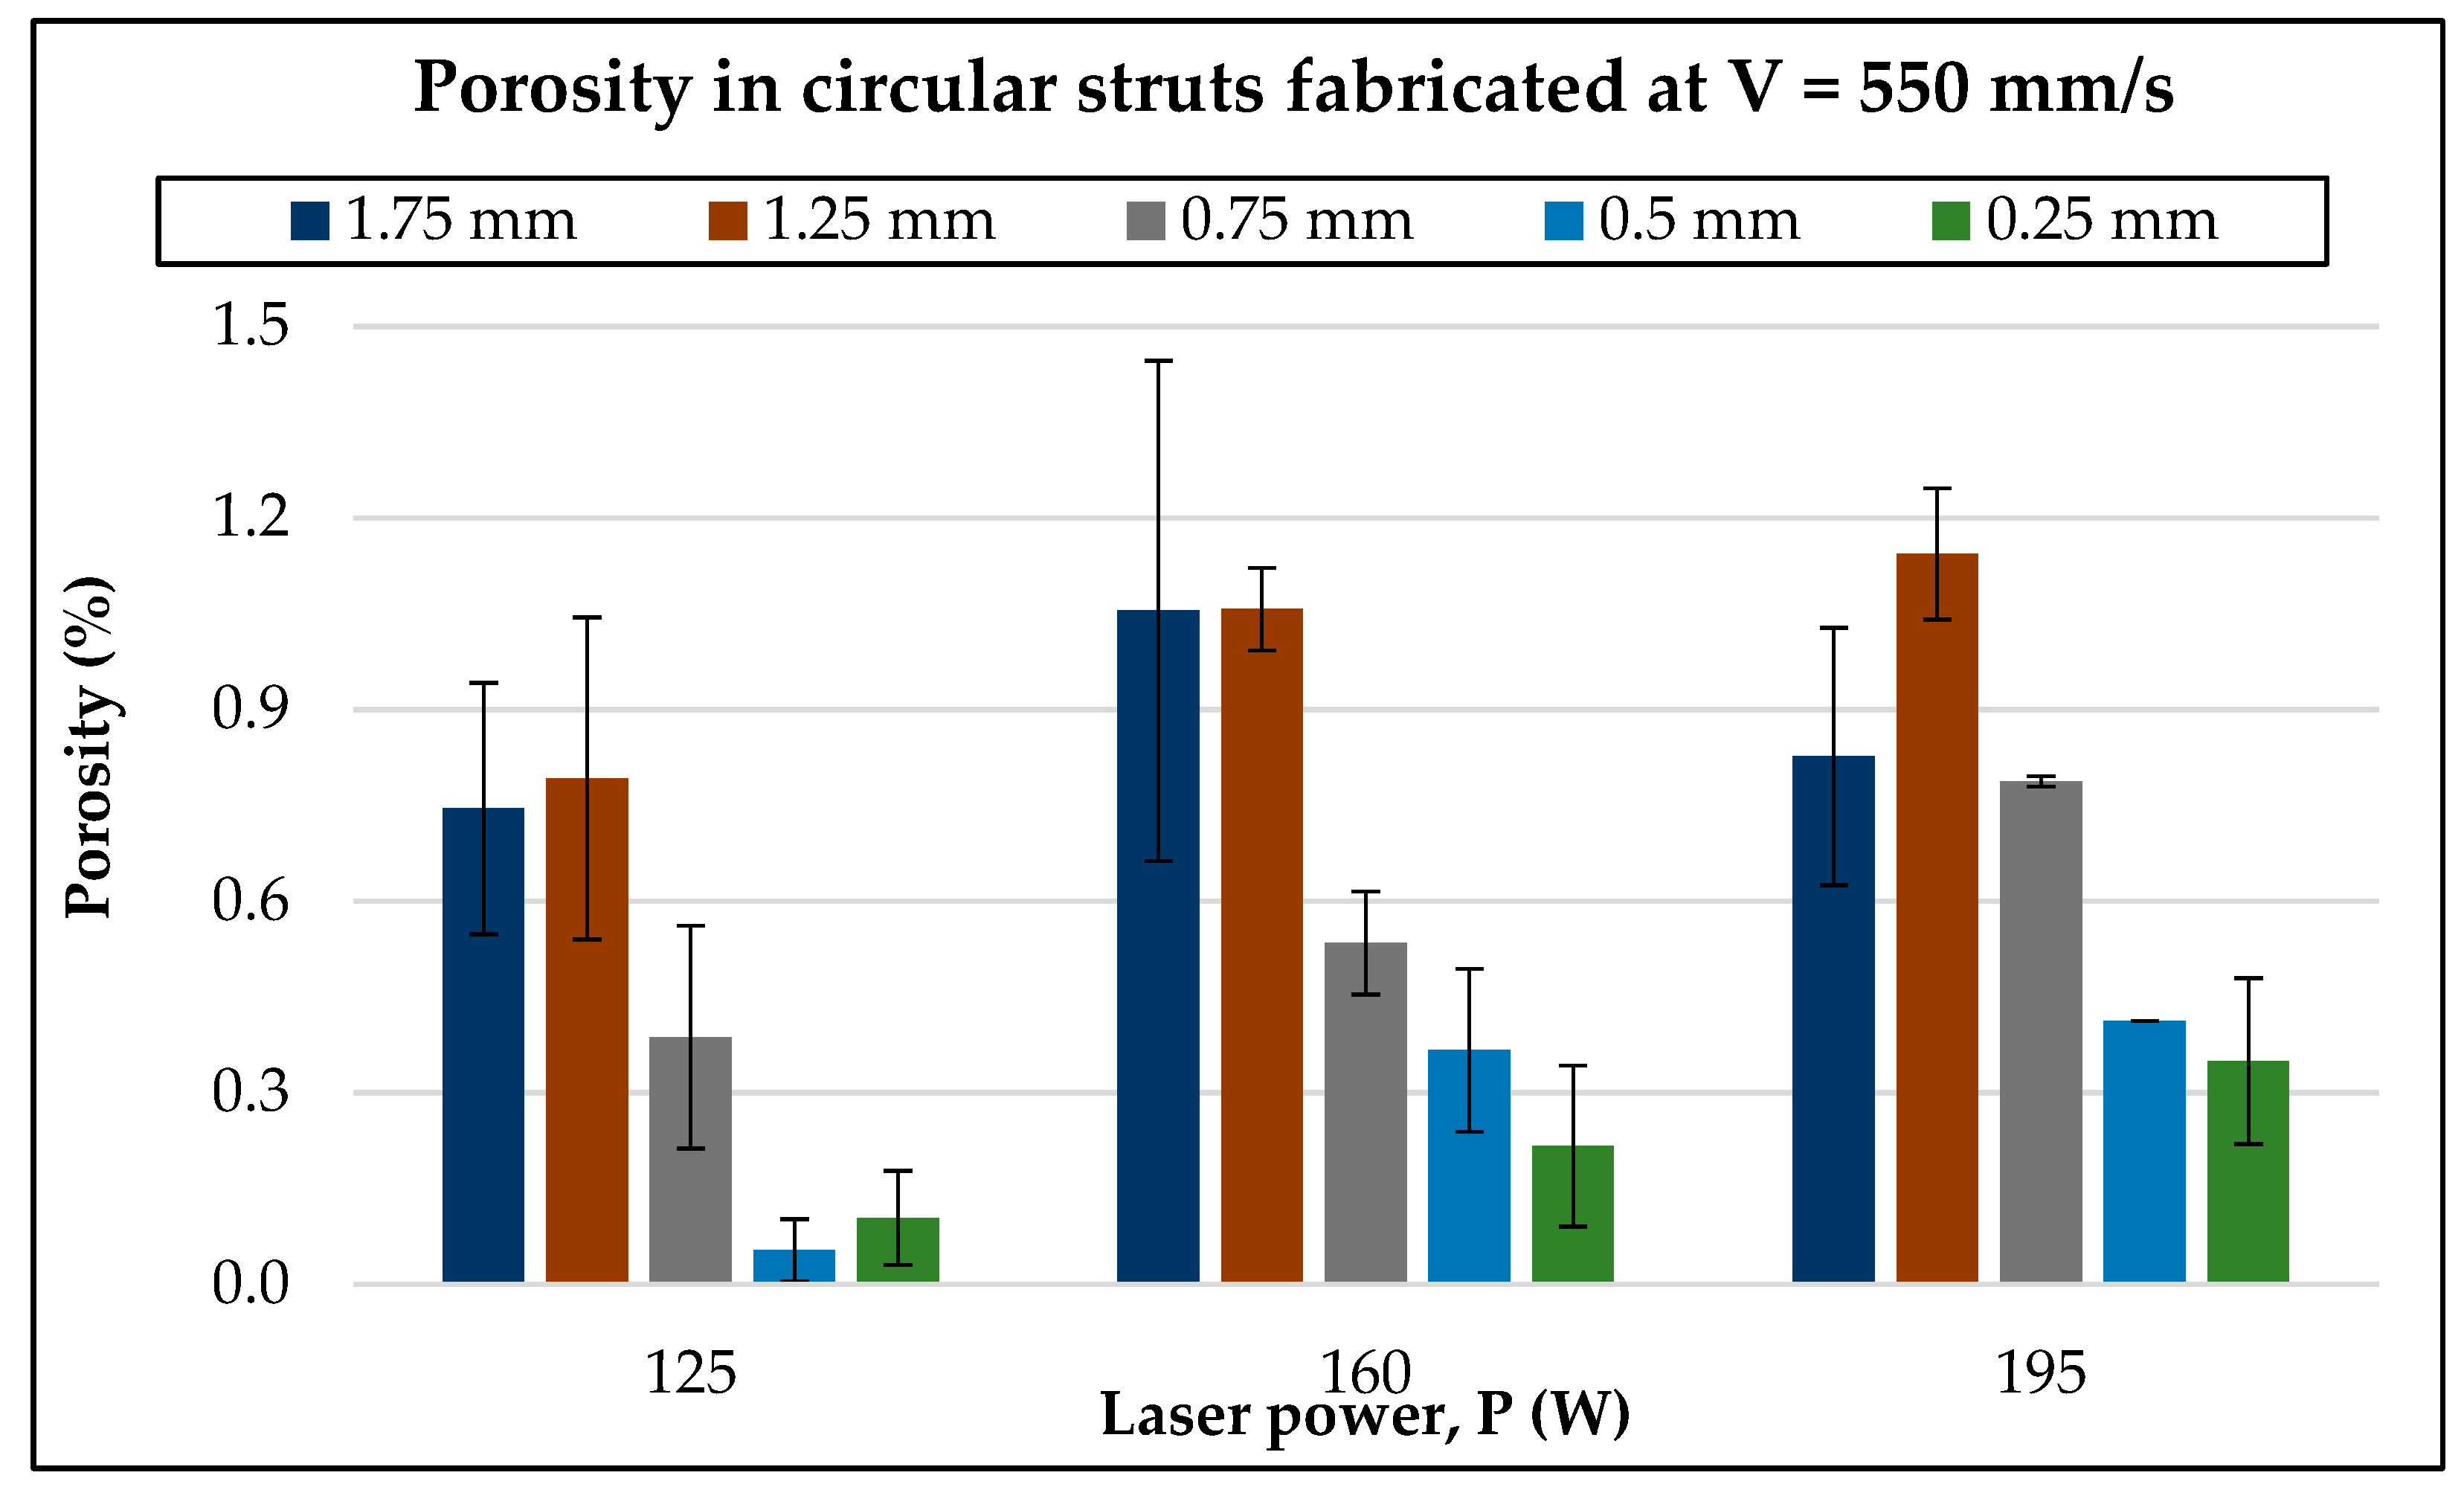
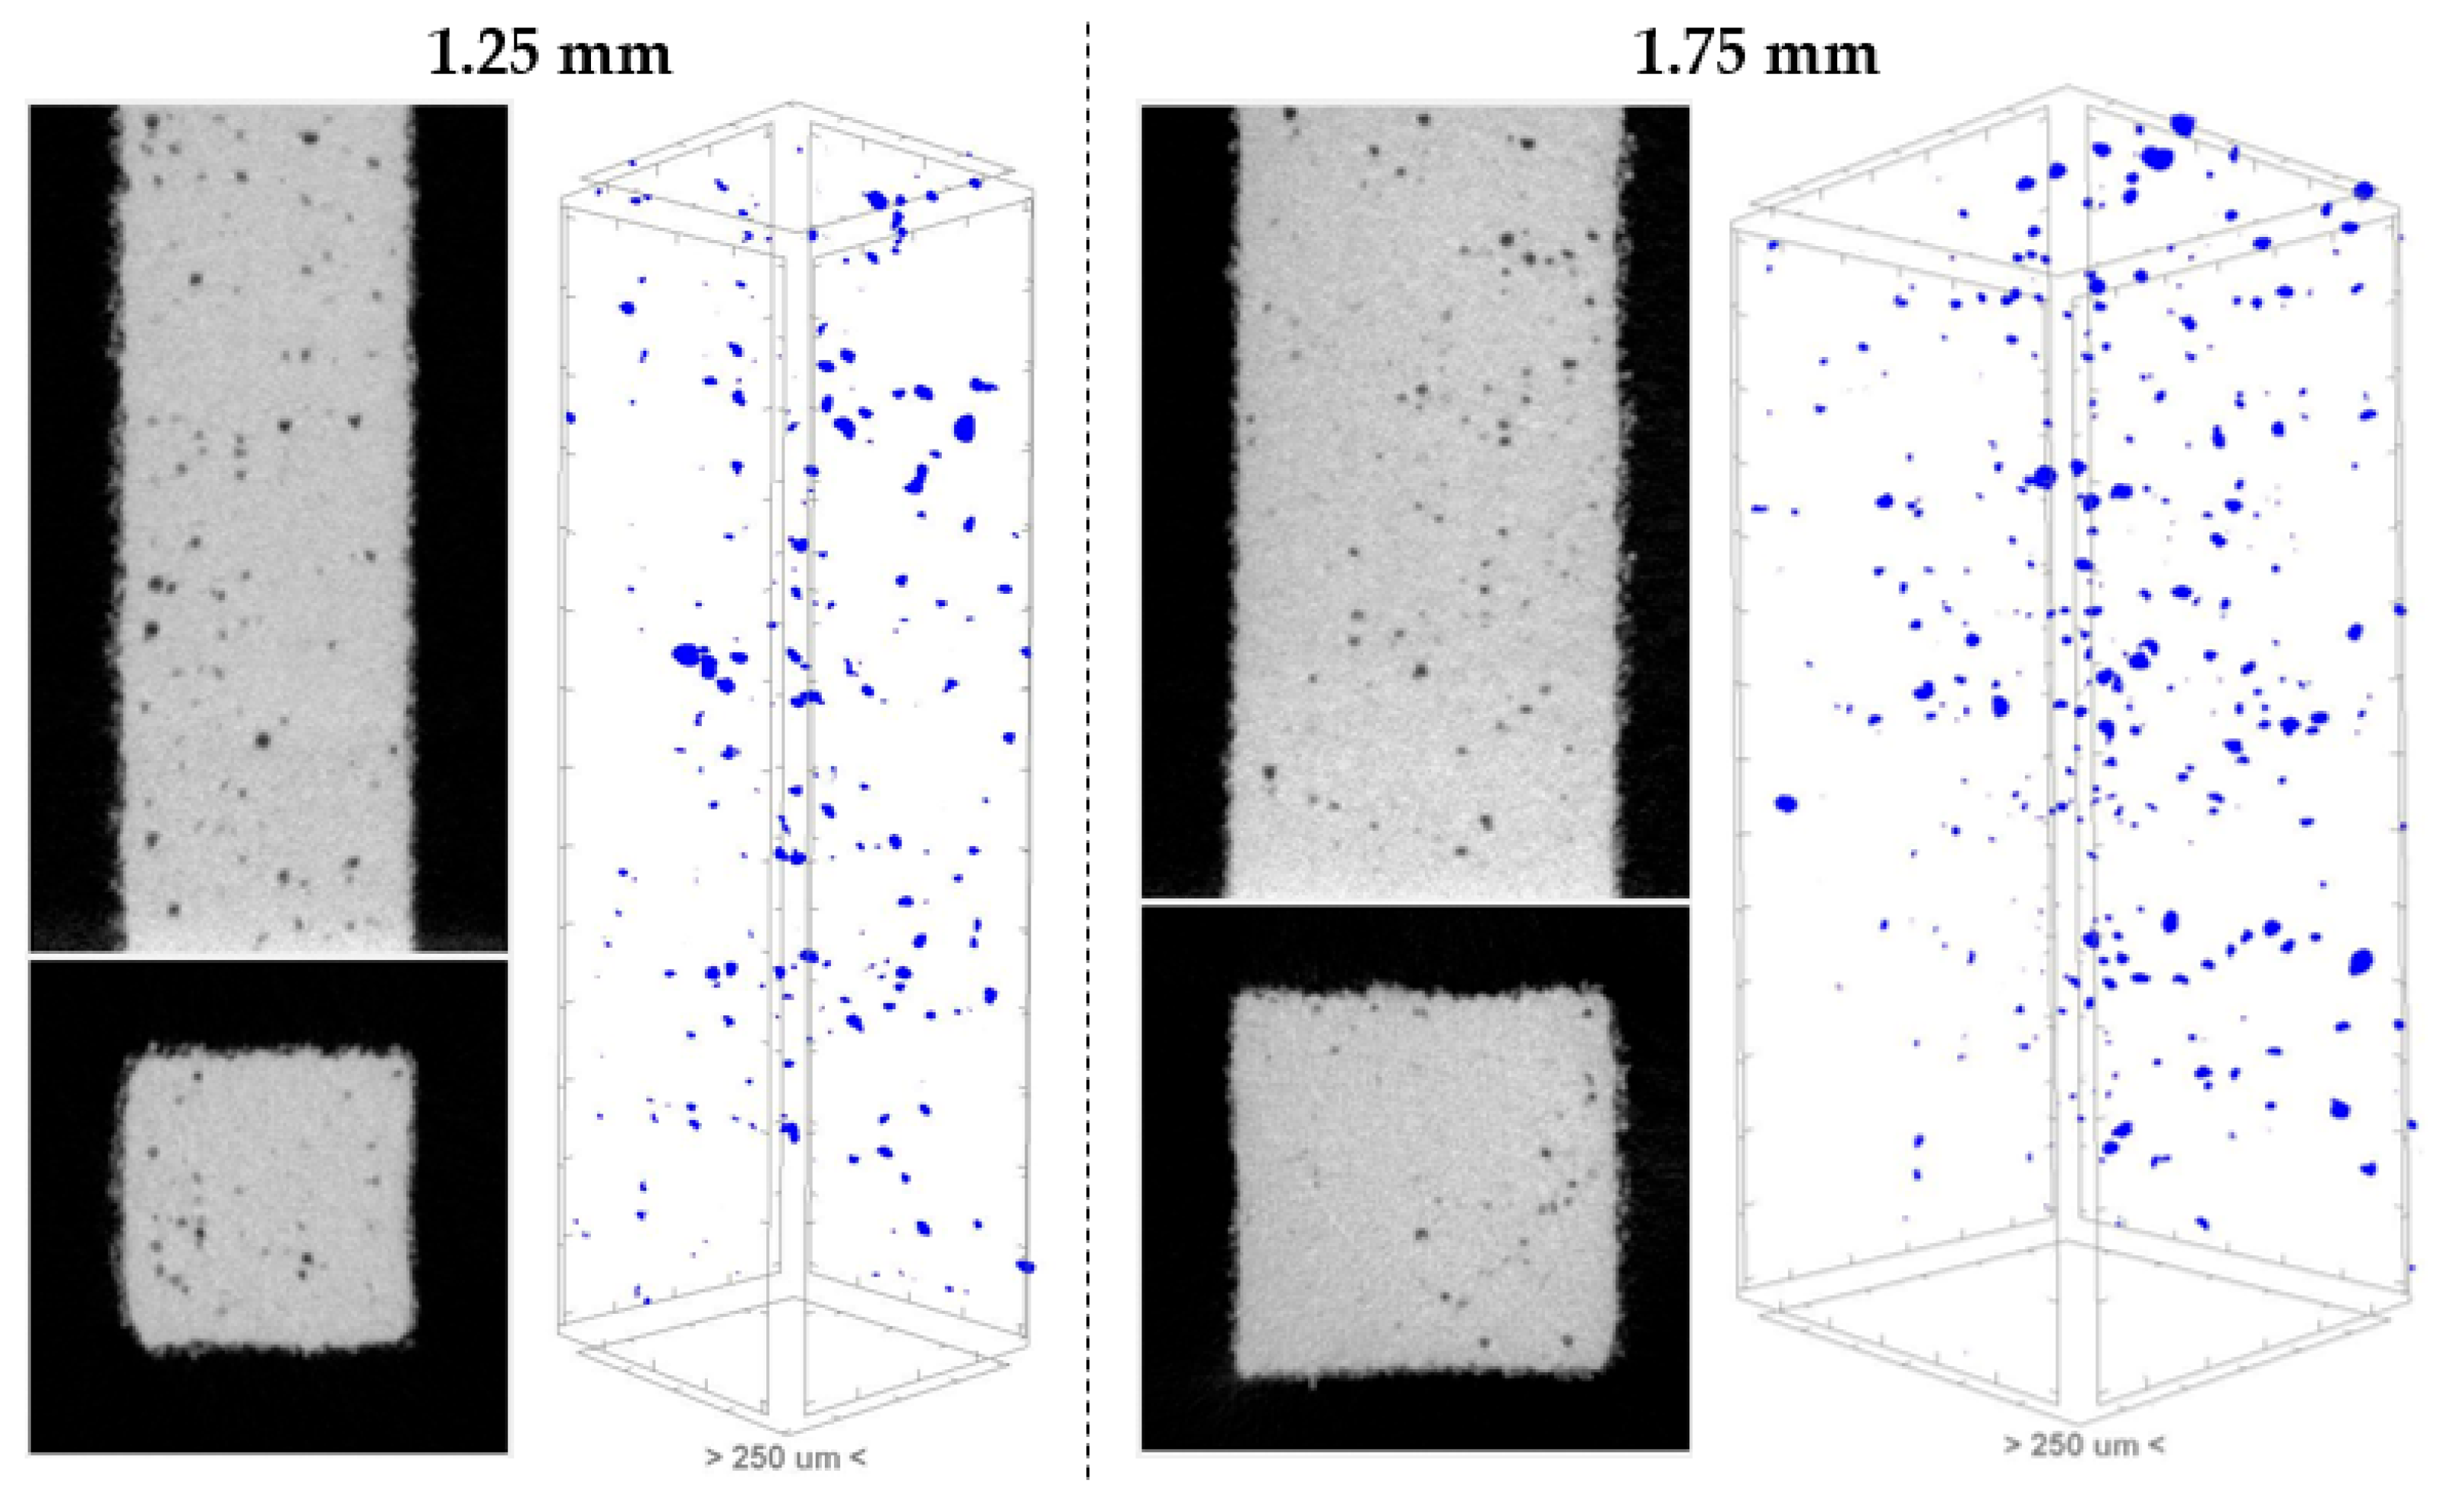
3. Results and Discussion

To understand the effects of the input LED, the 2D images of 0.75 mm circular struts built at various energy densities are shown in Figure 5. The cross-sectional images are taken through the center of the strut along (0.375 ± 0.007 mm) and across (1.85 ± 0.007 mm) the strut length. The struts are fully dense with a minimum or no pores when the linear energy density is lower than 0.195 J/mm. With the increase in the LED, there is a noticeable change in the number of pores as well as the pore size.
The 3D images of 0.75 mm square struts built with 0.195 J/mm and higher are shown in Figure 6. Although the variations in pore volume and number with the LED are visually apparent, the images do not show a linear increase in pore number with an increase in the LED. When the LED increases from 0.195 J/mm to 0.227 J/mm, the number of pores increases; when the LED increases further to 0.260 J/mm, the number of pores is reduced. The pore number then increases up to the strut built with 0.327 J/mm LED and subsequently decreases for the one with the highest LED of 0.355 J/mm. This indicates that the porosity cannot be evaluated based on the LED alone. Quantitative measurements based on statistical analysis of the laser power and scan speed are hence necessary.
The 3D images of the different-sized square struts built with 0.327 J/mm are shown in Figure 7 to portray the size effect on porosity. The larger the size, the pore number seems to increase significantly in the images. The porosity distribution shows no trend along or across the strut height. The sphericity of the pores formed on all struts is above 0.8 (sphericity = 0.833 ± 0.003), indicating they are nearly spherical in shape. The near-spherical shape and random distribution of pores in Figure 6 and Figure 7 indicate they are keyhole pores and not the lack of fusion pores.
The average pore volume (PVAvg) and porosity percentage (P%) are plotted against the linear energy density for all sizes of struts in Figure 8a–e. The data confirm that the porosity is negligibly low for the struts fabricated with an LED less than 0.195 J/mm. The reason is the lower magnitude of the keyhole effect at lower LEDs. From 0.195 J/mm to 0.227 J/mm, both the porosity percentage and pore volume increase. However, a further rise in the LED to 0.26 J/mm resulted in a decrease in the porosity percent for the 1.75 mm, 1.25 mm, and 0.75 mm struts. After that, until 0.327 J/mm, the porosity percentage linearly increases. For all strut sizes, the porosity percentage decreases when the LED changes from 0.327 J/mm to 0.355 J/mm. Thus, in all cases, the porosity percentage is high at the LED of 0.327 J/mm. The pore volume is increasing with the LED in most cases. However, the difference in the pore volume of struts with LEDs of 0.327 J/mm and 0.355 J/mm is minimal.
The patterns in porosity% with the change in LED indicate the effect of individual contributions of different process parameters on the strut porosity. The melt pool behavior changes with changes in the laser power and scan speed. The LED does not correspond to the unique laser power and scan speed; hence, it cannot be used individually for parameter effect analysis [40]. It is, hence, important to analyze the individual effects of laser power and scan speed on thin strut porosity. To understand the effects of laser power and scan speed separately, along with the effects of the LED, main effect plots were generated from the statistical analysis of circular strut data.
Figure 9, Figure 10 and Figure 11 show the main effect plots for the porosity percentage, average pore volume, and pore number obtained from circular strut porosity data. As both square and circular struts exhibit nearly identical data trends and values across the measured parameters (see Figure 8a–e), the main effect plots for each shape are effectively the same. Therefore, presenting the results for one geometry sufficiently represents both and avoids redundancy in the graphical analysis. Unlike the differences in the porosity percentage data, the average pore volume is increasing with an increase in the LED. This change is abrupt when the LED changes from 0.195 J/mm to 0.227 J/mm. It can be attributed to the change in scan speed from 1000 mm/s to 550 mm/s for those sets of LEDs [37].
A high LED increases the melt pool temperature, which causes material evaporation, leading to vapor column formation. The size of the vapor column depends on the input LED. The collapse of the larger vapor column can lead to larger pores, and the collapse of a narrower vapor column leads to smaller pores [37]. The largest pore volume obtained is 45,000 µm3 at the LED of 0.355 J/mm, and the lowest pore volume of 210 µm3 was at 0.125 J/mm. The average diameter of the pores formed is 18.38 ± 12 µm, with the largest and smallest pore diameters of 7.37 and 44.13 µm. Even though the largest average pore volume is at 0.355 J/mm, the pore number is low at this LED, compared to the 0.327 J/mm case. This results in a greater total pore volume at 0.327 J/mm, thus giving a higher porosity percentage at 0.327 J/mm. Such variations in porosity with an increase in laser power beyond a certain level while keeping the same scan speed have been reported in the literature [37]. It happens because of the melt pool depth variations and keyhole instability. As the laser power increases or the scan speed decreases, the energy density may become high enough for the melt pool to stabilize. This can allow the keyhole to reach a quasi-steady state. In small struts, short scan lengths often keep the melt pool in a transient state, preventing the keyhole from stabilizing enough to consistently trap gas, especially as the strut size gets smaller. At very high energy densities, the greater fluidity and longer melt duration can help gas bubbles escape before solidification, reducing the porosity even with a higher power input. This shift from increasing to decreasing porosity with higher laser power relies on the dynamic stability of the keyhole and the melt pool’s ability to manage or release trapped gas. Both factors are greatly influenced by the interaction of the process parameters and the specific thermal conditions of small struts.
Figure 12 shows the porosity percentage data of struts built at a scan speed of 550 mm/s and with different laser power inputs. For all struts except 1.75 mm struts, there is an increase in porosity with laser power. In the main effect plots, with the laser power, the porosity is linearly increasing up to 180 W, except at 170 W. At 170 W, the porosity is low because it was used with a higher scan speed (1250 mm/s), which was the default parameter set. However, when the laser power increases from 180 W to 195 W, there is a steep decrease in porosity. The influence of the laser power, P, on keyhole porosity due to melt pool instabilities can be explained by Equation (5), where the peak temperature of the melt pool, Tmax, is correlated to the absorptivity, A, Gaussian beam half width, σ, laser intensity, I, thermal diffusivity, D, thermal conductivity, k, and scan speed, v [41]. The Tmax in a melt pool is directly proportional to the laser intensity, I, and is indirectly proportional to the square root of the scan speed, v. Since I is a function of P (I = P/2πσ2), the laser power is the most influential parameter that determines the maximum melt pool temperature. At high melt pool temperatures, keyhole melting occurs, and the changes in keyhole porosity can be attributed to the variations in keyhole stability across the power levels used [37].
T m a x = 2 A I σ k π tan 1 2 D v σ
Figure 13 shows the porosity percentage data of struts built at 195 W laser power and different scan speeds. There is a reduction in porosity for all struts when the scan speed changes from 550 mm/s to 1000 mm/s. Shrestha et al. [37] reported a decrease in pore frequency with an increase in scan speed on single tracks deposited at lower LEDs. A lower scan speed increases the heat input intensity to the melt region, causing keyhole melting and subsequent pore formation [42]. The reduction in pore number indicates the reduction in severity of keyhole fluctuations due to a smaller melt pool depth at a high scan speed [43]. Figure 9, Figure 10 and Figure 11 also show that with an increase in scan speed from 550 mm/s to 1250 mm/s, the porosity is decreasing, with no noticeable difference between 1000 mm/s and 1250 mm/s. These results validate the low porosity percentage at 0.26 J/mm, with the combination of P = 195 W and V = 750 mm/s.
From Figure 8, Figure 9, Figure 10, Figure 11, Figure 12 and Figure 13, it is evident that, with strut size, the porosity percentage increases up to 1.25 mm and then decreases when the size is further increased to 1.75 mm. The 2D images at the center cross-section and the full view 3D images of 1.25 mm and 1.75 mm square struts built at 0.355 J/mm are shown in Figure 14. The images and the data reveal that even though the pore number is large in the 1.75 mm strut, the pore size is smaller compared to those in the 1.25 mm strut. The average pore volume is in a close range for all the struts of different sizes. The pore number is linearly increasing with strut size due to the volumetric change itself. This variation in keyhole porosity characteristics with strut size can also be attributed to the underlying melt pool dynamics. In small struts, the short scan length keeps the melt pool in a transient state, preventing the keyhole from stabilizing and thus reducing the number of keyhole pores. As the strut size increases, the melt pool has sufficient time and length to reach a quasi-steady state, stabilizing the keyhole and increasing the potential for gas entrapment and a larger number of pores. This can be leveraged for porosity control by tailoring the process parameters to the strut size. For small struts, higher LEDs than those used for bulk parts can be applied to ensure full melting without significant keyhole porosity, since the keyhole does not stabilize enough to trap gas persistently. On the other hand, for larger struts, process parameters should be selected to avoid excess energy input that could stabilize the keyhole and increase porosity.
From Figure 8, the average pore volume is higher for the square struts at 1.75 mm and 1.25 mm than the circle struts. This suggests that the square strut geometry may undergo less uniform heat dissipation and more localized overheating, resulting in larger pores. For 0.75 mm and 0.5 mm struts, the pore volume is nearly the same for both circle- and square-shaped struts, because the overall thermal gradients and melt pool dynamics become dominated by the small feature size rather than shape. For 0.25 mm struts, the circular struts show a higher average pore volume at a high LED range compared to square struts. This could be attributed to differences in the melt pool stability and the ability of the keyhole to reach a quasi-steady state, which may be more easily disrupted in circular cross-sections at such small scales and high energy input.
In summary, the keyhole porosity was severe at high LEDs in the thin struts fabricated by L-PBF, and thus, it may be desirable to lower the LED, which may not provide an optimal process condition and, worse yet, generate other types of defects, e.g., lack of fusion pores at a lower laser power [36]. On the other hand, the results demonstrate that the keyhole porosity decreases with decreasing strut size, e.g., from 1.25 mm to 0.25 mm, because of shorter scanning lengths. Therefore, instead of decreasing the LED, it is plausible to avoid or minimize keyhole porosity by reducing the strut size (thus, the scan length), without risking the parts’ strength and quality. Additionally, no significant difference in porosity is observed between the circle- and square-shaped struts.

4. Conclusions

The objective of this research is to investigate how the feature size may influence keyhole porosity in the L-PBF processing of small struts in applications of lattice structure manufacture. An experimental study was conducted, including strut designs (varying the size and shape), L-PBF fabrications with a broad range of laser power and scan speed combinations, pore data acquisitions by micro-CT with image/data processing, and statistical analysis. The average pore volume, pore number, and porosity percentage from different strut sizes and processing parameters are thoroughly evaluated, which vary significantly with input LED. Overall, the keyhole porosity increases with increasing laser power and decreasing scan speed, whereas the pore size seems to be dependent on the input LED alone. Further, the keyhole porosity decreases noticeably with the decrease in the strut horizontal dimension, possibly due to the change in the scan length, namely, the size effect. For example, at 0.33 J/mm, the porosity of circular struts decreases from ~1.3% to ~0.7% when the strut diameter decreases from 1.25 mm to 0.25 mm. On the other hand, there is no discernible difference in the porosity characteristics between circular and square shapes. The findings of this study may offer insights toward geometry and parameter selections, in the design and manufacture of lattice structures by L-PBF, to assure both the extrinsic and intrinsic characteristics, e.g., mechanical properties and porosity, respectively.
The future scope of this work is to evaluate a full factorial DOE, encompassing process parameters where the lack of fusion porosity dominates, to estimate the porosity in a broader range of parameters and diverse scan strategies. This will further aid in the parameter optimization and design attributes for thin feature fabrication for various applications. The scope expands to other materials and integrates in situ monitoring and numerical modeling to evaluate the size effect by studying the heat dissipation and melt pool characteristics. Moreover, the approach and methods adopted in this research may also apply to studies of inclined struts and other strut shapes. However, the pore distribution and overall porosity percentage may vary along the strut height due to potential changes in heat transfer over and under a slant overhang.

Author Contributions

Conceptualization, N.V.V.H. and K.C.; methodology, N.V.V.H. and K.C.; software, N.V.V.H.; validation, N.V.V.H.; formal analysis, N.V.V.H.; investigation, N.V.V.H.; resources, K.C.; data curation, N.V.V.H.; writing—original draft preparation, N.V.V.H.; writing—review and editing, K.C.; visualization, N.V.V.H.; supervision, K.C.; project administration, K.C.; funding acquisition, K.C. All authors have read and agreed to the published version of the manuscript.

Funding

This research was funded by the National Science Foundation, grant number CMMI-1921263.

Data Availability Statement

The original contributions presented in this study are included in the article. Further inquiries can be directed to the corresponding author.

Acknowledgments

The authors gratefully acknowledge the technical assistance of David Jaggers and Hamilton Bryan, Department of Mechanical Engineering, University of Louisville, KY, in this research work.

Conflicts of Interest

The authors declare no conflicts of interest.

References

  1. Schaedler, T.A.; Jacobsen, A.J.; Torrents, A.; Sorensen, A.E.; Lian, J.; Greer, J.R.; Valdevit, L.; Carter, W.B. Ultralight Metallic Microlattices. Science 2011, 334, 962–965. [Google Scholar] [CrossRef] [PubMed]
  2. Ashby, M.F. The properties of foams and lattices. Philos. Trans. R. Soc. A Math. Phys. Eng. Sci. 2006, 364, 15–30. [Google Scholar] [CrossRef]
  3. Vrána, R.; Koutný, D.; Paloušek, D.; Pantělejev, L.; Jaroš, J.; Zikmund, T.; Kaiser, J. Selective Laser Melting Strategy for Fabrication of Thin Struts Usable in Lattice Structures. Materials 2018, 11, 1763. [Google Scholar] [CrossRef] [PubMed]
  4. Evans, A.G.; Hutchinson, J.W.; Fleck, N.A.; Ashby, M.F.; Wadley, H.N.G. The topological design of multifunctional cellular metals. Prog. Mater. Sci. 2001, 46, 309–327. [Google Scholar] [CrossRef]
  5. Nakajima, H. Fabrication, properties and application of porous metals with directional pores. Prog. Mater. Sci. 2007, 52, 1091–1173. [Google Scholar] [CrossRef]
  6. Gibson, I.; Rosen, D.; Stucker, B. Additive Manufacturing Technologies: 3D Printing, Rapid Prototyping, and Direct Digital Manufacturing, 2nd ed.; Springer: Berlin/Heidelberg, Germany, 2015. [Google Scholar] [CrossRef]
  7. Weißmann, V.; Drescher, P.; Bader, R.; Seitz, H.; Hansmann, H.; Laufer, N. Comparison of Single Ti6Al4V Struts Made Using Selective Laser Melting and Electron Beam Melting Subject to Part Orientation. Metals 2017, 7, 91. [Google Scholar] [CrossRef]
  8. DebRoy, T.; Wei, H.L.; Zuback, J.S.; Mukherjee, T.; Elmer, J.W.; Milewski, J.O.; Beese, A.M.; Wilson-Heid, A.; De, A.; Zhang, W. Additive manufacturing of metallic components–Process, structure and properties. Prog. Mater. Sci. 2018, 92, 112–224. [Google Scholar] [CrossRef]
  9. Leuders, S.; Thöne, M.; Riemer, A.; Niendorf, T.; Tröster, T.; Richard, H.; Maier, H. On the mechanical behaviour of titanium alloy TiAl6V4 manufactured by selective laser melting: Fatigue resistance and crack growth performance. Int. J. Fatigue 2013, 48, 300–307. [Google Scholar] [CrossRef]
  10. Fotovvati, B.; Namdari, N.; Dehghanghadikolaei, A. Fatigue performance of selective laser melted Ti6Al4V components: State of the art. Mater. Res. Express 2018, 6, 012002. [Google Scholar] [CrossRef]
  11. Mullen, L.; Stamp, R.C.; Brooks, W.K.; Jones, E.; Sutcliffe, C.J. Selective Laser Melting: A regular unit cell approach for the manufacture of porous, titanium, bone in-growth constructs, suitable for orthopedic applications. J. Biomed. Mater. Res. Part B Appl. Biomater. 2009, 89B, 325–334. [Google Scholar] [CrossRef]
  12. Gong, H.; Rafi, K.; Gu, H.; Starr, T.; Stucker, B. Analysis of defect generation in Ti–6Al–4V parts made using powder bed fusion additive manufacturing processes. Addit. Manuf. 2014, 1–4, 87–98. [Google Scholar] [CrossRef]
  13. Maskery, I.; Aboulkhair, N.T.; Corfield, M.R.; Tuck, C.; Clare, A.T.; Leach, R.K.; Wildman, R.D.; Ashcroft, I.A.; Hague, R.J. Quantification and characterisation of porosity in selectively laser melted Al–Si10–Mg using X-ray computed tomography. Mater. Charact. 2016, 111, 193–204. [Google Scholar] [CrossRef]
  14. Spierings, A.B.; Schneider, M.; Eggenberger, R. Comparison of density measurement techniques for additive manufactured metallic parts. Rapid Prototyp. J. 2011, 17, 380–386. [Google Scholar] [CrossRef]
  15. Siddique, S.; Imran, M.; Rauer, M.; Kaloudis, M.; Wycisk, E.; Emmelmann, C.; Walther, F. Computed tomography for characterization of fatigue performance of selective laser melted parts. Mater. Des. 2015, 83, 661–669. [Google Scholar] [CrossRef]
  16. Wits, W.W.; Carmignato, S.; Zanini, F.; Vaneker, T.H.J. Porosity testing methods for the quality assessment of selective laser melted parts. CIRP Ann. 2016, 65, 201–204. [Google Scholar] [CrossRef]
  17. Maire, E.; Withers, P.J. Quantitative X-ray tomography. Int. Mater. Rev. 2013, 59, 1–43. [Google Scholar] [CrossRef]
  18. Rauniyar, S.; Chou, K. Transient Melt Pool Formation in Laser-Powder Bed Fusion Process. In Proceedings of the International Manufacturing Science and Engineering Conference, Virtual, 3 September 2020. [Google Scholar]
  19. Rauniyar, S.; Shrestha, S.; Chou, K. An Investigation Into Multi-Track Deposition in Laser Powder-Bed Fusion: Transient Regions Analysis and Scan Length Effects. In Proceedings of the ASME 2022 17th International Manufacturing Science and Engineering Conference, West Lafayette, IN, USA, 27 June–1 July 2022. [Google Scholar]
  20. Vilardell, A.; Takezawa, A.; du Plessis, A.; Takata, N.; Krakhmalev, P.; Kobashi, M.; Yadroitsava, I.; Yadroitsev, I. Topology optimization and characterization of Ti6Al4V ELI cellular lattice structures by laser powder bed fusion for biomedical applications. Mater. Sci. Eng. A 2019, 766, 138330. [Google Scholar] [CrossRef]
  21. Koju, N.; Hermes, J.; Saghaian, S.E.; Yang, L. Laser powder bed fusion additively manufactured thin lightweight Ti6Al4V features: An experimental investigation on the influence of powder feedstock, geometry, and process parameters on property/quality. Int. J. Adv. Manuf. Technol. 2024, 130, 1541–1561. [Google Scholar] [CrossRef]
  22. Pehlivan, E.; Roudnicka, M.; Dzugan, J.; Koukolikova, M.; Králík, V.; Seifi, M.; Lewandowski, J.J.; Dalibor, D.; Daniel, M. Effects of build orientation and sample geometry on the mechanical response of miniature CP-Ti Grade 2 strut samples manufactured by laser powder bed fusion. Addit. Manuf. 2020, 35, 101403. [Google Scholar] [CrossRef]
  23. Qiu, C.; Yue, S.; Adkins, N.J.; Ward, M.; Hassanin, H.; Lee, P.D.; Withers, P.J.; Attallah, M.M. Influence of processing conditions on strut structure and compressive properties of cellular lattice structures fabricated by selective laser melting. Mater. Sci. Eng. A 2015, 628, 188–197. [Google Scholar] [CrossRef]
  24. Yan, C.; Hao, L.; Hussein, A.; Bubb, S.L.; Young, P.; Raymont, D. Evaluation of light-weight AlSi10Mg periodic cellular lattice structures fabricated via direct metal laser sintering. J. Mech. Work. Technol. 2014, 214, 856–864. [Google Scholar] [CrossRef]
  25. Miranda, G.; Faria, S.; Bartolomeu, F.; Pinto, E.; Alves, N.; Peixinho, N.; Gasik, M.; Silva, F. A study on the production of thin-walled Ti6Al4V parts by selective laser melting. J. Manuf. Process. 2019, 39, 346–355. [Google Scholar] [CrossRef]
  26. Van Bael, S.; Kerckhofs, G.; Moesen, M.; Pyka, G.; Schrooten, J.; Kruth, J.P. Micro-CT-based improvement of geometrical and mechanical controllability of selective laser melted Ti6Al4V porous structures. Mater. Sci. Eng. A 2011, 528, 7423–7431. [Google Scholar] [CrossRef]
  27. Yan, C.; Hao, L.; Hussein, A.; Young, P.; Raymont, D. Advanced lightweight 316L stainless steel cellular lattice structures fabricated via selective laser melting. Mater. Des. 2014, 55, 533–541. [Google Scholar] [CrossRef]
  28. Leary, M.; Mazur, M.; Elambasseril, J.; McMillan, M.; Chirent, T.; Sun, Y.; Qian, M.; Easton, M.; Brandt, M. Selective laser melting (SLM) of AlSi12Mg lattice structures. Mater. Des. 2016, 98, 344–357. [Google Scholar] [CrossRef]
  29. Noronha, J.; Qian, M.; Leary, M.; Kyriakou, E.; Almalki, A.; Brudler, S.; Brandt, M. Additive manufacturing of Ti-6Al-4V horizontal hollow struts with submillimetre wall thickness by laser powder bed fusion. Thin-Walled Struct. 2022, 179, 109620. [Google Scholar] [CrossRef]
  30. Vrána, R.; Jaroš, J.; Koutný, D.; Nosek, J.; Zikmund, T.; Kaiser, J.; Paloušek, D. Contour laser strategy and its benefits for lattice structure manufacturing by selective laser melting technology. J. Manuf. Process. 2022, 74, 640–657. [Google Scholar] [CrossRef]
  31. Liang, H.; Xie, D.; Mao, Y.; Shi, J.; Wang, C.; Shen, L.; Tian, Z. The Size Effect on Forming Quality of Ti–6Al–4V Solid Struts Fabricated via Laser Powder Bed Fusion. Metals 2019, 9, 416. [Google Scholar] [CrossRef]
  32. Suard, M.; Barrière, L.; Lhuissier, P.; Perusin, S.; Filloux, B.; Dendievel, R. Influence of manufacturing orientations on the morphology of alloy 718 single struts manufactured by selective laser melting. Mater. Des. Process. Commun. 2021, 3, e140. [Google Scholar] [CrossRef]
  33. Murchio, S.; Dallago, M.; Zanini, F.; Carmignato, S.; Zappini, G.; Berto, F.; Maniglio, D.; Benedetti, M. Additively manufactured Ti–6Al–4V thin struts via laser powder bed fusion: Effect of building orientation on geometrical accuracy and mechanical properties. J. Mech. Behav. Biomed. Mater. 2021, 119, 104495. [Google Scholar] [CrossRef]
  34. Hossain, U.; Ghouse, S.; Nai, K.; Jeffers, J.R. Mechanical and morphological properties of additively manufactured SS316L and Ti6Al4V micro-struts as a function of build angle. Addit. Manuf. 2021, 46, 102050. [Google Scholar] [CrossRef]
  35. Kumar, V.P.; Jebaraj, A.V. Comprehensive review on residual stress control strategies in laser-based powder bed fusion process– Challenges and opportunities. Lasers Manuf. Mater. Process. 2023, 10, 400–442. [Google Scholar] [CrossRef]
  36. Shrestha, S.; Starr, T.; Chou, K. Porosity Analysis in Metal Additive Manufacturing by Micro-CT. In Proceedings of the ASME 2018 International Mechanical Engineering Congress and Exposition, Pittsburgh, PA, USA, 9–15 November 2018. [Google Scholar]
  37. Shrestha, S.; Starr, T.; Chou, K. A Study of Keyhole Porosity in Selective Laser Melting: Single-Track Scanning With Micro-CT Analysis. J. Manuf. Sci. Eng. 2019, 141, 071004. [Google Scholar] [CrossRef]
  38. Rauniyar, S.K. Experimental and Numerical Studies of Laser Powder-Bed Fusion Process with Ti-6Al-4V Powder: (1) Porosity and Mechanical Properties, and (2) Transient Phenomena in One- and Two-Dimensional Fabrications. Ph.D. Thesis, University of Louisville, Louisville, KY, USA, 2023. [Google Scholar] [CrossRef]
  39. Kasperovich, G.; Haubrich, J.; Gussone, J.; Requena, G. Correlation between porosity and processing parameters in TiAl6V4 produced by selective laser melting. Mater. Des. 2016, 105, 160–170. [Google Scholar] [CrossRef]
  40. Bertoli, U.S.; Wolfer, A.J.; Matthews, M.J.; Delplanque, J.-P.R.; Schoenung, J.M. On the limitations of Volumetric Energy Density as a design parameter for Selective Laser Melting. Mater. Des. 2017, 113, 331–340. [Google Scholar] [CrossRef]
  41. Amato, K.N.; Gaytan, S.M.; Murr, L.E.; Martinez, E.; Shindo, P.; Hernandez, J.; Collins, S.; Medina, F. Microstructures and mechanical behavior of Inconel 718 fabricated by selective laser melting. Acta Mater. 2012, 60, 2229–2239. [Google Scholar] [CrossRef]
  42. Benyounis, K.Y.; Olabi, A.G.; Hashmi, M.S.J. Effect of laser welding parameters on the heat input and weld-bead profile. J. Mech. Work. Technol. 2005, 164–165, 978–985. [Google Scholar] [CrossRef]
  43. Trapp, J.; Rubenchik, A.M.; Guss, G.; Matthews, M.J. In situ absorptivity measurements of metallic powders during laser powder-bed fusion additive manufacturing. Appl. Mater. Today 2017, 9, 341–349. [Google Scholar] [CrossRef]
Figure 1. The geometry of thin struts to study the size and shape effect. “a” is the cross-sectional dimension of the strut.
Jmmp 09 00226 g001
Figure 2. The specimen setup inside the Bruker SkyScan 1173 micro-CT scanner.
Jmmp 09 00226 g002
Figure 3. (a) Region of interest (ROI) selection on xy-plane. (b) Volume of interest (VOI) height selection in the z-plane.
Jmmp 09 00226 g003
Figure 4. (a) Selected ROI region for a circular strut of 1.75 mm size, (b) raw image of the ROI, (c) binary image where black and white pixels represent the solid and objects, respectively, (d) raw image superimposed over the binary image.
Jmmp 09 00226 g004
Figure 5. 2D images of 0.75 mm circular struts at the cross-section along the strut length (top) and across the strut length (bottom).
Jmmp 09 00226 g005
Figure 6. 3D images of 0.75 mm square struts built with LED ≥ 0.195 J/mm.
Jmmp 09 00226 g006
Figure 7. Isometric view of various size square struts built at 0.327 J/mm.
Jmmp 09 00226 g007
Figure 8. (ae) Average pore volume (PVAvg) and porosity percentage (P%) in struts of various sizes built at different linear energy densities.
Jmmp 09 00226 g008aJmmp 09 00226 g008b
Figure 9. Main effects plot for porosity percentage in circular struts.
Jmmp 09 00226 g009
Figure 10. Main effects plot for average pore volume in circular struts.
Jmmp 09 00226 g010
Figure 11. Main effects plot for pore number in circular struts.
Jmmp 09 00226 g011
Figure 12. Porosity in circular struts built at scan speed V = 550 mm/s and different laser powers.
Jmmp 09 00226 g012
Figure 13. Porosity in circular struts built at laser power P = 195 W and different scan speeds.
Jmmp 09 00226 g013
Figure 14. 2D images of the cross-section through the strut’s center and the 3D images of 1.25 mm and 1.75 mm square struts built at 0.355 J/mm.
Jmmp 09 00226 g014
Table 1. Design of struts.
Strut Size, a (mm)Strut Shape
1.75. 1.25, 0.75, 0.5, 0.25Circle, Square
Table 2. Chemical composition of Ti6Al4V powder.
ElementTiAlVFeOC
wt. %Balance6.094.130.250.130.08
Table 3. Process parameters used to study the effect of energy density input.
Parameter No.Linear Energy Density,
LED (J/mm)
Laser Power,
P (W)
Scan Speed,
V (mm/s)
10.1251251000
20.1361701250
30.1601601000
40.1951951000
50.227125550
60.260195750
70.291160550
80.327180550
90.355195550
Table 4. Number of fabricated struts data.
Parameter No.Strut SizeNumber of Fabricated Struts Total Number of Fabricated Struts
CircleSquare
1–91.7566108
1–91.2566108
1–90.751212216
1–90.501212216
1–90.251818324
Disclaimer/Publisher’s Note: The statements, opinions and data contained in all publications are solely those of the individual author(s) and contributor(s) and not of MDPI and/or the editor(s). MDPI and/or the editor(s) disclaim responsibility for any injury to people or property resulting from any ideas, methods, instructions or products referred to in the content.

