1. Introduction
Manufacturing companies need to increase their productivity by ensuring high-quality standards, low-cost and short lead times to stay competitive. In this environment, companies have to ensure a high product quality to meet customers’ demands [
1,
2]. In this context, quality can be defined as a set of characteristics of a unit (e.g., product or process) regarding their suitability, to meet specified and presupposed requirements [
3]. Therefore, both product and process quality need to be addressed to achieve the required product quality. For quality inspection, a distinction can be made between measurement technology on the product and measurement technology on the process to meet the quality requirements [
4].
In general, manufacturing companies try to improve or maintain a high quality while maximizing the efficiency of the overall system.
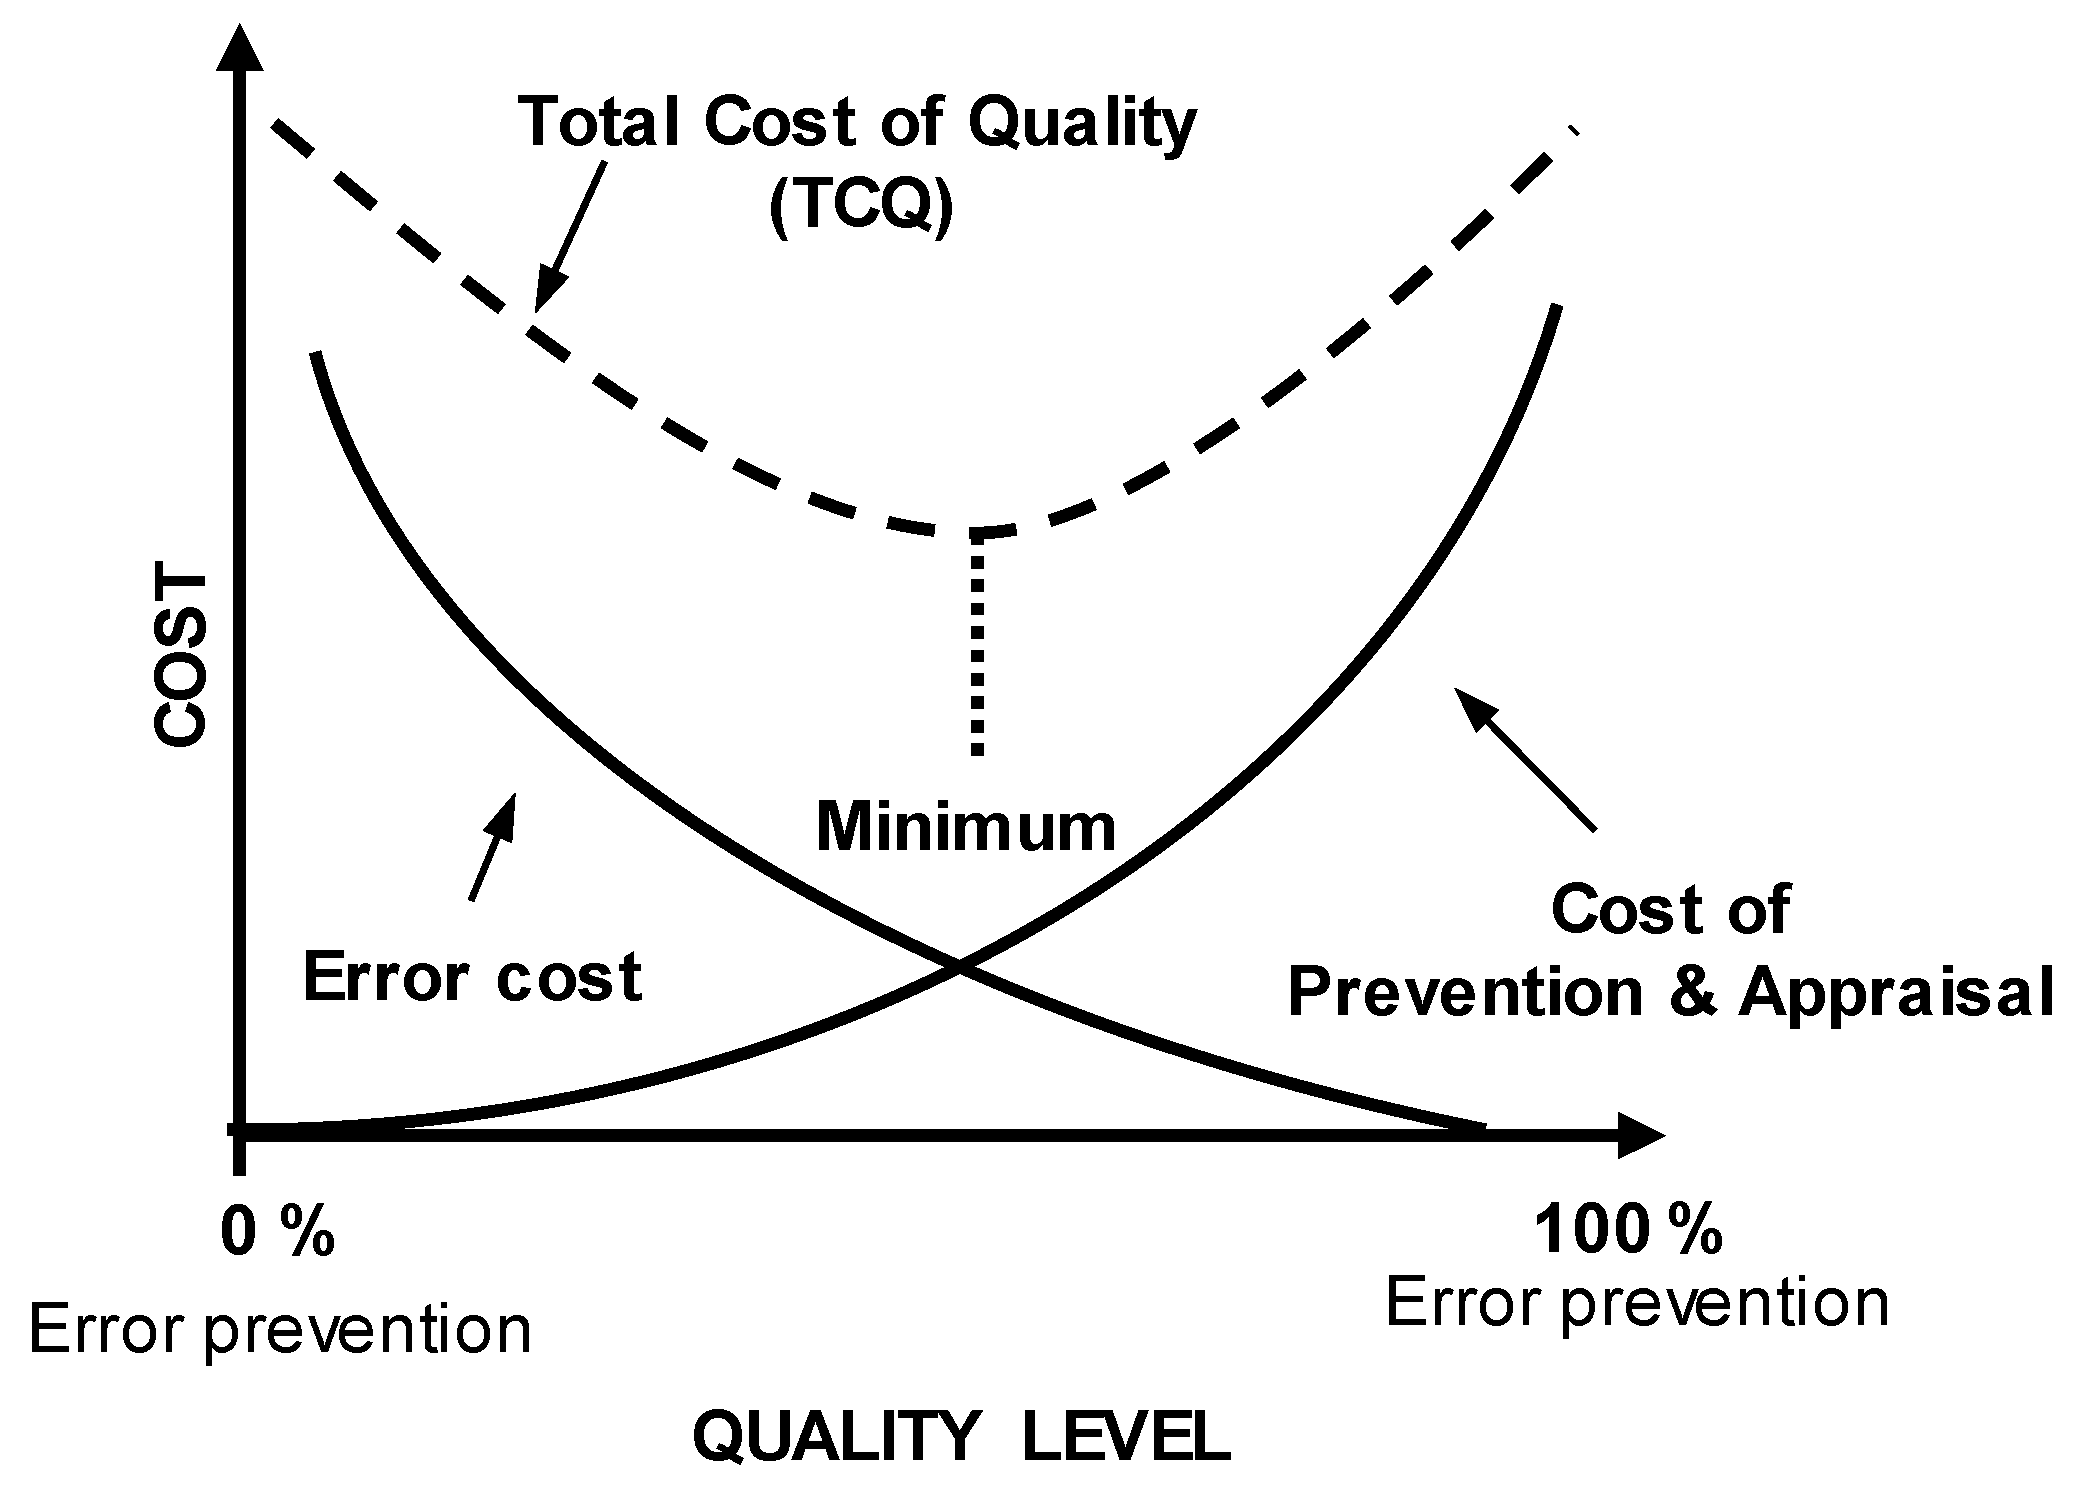
Figure 1 shows the challenges of finding an optimal trade-off between effort for error prevention and resulting costs in case of occurring errors. Manufacturing with a minimum amount of quality errors, even toward “zero-defect” production, is of course a promising vision to achieve. However, it requires high efforts—e.g., for physical inspection of product properties with high (temporal and spatial) resolutions and establishment of adaptive control regimes based on defined quality gates. Furthermore, high product variants lead to an increased complexity of quality inspection planning and operation. Consequently, with increasing error prevention, the cost of prevention and appraisal increase significantly [
5]. Therefore, strategies that allow a high transparency of product and process quality along the process chain while still keeping a reasonable effort are very promising.
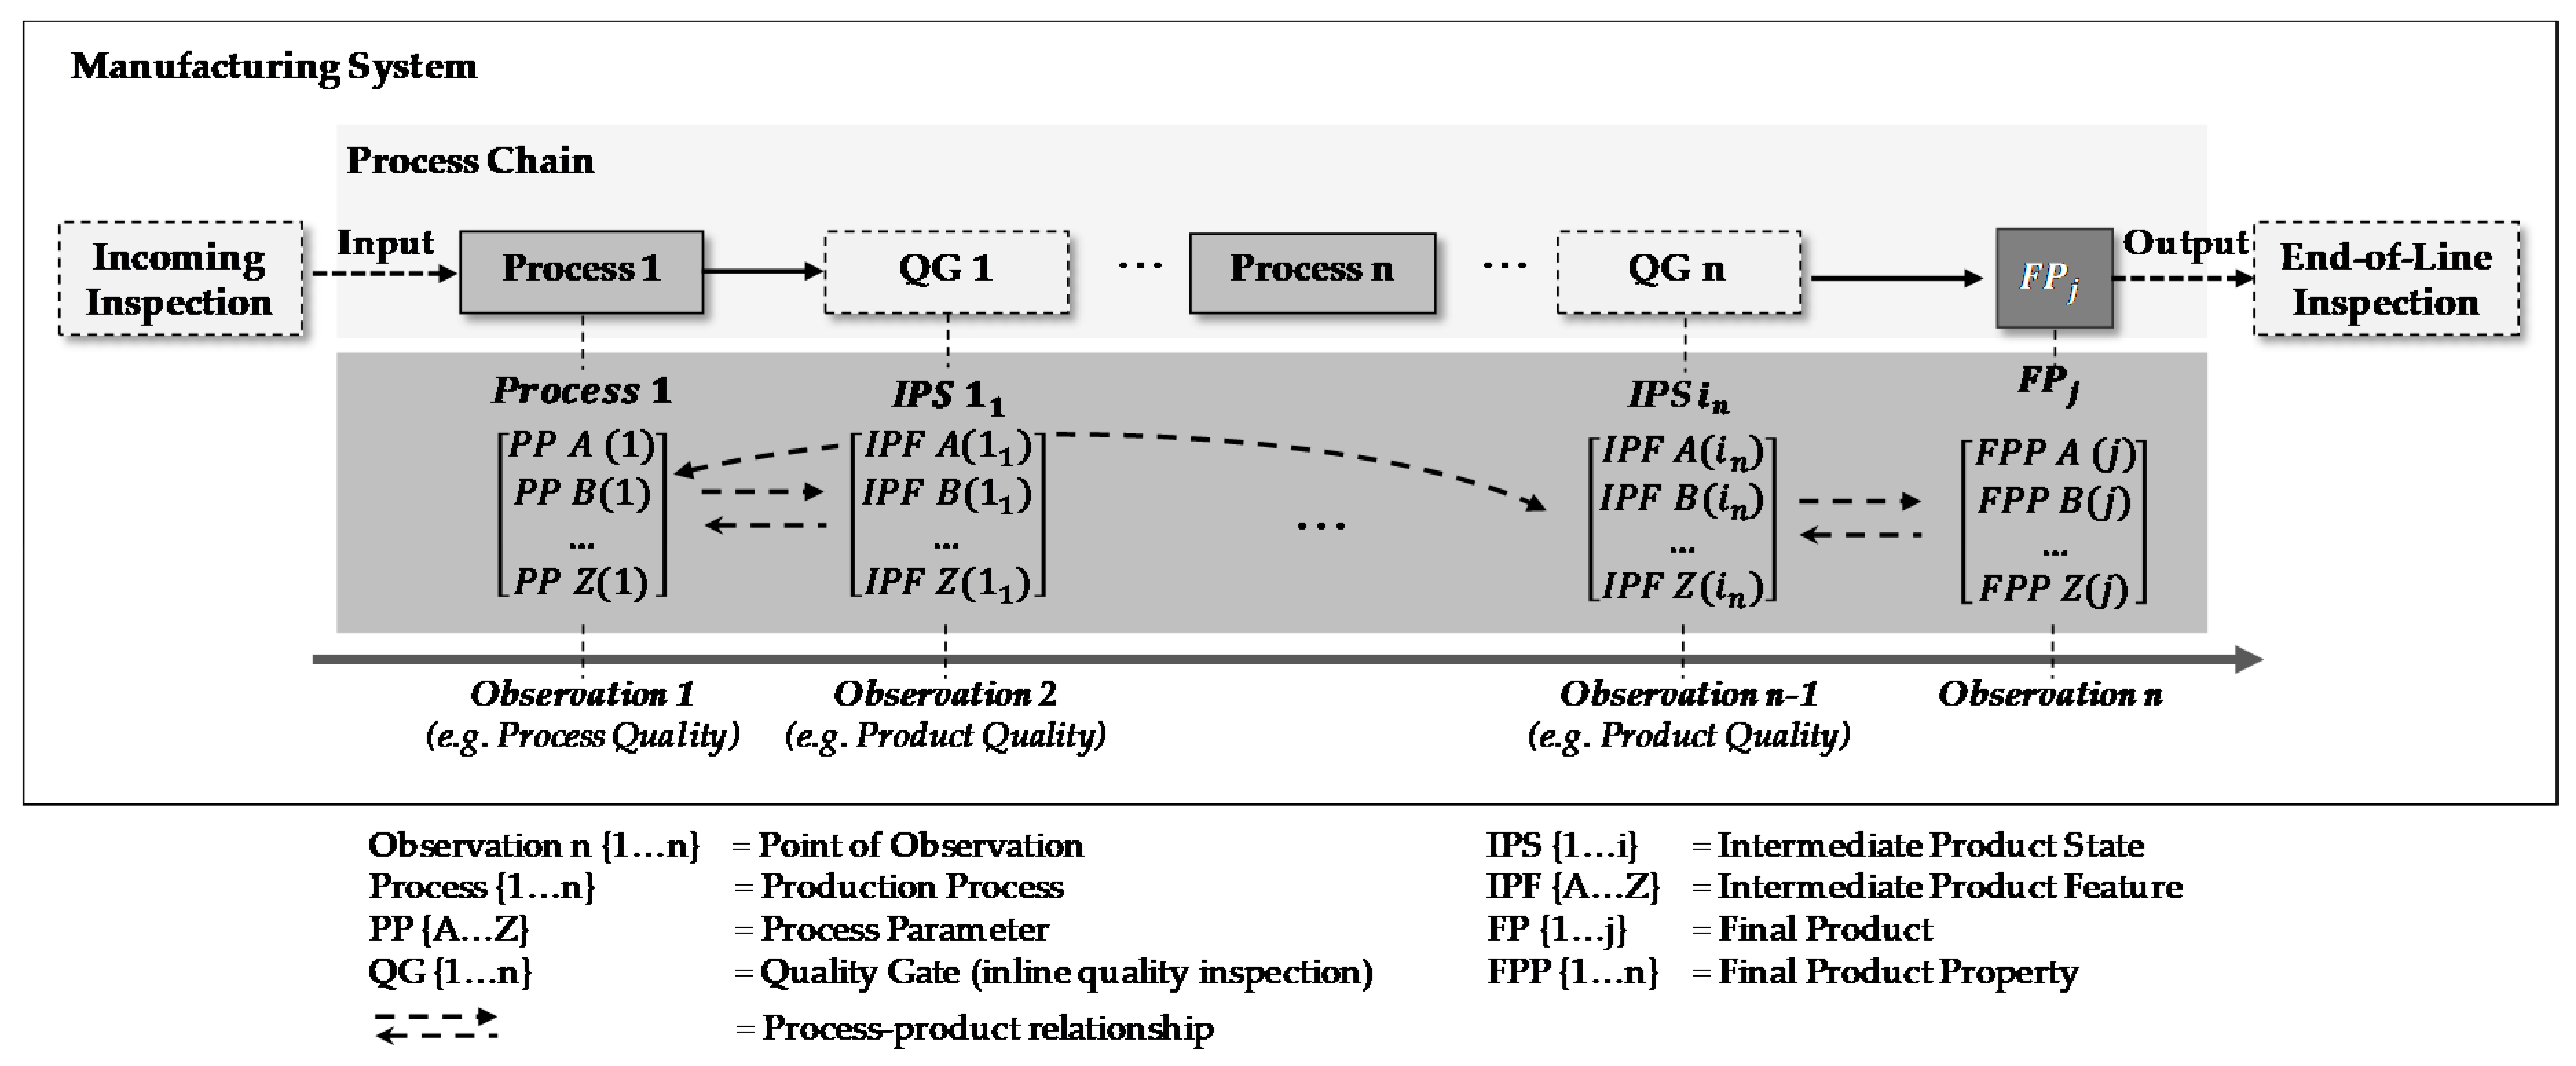
To decrease the total cost related to quality measurements and reduce rework and scrap, it is necessary to consider the complete process chain instead of single and isolated processes. Therefore, it is important to understand dynamics and interdependencies within the process chain. Here, especially in the context of product quality, transparency und understanding of process–product relationships, which describe interactions and the impact of the manufacturing processes on the resulting intermediate product features and vice versa, are of great importance. Moreover, to derive proper quality management strategies, knowledge about the propagation and the detection of intermediate product feature changes along manufacturing processes is essential. Therefore, the design of inspection processes is an important task in the planning and operation of manufacturing systems with regard to product and process quality.
Digitalization is a major trend in manufacturing which creates new opportunities for advanced quality management (QM). There are already numerous QM methods, tools and technologies that have already been implemented or are in the process of implementation.
To overcome the limitations of physical measurements within the quality inspection such as non-value adding process times for inspection, accuracy, flexibility and related efforts, virtual quality gates can be developed based on digital methods, tools and technologies [
6]. Therefore, existing or easy-to-obtain data from the physical production (e.g., shop floor) are used for a valid virtual model to predict the current product and process properties and thus are the basis for advanced QM and the improvement of the quality while maintaining a high transparency with low cost at the same time.
Against this background, central elements and characteristics of virtual quality gates are discussed and defined. The paper is structured as follows:
Section 2 gives insights on the theoretical background of cyber physical systems and quality gates.
Section 3 discusses applications of virtual quality gates in manufacturing and concludes with derived research demands for virtual quality gates.
Section 4 presents the theoretical framework for the design and implementation of virtual quality gates.
Section 5 presents three case studies with an exemplary application of the aforementioned framework in lithium-ion battery cell manufacturing, aluminum die casting and printed circuit board production.
Section 6 discusses the potential and challenges of virtual quality gates (VQGs) while
Section 7 gives an outlook on further research demand.
4. Framework of Virtual Quality Gate Design and Implementation
4.1. Technical Framework of Virtual Quality Gates
In the following, the developed technical framework for a virtual quality gate is presented in
Figure 5, based on the CPPS framework, as explained in
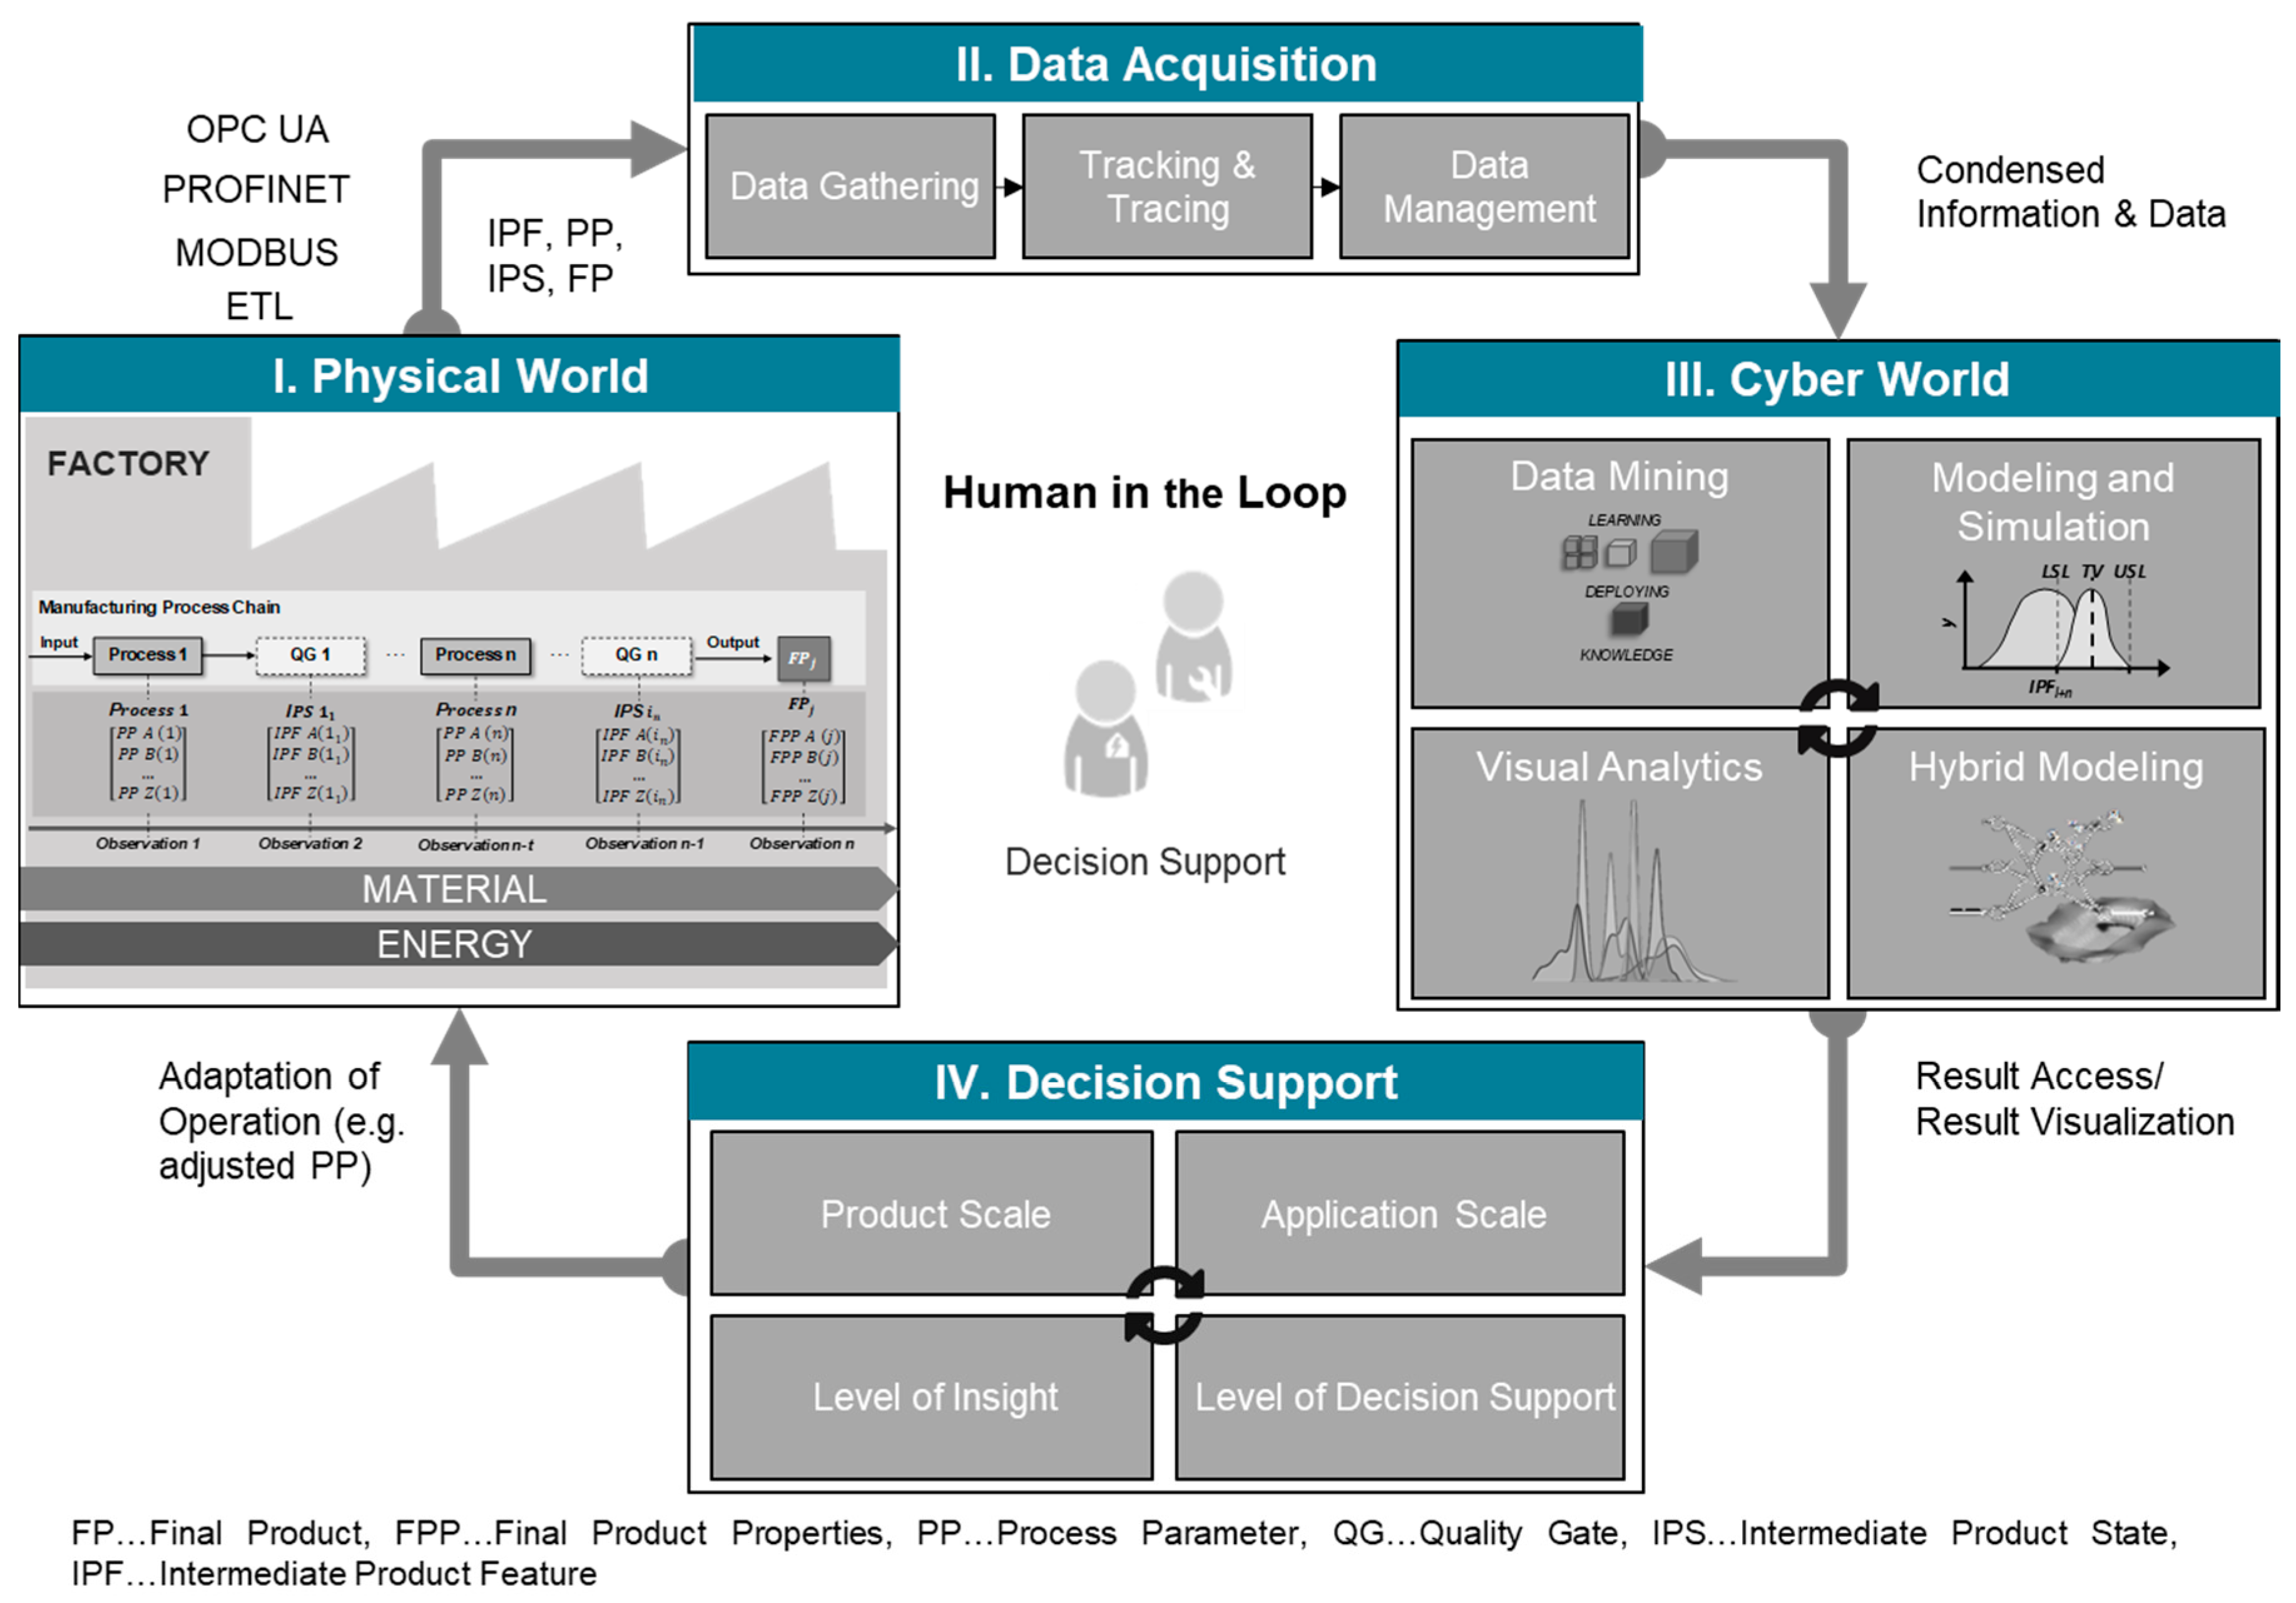
Section 2.1. The framework covers four major levels: I. physical world, II. data acquisition, III. cyber world and IV. decision support/control. Each level can be divided into different characteristics that need to be defined for implementing a VQG. Therefore, the physical world explains which information is required in order to assess and understand the current situation (understanding of production type and inspection). Data acquisition gives insights into the characteristics that need to be defined regarding data gathering in order to obtain needed data for the VQG from available data sources. In the cyber world, modeling approaches are explained that can be utilized to obtain desired product characteristics from acquired data. Decision support gives insights into how derived product characteristics are used to enable decision support or even direct production control.
4.2. Physical World
The physical world reflects the actual design and characteristics of the respective “real” manufacturing system. With a focus on QM, performance criteria such as the error rate or pseudo-error rate as well as mean rework time arise. These indicators are the basis for analysis and improvement purposes. Moreover, state variables such as normal force or power demand describe the system behavior. In addition, the system behavior is also affected by internal influences such as special room conditions (e.g., temperature or humidity) or external influences such as properties of incoming material (e.g., tolerances). However, design and control parameters such as feed, cutting speed or specific machine characteristics actively influence the manufacturing system behavior. These variables and parameters serve as the basis for quality control by creating a link between the requirements from product design and actual production as they provide, e.g. inspection characteristics. Furthermore, within the physical world the amount of machines and processes, the age of machines, cycle times and mean lead times are defined. Moreover, the product variants to be produced are specified.
Next to the mentioned quantitative characteristics, the physical world also defines the production type of the designed system (e.g., discrete or continuous processes). Moreover, through its design, inspection equipment and places are derived.
4.3. Data Acquisition
In order to obtain and to store the needed or desired data for a VQG, its source and type need to be specified, its accessibility needs to be determined—i.e., how this data can be obtained—and a data storage solution needs to be derived. The first two attributes (data source and data format) are mostly defined by the information from the previous phase—physical world. Data accessibility is usually dependent on the data source and the data storage needs to be derived based on the intended usage (cyber world).
Various data sources exist in production; some of them are spreadsheets, lab protocols or data files in general (e.g., excel files, word files, image files, etc.), control software (Supervisory Control and Data Acquisition (SCADA)), planning and design software (e.g., Enterprise and Resource Planning (ERP), Computer Aided Design (CAD), etc.), process automation (e.g., Computerized Numerical Control (CNC), Programmable Logic Control (PLC), etc.), sensors, etc. In the specified source, the data are usually available in a certain format—e.g., single value, time series, spatial data, image data, etc.
Based on the information of the data source and the data format, data accessibility is reviewed and evaluated with regard to intended usage in the cyber world. In the context of VQGs, quality-related data are of the highest importance. These data are either acquired inline of the production chain or through offline inspection of an intermediate product. The data can be stored in files which can be acquired either manually, by uploading through graphical user interfaces (GUIs) or by using an extraction transformation and loading process (ETL) if their directory is defined and accessible. Data stored in software applications can be, e.g., accessed through the application’s database via queries. Continuously running applications (SCADA, ERP, PLC, etc.) could have standardized communication protocols (e.g., open platform communication unified architecture (OPC-UA), ModBus, PROFINET, PROFIBUS, etc.) that can be accessed and used to acquire data. Sensors might also have communication protocols, or can be read out via analogue or digital signals. More often, sensors are read out by small Internet of things (IoT) devices and can make-up a whole IoT device network.
The choice of data management, if entirely needed, is also made with regard to the cyber world and the intended application. Since the IoT devices become more and more durable and performant, they also can be used for data management, allowing to store small amounts of data either decentralized or on the edge. Furthermore, the data can be stored centralized, either on premise, if the IT support is guaranteed, or on the cloud. For data management, various technologies exist for on premise or cloud data storage (e.g., Hadoop distributed file system (HDFS), MySQL, MongoDB, Amazon web services (AWSs), etc.).
4.4. Cyber World
Within a VQG, the main target of the cyber world is to analyze or predict the properties of the physical product. The modeled properties can be, on the one hand, IPFs for intermediate products or, on the other hand, FPPs for the final product. Another central task of the cyber world is to transform the quality prediction into knowledge that is used for automated process control or, most commonly, transmitted to the operator as decision support—e.g., in terms of an assistance system. Possible options to deliver appropriate decision support are, for example, user-friendly, interactive and easy-to-interpret model-based visualizations (e.g., localized failures and failure information within a three-dimensional product plot) or the simulation of effects of downstream processes on the product quality to derive action plans on product routing or process control. For modeling the cyber world of a VQG, four approaches can be distinguished:
Data Mining
Simulation
Hybrid Modeling
Visual Analytics
As shown within the literature review (see
Section 3.1), several approaches draw on data mining for virtual quality inspection. Through data-driven modeling, i.e., machine and deep learning, transparency towards process–product relationships can be achieved and trained models can be applied for quality prediction. According to their purpose, data-driven modeling can be divided into two general categories: (1) supervised learning and (2) unsupervised learning [
46]. The first one, most commonly used in quality prediction, requires labeled samples that are, for instance, acquired by product inspection—e.g., non-destructive X-ray inspection or destructive tensile testing. The second category, unsupervised learning, does not require labeled quality data. This type of learning tries to find patterns or trends within process data or product data (i.e., IPF or FPP). The patterns can be used as a starting point for further data analysis [
39]. Secondly, simulation approaches can be used to model the cyber world of a VQG—e.g., physics-based and numerical modeling as well as discrete event and agent-based simulations [
47]. For example, through the finite element method several IPFs can be modeled based on process and material parameters [
40]. However, these approaches come with the drawback of a time-consuming computation for complex parts. First, approaches address this drawback by hybrid modeling through building data-driven surrogate models of finite element simulations that appropriately capture the simulated characteristics and are additionally real-time capable [
41,
42,
48]. These approaches for building an online VQG through combining data-driven modeling and simulation illustrate the key idea of hybrid modeling which to entails the combination of more than one modeling paradigm. Lastly, visual analytics can be applied to a VQG, as a single modeling approach or as a hybrid modeling approach in conjunction with machine learning or simulation. In this context, an example could be the visualization and analysis of clustering-based IPF propagation along a process chain through a Sankey diagram (see case study III,
Section 5.3). Furthermore, an approach with a specified loop for knowledge discovery, covering the four elements of data, visualization, models and knowledge and defining visual analytics as a combination of automated analysis techniques with interactive visualizations for effective understanding, reasoning and decision making on the basis of very large and complex data sets is presented in [
49]. A survey on the state-of-the-art methods with regard to available commercial visual analytics software was performed by [
50]. By the emphasis on interactivity within visual analytics, the analyst stays in charge of the uncovering process and product quality issues that can be directly found within the raw process and product data or constructed by model-based process–product relationships.
4.5. Decision Support
The decision support ensures the feedback loop from the cyber world back into the physical world while involving the human. This feedback loop contains information derived from the VQG regarding the product and process quality. Here, the focus is on decision support in the sense of more precise feedback and not on the control of machines or individual components. This evaluation and processing of derived information and knowledge can be subdivided into the following characteristics: product scale, application scale, level of insight, and level of decision support.
The product scale and application scale evaluate the information defining the characteristic of the product addressed and the quantification of product information. The product scale characterizes the information derived by the VQG regarding the product in terms of the IPFs and FPPs. These values can represent the suitability of the previous process and the resulting intermediate product.
The application scale characterizes the applicability of the information derived by the VQG on the quantified amount of products/intermediate products. It provides information regarding the question on whether the tracked information concerns a single product, several products, the whole product batch or refers to a product in continuous production.
The level of insight characterizes the maturity of the derived information from the quality gate based on the data analytics’ maturity [
51]. It can therefore be either diagnostic, descriptive, predictive or prescriptive. In the context of VQGs, diagnostic relates to the obtained information that only characterizes the product. Descriptive defines information additional to product characteristics and also describes why the product characteristics are the way they are. The feature predictive defines the derived information provided by the VQG and allows a prediction of future events—e.g., describing the performance of the final product based on its IPFs. Prescriptive means that the provided information already directly addresses the improvement of the current situation or the product. The level of decision support defines the level of abstraction on which the obtained information is used to improve the current situation—e.g., the physical world. These levels of abstraction range from sole information output, visualization of the obtained information, indirect control or the direct control to improve the quality (e.g., process adaption).
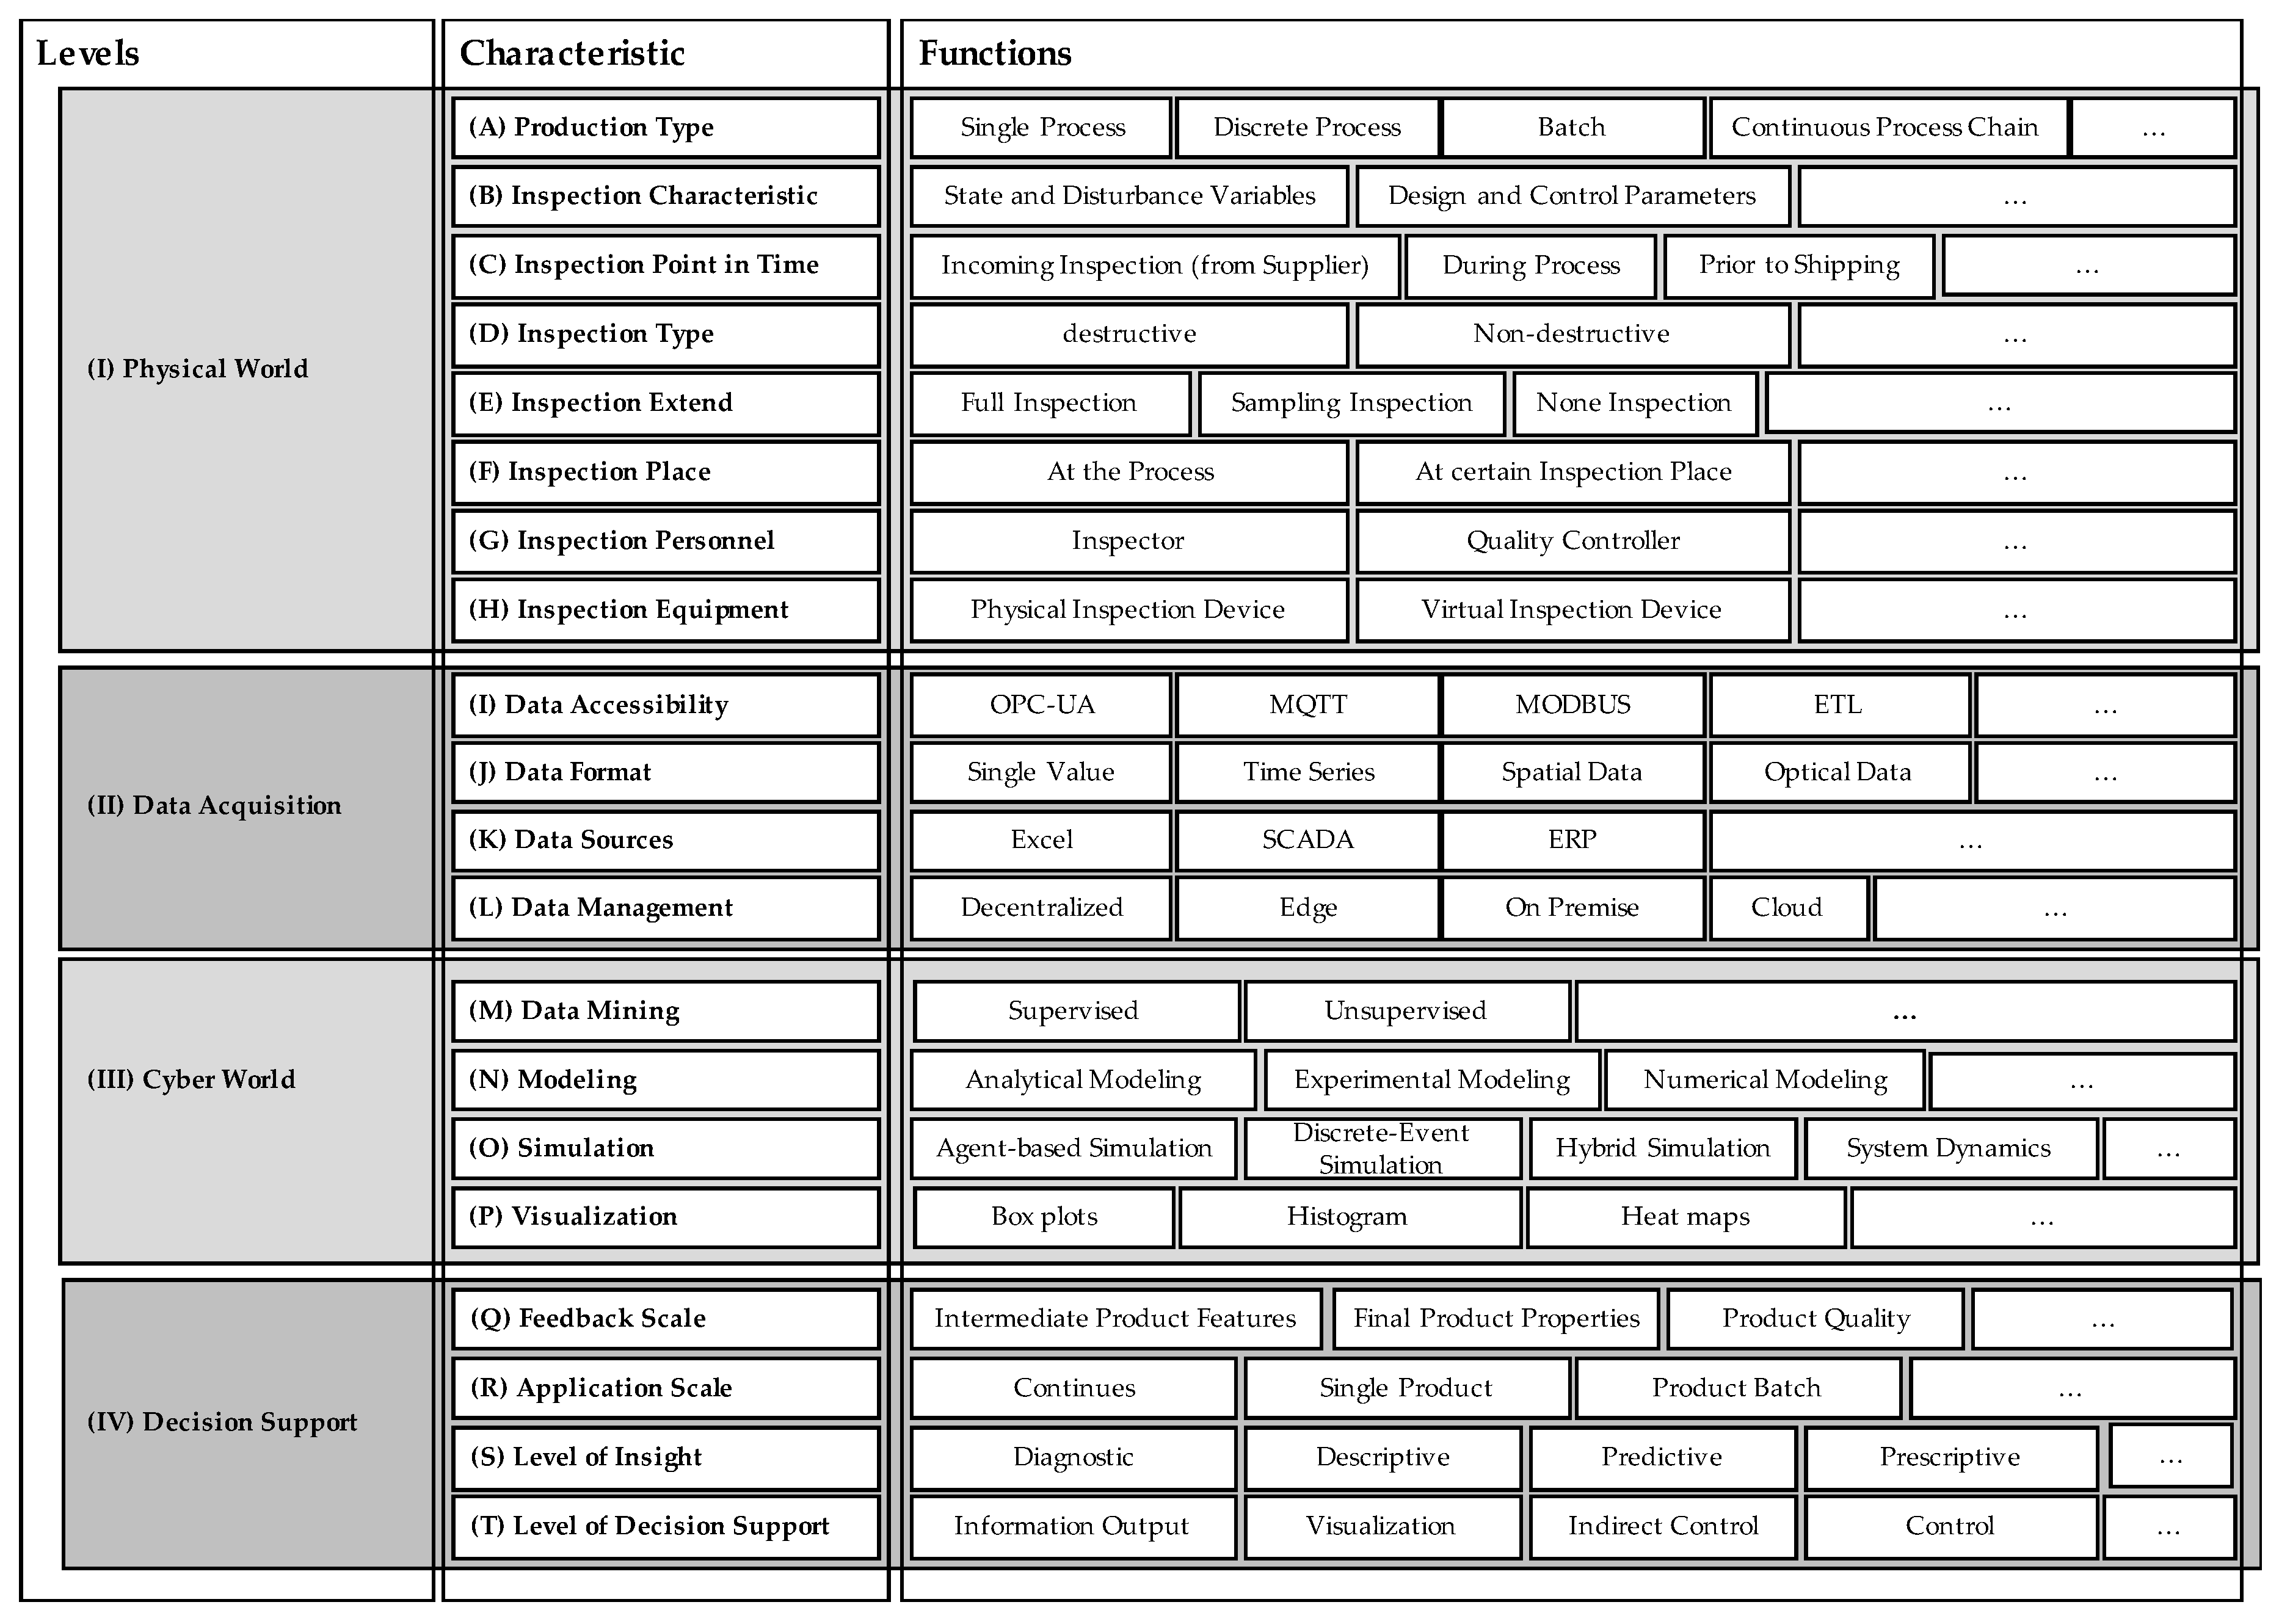
4.6. Morphological Analysis
To better understand what different functions are required when developing a quality and especially a VQG, a morphological analysis is performed. By this analysis, the complexity of how to design a suitable quality inspection is decomposed based on a morphological box. Within this context, a morphological box is a tool to generate possible solutions for complex problems by breaking the problem down into its essential parameters or dimensions (here, functions and principles of a VQG), as defined in
Section 2 [
52]. The morphological box for the design of VQG is shown in
Figure 6.
To further decompose the possible solution as well as the existing design space, characteristics (A–T) were identified and assigned to the different elements (I–IV). Within this scope, important characteristics of the inspection planning and CPPS were taken into account based on the findings of
Section 2 and
Section 3. In addition to the basic characteristics of inspection planning, an additional focus was put on the design of the virtual elements such as data mining or data management in the context of CPPSs.
To depict the characteristics in more detail, different possible functions are assigned to each characteristic. These functions can, e.g., be possible methods, tools and technologies of the characteristic. By combining functions of different characteristics and levels, a path identifying a VQG is given. Therefore, with the help of a morphological box, a high variety of different possible solutions solving a comparable issue can be identified.
5. Case Studies
5.1. Case Study I: VQG in the Manufacturing Chain of Lithium-Ion Battery Cells
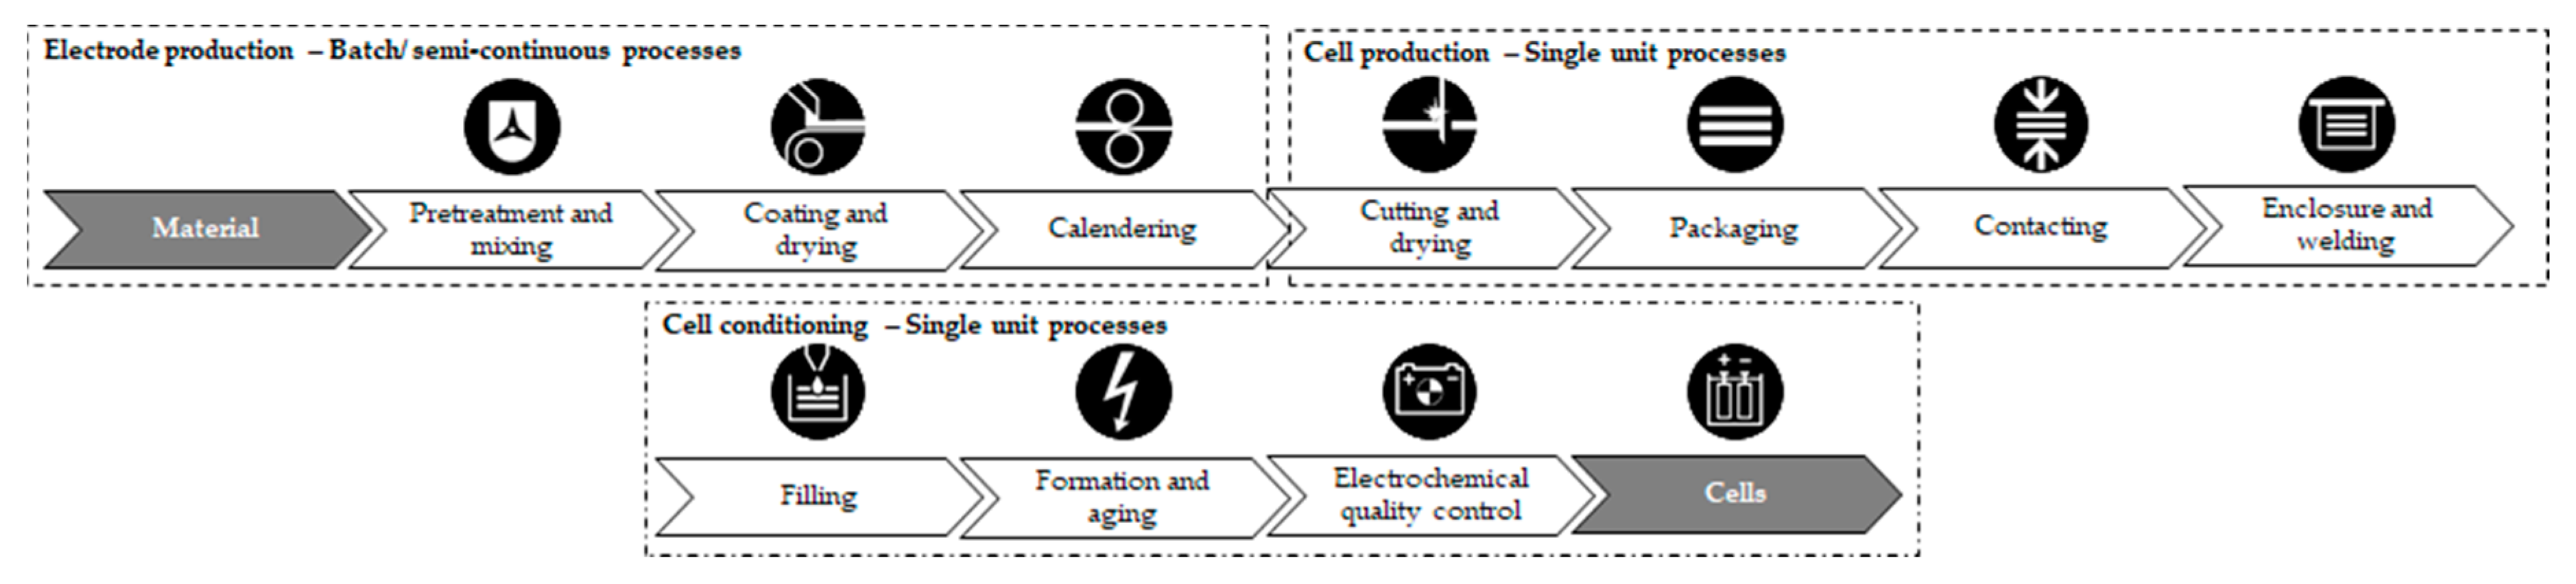
Future mobility concepts highly rely on electrically powered vehicles, with the current state-of-the-art energy storage technology being the Lithium-ion battery (LIB) [
53]. Its complex manufacturing chain can be subdivided into batch or semi-continuous processes—e.g., electrode production, single unit processes, such as cell production and cell conditioning, formation and aging, covering converging and diverging material flows. This process chain is depicted in
Figure 7.
The costs of LIB cells are dominated by the costs of the raw material. This dominance leads to the overall costs being highly sensitivity to possible production errors [
53]. Scrap rates reported in research and industry are still as high as 40% [
51]. Different QM approaches have been pursued to ensure a “higher quality” as well as lowering economic and environmental impacts [
54]. Some concepts strive towards analyzing the perceived quality of different intermediate products, predicting the future quality of the later produced battery cell and deriving counteractions, if the perceived quality does not match the targeted quality range [
55]. The abovementioned approach has been pursued at the Battery LabFactory Braunschweig (BLB) to develop a VQG approach. The BLB is a research center of the Technische Universität Braunschweig dedicated to facilitate interdisciplinary research for the development of production processes as well as diagnosis and simulation for current lithium-ion batteries and future battery technologies.
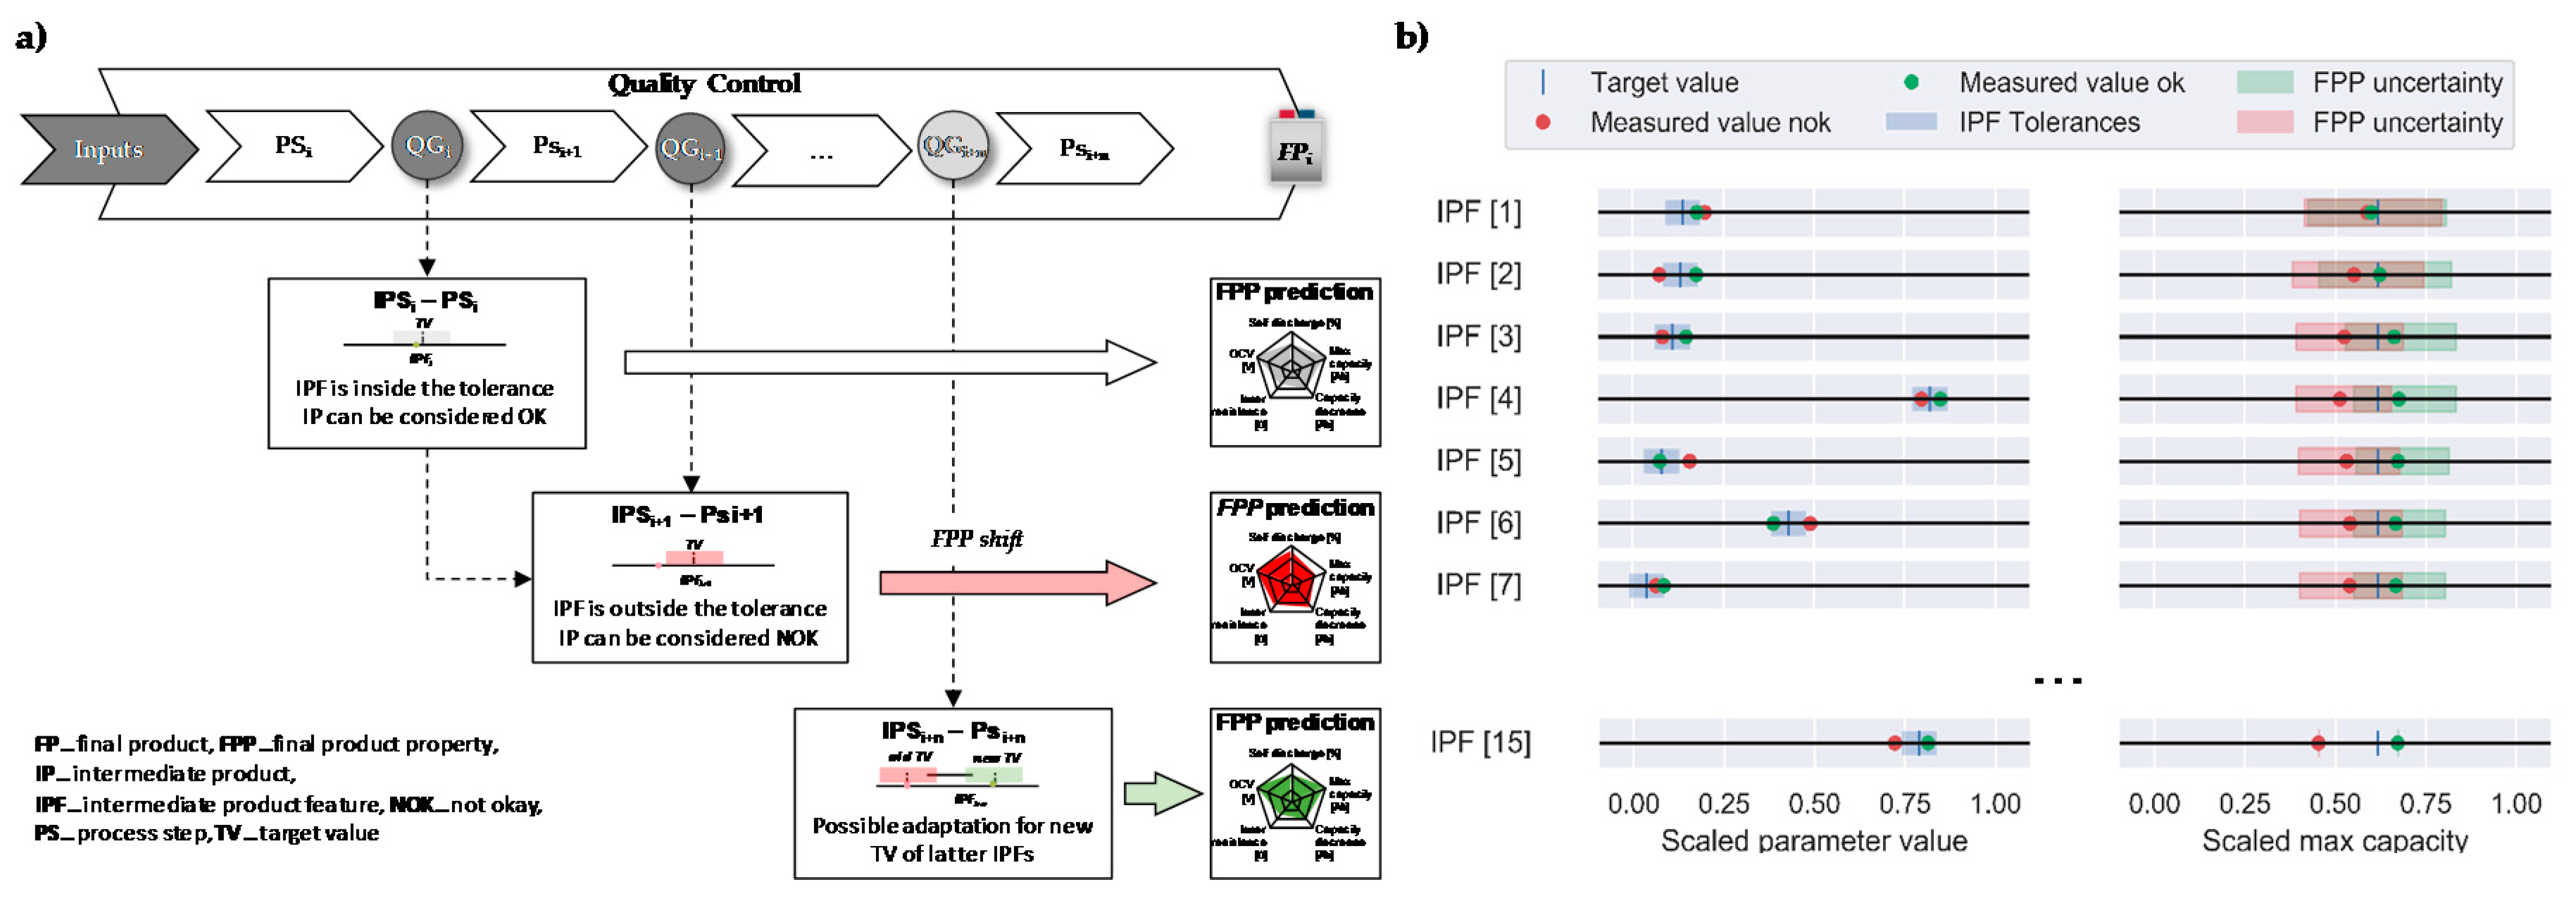
In the following, the VQG concept, as depicted in
Figure 8a, for the manufacturing of LIB cells is put into the context of the framework described in
Section 3.2. The overarching goal is to evaluate the quality of the intermediate products based on their influence of the obtained IPF on the final product properties (FPPs) of the LIB cell. Each VQG is defined by a target value (TV) as a desired IPF and a tolerance range, which are used to predict a value as well as a potential range for the latter FPP. With each new obtained IPF, the calculated range for the FPPs is decreased and the potential FPP value is estimated. With this, an insight into the quality of the produced intermediate product (IP) is given and the decision making in terms of QM is supported.
The physical world of the presented VQG approach focuses on the entire manufacturing chain, as depicted in
Figure 8, and represents a gate-to-gate approach. Offline and inline inspection are performed along the entire chain to evaluate the perceived quality of each IP and tracked through a traceability system to enable the seamless tracing of all allocated data to a specific product identification. The data acquisition is enabled by a combination of manual and automatic data acquisition techniques. With the manual data acquisition, the data are acquired from offline sources, such as test beds, which generate files that can be uploaded into a database on premise through a designed front-end. The automated data acquisition acquires sensor and production machines’ data via standardized communication protocols (e.g., OPC-UA, PROFINET) and transmit it to an industrial acquisition system (SCADA) or directly to a database—e.g., via Node.js. The data format represents process parameters, state variables and ambiance conditions (e.g., temperature, humidity) as time series as well as presenting intermediate product features and final product properties as single values. Through a tracking and tracing system, the operational data of each production or single product are acquired. These data cover the five dimensions—when, where, who, what and why—to enable a unique traceability of all intermediate and final products along the manufacturing chain. The first two dimensions are acquired automatically by defining thresholds in the power load of each process to detect the processing state. The missing three dimensions are acquired through a web interface at each process step. To cover a possible information loss during the cutting of an electrode coil into single sheet, a data matrix code (DMC) is imprinted onto the current collector and scanned during the cell assembly process, allowing to track a single electrode inside a LIB cell.
Within the cyber world, a data mining-based approach for the VQG is pursued. Here, feature selection and modeling phases are deployed. First, the IPF and FPP data are preprocessed and cleansed. Data sets with a high amount of missing values are removed. The data are then min-max-scaled between 0 and 1 and the data sets with constant values and a low variance are removed. Next, co-correlated IPFs are removed. Then, the recursive feature elimination algorithm is used to choose 15 IPFs with the highest influence on selected FPPs. This data set is then put into relation by computing a quantitative relation based on Lasso-Lars regression, Random Forest and ANN models. To predict the future FPP values based on the quality gate with target values and tolerances the ANN model is used.
The model for the VQG is deployed in Python by accessing the relevant database of the IPF and FPP and can automatically be executed or on demand by implementing the script into a docker. Whenever an IPF is measured and the acquired data set is uploaded, the VQG model calculates the target FPP and its uncertainty. This process is depicted in
Figure 8b [
45].
The data-driven VQG approach provides decision support for the process expert and the production manager. Possible derived suggestions can be a readjustment of the next processing steps (new TV and tolerances for IPFs) in order to meet the requirement for the FPPs or not to continue the processing of the current IP in order to save energy and costs. Hereby, an early detection of possible faults is enabled to improve future process control. The decision support can be visualized on a mobile device at each processing step as well as in a production control dashboard.
5.2. Case Study II: VQG in Aluminum Die Casting
Casting processes are very complex in nature and are characterized by a high variability and non-linearity, phase conversions and interactions between process parameters and their environment. Due to these characteristics as well as missing direct feedback for the worker on the current casting performance, i.e., time delay of several minutes between casting and quality inspection, a data-driven VQG for active decision-support can serve as a viable approach. Several improvements and insights can be obtained throughout the VQG concept, such as need-based work instructions, less non-value adding activities, reduced manual inspection efforts (e.g., confident likelihood of no failure) and transparency towards stable process settings, critical state variables as well as cause–effect relationships.
In the following, a VQG concept for the aluminum die casting of automotive components is depicted. The VQG targets data-driven decision support for stable process settings. Aluminum die casting can be divided into hot and cold areas. Cold areas encompass the machining of the casted parts, quality inspections (e.g., X-ray inspection and crack test) as well as part assembly. The casting part quality is to the greatest extent determined within the hot areas, such as melting, casting and heat treatment. Hence, the physical world of the presented VQG focuses on single process step casting, which encompasses the following substeps: A crucible with molten aluminum is positioned at the casting line. Using a robot-guided ladle, the molten aluminum is poured from the crucible, transferred to one of the casting pitches and poured in the mold. Inside the actively cooled mold, the aluminum solidifies until the raw component can be removed automatically by a robot. The part is passed into a cooling basin, followed by the separation of a sprue and riser system and, finally, a non-destructive visual and X-ray quality inspection is conducted. Due to the components safety requirements, a full inspection of each part is pursued, delivering an extensively labeled training data set.
As data types within data acquisition process parameters (e.g., hardening time), state variables (e.g., mold temperature) as well as the final product properties, binary classification in good parts (OK) and defects (NOK) is considered. The measurement of process parameters and state variables is part-specific and carried out at discrete times (e.g., mold temperature at casting start). In total, the modeling comprises 23 independent features and a binary target variable. For tracking and tracing, a part-specific unique identifier is created and its data protocol is updated at the master PLC throughout the process chain from crucible placement until cooling. Before cooling, a DMC is printed on the casted part containing the unique identifier. The code can be read at all downstream processes (e.g., X-ray inspection), which enables the fusion of process data with quality data. The two data sources, PLC and X-ray inspection station, are accessed via OPC-UA and data management is carried out on-premise within an industrial cloud solution.
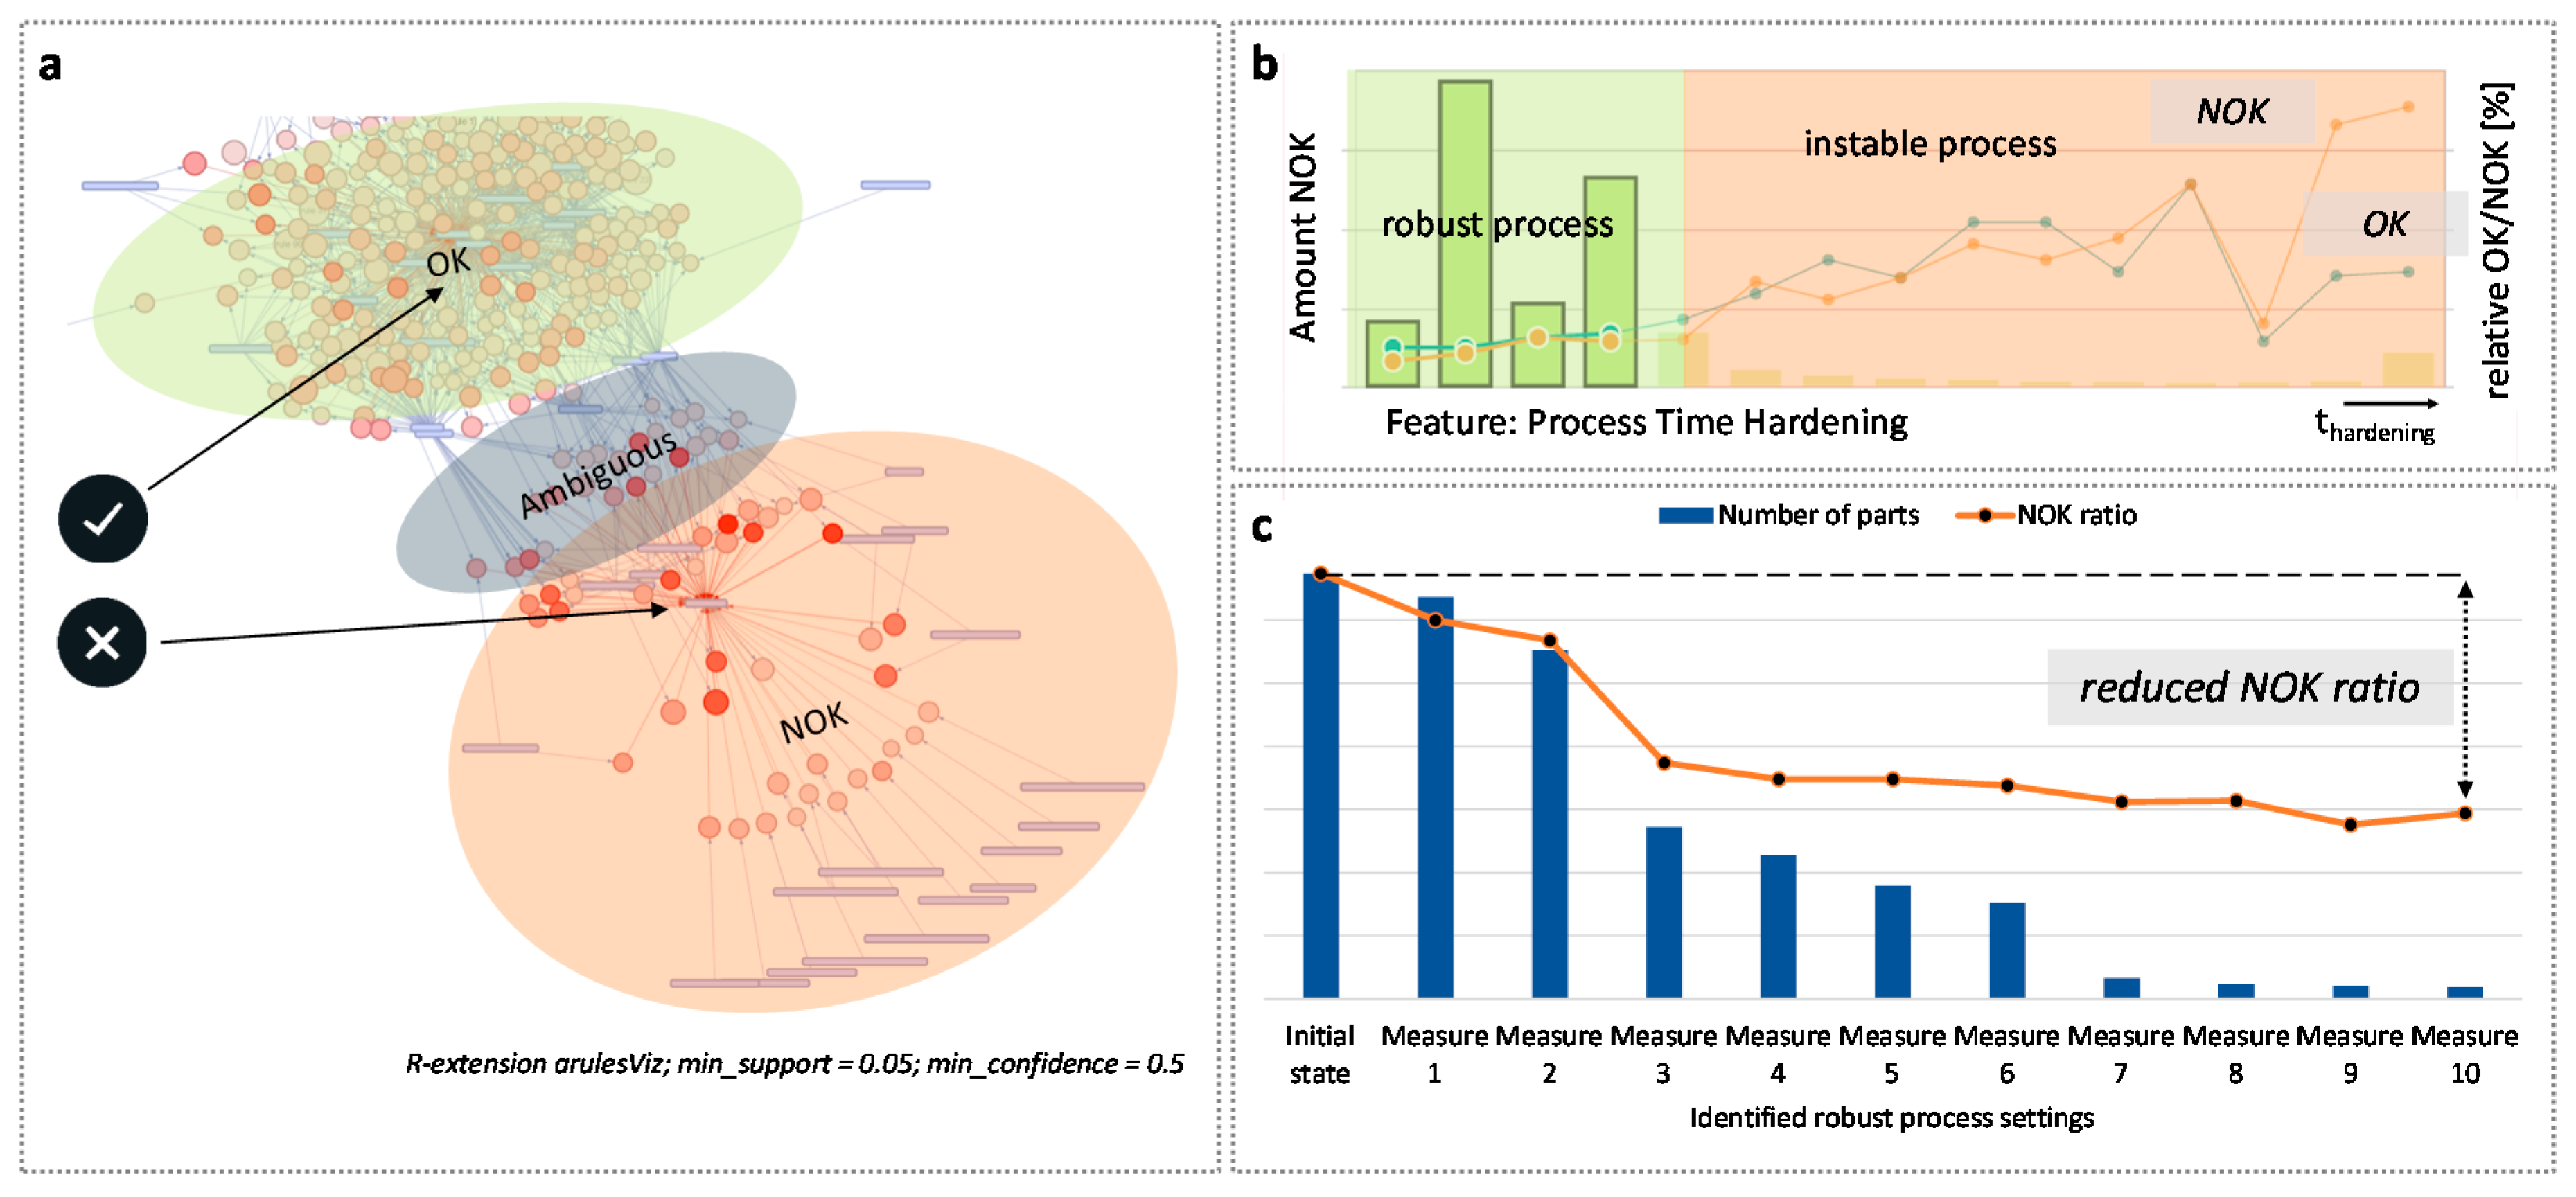
Within the cyber world, a hybrid approach in terms of data mining (i.e., class association rules mining) and visual analytics is pursued. The acquired raw data require some preprocessing steps. Most importantly, discretization and balancing—e.g., random under-sampling, are performed. For class association rule mining, the a-priori algorithm of the R package is used in conjunction with a fixed right-hand side (i.e., binary product quality). Depending on the defined model parameters, e.g., minimum threshold for confidence and support, shallow or more complex rules are extracted. These rules are further analyzed through a graph-based visual analytics approach—see
Figure 9a. The plot reveals 800 rules that can be allocated to three clusters: the top left cluster represents stable process parameters; the bottom right encompasses process parameters with a higher error induction, and lastly one cluster covers parameters with ambiguous allocations to the distinct ones. Additionally, the plot characteristics, such as the hue—i.e., the darker the color, the higher the lift value of a rule—and positioning—e.g., close position to a class highlights strong dependency—support the analyst in interpretation.
The VQG delivers operational and tactical decision support on measures for stable process parameters and state variables on a continuous range, e.g., hardening time, less than the specific value of the threshold. These measures deviate from the identified set of most influential rules and can be interactively analyzed within a business intelligence tool (e.g., Qlik), as shown in
Figure 9b, for the feature hardening time. These tools allow the analyst to examine the influence and sensitivity of parameters on the NOK ratio as well as cumulative effects through overlaying filters.
Figure 9c shows the effect on the NOK ratio (orange line) caused by cumulative measures. Within this use case based on the ten most influential measures, a significant reduction in the NOK ratio is indicated. However, only a small share of the whole data set is manufactured under the identified conditions yet (blue bars). The identified measures need to be validated and can serve as key variables for an online process monitoring and control.
5.3. Case Study III: VQG in Printed Circuit Board Production
This case study covers the printed circuit board (PCB) assembly in electronic production. Observed defects are often a combination of effects from several processes. To improve the overall quality and reduce scrap and rework, it is necessary to consider the complete process chain instead of single and isolated processes. Therefore, it is important to understand dynamics and interdependencies within the manufacturing system. To derive proper QM strategies, knowledge about the propagation and the detection of IPF changes along the process chain is essential [
26,
27].
Within this case study, different intermediate product states based on IPF are defined. Moreover, by using machine learning algorithms, intermediate product states with similar IPF are assigned to product classes. By visualizing the propagation of these classes through the complete manufacturing system, the process and product quality transparency can be improved. In addition, the concept is supposed to allow the analysis of interactions and the product state propagation within the manufacturing system.
The physical world of the following case study focusses on the printed circuit board (PCB) assembly in electronic production. The PCB production line adopted for this case study focusses on surface-mounted technology (SMT). Here, the individual components are placed on the surface of the PCB and soldered conductively. During the printing process, soldering paste is dispersed onto the surface of the PCB. This is followed by the solder paste inspection (SPI). To ensure a reliable connection of the components, a defined amount of solder paste is needed and variations in the solder paste volume have to be minimized. The products are then inserted into the pick and place (P&P) machine. The P&P machine places the individual components on the liquid solder in several sequential steps. After placing all components on the board, the PCB pass through a reflow oven in which the solder is melted and the connection pins are firmly soldered to the PCB. The automated optical inspection (AOI) checks the PCB after the reflow oven as a final examination at the end of line. All PCBs are checked 100% (full inspection and non-destructive) at the two considered physical inspection stations, SPI and AOI, and deliver the underlying data basis.
Within data acquisition, data types such as integer and float are measured. These are, in particular, values from the inspection process such as solder height or angle of a component on the PCB. Moreover, intermediate product properties results are considered at each inspection station in terms of binary classification in good parts (OK) and defects (NOK). The inspection data are accessed by a MES that is connected to the machines via different protocols such as UPC-UA or MQTT. The data are managed in a structured database within a cloud solution. The tracking and tracing is based on a unique barcode that is assigned to each PCB. Moreover, a DMC is lasered into the PCB surface for identification purposes. All data are directly assigned to the barcode, which enables a clear assignment of data to the respective product.
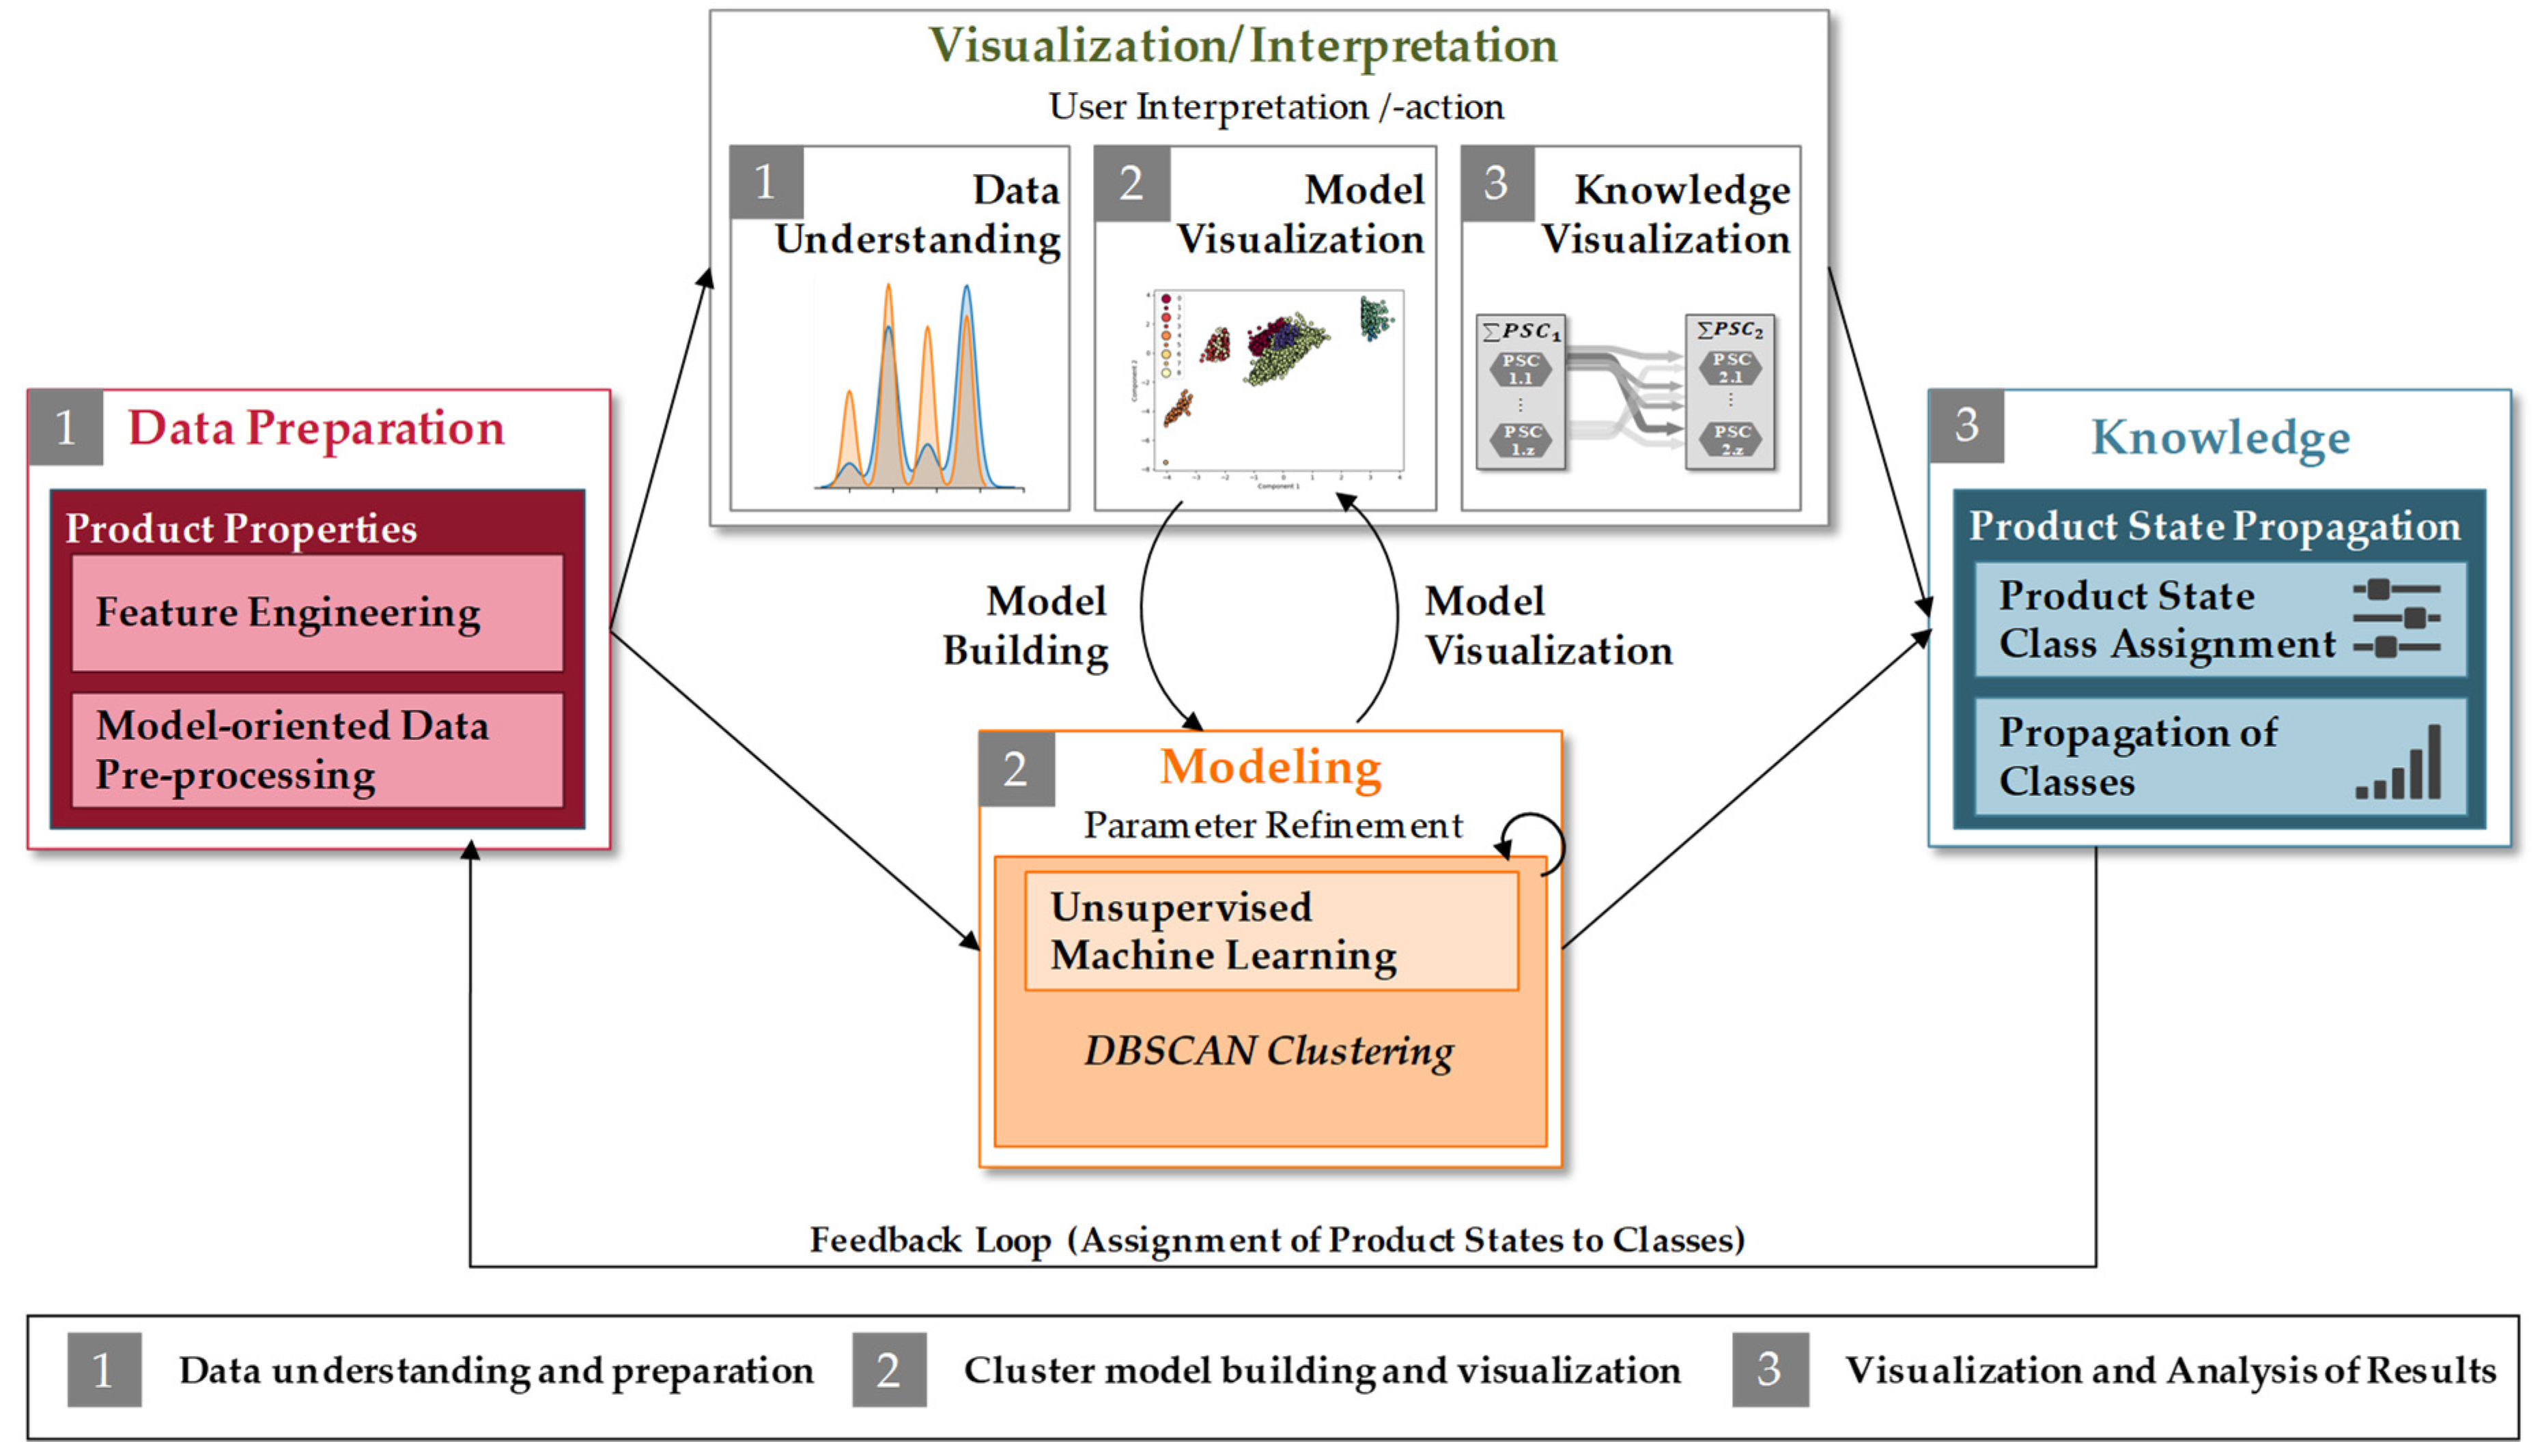
Within the cyber world, a data-driven visual analytics approach is chosen using unsupervised machine learning, which is proposed in
Figure 10.
To analyze the propagation of different products along the manufacturing process chain, IPFs are clustered to define intermediate product classes (IPCs). The approach draws on clustering methods that need less parameterization effort and supports the resulting models’ interplay with visualizations for model analysis and knowledge building. Here, in particular, one promising approach is density-based clustering. This type of clustering separates areas with a high density of data points from areas low in density. In the next step, areas with high density are assigned to a cluster, whereas areas with low density are excluded as so-called noise. In order to be able to make a clear distinction between the two categories, a threshold for the minimum density within a cluster has to be defined [
56,
57]. The most common density-based algorithm is Density-Based Spatial Clustering of Applications with Noise (DBSCAN) which is also the underlying algorithm applied in this case study. The inspection results of SPI and AOI are treated as two different observations. Hence, the observation specific data are clustered separately. To build an appropriate clustering model, an iterative parameter refinement is performed.
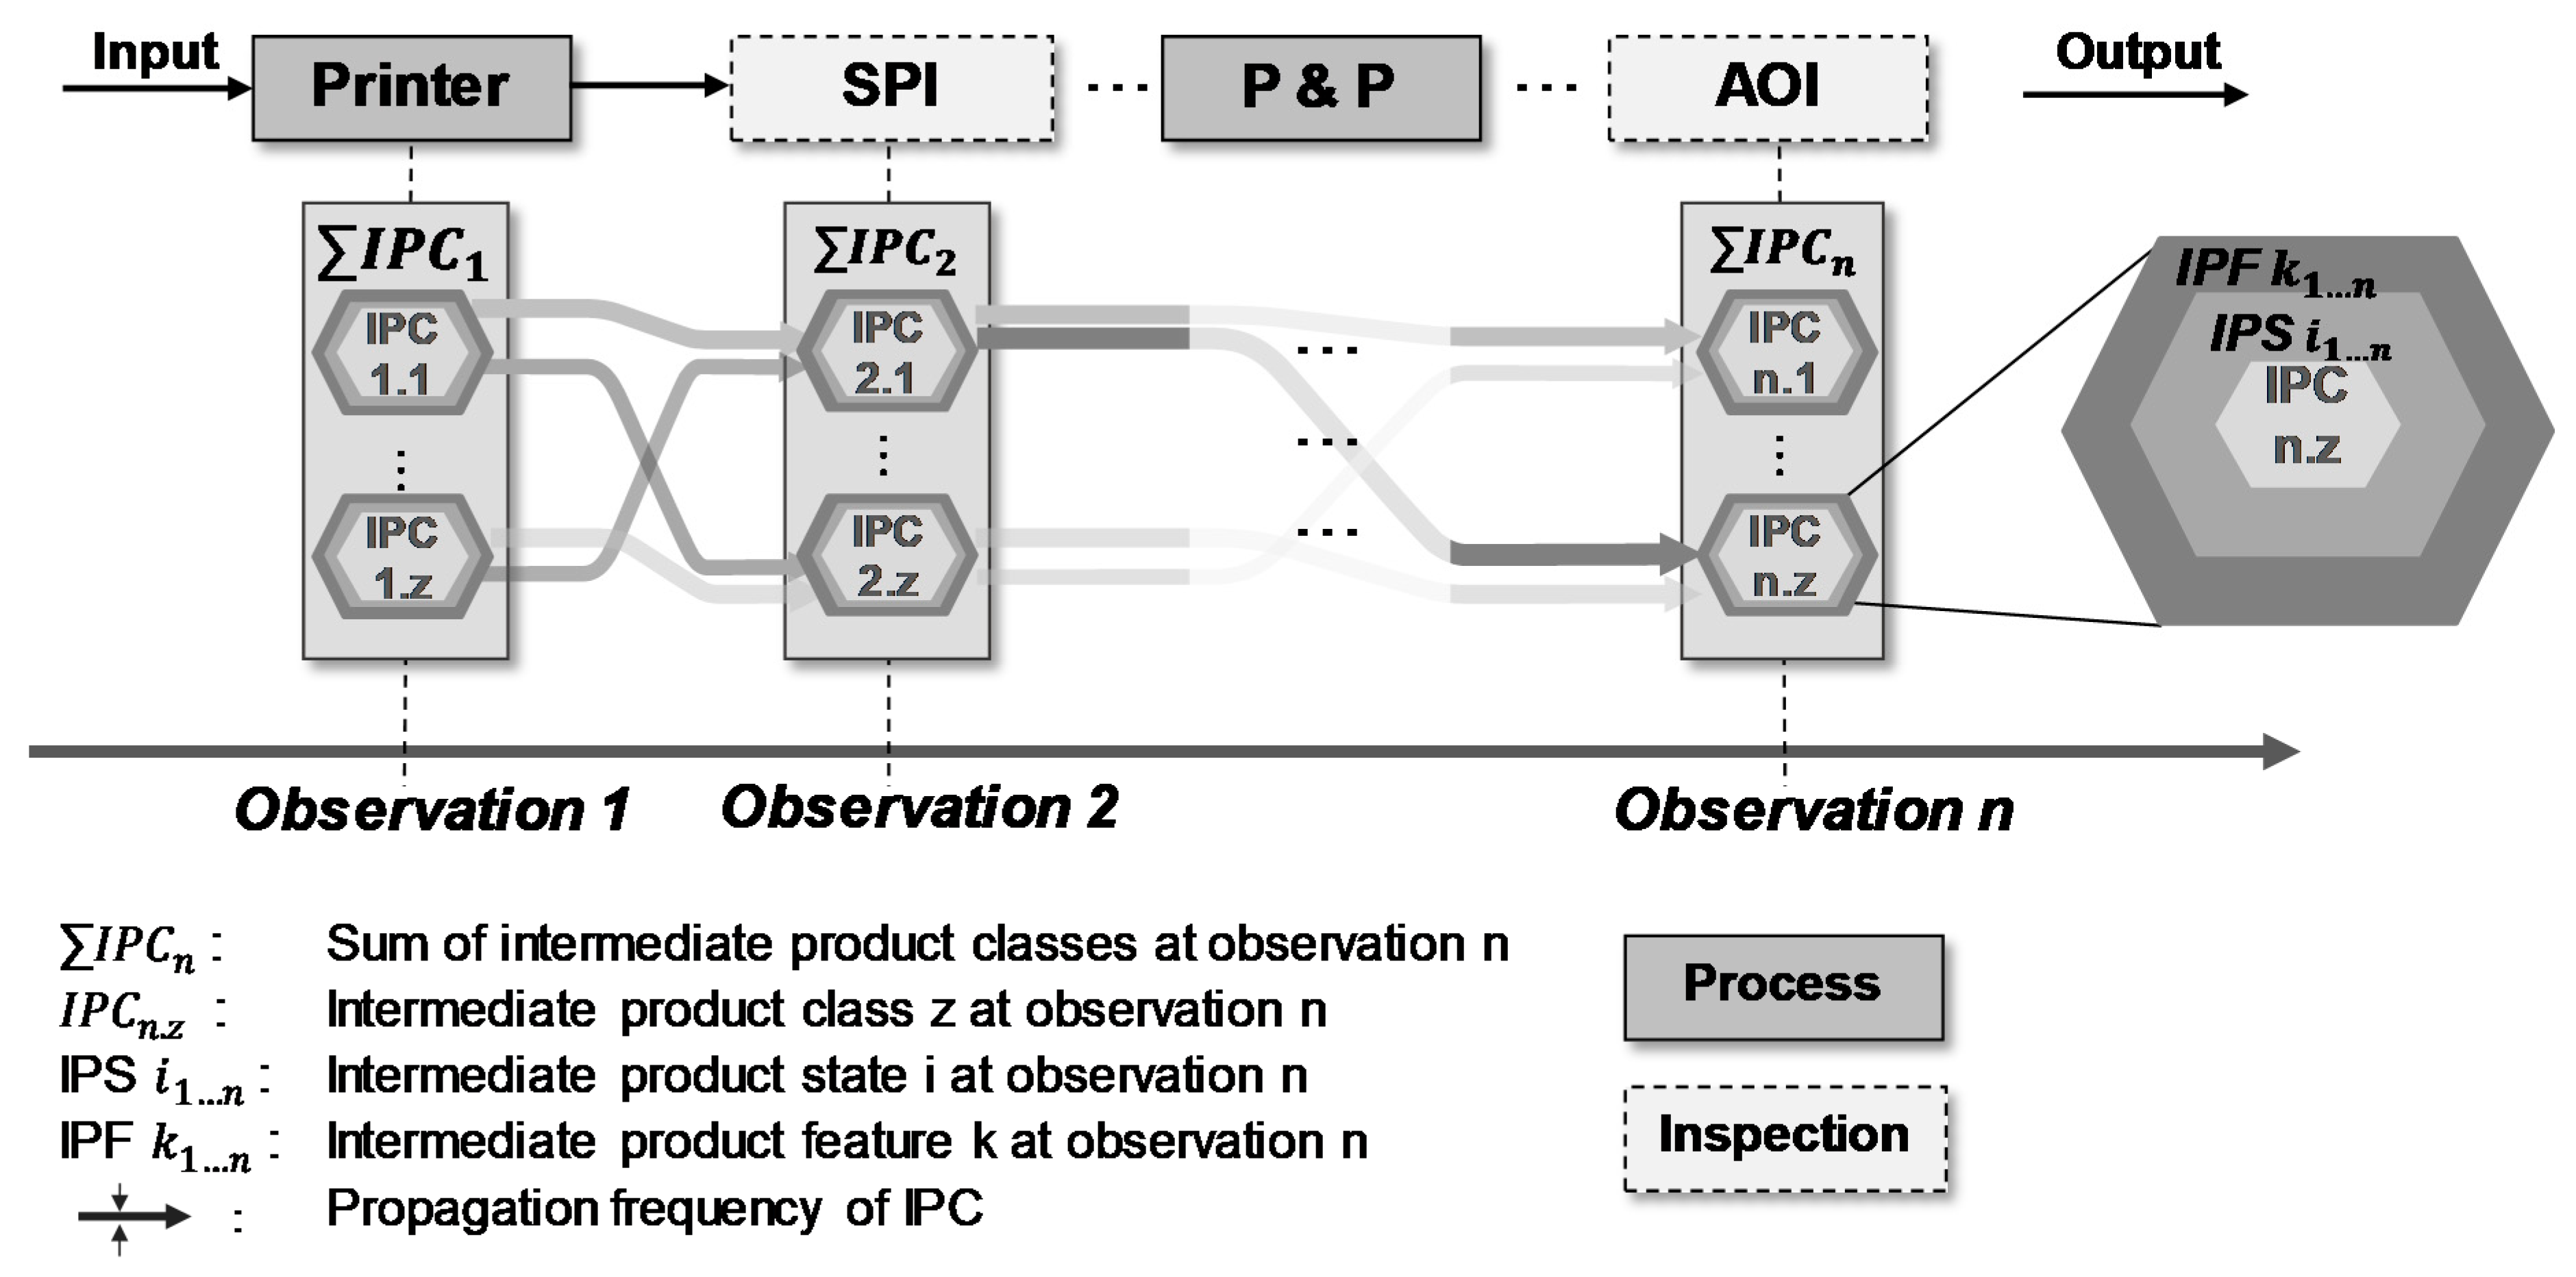
This approach delivers operational and tactical decision support by describing the propagation and analyzing interdependencies of the IPC within the manufacturing process chain of PCB assembly. Therefore, it is important to visualize existing IPC flows within the system. To gain even more insight into the characteristics of IPCs within electronic manufacturing process chains, the propagation from the inspection stations SPI to AOI is exemplarily shown by a Sankey diagram in
Figure 11.
The developed framework offers a structured approach to analyze the propagation of IPCs along the manufacturing process chain. Based on this, the behavior of different products within a manufacturing system can be tracked and specific control strategies can be derived. The approach is iterative with multiple visualizations in order to achieve valid model parameters.
6. Conclusions
The results of this paper show a guided framework for the design and implementation of VQGs to improve the quality in the manufacturing system while maintaining high transparency regarding the product and process quality with a low cost at the same time. Within the framework, the individual characteristics of the VQG are assigned to the four levels of the CPPS. Moreover, different possible functions are linked to each characteristic. To ensure accessibility and applicability and to support the design and implementation of VQGs, the framework is based on a morphological box.
In order to illustrate the design and implementation options, three different case studies were introduced in this paper to discuss the implementation and use of VQGs.
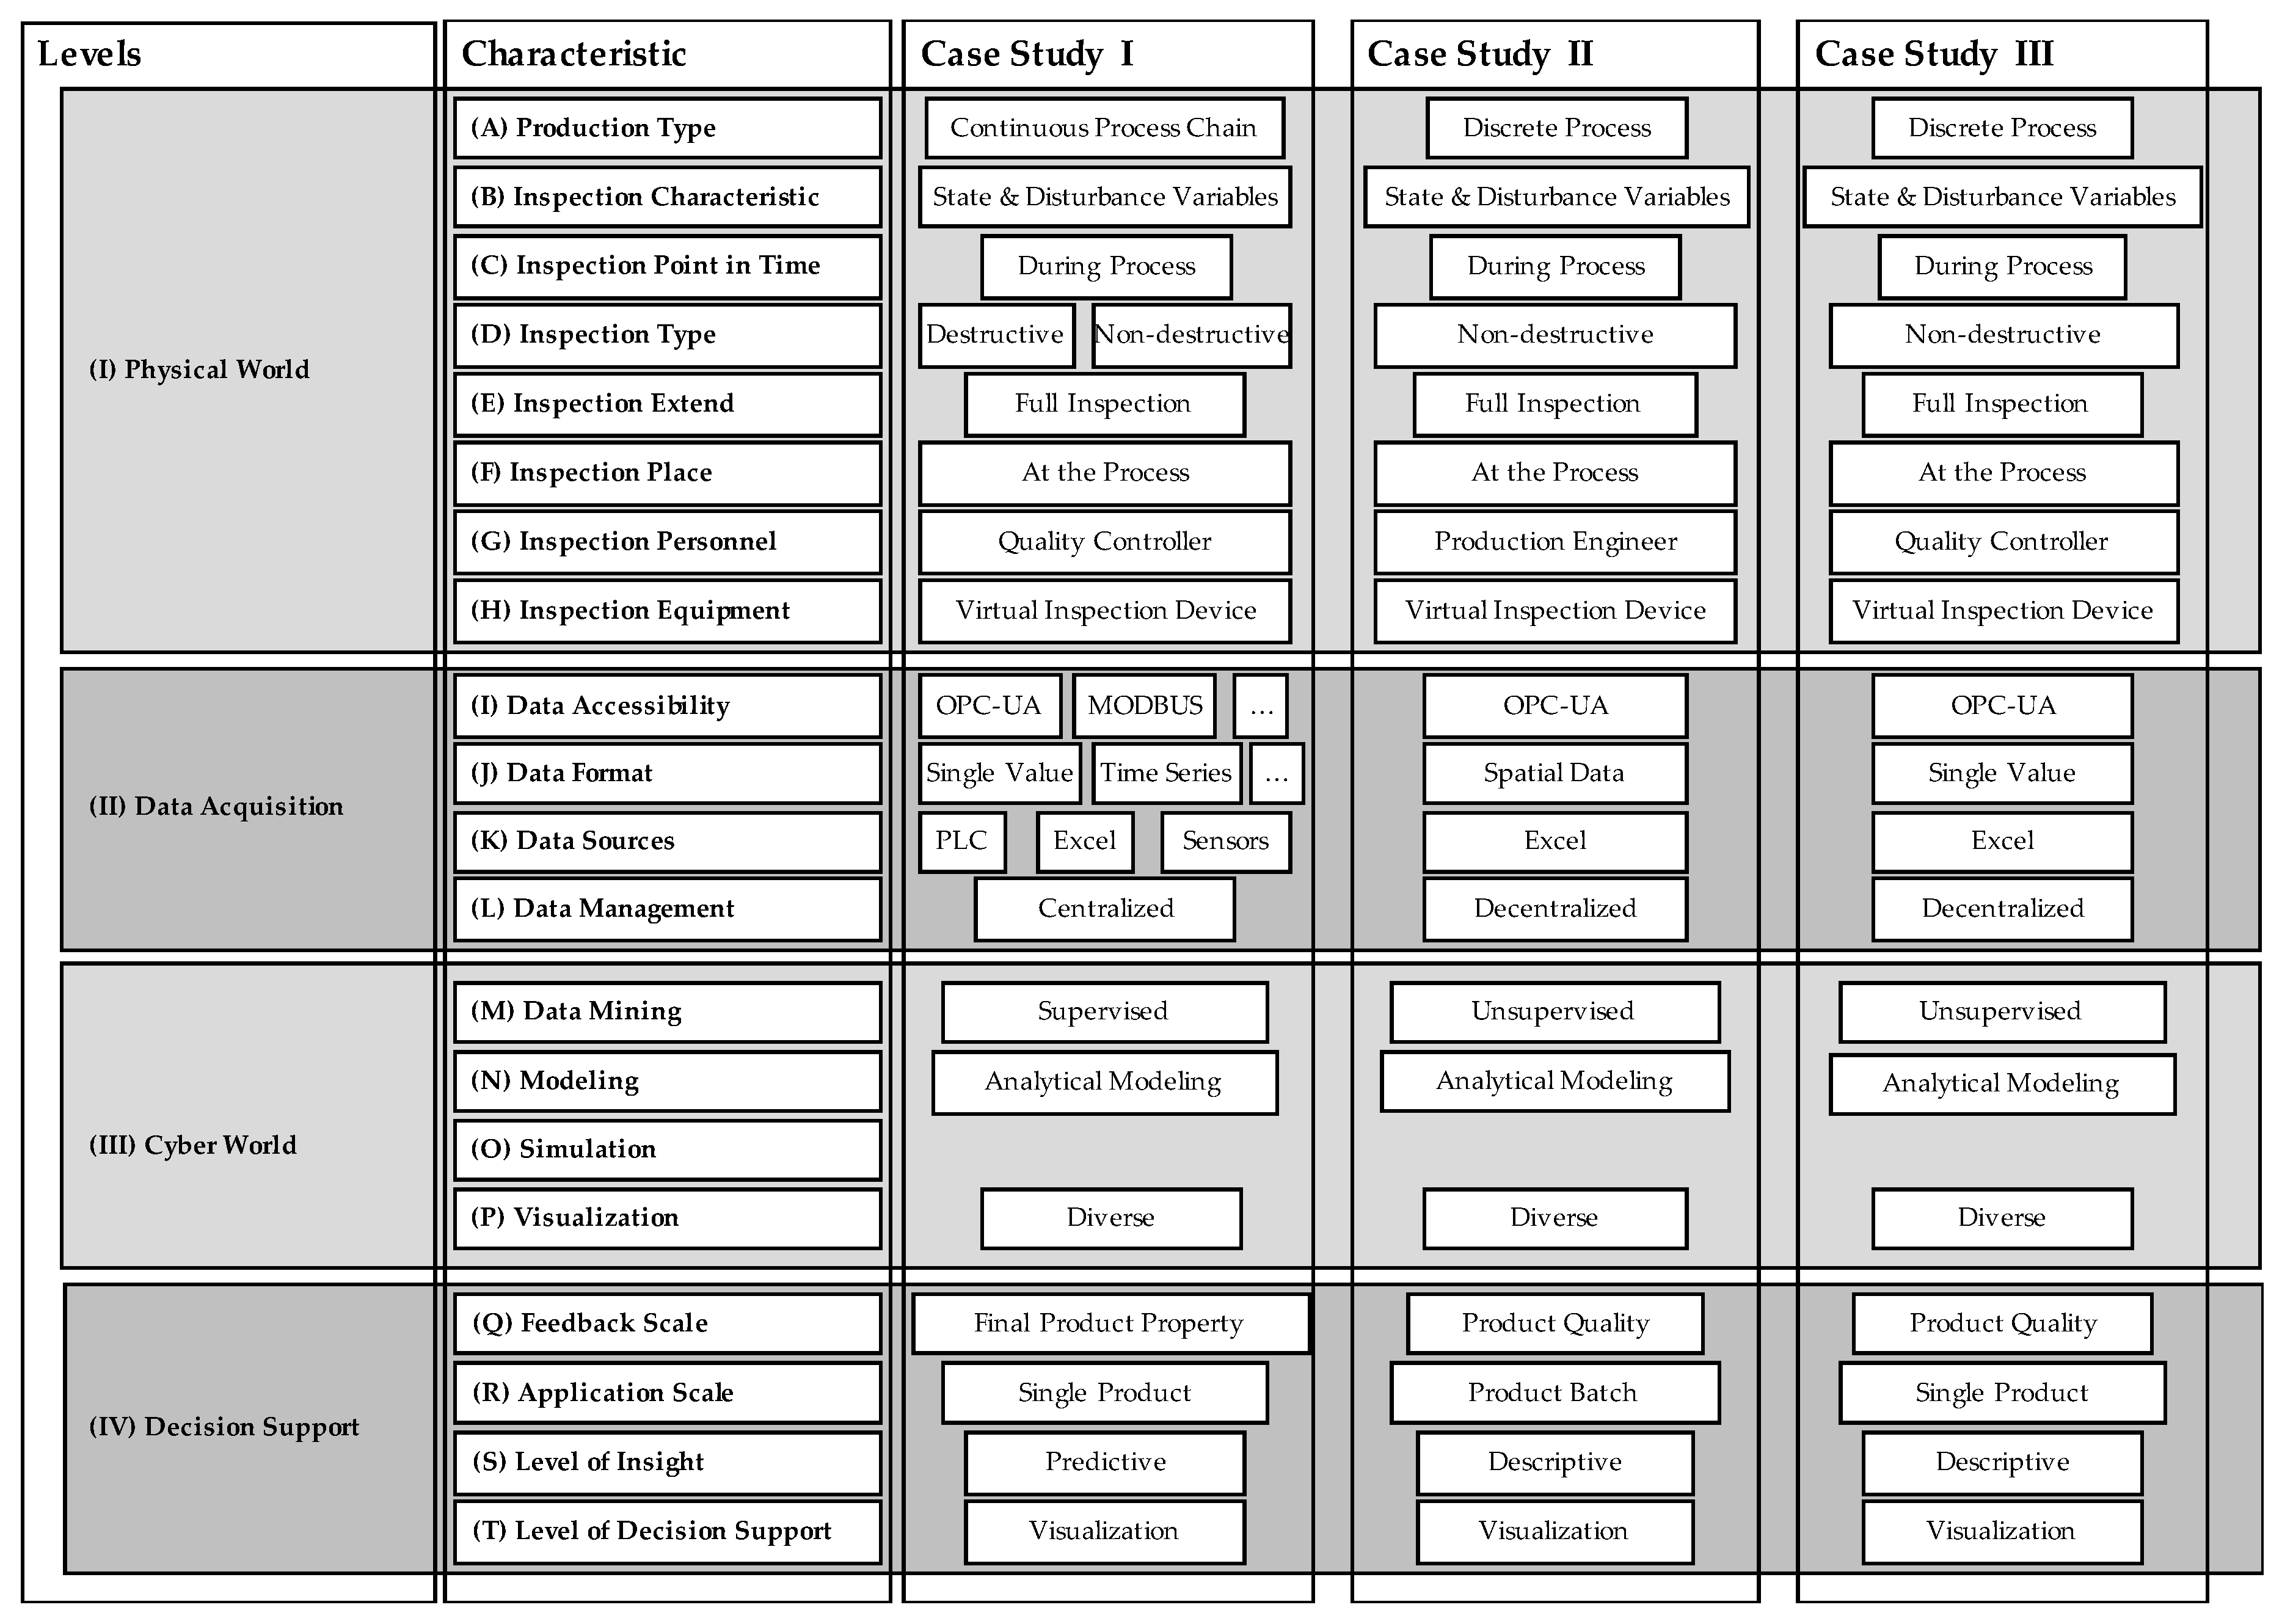
Figure 12 gives an overview of different VQG specifications based on case studies I to III, discussed in
Section 5. The different case studies are characterized by their specification for the different levels of the CPPS.
The case studies discussed in this paper clearly show that the developed framework can be used to implement VQGs in numerous ways. Moreover, all three examples show applications in different industrial sectors with different hardware and software components (e.g., data format and data sources). Furthermore, with the help of the presented framework, physical inspection equipment can be substituted resulting in reduced quality costs and the transparency of product quality in the manufacturing system can be increased by acquiring and modeling respective data within a CPPS. With focus on the implementation of VQGs, the logical structure of the morphological box provides a structured decision support to select from different possible functions and combines those to an individual VQG solution. Moreover, an extension of the morphological box, e.g., by new technologies, is supported and thus a high flexibility is given.
7. Outlook
Further research directions will result in a detailed assessment of VQGs within manufacturing systems by an economic and ecological quantification of their potential to minimize the total cost of quality by optimizing the trade-off between error cost and cost of error prevention. Moreover, further research is needed to define product-specific inspection strategies that are performed flexibly within the manufacturing system based on VQGs. An increased amount of data in the manufacturing environment leverage the application fields of VQG. Therefore, new data-based prediction models and pipelines need to be developed to increase the accuracy and applicability of those technologies in the manufacturing context to foster the transformation towards future production systems. Especially in this context, further research needs to focus on generalizing (e.g., quality prediction) models to deploy developed solutions across different industries. Especially in this context, the potential and challenges of, e.g., transfer learning in the manufacturing context, must be evaluated. Since VQGs are based on diverse data sources, the trustworthiness of these data is of high importance, especially in the field of quality control. Here, further research to ensure the trustworthiness of manufacturing data and to leverage the field of data security especially within the manufacturing environment can be addressed.

 ,
, 


