
Inspecting Buildings Using Drones and Computer Vision: A Machine Learning Approach to Detect Cracks and Damages
by
 , and
, and
Hafiz Suliman Munawar
1,2, 
Fahim Ullah
1,* ,
,
Amirhossein Heravi
1,
Muhammad Jamaluddin Thaheem
3 and
Ahsen Maqsoom
4
1
School of Surveying and Built Environment, University of Southern Queensland, Ipswich, QLD 4300, Australia
2
School of Built Environment, University of New South Wales, Sydney, NSW 2052, Australia
3
School of Architecture and Built Environment, Deakin University, Geelong, VIC 3220, Australia
4
Department of Civil Engineering, COMSATS University Islamabad, Wah Cantt 47040, Pakistan
*
Author to whom correspondence should be addressed.
Drones 2022, 6(1), 5; https://doi.org/10.3390/drones6010005
Submission received: 14 November 2021
/
Revised: 9 December 2021
/
Accepted: 18 December 2021
/
Published: 24 December 2021
(This article belongs to the Special Issue Drones in the Built Environment: Applications in Construction, Architecture, Transportation, Urban and Regional Planning)
Abstract
:Manual inspection of infrastructure damages such as building cracks is difficult due to the objectivity and reliability of assessment and high demands of time and costs. This can be automated using unmanned aerial vehicles (UAVs) for aerial imagery of damages. Numerous computer vision-based approaches have been applied to address the limitations of crack detection but they have their limitations that can be overcome by using various hybrid approaches based on artificial intelligence (AI) and machine learning (ML) techniques. The convolutional neural networks (CNNs), an application of the deep learning (DL) method, display remarkable potential for automatically detecting image features such as damages and are less sensitive to image noise. A modified deep hierarchical CNN architecture has been used in this study for crack detection and damage assessment in civil infrastructures. The proposed architecture is based on 16 convolution layers and a cycle generative adversarial network (CycleGAN). For this study, the crack images were collected using UAVs and open-source images of mid to high rise buildings (five stories and above) constructed during 2000 in Sydney, Australia. Conventionally, a CNN network only utilizes the last layer of convolution. However, our proposed network is based on the utility of multiple layers. Another important component of the proposed CNN architecture is the application of guided filtering (GF) and conditional random fields (CRFs) to refine the predicted outputs to get reliable results. Benchmarking data (600 images) of Sydney-based buildings damages was used to test the proposed architecture. The proposed deep hierarchical CNN architecture produced superior performance when evaluated using five methods: GF method, Baseline (BN) method, Deep-Crack BN, Deep-Crack GF, and SegNet. Overall, the GF method outperformed all other methods as indicated by the global accuracy (0.990), class average accuracy (0.939), mean intersection of the union overall classes (IoU) (0.879), precision (0.838), recall (0.879), and F-score (0.8581) values. Overall, the proposed CNN architecture provides the advantages of reduced noise, highly integrated supervision of features, adequate learning, and aggregation of both multi-scale and multilevel features during the training procedure along with the refinement of the overall output predictions.
1. Introduction and Background
A holistic monitoring system forms an integral component for the safety assessment of civil infrastructures. Early detection and associated maintenance of civil infrastructures are highly necessitated to reduce the damages and other serious losses in terms of economy and human fatality [1]. To allow for efficient means of damage assessment, cutting-edge technologies are leveraged to ensure that civil infrastructures remain healthy and losses of human lives and finances are minimized, if not eliminated [2,3]. This forms an important area for current research as the traditional manual visual inspection methods used to assess the structural health of civil infrastructures display numerous limitations [4].
Reliable, speedy, and efficient crack detection methods are critical to inspecting the health of structures as it determines their safety and durability [5]. The results of traditional (manual) crack detection methods are highly dependent on the expertise and the approaches used by the investigators. Such manual inspection is performed through the analysis of crack (i.e., positioning and widths), where the obtained results are subjective and vary based on the skillset of the individual inspector [6]. Such limitations lead to improper damage assessment in critical infrastructure [7,8]. Therefore, there is an earnest need for automated techniques to efficiently detect cracks in civil infrastructure by overcoming the limitations of manual methods.
Numerous computer vision-based approaches have been applied to address the limitations of image segmentation and crack detection [9]. Most of these crack detection methods employ various edge detection techniques, such as fast Haar transform, fast Fourier transform, or the Sobel and Canny operator [10]. However, the robustness of the basic edge detection methods is highly dependent upon the image contrast and background uniformity [11]. Therefore, hybrid strategies have been utilized to improve and augment the automatic detection of cracks in concrete images [12,13].
A candidate approach for such automated damage detection is image processing (IP). IP techniques enable the recognition of cracks from the crack image set and enable its key measurements such as orientation and width [14,15,16]. Several studies based on IP methods have been reported in the literature for the detection of damages in concrete structures, including cracks [17,18,19], potholes [20], and damage to asphalt pavements [21]. Largely, the IP techniques are sufficient and effective for detecting cracks in specific images. However, their robustness is affected due to the appearance of different objects, such as light, shadows, rough surfaces, and other disturbances from real-world cases [22].
Generally, different methods, including computer vision and IP techniques, have been applied for damage detection but they have their limitations that can be overcome by using various hybrid approaches based on artificial intelligence (AI) and machine learning (ML) techniques [23,24,25,26]. Therefore, to enhance the performance of IP-based methods for crack detection, the current research utilizes AI and ML techniques [27]. The ML approaches use IP techniques for feature extraction to identify cracks or other damages [28]. The utility of various methods, including artificial neural networks (ANNs) and support vector machines (SVM), lead to the detection of concrete cracks and other damages to structures, whereby the performance is highly dependent on extracted crack features. Furthermore, such feature extraction is affected by identifying false features during IP. Therefore, the convolutional neural networks (CNNs) are used to detect cracks in images by discarding the extraction process of crack features [29,30].
The CNN-based methods are generally derived from ANNs but display better learning of image features and require few parameters in comparison. This is mainly due to partial connections, weights, and pooling processes amid neurons [31]. Compared to traditional methods, the CNN-based crack detection framework does not require the pre-extraction and calculation of features [32]. Moreover, CNN is based on automatic learning of crack features and does not require format conversion of input images [33]. Furthermore, the CNN-based crack detection architecture displays higher accuracy than the traditional methods [34,35,36]. Due to its ability to learn to extract the optimal features, with proper training, it can achieve superior damage detection and localization accuracy despite the noise and uncorrelated patterns. CNNs have three architectural frameworks: local receptive fields, shared weights, and spatial sub-sampling [35]. Local receptive fields allow extracting multiple feature maps by sliding the same set of units all over the input. This property makes CNN robust to the translation and distortion of the input. CNN configurations can easily achieve a high detection performance compared to other techniques that can even defy a human expert inspector.
The applications of cyclic generative adversarial networks (CycleGAN) in deep learning (DL) have considerably increased over the recent years providing training of models in the max-min two-player manner [37]. The broader applicability of CycleGAN has led to the consideration of crack detection in concrete surfaces as an image-to-image translation problem. Owing to this, the crack images can be translated to the ground truth, like images exhibiting similar structural patterns [38]. The current study proposes a CNN architecture based on 16 convolution layers and CycleGANs to detect cracks in Sydney-based mid to high rise buildings constructed since the year 2000. The proposed CNN-based classifier can be effectively applied for crack detection on a larger scale due to the utilization of CycleGAN. This allows the generation of reliable and realistic images without the requirement of using paired examples for training [29,31,32,34,38,39]. In the current study for the GAN, a fully connected layered generator configuration was used to generate images with random noise [39]. It assists in the automatic training of models in an unsupervised manner based on images from the source and target domain without being related.
Sydney is selected as a case study due to its unique qualities as a developed coastal city in Australia. It has a population of more than five million with hundreds of mid to high-rise buildings and tall structures. The only other city matching the qualities of Sydney is Melbourne. However, due to COVID-19 based lockdowns and restrictions on interstate travel, the study is restricted to Sydney only. In addition, structurally, the coastal climate of Sydney makes its buildings vulnerable to quicker deterioration due to chemical attacks, such as excess carbon dioxide, Sulphur dioxide, chlorine, and efflorescence, salty water sprays, rains, and other sources.
Further, due to Sydney’s crowded central business district (CBD) containing the majority of high-rise buildings, monitoring vehicles access and free movement of construction equipment are constrained. In addition, a high number of personal cars, the existence of most of the corporate headquarters, newly constructed tram lines, and the congested and often blocked roads of the CBD add to the monitoring and regular maintenance difficulties of the buildings. These issues can be resolved using drones for regular building monitoring in Sydney and similar cities worldwide. The drones can quickly scan, monitor, and assess the building condition and speed up the maintenance process and requests due to the real-time data sharing with the maintenance organization’s head office for swift action. Further, the drones being smaller in size, lightweight, and free from interference with the local ground traffic, provide speed and convenience of monitoring. Furthermore, these drones present no danger to the aerial traffic as all air routes avoid tall buildings and the CBD areas in Sydney in general.
In this study, a modified CNN is used based on 16 convolution layers, and CycleGAN has been used to improve detection accuracy and avoid data augmentation. The proposed CNN-based framework can be used widely for automatic crack detection in infrastructures such as buildings with eased scaling to any device (i.e., jetson nano, coral dev board). Moreover, all the images used for the crack dataset in the current study were collected using efficient, cost- and time-effective UAVs (i.e., DJI-MJ200). After collecting the crack image set, data were pre-processed.
The rest of the paper is organized as follows. Section 2 presents the methodology section, where we elaborate on the data collection method, data pre-processing, and the proposed CNN architecture used for crack detection. Section 3 presents the development of the CNN, the U-Net model architecture, and the loss formulation. Section 4 presents the training of the proposed CNN model for crack detection, including the model training using U-Net and CycleGAN. Section 5 presents the performance evaluation of the training and test sets, including discussions on the evaluation metrics, training, and test accuracy, model parameters, and data augmentation. Section 6 presents the application of the proposed model, the key results, and pertinent discussions. Finally, Section 7 concludes the study, presents the key takeaways and limitations of the current study, and provides directions for future expansion based on the current study.
2. Methodology
For the proposed CNN-based crack detection architecture, we elaborate on the crack dataset used for the current study. This is followed by a detailed description of the model architecture, parameters used for modeling, the overall training of the model, and the final validation and testing of the crack detection model. The overall CNN-based architecture used for crack detection in infrastructures is provided in Figure 1a. First, the images extracted from the public dataset were included in the final set. In the second step pre-processing of the image dataset was performed, followed by per-pixel labeling and ground truth supervision. Then, the collected dataset was divided into the training and test sets (80%, 15%, and 5%), respectively. Next, the model was trained using CycleGAN and multi-scale features such as decode and fusion. Finally, the model was evaluated for both training and test sets, respectively.
For a CNN-based classification, image resizing according to input is needed to extract high-level features to perform image classification based on crack levels. In our study, we use two levels of cracks: crack and non-crack levels, respectively. A detailed description of the proposed CNN architecture for crack detection and its various steps is provided in the subsequent subsections.
2.1. Data Collection and Pre-Processing of Crack Images
The foremost step for the current study was to gather images of cracks in Sydney-based mid to high rise buildings with 5 stories and more using the available open-source image datasets and UAVs. Data collection through UAVs helps avoid interference with the normal building operations and provides flexible and cost-effective ways for capturing crack images [40]. The images from the locations (random buildings in Sydney), and building and crack types considered in this study are presented in Figure 2.
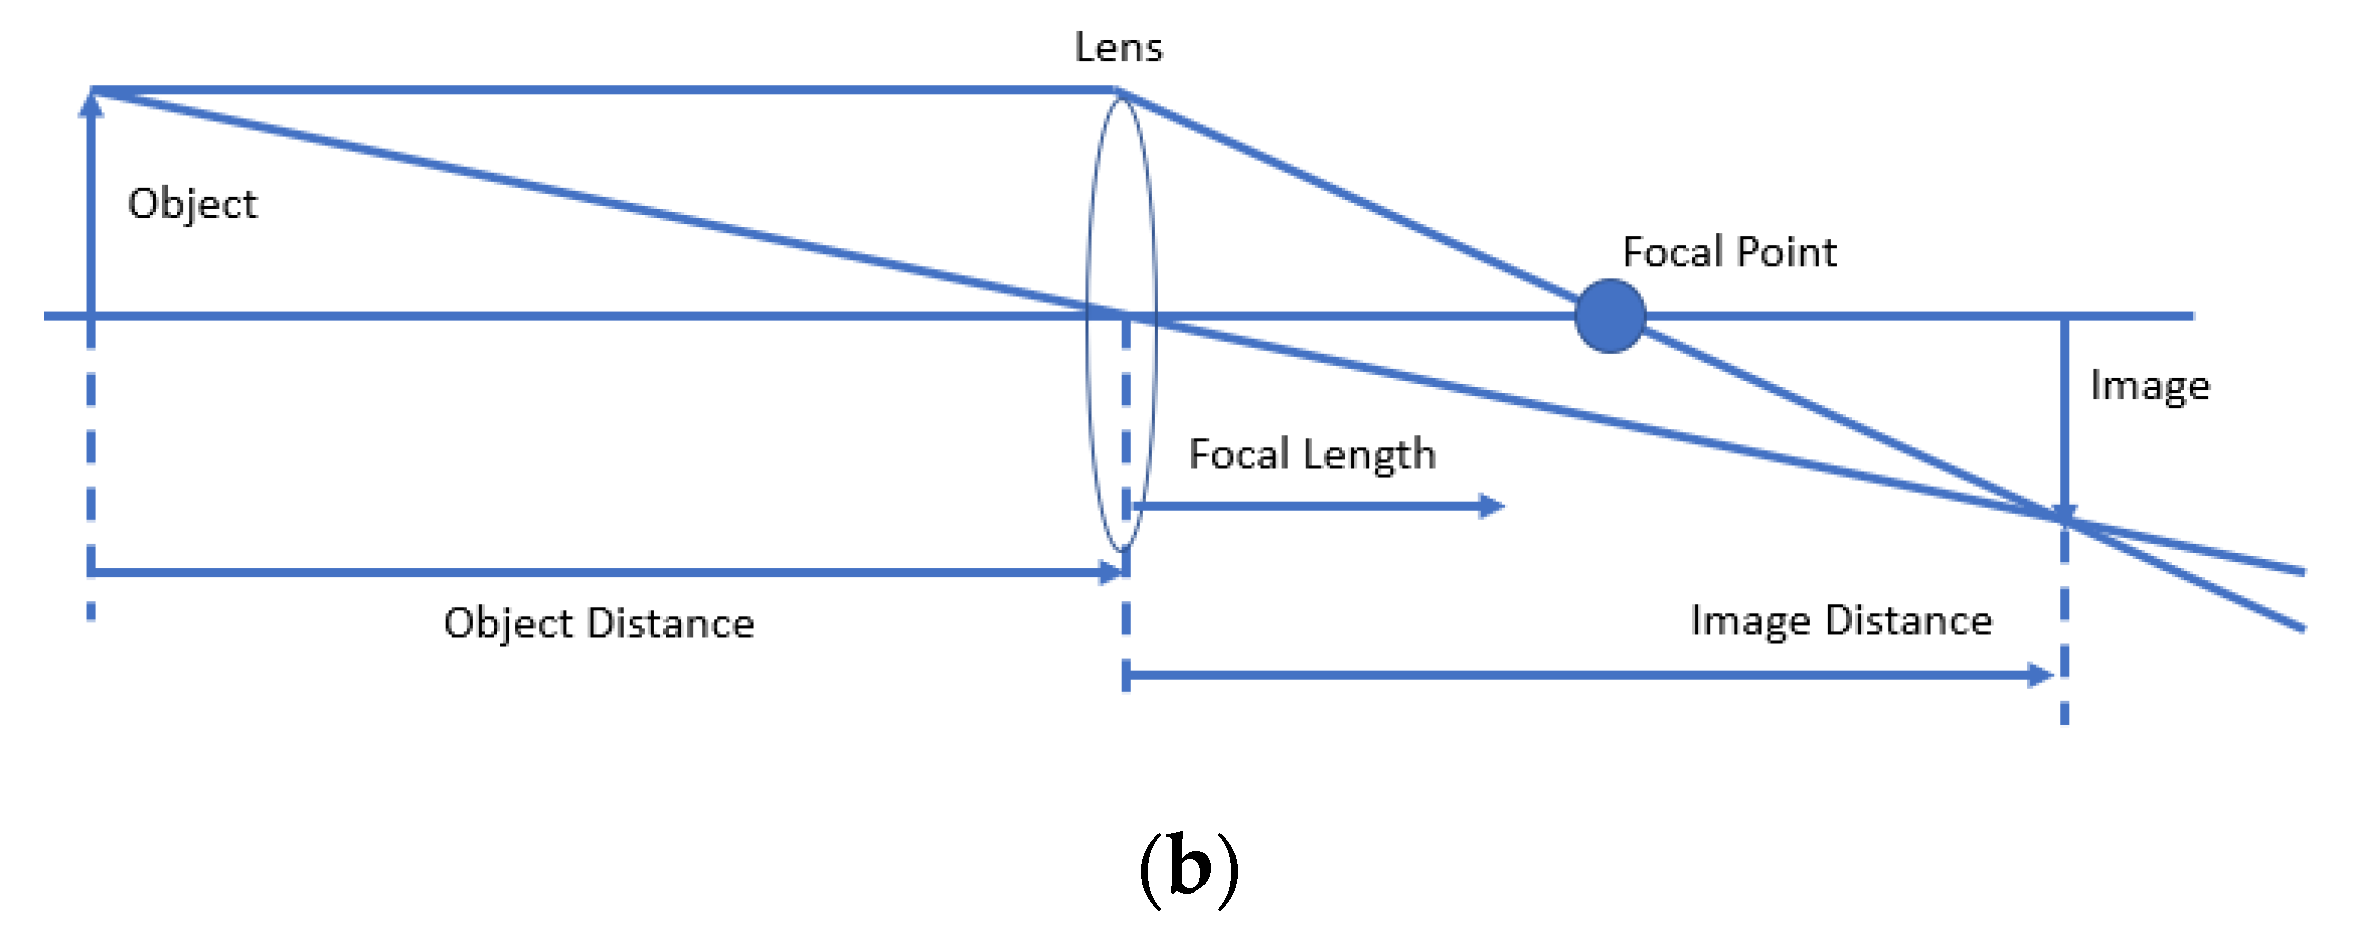
The camera installed on the UAV was used to capture the images. The lens collected the light from the object to create an image (Figure 1b). The size and location of the images depend on the location of the object and the focal length of the lens. The relationship between the object distance (o), the focal length (f), and the image distance (i) are given by . The object distance is simply the distance from the object to the center of the lens. The image distance is the distance from the center of the lens to the image. The focal length is a characteristic of the lens, and it specifies the distance at which parallel rays come to a focus. The field calibration at 20 m flight height was carried out with a focal length of 8.4 mm, format size of 7.5 mm, and principal point at 3.8 × 2.5.
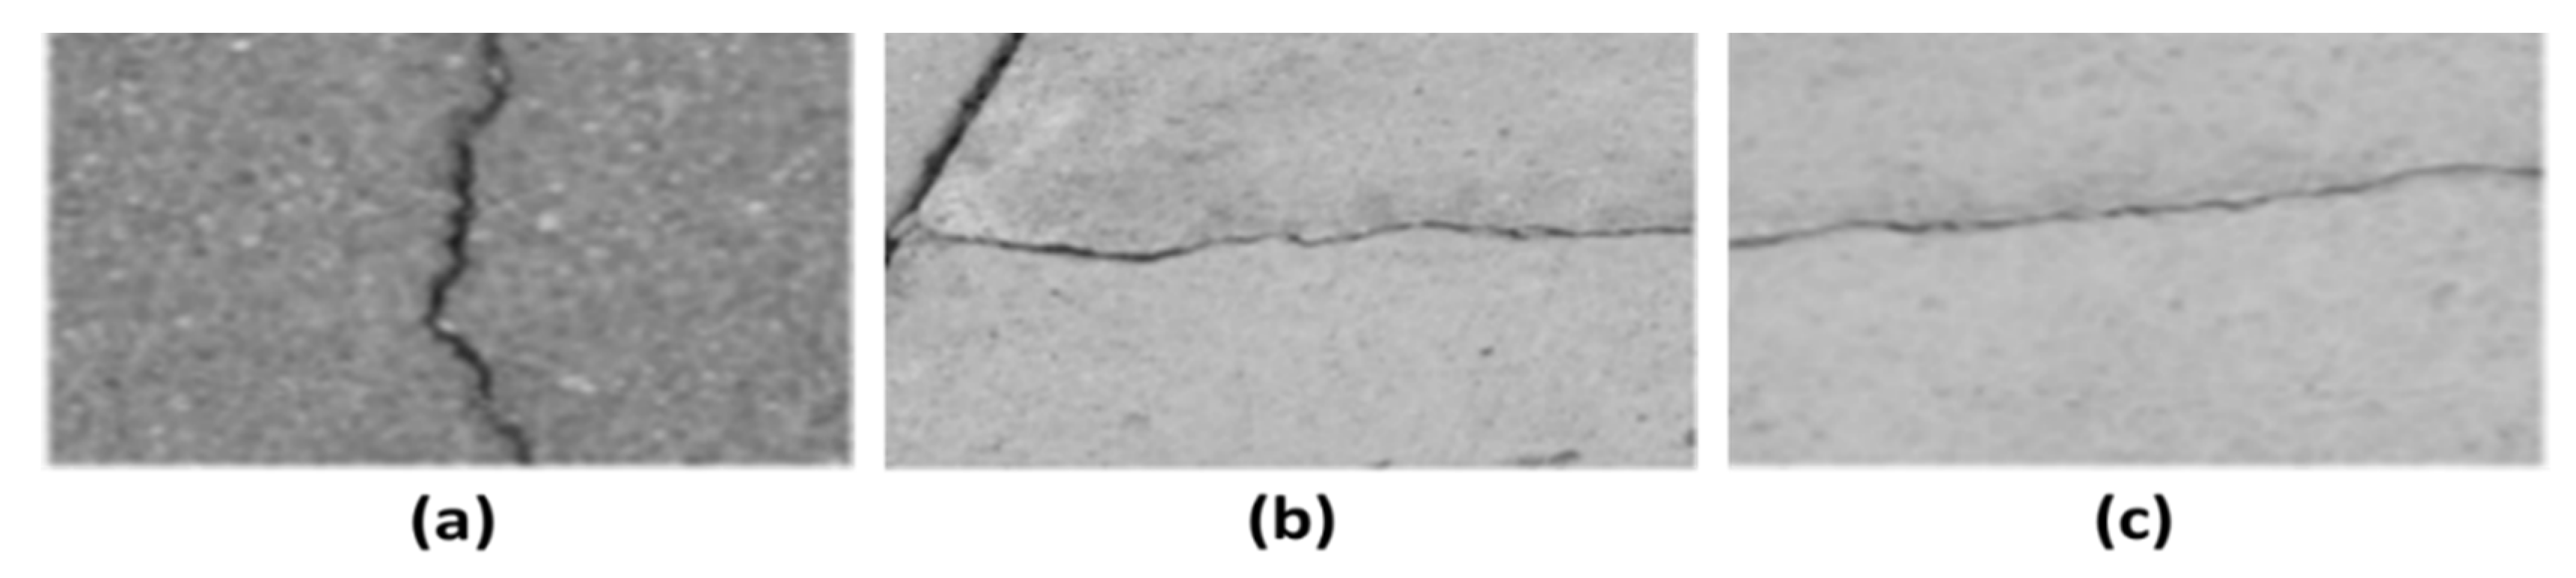
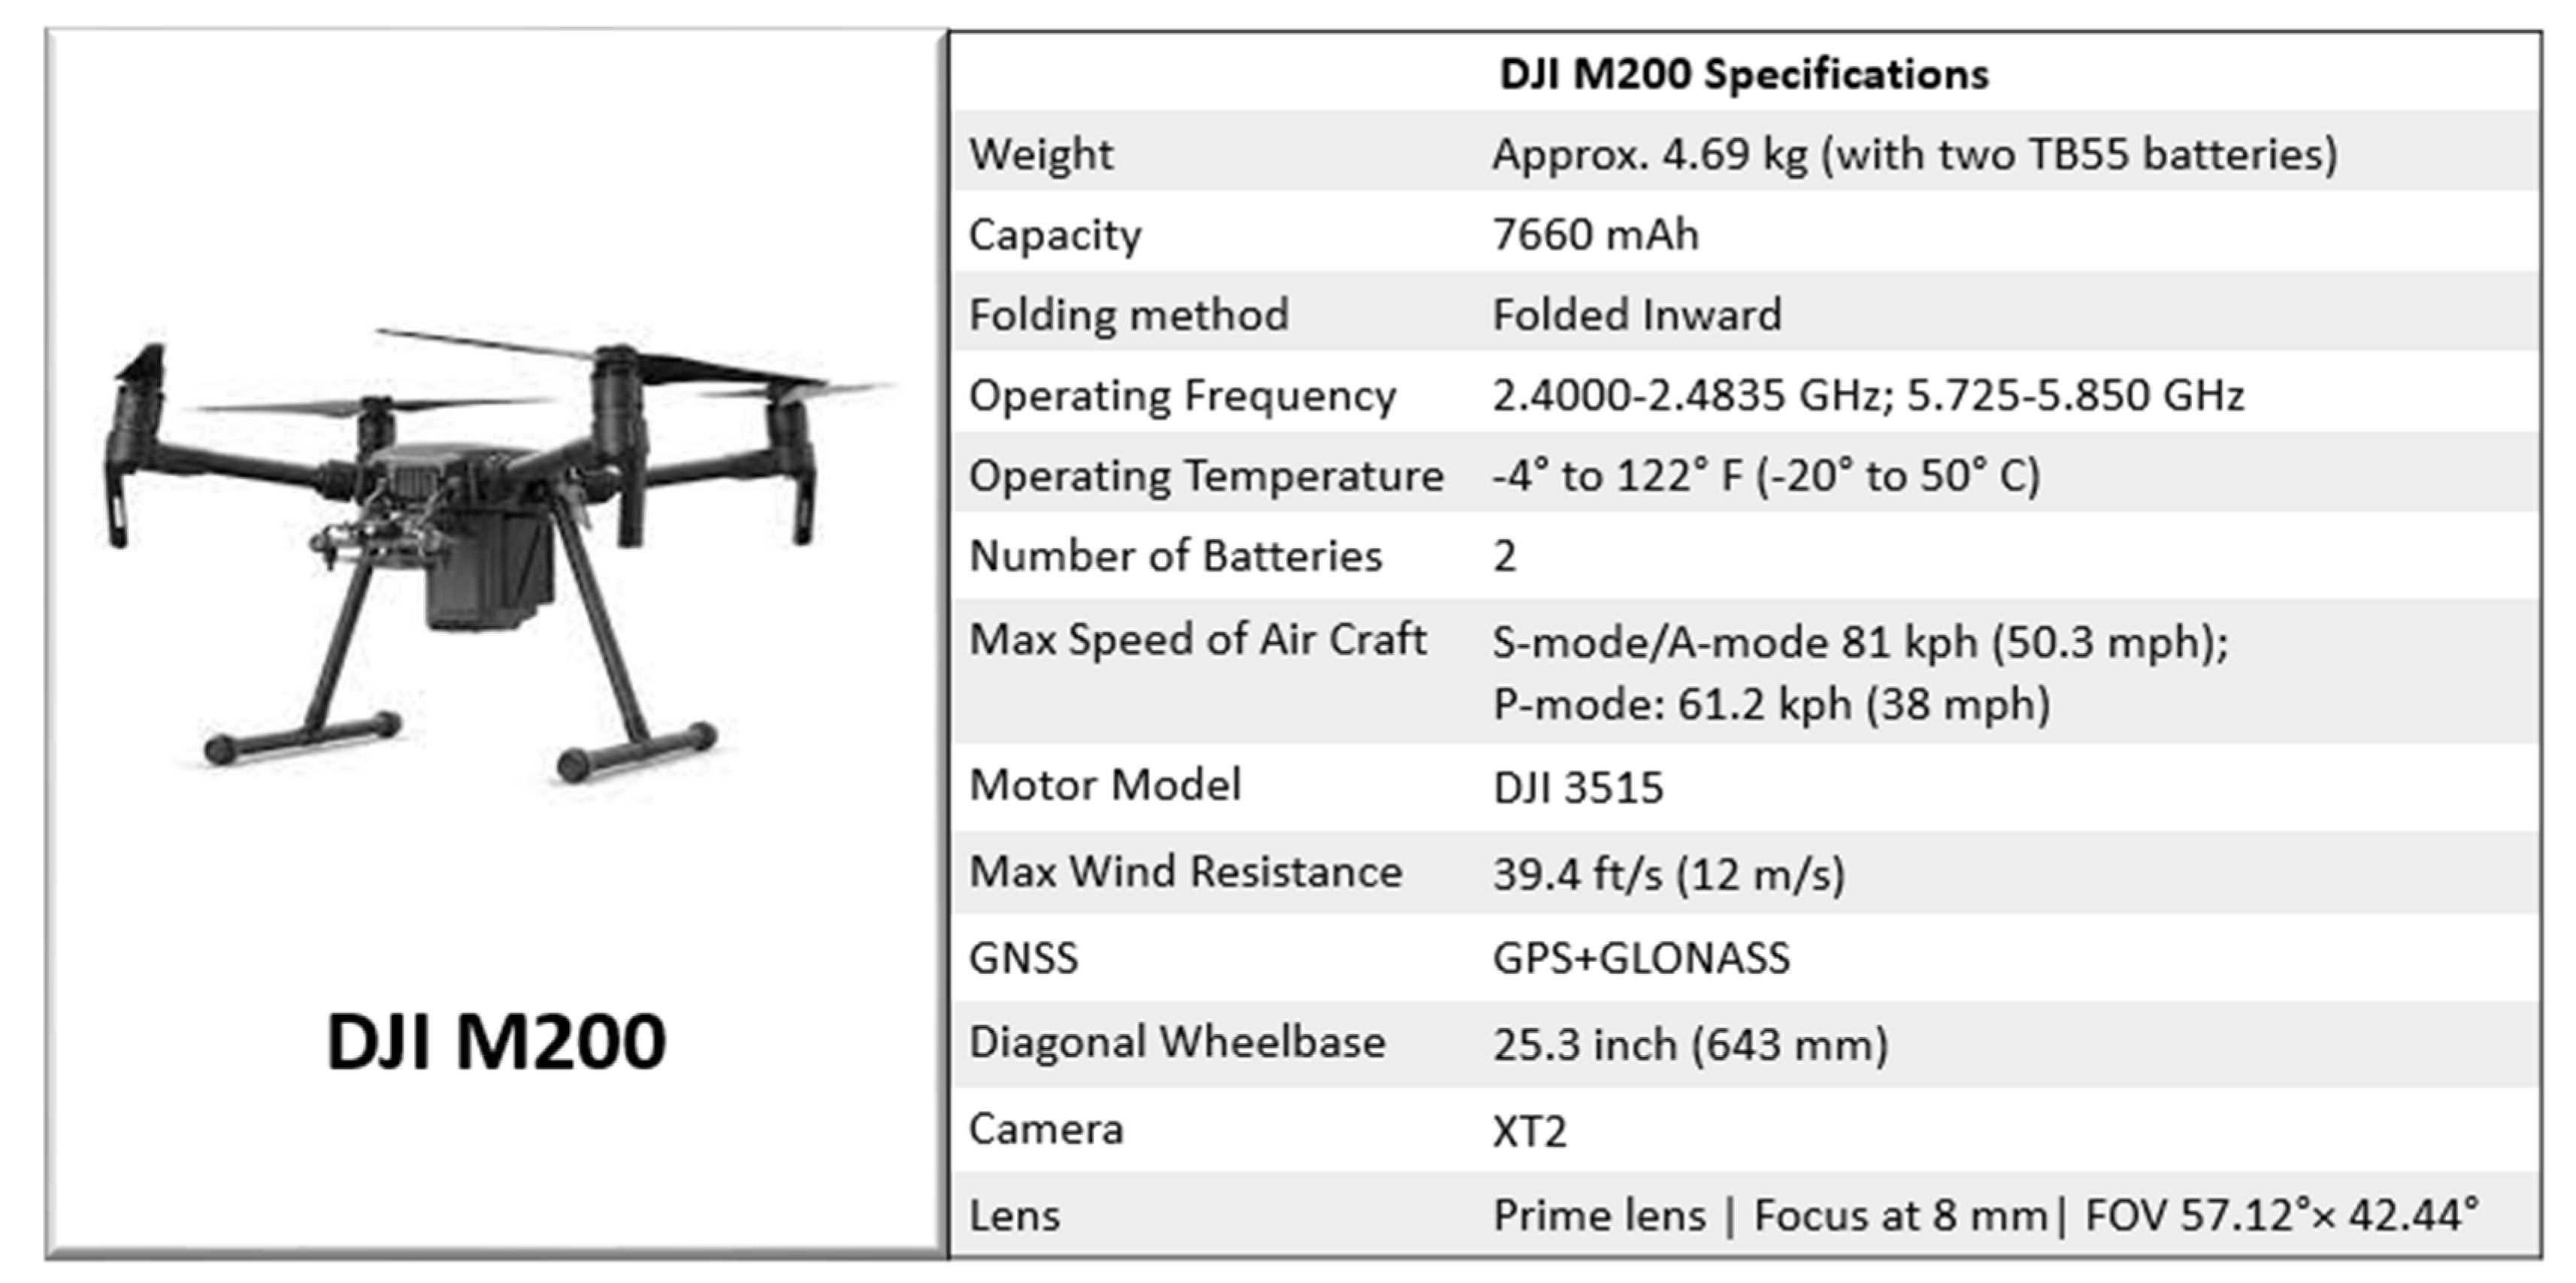
The crack image set was collected using the DJI-M200 quadcopter that contains a GNSS receiver, barometer, the inertial measurement unit (IMU), and a vertical take-off and landing (VTOL) [41]. A total of 1300 crack images were captured for inclusion in the final dataset. The dimensions and size of the collected crack images were set to 4864 × 3648 and 7 megabytes (MB), respectively, for pre-processing. The types of cracks considered in the study are simple cracks, hairline cracks, and artificial marking cracks (Figure 2). Simple cracks mainly arise from structural settlements. The hairline cracks are very small and shallow, resulting from plastic shrinkages [42], whereas the artificial cracks are different from natural cracks as they are introduced artificially.
Pre-processing of the collected images with two types of crack levels (crack and non-crack) forms an integral part of the proposed methodology. First, the captured and extracted crack images were pre-processed to remove unwanted entities (i.e., water, buildings, roads, trees, etc.) and background noise. Afterward, the images were adjusted for brightness and size. The overall pixels used in the current study are presented in Table 1. A smaller number of crack pixels were included in both the training and test sets. A total of 96.30% and 94.68% non-crack pixels were used to train and test the proposed CNN architecture.
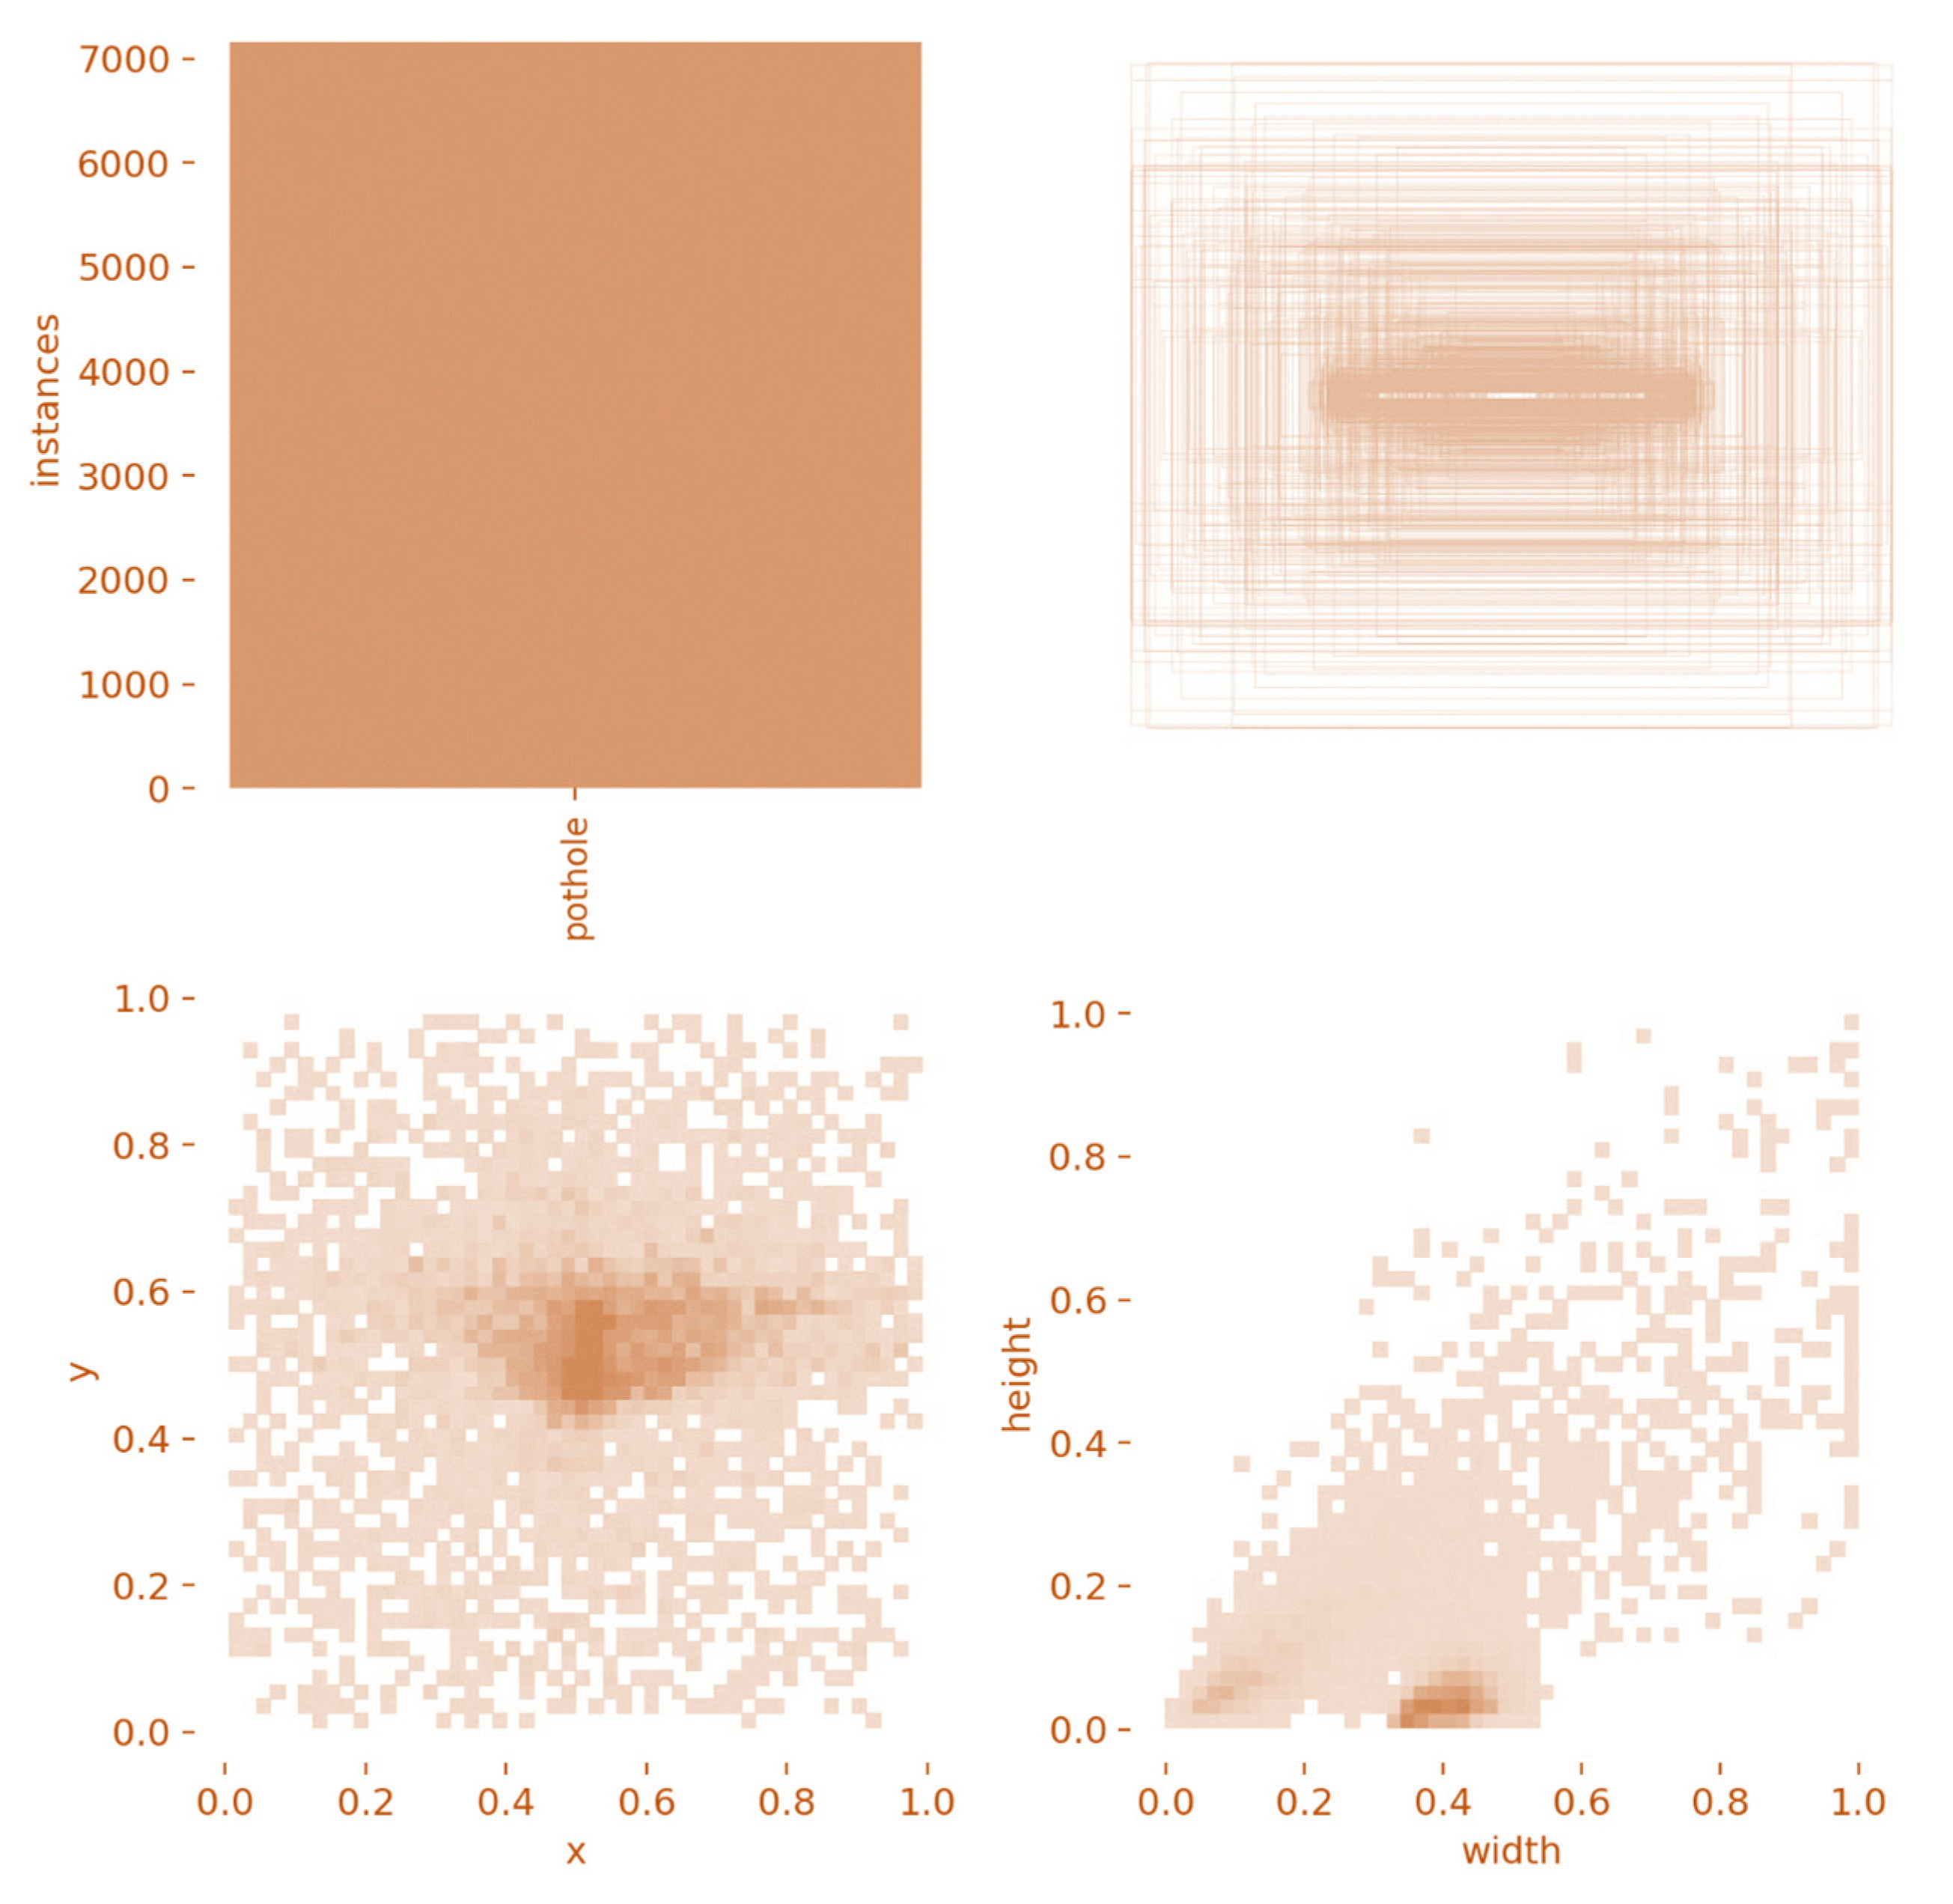
Additionally, a total of about 8.70% and 9.75% crack pixels were used for the training and validation of our model (Table 1). The total crack pixels used for the training and testing were further divided into significant crack pixels and weak crack pixels. This categorization distinguishes crack pixels based on the pixel width. For example, a crack with a pixel depth of 1–5 is defined as a weak crack, whereas a crack exhibiting a pixel width greater than 5 is defined as a significant crack pixel. For the crack images in the current study, the height and width distributions are presented according to two levels: crack and non-crack. The spatial representation of the crack regions in the collected images is provided in Figure 3, where the height and width distributions of the crack pixels were obtained using WandB and PyTorch. The details for the software and hardware used during this research activity are provided in Appendix B.
For the current study, the frequency of crack pixels was predicted, and the related labels or bounding boxes were located using data distribution and spatial location. The axis presented in Figure 3 represents the size distribution. It shows that spatial or frequency distribution for our crack pixels is neither skewed nor projected at one place. Rather, crack pixels display Gaussian or well-distributed pixel data as shown in Figure 3, which indicates that the pixel distribution in the selected crack dataset is free from any bias or statistical error.
In the proposed deep CNN architecture, label generation and crack detection for training were performed through a data augmentation approach based on random image cropping and patching. However, despite numerous parameters, advanced image classification, and processing, the high-performance deep CNNs are vulnerable to overfitting due to learning the non-generalized features of the collected images during the training process. Therefore, a deep CNN requires an adequate set of training samples to avoid overfitting the model [43,44]. This can be achieved by applying several data augmentation techniques such as flipping, random cropping, and resizing to increase variation among the images used to train the model [45,46]. In the current study, we applied three techniques for data augmentation, including cropping, flipping, and rotating. Their details are provided in the data augmentation section (Section 5.4).
2.2. Per-Pixel Segmentation through SegNet
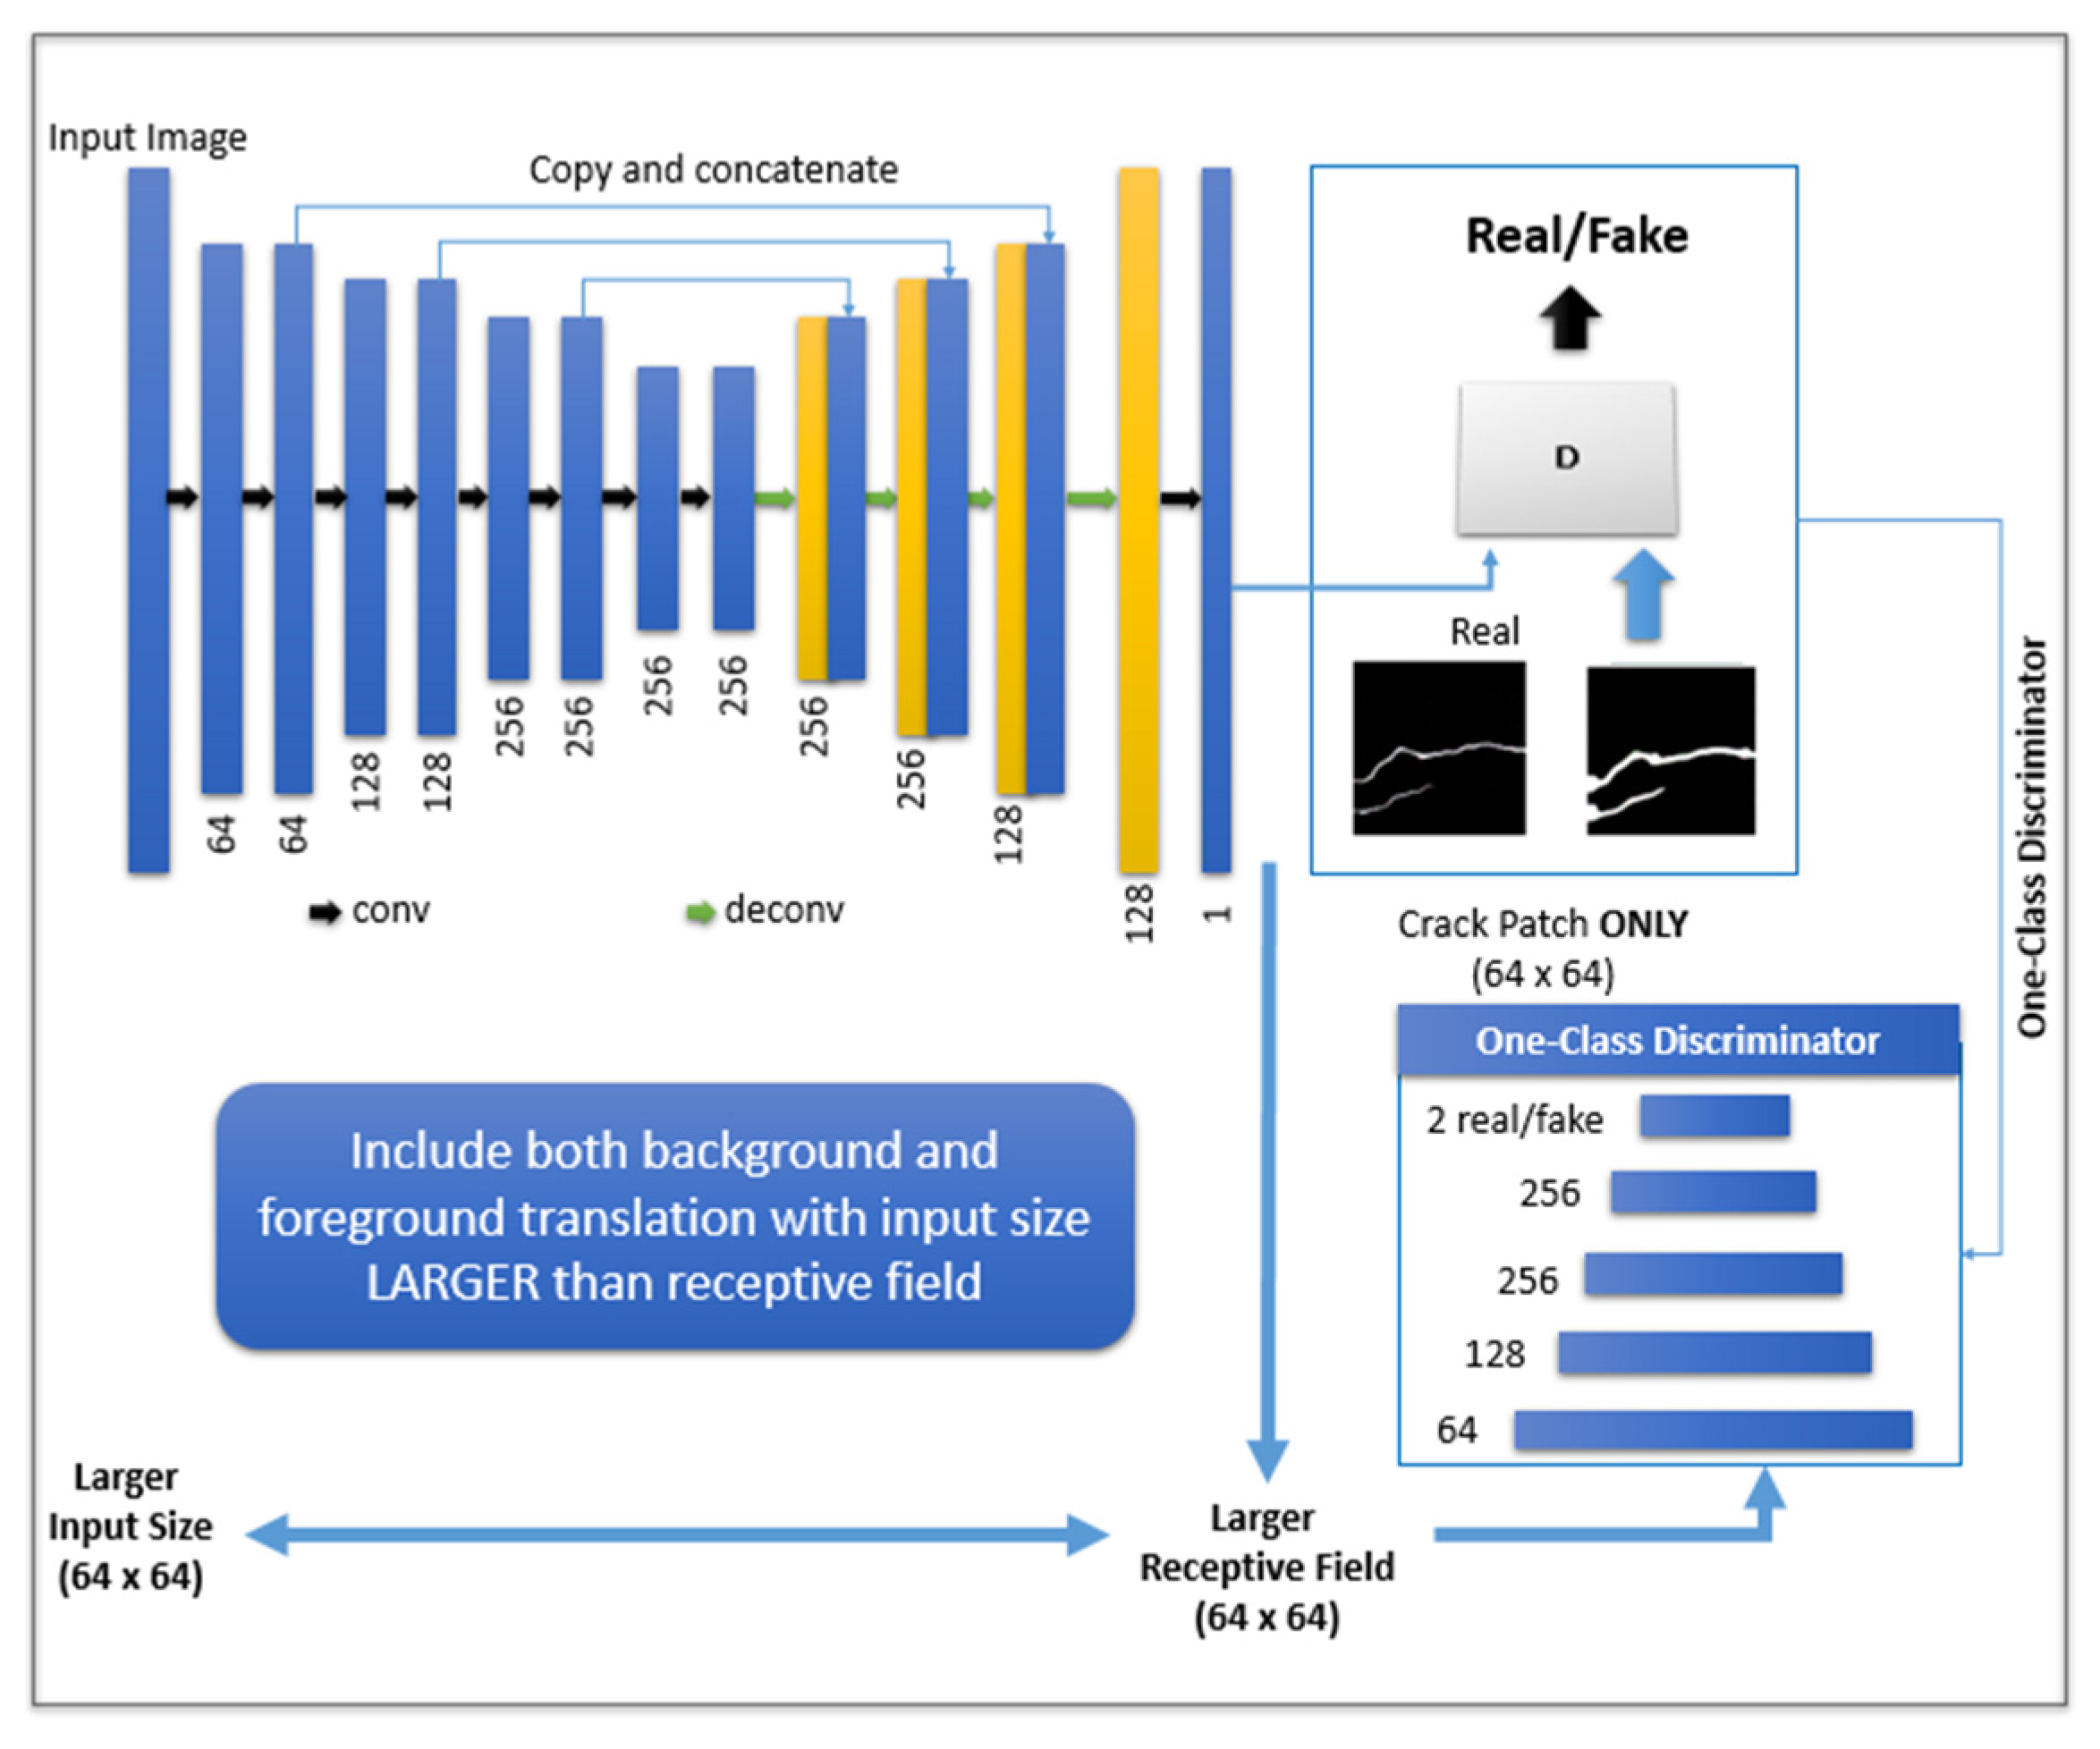
The SegNet model was trained for the collected image dataset through segmentation. Due to the requirement of manual supervision and inadequate accuracy offered by the SegNet, a per-pixel annotation was utilized. Generally, the SegNet architecture is based on a CNN with several encoders, decoders, pair-wise classifiers, convolution layers, batch normalization, ReLU non-linearity units, non-overlapping max-pooling, and sub-sampling [47,48,49]. The decoder considers the un-sampled sparse encoding by max-pooling indices to reduce the model parameters and retain the overall boundaries of the class during segmentation. The gradient descent method and the Bayesian SegNet architecture were used for model training in an end-to-end manner in the current study [50]. A VGG-16 architecture with 16 convolutional layers was used for the SegNet’s encoder with a set of 16 corresponding decoders [51]. The proposed architecture of the multiple layered CNN used for crack detection is presented in Figure 4.
Generally, the CNN architecture is based on multiple blocks and four layers: convolutional layer, pooling layer, ReLU correction layer, and fully connected layer. The first block contains convolution layers responsible for feature extraction from an input image and calculating convolution across each filter through the convolution kernels. This process is repeated several times, and values from the last map-based features are converted to a vector output which forms the input of the second block. Many linear combinations and activation functions are applied in the second block on the vector values resulting in a new output vector. Finally, in the ending block, logistic and SoftMax activation functions are applied that allow binary and multi-classification, respectively [52,53].
In terms of the four layers in a CNN, the pooling layer is important in receiving feature maps and applying pooling operations to the received feature maps. The pooling layer is generally located between two convolution layers and reduces the image size while preserving its important characteristics. The pooling layer also helps reduce the number of calculations and parameters used for the architecture, ultimately leading to reduced over-fitting and an overall improvement in the efficiency of the CNN. Another important layer in the CNN is the ReLU correction layer, an activation function that allows replicating all negative input values by zero [53].
For the current study, a small SegNet-Basic network with four layers and constant feature size of 64 was used for every encoder and decoder. This offers an effective conceptual representation of the larger architecture. In addition, a multi-scale feature decode and fuse (MSDF) model with a CRF layer was utilized to detect boundaries. This model was also used to implement probabilistic inference over the segmentation model. Thus, in the Bayesian SegNet, a posterior distribution over the convolutional weight (W) for a given training dataset X exhibiting labels Y and probability distribution p can be achieved using Equation (1). However, the management of posterior distribution is difficult. Therefore, the weight distribution needs to be approximated through variational inference [54]. This provides the distribution learning over the weights q(W) of the architecture [55]. This can be achieved by applying the Kullback–Leibler (KL) divergence minimization, as shown in Equation (2).
(W|X, Y)
(q(W)||p(W|X, Y))
For each convolution layer (i) with K × K dimensions, an approximation of the Gaussian process can be modeled using Equation (3), where j indicates units, bi represents the vectors of Bernoulli distributed random variables, pi represents dropout probability, Mi indicates variational parameters, and Wi shows the approximated variational distribution [56]. A standard value of 50% was used to account for the dropout probability (pi) optimization associated with neurons. This allows avoiding overfitting of the model during the training process [57].
The dropout method was used for model training. Generally, a posterior distribution of SoftMax class probabilities can be obtained during training using a dropout method. The sample means can be utilized for the prediction of segmentation. In comparison, class output uncertainty can be modeled by calculating the means of the variance measurements per class. Furthermore, MATLAB R2017b was used to re-examine and manage crack and non-crack labels after image labeling.
3. Development of the CNN
The development process of the proposed CNN architecture for crack detection and training of the developed model is discussed in this section. This was achieved by implementing the U-Net architecture, the details for which are subsequently provided.
3.1. U-Net Model Architecture
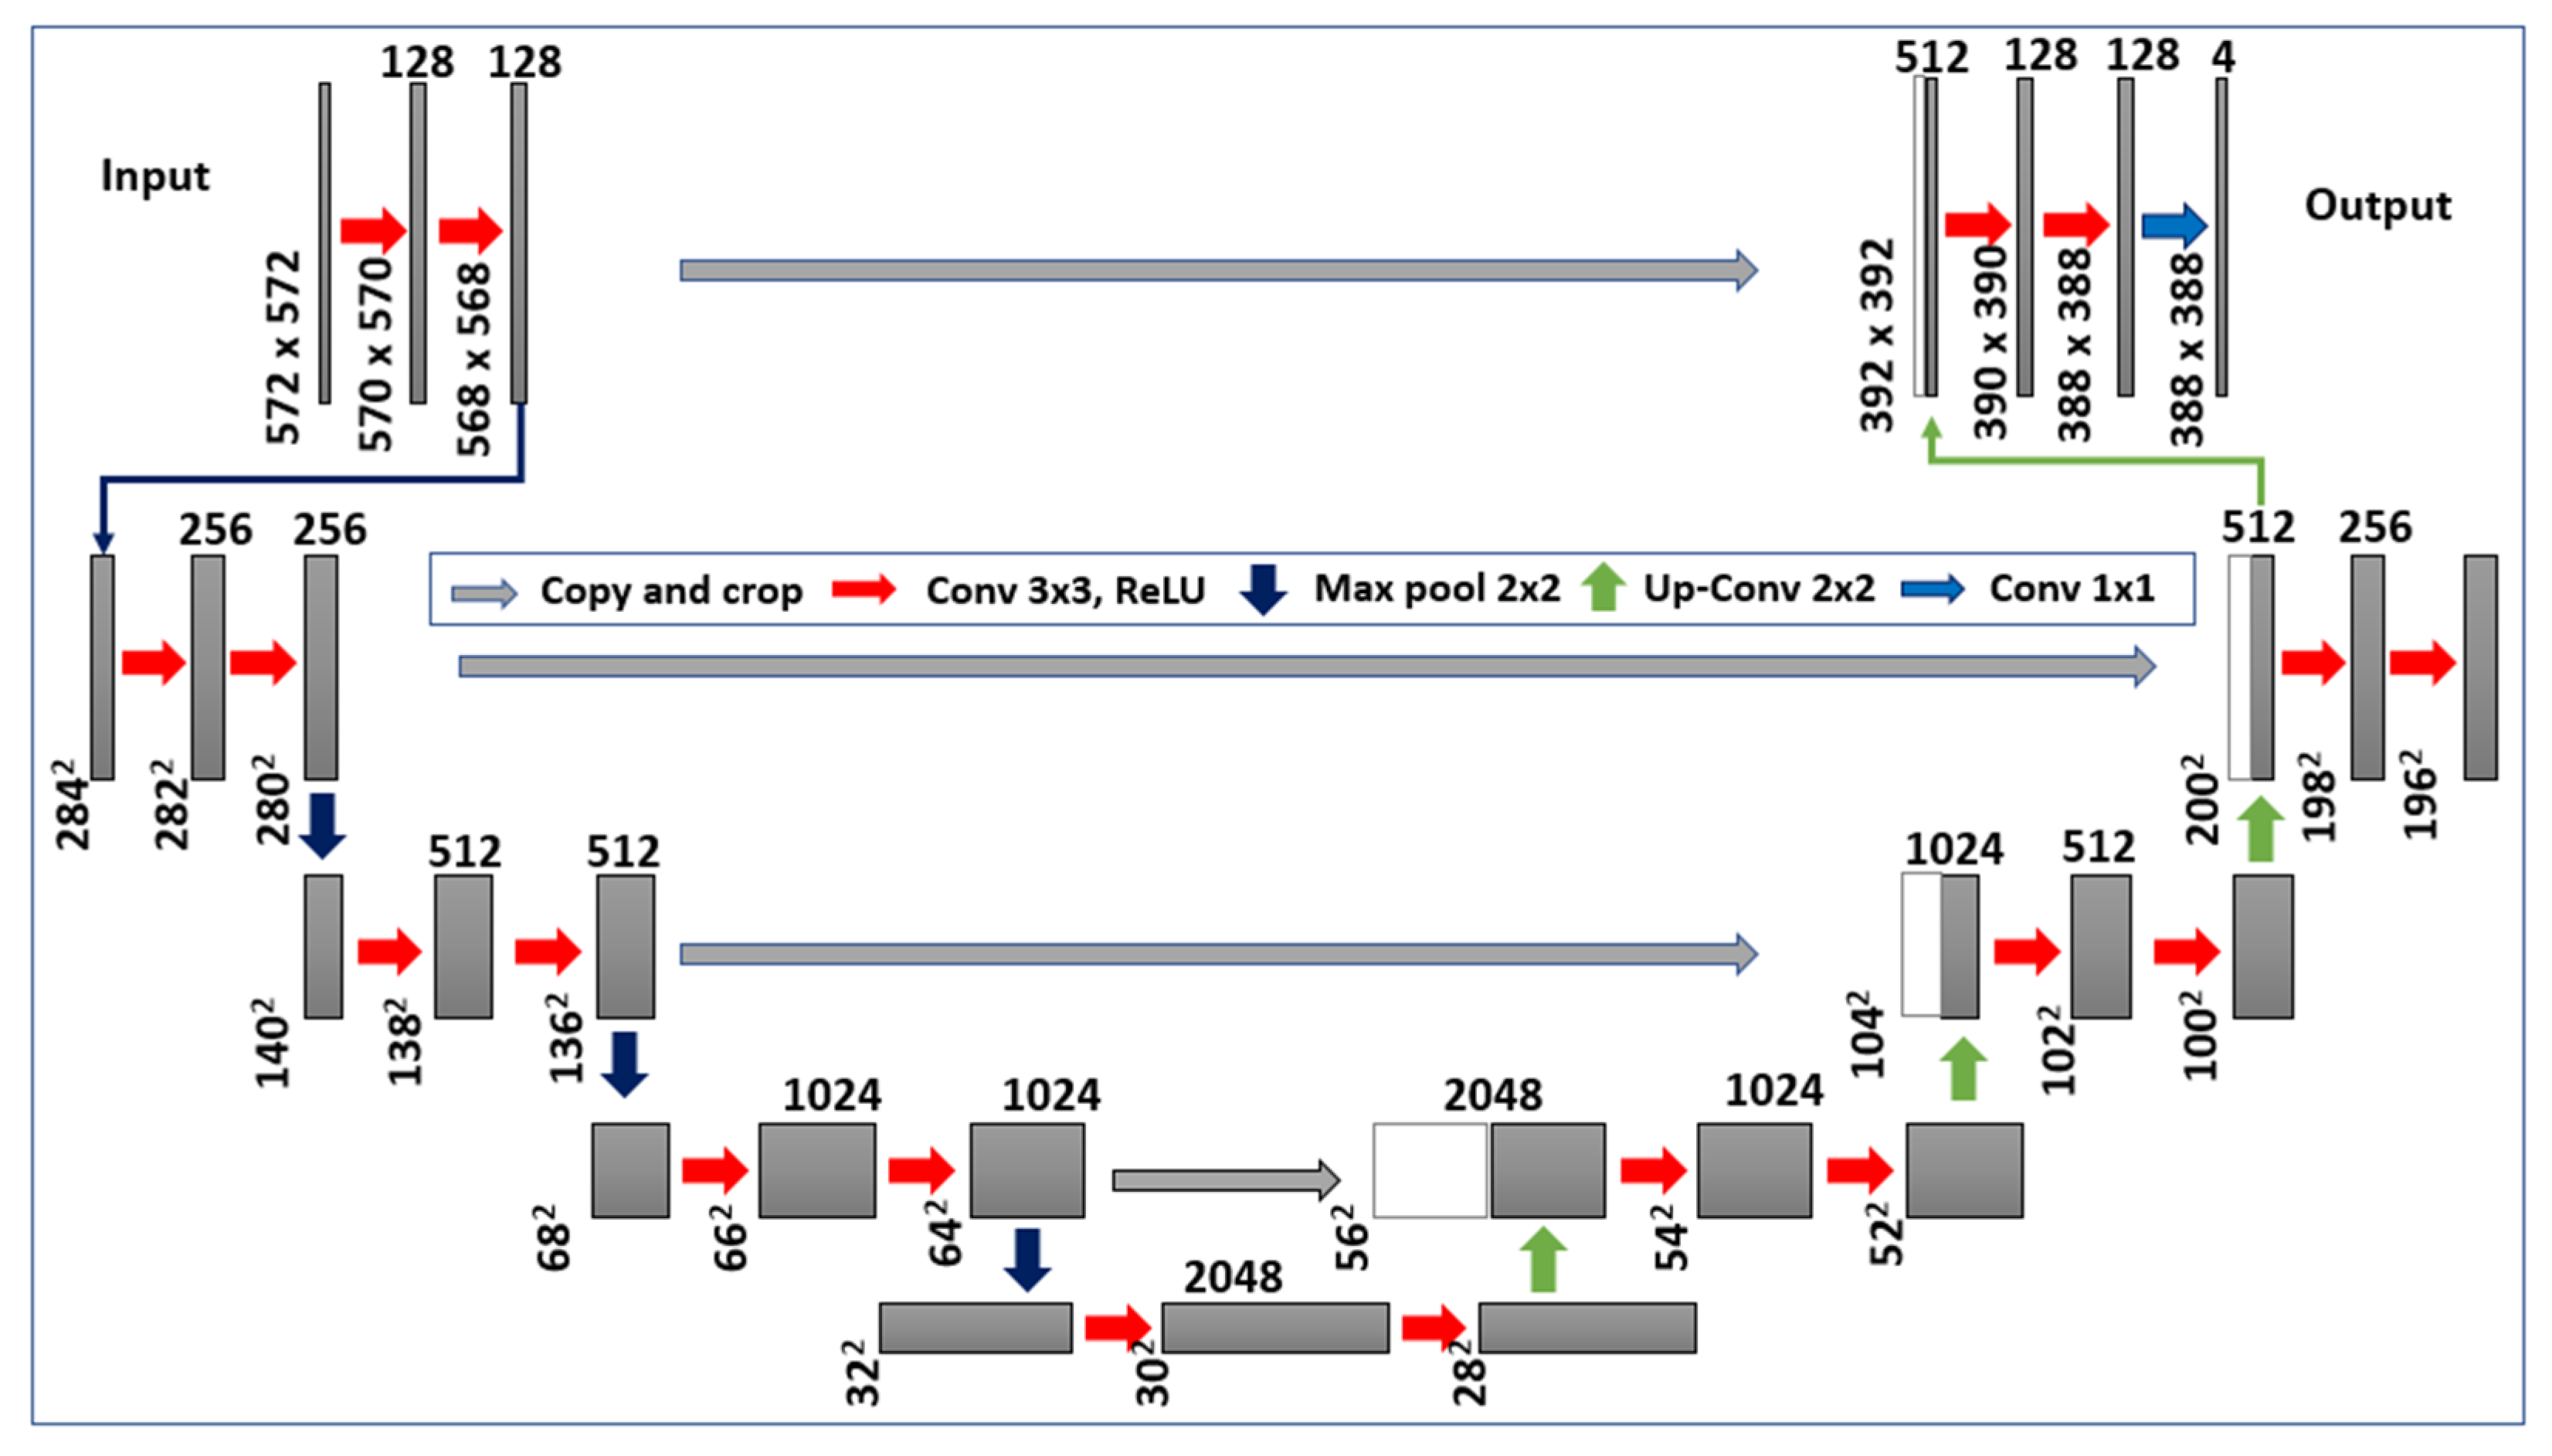
U-Net architecture is a popular end-to-end architecture used to execute semantic segmentation precisely and efficiently [58]. A U-Net implementation was used to pass model configurations such as activation, function, and depth as arguments while creating the current CNN model. The U-Net architecture (with encoder and decoder) used for crack detection is presented in Figure 5. To capture features at different image scales, functions and the repeated conventional stack of layers (k = 3, s = 1) in each block were used as the encoder architecture. In addition, after each convolution block, a non-linearity layer and a max-pooling layer (k = 2, s = 2) are positioned.
The symmetric expanding counterpart of the transposed convolution layers was used for the decoder, which considers the up-sampling and collection of trainable parameters. This assists the functionality of the max pool, which is the reverse of pooling layers. For the decoder implementation, each convolution block is coupled with an up-convolutional layer to receive output feature maps generated by the corresponding encoder blocks. Cropping was done if the feature maps from the encoder layer display dimensions greater than the decoder layer. Additionally, the output must pass to another convolution layer (k = 1, s = 1) with an equal number of feature maps and defined labels. The proposed architecture can offer context-based localization and solutions. The grey boxes in Figure 5 depict a multi-channel feature map. The number of channels for the associated feature maps is provided on the top of the box, whereas the x-y size is displayed at the lower-left edge of the box. The white box in the figure corresponds to the copied feature maps, and arrows indicate different operations.
3.2. Loss Formulation
The holistic nested edge detection (HED) method was developed to address two important issues: holistic image training and multi-scale feature learning. HED is a DL method used to convert pixel-wise edge classification into image-to-image prediction [59]. In the current study, we have implemented most of the HED notations and formulations by applying some variations [43]. For example, for crack segmentation, this can be achieved using a training set S with the image set In and the ground truth set Gn (Equation (4)), In with j number of images (Equation (5)), and original input image Gn with j number of images (Equation (6)).
S = {(In, Gn), n = 1,…, N}
In = {I(n)j, j = 1,…, |In|}
Gn = {G(n)j, j = 1,…, |Gn|}, Y(n) j ∈ {0, 1}
The basic aim behind training a CNN is to minimize the differences between ground truth and final CNN predictions. Each image is considered independently, and the side-output layers are evaluated during training (Figure 5).
3.2.1. Adversarial Loss
A max-min two-player game is used to execute adversarial networks, enabling real-like images generated from the noise. Accordingly, alternate optimization of adversarial network-based objectives is performed using Equations (7) and (8).
where D, G, and z represent the discriminator, generator, and the noise vector input, respectively. Additionally, x denotes the real image in the training set, and D and G maximize both equations leading to adversarial learning.
maxDVD (D, G) = E × p4 (x) [logD(x)] + Ez p4 (z)
maxGVG (D, G) = Ez p4 (z)
3.2.2. Cycle-Consistency Loss
The adversarial loss provides benefits in terms of obtaining structured images. However, it is insufficient to perform translation of crack image patches to the preferred structure patch or vice versa when used alone. Due to this, a consistent pattern is not guaranteed within the input and the output images. Thus, an additional parameter is required to effectively train the architecture and maintain the consistent pattern of the input and output images [60]. For a network, each sample x in the dataset X must return to the original patch after cycle processing (x → G(x) → F(G(x))~x). The same holds for each structure image y in the structure set (y → R(y) → F(R(y))~y). The discussed constraints lead to the formulation of cycle-consistency loss as described in Equation (9). Here, Ex p4(x) represents the expected probability distribution.
Lcyc (F, R) = Ex p4(x)
4. Training of the Proposed CNN Model for Crack Detection
4.1. Model Training Using U-Net
For the crack detection U-Net architecture training, different parameters (i.e., U-Net, loss function, stochastic gradient descent (SGD), central processing units/graphics processing units (CPU/GPU), a learning rate scheduler, epoch, training, and training validation data loader) were used in the study. The U-Net is trained through iterations over training data loads followed by the transfer of batches to the training mode using the network. Training produces results in the form of accumulated training loss, validation loss, and learning rate. A loss function is used to compute loss, which considers the outputs and the targets for loss calculation.
Matplotlib was used to analyze the training rate test results for both training and validation loss, as shown in Figure 6, which also shows that the crack dataset used in this study is devoid of overfitting or bias as both the training and test sets are used for the proposed crack detection architecture. This ultimately assists in creating a more generalized approach that is easily applicable to new datasets to achieve an overall better performance and accuracy. The performance of training and test sets is plotted against the number of steps used in the current approach. Comparable performance was achieved for both the training and test sets after the initial 25 steps, as shown in Figure 6.
4.2. Model Training Using CycleGAN
To train CycleGAN, two separate datasets are required; a crack image set (X) with crack images {xi} and the structure library (Y) with images {yi}. The forward and reverse GANs form the network topology allowing image translations from X to Y (F: X → Y) and Y to X (F: Y → X). The network topology for the CycleGAN is presented in Figure 7.
The main function of the CycleGAN is transferring the characteristics of one image to another. Thus, it can address problems based on image reconstruction. The input image (x) is initially considered and converted based on the generator (G) to a restructured image. Later, this process is reversed to convert a restructured image to an original image through the generator (F). This is followed by the mean squared error loss calculations between the original and the reconstructed images. Thus, generator and discriminator are the two core components of the CycleGAN. The generators provide samples from the anticipated distribution, and the discriminator assists in determining the originality or realness of the sample (i.e., real distribution or generated distribution).
The CycleGAN based network contains three parts: the encoder, transformer, and decoder. The encoder is responsible for receiving input images for feature extraction through the utility of three convolution layers. These convolution layers reduce the original image size to a quarter. Depending on the input size, the output from the encoder is sent to the transformer with residual blocks (6 or 9) after applying the activation function. This output from the transformer is later transferred to the decoder based on a 2-deconvolution block of fractional strides. This topology of the decoder helps in increased representation in terms of size compared to the original size of the image [61,62,63]. There are generally two discriminators to mediate the working of CycleGAN. These include the discriminator Dx and Dy. Dx is used for distinguishing between the {xi} and {R(yi)} with Ladvr (reverse adversarial loss), whereas Dy helps in distinguishing between {yi} and the translated images {F(xi)}. This allows overcoming the differences in various domains and data imbalance. The objective function for this process is given in Equation (10).
L = (Ladvf + Ladvr) + (L1fc + L1rc)
Here, Ladvf denotes the forward adversarial loss and the parameter λ controls the weight between the adversarial and the cycle-consistent losses. The variables L1fc and L1rc indicate the two-cycle consistent losses with L1-distance formulas in both the forward and reverse GAN, respectively [64].
5. Performance Evaluation of the Training and Test Sets
A set of evaluation metrics was used to evaluate the accuracy and overall performance of the proposed CNN architecture. It was evaluated for both the test set and the training set. The details of the performance parameters used in the current study are described in the following sections.
5.1. Evaluation Metrics
Overall, in the current study, three parameters, including global accuracy (GC) (Equation (11)), class average accuracy (CAC) (Equation (12)), and the mean intersection of the union overall classes (IoU) (Equation (13)), were used for the evaluation of common semantic segmentation [9,40]. The GC metric provided an estimation of correctly predicted pixels (in percentage). The GC metric is calculated using Equation (11), where n and t represent the sample and technique under observation. The CAC estimates the predictive accuracy over all the classes (ncls) (Equation (12)). Finally, the IoU metric quantifies the percentage of overlapping pixels between the target mask and the output predictions [65]. Herein, n and t indicate the sample and the technique under observation.
In addition to the aforementioned metrics, three other parameters, including precision (P) (Equation (14)), recall (R) (Equation (15)), and F-score (F) (Equation (16)), were also used for the performance evaluation of the proposed crack detection CNN model. These metrics, including P, R, and F, were calculated to evaluate the semantic segmentation using equations 18–20 [66,67]. P represents the predictions for a positive class included in the collected dataset. The R parameter quantifies predictions for all the positive classes. Finally, the F-score considers the P and R parameters, thus indicating model accuracy for the given dataset [68].
5.2. Training and Test Accuracy
Two parameters, including average Precision (mAP) and IoU, were used in the current study for assessing the accuracy of the training and test sets. The results are plotted in Figure 8 where, P values were plotted on the x-axis and the R values on the y-axis, respectively. These parameters were used in the current study to evaluate image segmentation. Additionally, the IoU parameter was used to quantify common pixels between the target mask and predictions of the outputs [29,67]. It is notable that for the selected crack dataset, the IoU_min values increased from 0.1 to 0.9 while calculating the error on each point.
Results in Figure 8 indicate that at an IoU_min value of 0.1, a maximum value of mAP (0.76) was observed, indicating that the threshold should be high. Additionally, on increasing the IoU_min from 0.1 to 0.9, a decrease in the mAP values is observed. The threshold must not fluctuate; otherwise, it will lead to a compromised average accuracy. Further, the model must achieve a high P-value and a lower R-value. In this study, the P-R curves were computed by changing the threshold of the prediction confidence. To achieve a match, this process was repeated at different IoU thresholds. Further, our results indicate that computing a single P and R score at a particular IoU threshold was not adequate to define the behavior of the proposed model’s full P-R curve. Thus, average P was utilized for integrating the area under a P-R curve.
5.3. Model Parameters
Fully convolutional network (FCN) [69], DSN [22], HED [70], and SegNet [71] were used to build the proposed architecture for crack detection. Training of the CNN-based architecture was performed using the Caffe library [15]. The model optimizations were performed using stochastic gradient descent (SGD). Different parameters, including the size of the input image, ground truth size, mini-batch size, learning rate, loss weight associated with each side-output layer, loss weight associated with the final fused layer, momentum, weight decay, and training iterations were used for fine-tuning the model. The fine-tuned values for the selected parameters used in the current study are presented in Table 2.
Batch normalization, side-output layers, and loss of function techniques were utilized for the proposed CNN-based architecture to distinguish the crack and non-crack levels. Image sizes were scaled according to input image sizes. Further, image segmentation was utilized to analyze local images in-depth. The mini-batch size of 1 was selected based on GPU capacity to reduce the time required for training. Moreover, to optimize training and avoid getting stuck at the local minima, a learning rate starting from 0.0001 was later adjusted based on momentum and weight decay. Thus, the proposed architecture helps in improving the convergence and accuracy and eradicating the requirement of pre-trained models for training the network.
5.4. Data Augmentation
Data augmentation forms an integral component of deep neural networks. For the proposed crack detection, CNN model data augmentation was performed 16 times. Three steps were used to perform data augmentation. These include: (1) rotating images to 8 different angles every 45° between 0° and 360°, (2) cropping the rotated image by considering the largest rectangle devoid of any blank regions, and (3) flipping images horizontally at each angle. Finally, the architecture was trained using both raw and augmented images. Both training and testing of the architecture were performed using the NVIDIA TITAN X graphic card [17].
6. Model Application, Results, and Discussion
The utility of advanced computer vision-based and AI techniques (i.e., ANNs and CNNs) can assist in overcoming the shortcomings of the conventional inspection methods [21]. Therefore, we proposed a modified version of a deep hierarchical CNN classifier with 16 convolution layers and CycleGAN to predict pixel-wise segmentation in an end-to-end fashion. For this purpose, the building cracks dataset was collected for mid to high rise buildings (five stories and above) constructed since 2000, as shown in Figure 9. The specifications of the DJI-MJ200 used in the current study for capturing images are also elaborated in Figure 9.
The distance from the crack in all images captured from Drone (DJI M200) was not the same. Some images were aerial, and most were captured through an orthogonal trajectory. Moreover, the edge has both the properties of rotation invariant feature transformation (RIFT) and scale invariant feature transformation (SIFT), so it does not matter if the dimension of the image is changed or the detected object is global or local. The purpose of this study was to detect cracks from the imagery captured based on (pixel to pixel) labeling and assessment, which is a necessary step in heterogeneous data integration.
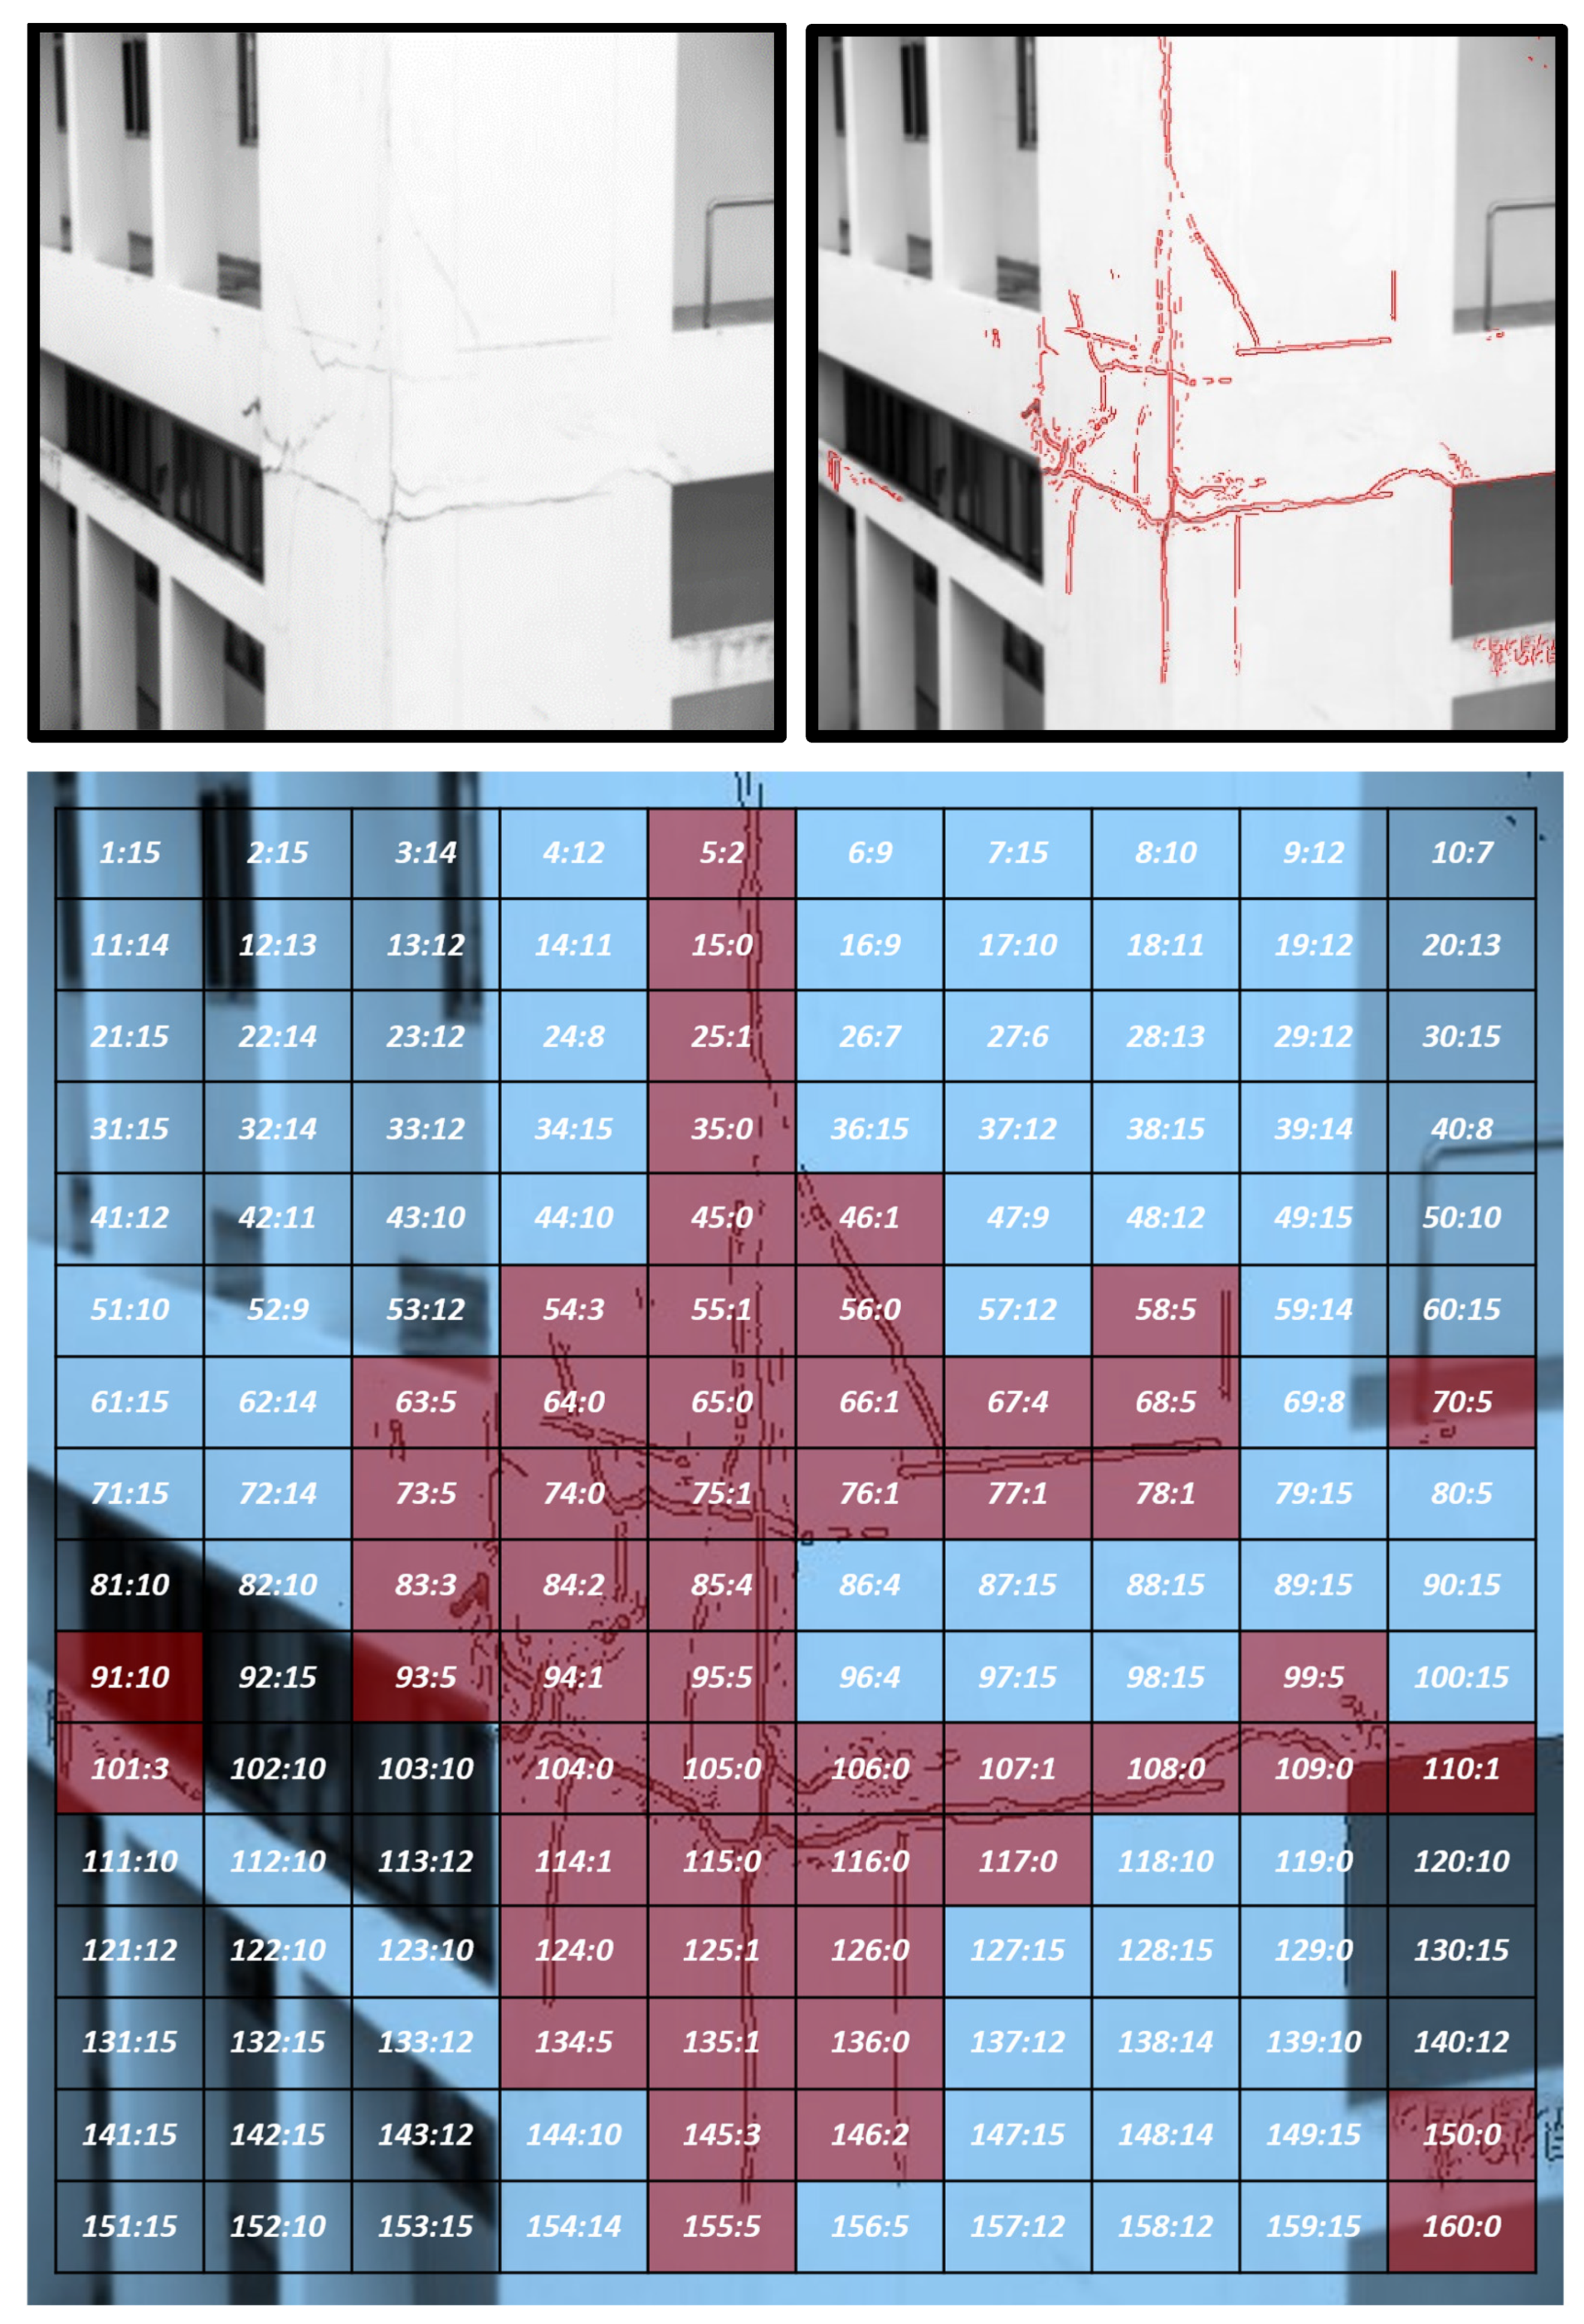
Image segmentation was used to analyze local images in-depth for crack detection in buildings. This was achieved through the representation of the subject under consideration through binary images. The total crack images were divided into two datasets to perform training and the testing of the proposed CNN-based architecture for crack detection (crack and non-crack). Some of the representative crack images included in the crack dataset and the associated segmentation used in the current study are presented in Figure 10. The exact coverage of the crack regions was achieved through the pixel-wise segmentation mapping of each image. A pixel size of 544 ×384 was selected for the current study.
The crack images were collected from diverse scales and scenes from real-world situations to include a universal representation of crack. For the proposed CNN framework, the total crack pixels included in the training and test sets were further distributed into significant and weak crack pixels, respectively. This classification was performed to distinguish crack pixels based on the pixel width. For example, cracks with a pixel depth of 0 to 5 were categorized as having severe damage and water straining. Furthermore, the batch normalizations were incorporated in the proposed architecture to reduce network over-fitting and boost the overall performance. Moreover, for the refinement of dense regions, both conditional random fields and the faster/efficient guided image filtering methods were implemented in the current study.
The proposed CNN-based model for crack detection was trained using five approaches, including Guided Filter (GF) method, Baseline (BN) method, Deep-Crack BN, Deep-Crack GF, and SegNet. For the Deep-Crack BN, the modified version of DeepCrack-Basic was used based on HED [12,13] and loss of function architecture. DeepCrack-Basic is modified to achieve Deep-Crack BN mainly through the addition of batch normalization layers before each activation operation. Similarly, the Deep-Crack GF is a version of Deep-Crack-BN with an additional guided filtering module. The PSPnet based multi-focus method was used for the fusion of images. Furthermore, the current study used a DEEPLAB method employing deep CNNs, atrous convolution, and fully connected CRFs [17] to perform image segmentation. Herein, the PSPnet was used to extract the focused regions of an image.
The total crack pixels included in the training and test sets were further distributed into significant and weak crack pixels for the proposed CNN framework. This classification was performed to distinguish crack pixels based on the pixel width. For example, cracks with a pixel depth of 1 to 5 were categorized as weak cracks, whereas cracks with a pixel width above 5 were classified as significant crack pixels. Moreover, a data augmentation approach based on random image cropping and patching was used for the proposed deep CNN architecture for label generation and crack detection during training. The frequency of crack pixels was predicted, and related labels or bounding boxes were located using data distribution and spatial location.
Despite other structures in the images, the prediction gives a high score for the area where positive classes are present. For the proposed CNN framework, the total crack pixels included in the training and test sets were further distributed into significant and weak pixels, respectively (Figure 10). This classification was performed to distinguish crack pixels based on the pixel width. For example, a crack with a pixel depth of 0–5 was categorized as a deep crack. Similarly, a crack with a pixel width above 5 depicts object features. Moreover, a data augmentation approach based on random image cropping and patching was used for the proposed deep CNN architecture for label generation and crack detection during training. The frequency of crack pixels was predicted, and related labels or bounding boxes were located using data distribution and spatial location.
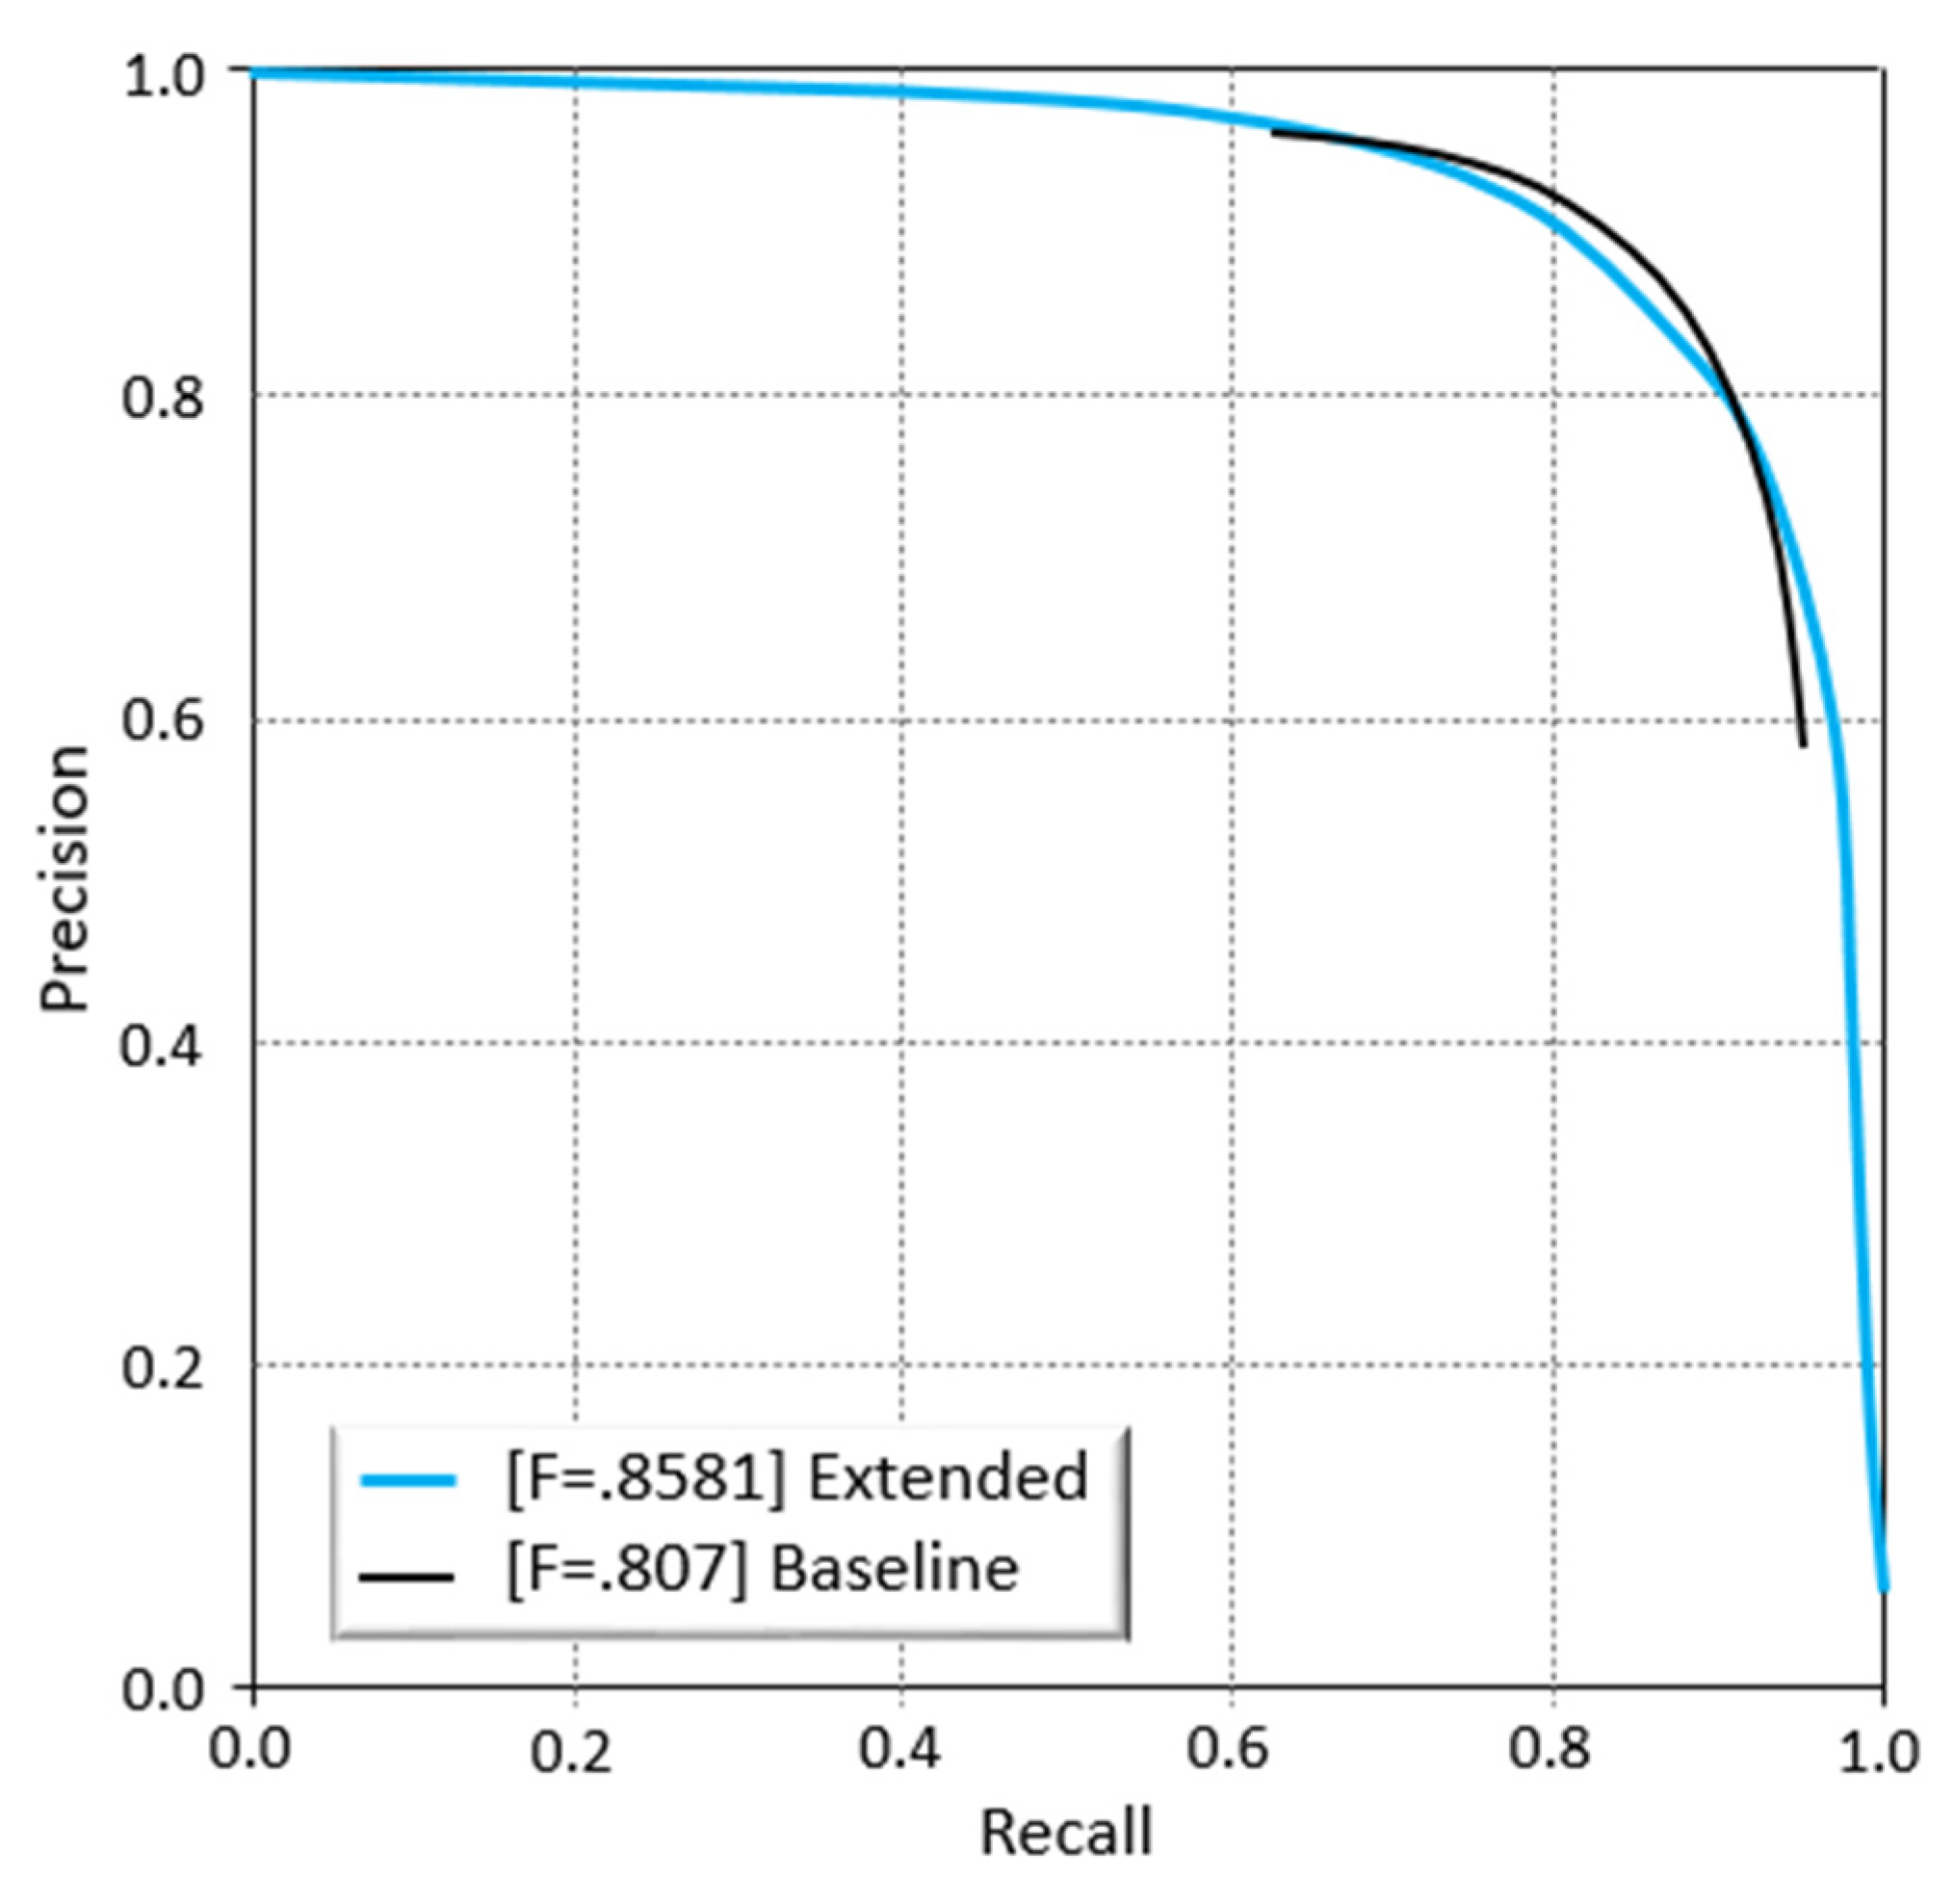
Both baseline and extended architectures have been used in the current study. The extended architecture method has incorporated data augmentation, the fusion method, and decay of learning rates. The baseline method does not take into account data augmentation. The results of both the baseline and extended methods are presented in Figure 11. It is shown that the extended architecture outperforms the baseline architecture, as indicated by the improved F-score value of 0.858 compared to 0.807.
Overall, the performance was assessed for all five studied methods, including baseline, extended method, DeepCrack-BN, DeepCrack-GF, and SegNet. Results indicate that the extended architecture outperformed all other parameters, as shown by the values of performance evaluation metrics presented in Table 3. The model performance was evaluated considering the GC, CAC, Mean IOU, P, R, and F-score metrics. For each of these architectures, cross-validation was performed, and predictive power was assessed based on the aforementioned evaluation parameters.
The application of CNNs for crack detection has been frequently reported in the literature. For example, Nguyen et al. have reported CNN architecture based on five convolutional layers with a kernel size of 3 × 3 pixels or 4 × 4 pixels for pavement crack detection [14]. In addition, a max-pooling layer with a 2 × 2 pixel kernel size was added after each convolutional layer [32]. More recently, a model based on neural architecture search technology with pre-trained weights on the ImageNet has been reported [46,72,73,74]. Herein, testing was performed by collecting crack images from different locations and the proposed model was compared with three other models (MobileNetV2, DenseNet201, and InceptionV3). The results demonstrated that their proposed model displays an accuracy of about 0.99, a reduced number of parameters, and a better generalization [19].
Additionally, a CNN based on two-step pavement crack detection and segmentation method has been reported by Liu et al. that uses a modified U-Net in the second step. Moreover, F1 scores of 90.58% and 95.75% have been reported for the proposed crack detection and segmentation methods [2]. It is notable that, similar to the already reported models, our final model displays accuracy of about 0.99 that lies within the comparable range of the reported models.
Li and coworkers have reported the comparison of CrackU-net with conventional methods, FCN, and U-net [19]. Notably, the CrackU-net outperforms other methods as indicated by the accuracy, P, R, and F-scores of 0.9901, 0.9856, 0.9798, and 0.9842, respectively [16]. Furthermore, Fan et al. [15] proposed an ensemble of CNNs for the automatic detection of pavement cracks. The results indicate that compared to Crack Forest Dataset (CFD) and AigleRN database for pavement images, the proposed model displayed superior performance (P = 0.9552, R = 0.9521 and F1 = 0.9533) [15].
Soni [75] investigated crack detection in structural designing structures. The study proposed crack detection in buildings based on completely convolutional arrange (FCN) for semantic division on concrete crack pictures. Three system models were assessed for characterizing a dataset of 40,000, 227 × 227 pixel pictures. For semantic division, the encoder-decoder FCN connect with the VGG16-based encoder on 227 × 227-pixel crack-named pictures (500 subsets). As a result, the FCN organize accomplishes about 90% in normal exactness, distinguishing cracks and thickness measured precisely.
In comparison to the above studies, it is evident that our extended method displays a superior performance to all other methods, thus showing GC, CAC, Mean IOU, P, R, and F-score values of 0.990, 0.939, 0.879, 0.838, 0.879, and 0.8581, respectively, as shown in Table 3. The performance of our proposed model lies within a comparable performance range as indicated by the performance evaluation metrics reported by previous studies. The results indicate that the baseline methods are better than the other studied methods. The performance of the extended method is slightly better in comparison to the baseline method. The baseline provides good generalization as a weighted average has been added instead of simple fusion averaging. In comparison, the extended method takes into account the CRF-based fusion. Overall, the lowest performance was achieved by the SegNet architecture.
Our proposed architecture displays a substantial improvement in the overall performance compared to all methods (PSPNet DeepLab and SegNet) included in the current study. Moreover, the results might vary for the aforementioned methods mainly due to certain intrinsic differences between crack and edge detection methods. Based on these, we can propose the extended model to be ideal for real-time IP of crack images. Overall, the proposed CNN architecture will ultimately improve convergence and accuracy. It will also eliminate the requirement of using a pre-trained model for network training. Moreover, the identification and analysis of building cracks through the proposed machine learning-based model will significantly improve the efficiency of building crack detection.
7. Conclusions
Crack detection is a challenging and time-consuming endeavor. There are several limitations of manual damage inspection in the context of objectivity and reliability. These limitations can be addressed by the utilization of automatic methods. AI and ML approaches have been reported in the literature for effective monitoring of such damages. Among the relevant techniques, CNN-based models have emerged as one of the most promising computer vision and DL methods for automatic learning and detection of image features. Furthermore, the CNNs reduce noise effects as they do not require the extraction of image features. Due to numerous advantages of the CNN architectures, we proposed a 16-layer CNN architecture with the integration of CycleGAN to predict pixel-wise segmentation and detect cracks in mid to high rise buildings in Sydney.
Extended FCN and DSN are also added to the proposed approach, which helps achieve direct and highly integrated supervision of features at all convolutional stages. Our proposed architecture also provides adequate learning and aggregation of both multi-scale and multilevel features during the training procedure. The proposed CNN-based crack detection architecture differs from the conventional architectures as it considers multiple layers compared to traditional architectures that only consider the last convolutional layer. Further, GF and CRFs methods have also been included in the current study to refine the overall output predictions. Additionally, a major highlight of the current study is the collection of crack images from different buildings in an efficient, time- and cost-effective manner using UAVs. The proposed 16-layer deep hierarchical CNN-based model displayed a superior performance, as indicated by the model evaluation parameters. The architecture was evaluated against five methods: GF, BN, Deep-Crack BN, Deep-Crack GF, and SegNet. Overall, the GF method outperformed all other methods. Moreover, GF methods displays GC, CAC, Mean IOU, P, R, and F-score values of 0.990, 0.939, 0.879, 0.838, 0.879, and 0.8581, respectively. The lowest performance was achieved for the SegNet method.
In addition to the promising performance of CNN, there are certain limitations. These are mainly associated with the inclusion of the CycleGAN for per-pixel segmentation. CycleGAN helps in achieving remarkable performance but also brings along several challenges associated with its application. Non-convergence, instability, and collapse are the shortcomings associated with the use of CycleGAN with an inappropriate architectural design, objective function, and optimization algorithm. Additionally, the CycleGAN mediates the one-to-one associations for a model that is insufficient to describe relationships across complex domains. Furthermore, the current study did not consider the photometric value manipulation and use of HSV (hue, saturation, value) for data augmentation. Thus, it points towards the utility of photometric values and HSV for data augmentation in future studies to ultimately achieve better accuracy.
The current study, due to travel restrictions, lockdowns and movement concerns, is restricted to the case study of Sydney only. Other studies can consider different climatic regions globally to extend the study to other smart cities. Similarly, in the case of Australia, comparisons and assessments with other coastal cities such as Melbourne can be made in the future to realize the Australian smart city dream. Further, the current study focuses on mid to high-rise buildings. In the future, a holistic drone-based monitoring framework for different building types, including small, medium, and high-rise buildings, can also be developed. Finally, transfer learning concepts may help generalize the results to other similar cities and building types.
The CNN-based architecture proposed in the current study will help provide efficient, timely, cost-effective, real-time detection and monitoring of damages. Furthermore, the proposed architecture can be applied to other cities and types of infrastructure. This will help avoid the loss of human lives and economic losses and allow the continuation of routine maintenance. Moreover, the proposed framework provides an additional advantage of scalability, such that it can be easily scaled to any device.
Author Contributions
Conceptualization, F.U.; methodology, H.S.M. and F.U.; software, H.S.M. and F.U.; validation, H.S.M. and F.U. formal analysis, H.S.M. and F.U.; investigation, H.S.M. and F.U.; resources F.U. and A.H.; data curation, H.S.M. and F.U.; writing—original draft preparation, H.S.M. and F.U. writing—review and editing, F.U., A.H., M.J.T. and A.M., visualization, H.S.M. and F.U.; supervision, F.U.; project administration, F.U., A.H., M.J.T. and A.M.; funding acquisition, F.U. All authors have read and agreed to the published version of the manuscript.
Funding
This research received no external funding.
Institutional Review Board Statement
Not applicable.
Informed Consent Statement
Not applicable.
Data Availability Statement
Data is available with the first author and can be shared with anyone upon reasonable request.
Acknowledgments
This research is conducted under the project “2021 HES Faculty Collaboration Grant” awarded to Fahim Ullah at the University of Southern Queensland. The first author is the research assistant and all other authors are collaborators in the project.
Conflicts of Interest
The authors declare no conflict of interest.
Appendix A

Table A1.
List of Abbreviations.
| S. No | Abbreviation | Full Form |
|---|---|---|
| 1 | AI | Artificial Intelligence |
| 2 | ANNs | Artificial Neural Networks |
| 3 | CNNs | Convolutional Neural Networks |
| 4 | CycleGAN | Cycle Generative Adversarial Network |
| 5 | CRFs | Conditional Random Fields |
| 6 | CAC | Class Average Accuracy |
| 7 | FoV | Field of View |
| 8 | FCN | Fully Convolutional Network |
| 9 | FPR | False Positive Rate |
| 10 | GC | Global Accuracy |
| 11 | GNSS | Global Navigation Satellite System |
| 12 | HSV | Hue Saturation Value |
| 13 | HED | Holistically-Nested Edge Detection |
| 14 | KL | Kullback-Leibler |
| 15 | MMS | Mobile Measurement System |
| 16 | MB | Megabytes |
| 17 | ROC | Receiver Operating Characteristic |
| 18 | SGD | Stochastic Gradient Descent |
| 19 | TPR | True Positive Rate |
| 20 | UAV | Unmanned Aerial Vehicle |
| 21 | VGG | Visual Geometry Group |
| 22 | VTOL | Vertical Take-Off and Landing |
Appendix B
Table A2.
Software and Hardware Used in the Paper.
| Software | Hardware |
|---|---|
| Background Sessions of WanDB (Data Distribution) | Drone: DJI M200 |
| Library: PyTorch | Intel Core i9-10900KF (10 × 3.70 GHz, 20MB L3 cache, 125 W) |
| IDE: Anaconda 4.0 | GPU (GeForce RTX 2080 Ti). |
| Language: Python & MATLAB 2017 | Camera: XT2 |
References
- Abdel-Qader, I.; Abudayyeh, O.; Kelly, M.E. Analysis of edge-detection techniques for crack identification in bridges. J. Comput. Civ. Eng. 2003, 17, 255–263. [Google Scholar] [CrossRef]
- Liu, J.; Yang, X.; Lau, S.; Wang, X.; Luo, S.; Lee, V.C.S.; Ding, L. Automated pavement crack detection and segmentation based on two-step convolutional neural network. Comput.-Aided Civ. Infrastruct. Eng. 2020, 35, 1291–1305. [Google Scholar] [CrossRef]
- Ullah, F.; Sepasgozar, S.M.; Wang, C. A systematic review of smart real estate technology: Drivers of, and barriers to, the use of digital disruptive technologies and online platforms. Sustainability 2018, 10, 3142. [Google Scholar] [CrossRef] [Green Version]
- Krizhevsky, A.; Sutskever, I.; Hinton, G.E. ImageNet classification with deep convolutional neural networks. Commun. ACM 2017, 60, 84–90. [Google Scholar] [CrossRef]
- Nishikawa, T.; Sugiyama, T.; Fujino, Y. Concrete crack detection by multiple sequential image filtering. Comput.-Aided Civ. Infrastruct. Eng. 2012, 27, 29–47. [Google Scholar] [CrossRef]
- Brownjohn, J.M. Structural health monitoring of civil infrastructure. Philos. Trans. R. Soc. A Math. Phys. Eng. Sci. 2007, 365, 589–622. [Google Scholar] [CrossRef] [Green Version]
- Ullah, F.; Sepasgozar, S.M.; Thaheem, M.J.; Al-Turjman, F. Barriers to the digitalization and innovation of Australian Smart Real Estate: A managerial perspective on the technology non-adoption. Environ. Technol. Innov. 2021, 22, 101527. [Google Scholar] [CrossRef]
- Ullah, F.; Qayyum, S.; Thaheem, M.J.; Al-Turjman, F.; Sepasgozar, S.M. Risk management in sustainable smart cities governance: A TOE framework. Technol. Forecast. Soc. Chang. 2021, 167, 120743. [Google Scholar] [CrossRef]
- Fujita, Y.; Mitani, Y.; Hamamoto, Y. A method for crack detection on a concrete structure. In Proceedings of the 18th International Conference on Pattern Recognition (ICPR’06), Hong Kong, China, 20–24 August 2006. [Google Scholar]
- Cha, Y.J.; Büyüköztürk, O. Deep learning-based crack damage detection using convolutional neural networks. Comput.-Aided Civ. Infrastruct. Eng. 2017, 32, 361–378. [Google Scholar] [CrossRef]
- Liu, S.-W.; Huang, J.H.; Sung, J.-C.; Lee, C. Detection of cracks using neural networks and computational mechanics. Comput. Methods Appl. Mech. Eng. 2002, 191, 2831–2845. [Google Scholar] [CrossRef]
- Ali, M.L.; Thakur, K.; Atobatele, B. Challenges of cyber security and the emerging trends. In Proceedings of the 2019 ACM International Symposium on Blockchain and Secure Critical Infrastructure, Auckland, New Zealand, 8 July 2019. [Google Scholar]
- Cheng, H.; Chen, J.-R.; Glazier, C.; Hu, Y. Novel approach to pavement cracking detection based on fuzzy set theory. J. Comput. Civ. Eng. 1999, 13, 270–280. [Google Scholar] [CrossRef]
- El Adoui, M.; Mahmoudi, S.A.; Larhmam, M.A.; Benjelloun, M. MRI breast tumor segmentation using different encoder and decoder CNN architectures. Computers 2019, 8, 52. [Google Scholar] [CrossRef] [Green Version]
- Fan, Z.; Li, C.; Mascio, P.D.; Chen, X.; Zhu, G.; Loprencipe, G. Ensemble of deep convolutional neural networks for automatic pavement crack detection and measurement. Coatings 2020, 10, 152. [Google Scholar] [CrossRef] [Green Version]
- Kaseko, M.S.; Lo, Z.-P.; Ritchie, S.G. Comparison of traditional and neural classifiers for pavement-crack detection. J. Transp. Eng. 1994, 120, 552–569. [Google Scholar] [CrossRef]
- Ullah, F. Developing a Novel Technology Adoption Framework for Real Estate Online Platforms: Users’ Perception and Adoption Barriers. Ph.D. Thesis, University of New South Wales, Sydney, Australia, 2021. Available online: https://www.unsworks.unsw.edu.au/permalink/f/a5fmj0/unsworks_77811 (accessed on 10 November 2021).
- Ham, Y.; Kamari, M. Automated content-based filtering for enhanced vision-based documentation in construction toward exploiting big visual data from drones. Autom. Constr. 2019, 105, 102831. [Google Scholar] [CrossRef]
- Li, S.; Zhao, X. Image-based concrete crack detection using convolutional neural network and exhaustive search technique. Adv. Civ. Eng. 2019, 2019, 6520620. [Google Scholar] [CrossRef] [Green Version]
- Chen, M. Development and Evaluation of a Hydrological and Hydraulic Coupled Flood Prediction System Enabled by Remote Sensing, Numerical Weather Prediction, and Deep Learning Technologies. Ph.D. Thesis, University of Oklahoma, Norman, OK, USA, 2021. [Google Scholar]
- Fujita, Y.; Hamamoto, Y. A robust automatic crack detection method from noisy concrete surfaces. Mach. Vis. Appl. 2011, 22, 245–254. [Google Scholar] [CrossRef]
- Han, L.; Liang, H.; Chen, H.; Zhang, W.; Ge, Y. Convective precipitation nowcasting using U-Net Model. IEEE Trans. Geosci. Remote Sens. 2021, 1–8. [Google Scholar] [CrossRef]
- Ullah, F.; Sepasgozar, S.M.; Shirowzhan, S.; Davis, S. Modelling users’ perception of the online real estate platforms in a digitally disruptive environment: An integrated KANO-SISQual approach. Telemat. Inform. 2021, 63, 101660. [Google Scholar] [CrossRef]
- Koch, C.; Georgieva, K.; Kasireddy, V.; Akinci, B.; Fieguth, P. A review on computer vision based defect detection and condition assessment of concrete and asphalt civil infrastructure. Adv. Eng. Inform. 2015, 29, 196–210. [Google Scholar] [CrossRef] [Green Version]
- Ullah, F.; Al-Turjman, F. A conceptual framework for blockchain smart contract adoption to manage real estate deals in smart cities. Neural Comput. Appl. 2021. [Google Scholar] [CrossRef]
- Ullah, F.; Al-Turjman, F.; Qayyum, S.; Inam, H.; Imran, M. Advertising through UAVs: Optimized path system for delivering smart real-estate advertisement materials. Int. J. Intell. Syst. 2021, 36, 3429–3463. [Google Scholar] [CrossRef]
- Dinh, T.H.; La, H.M. Computer vision-based method for concrete crack detection. In Proceedings of the 2016 14th International Conference on Control, Automation, Robotics and Vision (ICARCV), Phuket, Thailand, 13–15 November 2016. [Google Scholar]
- Hoang, N.-D. Image processing-based pitting corrosion detection using metaheuristic optimized multilevel image thresholding and machine-learning approaches. Math. Probl. Eng. 2020, 2020, 6765274. [Google Scholar] [CrossRef]
- Cheng, B.; Girshick, R.; Dollár, P.; Berg, A.C.; Kirillov, A. Boundary IoU: Improving object-centric image segmentation evaluation. In Proceedings of the 2021 IEEE/CVF Conference on Computer Vision and Pattern Recognition, Nashville, TN, USA, 19–25 June 2021. [Google Scholar]
- Jia, Y.; Shelhamer, E.; Donahue, J.; Karayev, S.; Long, J.; Girshick, R.; Guadarrama, S.; Darrell, T. Caffe: Convolutional architecture for fast feature embedding. In Proceedings of the 22nd ACM International Conference on Multimedia, Orlando, FL, USA, 3–7 November 2014. [Google Scholar]
- Ahuja, S.K.; Shukla, M.K. A survey of computer vision based corrosion detection approaches. In International Conference on Information and Communication Technology for Intelligent Systems; Springer: Cham, Switzerland, 2017. [Google Scholar]
- Huyan, J.; Li, W.; Tighe, S.; Xu, Z.; Zhai, J. CrackU-net: A novel deep convolutional neural network for pixelwise pavement crack detection. Struct. Control Health Monit. 2020, 27, e2551. [Google Scholar] [CrossRef]
- Dinh, T.H.; Pham, M.T.; Phung, M.D.; Nguyen, D.M.; Tran, Q.V. Image segmentation based on histogram of depth and an application in driver distraction detection. In Proceedings of the 2014 13th International Conference on Control Automation Robotics & Vision (ICARCV), Singapore, 10–12 December 2014. [Google Scholar]
- LeCun, Y.; Hinton, G. Deep learning. Nature 2015, 521, 436–444. [Google Scholar] [CrossRef]
- Ullah, F.; Sepasgozar, S.M.; Thaheem, M.J.; Wang, C.C.; Imran, M. It’s all about perceptions: A DEMATEL approach to exploring user perceptions of real estate online platforms. Ain Shams Eng. J. 2021, 12, 4297–4317. [Google Scholar] [CrossRef]
- Maqsoom, A.; Aslam, B.; Gul, M.E.; Ullah, F.; Kouzani, A.Z.; Mahmud, M.; Nawaz, A. Using multivariate regression and ANN models to predict properties of concrete cured under hot weather: A case of rawalpindi pakistan. Sustainability 2021, 13, 10164. [Google Scholar] [CrossRef]
- Vu, M.; Jardani, A. Convolutional neural networks with SegNet architecture applied to three-dimensional tomography of subsurface electrical resistivity: CNN-3D-ERT. Geophys. J. Int. 2021, 225, 1319–1331. [Google Scholar] [CrossRef]
- Atha, D.J.; Jahanshahi, M.R. Evaluation of deep learning approaches based on convolutional neural networks for corrosion detection. Struct. Health Monit. 2018, 17, 1110–1128. [Google Scholar] [CrossRef]
- Li, X.; Li, X.; Zhu, D. On the learning property of logistic and softmax losses for deep neural networks. Proc. AAAI Conf. Artif. Intell. 2020, 34, 4739–4746. [Google Scholar] [CrossRef]
- He, K.; Sun, J.; Tang, X. Guided image filtering. IEEE Trans. Pattern Anal. Mach. Intell. 2012, 35, 1397–1409. [Google Scholar] [CrossRef]
- Zeiler, M.D.; Fergus, R. Visualizing and understanding convolutional networks. In European Conference on Computer Vision; Springer: Cham, Switzerland, 2014. [Google Scholar]
- Koch, C.; Brilakis, I. Pothole detection in asphalt pavement images. Adv. Eng. Inform. 2011, 25, 507–515. [Google Scholar] [CrossRef]
- Buckland, M.; Gey, F. The relationship between Recall and Precision. J. Am. Soc. Inf. Sci. 1994, 45, 12–19. [Google Scholar] [CrossRef]
- Moss, D.J.; Nurvitadhi, E.; Sim, J.; Mishra, A.; Marr, D.; Subhaschandra, S.; Leong, P.H. High performance binary neural networks on the Xeon + FPGA™ platform. In Proceedings of the 2017 27th International Conference on Field Programmable Logic and Applications (FPL), Ghent, Belgium, 4–8 September 2017. [Google Scholar]
- Badrinarayanan, V.; Kendall, A.; Cipolla, R. Segnet: A deep convolutional encoder-decoder architecture for image segmentation. IEEE Trans. Pattern Anal. Mach. Intell. 2017, 39, 2481–2495. [Google Scholar] [CrossRef] [PubMed]
- Nguyen, N.T.H.; Le, T.H.; Perry, S.; Nguyen, T.T. Pavement crack detection using convolutional neural network. In Proceedings of the Ninth International Symposium on Information and Communication Technology, Da Nang, Vietnam, 6–7 December 2018. [Google Scholar]
- Moss, T.; Figueroa, G.; Broen, S. Corrosion detection using AI: A comparison of standard computer vision techniques and deep learning model. In Proceedings of the Sixth International Conference on Computer Science, Engineering and Information Technology, Vienna, Austria, 21–22 May 2016. [Google Scholar]
- Sinha, S.K.; Fieguth, P.W. Automated detection of cracks in buried concrete pipe images. Autom. Constr. 2006, 15, 58–72. [Google Scholar] [CrossRef]
- Zhang, K. Deep Learning for Crack-like Object Detection; Utah State University: Logan, UT, USA, 2019. [Google Scholar]
- Prasanna, P.; Gucunski, N.; Basily, B.B.; La, H.M.; Lim, R.S.; Parvardeh, H. Automated crack detection on concrete bridges. IEEE Trans. Autom. Sci. Eng. 2014, 13, 591–599. [Google Scholar] [CrossRef]
- Yokoyama, S.; Matsumoto, T. Development of an automatic detector of cracks in concrete using machine learning. Procedia Eng. 2017, 171, 1250–1255. [Google Scholar] [CrossRef]
- Lee, C.-Y.; Xie, S.; Gallagher, P.; Zhang, Z.; Tu, Z. Deeply-supervised nets. In Artificial Intelligence and Statistics; PMLR: San Diego, CA, USA, 2015. [Google Scholar]
- Stroia, I.; Itu, L.; Niţă, C.; Lazăr, L.; Suciu, C. GPU accelerated geometric multigrid method: Performance comparison on recent NVIDIA architectures. In Proceedings of the 2015 19th International Conference on System Theory, Control and Computing (ICSTCC), Cheile Gradistei, Romania, 14–16 October 2015. [Google Scholar]
- Wang, W.; Wang, K.C.; Braham, A.F.; Qiu, S. Pavement crack width measurement based on Laplace’s equation for continuity and unambiguity. Comput.-Aided Civ. Infrastruct. Eng. 2018, 33, 110–123. [Google Scholar] [CrossRef]
- Protopapadakis, E.; Kopsiaftis, G.; Doulamis, N.; Amditis, A. Crack identification via user feedback, convolutional neural networks and laser scanners for tunnel infrastructures. In Proceedings of the International Joint Conference on Computer Vision, Imaging and Computer Graphics Theory and Applications, Rome, Italy, 27–29 February 2016. [Google Scholar] [CrossRef] [Green Version]
- Qayyum, S.; Ullah, F.; Al-Turjman, F.; Mojtahedi, M. Managing smart cities through six sigma DMADICV method: A review-based conceptual framework. Sustain. Cities Soc. 2021, 72, 103022. [Google Scholar] [CrossRef]
- Lee, B.Y.; Kim, Y.Y.; Kim, J.-K. Automated image processing technique for detecting and analyzing concrete surface cracks. Struct. Infrastruct. Eng. 2013, 9, 567–577. [Google Scholar] [CrossRef]
- Zhu, J.-Y.; Park, T.; Isola, P.; Efros, A.A. Unpaired image-to-image translation using cycle-consistent adversarial networks. In Proceedings of the 2017 IEEE International Conference on Computer Vision, Venice, Italy, 22–29 October 2017. [Google Scholar]
- Rivadeneira, R.E.; Sappa, A.D.; Vintimilla, B.X. Thermal image super-resolution: A novel architecture and dataset. In Proceedings of the 15th International Conference on Computer Vision Theory and Applications, Valletta, Malta, 27–29 February 2020. [Google Scholar]
- Yamaguchi, T.; Nakamura, S.; Saegusa, R.; Hashimoto, S. Image-based crack detection for real concrete surfaces. IEEJ Trans. Electr. Electron. Eng. 2008, 3, 128–135. [Google Scholar] [CrossRef]
- Long, J.; Darrell, T. Fully convolutional networks for semantic segmentation. In Proceedings of the IEEE Conference on computer Vision and Pattern Recognition, Boston, MA, USA, 7–12 June 2015. [Google Scholar]
- Simonyan, K.; Zisserman, A. Very deep convolutional networks for large-scale image recognition. arXiv 2014, arXiv:1409.1556v6. [Google Scholar]
- Suh, G.; Cha, Y.-J. Deep faster R-CNN-based automated detection and localization of multiple types of damage. In Sensors and Smart Structures Technologies for Civil, Mechanical, and Aerospace Systems 2018; International Society for Optics and Photonics: Denver, CO, USA, 2018. [Google Scholar]
- Wei, Y.; Wang, Z.; Xu, M. Road structure refined CNN for road extraction in aerial image. IEEE Geosci. Remote Sens. Lett. 2017, 14, 709–713. [Google Scholar] [CrossRef]
- Liu, L.; Tan, E.; Zhen, Y.; Yin, X.J.; Cai, Z.Q. AI-facilitated coating corrosion assessment system for productivity enhancement. In Proceedings of the 2018 13th IEEE Conference on Industrial Electronics and Applications (ICIEA), Wuhan, China, 31 May–2 June 2018. [Google Scholar]
- Prasoon, A.; Igel, C.; Lauze, F.; Dam, E.; Nielsen, M. Deep feature learning for knee cartilage segmentation using a triplanar convolutional neural network. In International Conference on Medical Image Computing and Computer-Assisted Intervention; Springer: Berlin/Heidelberg, Germany, 2013. [Google Scholar]
- Zhang, K.; Zhang, Y.; Cheng, H. Self-supervised structure learning for crack detection based on cycle-consistent generative adversarial networks. J. Comput. Civ. Eng. 2020, 34, 04020004. [Google Scholar] [CrossRef]
- Santos, B.O.; Valença, J.; Júlio, E. Classification of biological colonization on concrete surfaces using false colour HSV images, including near-infrared information. In Optical Sensing and Detection V; International Society for Optics and Photonics: Strasbourg, France, 2018. [Google Scholar]
- Su, C.; Wang, W. Concrete cracks detection using convolutional neuralnetwork based on transfer learning. Math. Probl. Eng. 2020, 2020, 7240129. [Google Scholar] [CrossRef]
- Yuan, M.; Liu, Z.; Wang, F. Using the wide-range attention U-Net for road segmentation. Remote Sens. Lett. 2019, 10, 506–515. [Google Scholar] [CrossRef]
- Qu, Z.; Ju, F.-R.; Guo, Y.; Bai, L.; Chen, K. Concrete surface crack detection with the improved pre-extraction and the second percolation processing methods. PLoS ONE 2018, 13, e0201109. [Google Scholar] [CrossRef] [PubMed] [Green Version]
- Munawar, H.S.; Qayyum, S.; Khan, S.I.; Mojtahedi, M. UAVs in disaster management: Application of integrated aerial imagery and convolutional neural network for flood detection. Sustainability 2021, 13, 7547. [Google Scholar] [CrossRef]
- Munawar, H.S.; Ullah, F.; Qayyum, S.; Heravi, A. Application of deep learning on uav-based aerial images for flood detection. Smart Cities 2021, 4, 1220–1243. [Google Scholar] [CrossRef]
- Ullah, F.; Khan, S.I.; Munawar, H.S.; Qadir, Z.; Qayyum, S. UAV based spatiotemporal analysis of the 2019–2020 new south wales bushfires. Sustainability 2021, 13, 10207. [Google Scholar] [CrossRef]
- Soni, A.N. Crack detection in buildings using convolutional neural network. J. Innov. Dev. Pharm. Tech. Sci. 2019, 2, 54–59. [Google Scholar]
Figure 1.
(a) The Structure Degradation Detection CNN framework. (b) Process of image creation using a lens.
Figure 1.
(a) The Structure Degradation Detection CNN framework. (b) Process of image creation using a lens.
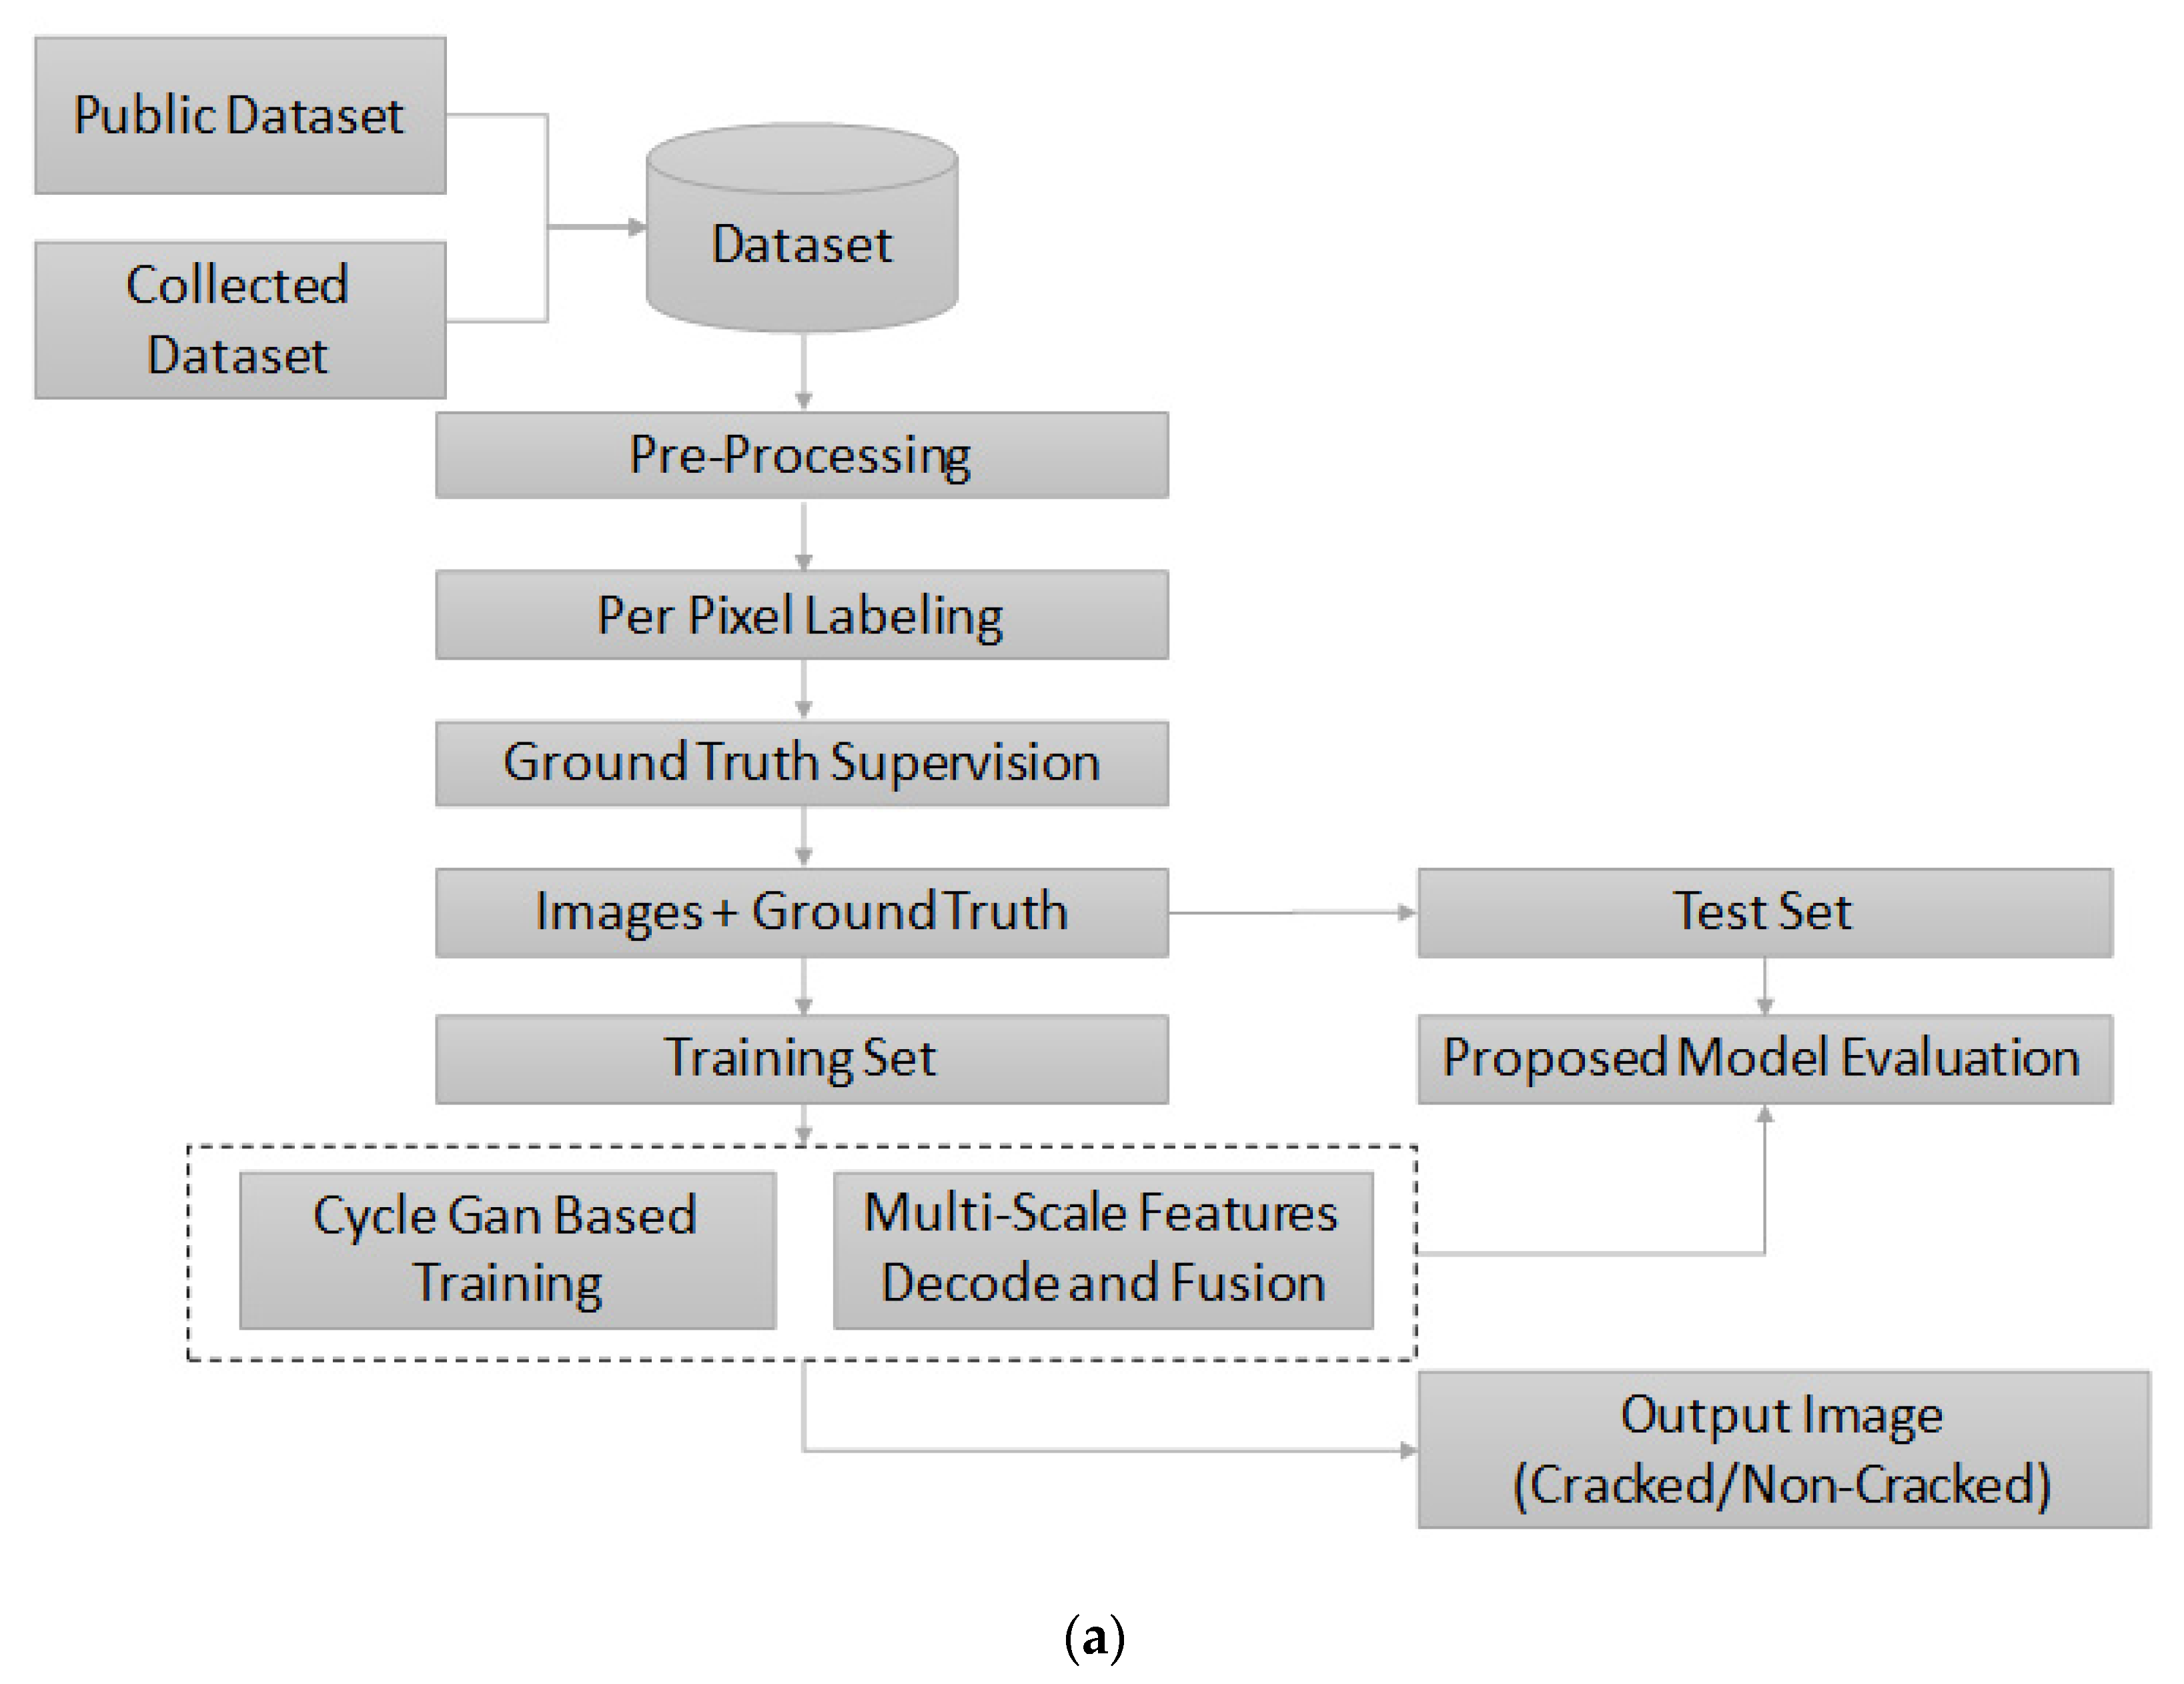

Figure 2.
Three types of cracks included in the dataset (a) simple crack, (b) hairline crack, and (c) artificial marking crack.
Figure 2.
Three types of cracks included in the dataset (a) simple crack, (b) hairline crack, and (c) artificial marking crack.

Figure 3.
The height, width, and spatial extent of the crack pixels in the dataset.

Figure 4.
A representation of 16-convolutional layer CNN architecture.
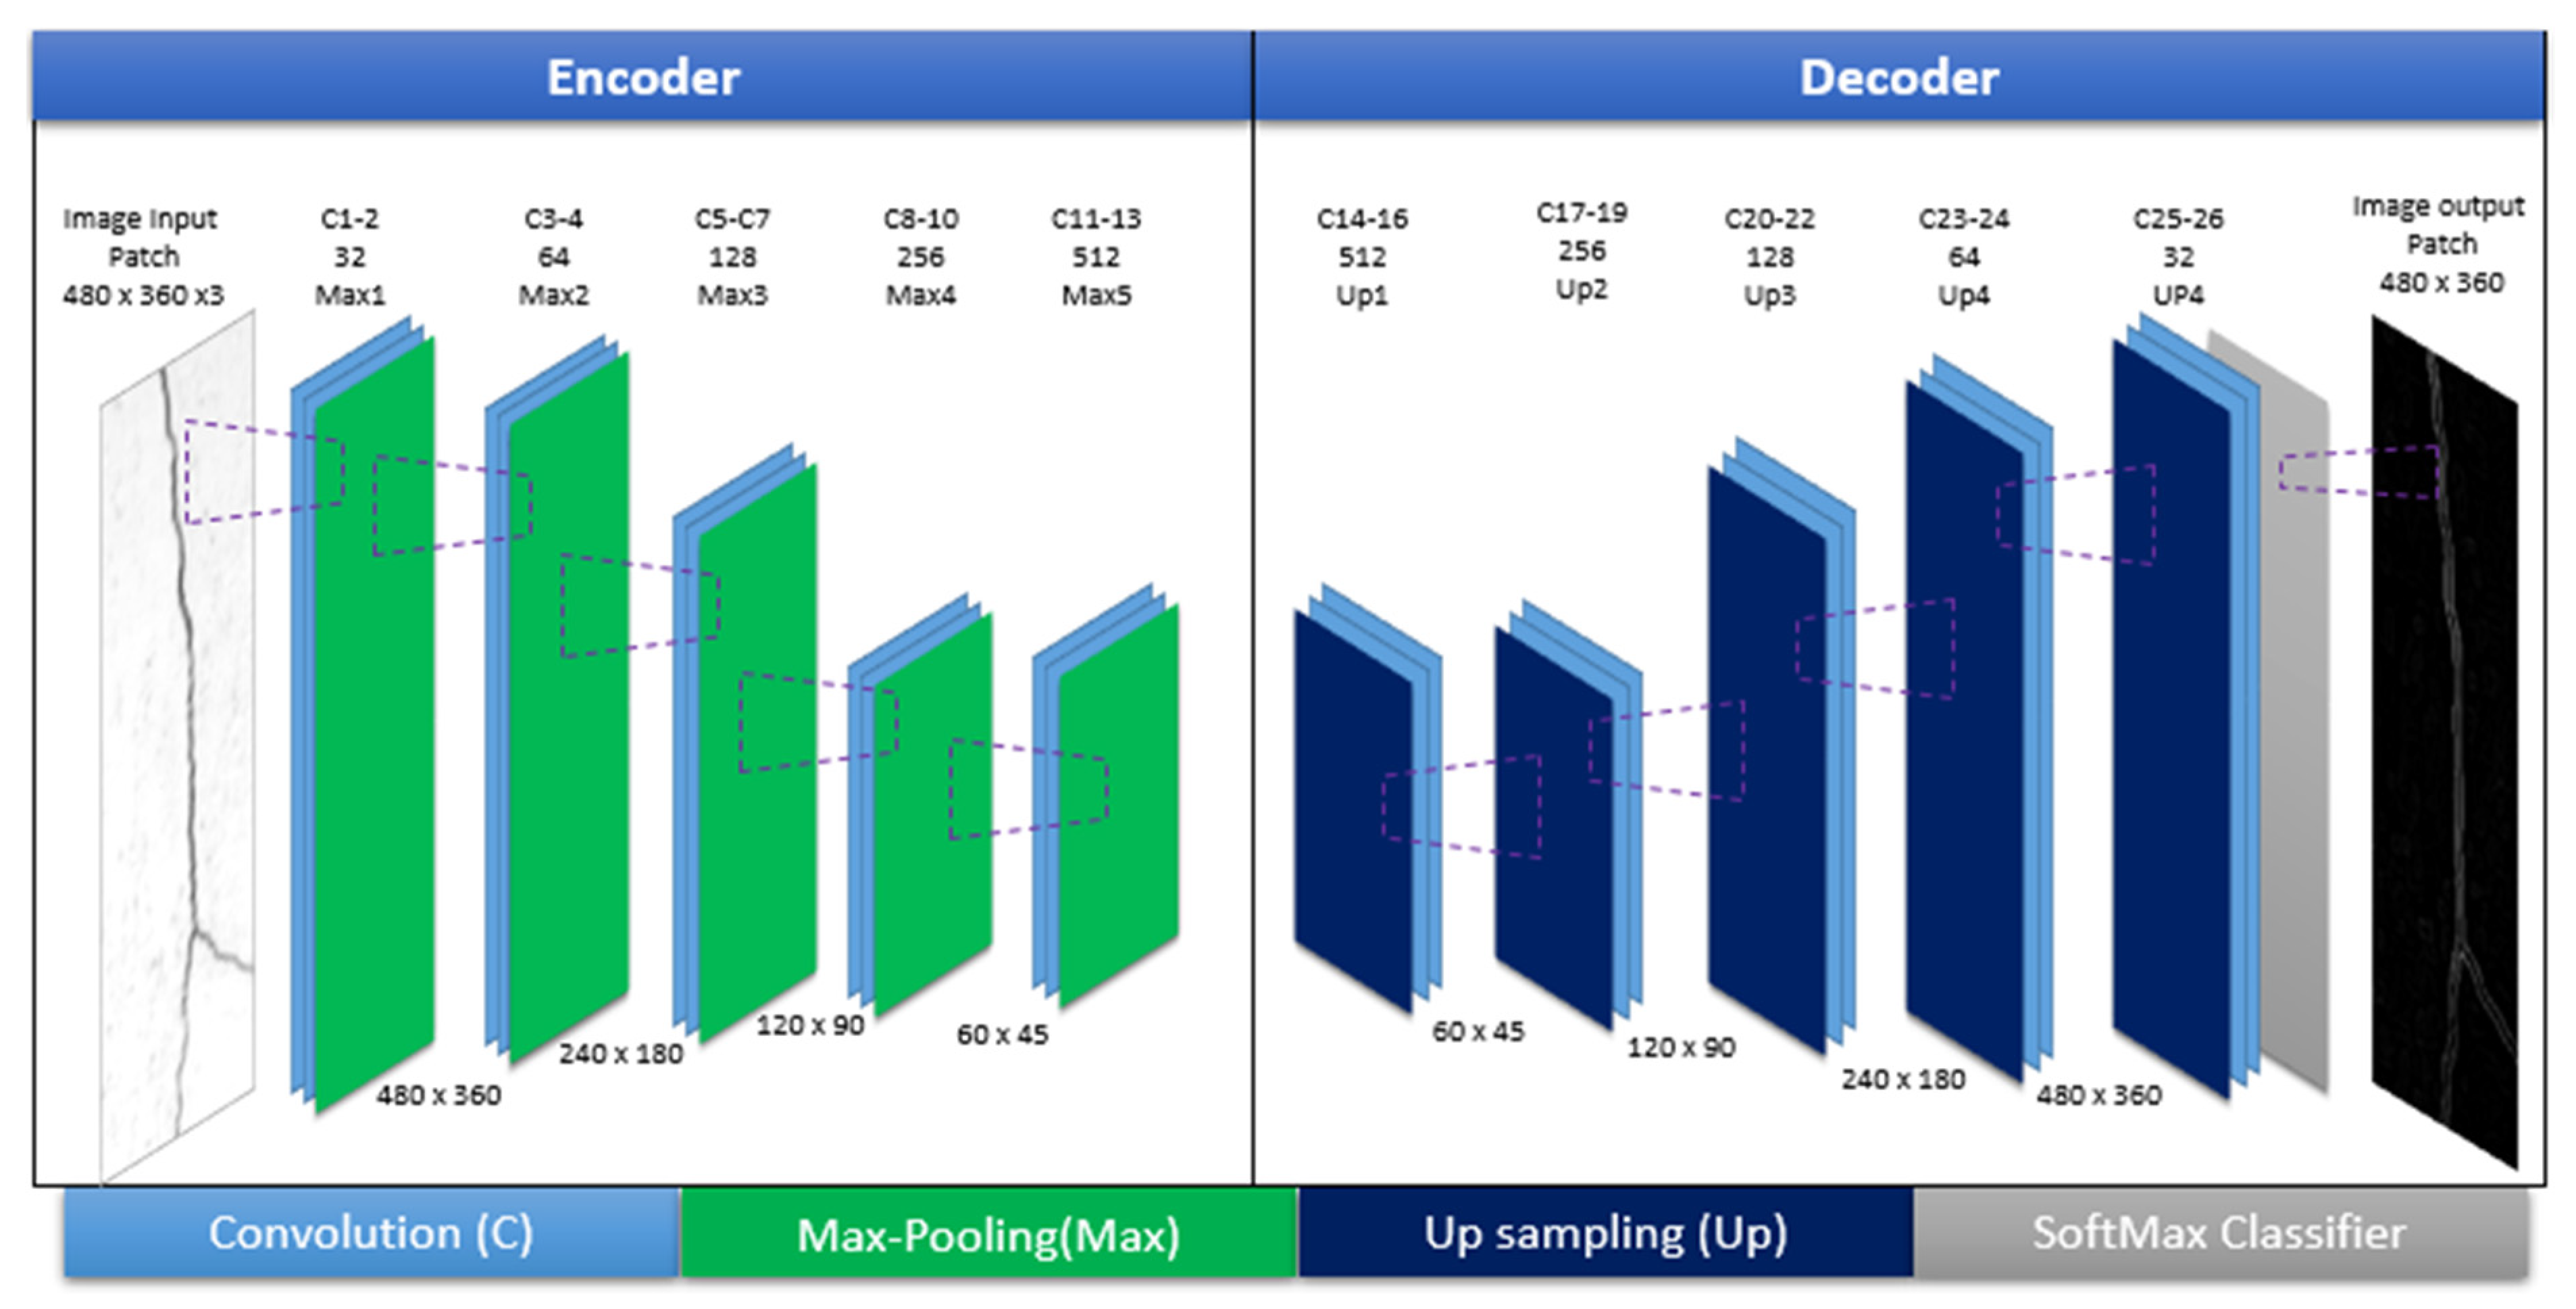
Figure 5.
The U-Net architecture for crack detection.

Figure 6.
The plots for iterations versus Recall for the (a) training and (b) test sets.
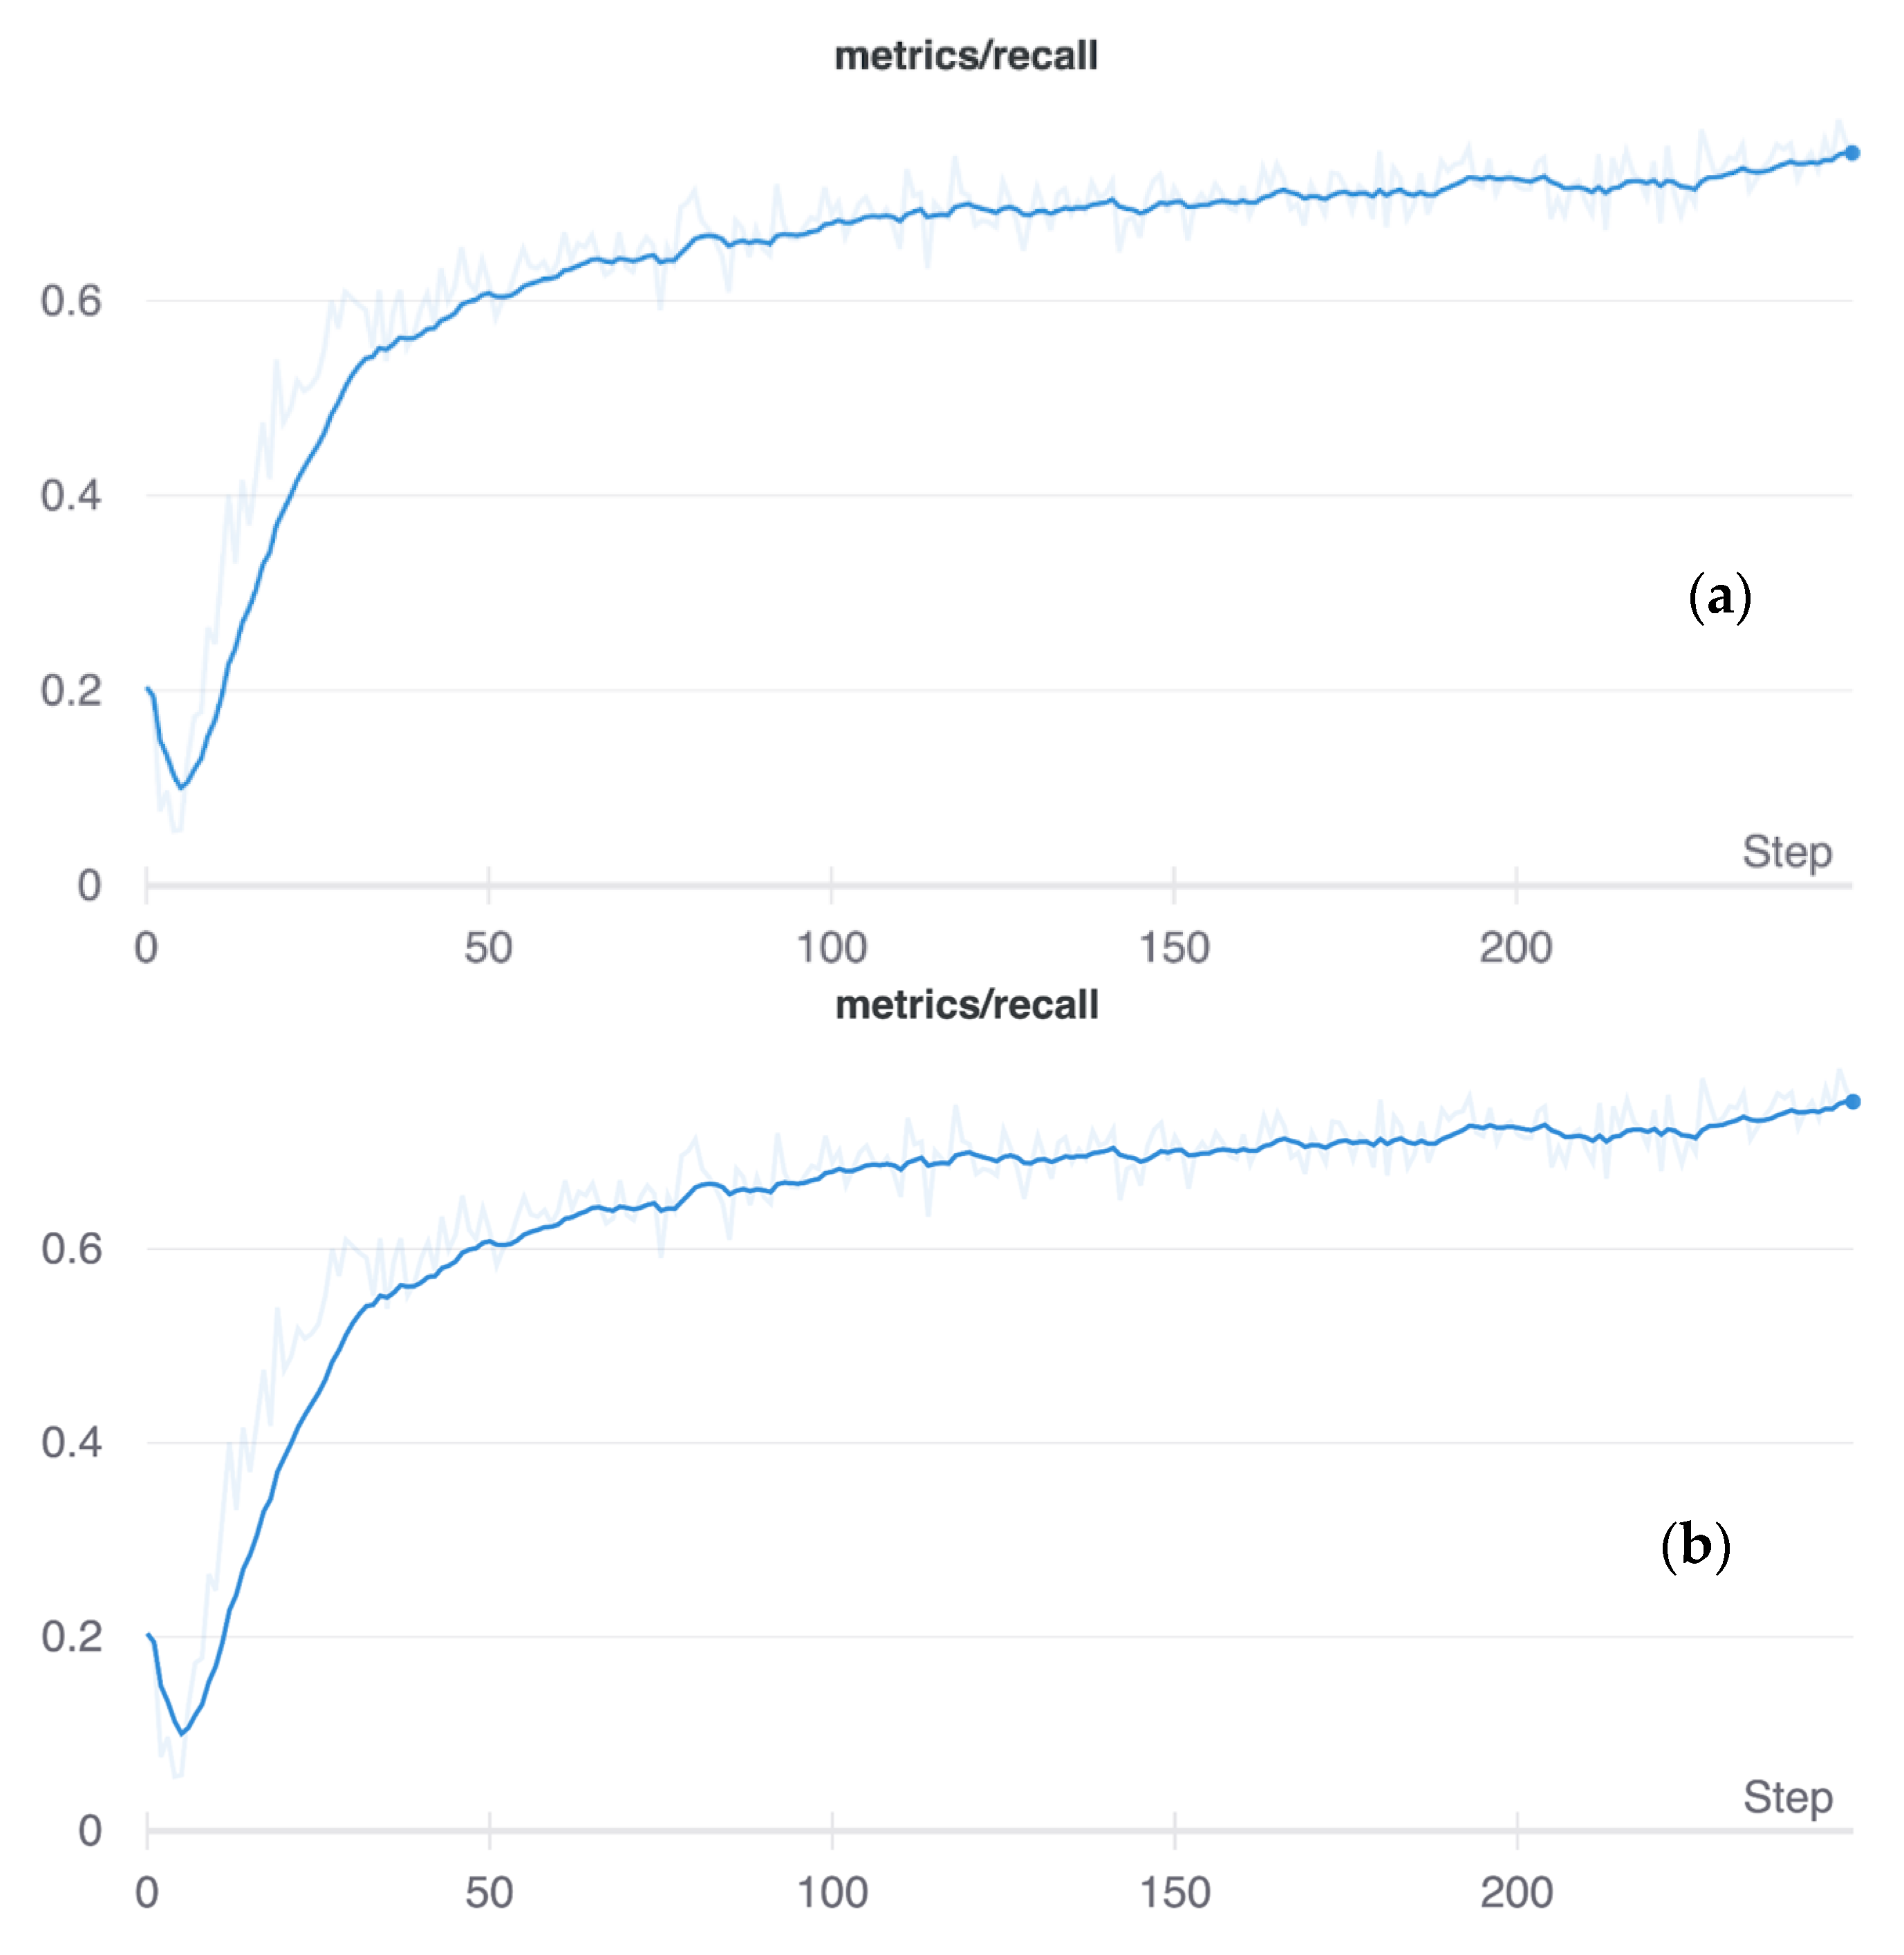
Figure 7.
The use of CycleGan for training the network.

Figure 8.
The precision-recall curves for the dataset.
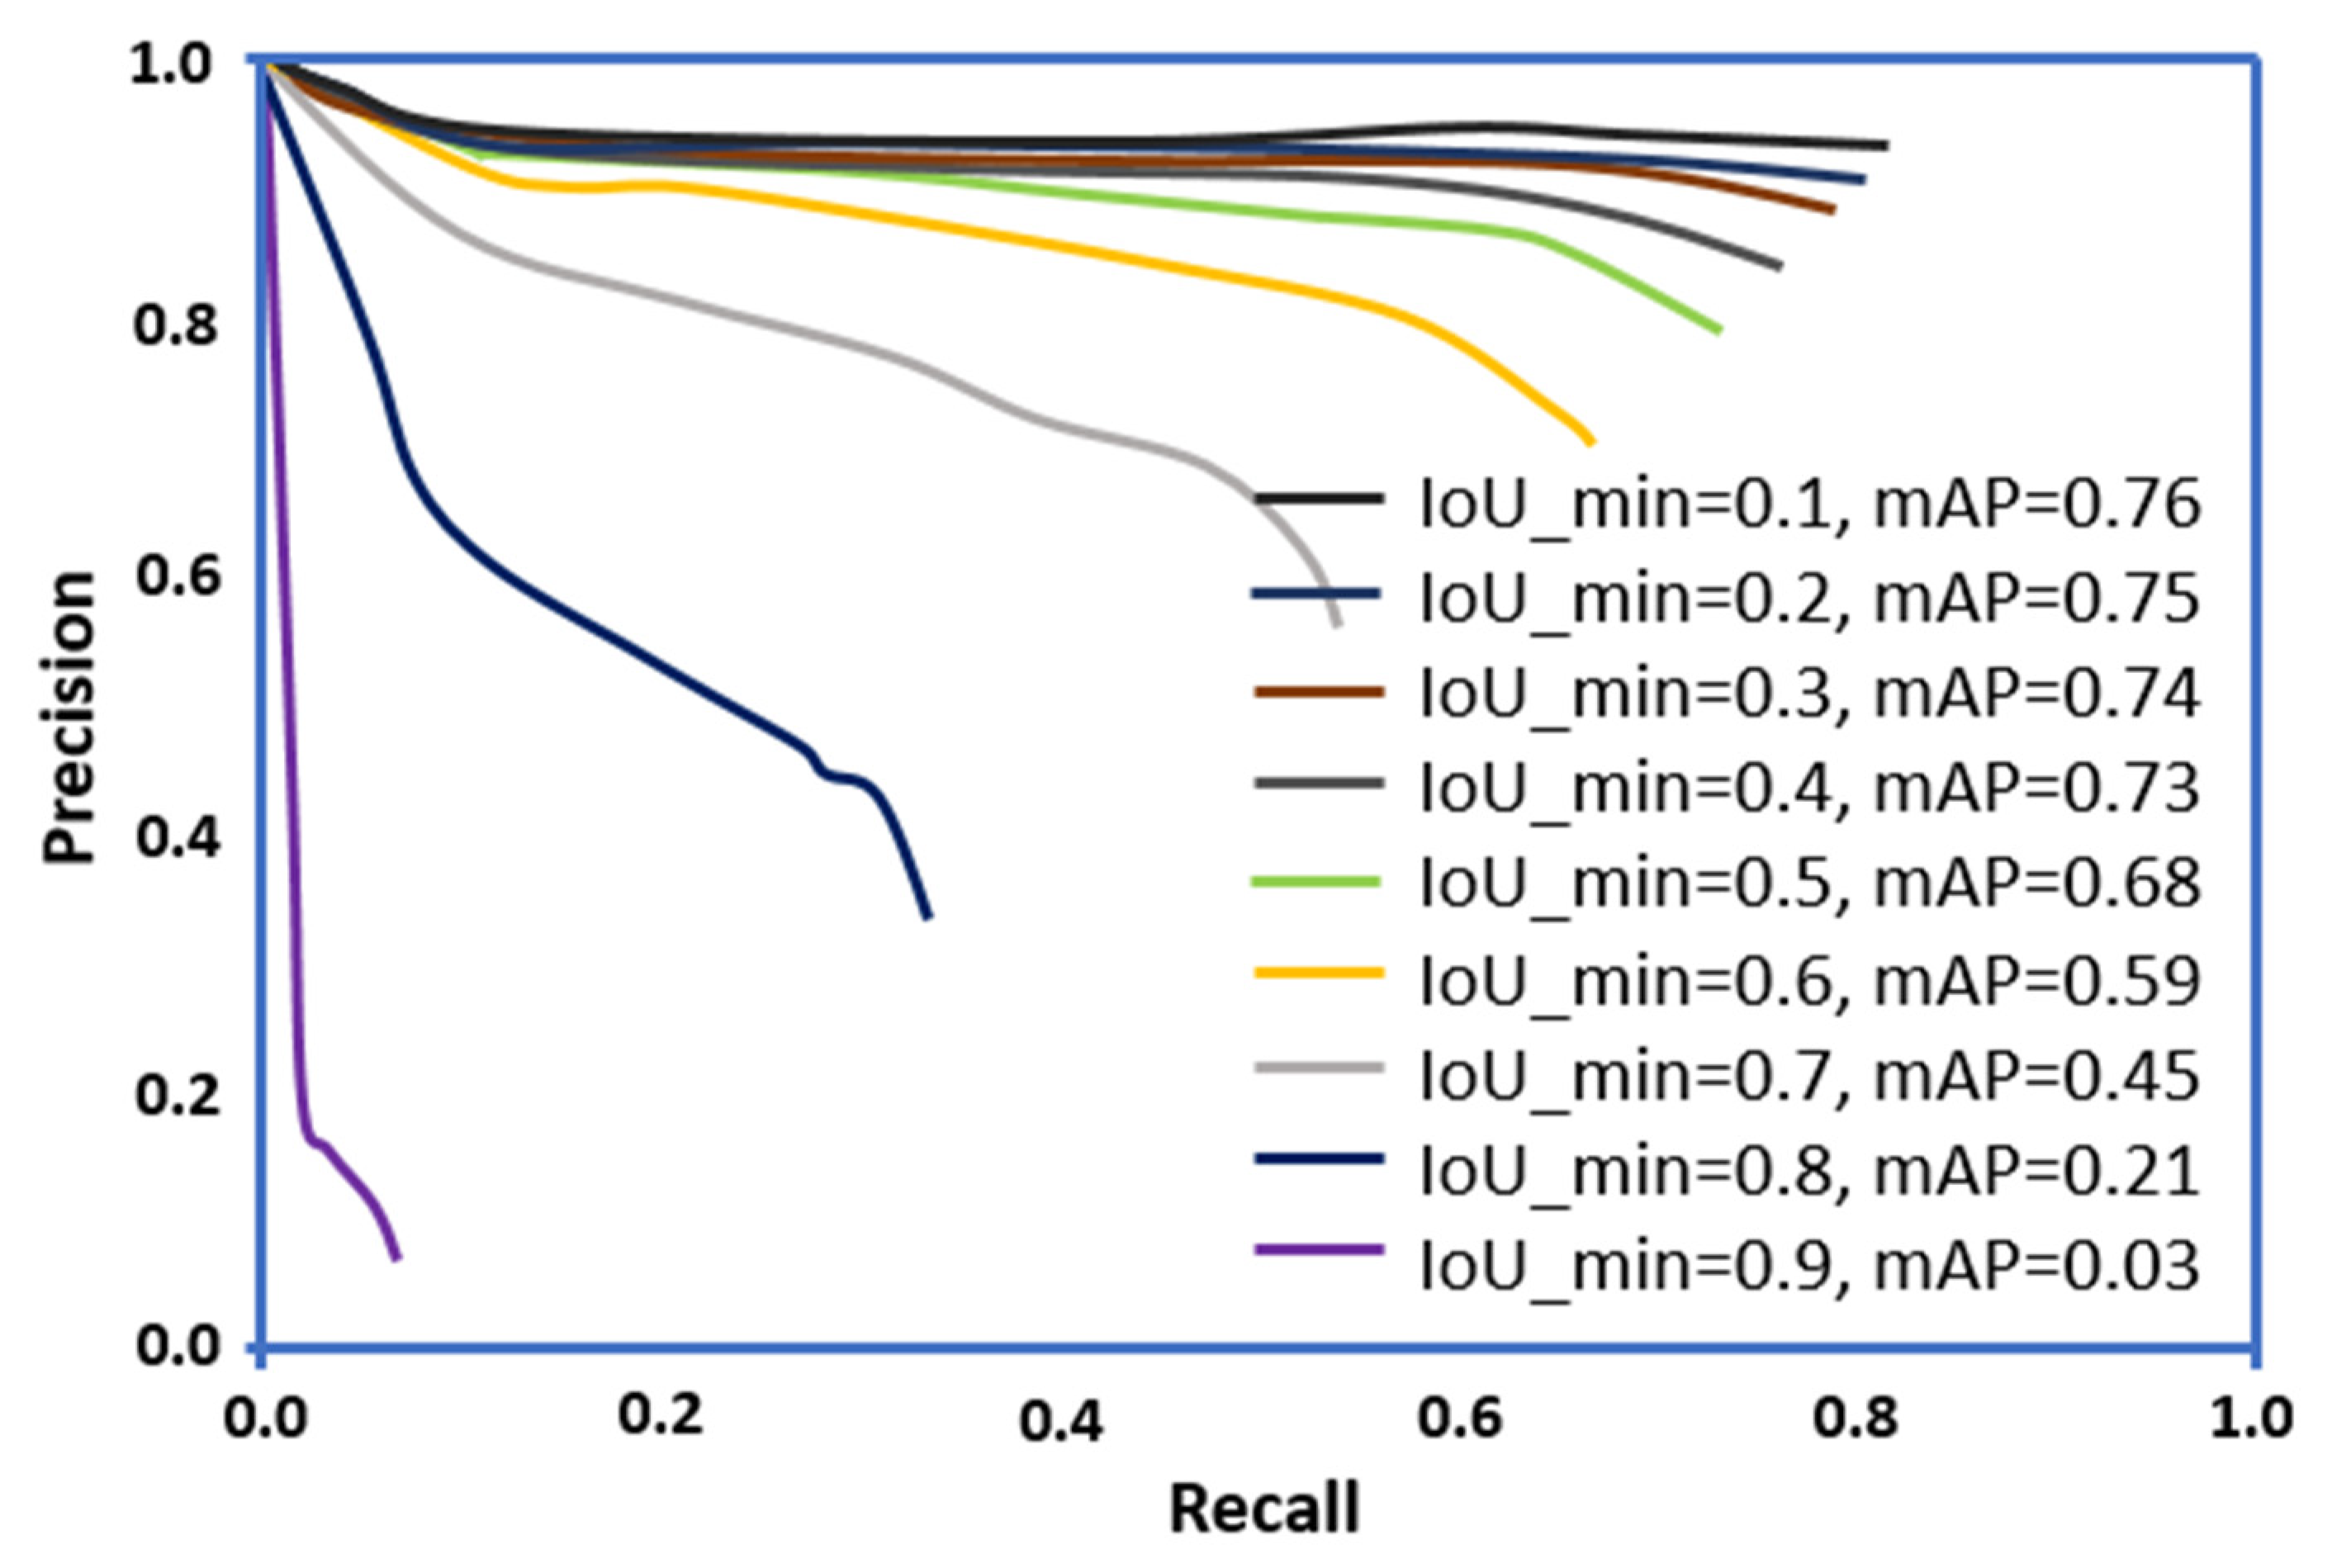
Figure 9.
The specifications of the DJI-MJ200 used for capturing crack images. (details available at https://www.dji.com/zenmuse-xt2, accessed on 8 December 2021).
Figure 9.
The specifications of the DJI-MJ200 used for capturing crack images. (details available at https://www.dji.com/zenmuse-xt2, accessed on 8 December 2021).

Figure 10.
Some of the representative crack images included in the crack dataset and the associated segmentation used in the current study.
Figure 10.
Some of the representative crack images included in the crack dataset and the associated segmentation used in the current study.

Figure 11.
The Precision-Recall curves generated by the threshold segmentation method.

Table 1.
The percentage of crack and non-crack pixels used to train and validate the CNN-based crack detection architecture.
Table 1.
The percentage of crack and non-crack pixels used to train and validate the CNN-based crack detection architecture.
| Crack Pixels (%) | Non-Crack Pixels (%) | ||
|---|---|---|---|
| Significant | Weak | ||
| Total | 2.98 | 1.37 | 95.65 |
| Training | 3.13 | 0.55 | 96.30 |
| Testing | 4.25 | 1.06 | 94.68 |
Table 2.
Model Parameters tuned for the network.
| Serial No | Parameter | Value Tuned |
|---|---|---|
| 1 | Size of the input image | 544 × 384 × 3 |
| 2 | Ground truth size | 544 × 384 × 1 |
| 3 | Size of mini-batch | 1 |
| 4 | Learning Rate | 1 × 10⁻⁴ |
| 5 | Loss weight associated with each side-output layer | 1.0 |
| 6 | Loss weight associated with final fused layer 1.0 | 1.0 |
| 7 | Momentum | 0.9 |
| 8 | Weight decay | 2 × 10⁻⁴ |
| 9 | Training iterations | 2 × 10⁵; reduce learning rate by 1/5 after 5 × 10⁴ |
Table 3.
Performance evaluation metrics for the selected threshold segmentation methods.
| Outputs | Global Accuracy | Class Average Accuracy | Mean IoU | Precision | Recall | F-Score |
|---|---|---|---|---|---|---|
| Our Method with Guided Filter | 0.990 | 0.939 | 0.879 | 0.838 | 0.879 | 0.8581 |
| Our Baseline Method | 0.988 | 0.899 | 0.896 | 0.84 | 0.784 | 0.807 |
| DeepCrack-BN | 0.982 | 0.898 | 0.822 | 0.768 | 0.806 | 0.786 |
| DeepCrack-GF | 0.964 | 0.875 | 0.825 | 0.787 | 0.724 | 0.754 |
| SegNet | 0.871 | 0.819 | 0.649 | 0.626 | 0.66 | 0.643 |
Publisher’s Note: MDPI stays neutral with regard to jurisdictional claims in published maps and institutional affiliations. |
© 2021 by the authors. Licensee MDPI, Basel, Switzerland. This article is an open access article distributed under the terms and conditions of the Creative Commons Attribution (CC BY) license (https://creativecommons.org/licenses/by/4.0/).
Share and Cite
MDPI and ACS Style
Munawar, H.S.; Ullah, F.; Heravi, A.; Thaheem, M.J.; Maqsoom, A. Inspecting Buildings Using Drones and Computer Vision: A Machine Learning Approach to Detect Cracks and Damages. Drones 2022, 6, 5. https://doi.org/10.3390/drones6010005
AMA Style
Munawar HS, Ullah F, Heravi A, Thaheem MJ, Maqsoom A. Inspecting Buildings Using Drones and Computer Vision: A Machine Learning Approach to Detect Cracks and Damages. Drones. 2022; 6(1):5. https://doi.org/10.3390/drones6010005
Chicago/Turabian StyleMunawar, Hafiz Suliman, Fahim Ullah, Amirhossein Heravi, Muhammad Jamaluddin Thaheem, and Ahsen Maqsoom. 2022. "Inspecting Buildings Using Drones and Computer Vision: A Machine Learning Approach to Detect Cracks and Damages" Drones 6, no. 1: 5. https://doi.org/10.3390/drones6010005