


Highlights
What are the main findings?
- A UAV-based system which enables configurable water sampling.
- The system performs composite multi-point sampling within a single UAV mission while reducing cross-contamination.
What are the implications of the main finding?
- Improved UAV mission efficiency through energy-aware sampling operations.
- Flexible sampling strategies through user-defined and customizable protocols.
Abstract
Surface water monitoring often requires frequent and reliable sampling at locations that are difficult or unsafe to access using conventional methods. To address these constraints, unmanned aerial vehicles (UAVs) have increasingly been used as platforms for automated water collection. This paper presents a UAV-assisted water sampling system designed to provide a high degree of operational flexibility through control of sampling depth and collected volume. The proposed system can collect up to 3 L of water distributed across six individual containers, enabling a variety of sampling strategies, including discrete, composite, and multi-depth sampling. Sampling depths of up to 3.25 m can be achieved, supporting depth-resolved investigations such as stratified water-column analyses. Compared with existing UAV-based samplers, the proposed system combines configurable sampling depth, configurable sampling volume, and a multi-bottle architecture within a single platform. To support sample integrity, an automated cleaning sequence is executed before each collection step to reduce the risk of cross-contamination between samples. Experimental validation demonstrated repeatable depth deployment under controlled conditions and consistent volume-control performance, with relative errors generally within ±3% and a maximum observed deviation of 5%. In addition, a task-based analysis provided an initial characterization of the energy demand associated with the sampling process. Overall, the results indicate that the proposed architecture can support flexible and protocol-oriented water sampling operations while extending the sampling capabilities of existing UAV-based systems.
1. Introduction
Unmanned aerial vehicles (UAVs), which are commonly referred to as drones, are increasingly used in environmental monitoring applications due to their rapid deployment, high mobility, and ability to operate in areas that are difficult or unsafe to access. Equipped with lightweight sensors and imaging systems, UAVs are widely applied to tasks such as precision agriculture vegetation and forest inspection [1,2,3], snow surface mapping, and water body monitoring. Recent progress in increasing payload capacity, onboard power availability, and wireless communication solutions has also enabled UAVs to support more demanding field operations, including water sampling and in situ measurements [4,5].
Water sampling is performed in a wide range of environments, including lakes, rivers, coastal waters, and groundwater systems, each presenting specific operational constraints and requirements [6,7]. Water sampling plays a critical role in environmental monitoring and decision-making processes, as collected samples are used to assess water quality indicators such as nutrient concentrations, contaminants, and biological markers, which support the management of water resources and ecosystem health [8,9]. In recent years, sampling has also supported advanced analyses such as environmental DNA (eDNA), which enables the detection of species presence and biodiversity through water samples [10,11].
In this context, UAV-assisted sampling is particularly well suited to surface water environments, offering efficient access without the need for direct physical presence. This approach has emerged as a promising alternative to traditional boat-based methods. Compared to boat-based sampling, UAV-based approaches offer improved operator safety, reduced logistical constraints, and enhanced accessibility to hazardous or remote locations, while minimizing disturbance to the sampled environment [5,12]. As summarized in Table 1, these advantages make UAV-based sampling particularly suitable for rapid or repeated monitoring campaigns.
Table 1.
Comparison between boat-based and drone-based water sampling methods. Symbols indicate qualitative performance: “–” denotes a limitation or unfavorable characteristic, “+” indicates acceptable or favorable performance, and “++” denotes a strong advantage.
Although boat-based sampling remains a reference method due to its established protocols, precise control, and reliable sample handling, several studies have demonstrated that UAV-assisted sampling can provide water samples of sufficient quality and reproducibility for scientific analyses [5,13,14].
While UAV-based sampling introduces new challenges related to payload limitations and stability, it offers significant advantages in terms of rapid deployment, safety, and accessibility. These challenges highlight the need for rigorous validation of UAV-based sampling approaches. A key requirement for the adoption of UAV-based sampling in environmental monitoring is to demonstrate that the data obtained from samples collected using UAV systems are comparable to those obtained using conventional boat-based methods. Previous studies have shown, through statistical comparisons of water quality parameters, that no significant differences are observed between UAV-based and traditional sampling approaches, indicating that data accuracy and precision are not adversely affected by the use of UAV platforms [15]. Beyond data quality considerations, operational efficiency also plays a key role in the adoption of UAV-based systems. UAV-based operations can substantially reduce sampling time and operational costs, particularly in repetitive or spatially distributed monitoring campaigns. Although UAV-based systems may involve higher initial investment costs, they offer significant advantages by reducing logistical constraints and field deployment effort [15].
Despite these advantages, most existing UAV-based water sampling systems remain limited in their ability to support advanced sampling protocols, particularly those requiring variable sample volumes and depth-selective collection. Many reported systems rely on fixed-volume containers, predefined sampling depths, or a limited number of samples per mission, which restricts their applicability in studies requiring larger integrated volumes or flexible sampling strategies [8,16,17,18]. These limitations are especially constraining when composite sampling is required. Composite sampling, which consists of combining water that is collected from multiple surface or depth locations into a single container, is commonly used to obtain a sample that is representative of spatial or vertical variability. In particular, current designs typically constrain either the number of samples, the achievable sampling depth, or the collected volume, forcing practitioners to adapt their protocols to the hardware rather than the converse.
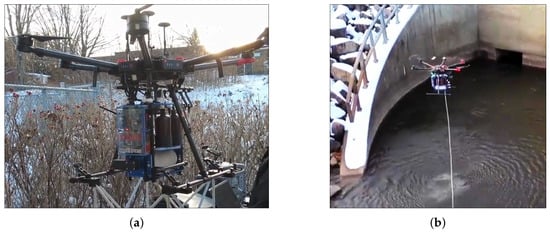
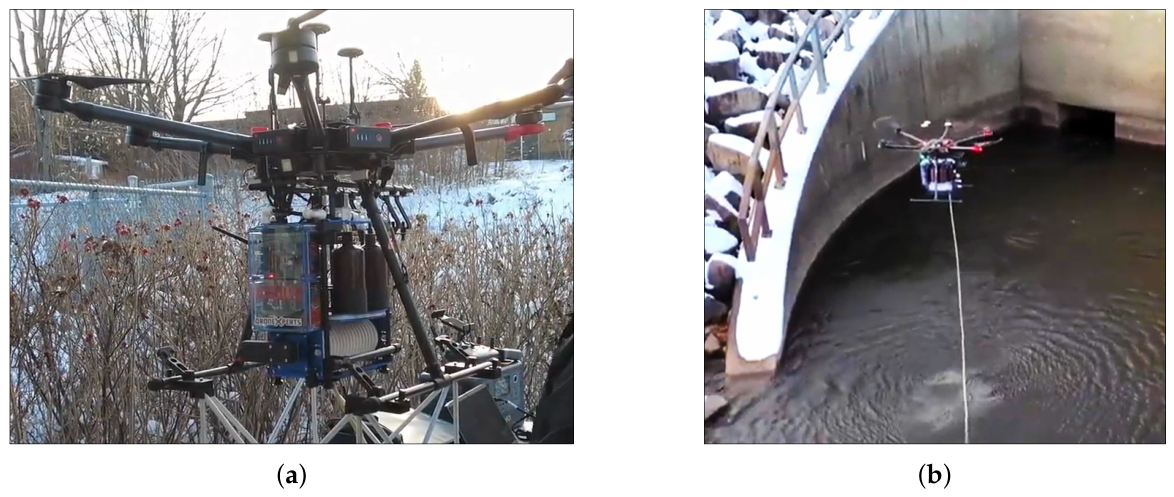
To address these limitations, this paper presents a custom-built UAV-assisted water sampling payload that was designed to provide a high degree of operational flexibility (Figure 1). The main contribution of this work is a sampling payload that simultaneously offers
Figure 1.
UAV-mounted water sampling system. (a) Water sampling system mounted on a DJI M600; (b) Water sampling system during a sampling mission.
- (i)
- User-configurable sampling volume up to 3 L of water distributed across six individual containers;
- (ii)
- User-configurable sampling depth up to 3.25 m;
- (iii)
- Support for multi-bottle composite sampling within a single mission.
Since the proposed sampler combines active pumping, flowmeter-based volume regulation, and a multi-container storage system, it can implement discrete, composite, and hybrid protocols that better align with analytical requirements in environmental monitoring. To preserve sample integrity and minimize cross-contamination between successive collections, an automated flushing and cleaning sequence is executed prior to each sampling action.
The remainder of this paper is organized as follows. Section 2 reviews existing UAV-based water sampling systems and highlights their limitations. Section 3 describes the architecture and operating principles of the proposed system. Section 4 presents experimental results including the sampling performance, operational task duration, and power consumption. Section 5 discusses the results and Section 6 concludes the paper and outlines perspectives for future improvements.
2. Related Work
Over the past decade, several UAV-based water sampling systems have been proposed to demonstrate the feasibility of aerial water collection in aquatic environments. These systems differ in their sampling mechanisms, achievable depths, collected volumes, and degree of autonomy. Early studies primarily focused on validating the concept of UAV-assisted sampling and demonstrating that water samples that were collected by drones could meet scientific quality requirements. More recent work has explored improvements in automation, positioning accuracy, and operational safety. However, despite these advances, most existing systems remain constrained by fixed sampling volumes, limited depth control, or a small number of samples per mission, which restricts their applicability for advanced or composite sampling protocols.
The pioneer in this field is the work of Jean-Paul Ore and his coworkers [17]. They proposed a mechanism that can collect three 20 mL samples per mission using a suspended pump. The proposed system is equipped with sensors for altitude approximation. They also had proposed a method to avoid cross-contamination which consists of flushing water after each sampling operation. Schwarzbach et al. [18] presented a system consisting of a 500 mL container that is affixed to the UAV, in which water is collected through a suspended pump. Doi et al. [10] proposed a system consisting of a 1 L bottle that was suspended from a UAV by a 10 m wire. The system included two buoys, one to prevent cable interference and another to visually confirm that the bottle had submerged for water sampling. Terada et al. [12] proposed a drone-based water sampler comprising of a bottle suspended from the UAV with a 30 m rope. The structure of the bottle is similar to a Van Dorn sampler [19], which is a hollow tube that can be filled when lowered into the water and where the open ends are blocked by two stoppers or balls when the rope is pulled up, thereby avoiding the downward flow. The bottle can collect up to 330 mL. Koparan et al. [8] developed an autonomous UAV-based water sampling system using a thief-style sampler that was suspended on a 1.8 m tether. The device collects a single 130 mL water sample at depths ranging from 0.56 to 0.79 m, which is triggered mechanically by a released messanger weight, like a Van Dorn bottle. Castendyk et al. [20] proposed a validated method for water sampling in pit lakes using a DJI Matrice 600 drone that was equipped with a passive HydraSleeve sampler. This system enables sample collection at depths up to 92 m, with a total sample volume of approximately 1.75 L offering a safe alternative to boat-based sampling in hazardous or inaccessible environments. The chemical results that were obtained with this method were found to be comparable to traditional approaches, with deviations less than 20%. Lariosa et al. [21] developed a UAV-based automatic water sampling system capable of collecting a single surface water sample of approximately 500 mL. The sampling depth is limited to about 0.1 m below the water surface and is defined by the position of a float switch relative to the sampling chamber. Ryu et al. [22] presented a UAV-based real-time water quality monitoring and sampling platform (UASWQP) that integrates in situ sensors (pH, temperature, electrical conductivity, dissolved oxygen). The system also includes a suspended bottle sampler capable of collecting up to 1 L of water at variable but non-quantified depths, and is primarily designed for real-time monitoring rather than sampling. Kidder et al. [23] proposed a UAV-based water sampling system designed for hydrogeochemical mineral exploration, combining a peristaltic pump with in-line (0.45 µm) point-source filtration to collect dissolved trace-element samples. The system prioritizes analytical sample quality and contamination control and is designed for sampling at fixed depths (≈2 m), with single-sample collection and a typical sampling volume of approximately 0.5 L.
The main limitation of the previously presented samplers lies in the restricted volume capacity and the limited number of samples that are collected per mission. Most existing prototypes allow for the collection of only one to three samples, with individual volumes ranging from 20 mL to 1750 mL. These quantities are often insufficient to perform all of the required physico-chemical, microbiological or environmental DNA (eDNA) analyses that are necessary for a comprehensive assessment of the studied waterbody. Table 2 is adapted from [16,24], and summarizes the recommended volumes required for different types of analyses.
Table 2.
Recommended sample volumes for different types of analyses.
As summarized in Table 2, the volumes that are recommended for physico-chemical, microbiological and eDNA analyses often exceed the capacity of existing UAV-based samplers, particularly when duplicate samples or multiple analytical suites are required. This gap further motivates the need for systems that can collect larger integrated volumes and distribute water across several containers within a single mission. Therefore, addressing these volume limitations requires considering not only the total sampling capacity, but also the number of samples that can be collected within a single mission. Both factors play a crucial role in water sampling strategies. A higher capacity not only allows for compliance with multiple analytical protocols, but also enables duplicate sampling, thereby enhancing the reliability and statistical robustness of the results. Moreover, broadening the sampling scope is essential to capture the spatial and temporal variability of the physical, chemical, and biological characteristics of a waterbody. Increasing the number of samples also allows for the collection of composite samples from both surface and at depth within a single mission, ensuring comprehensive vertical and horizontal coverage of the study site. This integrated approach improves the capacity to detect potential gradients and variations throughout the water column and across different sampling points.
Wu et al. [25] developed an autonomous UAV-based water sampling system that was capable of collecting five surface samples of 500 mL each per mission. While their design offers improved automation and positioning and increases the collected volume compared to earlier UAV-based samplers, it remains limited in terms of sampling depth. The system only collects near-surface water (40–50 cm), which makes it unsuitable for studies that require depth-resolved or subsurface sampling.
As summarized in Table 3, existing UAV-based water sampling systems generally lack the ability to simultaneously adjust sampling depth and collected volume, while supporting more than a few samples per mission. None of the reported designs provides combined control over depth, volume, and composite sampling on a multi-bottle payload, which limits their use for protocol-driven sampling strategies that require both depth-resolved and integrated samples.
Table 3.
Comparison of UAV-based water sampling systems.
Overall, existing UAV-based water sampling systems have successfully demonstrated the feasibility of aerial water collection and have proven suitable for a range of monitoring applications [21,22,23,25]. Nevertheless, most reported solutions remain limited in terms of sampling volume capacity, depth flexibility, and number of samples per mission. Fixed-volume containers and predefined sampling depths restrict the implementation of composite or mission-specific sampling protocols, particularly when large integrated volumes are required. These limitations highlight the need for a more versatile UAV-assisted sampling system capable of user-configurable sampling depth and volume, enabling both discrete and composite sampling strategies within a single mission. The system proposed in this work is designed specifically to address these challenges.
3. System Design and Sampling Strategy
3.1. Design Objectives and System Requirements
Based on the limitations that were identified in existing UAV-based water sampling systems (Section 2 and Table 3), the design of the proposed system was guided by three primary objectives:
- (i)
- Enabling user-configurable sampling volume;
- (ii)
- Enabling user-configurable sampling depth;
- (iii)
- Supporting composite sampling protocols within a single UAV mission.
Additional constraints included compatibility with UAV payload limitations, minimization of electrical power consumption, prevention of cross-contamination between samples, and safe operation under field conditions. These requirements informed the mechanical design, electronic architecture, and control logic of the proposed sampling system.
3.2. System Architecture Overview
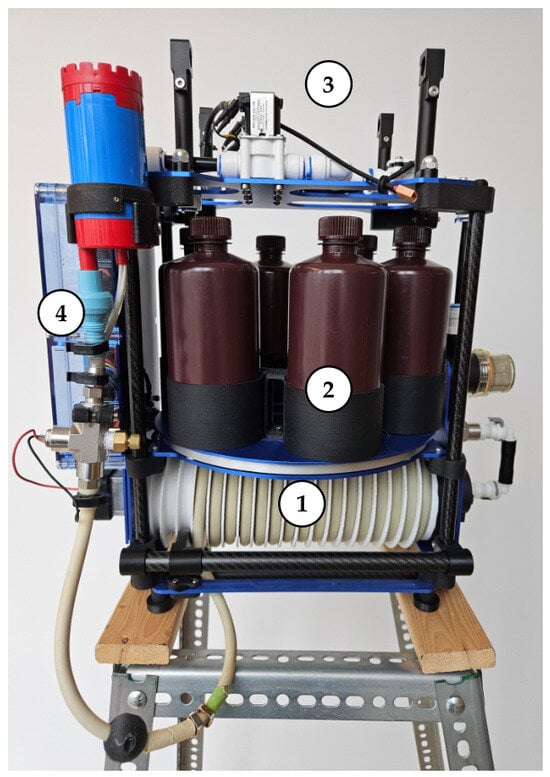
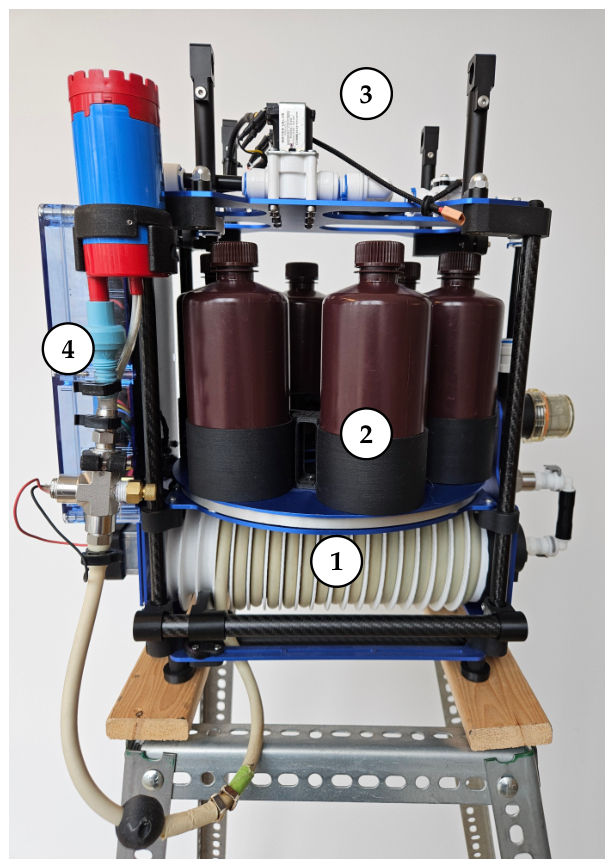
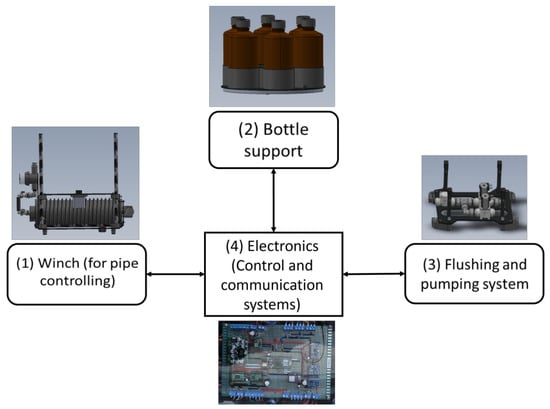
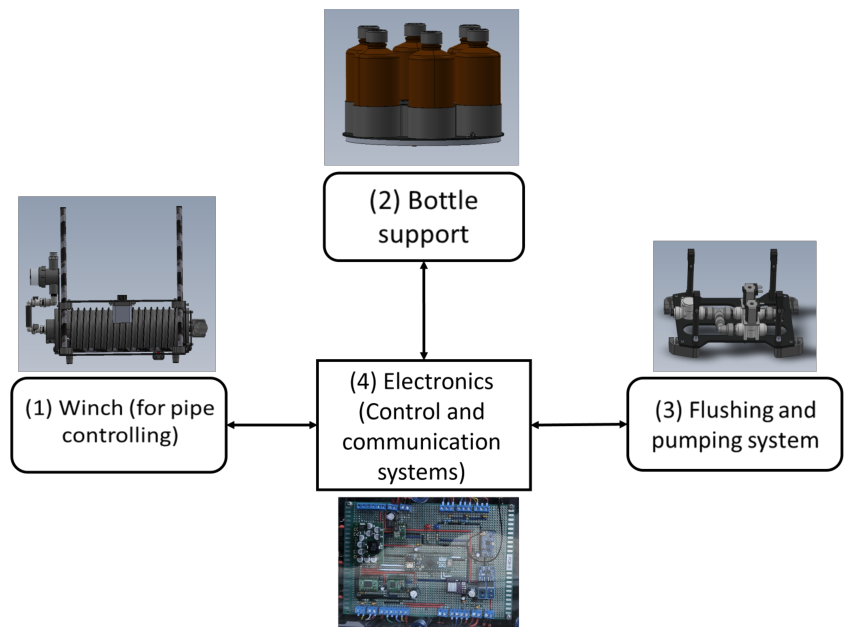
The proposed UAV-assisted water sampling system that is presented in Figure 2 is designed as a modular payload that integrates mechanical, electronic, and control subsystems to enable user-configurable sampling depth and sampling volume, while remaining compatible with UAV payload and power constraints.
Figure 2.
UAV-assisted water sampling system: (1) Winch; (2) Bottle support; (3) Pumping and flushing system; (4) Electronics (control and communication system).
3.2.1. Overall System Architecture
The system consists of two main subsystems:
- (i)
- The UAV-mounted sampling payload, which performs the physical sampling operations, including hose deployment/retraction, pumping, flushing, and bottle selection and filling.
- (ii)
- The ground control station, which allows the operator to configure sampling parameters, initiate sampling actions, and monitor system status in real time.
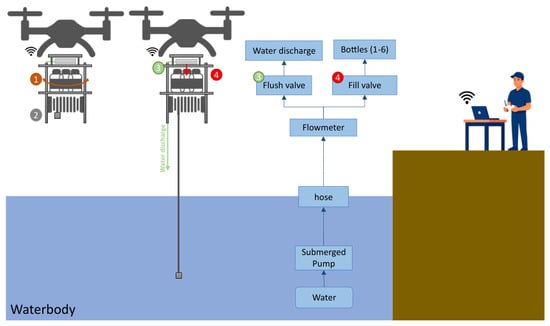
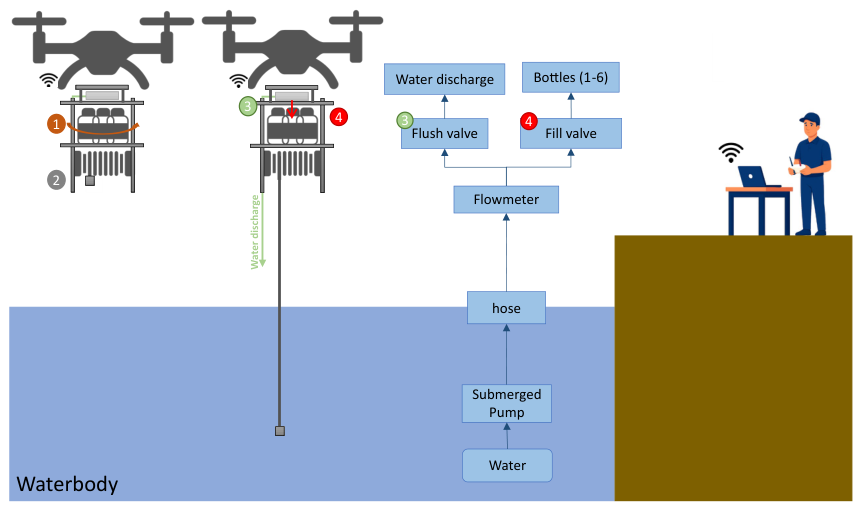
These two subsystems communicate wirelessly, enabling command transmission and feedback during sampling operations. Figure 3 shows the overall system architecture and operating principle. As it is illustrated, the sampling sequence begins with the rotation of the platform to align the selected bottle with the sampling outlet (1), followed by the deployment of the hose to reach the target depth (2). Then, water is drawn from the waterbody using the submerged pump and transported through the hose to the UAV plateform. The flow is measured by a flowmeter and then directed either to a flushing valve for system cleaning (3) or to fill valve for sample collection (4). The flushing water is discharged back into the environment, while the collected samples are directed into one of the selected bottles.
Figure 3.
The overall system architecture and operating principle. Blue arrows indicate water flow. Numbered labels identify the main automated functions: (1) bottle-positioning mechanism, (2) hose deployment and retrieval system, (3) flushing operation, and (4) bottle-filling operation.
The sampling payload is mechanically mounted beneath the UAV and is powered directly from the UAV’s regulated 18 V output, ensuring stable operation without the need for additional onboard batteries.
3.2.2. Mechanical Architecture
The mechanical architecture is designed to support depth-resolved and composite sampling while maintaining stability during flight. The main mechanical components include:
- A motorized winch system, which is responsible for deploying and retrieving the sampling hose. Since the system controls the length of hose that is released, it enables user-defined sampling depths while the UAV remains in a stable hover. Although the sampling hose has a total length of 4.5 m, a portion of the hose is intentionally kept wound on the winch to limit mechanical stress and prevent potential damage to the pump and sampling inlet. Combined with the minimum hovering altitude of approximately 1 m above the water surface that is required for safe flight operations, this design choice results in a maximum effective sampling depth of 3.25 m [8,9].
- A sampling hose is connected to an electrically driven submersible pump, allowing active water intake at the selected depth. The selection of the pump was guided not only by its hydraulic performance and electrical requirements, but also by its mass. When submerged, the pump weight contributes to maintaining the sampling hose under tension, which promotes the penetration of the sampling inlet into the water column and improves depth positioning stability.
- A rotating bottle support, which positions one of six sampling containers beneath the outlet for filling.
- A flushing system, used to clean the hose and pump between sampling operations to prevent cross-contamination.
Most structural components were custom-designed and fabricated using 3D printing in PETG thermoplastic, allowing rapid iteration and precise adaptation to UAV payload constraints. PETG was selected for its good mechanical strength and moisture resistance. The total mass of the sampling system is 5.9 kg, including the pump, hose, winch mechanism, electronics, and bottle support structure, with empty bottles.
3.2.3. Electronic Control Architecture
The sampling payload is controlled by an Arduino Micro microcontroller [26], which serves as the central control unit. As shown in Figure 4, it coordinates all sampling operations, including:
Figure 4.
Thesampling system architecture and its four principal subsystems.
- Winch actuation for hose deployment and retraction (sampling depth control);
- Pump activation for water intake and flushing;
- Bottle positioning and filling;
- Sensor acquisition and safety monitoring;
- Wireless communication with the ground station.
A flowmeter, based on a flow sensor, is integrated into the hydraulic circuit to measure the volume of water that is transferred during sampling. This device operates in the range of 0.3–10 L/min and provides pulse-based output proportional to the flow rate. The collected volume is estimated by integrating the measured flow rate over time, with a specified accuracy of %. The flowmeter enables active volume control, allowing the system to stop pumping once the target volume has been collected for each container. The same sensing principle is used to regulate the flushing volume that is applied between successive samples.
To ensure operational safety and reliability, limit sensors and protective logic are implemented to detect abnormal conditions such as end-of-travel events, excessive tension, or unexpected motor behavior.
3.2.4. Volume Control and Flushing Capacity Estimation
Accurate control of the flushing process is essential to limit potential cross-contamination between samples. The required flushing volume is estimated based on the geometric characteristics of the sampling hose and the applied cleaning protocol. The flushing volume is computed as shown in Equation (1):
where V is the flushing volume in milliliters (mL), r and L are respectively the radius and length of the hose in centimeters (cm), and S is a safety coefficient that was introduced to ensure full internal volume replacement. The value of S can be adjusted depending upon the expected nature of contaminants and the sampling objective.
This formulation allows the flushing process to be systematically adapted to different hose configurations and sampling requirements.
3.2.5. Architectural Support for Composite Sampling
The combination of depth control, flowmeter-based volume regulation, and multi-container storage enables the implementation of composite sampling protocols. Water collected from multiple depths or locations can be sequentially routed into the same container, or distributed across different containers according to the operator-defined sampling strategy.
This architecture provides a level of flexibility that is not available in most existing UAV-based sampling systems relying on fixed containers or passive filling mechanisms.
Building on this architecture, the following section details the sampling strategy and control logic that enable configurable depth, configurable volume, and composite sampling within a single UAV mission.
3.3. Sampling Strategy and Customizability
The sampling strategy that is implemented in the proposed system is designed to provide a high degree of flexibility, allowing operators to define sampling depth, sampling volume, and sampling sequence according to mission-specific requirements. This flexibility directly addresses the limitations of existing UAV-based water sampling systems, which typically rely on fixed sampling parameters.
3.3.1. Configurable Depth–Volume Control
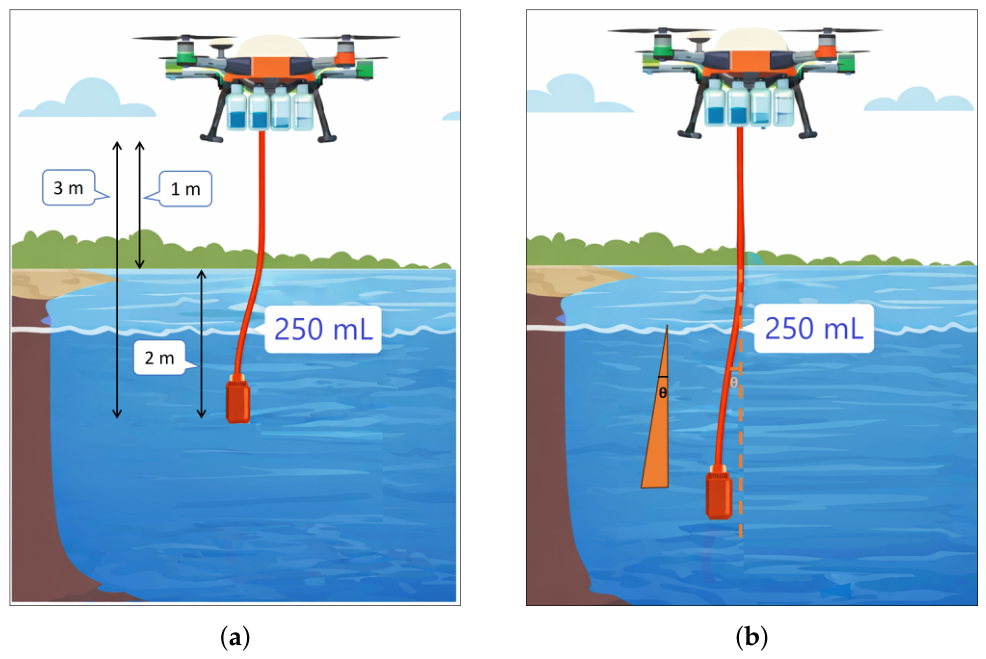
The proposed system provides an integrated control framework that enables user-configurable sampling depth, sampling volume, and composite sampling within a single UAV mission. Sampling depth is regulated through the motorized winch, which adjusts the length of the hose that is deployed below the UAV, allowing water to be collected at specific locations within the water column without modifying the mechanical structure (Figure 5).
Figure 5.
Illustration of configurable depth sampling. (a) Sampling depth estimation; (b) Potential hose deviation due to water currents.
The sampling depth is estimated as the difference between the deployed hose length and the UAV hovering height above the water surface as it is shown in Figure 5a. The UAV maintains a stable hovering position during operation; however, water currents may induce a deviation of the hose from the vertical (angle ), leading to a small difference between the estimated and actual sampling depth (Figure 5b). This effect is considered a source of uncertainty and was not quantified in the present study. Under the calm conditions encountered during testing, its impact was assumed to remain limited; however, additional experiments under controlled flow conditions are required to quantify its influence on depth estimation accuracy.
The integration of volume configuration capability, a multi-bottle architecture, and depth control enables flexible sampling with precise volume regulation. Samples collected at different depths can be sequentially routed into a single container or distributed across multiple containers, supporting discrete, composite, or hybrid sampling strategies.
3.3.2. Modular Task-Based Implementation
To support this flexibility, the sampling process is implemented as a set of independent, modular tasks, such as hose deployment, pumping, flushing, and hose retraction. Each task can be executed individually or combined with others to form a complete sampling cycle.
This task-based architecture allows sampling protocols to be customized through parameter selection rather than firmware modification, which facilitates rapid adaptation to new field campaigns and analytical requirements. As a result, new sampling strategies can be implemented without altering the underlying software structure, improving usability and adaptability for different field applications.
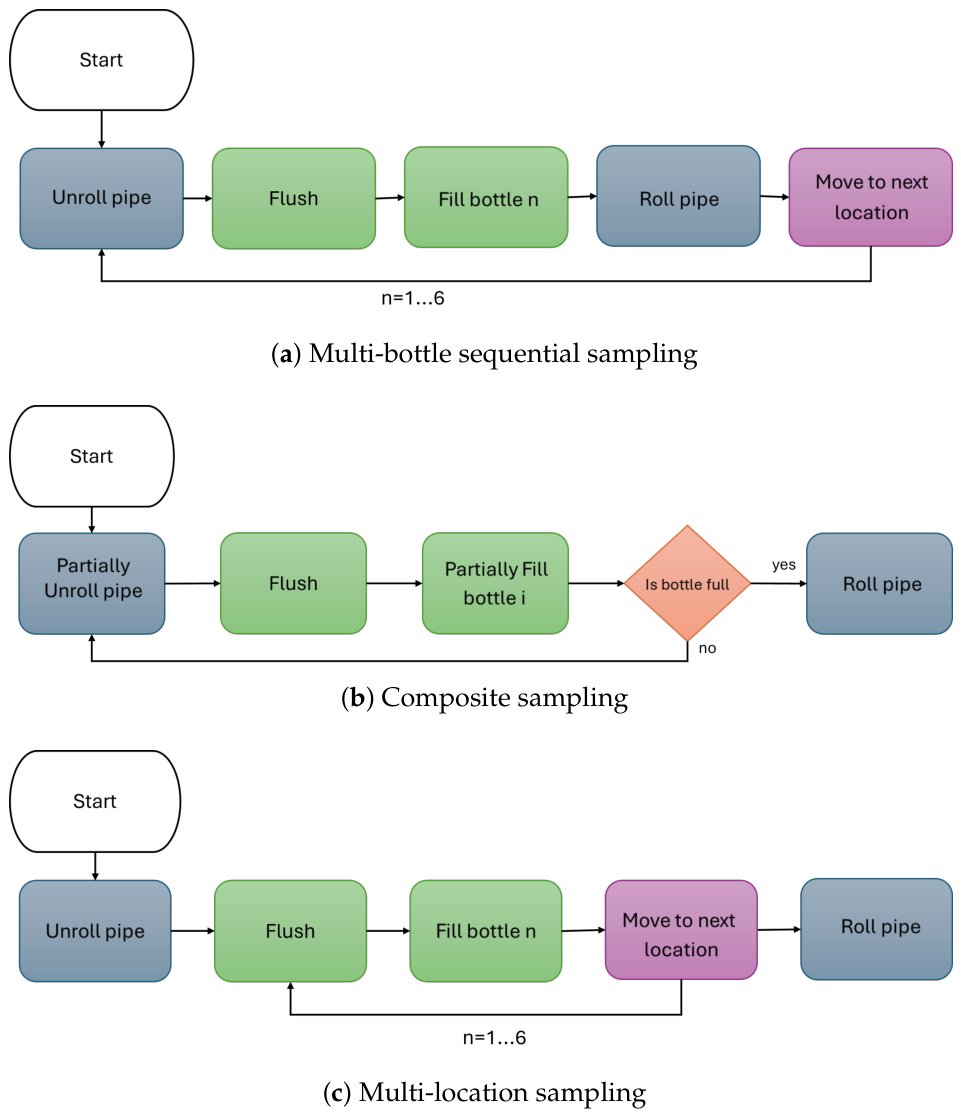
Figure 6 presents three representative examples of possible workflows; additional protocols can be defined by recombining the same task primitives according to the user’s sampling strategy.
Figure 6.
Example sampling workflows constructed using the modular task-based control architecture. Colors identify task categories: blue denotes winch operations, green pumping operations, purple UAV movements, and orange decision steps.
3.3.3. Sampling Cycle Overview
A typical sampling cycle begins with the deployment of the hose to the target depth, followed by a flushing operation to clean the hydraulic circuit. The pump is then activated to collect the target volume into the selected container. After filling, the hose is retrieved, and the system prepares for the next sampling operation.
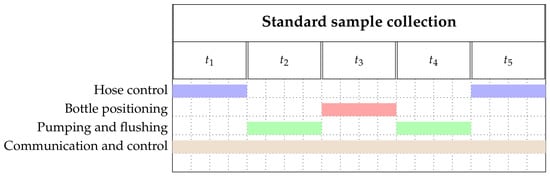
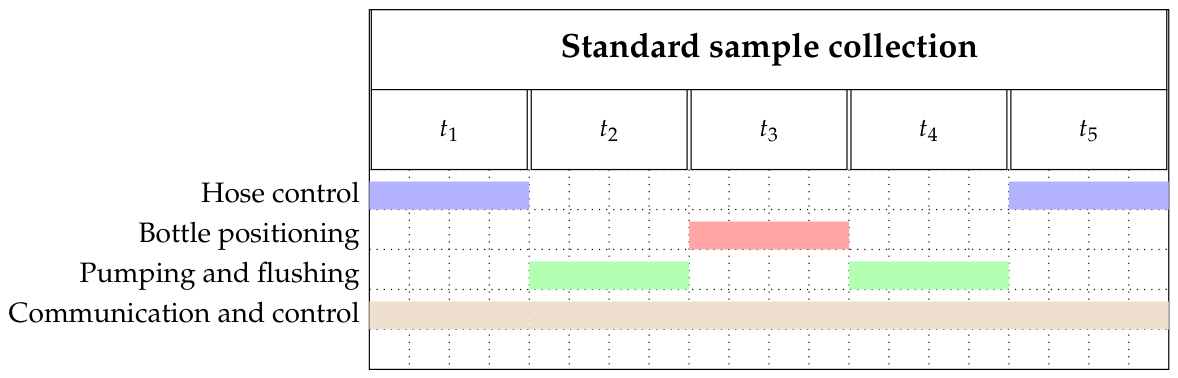
The task durations, denoted as , and the overlap of these actions are illustrated in the Gantt diagram [27] presented in Figure 7; this notation is used throughout the remainder of the paper. This diagram highlights the coordination between mechanical actuation, pumping operations, and control tasks during a single sampling cycle. The values of associated with each task in the Gantt diagram are experimentally measured and reported in the Results Section.
Figure 7.
Gantt diagram of a single sampling cycle illustrating the sequencing of depth control, pumping, flushing, and communication tasks. Colors identify the active subsystem during each task: blue (hose control), red (bottle positioning), green (pumping and flushing), and brown (communication and control).
The flexibility provided by this sampling strategy introduces the need for careful contamination control and stable system operation, which are supported by the cleaning protocol described in the following section.
3.4. Contamination Prevention and Cleaning Protocol
To prevent cross-contamination between successive samples, the system integrates an automated flushing routine that is executed before each sampling action. Residual water inside the hose and pump is removed by pumping a predefined flushing volume (Equation (1)). The flushing operation is implemented as an independent task within the modular control architecture, enabling seamless insertion between sampling actions, regardless of the selected depth or volume configuration. Although this flushing routine increases the energy cost per cycle, it is essential to maintain sample integrity, especially when a single container is used to accumulate contributions from multiple depths or locations.
3.5. User Interface and Mission Control
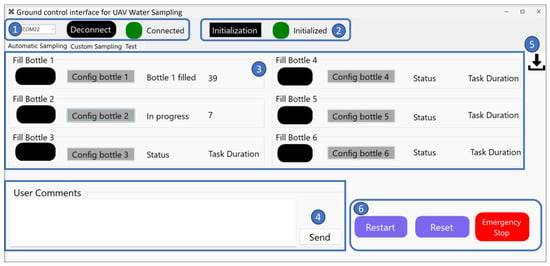
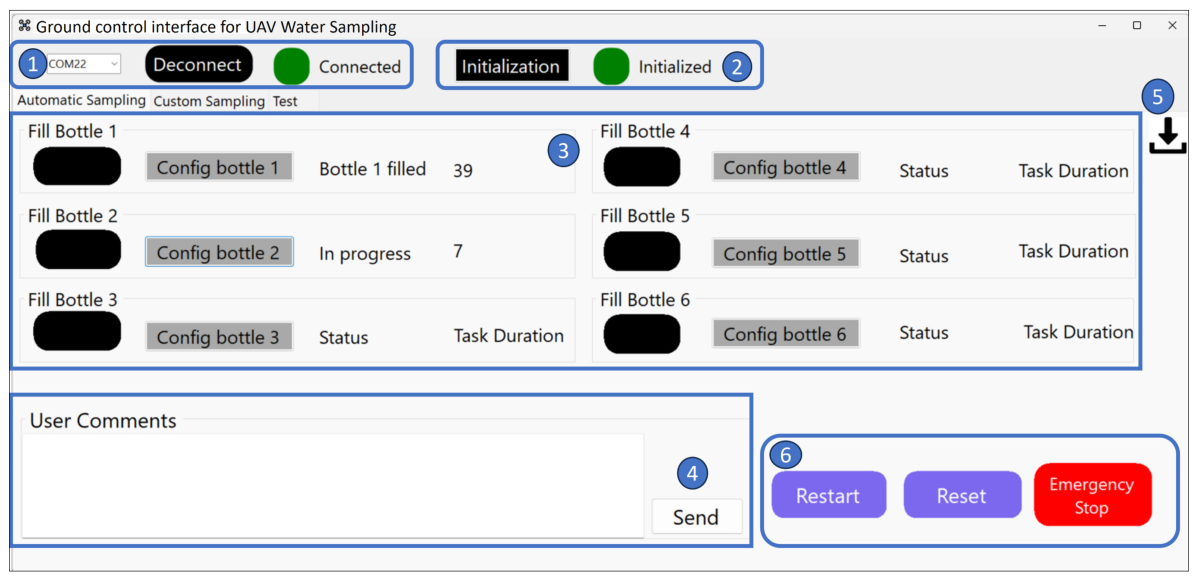
The user interface and mission control subsystem provides the operational link between the operator and the UAV-mounted sampling payload (Figure 8). Its primary role is to enable configuration, execution, and monitoring of sampling operations while ensuring safe system behavior during flight.
Figure 8.
Sampling system user interface showing the complete mission plan: (1) Sampler link status; (2) system initialization status; (3) bottle configuration and sampling operation monitoring; (4) user comments; (5) report download; (6) safety control.
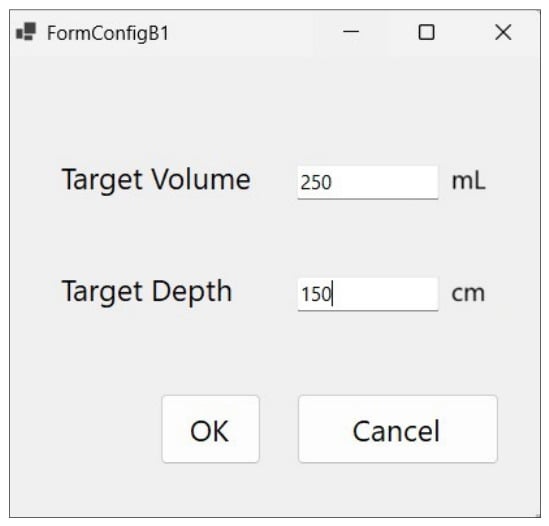
Sampling configuration is performed prior to the mission through a dedicated configBottle function (Figure 8), which allows the operator to assign a target depth and target volume to each bottle via a graphical input window (Figure 9). Each bottle is individually numbered, enabling a clear correspondence between pre-defined sampling locations and the associated containers.
Figure 9.
Volume and depth configuration for each bottle.
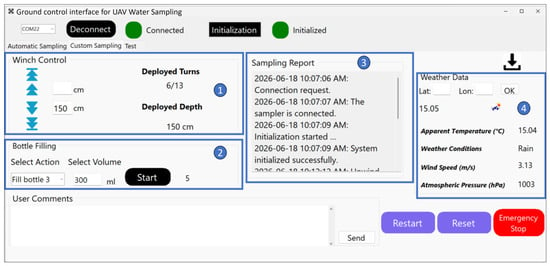
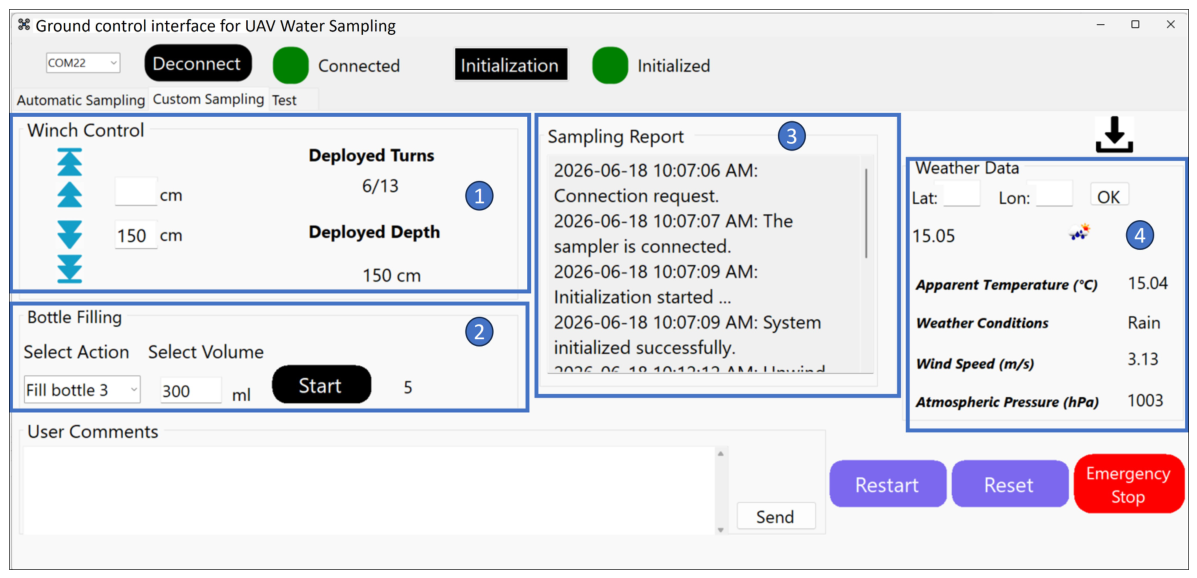
As illustrated in Figure 10, the user interface also supports composite sampling protocols, enabling the customization of the sampling sequence according to the mission requirements. In addition to configuring sampling depth and volume, the operator can define the order of operations, such as performing multiple flushing cycles before filling a bottle or deploying the hose once for several consecutive sampling points before retracting it.
Figure 10.
Sampling system user interface showing the customized and modular mission plan: (1) Volume and depth configuration, (2) Action selection, (3) Operation Summary, (4) Real-time weather data.
3.5.1. Mission Configuration and Parameter Definition
During the flight, the operator defines mission parameters through the user interface according to the predefined sampling protocol, which includes the target sampling depths, target sample volumes, container selection, and sampling sequence. These parameters can be specified for individual sampling actions (Figure 10) or grouped to form a complete mission plan (Figure 8).
This configuration flexibility allows operators to tailor the sampling strategy to specific scientific objectives, such as collecting discrete samples at selected depths or constructing composite samples by combining multiple depth-resolved contributions within a single container. Once defined, the parameters are transmitted to the sampling payload and stored locally, allowing autonomous execution during flight.
3.5.2. Real-Time Monitoring and Safety Control
The user interface provides real-time feedback on the system status, including hose deployment, container selection, and sampling progress. This allows the operator to continuously monitor mission execution and verify that each sampling step is performed as intended. The interface also enables on-demand control actions, such as an emergency stop, which can be triggered at any time to immediately halt operations and return the system to a safe state.
In addition, autonomous fail-safe routines monitor abnormal operating conditions such as excessive winch tension and end-of-travel events. When such conditions are detected, the system automatically stops the current operation to reduce mechanical stress and prevent potential flight instability.
The main operational challenges identified for this system are related to the hose deployment and the submerged pump. Winch control may be affected by environmental disturbances such as wind or UAV-induced vibrations, potentially leading to improper hose winding or failure to detect end-of-travel limits.
Another potential hazard is the pump becoming obstructed during operation. In the current system configuration, a dedicated release mechanism is not yet implemented. To mitigate these risks, sampling locations are carefully selected to avoid underwater obstacles, and operations are conducted under favorable environmental conditions, including low current velocity.
3.6. Communication and System Integration
The communication link is implemented using two HC-12 transceivers (HiLetgo, Shenzhen, China), with an Arduino Nano [28] at the ground station and an Arduino Micro that is embedded in the UAV payload. The Nano sends mission commands, while the Micro receives them and returns system feedback through a command–feedback loop. This link operates independently of the flight controller and enables transmission of mission parameters, sampling commands, and emergency-stop signals, while the payload returns status updates and task acknowledgements in real time.
3.7. Effect of Payload Power Consumption on UAV Endurance
The water sampler is directly powered through the UAV’s regulated output. Because both payload mass and electrical consumption influence flight endurance, the sampling system was designed and programmed with the objective of minimizing operation time and overall power demand.
Since the proposed sampling strategy relies on multiple active subsystems operating sequentially during a sampling cycle, including winch actuation, pumping, flushing, and communication, it is essential to quantify the effects of payload power consumption on UAV flight endurance. This analysis evaluates the electrical power demand that is associated with each task of the sampling cycle and estimates the resulting effect on mission duration. To quantify how the sampling payload affects UAV endurance, we evaluated the electrical power consumption of each subsystem during a complete sampling cycle. Each subsystem draws a specific current and operates during different phases of the cycle, as shown in the Gantt diagram (Figure 7). The measured current values are presented in the Results section. For each phase, the instantaneous electrical load was computed as
where U = 18 V corresponds to the regulated output voltage supplied by the UAV, is the instantaneous current drawn by the considered phase expressed in amperes (A) and is the corresponding instantaneous electrical power expressend in watts (W).
The average power consumption is computed as the time-weighted sum of the power associated with each task of the sampling cycle, as shown in Equation (3).
where:
- = average electrical power of the phase k;
- = duration of phase k;
- N = total number of phases.
The total energy consumption required for a complete sampling cycle () was computed as:
where is the total energy consumption per sampling cycle expressed in watt-hours (Wh). The factor 3600 converts time from seconds to hours.
This task-based power analysis provides a quantitative basis for evaluating the impact of the sampling payload on UAV endurance. The experimental results presented in Section 4 validate these estimates under real operating conditions.
4. Results and Discussion
4.1. Field Experiment Validation
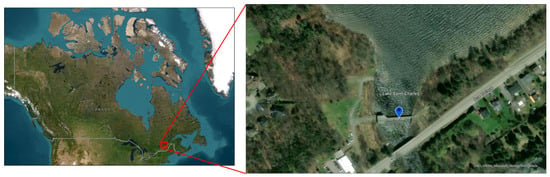
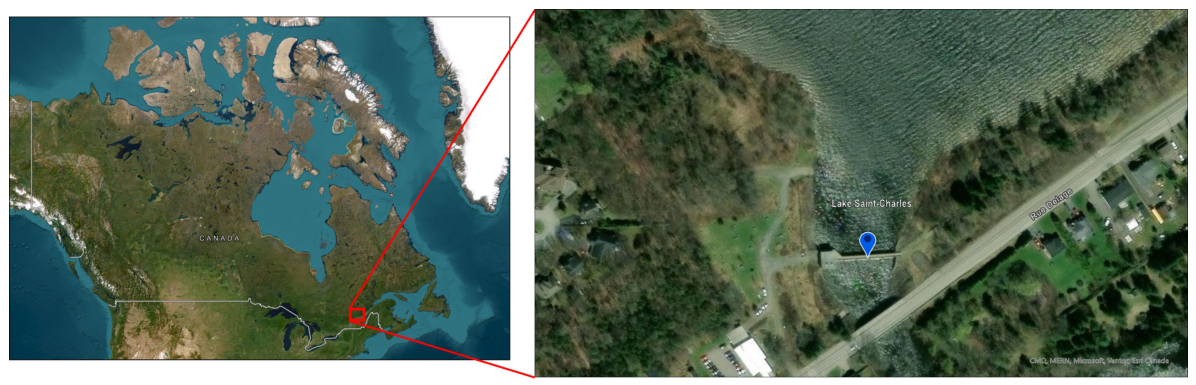
The field experiment was conducted at Lake Saint-Charles, Quebec, Canada, near the drinking water intake structure as shown in Figure 11. For these initial field tests, the sampling location was deliberately selected to ensure calm and shallow water conditions, with no obstacles that could interfere with the pump operation.
Figure 11.
Location of the field experiment at Lake Saint-Charles, Quebec, Canada. Map created by the authors using ArcGIS (ArcGIS Pro. 3.5.0, ESRI Inc., Redlands, CA, USA, 2025) Basemap: © Esri, Maxar, Earthstar Geographics, and the GIS User Community.
On the day of the experiment, weather conditions were favorable, with clear skies and low wind speeds, ensuring stable UAV operation. These conditions ensured safe operation and minimized hose deviation. A video demonstrating the UAV sampling mission is available in the Supplementary Materials.
During these validation tests, the sampling location was selected in close proximity to the take-off point in order to minimize transit time and maximize the number of achievable sampling sequences within a single flight. The experiments were conducted using two sample bottles, each collecting approximately 100 mL of water, resulting in a total collected volume of approximately 200 mL. The empty sampling system had a measured mass of 5.9 kg, and the collected water increased the total payload to approximately 6.1 kg, which slightly exceeded the nominal payload capacity of the DJI Matrice 600. Since the objective of these experiments was to demonstrate the feasibility of the UAV-based sampling approach rather than to assess UAV performance under maximum payload conditions, the flights were performed over short distances near the take-off location. Further investigations using a higher-payload UAV platform will be conducted to evaluate system performance under increased payload conditions and to quantify the effects of hydrodynamic loading during sampling.
Under these conditions, the UAV achieved an approximate flight endurance of 12 min, which was sufficient to perform several sampling sequences near the take-off location. However, this duration should be considered indicative, as it reflects favorable operating conditions and does not represent worst-case mission scenarios involving longer transit distances or full payload capacity. These aspects should therefore be taken into account when estimating the number of achievable sampling cycles under operational conditions.
4.2. Error Metrics and Statistical Analysis
To evaluate the performance of the proposed sampling system, several statistical indicators were used, including relative error, standard deviation, confidence interval, and relative dispersion.
The relative error for each individual measurement is defined as:
where is the measured value for the i-th repetition, and is the target value. The reported relative error corresponds to the mean of these individual errors:
The standard deviation () is used to quantify the variability of the measurements:
where is the mean of the measured values.
Finally, the relative dispersion is used to normalize the variability with respect to the mean value:
4.3. Depth Control Performance and Repeatability
This experiment evaluates the performance and repeatability of the winch-based depth control mechanism that was implemented in the proposed sampling system. For a set of predefined target depths, the effective position of the sampling inlet was measured and compared with the target values across repeated measurements (see Table 4 for the number of repetitions for each depth).
Table 4.
Depth control performance based on target and measured depths. The column “Number of repetitions” indicates the number of repeated measurements performed for each target value. The measured values correspond to the average of these repetitions.
All experiments were conducted under controlled laboratory conditions, using identical system configuration and command parameters, with the sampler maintained in a fixed position.
The depth control error was quantified using the relative percentage error, defined in the Section 4.2. It is important to note that the depth control is based on a discrete mechanism defined by the number of winch rotations and a fixed cable length per turn (30 cm). As a result, the achievable depths are quantized, and no variability is observed under identical operating conditions. Consequently, statistical indicators such as standard deviation and confidence intervals are not applicable in this case, and the system performance is assessed solely through the relative error defined in Equation (5).
The results indicate that the system reaches the target depths with small and bounded deviations, demonstrating consistent deployment behavior. The observed error primarily results from the discretization of the control mechanism rather than stochastic variations. This level of control is sufficient to support depth-resolved and composite sampling protocols, where accurate and consistent depth positioning is required.
4.4. Performance and Repeatability of the Sampling Volume Control
The objective of this experiment is to evaluate the performance and repeatability of the flowmeter-based volume regulation that was implemented in the proposed system.
For each test, a target sampling volume was defined through the user interface. The collected volume was measured by weighing the filled bottle using a calibrated electronic scale with a resolution of 1 g, and subtracting the mass of the empty container. The sampling and volume measurement process was repeated multiple times for each target volume, with the number of repetitions varying depending on the experiment. All experiments were conducted under controlled laboratory conditions using identical system configuration and command parameters.
Table 5 summarizes the results obtained for target volumes between 200 mL and 500 mL.
Table 5.
Volume control performance and repeatability based on target and measured sample volumes. The column “Number of repetitions” indicates the number of repeated measurements performed for each target value. The measured values correspond to the average of these repetitions.
Overall, the experimental results indicate that the proposed sampling system provides consistent control of the collected volume across the tested range. The relative error values, calculated using Equation (6), reveal a small but systematic bias that varies with the target volume, with slight underfilling observed at 300 mL and moderate overfilling at higher volumes. While the bias remains limited for most tested volumes (generally within ±3%), larger deviations were observed for some intermediate volumes, notably at 350 mL and 400 mL. Nevertheless, the achieved accuracy remains suitable for environmental sampling applications.
The variability of the system, quantified by the standard deviation (Equation (7)) and relative dispersion (Equation (8)), remained relatively stable across all tested volumes. Standard deviation values range from 6 mL to 20 mL, while the relative dispersion remains between approximately 3% and 4%. These results indicate a satisfactory level of repeatability and suggest that the sampling process is not strongly affected by random variations under the tested conditions.
4.5. Execution Time and Sampling Cycle Duration
This experiment evaluates the execution time of the individual tasks that compose a sampling cycle, in order to asses the predictability (i.e., consistency of execution time) and repeatability of the task-based sampling strategy described in Section 3.3. Each task was executed repeatedly under controlled laboratory conditions, using identical system configuration and command parameters. The duration of each task was measured from command initiation to task completion acknowledgement. The number of repetitions per task ranged from 20 to 60 depending on the operation.
The results are summarized in Table 6. It is indicated that the complete sampling cycle requires approximately 80 s on average. This predictable temporal footprint is essential for mission planning, as it enables an estimate of the number of achievable sampling cycles within a given UAV flight window. The deployment and retraction of the sampling hose both exhibited mean duration of approximately 22 s, with low variability across repetitions, reflecting the fixed motor speed and constant deployment length used during the tests. The bottle-positioning operation showed a duration ranging from 4 to 8 s, which is explained by the dependence of the movement time on the angular distance between the current and target bottle positions; shorter transitions occur when the next container is adjacent, while longer transitions correspond to larger index steps on the rotating platform.
Table 6.
Execution time of sampling tasks. The table reports the number of test repetitions and the mean duration of each task within a sampling cycle.
The pumping and flushing operations for a 500 mL transfer each required a mean duration of 15 s, indicating consistent transfer times across repeated measurements for a given target volume. These values are consistent with the durations assumed in the sampling-cycle model and the Gantt diagram presented in Section 3.3.3.
Overall, the results indicate that the main sampling tasks exhibit stable and predictable execution times, which is essential for scheduling multi-step sampling sequences and estimating the impact of the payload on energy consumption and flight endurance. The measured task durations are therefore used as reference values in the endurance analysis presented in Section 4.6.
4.6. Power Consumption and Endurance Validation
The objective of this analysis is to quantify the electrical load of the sampling payload and evaluate its effect on UAV flight endurance.
4.6.1. Calculated Power per Phase and Average Cycle Power
The experimental current values (I) that are reported in Table 7 and the task durations () in Table 6 were substituted into Equations (2)–(4) to compute the phase power, phase energy, and total energy per sampling cycle. The computations use the regulated payload supply voltage of U = 18 V. All electrical measurements were conducted under controlled laboratory conditions. The sampling system was powered using a regulated DC power supply set to 18 V, and the current drawn by each subsystem (hose control, bottle positioning, pumping and flushing, and communication and control) was recorded during operation. For each task, the peak current value displayed by the power supply was noted and used in the subsequent calculations. Power and energy values were computed for each task of the sampling cycle using a time-weighted model, accounting for both the duration and the electrical load associated with each operation. The task durations were obtained from the execution-time analysis presented in Section 4.5.
Table 7.
Energy consumption per subsystem during a single sampling cycle.
The total energy required for a single sampling cycle is approximately . The corresponding time-weighted average payload power, computed using Equation (3), is .
Given that peak currents were used, these values represent a conservative (upper-bound) estimate of power consumption.
4.6.2. Effect on Drone Flight Endurance
To assess the operational feasibility of the proposed sampling system, the cycle energy that was obtained in Section 4.6.1 was compared with the battery capacities of representative multirotor platforms (Table 8). The listed UAV models cover a range of payload capabilities and onboard energy budgets, with manufacturer-reported endurance values provided only for contextual interpretation of typical mission windows.
Table 8.
Reference UAV platforms used to provide endurance context. Battery energy capacity and payload capability are reported to assess the impact of the sampling payload energy consumption on mission feasibility.
Given a sampling-cycle energy of approximately 1.6 Wh, the relative energy cost of one sampling operation corresponds to:
- ≈1.2% of the DJI M600 battery capacity (129.96 Wh);
- ≈0.33% of the Aurelia X8 capacity (488.4 Wh);
- ≈0.27% of the Aurelia X6 Pro capacity (599.4 Wh).
Even under conservative peak-current assumptions, this indicates that multiple sampling cycles can be executed within a single flight while maintaining sufficient reserves for navigation and return-to-home. The operation time per cycle (~80 s) also fits well within the manufacturer-reported endurance ranges in Table 8, confirming that the proposed sampling process is compatible with practical multirotor mission durations.
The exact number of achievable sampling cycles per mission will depend on additional factors such as payload mass, flight profile, wind conditions, and safety margins. However, the results demonstrate that the electrical load associated with pumping, flushing, and hose actuation introduces only a moderate and operationally acceptable impact on UAV endurance. Consequently, the payload’s electrical demand represents a moderate addition to the overall energy budget and does not prevent the execution of multiple depth-resolved or composite sampling cycles during a single mission.
4.7. Technical Challenges and Design Improvements
The development of the sampling system also presented several technical challenges that required iterative design and testing. One of the most critical issues concerned the integration of the pump power cable inside the sampling hose. A dedicated solution had to be designed to ensure water-tightness, hose flexibility, and mechanical protection of the cable, while avoiding premature wear caused by repeated deployment and retraction cycles. Multiple hose materials were evaluated experimentally to balance two competing constraints: sufficient flexibility for coiling and guidance, and limited elasticity to prevent axial stretching. Excessive elasticity was found to induce additional tension on the internal power cable, increasing the risk of fatigue and eventual breakage. The final selected hose provided adequate flexibility for handling while maintaining enough stiffness to protect the embedded electrical conductor. The hose is made of of flexible Tygon® tubing (A-60-F), a rubber-based polymer commonly used in food and sanitary applications, selected based on its mechanical behavior.
A second major challenge involved the winch-based deployment/retraction mechanism. During hose deployment and retraction, particularly under windy conditions or when piloting deviations occurred, the hose could twist or oscillate, generating uncontrolled motion and potential entanglement. To mitigate these effects, a guiding mechanism, passive tension-control elements, and stabilization fixtures were introduced to constrain hose motion and improve deployment/retraction regularity.
Finally, several safety mechanisms were incorporated to ensure robust operation in field conditions. These include an emergency stop function that can be triggered manually through the user interface or automatically by the control logic, as well as limit-state protection features such as end-of-travel sensing, overload detection, and abnormal-tension monitoring. Together, these measures increase operational safety and reduce the likelihood of failure during sampling operations.
5. Discussion
The experimental results indicate that the proposed UAV-assisted sampling system provides consistent and repeatable control of both sampling depth and collected volume under the tested conditions. Flowmeter-based regulation yielded relative errors generally within ±3%, with a maximum observed deviation of 5%, while the winch mechanism provided repeatable depth deployment during laboratory testing. These results suggest that the proposed architecture can support controlled and protocol-driven sampling operations requiring user-defined depth and volume settings.
When compared with existing UAV-based water sampling systems, the proposed approach addresses several limitations related to sampling controllability and capacity. Most reported systems rely on fixed-depth or surface-only sampling, with limited or no control over the sampling depth, and often collect a single sample per mission or a small number of low-volume samples. In contrast, the proposed system provides experimentally validated control over sampling depth and volume and incorporates a multi-bottle architecture designed to support the collection of multiple samples within a single mission. These features enhance operational flexibility and may support a broader range of standardized water sampling protocols.
The ability to control sampling depth is particularly important in aquatic environments where vertical stratification can strongly influence physicochemical and biological parameters. Parameters such as temperature, dissolved oxygen, and nutrient concentrations can vary significantly with depth, especially in stratified water bodies. Consequently, depth-resolved sampling is often required to obtain representative and scientifically meaningful data.
Similarly, the capacity to collect larger sample volumes and distribute water across multiple containers represents a valuable capability. As highlighted in Table 2, comprehensive water-quality assessments may involve numerous physicochemical parameters, each requiring sample volumes typically ranging from 100 to 1000 mL. Consequently, the total volume required for a complete analysis can be substantial, particularly when multiple analytical techniques are combined. In addition, emerging methods such as environmental DNA (eDNA) analysis often require large sample volumes to ensure adequate detection sensitivity. The ability to collect larger volumes also facilitates duplicate or replicate sampling, which can improve data reliability and support standard monitoring practices. In this context, the proposed system extends the sampling capabilities of many existing UAV-based solutions that are typically limited to small-volume or single-sample collection.
A direct comparison of energy consumption with existing UAV-based water sampling systems remains challenging, as energy-use data are rarely reported in the literature, particularly for systems employing active components such as pumps or winch mechanisms. In many previously reported designs, sampling is achieved using passive mechanisms requiring little or no onboard power. In contrast, the proposed system relies on active pumping, hose deployment, and automated flushing processes, which inherently increase energy demand.
The task-based analysis performed in this study provided an initial characterization of the electrical demand associated with these operations. The measured energy consumption per sampling cycle represented a limited contribution to the onboard energy capacity of the heavy-payload UAV platforms considered in this study. These results provide useful information for mission planning and platform selection. However, additional endurance testing under varying payload and mission conditions would be required to fully assess operational performance and energy utilization in real-world deployments.
In addition, the field experiments, although conducted under controlled and limited conditions, provide an initial validation of the system’s operation in a realistic environment. The system demonstrated stable flight behavior and consistent sampling performance under the tested conditions. However, these tests were conducted under calm environmental conditions and were not intended to evaluate the influence of water currents on sampling depth estimation.
While the depth-control performance was experimentally validated under controlled laboratory conditions, flow-induced hose deviation may affect the actual sampling depth in environments with significant currents. Consequently, additional testing under controlled flow conditions is required to quantify this effect and define the operational limits of the proposed depth-control approach. More extensive field testing under varying environmental conditions would also be required to assess system robustness and generalizability.
Several limitations of the current study should be acknowledged. First, the maximum demonstrated sampling depth of 3.25 m restricts applicability in deep-water environments, where alternative techniques may be more appropriate. Second, the total payload mass of approximately 5.9 kg limits deployment to UAV platforms with sufficient lifting capacity. In addition, hose stability may be affected by environmental disturbances such as wind or water currents, particularly at greater depths. Such disturbances may also influence the accuracy of the depth-estimation method, which assumes a nearly vertical hose configuration.
The payload capacity of the UAV platform represents another important operational constraint. The field experiments were intended as an initial operational validation of the sampling system and were not designed to evaluate performance under full-capacity payload conditions. During the field tests, two bottles were filled with approximately 100 mL of water each, corresponding to a total collected volume of approximately 200 mL. Additional flight tests using higher-capacity UAV platforms, such as the Aurelia X8, are planned to better assess system performance under increased payload conditions and closer-to-full-capacity deployments.
These limitations highlight opportunities for future developments. Future work will focus on further improving the safety, reliability, and operational flexibility of the proposed system. First, the integration of a release mechanism is planned to enable safer operations by allowing rapid detachment of the sampling payload in emergency situations.
Second, additional experiments will be conducted to assess the effectiveness of the flushing process in reducing cross-contamination between samples. These tests will be carried out in the context of environmental DNA (eDNA) analyses, for which contamination control is critical. A dedicated protocol for evaluating cross-contamination is currently under development and awaiting validation.
Further developments will aim to reduce the overall mass of the sampling system in order to improve compatibility with a broader range of UAV platforms. In parallel, efforts will focus on extending the achievable sampling depth range to better support water sampling in deeper environments, where depth-resolved investigations are required.
Finally, the integration of in situ sensors is planned to enable simultaneous acquisition of physicochemical parameters during sampling operations, thereby enhancing the system’s capability for comprehensive environmental monitoring.
6. Conclusions
This study presented a UAV-assisted water sampling system capable of controlling both sampling depth and collected volume within a single mission. The experimental results indicated consistent volume-control performance, with relative errors generally within ±3% and a maximum observed deviation of 5%, while maintaining repeatable depth deployment under controlled conditions.
The proposed architecture supports the collection of up to 3 L of water distributed across multiple containers, enabling the implementation of discrete, composite, and multi-point sampling strategies. Compared with many existing UAV-based sampling systems, this approach extends the flexibility of sampling operations by combining configurable depth control, configurable volume control, and a multi-bottle architecture within a single platform.
The task-based analysis showed that a complete sampling cycle can be performed in approximately 80 s, with an associated energy consumption of about 1.6 Wh per cycle, corresponding to a limited fraction of the total onboard energy capacity. These results characterize the energy demand associated with the sampling process and provide information that may support mission planning and platform selection. However, additional flight testing would be required to fully assess operational endurance under different payload and mission conditions.
Field experiments provided an initial validation of the system under realistic operating conditions and demonstrated stable operation during sampling missions. Nevertheless, these tests were conducted under controlled environmental conditions and were not intended to evaluate the effects of water currents, full-capacity payload operation, or long-endurance missions. Consequently, the operational limits of the system under more demanding conditions remain to be fully characterized.
Several limitations also remain, including the current maximum sampling depth of 3.25 m, payload constraints associated with heavy sampling systems, and the potential influence of environmental disturbances on hose stability and depth estimation. Despite these limitations, the results suggest that UAV-assisted sampling systems can evolve toward more flexible and protocol-oriented approaches, with the proposed system representing a step in this direction. The adoption of such systems will depend on their ability to operate reliably under diverse field conditions and to meet established environmental monitoring requirements. In addition, regulatory constraints related to UAV operations, including payload limits, flight authorization, and safety considerations, are expected to play a key role in their practical deployment.
Future work will focus on evaluating system performance under increased payload conditions, validating the effectiveness of the flushing protocol for contamination control in eDNA applications, reducing overall system mass, extending the achievable sampling depth range, and integrating in situ sensing technologies. These developments are expected to further enhance the applicability of UAV-assisted water sampling for environmental monitoring and research.
Supplementary Materials
Sampler test video, available at https://www.youtube.com/watch?v=6ee80uMxjnU, accessed on 15 January 2025.
Author Contributions
Conceptualization, S.M., K.C. and R.G.; Methodology, S.M., K.C. and R.G.; Software, S.M.; Validation, S.M., K.C. and R.G.; Formal analysis, S.M.; Investigation, S.M.; Resources, K.C.; Writing—original draft preparation, S.M.; Writing—review and editing, S.M., K.C. and R.G.; Visualization, S.M. and R.G.; Supervision, K.C.; Project administration, K.C.; Funding acquisition, K.C. All authors have read and agreed to the published version of the manuscript.
Funding
This research was supported by the Institut National de la Recherche Scientifique, Mitacs (IT19835) and DroneXperts Inc.
Data Availability Statement
The original contributions presented in this study are included in the article. Further inquiries can be directed to the corresponding author.
Acknowledgments
The authors acknowledge the collaboration with DroneXperts Inc. (Quebec, QC, Canada), which was conducted within a Mitacs research partnership program. DroneXperts contributed to defining UAV-related design constraints, supported the integration of the sampling system onto the drone platform, and participated in field testing and validation activities. Their engineering input and iterative feedback greatly contributed to the final implementation of the system. The authors would also like to express their gratitude to Ghassen Ibrahim for his valuable support and technical assistance in electronics and 3D printing. The authors also thank W.F.J. Parsons for assistance with the revision of the English language.
Conflicts of Interest
The authors have no conflicts of interest to declare. All co-authors have seen and agree with the contents of the manuscript and there is no financial interest to report. We certify that the submission is original work and is not under review at any other publication.
References
- Guebsi, R.; Mami, S.; Chokmani, K. Drones in precision agriculture: A comprehensive review of applications, technologies, and challenges. Drones 2024, 8, 686. [Google Scholar] [CrossRef] [Scilit]
- Beloev, I.H. A review on current and emerging application possibilities for unmanned aerial vehicles. Acta Technol. Agric. 2016, 19, 70–76. [Google Scholar] [CrossRef] [Scilit]
- De Michele, C.; Avanzi, F.; Passoni, D.; Barzaghi, R.; Pinto, L.; Dosso, P.; Ghezzi, A.; Gianatti, R.; Della Vedova, G. Using a fixed-wing UAS to map snow depth distribution: An evaluation at peak accumulation. Cryosphere 2016, 10, 511–522. [Google Scholar] [CrossRef] [Scilit]
- Barrile, V.; La Foresta, F.; Genovese, E. Optimizing Unmanned Aerial Vehicle Electronics: Advanced Charging Systems and Data Transmission Solutions. Electronics 2024, 13, 3208. [Google Scholar] [CrossRef] [Scilit]
- Lally, H.; O’Connor, I.; Jensen, O.; Graham, C. Can drones be used to conduct water sampling in aquatic environments? A review. Sci. Total Environ. 2019, 670, 569–575. [Google Scholar] [CrossRef] [Scilit] [PubMed]
- Irvine, D.J.; Singha, K.; Kurylyk, B.L.; Briggs, M.A.; Sebastian, Y.; Tait, D.R.; Helton, A.M. Groundwater-Surface water interactions research: Past trends and future directions. J. Hydrol. 2024, 644, 132061. [Google Scholar] [CrossRef] [Scilit]
- Jiang, W.; Sheng, Y. Soil–Groundwater Environmental Quality and Water Resource: Assessment of Contaminant Sources, Species, and Transformations. Water 2025, 17, 1493. [Google Scholar] [CrossRef] [Scilit]
- Koparan, C.; Koc, A.B.; Privette, C.V.; Sawyer, C.B.; Sharp, J.L. Evaluation of a UAV-assisted autonomous water sampling. Water 2018, 10, 655. [Google Scholar] [CrossRef] [Scilit]
- Zhang, R.; Wang, Z.; Li, X.; She, Z.; Wang, B. Water Quality Sampling and Multi-Parameter Monitoring System Based on Multi-Rotor UAV Implementation. Water 2023, 15, 2129. [Google Scholar] [CrossRef] [Scilit]
- Doi, H.; Akamatsu, Y.; Watanabe, Y.; Goto, M.; Inui, R.; Katano, I.; Nagano, M.; Takahara, T.; Minamoto, T. Water sampling for environmental DNA surveys by using an unmanned aerial vehicle. Limnol. Oceanogr. Methods 2017, 15, 939–944. [Google Scholar] [CrossRef] [Scilit]
- Minamoto, T.; Miya, M.; Sado, T.; Seino, S.; Doi, H.; Kondoh, M.; Nakamura, K.; Takahara, T.; Yamamoto, S.; Yamanaka, H.; et al. An illustrated manual for environmental DNA research: Water sampling guidelines and experimental protocols. Environ. DNA 2021, 3, 8–13. [Google Scholar] [CrossRef] [Scilit]
- Terada, A.; Morita, Y.; Hashimoto, T.; Mori, T.; Ohba, T.; Yaguchi, M.; Kanda, W. Water sampling using a drone at Yugama crater lake, Kusatsu-Shirane volcano, Japan. Earth Planets Space 2018, 70, 64. [Google Scholar] [CrossRef] [Scilit]
- Graham, C.; O’Connor, I.; Broderick, L.; Broderick, M.; Jensen, O.; Lally, H. Drones can reliably, accurately and with high levels of precision, collect large volume water samples and physio-chemical data from lakes. Sci. Total Environ. 2022, 824, 153875. [Google Scholar] [CrossRef] [Scilit] [PubMed]
- Horricks, R.A.; Bannister, C.; Lewis-McCrea, L.M.; Hicks, J.; Watson, K.; Reid, G.K. Comparison of drone and vessel-based collection of microbiological water samples in marine environments. Environ. Monit. Assess. 2022, 194, 439. [Google Scholar] [CrossRef] [Scilit] [PubMed]
- Lally, H.; O’Connor, I.; Broderick, L.; Broderick, M.; Jensen, O.; Graham, C. Assessing the Potential of Drones to Take Water Samples and Physiochemical Data from Open Lakes; EPA Research Report; Environmental Protection Agency: Wexford, Ireland, 2020.
- Hunter, M.E.; Ferrante, J.A.; Meigs-Friend, G.; Ulmer, A. Improving eDNA yield and inhibitor reduction through increased water volumes and multi-filter isolation techniques. Sci. Rep. 2019, 9, 5259. [Google Scholar] [CrossRef] [Scilit] [PubMed]
- Ore, J.P.; Elbaum, S.; Burgin, A.; Detweiler, C. Autonomous aerial water sampling. J. Field Robot. 2015, 32, 1095–1113. [Google Scholar] [CrossRef] [Scilit]
- Schwarzbach, M.; Laiacker, M.; Mulero-Pázmány, M.; Kondak, K. Remote water sampling using flying robots. In Proceedings of the 2014 International Conference on Unmanned Aircraft Systems (ICUAS); IEEE: New York, NY, USA, 2014; pp. 72–76. [Google Scholar] [CrossRef] [Scilit]
- Van Dorn, W. Large-volume water samplers. Eos Trans. Am. Geophys. Union 1956, 37, 682–684. [Google Scholar] [CrossRef] [Scilit]
- Castendyk, D.; Voorhis, J.; Kucera, B. A validated method for pit lake water sampling using aerial drones and sampling devices. Mine Water Environ. 2020, 39, 440–454. [Google Scholar] [CrossRef] [Scilit]
- Lariosa, I.M.G.; Pao, J.C.; Banglos, C.A.G.; Paradela, I.P.; Aleluya, E.R.M.; Salaan, C.J.O.; Premachandra, C.N. Drone-based automatic water sampling system. IEEE Access 2024, 12, 35109–35124. [Google Scholar] [CrossRef] [Scilit]
- Ryu, J.H. UAS-based real-time water quality monitoring, sampling, and visualization platform (UASWQP). HardwareX 2022, 11, e00277. [Google Scholar] [CrossRef] [Scilit] [PubMed]
- Kidder, J.A.; Grenier, A.; Harvey, B.J.; Beckett-Brown, C.E.; Mcclenaghan, M.B.; Pelchat, P.; Zhang, J.; Layton-Matthews, D.; Oliva, F. Using UAVs to collect filtered water samples for mineral exploration: Will it take off? J. Geochem. Explor. 2025, 269, 107617. [Google Scholar] [CrossRef] [Scilit]
- Centre d’Expertise en Analyse Environnementale du Québec, Canada. Protocole d’Échantillonnage—Eaux de Surface. 2021. Available online: https://www.ceaeq.gouv.qc.ca/documents/publications/echantillonnage/dr09_10eauxsurf.pdf (accessed on 14 April 2025).
- Wu, J.; Deng, W.; Huang, F.; Song, X.; Li, L.; Zhai, Z. Development of a UAV-assisted autonomous water sampling device. Discov. Appl. Sci. 2025, 7, 182. [Google Scholar] [CrossRef] [Scilit]
- Arduino. Arduino Micro. 2023. Available online: https://docs.arduino.cc/hardware/micro/ (accessed on 5 May 2026).
- Wilson, J.M. Gantt charts: A centenary appreciation. Eur. J. Oper. Res. 2003, 149, 430–437. [Google Scholar] [CrossRef] [Scilit]
- Arduino. Arduino Nano. 2023. Available online: https://docs.arduino.cc/hardware/nano/ (accessed on 5 May 2026).

Disclaimer/Publisher’s Note: The statements, opinions and data contained in all publications are solely those of the individual author(s) and contributor(s) and not of MDPI and/or the editor(s). MDPI and/or the editor(s) disclaim responsibility for any injury to people or property resulting from any ideas, methods, instructions or products referred to in the content. |
© 2026 by the authors. Licensee MDPI, Basel, Switzerland. This article is an open access article distributed under the terms and conditions of the Creative Commons Attribution (CC BY) license.