Effect of Water Drawdown and Dynamic Loads on Piled Raft: Two-Dimensional Finite Element Approach


School of Civil and Environmental Engineering, University of Technology Sydney, Broadway, NSW 2007, Australia
*
Author to whom correspondence should be addressed.
Infrastructures 2019, 4(4), 75; https://doi.org/10.3390/infrastructures4040075
Submission received: 30 June 2019
/
Revised: 25 November 2019
/
Accepted: 2 December 2019
/
Published: 7 December 2019
(This article belongs to the Special Issue Seismic Resilient Infrastructures)
Abstract
:The piled raft foundations are widely used in infrastructure built on soft soil to reduce the settlement and enhance the bearing capacity. However, these foundations pose a potential risk of failure, if dynamic traffic loading and ground conditions are not adequately accounted in the construction phase. The ground conditions are complex because of frequent groundwater fluctuations. The drawdown of the water table profoundly influences the settlement and load sharing capacity of piled raft foundation. Further, the dynamic loading can also pose a potential risk to these foundations. In this paper, the two-dimensional finite element method (FEM) is employed to analyze the impact of water drawdown and dynamic loading on the stability of piled raft. The seismic response of piled raft is also discussed. The stresses and deformations occurring in and around the raft structure are evaluated. The results demonstrate that water drawdown has a significant effect on the stability and seismic response of piled raft. Various foundation improvement methods are assessed, such as the use of geotextile and increasing thickness of the pile cap, which aids of limiting the settlement.
1. Introduction
In Australia, many infrastructure projects are located on the soft soil. Owing to high compressibility of such soils, structures are affected due to excessive differential settlement. The piled-raft foundations have become popular since its inception by Burland et al. [1] and Sawada [2]. Piled-rafts have been widely used to reduce the settlements and enhance the bearing capacity for a range of structures including tall towers, nuclear structures, and high-rise buildings [3,4,5]. Most of the load is supported by raft through contact with soil while the remaining load is transferred to piles through skin friction [6]. The load carrying by raft varies from 20 to 60%, depending upon the pile spacing and length [7,8]. Thus, piled raft foundation can lead to economical design without compromising the safety of the built infrastructure [9,10].
The level of groundwater table (GWT) and loading condition influence piled raft characteristics. Moormann [11] reported that the GWT lowering influences the settlement as well as the load sharing capacity of piled raft. They considered only static loading condition, whereas dynamic loading consideration is essential. The lowering of the GWT should be avoided to reduce the ground settlement [12,13]. You et al. [14] reported that GWT can lead to ground subsidence, affecting the stability of surrounding structures. The fluctuation in GWT results in differential settlement in surrounding soil, leading to potential damage [14,15].
Further, assessment of dynamic loading on the piled raft is a crucial aspect to ensure safety during seismic events. Seismic response of piled raft is a challenging and complex task as the transfer mechanism of lateral load is dependent on the soil type and interaction between different components such as pile, raft, and soil [15]. The inertial and kinematic forces induced by interaction in the piled raft system are crucial. Failure of the structures during major earthquakes in the past (including Kobe 1995, Chi-Chi 1999, Sumatra 2004, Hati 2010, Nepal 2015) shows the importance of assessment of dynamic loading on a piled raft foundation. Kumar et al. [16] investigated the effect of earthquake on piled raft foundation and found that response of the piled raft under dynamic loading is significantly different from the static loading condition and thus it should be considered in analysis for safety consideration. Das et al. [17] reported that the inherent variability of soil considerably affects the fundamental frequency and force of piled raft system. Zhang and Liu [18] investigated the seismic response of a structure supported by piled raft. They concluded that the peak base acceleration and flexural rigidity of pile have significant influences on the pile bending moment response. Yamashita et al. [19] investigated the seismic behavior of a piled raft foundation system supporting a high rise building in Tokyo. They found that there was a significant change in the settlement and the load sharing capacity between piles and raft before and after the earthquake.
In the past, limited studies have been performed to investigate the effect of GWT drawdown on the static and dynamic response of piled raft, and no research has been done for the combined impact of GWT and dynamic loading. It thus becomes essential to assess the stability of piled raft against dynamic loading [20,21] considering GWT, and undertake to necessary modifications so that it can withstand against higher stresses from natural disasters and possibly eliminate structural damage.
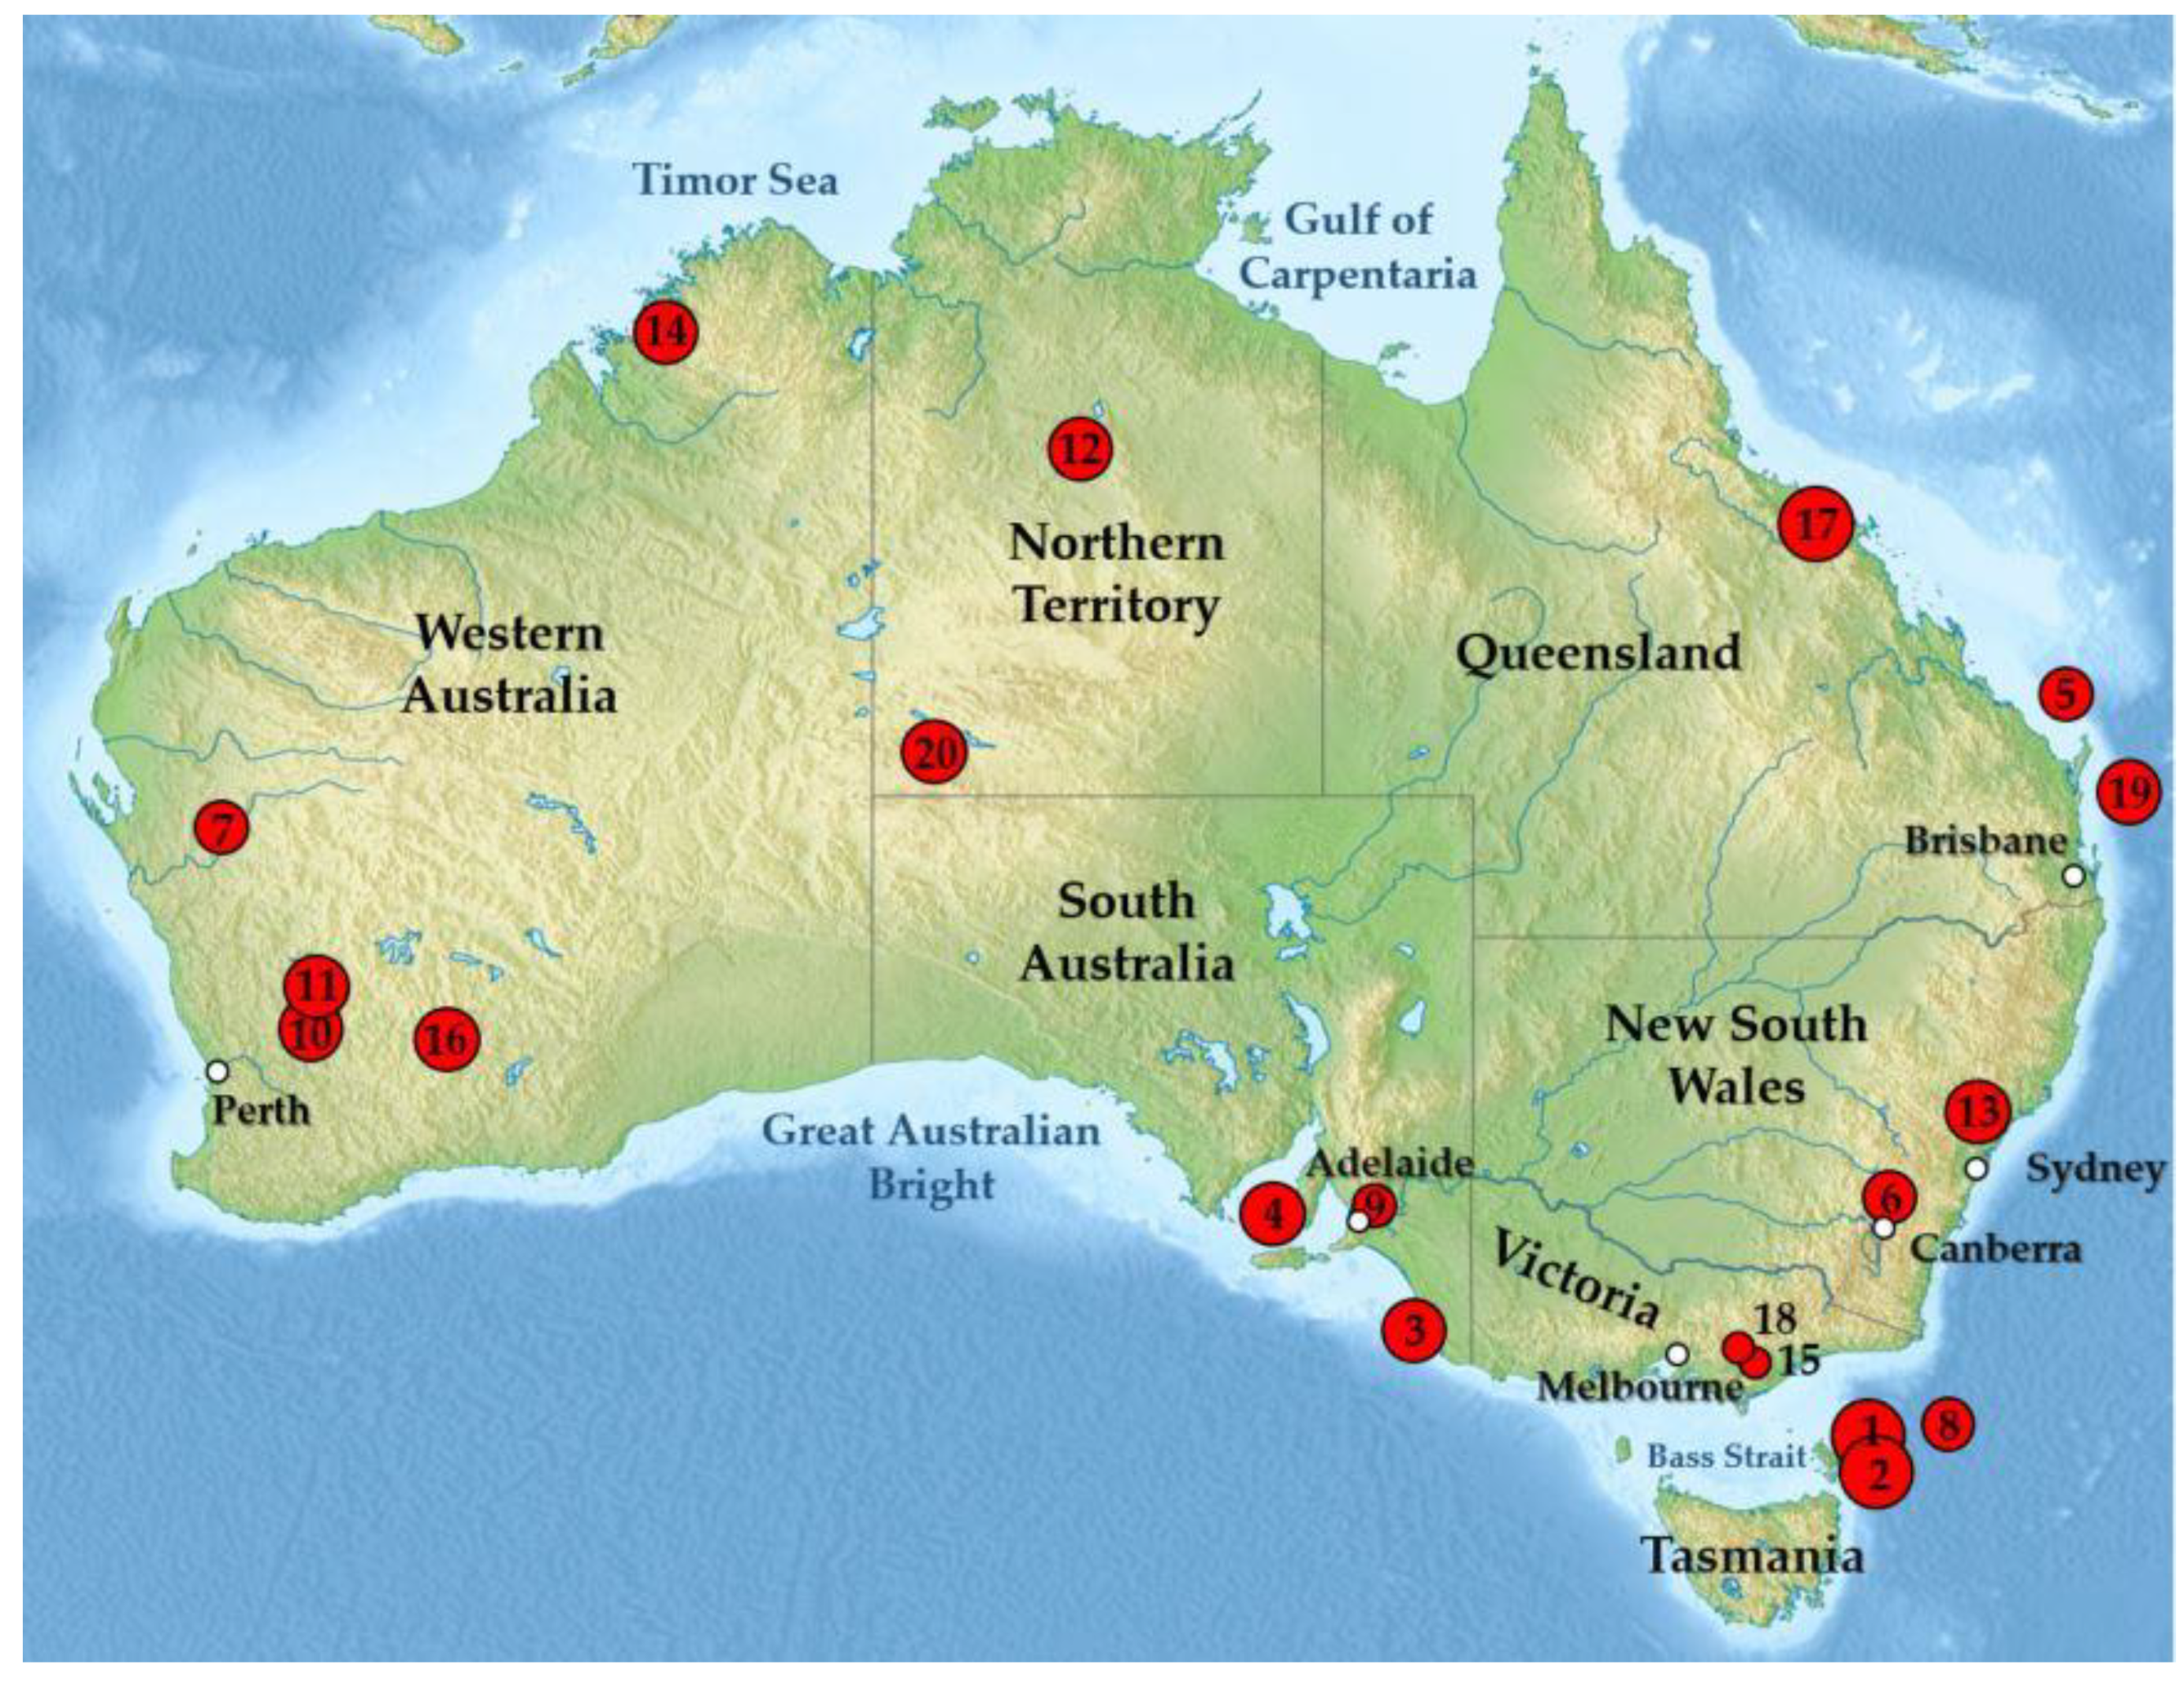
Australia is traditionally considered as a seismically inactive region. However, a small to moderate earthquake events have been reported by Geoscience Australia [22]. The geographical locations of such seismic events in Australia are shown in Figure 1. Further details, including earthquake magnitude on Richter scale, are listed in Table 1.
This study is focused on the critical assessment of the effect of GWT drawdown and dynamic loading on piled raft foundation. Finite element method (FEM) is an effective tool to simulate the effect of drawdown and dynamic loading on various types of soil [5,23,24]. Improper simulation of complex ground conditions can result in potential failure during the construction or post-construction phases. In this paper, the commercial software package, PLAXIS 2D v. 2012 developed by Bentley Systems is used to perform finite element analysis.
2. Finite Element Modeling and Model Setup
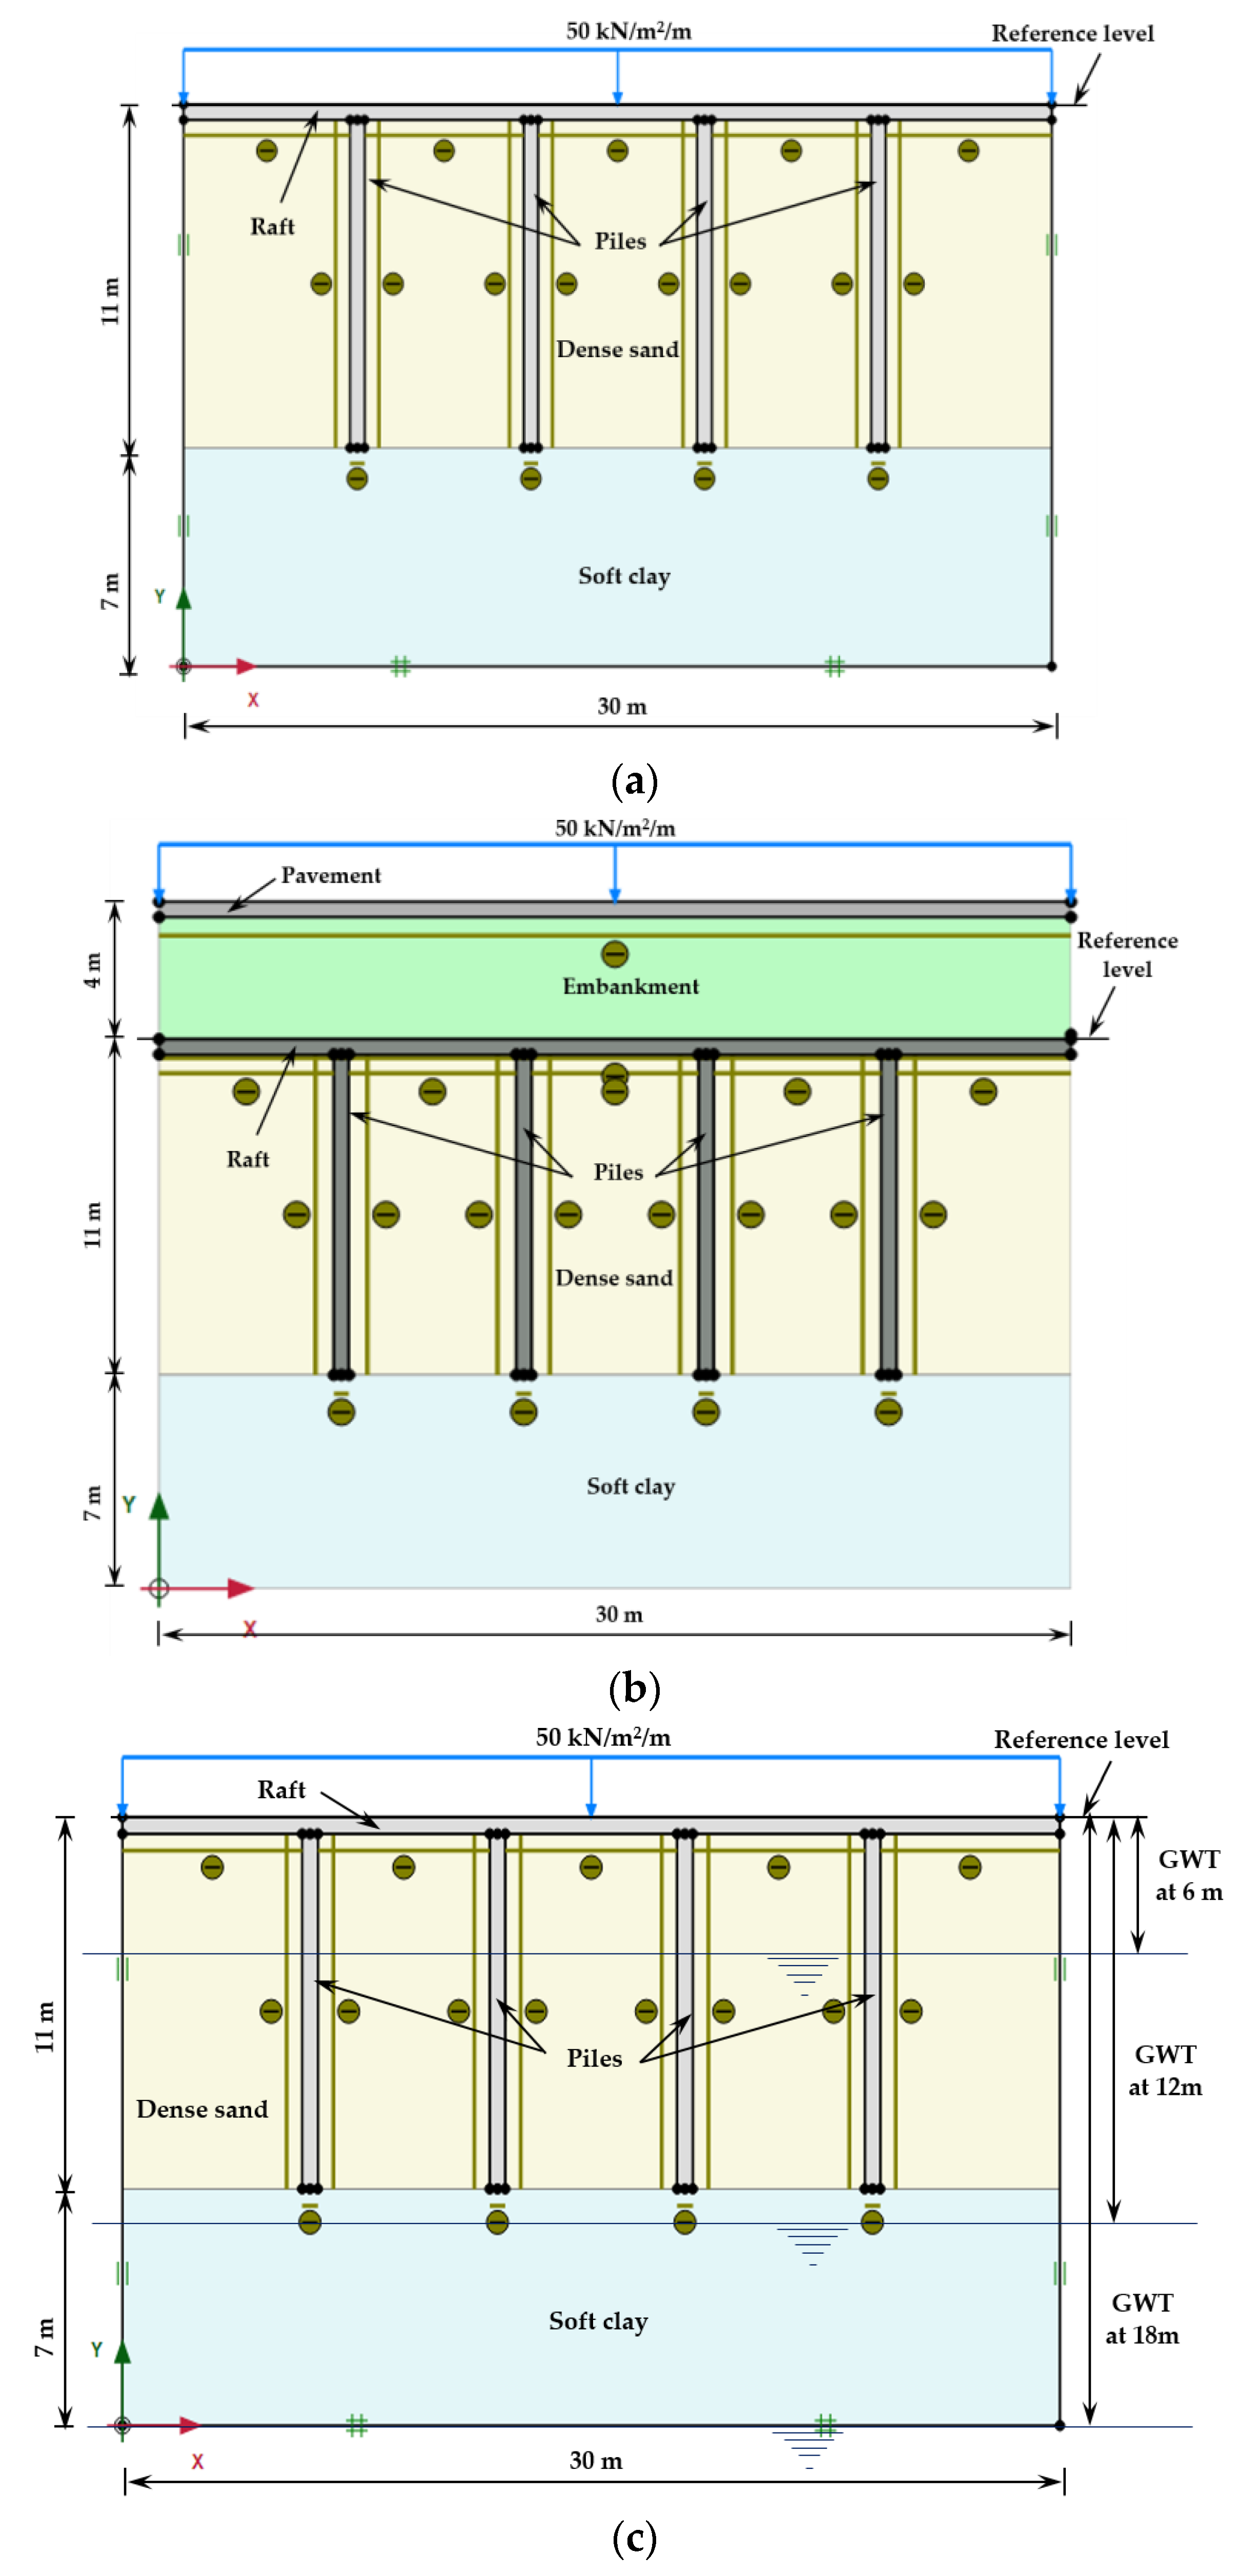
The two-dimensional plane strain nonlinear finite element analysis (FEA) is carried out in PLAXIS 2D v. 2012. Mesh is discretized by the fifteen-noded triangular element. Fine mesh is selected for this analysis. A wide boundary, three times of depth on each side (i.e., 110 m wide) is considered to minimize the boundary effect on dynamic analysis [25]. The roller support is considered laterally at both sides while the bottommost side is kept fully fixed [25,26]. The bottom boundary represents the bedrock, which is located at 7 m from the pile base. The pile stiffness appropriate to 2D state is modelled following the approach suggested elsewhere [27,28]. The interface elements are used to incorporate the soil–pile and soil–raft interactions. The interface strength reduction factor (Rint) = 0.6 is used to reduce the skin resistance of the interface allowing slippage between the pile and soil nodes. The pile is modeled as 10.5 m in length and 0.5 m in diameter. The raft is 30 m long and 0.5 m wide. The pile spacing is 6 m. In this study, four different cases are considered: (i) Piled raft in sand underlain by clay; (ii) piled raft in clay underlain by sand; (iii) piled embankment in sand underlain by clay; and (iv) piled embankment in clay underlain by sand. The case (i) is also chosen to investigate the seismic response of a piled raft foundation. The geometry of the model and soil profile are shown in Figure 2 for cases (i) (Figure 2a) and (iii) (Figure 2b). Each case has identical soil stratigraphy, with GWT located at 6 m, 12 m, and 18 m below the raft in order to simulate the effect of drawdown, as shown in Figure 2c for case (i). The hardening soil model is used to simulate embankment soil. The finite element (FE) parameters of the homogenous sand, clay, embankment, and pile raft are taken as provided by Engin and Brinkgreve [29] and PLAXIS 2D manual [30]; these properties are listed in Table 2.
3. Results and Discussion
3.1. Case (i): Piled Raft Constructed in Sand Underlain by Clay
It is apparent from Figure 3a that the settlement is uniform across the top of the piled raft structure. However, it increases near the edges of the raft. The ultimate settlement (su) for case (i) is found to be 18.85 mm, 23.6 mm, and 22.8 mm corresponding to GWT at 6 m, 12 m, and 18 m, respectively (refer Figure 3b). The settlement is measured along the centerline, as shown in Figure 3b. For all GWT positions, the settlement trend is similar and shows abrupt change at the interface because of the change in soil properties. For the consolidation phase, the settlement value is 3.5 mm, 4.3 mm, and 4.4 mm for GWT at 6 m, 12 m, and 18 m respectively, which is much smaller than the plastic phase as anticipated.
3.2. Case (ii): Piled Raft Constructed in Clay Underlain by Sand
Figure 4 demonstrates that the ultimate settlement (su) for case (ii) is 209.22 mm, 198.45 mm, and 191.66 mm corresponding to GWT position of 6 m, 12 m, and 18 m, respectively. It implies that the piled raft in clays exhibits much higher settlements compared to that in the sand. This could be potentially due to the fact of clay layer is subjected to higher stress. During the consolidation phase, the settlement slightly increases for both GWT positions (i.e., 5.3 mm, 5.0 mm, and 4.8 mm, respectively) compared to the case (i).
3.3. Case (iii): Piled Embankment in Sand Underlain by Clay
Figure 5 shows settlement for case (iii). It is observed that the settlement trend is similar to case (i). However, the ultimate settlement is observed as 20.15 mm, 22.85, and 22.87 mm for GWT positions of 6 m, 12 m, and 18 m, respectively. The settlement is also approximately similar to case (i). The maximum settlement occurs at the top of embankment fill.
3.4. Case (iv): Piled Raft Embankment in Clay Underlain by Sand
The settlement is found to be lower than case (ii). It is well acknowledged that the stability of piled raft is influenced by the location of groundwater table and soil surrounding the piled raft. However, after 12 m GWT, the settlement is not significantly influenced. All findings by numerical analysis in term of maximum stress (σmax), maximum strain (εmax), and ultimate settlement (su) are summarized in Table 3. It is interesting to note that how the pile raft foundation performs under varying positions of groundwater table. The cases (i) and (iii) demonstrate the lower bearing capacity compared to cases (ii) and (iv). It implies that the piled raft with embankment performs better in term of settlement as the embankment helps in the efficient load transfer.
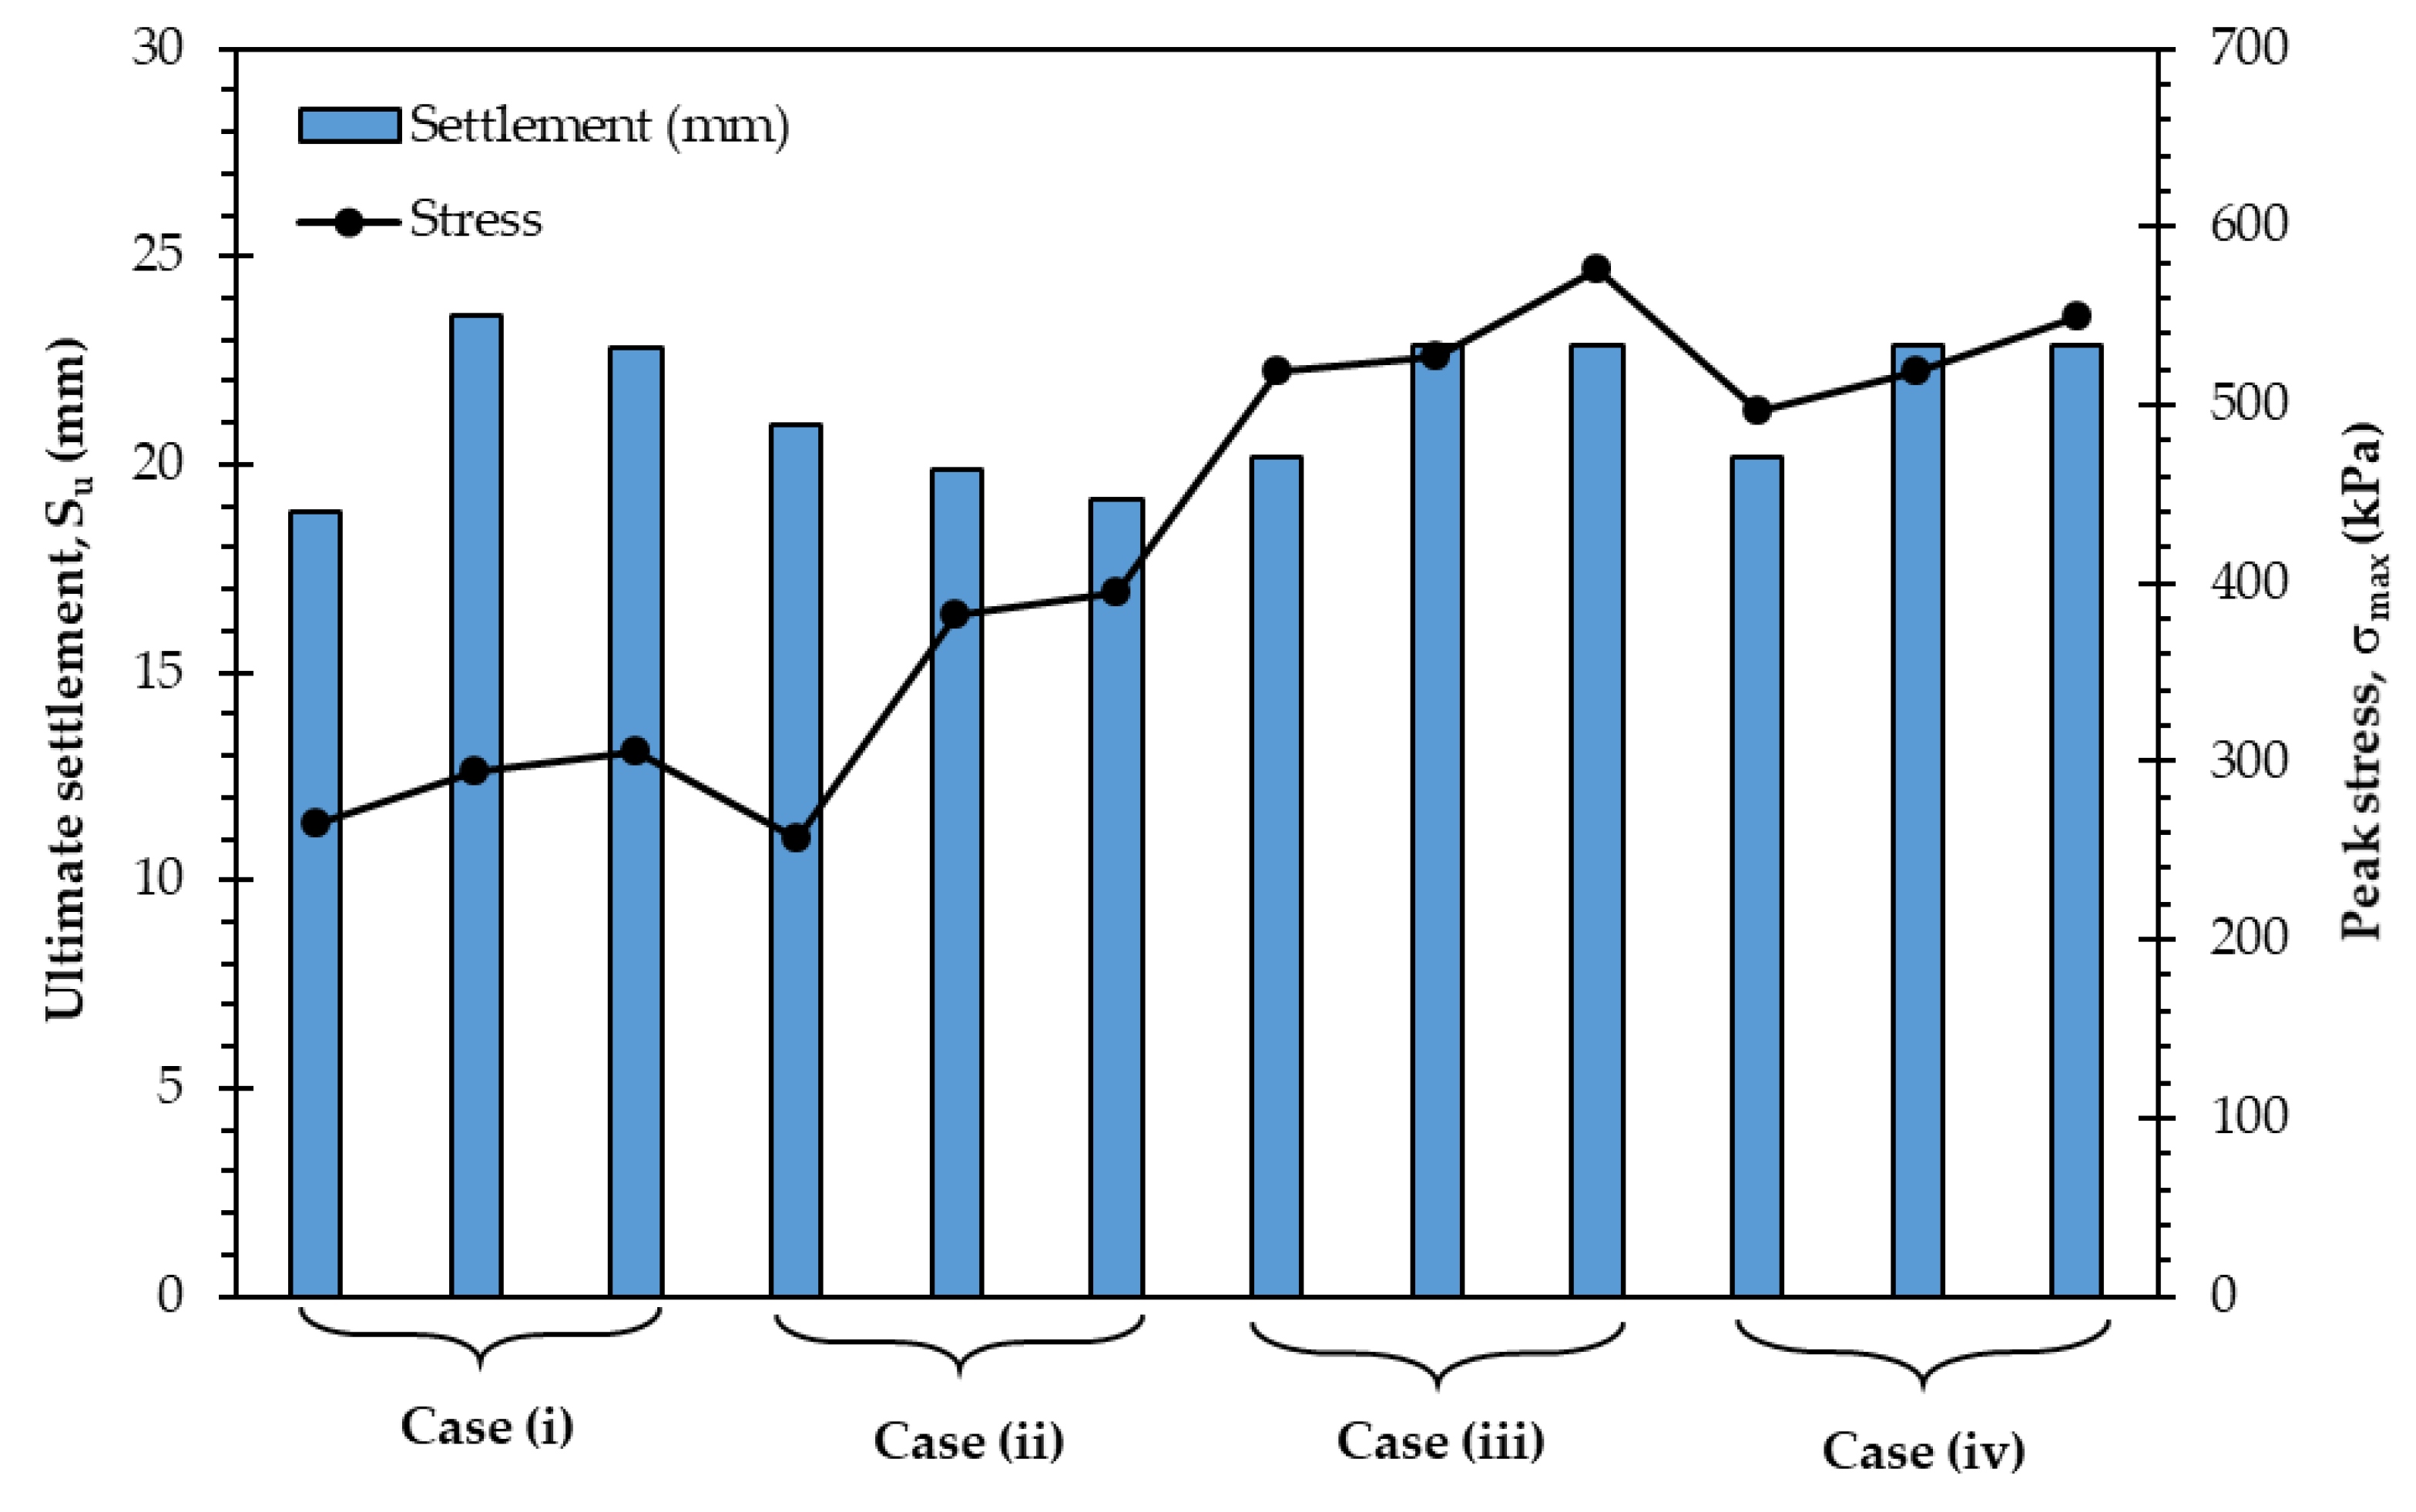
Figure 6 shows the relationship between maximum stress (σmax) and settlement (su). The maximum stress at the base and maximum settlement at the top of the analyzed models is shown in Figure 6. It is demonstrated that case (i) has the lowest, whereas case (iv) has the highest bearing capacity because of the embankment rest on the piled raft in clay underlain by sand. It is also interesting to see that when introducing the embankment overlying the piled raft in sand (case (iii)) then the settlement reduces dramatically (about 41%). In contrast, the embankment overlying on the piled raft in clay (case (iv)), the settlement does not reduce so much (about 8.82%). It implies the benefit of embankment to enhance the bearing capacity in case (i) while the case (ii) does not show any substantial benefit.
4. Improved Performance of Piled Raft
Various strengthening techniques are available to improve the load-bearing capacity of a piled raft foundation. These include increasing length and diameter of pile, increasing the number of piles, reducing the pile spacing, and adding geotextile material in piled raft embankment. Increasing the thickness of the pile raft slab can enhance the load transfer from the structure to the piles. Geosynthetic materials are designed to give extra reinforcement for embankment fill [31]. Stiffness value of the geotextile is typically between 500 kN/m/m to 3000 kN/m/m.
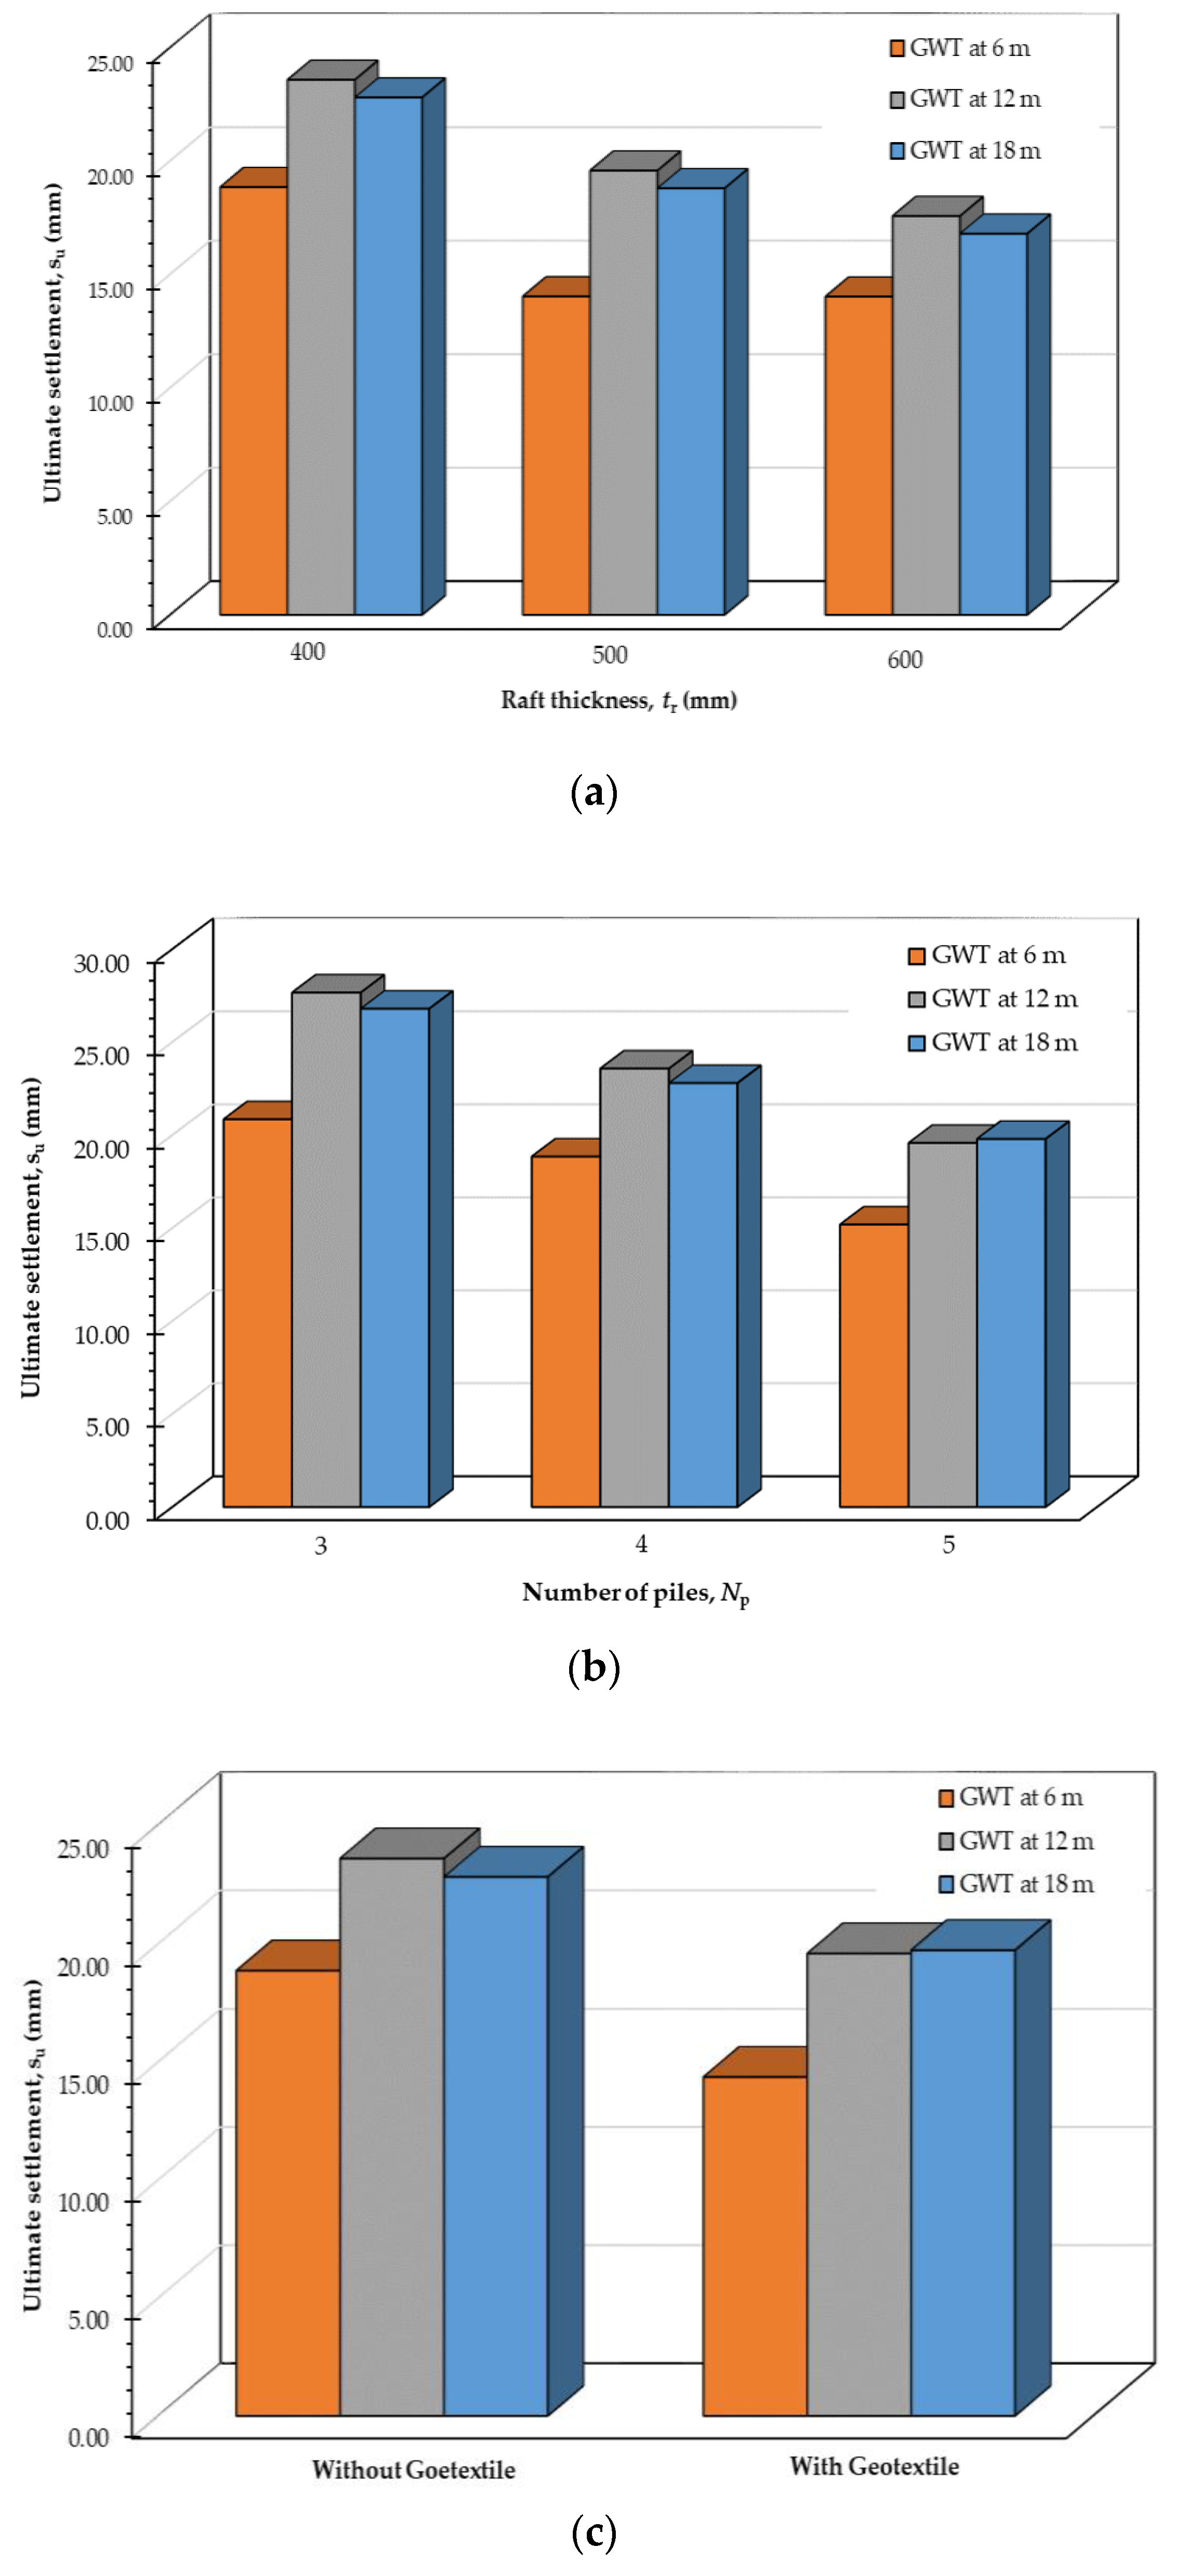
In this study, three improvement techniques, (a) increasing the raft thickness; (b) increasing the number of piles; and (c) adding geotextile layers, have been used to enhance the performance of the piled raft. The stiffness value of 1500 kN/m/m is chosen to represent the common woven geotextile used in the road projects in Australia [32,33]. The case (i) is considered to see the effect of these techniques on the performance of piled raft. The FE results are plotted in Figure 7. It is observed that the piled raft stability is increased after introducing these techniques. The raft thickness (tr) is increased as 400, 500, and 600 mm, and it is shown to reduce the settlements up to 25%.
Further, increasing the number of piles below the raft also enhances the stability of the foundation. For this study, three configurations of pile group (i.e., 3, 4, and 5 piles) are considered. Results show that increasing the number of piles resulted in the improvement of stability of the piled raft. The settlement is reduced by up to 35%. The use of geotextile is responsible for the reduced settlement up to 15%. It may conclude that the number of piles is more pronounced to reduce the settlement.
5. Seismic Response Analysis
Earthquake loads are typically applied at the base of the soil model and resulting shear waves propagate in the vertically upward direction. The soil is simulated in plain strain condition which does not has geometric damping. Therefore, Rayleigh damping can be provided to get accurate results. There are a few aspects that should be taken in mind: (a) boundary condition, (b) mesh element size, and (c) time stepping. In the seismic analysis, the shear waves travel within the model and interact with vertical boundaries, which cause the trap of earthquake-induced energy. The issue of energy trapping into the model can be solved by incorporating the appropriate boundary condition, as discussed earlier.
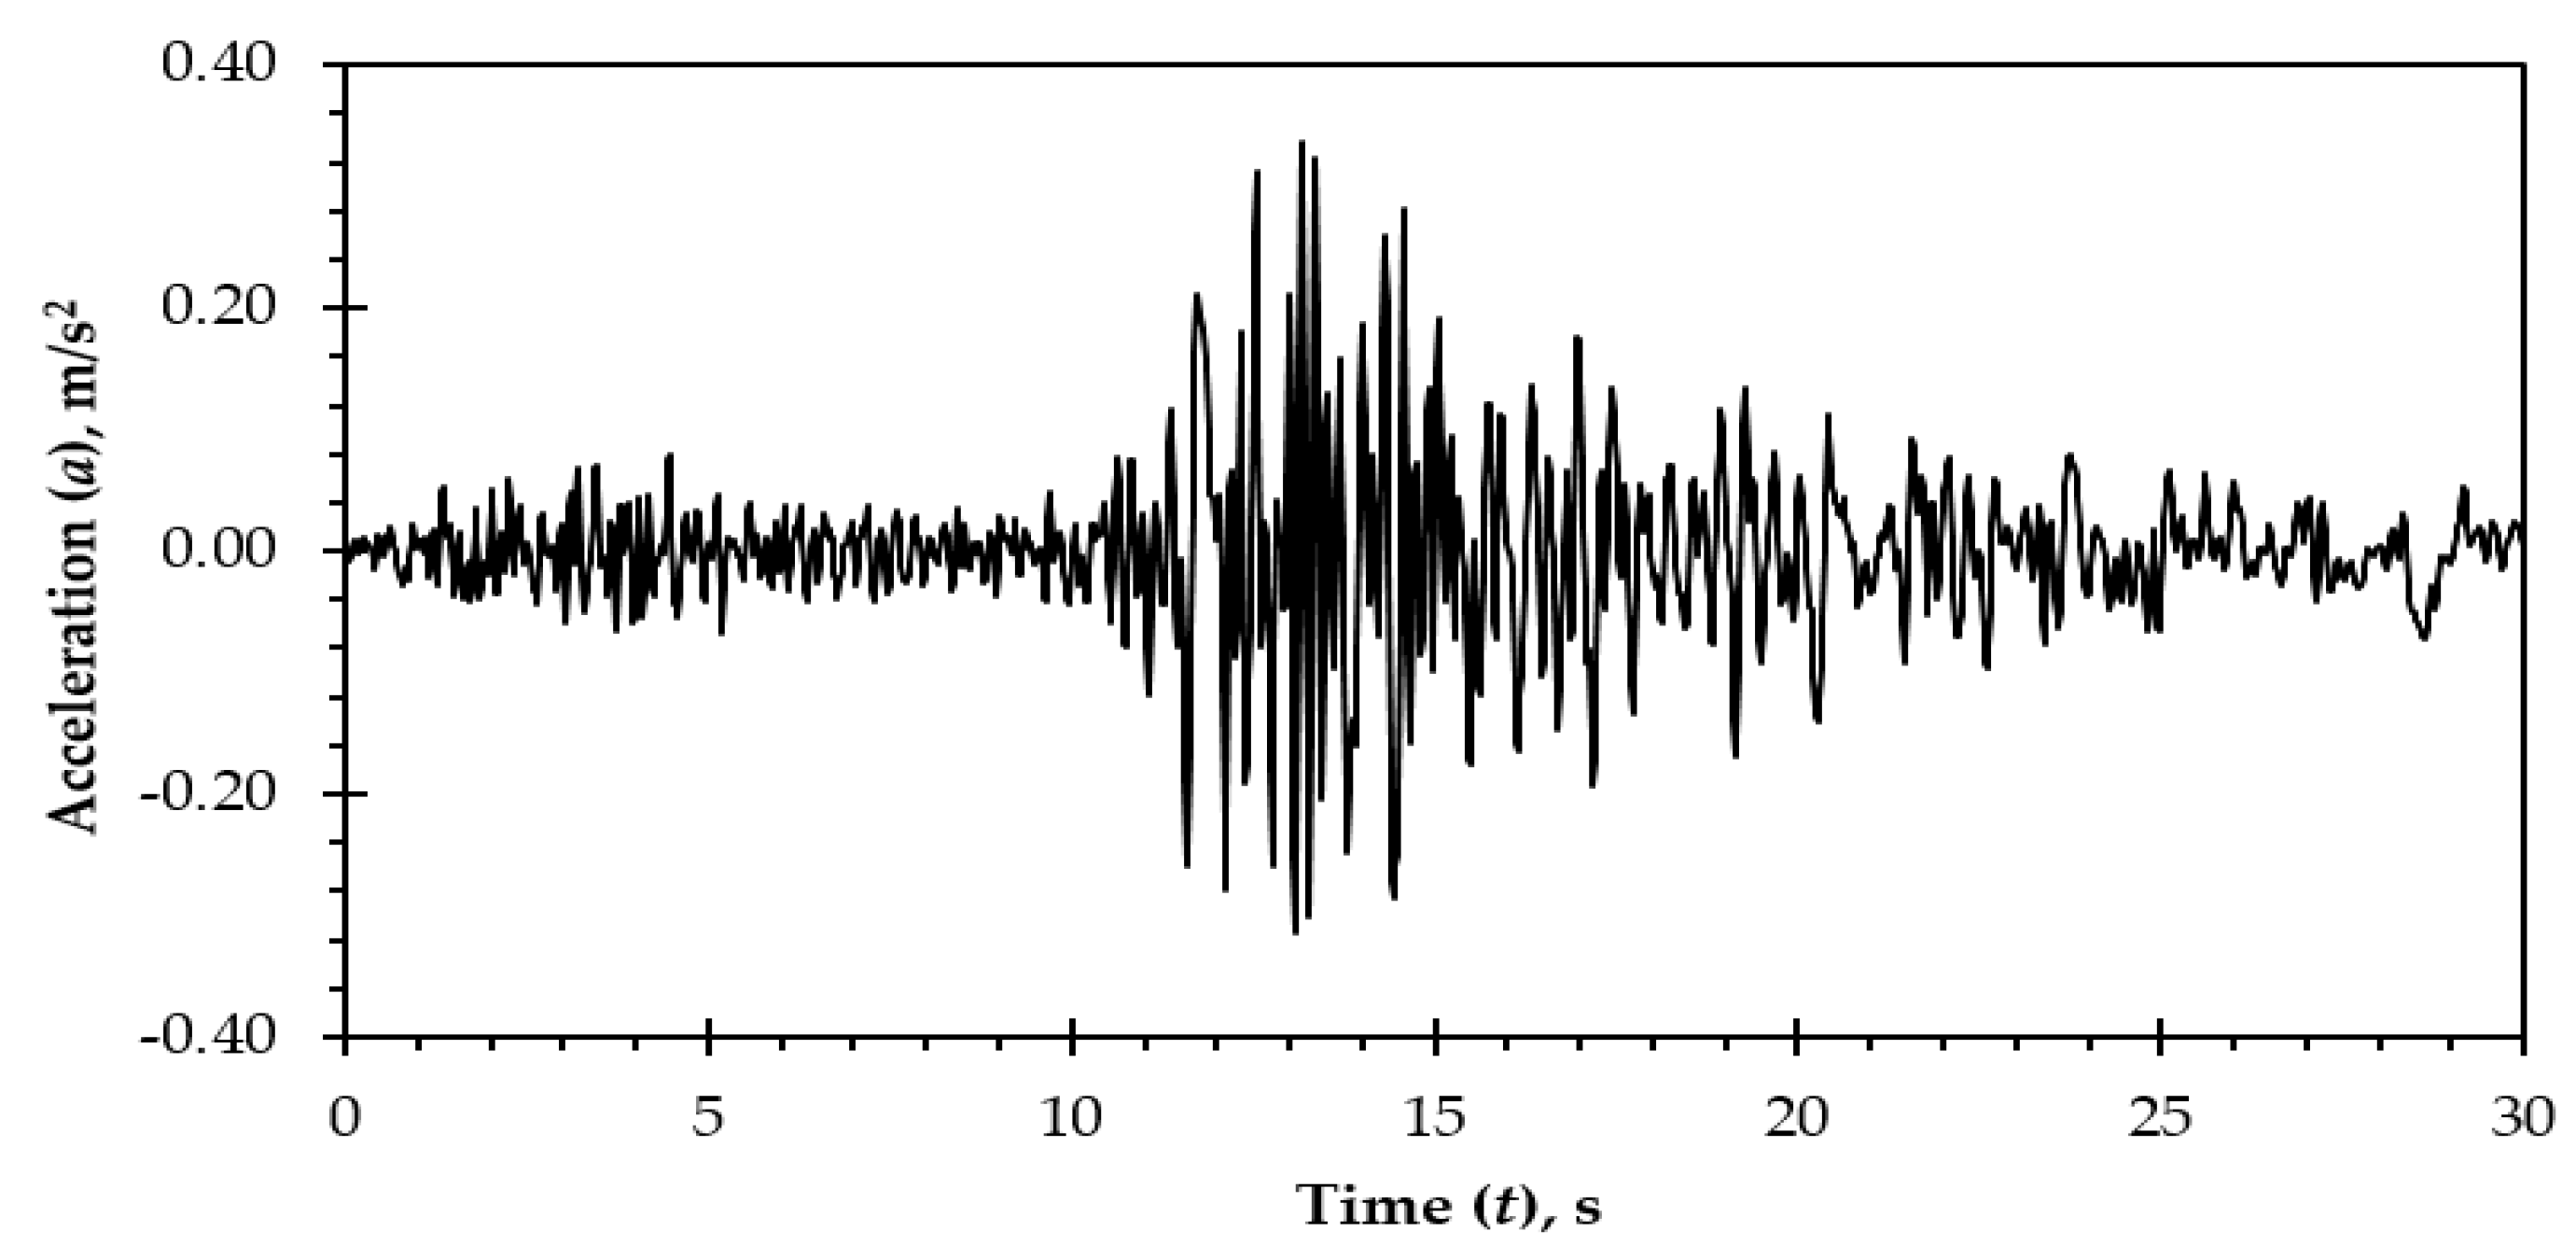
In this study, the acceleration time history of the Christchurch earthquake 2011 is considered for the dynamic excitation, as shown in Figure 8. In addition, El Centro 1940 and Loma 1989 earthquakes are also considered to seek response spectra acceleration distribution. The ground motion parameters considered in the analysis resemble well with the dynamic characteristics of a few major earthquakes listed in Table 1. These earthquakes include Petermann Ranges (2016), Collier Bay (1997), Cadoux (1979), Meckering (1968), Meeberrie (1941), and Offshore Beachport (1897), (i.e., location no. 1, 7, 10, 11, 14, and 18). The dynamic analysis is performed in three stages, viz., (1) all the structural elements are activated in plastic phase after activating all soil elements in the initial phase; (2) vertical load are activated, and displacement is set to zero in plastic phase; and (3) the dynamic time interval is set to 30 s in dynamic phase. The input ground motion is imposed at the bottom boundary with a prescribed displacement of 1.0 m in lateral (x-axis) direction. The duration of input ground motion is considered 30 s with 0.02 s as time interval.
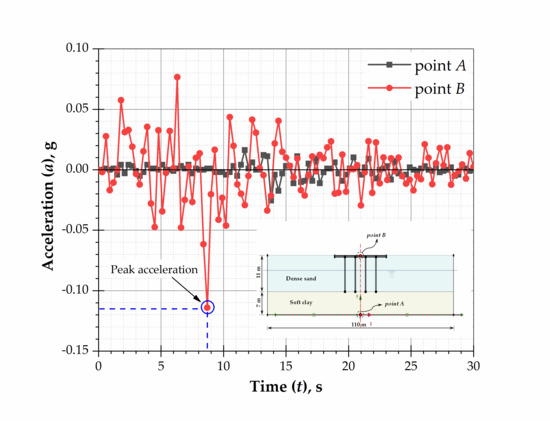
Seismic waves travel from source point to surface through the soil layers. The soil layers act as a filter and influence the ground motion characteristics. The seismic response analysis of a foundation system is therefore a priori before a fully integrated dynamic analysis of overlying structure is undertaken. The seismic response analysis of piled raft foundation is conducted considering case (i). The model undergoes deformation because of a given earthquake input motion. Two points (i.e., at the base of soil, point A; midpoint of the piled raft, point B) are considered to get the seismic response of piled raft foundation, as shown in Figure 9.
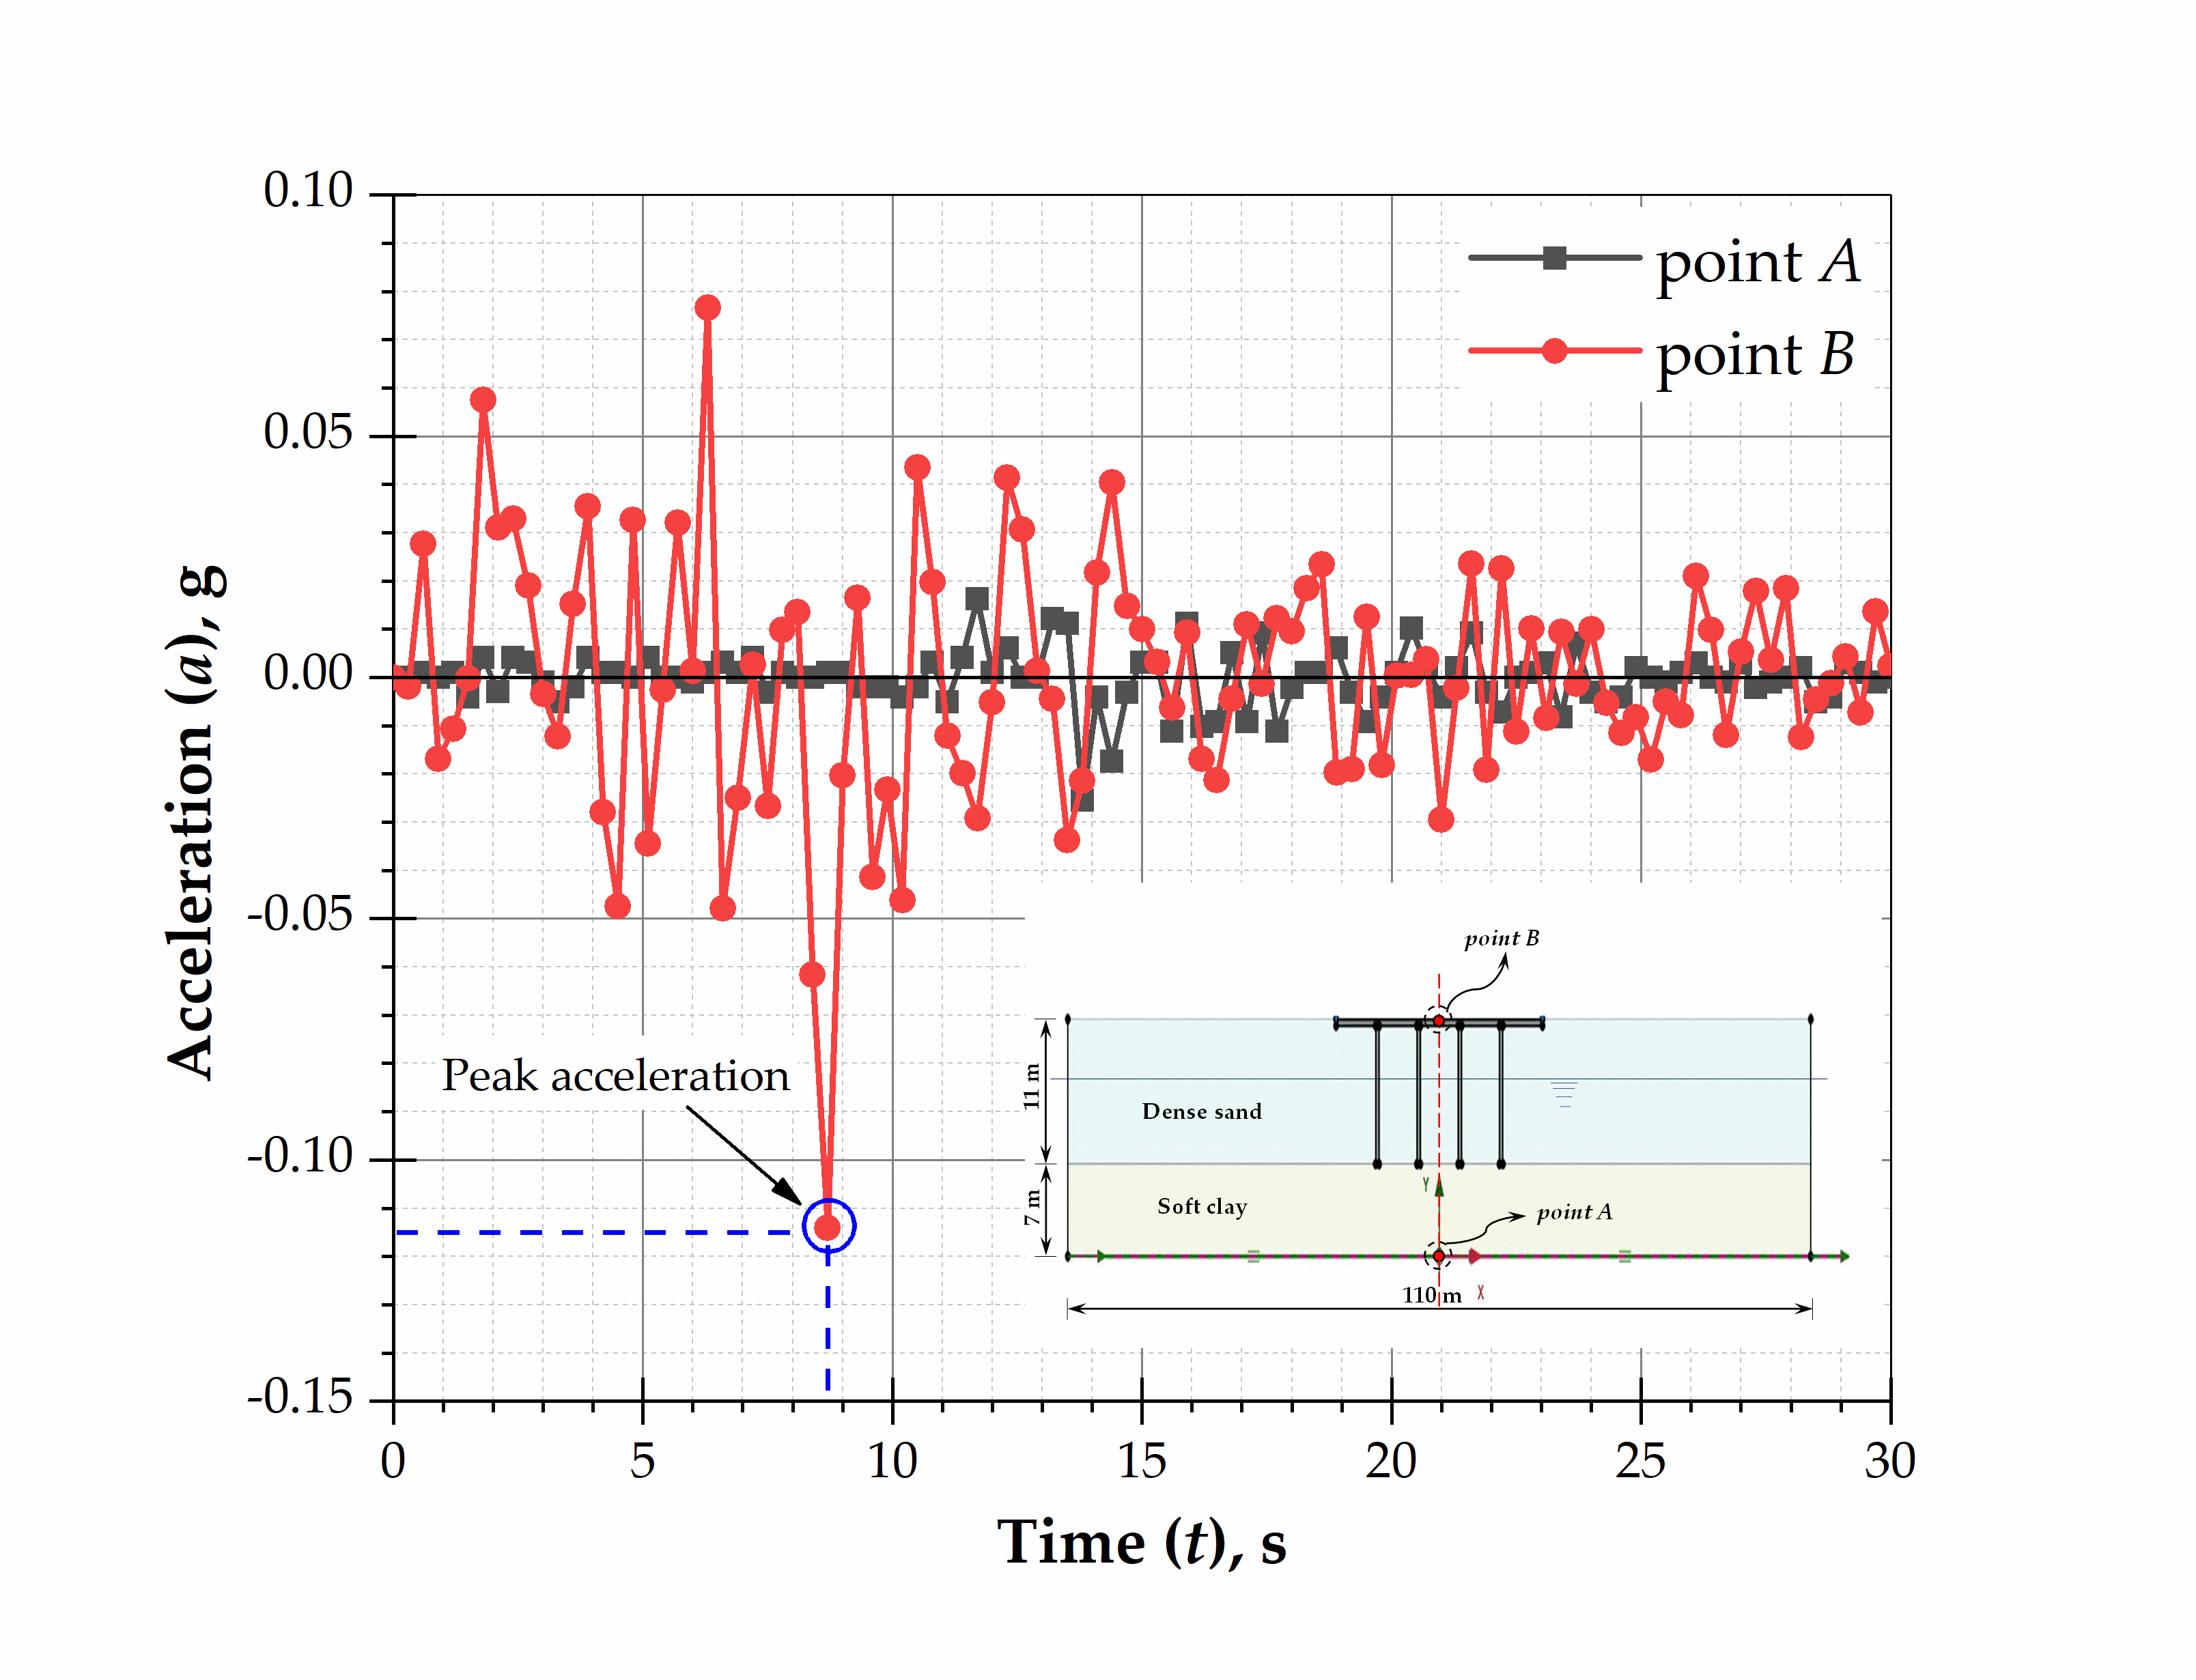
The response of piled raft is investigated at the selected points, on the bedrock (i.e., at the base of model) and the top surface of the model. For GWT at 6 m, time history graph of a given earthquake motion in terms of acceleration (a) is shown in Figure 10a. The peak spectral acceleration (PSA) response spectrum considering 5% of damping is given in Figure 10b.
As shown in Figure 10a, the input acceleration (a; 0.03 g) becomes amplified as it reaches the top surface of the model. At point A, the maximum acceleration (a) is 0.03 g, and it gets amplified to 0.11 g at point B. It implies that the site amplification factor of 3.67 as the ground acceleration shows about a four-fold increase. Figure 10b shows the response spectra in terms of acceleration (i.e., PSA). The PSA is calculated as the single degree of freedom (SDOF) system, considering different stiffness values. The damping ratio and input ground motion are considered the same during the response spectrum analysis. Different stiffness values calculate time period as reported in the x-axis of Figure 10b. The peak value of PSA corresponding to a specific time period can be used further to calculate the maximum shear stress (τmax) at the base of the overlying structure. It can be seen in Figure 10b that the peak value of PSA is about 1.0 s, which implies that if the vibration time of the overlying structure is 1.0 s, the system will be in resonance.
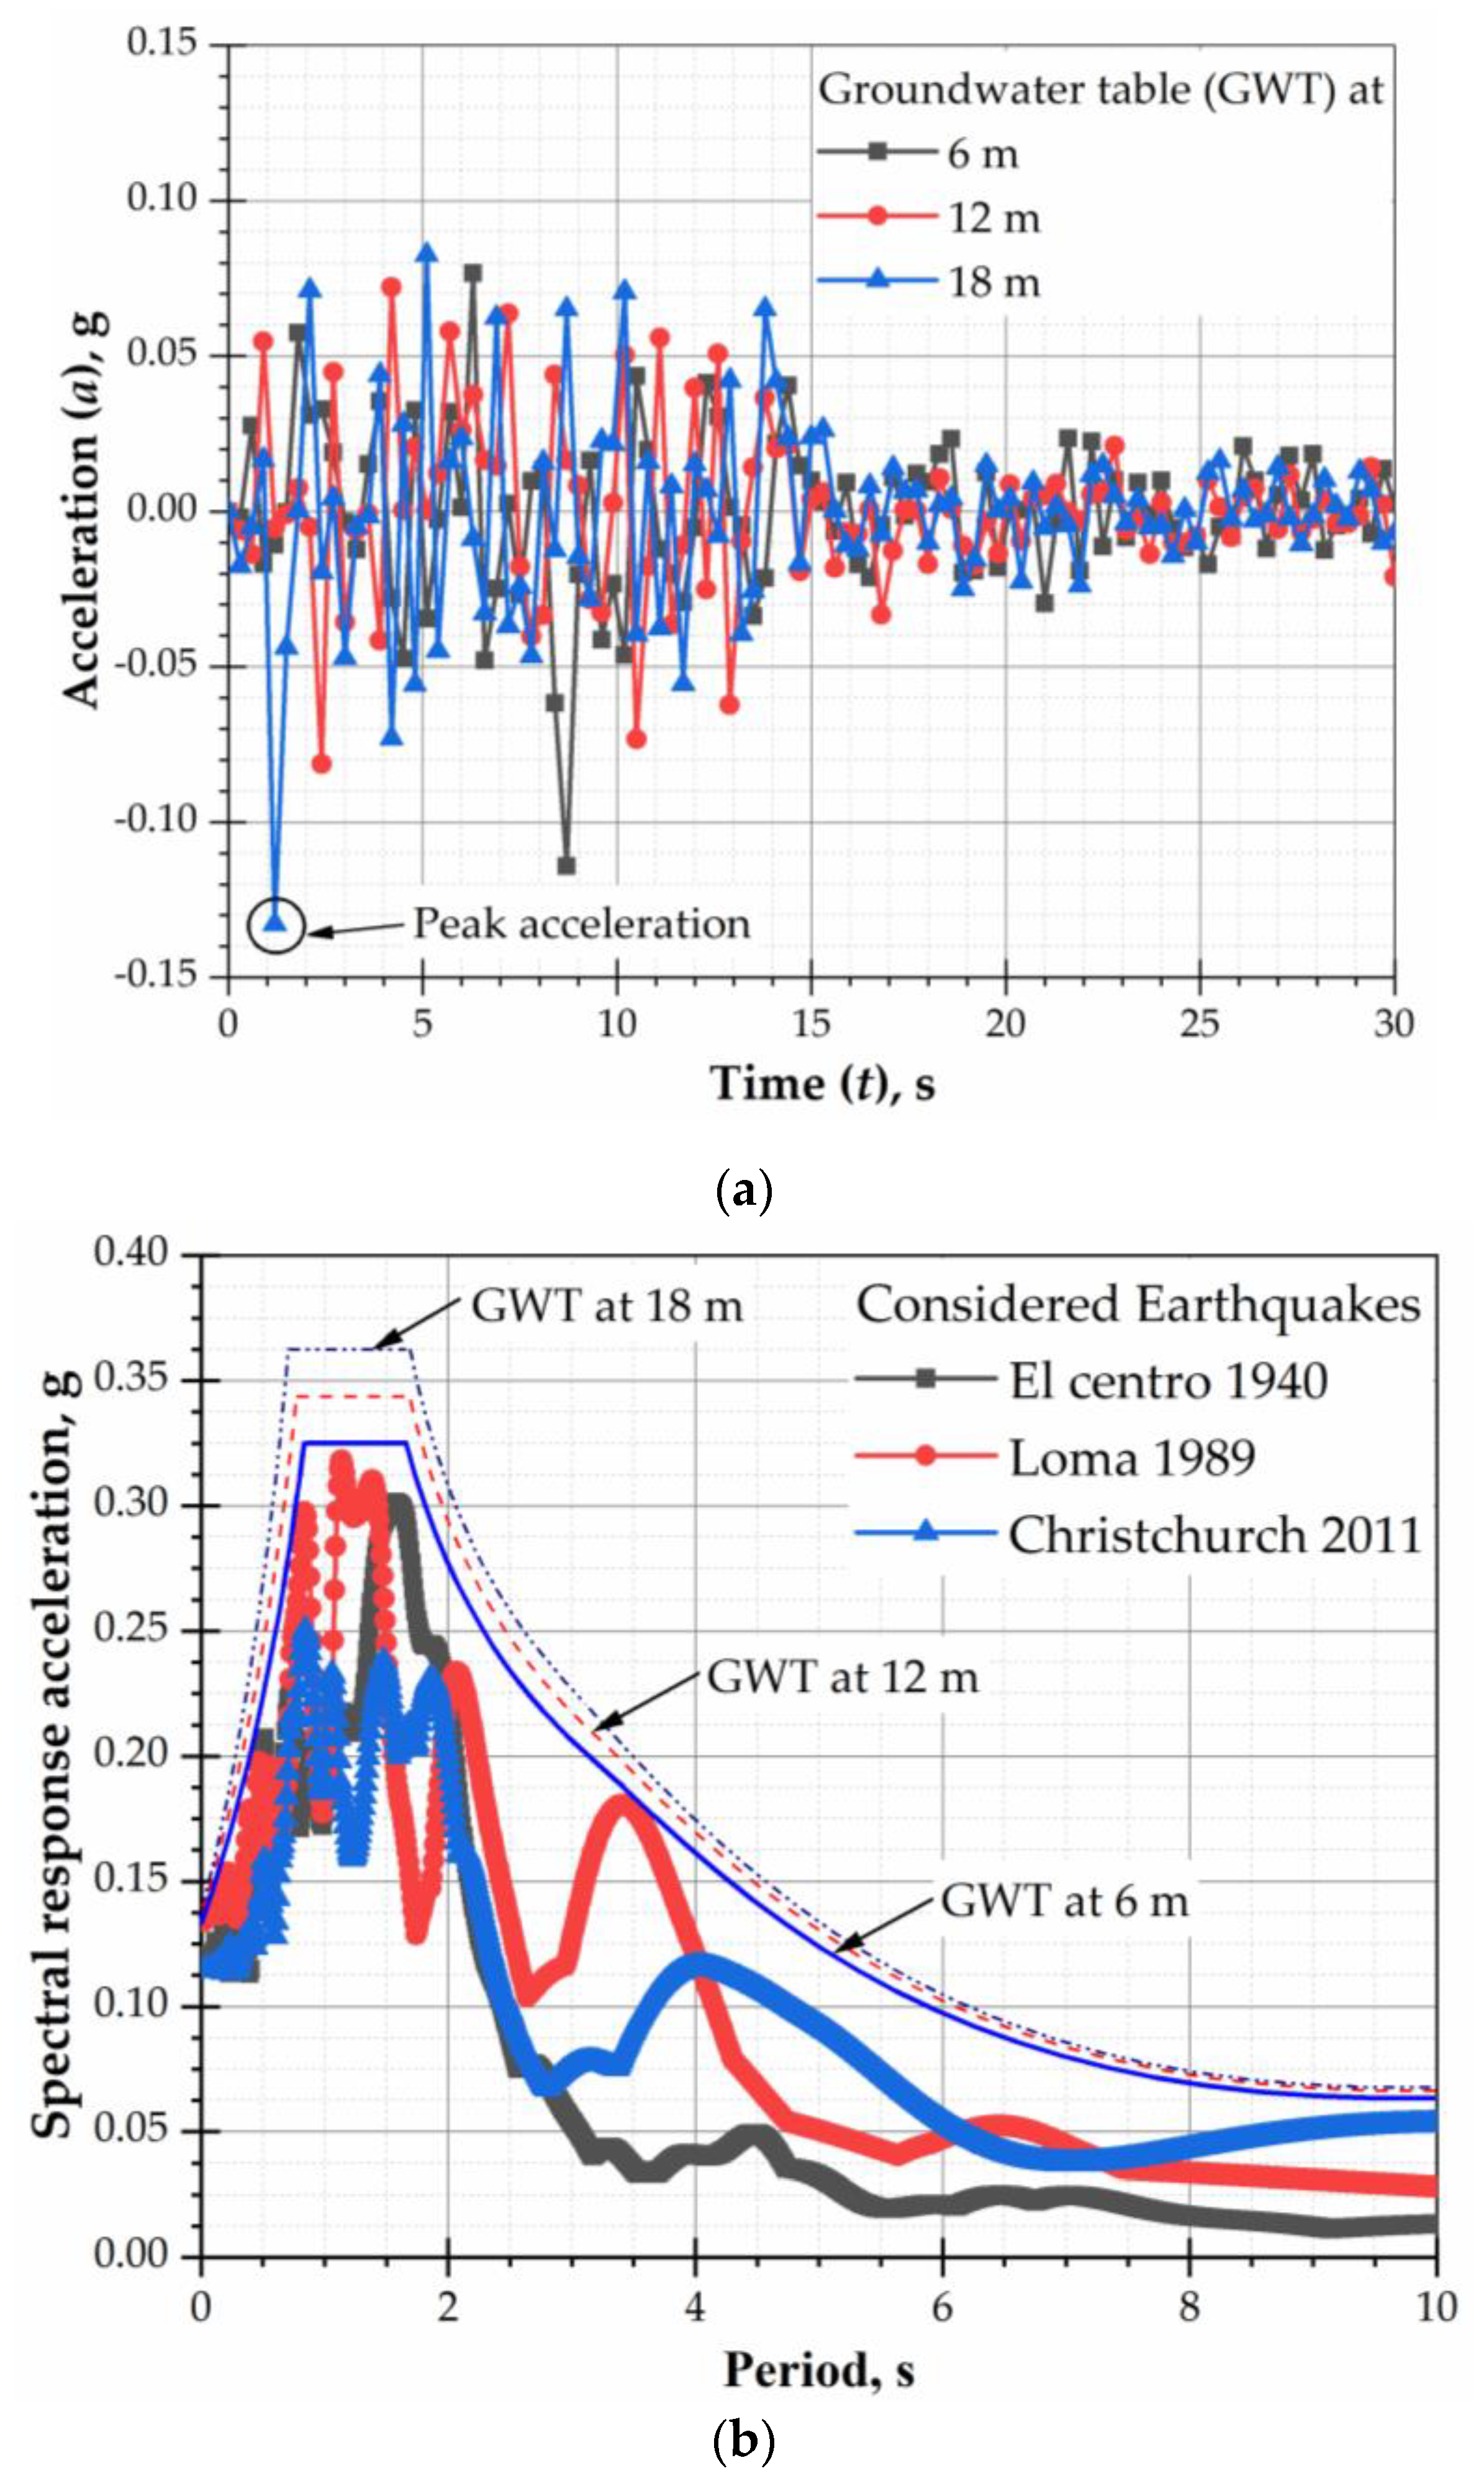
Effect of drawdown on the seismic response of the foundation system is shown in Figure 11. Figure 11a shows the time history curve at point B for three different GWT levels. It shows that the acceleration value is higher for 18 m GWT condition as compared to GWT at 6 m and 12 m. On the other side, Figure 11b shows the response spectra for three earthquake records at different GWT (6 m, 12 m, and 18 m). The response spectra curve for different GWT is constructed according to the observed response acceleration trend. The response accelerations at 6 m GWT for considered earthquake records have been plotted. It shows that the higher response spectral acceleration is captured as GWT increase. Figure 11 implies that the seismic response is significantly affected by the drawdown. Thus, if the GW exists near the base of the overlying structure, then it can be the cause of severe damage or total collapse. Therefore the GWT should be lowered by a greater extent to reduce the damage caused by the earthquake.
6. Conclusions
This paper reports the outcomes of finite element analysis of the piled raft foundation under two-dimensional plane strain state. The stability of the piled raft foundation subjected to seismic loads and groundwater table drawdown is evaluated. The results demonstrate that the groundwater table and seismic loading have a significant effect on the overall performance of piled raft foundation. Through the outcomes of this study, the following conclusions may be drawn:
- The level of groundwater has a substantial effect on the settlement of piled raft foundation. The ground response is significantly influenced by the GWT fluctuation. The lower GWT gives low site frequency resulting in increases of peak ground acceleration. The peak acceleration increases by 20% when GWT is located at 18 m compared to 6 m and 12 m. Thus, the seismic response of the foundation system also affects the level of groundwater. This aspect should be considered in the design of piled raft.
- Three strengthening techniques are considered to improve the performance of piled raft. The settlement is reduced by up to 20% by introducing more number of piles compared to other considered strengthening techniques. It is worth noting that the liquefaction risk can be reduced by increasing the number of piles.
In summary, groundwater tables and dynamic loading have a significant impact on the stability of a piled raft foundation. Further study to analyze the coupled effects of groundwater table fluctuations, time-dependent dynamic traffic loads, and liquefaction potential is necessary and is currently under investigation by the authors.
Author Contributions
N.K.M. perceived the paper. N.K.M. wrote the first draft of this paper. S.N. contributed to the data analysis and editing of the manuscript. All authors have approved it for publication.
Funding
The authors would like to express their sincere gratitude to Government of India for providing the financial support under the National Overseas Scholarship, No. 11016/16/2016 Education.
Acknowledgments
The financial support providing by Government of India and the assistance from David Rizkalla, former graduate student of University of Technology Sydney during the early modeling stages is greatly appreciated.
Conflicts of Interest
The authors declare no conflict of interest.
References
- Burland, J. Piles as settlement reducers. In Proceedings of the 19th National Italian Geotechnical Conference, Padova, Italy, 19–21 September 1995; Volume 2, pp. 21–34. [Google Scholar]
- Sawada, K.; Takemura, J. Centrifuge model tests on piled raft foundation in sand subjected to lateral and moment loads. Soils Found. 2014, 54, 126–140. [Google Scholar] [CrossRef] [Green Version]
- Nguyen, D.D.C.; Kim, D.-S.; Jo, S.-B. Parametric study for optimal design of large piled raft foundations on sand. Comput. Geotech. 2014, 55, 14–26. [Google Scholar] [CrossRef]
- Basile, F. Non-linear analysis of vertically loaded piled rafts. Comput. Geotech. 2015, 63, 73–82. [Google Scholar] [CrossRef]
- Mali, S.; Singh, B. Behavior of large piled-raft foundation on clay soil. Ocean Eng. 2018, 149, 205–216. [Google Scholar] [CrossRef]
- Maharaj, D.K.; Gandhi, S.R. Non-linear finite element analysis of piled-raft foundations. Inst. Civ. Eng. Geotech. Eng. 2004, 157, 107–113. [Google Scholar] [CrossRef]
- Butterfield, R.; Banerjee, P.K. The problem of pile group–pile cap interaction. Geotechnique 1971, 21, 135–142. [Google Scholar] [CrossRef]
- Kuwabara, F. An elastic analysis for piled raft foundations in a homogeneous soil. Soils Found. 1989, 29, 82–92. [Google Scholar] [CrossRef] [Green Version]
- Poulos, H.G. Tall building foundations: Design methods and applications. Innov. Infrastruct. Solut. 2016, 1, 10. [Google Scholar] [CrossRef] [Green Version]
- Poulos, H.G. Piled raft foundations: Design and applications. Geotechnique 2001, 51, 95–113. [Google Scholar] [CrossRef]
- Moormann, C. Geotechnical long-term monitoring: Impact of groundwater-lowering on adjacent high-rise buildings. In Field Measurements in Geomechanics; CRC Press: Borarton, FL, USA, 2003; pp. 250–257. [Google Scholar]
- Rahardjo, H.; Nio, A.S.; Leong, E.C.; Song, N.Y. Effects of groundwater table position and soil properties on stability of slope during rainfall. J. Geotech. Geoenviron. Eng. 2010, 136, 1555–1564. [Google Scholar] [CrossRef]
- Calin, N.; Radu, C.; Bica, I. Dewatering system of a deep of excavation in urban area–Bucharest case study. Procedia Eng. 2017, 209, 210–215. [Google Scholar] [CrossRef]
- You, Y.; Yan, C.; Xu, B.; Liu, S.; Che, C. Optimization of dewatering schemes for a deep foundation pit near the Yangtze River, China. J. Rock Mech. Geotech. Eng. 2018, 10, 555–566. [Google Scholar] [CrossRef]
- Viggiani, C.; Mandolini, A.; Russo, G. Piles and Pile Foundations; CRC Press: London, UK, 2014. [Google Scholar]
- Kumar, A.; Choudhury, D.; Katzenbach, R. Effect of earthquake on combined pile–raft foundation. Int. J. Geomech. 2016, 16, 04016013. [Google Scholar] [CrossRef]
- Das, B.; Saha, R.; Haldar, S. Effect of in-situ variability of soil on seismic design of piled raft supported structure incorporating dynamic soil-structure-interaction. Soil Dyn. Earthq. Eng. 2016, 84, 251–268. [Google Scholar] [CrossRef]
- Zhang, L.; Liu, H. Seismic response of clay-pile-raft-superstructure systems subjected to far-field ground motions. Soil Dyn. Earthq. Eng. 2017, 101, 209–224. [Google Scholar] [CrossRef]
- Yamashita, K.; Hamada, J.; Onimaru, S.; Higashino, M. Seismic behavior of piled raft with ground improvement supporting a base-isolated building on soft ground in Tokyo. Soils Found. 2012, 52, 1000–1015. [Google Scholar] [CrossRef] [Green Version]
- Buckman, S. Earthquakes down under: A rare but real hazard. Conversation 2015, 1–4. Available online: http://ro.uow.edu.au/cgi/viewcontent.cgi?article=3576&context=smhpapers (accessed on 5 March 2019).
- Standards Australia. Structural Design Actions Part 4: Earthquake Actions in Australia; Standards Australia International: Sydney, Australia, 2007. [Google Scholar]
- Geoscience Australia. Historic Earthquakes of Australia. Available online: https://geoscience-au.maps.arcgis.com/apps/MapSeries/index.html?appid=72ad590cc9364e41b06907406bb7712e (accessed on 5 March 2019).
- Cho, J.; Lee, J.H.; Jeong, S.; Lee, J. The settlement behavior of piled raft in clay soils. Ocean Eng. 2012, 53, 153–163. [Google Scholar] [CrossRef]
- Alnuaim, A.M.; El Naggar, H.; El Naggar, M.H. Evaluation of Piled Raft Performance Using a Verified 3D Nonlinear Numerical Model. Geotech. Geol. Eng. 2017, 35, 1831–1845. [Google Scholar] [CrossRef]
- Manafpour, A.R.; Moradi, V. Investigating conventional FE modelling for dynamic soil-structure interaction under horizontal and vertical ground motions. In Proceedings of the 15th World Conference on Earthquake Engineering, Lisbon, Portugal, 24–28 September 2012. [Google Scholar]
- Amorosi, A.; Boldini, D.; Elia, G. Parametric study on seismic ground response by finite element modelling. Comput. Geotech. 2010, 37, 515–528. [Google Scholar] [CrossRef]
- Basack, S.; Nimbalkar, S. Numerical solution of single pile subjected to torsional cyclic load. Int. J. Geomech. 2017, 17, 04017016. [Google Scholar] [CrossRef]
- Basack, S.; Nimbalkar, S. Measured and predicted response of pile groups in soft clay subjected to cyclic lateral loading. Int. J. Geomech. 2018, 18, 04018073. [Google Scholar] [CrossRef]
- Engin, H.K.; Brinkgreve, R.B.J. Investigation of pile behavior using embedded piles. In Proceedings of the 17th International Conference on Soil Mechanics and Geotechnical Engineering, Alexandria, Egypt, 5–9 October 2009; pp. 1189–1192. [Google Scholar] [CrossRef]
- Brinkgreve, R.B.J.; Swolfs, W.M.; Engin, E.; Waterman, D.; Chesaru, A.; Bonnier, P.G.; Galavi, V. PLAXIS 2D 2010. Available online: http://plaxis.us/updater/Plaxis%202D/2013.02.16773.4521/files/classic/manuals/english/2D2012-0-Gen-Info.pdf (accessed on 5 March 2019).
- Wulandari, P.S.; Tjandra, D. Analysis of piled raft foundation on soft soil using PLAXIS 2D. Procedia Eng. 2015, 125, 363–367. [Google Scholar] [CrossRef] [Green Version]
- Rowe, R.K.; Liu, K.W. Three-dimensional finite element modelling of a full-scale geosynthetic-reinforced, pile-supported embankment. Can. Geotech. J. 2015, 52, 2041–2054. [Google Scholar] [CrossRef]
- Wang, K.; Zhuang, Y.; Liu, H.; Xiao, H. Multilayered low-strength geogrid-reinforced piled embankment. Geotech. Res. 2018, 5, 231–246. [Google Scholar] [CrossRef] [Green Version]
- GeoNet New Zealand. The New Zealand GeoNet Strong Motion Data Products. Available online: https://www.geonet.org.nz/data/types/strong_motion (accessed on 28 June 2019).
Figure 1.
Historic earthquakes of Australia (data sourced from [22]).
Figure 1.
Historic earthquakes of Australia (data sourced from [22]).

Figure 2.
Geometric model and soil profile of piled raft for (a) case (i), (b) case (iii), and (c) groundwater table (GWT) location in case (i).
Figure 2.
Geometric model and soil profile of piled raft for (a) case (i), (b) case (iii), and (c) groundwater table (GWT) location in case (i).

Figure 3.
Settlement for case (i), (a) discretized mesh, (b) for different GWT positions.
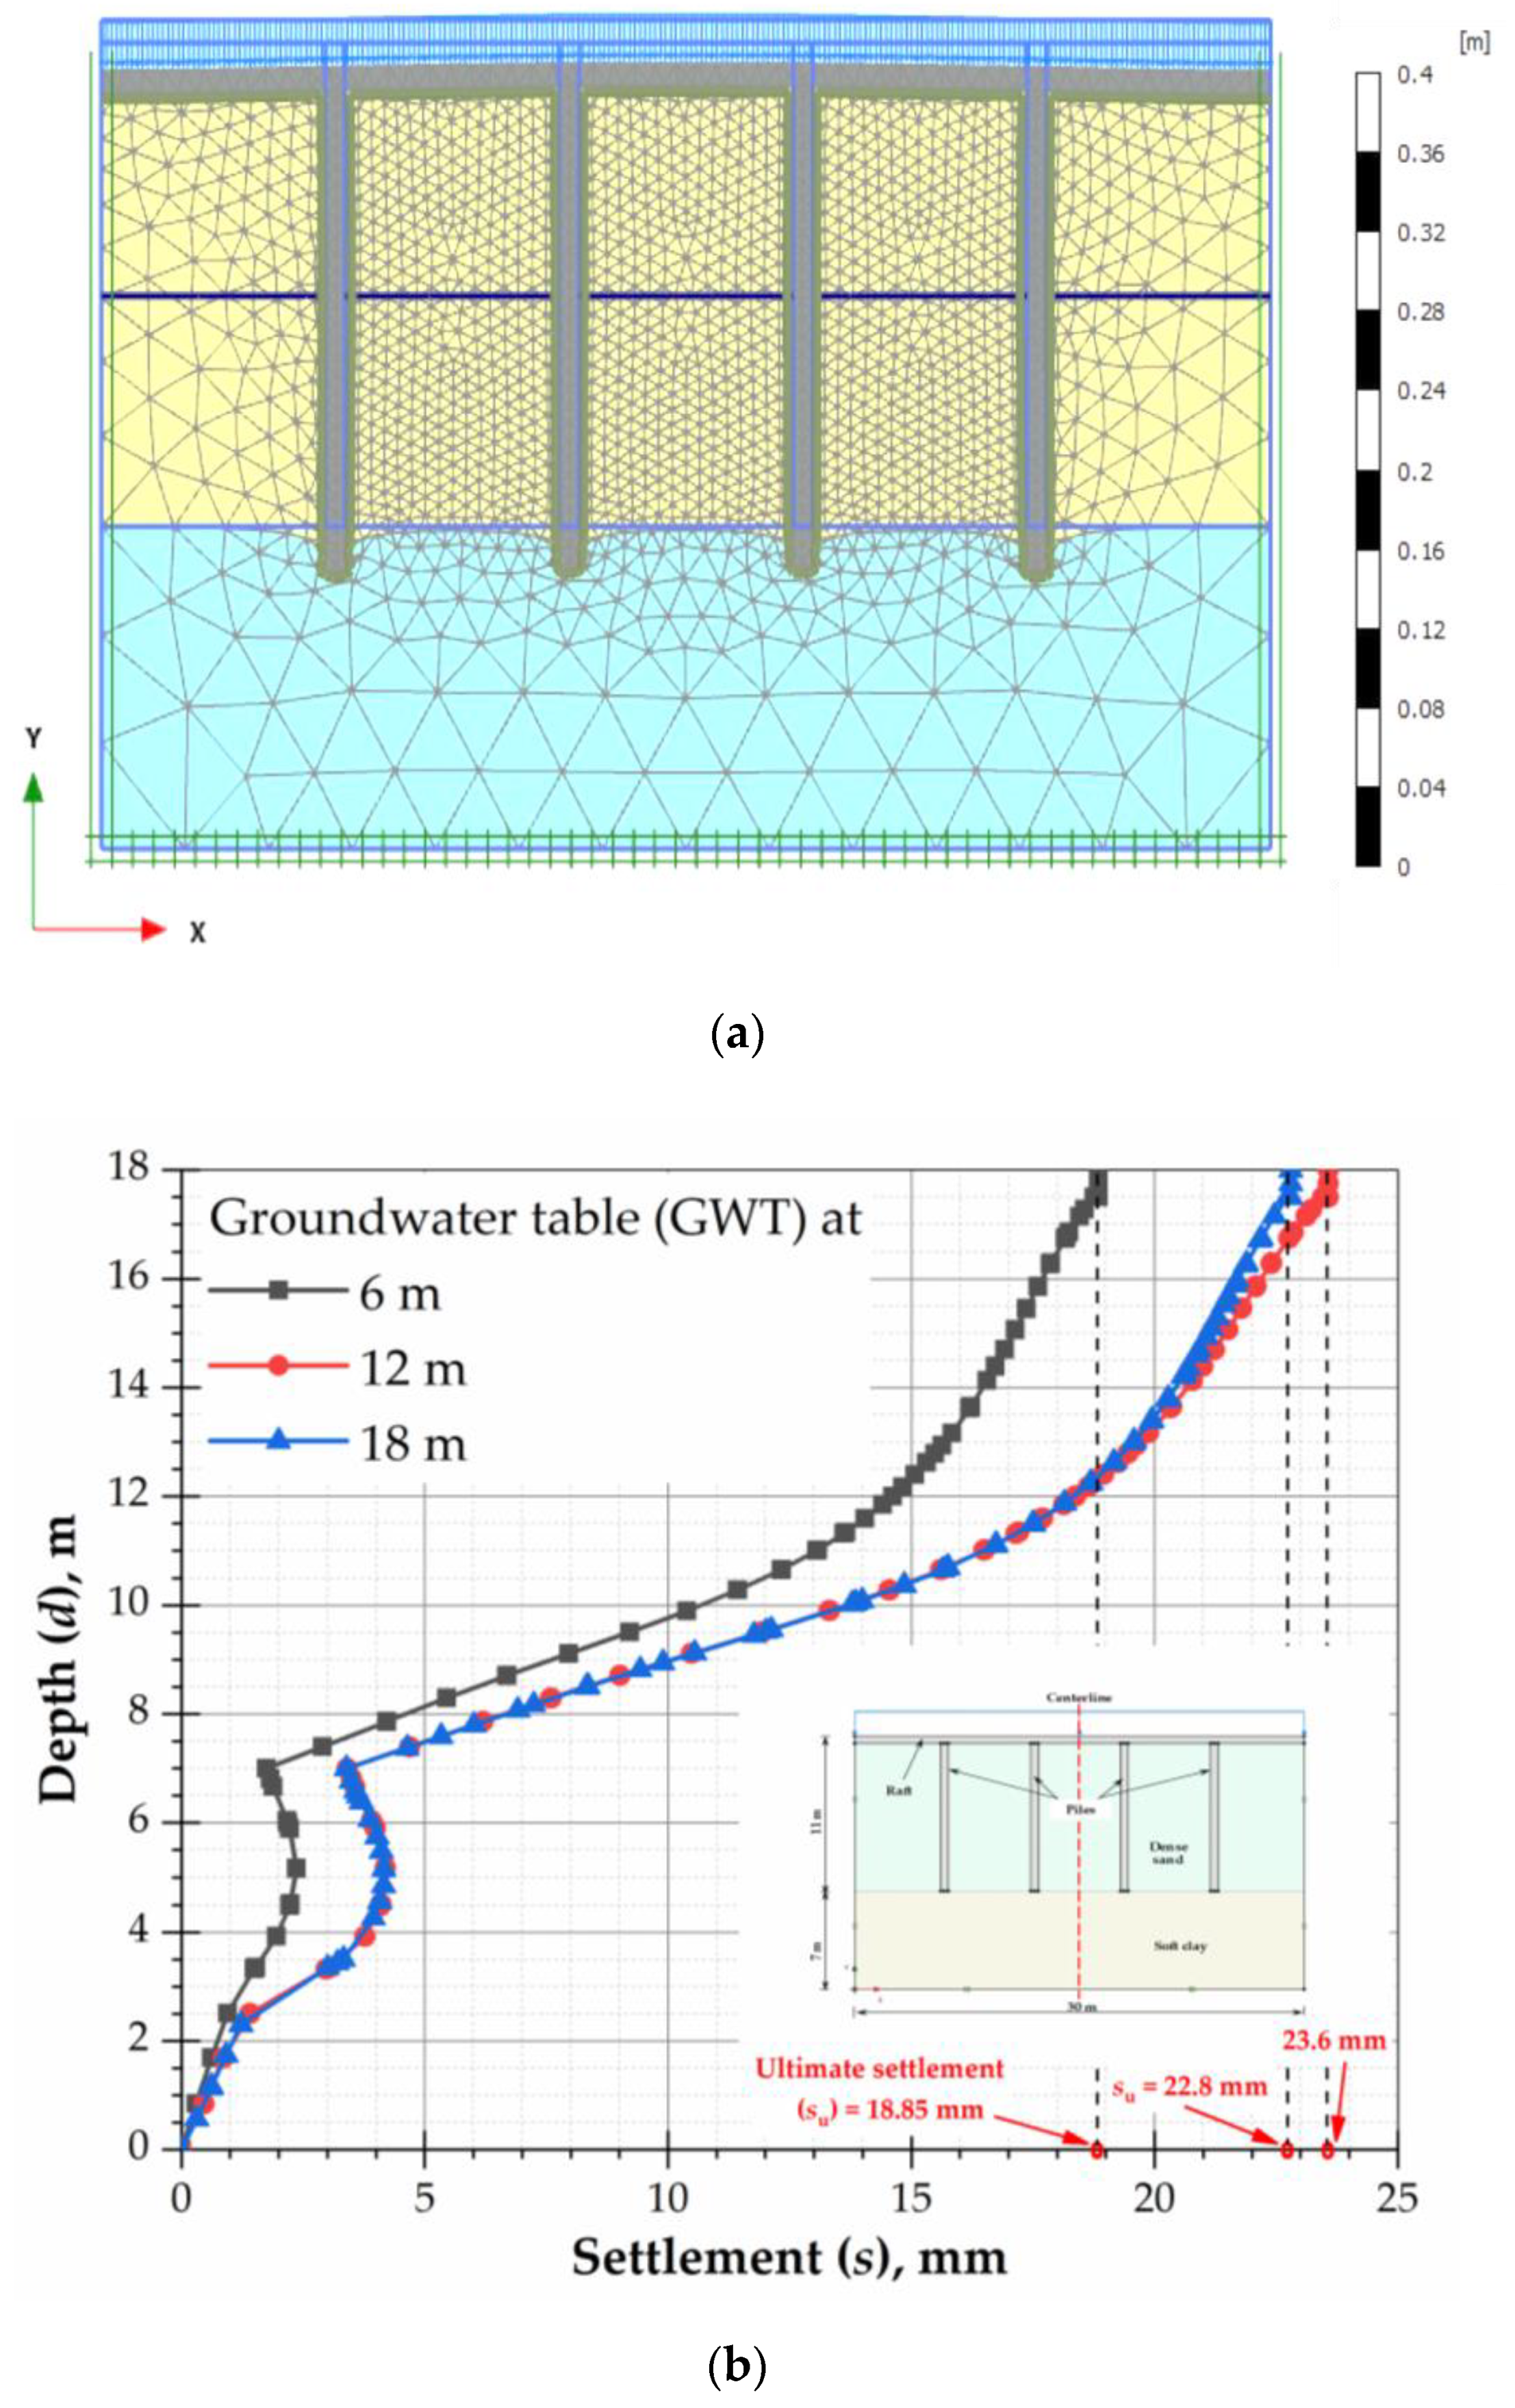
Figure 4.
Settlement for case (ii), for different GWT positions.
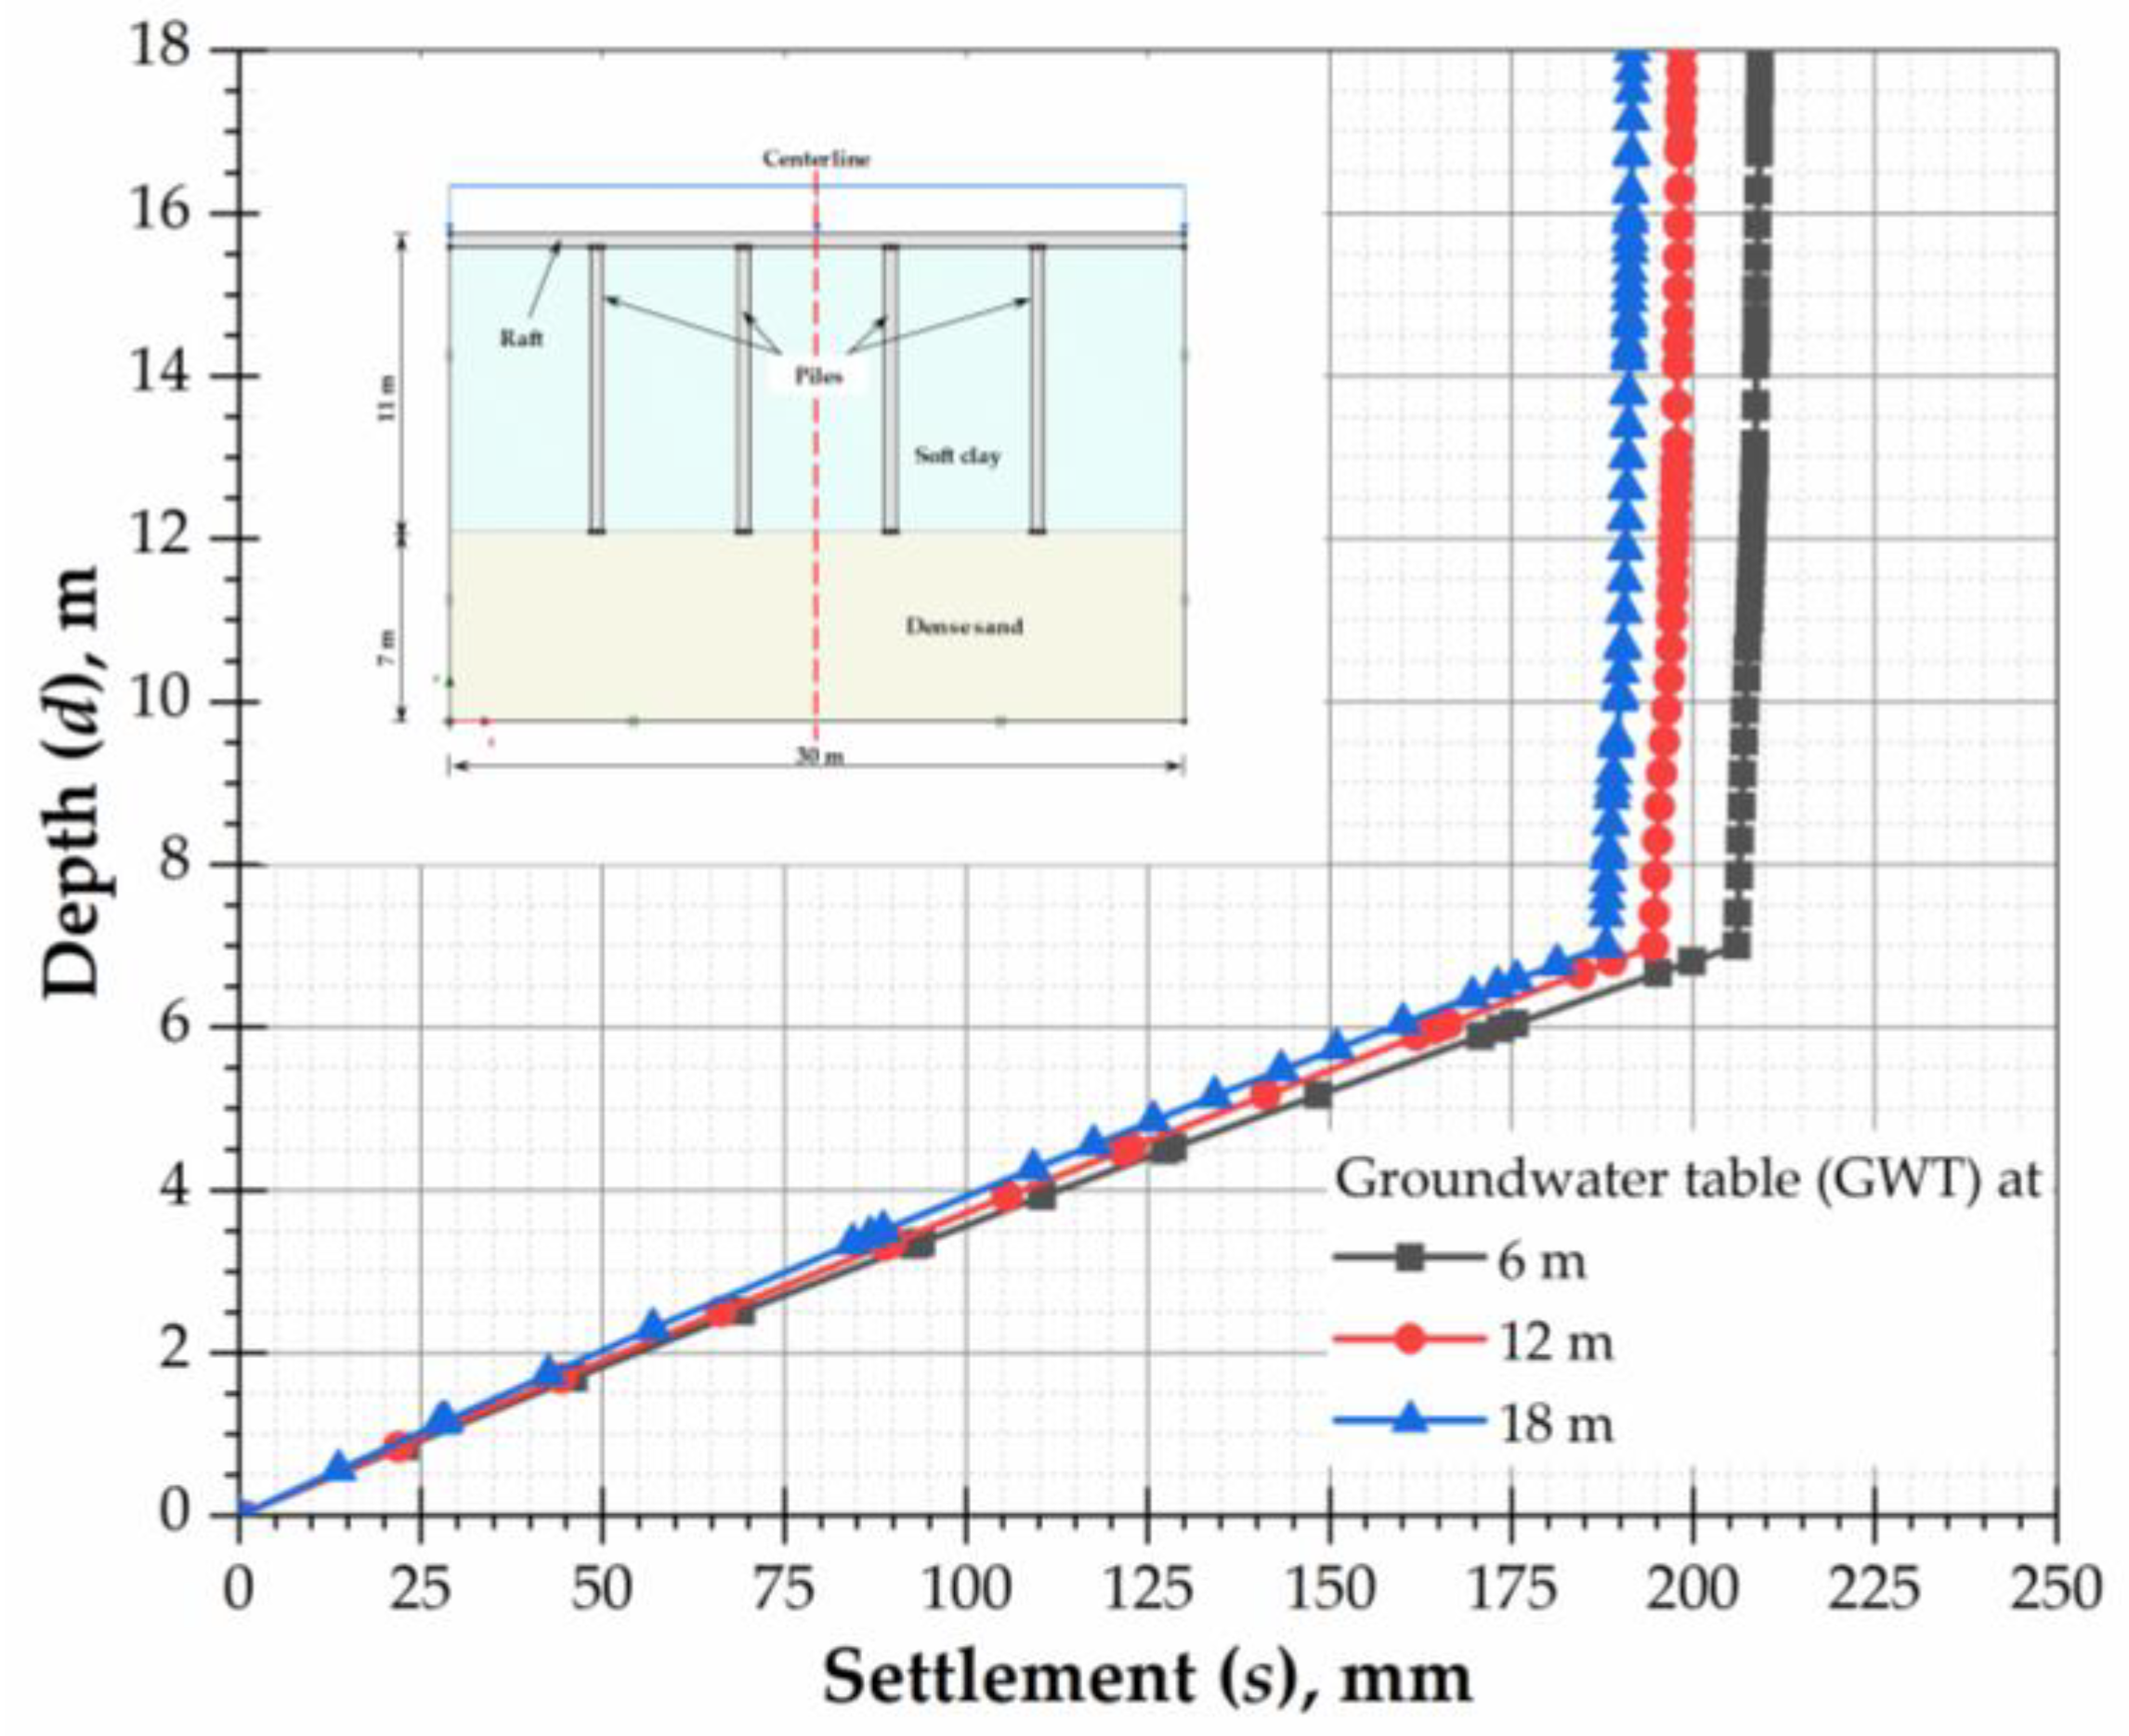
Figure 5.
Settlement for case (iii), for different GW positions.
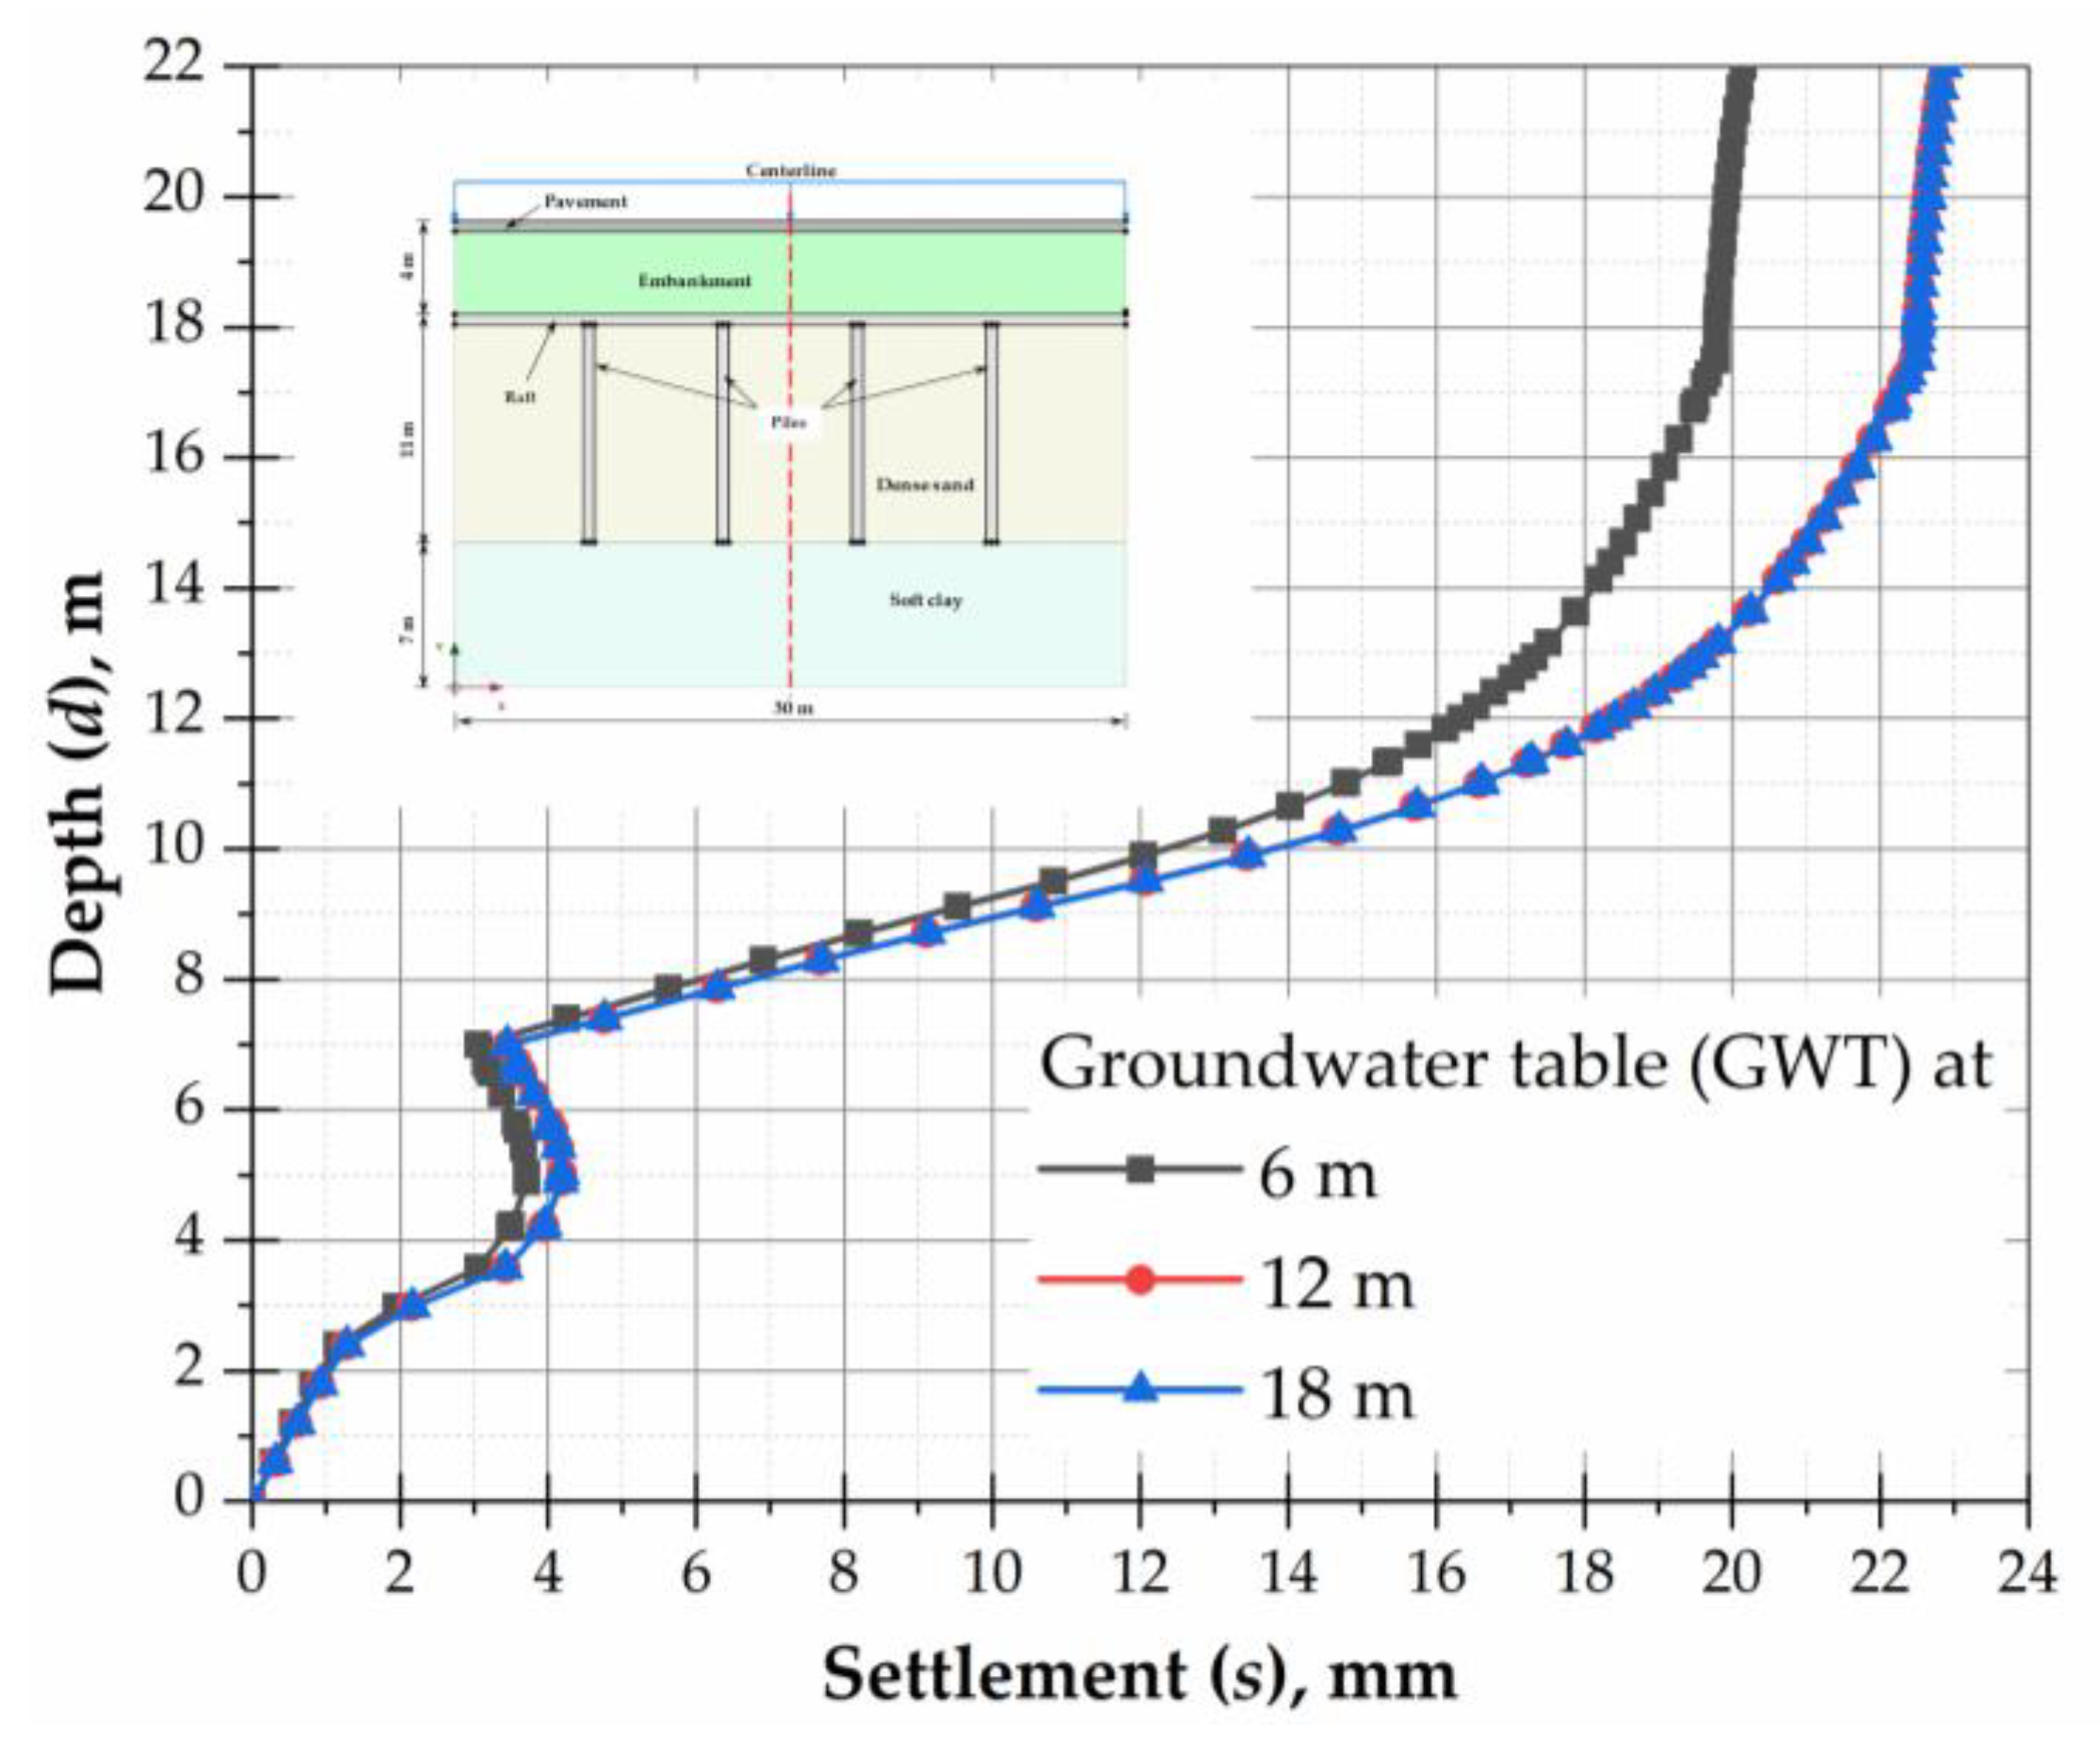
Figure 6.
Variation between the peak stress and the ultimate settlement.

Figure 7.
Influence on ultimate settlement, (su) of (a) raft thickness, (tr) (b) number of piles (Np), and (c) piled raft with and without geotextile.
Figure 7.
Influence on ultimate settlement, (su) of (a) raft thickness, (tr) (b) number of piles (Np), and (c) piled raft with and without geotextile.

Figure 8.
Acceleration-time history used in this study (data sourced from [34]).
Figure 8.
Acceleration-time history used in this study (data sourced from [34]).

Figure 9.
Piled raft model considering case (i) for seismic response analysis.
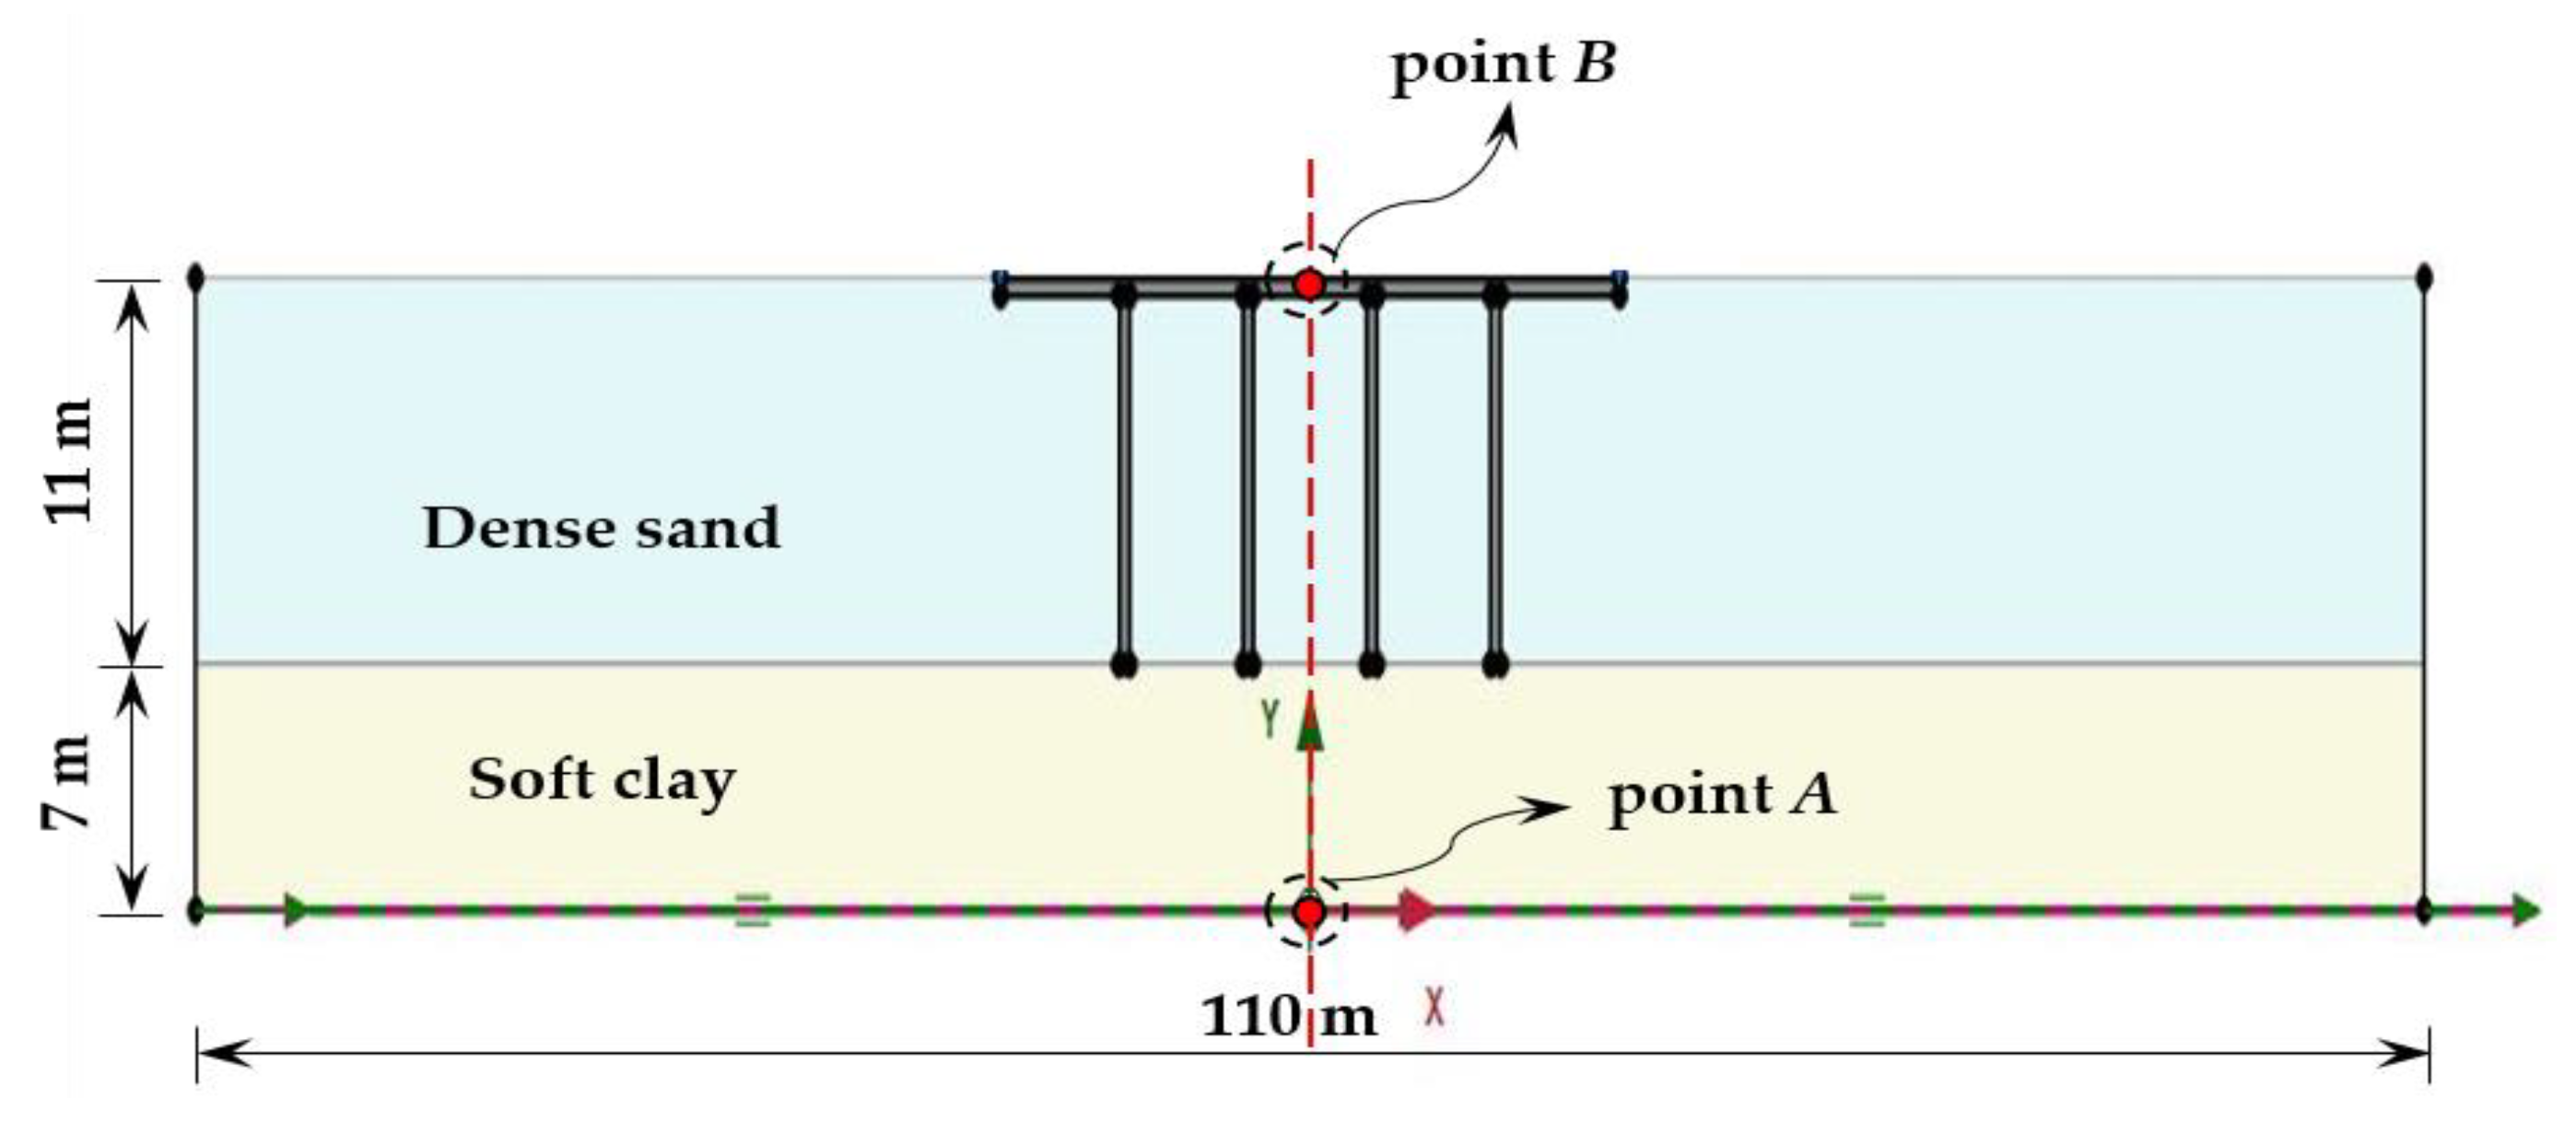
Figure 10.
(a) Time history curve, and (b) response spectrum; for GWT at 6 m.
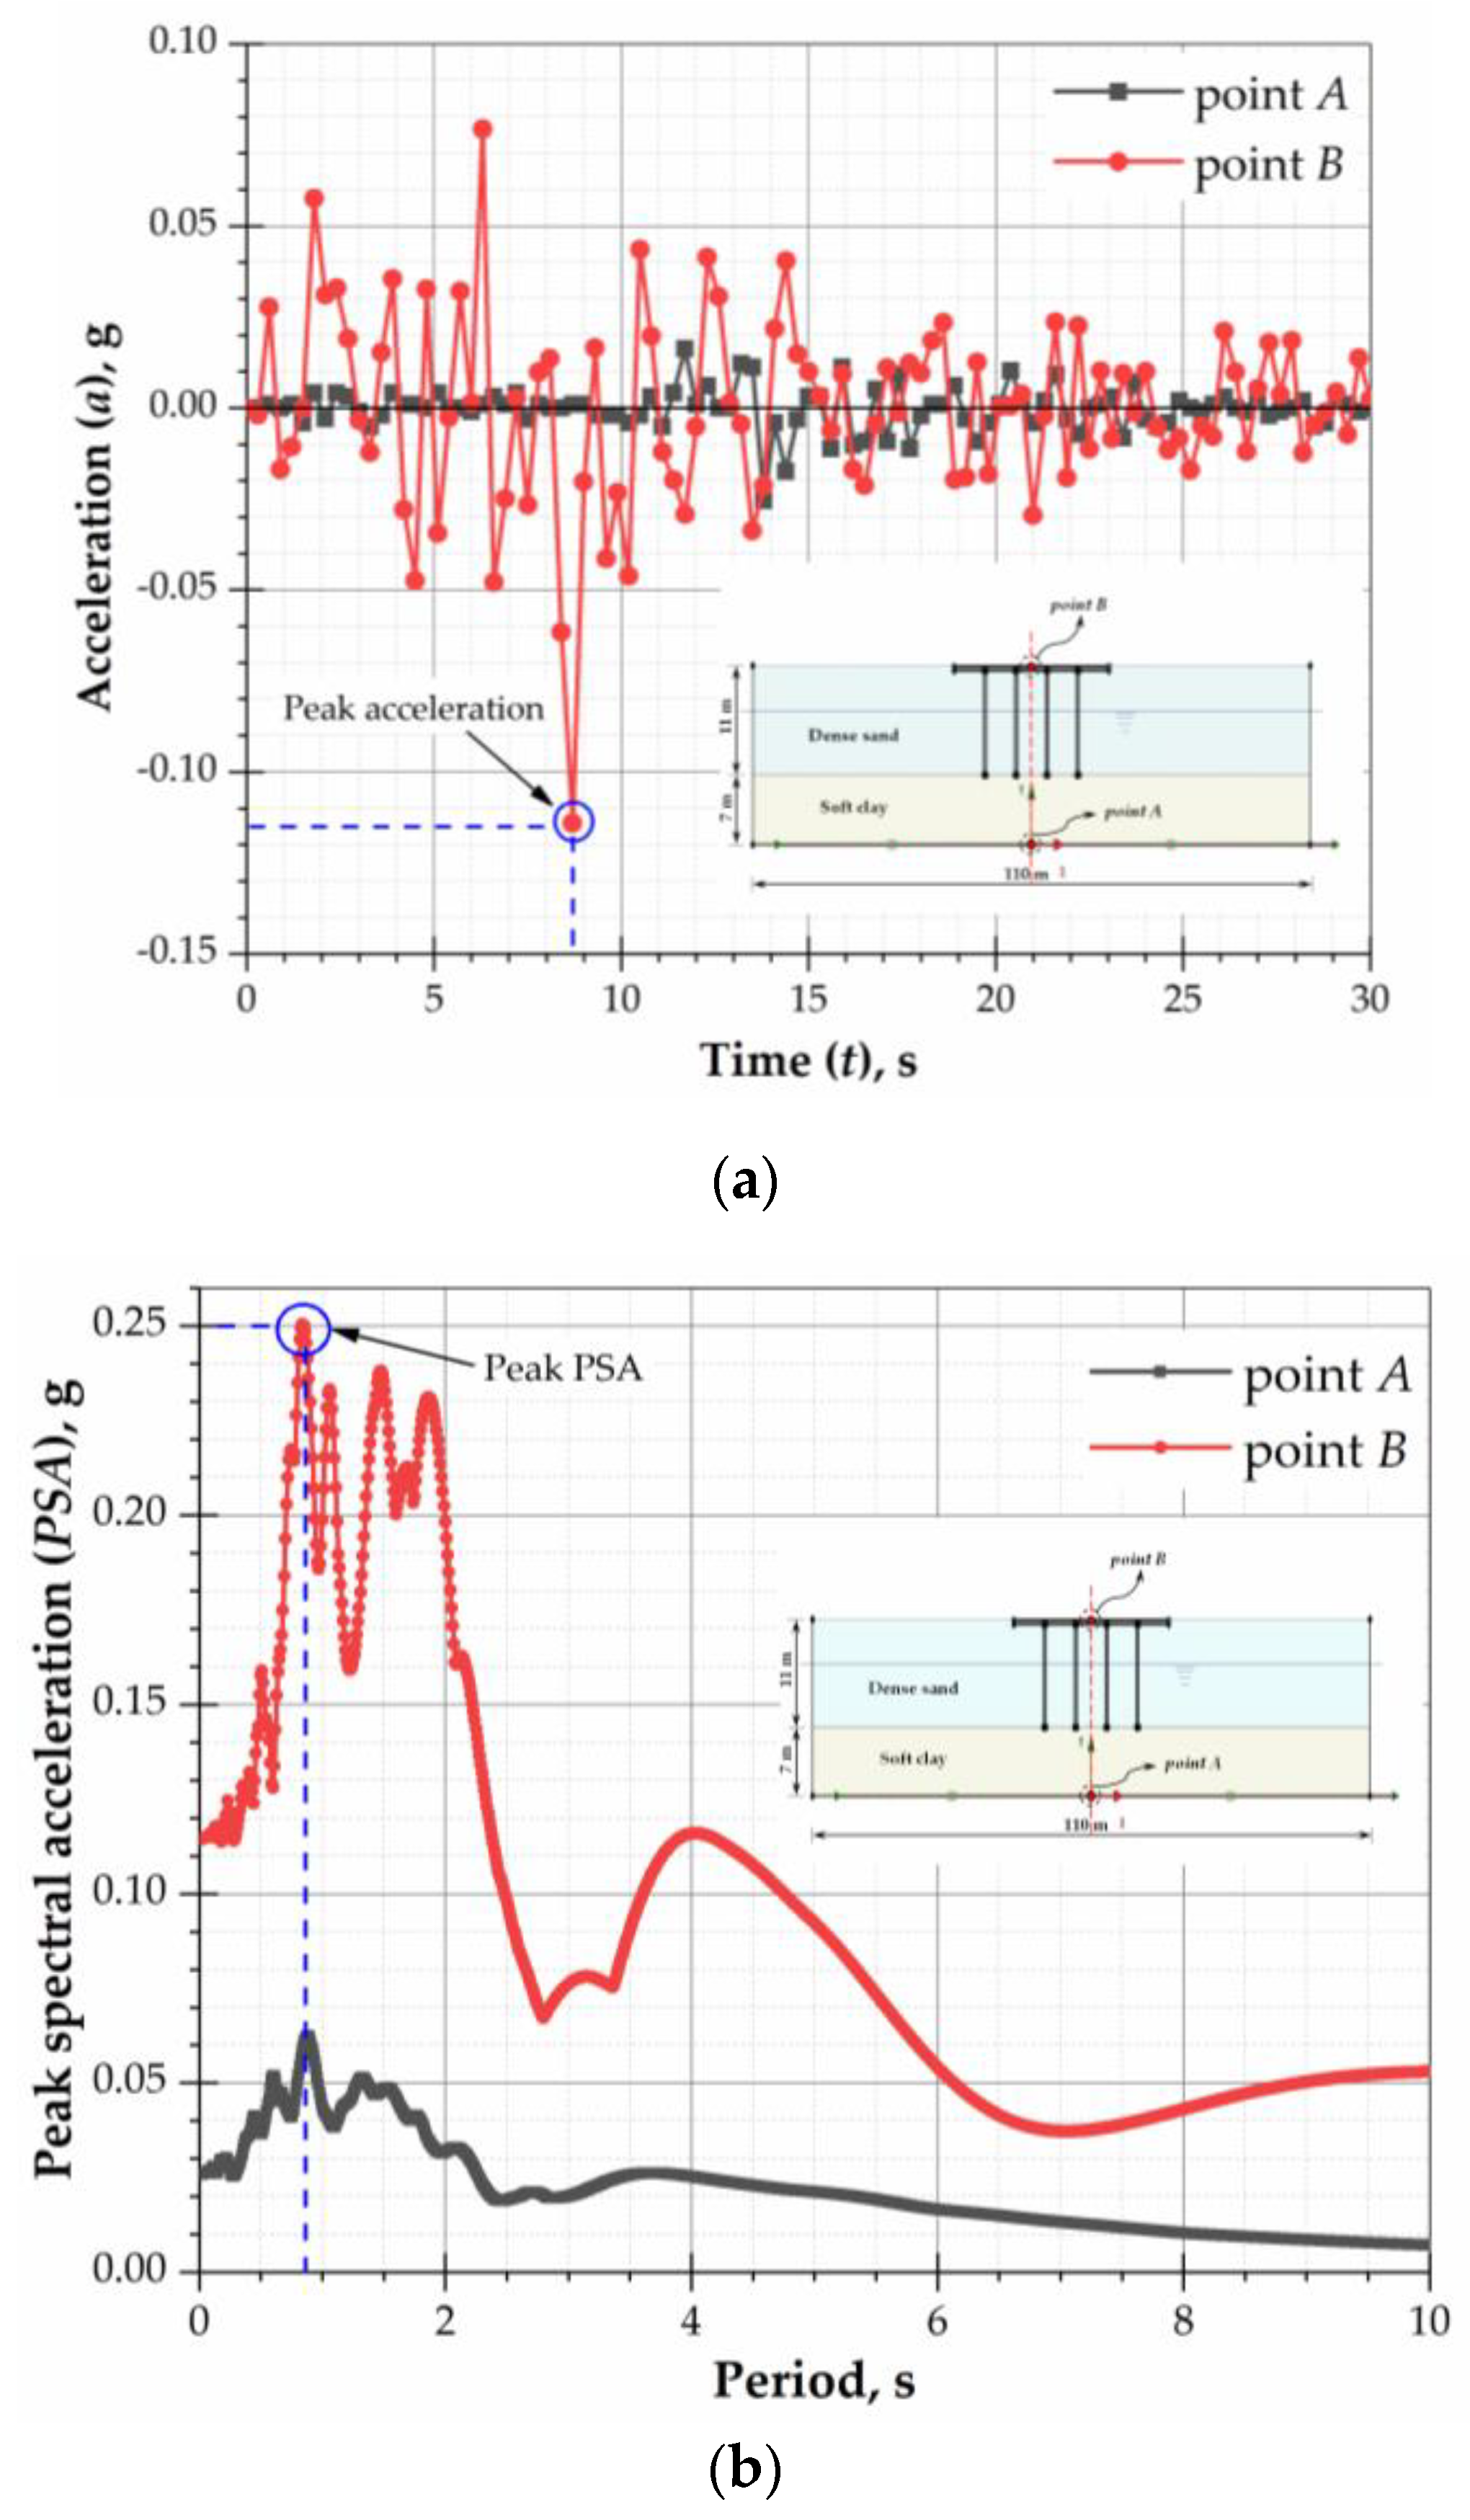
Figure 11.
(a) Time history curve, and (b) spectral response acceleration; at point B for different GWT.
Figure 11.
(a) Time history curve, and (b) spectral response acceleration; at point B for different GWT.

Table 1.
Seismic events in Australia and territories (data sourced from [22]).
Table 1.
Seismic events in Australia and territories (data sourced from [22]).
| Location No. | Year | Location | State | Magnitude (M) |
|---|---|---|---|---|
| 1. | 2016 | Petermann Ranges | Northern Territory | 6.1 |
| 2. | 2015 | Offshore East of Fraser Island | Queensland | 5.4 |
| 3. | 2012 | Moe | Victoria | 5.4 |
| 4. | 2011 | Near Bowen | Queensland | 7.1 |
| 5. | 2010 | Kalgoorlie | Western Australia | 5.0 |
| 6. | 2000 | Boolarra South | Victoria | 5.0 |
| 7. | 1997 | Collier Bay | Western Australia | 6.2 |
| 8. | 1989 | Newcastle | New South Wales | 5.4 |
| 9. | 1988 | Tennant Creek | Northern Territory | 6.6 |
| 10. | 1979 | Cadoux | Western Australia | 6.1 |
| 11. | 1968 | Meckering | Western Australia | 6.5 |
| 12. | 1954 | Adelaide | South Australia | 5.4 |
| 13. | 1946 | Offshore East of Flinders Island | Tasmania | 5.8 |
| 14. | 1941 | Meeberrie | Western Australia | 6.3 |
| 15. | 1934 | Gunning | New South Wales | 5.6 |
| 16. | 1918 | Offshore Gladstone | Queensland | 6.0 |
| 17. | 1902 | Warooka | South Australia | 6.0 |
| 18. | 1897 | Offshore Beachport | South Australia | 6.5 |
| 19. | 1892 | Tasman Sea NE | Tasmania | 6.9 |
| 20. | 1885 | Tasman Sea | Tasmania | 6.8 |
| Parameter | Clay | Sand | Embankment | Piled-Raft | Pavement Base |
|---|---|---|---|---|---|
| Material Model | HS Small | HS Small | Hardening Soil | Linear elastic | Linear elastic |
| Drainage Type | Drained | Drained | Drained | Non-porous | Non-porous |
| Soil unit weight above phreatic level, γunsat (kN/m3) | 16 | 20 | 16 | 24 | 15 |
| Soil unit weight below phreatic level, γsat (kN/m3) | 18 | 20 | 19 | - | - |
| Young modulus at reference level, E’ (kN/m2) | - | - | - | 3 × 10⁷ | 3 × 10⁷ |
| Secant stiffness in standard drained triaxial test, E50ref (kN/m2) | 2.0 × 10⁴ | 3.0 × 10⁴ | 2.5 × 10⁴ | - | - |
| Tangent stiffness for primary oedometer loading, Eoedref (kN/m2) | 2.6 × 10⁴ | 3.6 × 10⁴ | 2.5 × 10⁴ | - | - |
| Unloading/reloading stiffness, Eurref (kN/m2) | 9.5 × 10⁴ | 1.1 × 10⁵ | 7.5 × 10⁴ | - | - |
| Power for stress-level dependency of stiffness, m | 0.5 | 0.5 | 0.5 | - | - |
| Poisson’s ratio, ν‘ | 0.2 | 0.2 | 0.2 | 0.1 | 0.1 |
| Friction angle, φ’ (deg) | 18 | 30 | 30 | - | - |
| Cohesion, c’ref (kN/m2) | 10 | 5 | 1 | - | |
| Shear strain at which Gs = 0.7Go, γ0.7 | 1.2 × 10⁻⁴ | 1.5 × 10⁻⁴ | - | - | - |
| Shear modulus at very small strains, Goref (kN/m2) | 2.7 × 10⁵ | 1.0 × 10⁵ | - | - | - |
Table 3.
FE predicted values of peak stress, maximum strain and ultimate settlement.
| Case | GWT at | Peak Stress, σmax (kPa) | Maximum Strain, εmax (%) | Ultimate Settlement, su (mm) |
|---|---|---|---|---|
| Case (i) | 6 m | 263.45 | 2.15 | 18.85 |
| 12 m | 289.55 | 3.75 | 23.58 | |
| 18 m | 305.21 | 4.52 | 22.80 | |
| Case (ii) | 6 m | 254.43 | 0.31 | 20.92 |
| 12 m | 375.95 | 0.37 | 19.85 | |
| 18 m | 394.24 | 0.42 | 19.17 | |
| Case (iii) | 6 m | 511.19 | 0.44 | 20.15 |
| 12 m | 520.21 | 0.45 | 22.85 | |
| 18 m | 570.85 | 0.44 | 22.87 | |
| Case (iv) | 6 m | 489.57 | 0.24 | 20.15 |
| 12 m | 519.12 | 0.27 | 22.85 | |
| 18 m | 549.43 | 0.30 | 22.87 |
© 2019 by the authors. Licensee MDPI, Basel, Switzerland. This article is an open access article distributed under the terms and conditions of the Creative Commons Attribution (CC BY) license (http://creativecommons.org/licenses/by/4.0/).
Share and Cite
MDPI and ACS Style
Meena, N.K.; Nimbalkar, S. Effect of Water Drawdown and Dynamic Loads on Piled Raft: Two-Dimensional Finite Element Approach. Infrastructures 2019, 4, 75. https://doi.org/10.3390/infrastructures4040075
AMA Style
Meena NK, Nimbalkar S. Effect of Water Drawdown and Dynamic Loads on Piled Raft: Two-Dimensional Finite Element Approach. Infrastructures. 2019; 4(4):75. https://doi.org/10.3390/infrastructures4040075
Chicago/Turabian StyleMeena, Naveen Kumar, and Sanjay Nimbalkar. 2019. "Effect of Water Drawdown and Dynamic Loads on Piled Raft: Two-Dimensional Finite Element Approach" Infrastructures 4, no. 4: 75. https://doi.org/10.3390/infrastructures4040075