One-Dimensional Modelling of a Trilateral Flash Cycle System with Two-Phase Twin-Screw Expanders for Industrial Low-Grade Heat to Power Conversion


Abstract
:1. Introduction
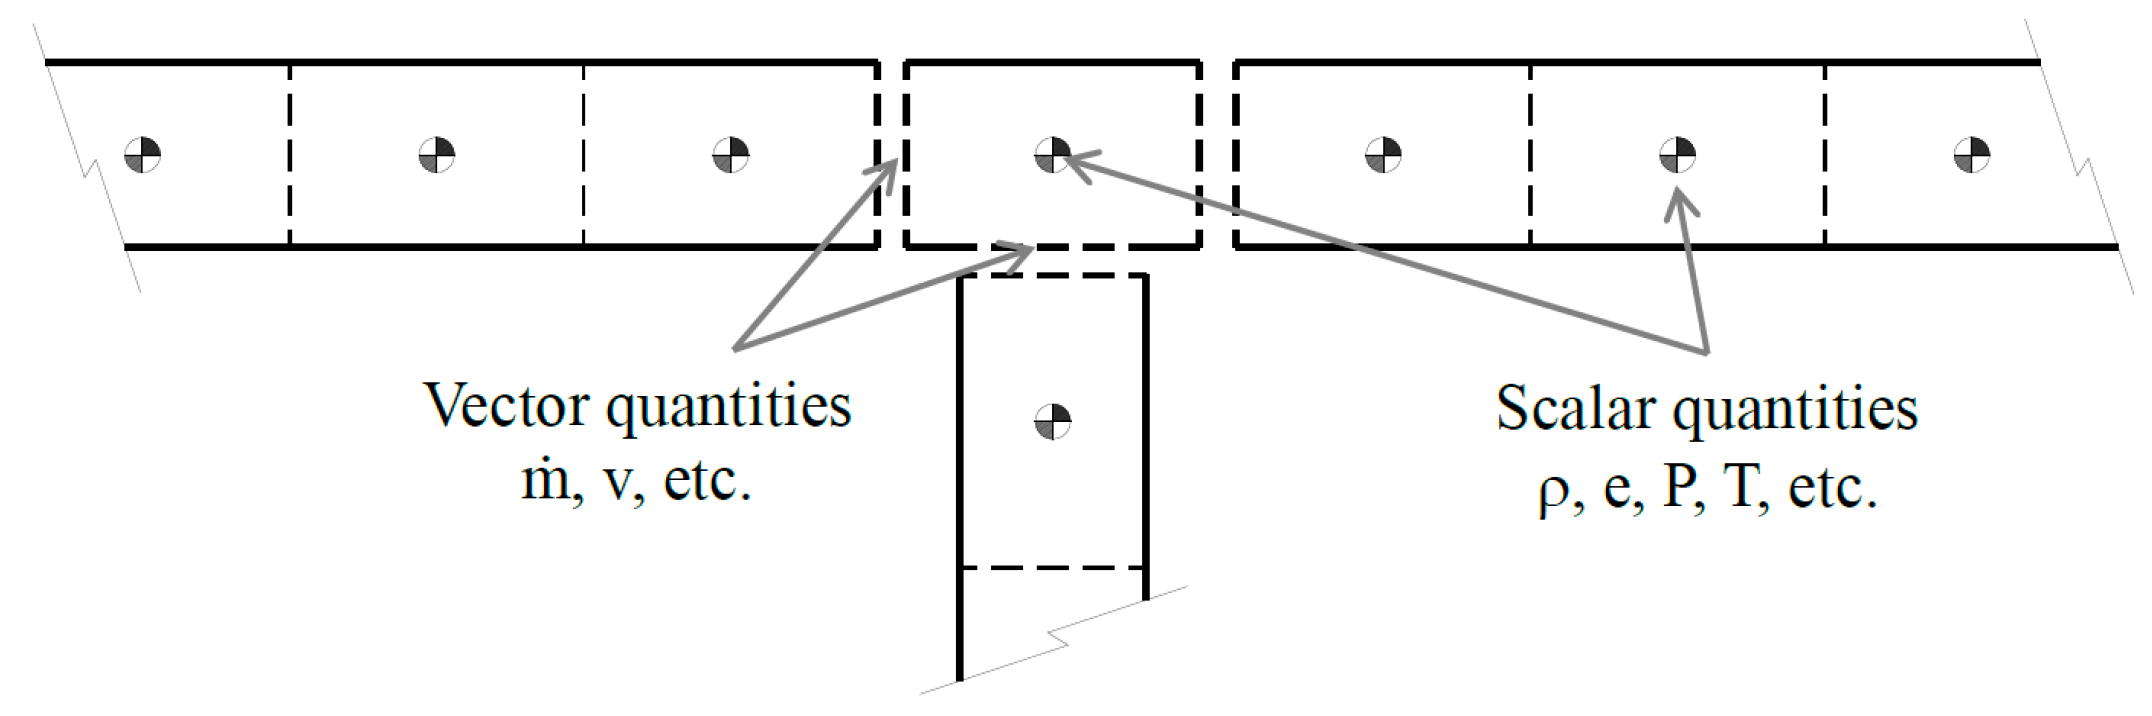
2. Modelling Theory
3. Modelling of Energy Conversion Systems Based on Bottoming Thermodynamic Cycles
3.1. Modelling of Dynamic and Positive Displacement Machines
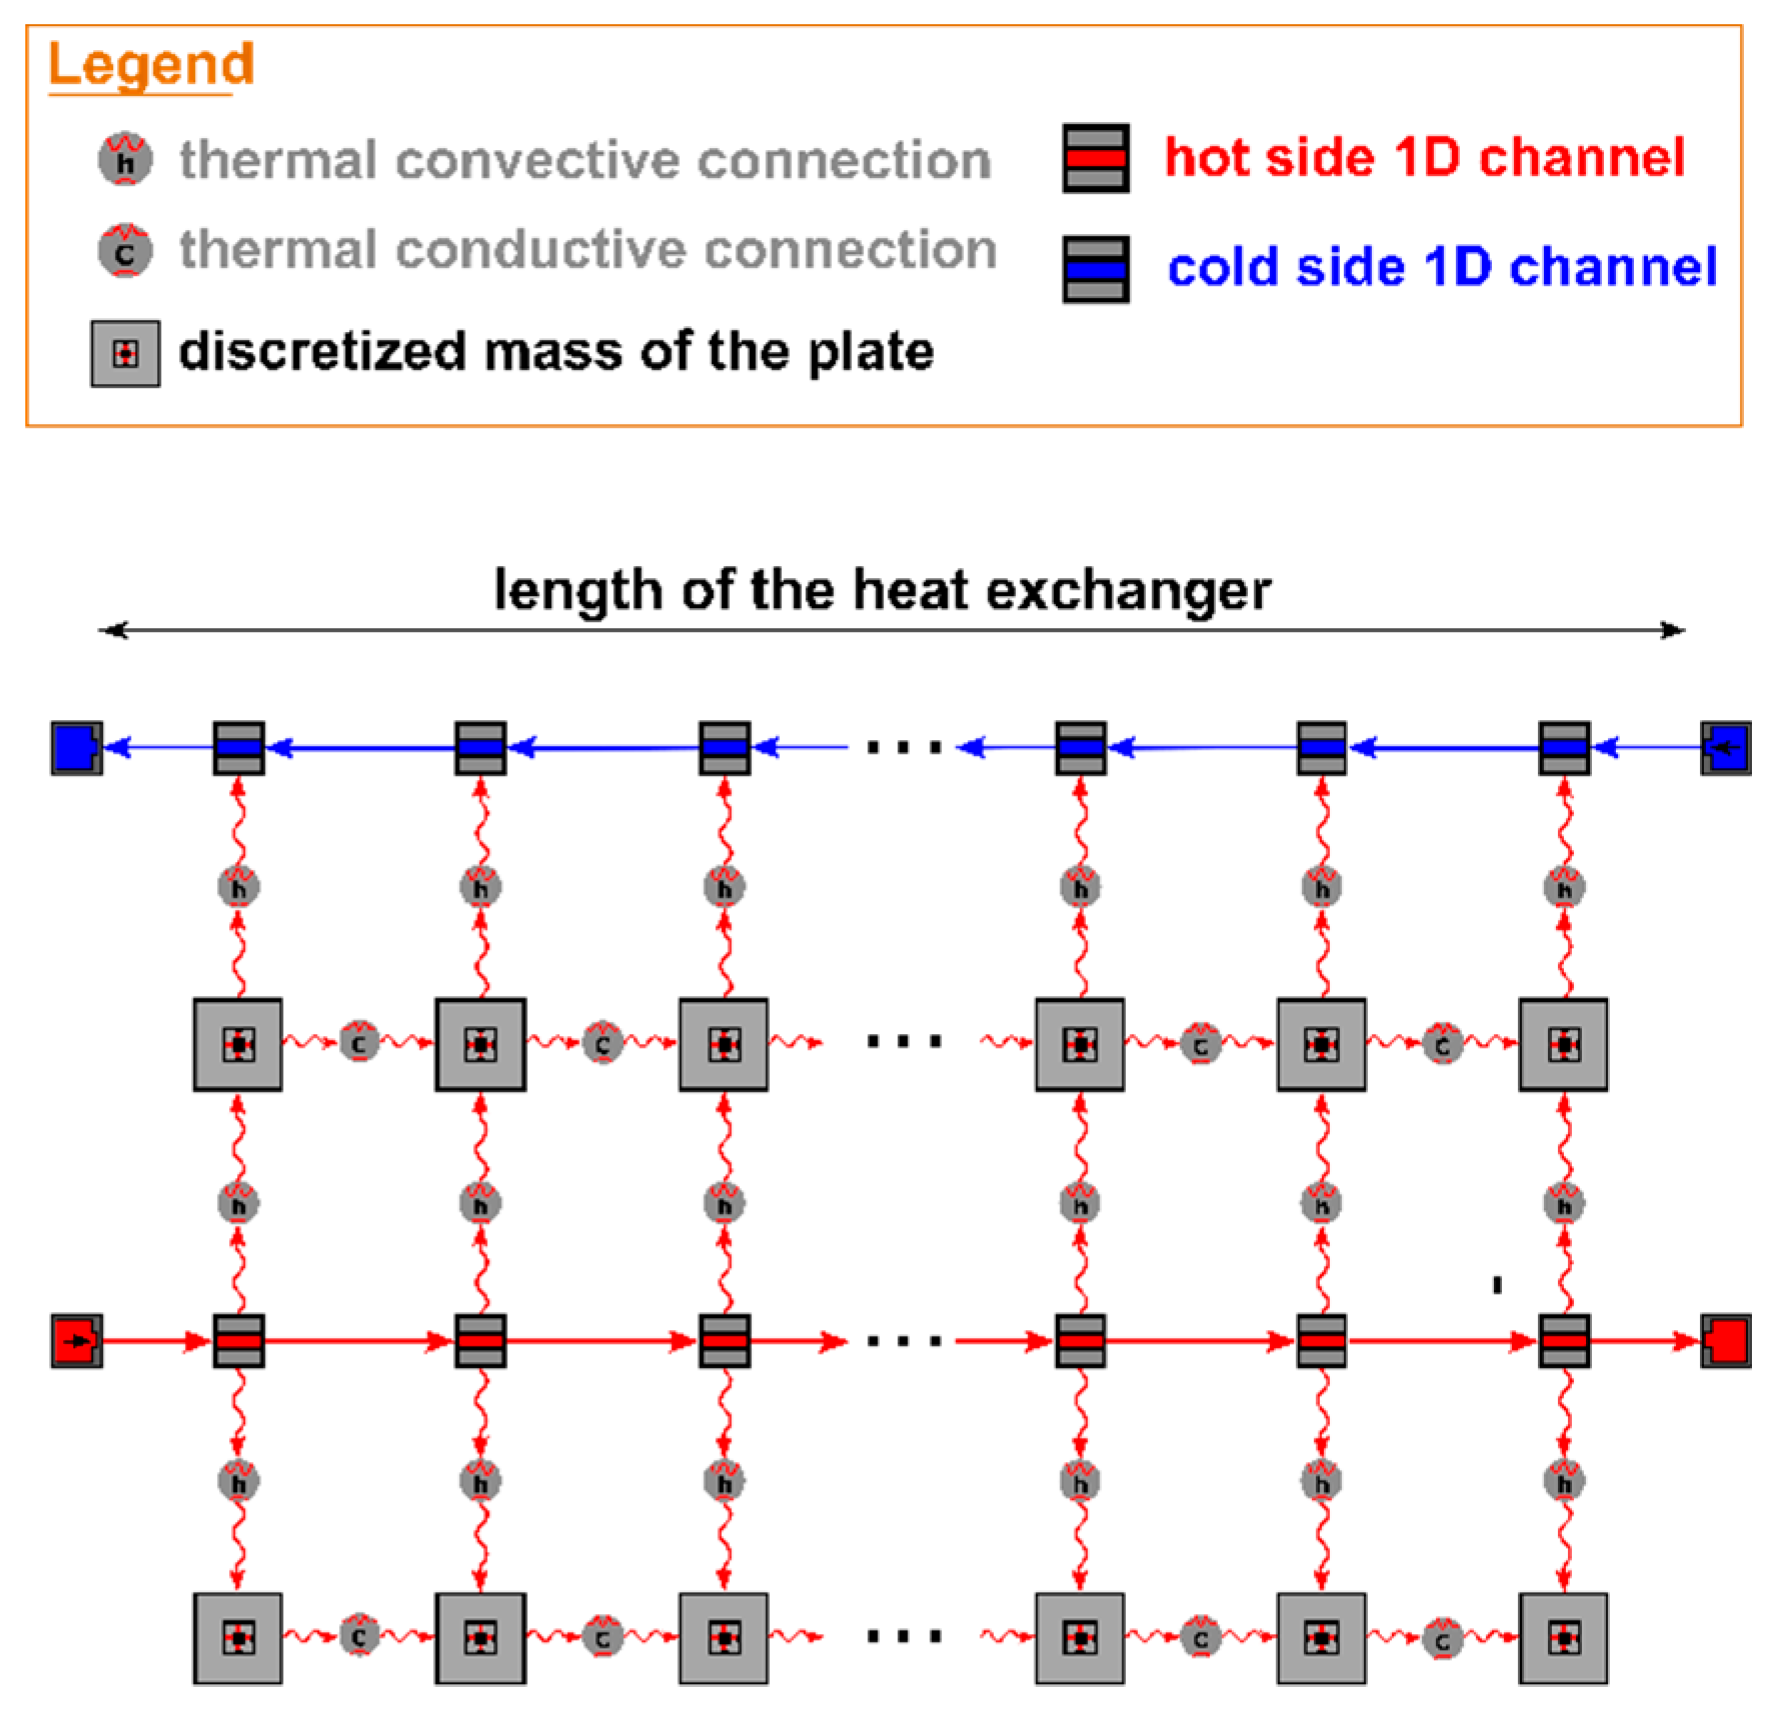
3.2. Heat Exchangers
3.3. Pipes, Valves, and System Auxiliaries
4. Results and Discussion
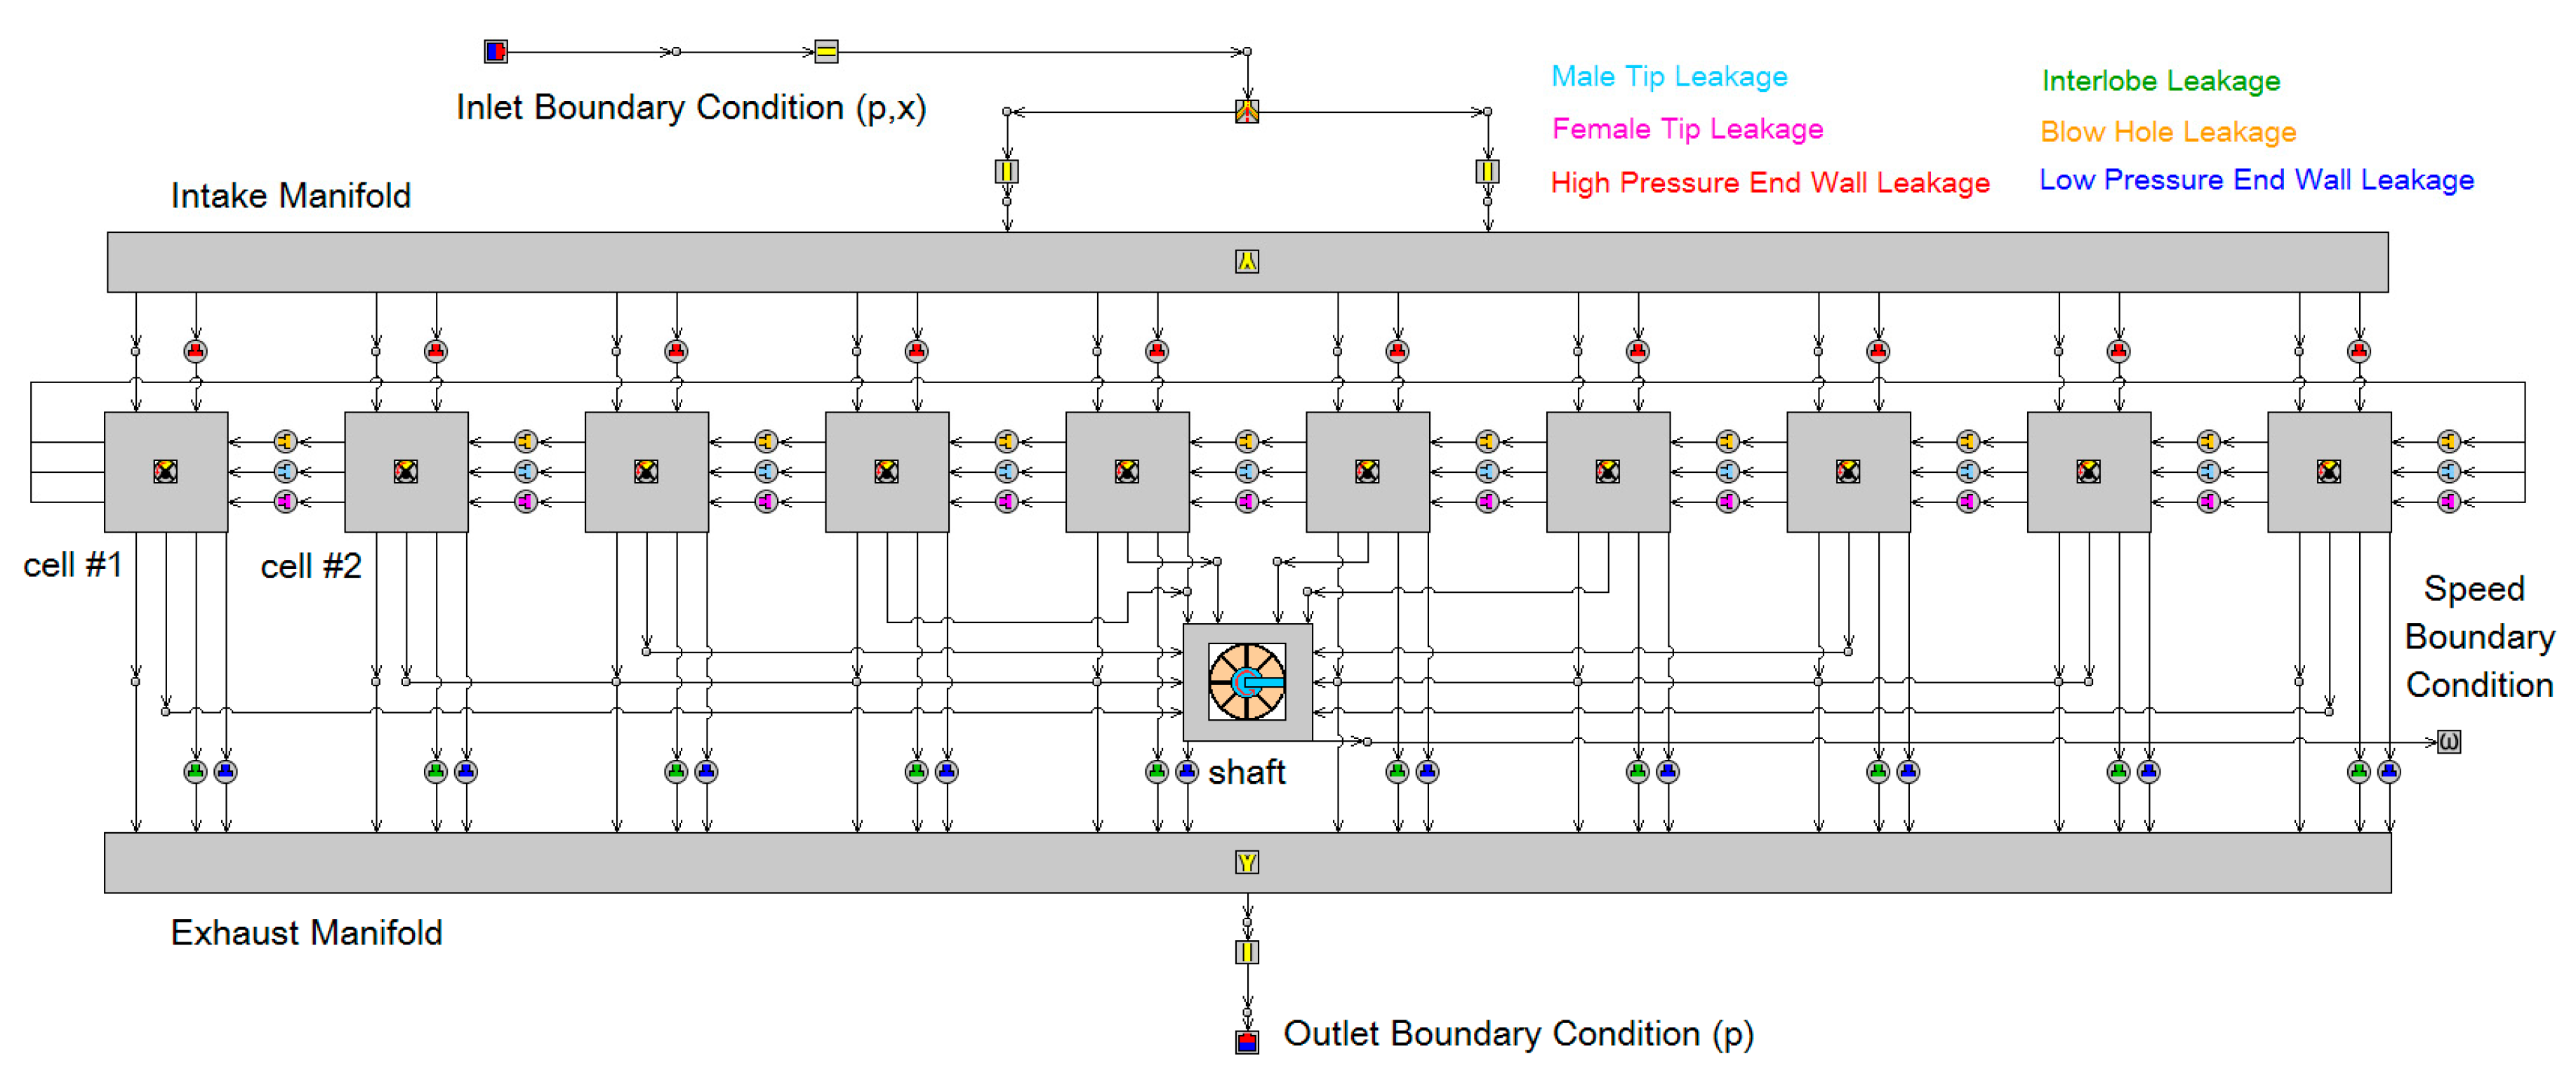
4.1. Twin-Screw Two-Phase Expander
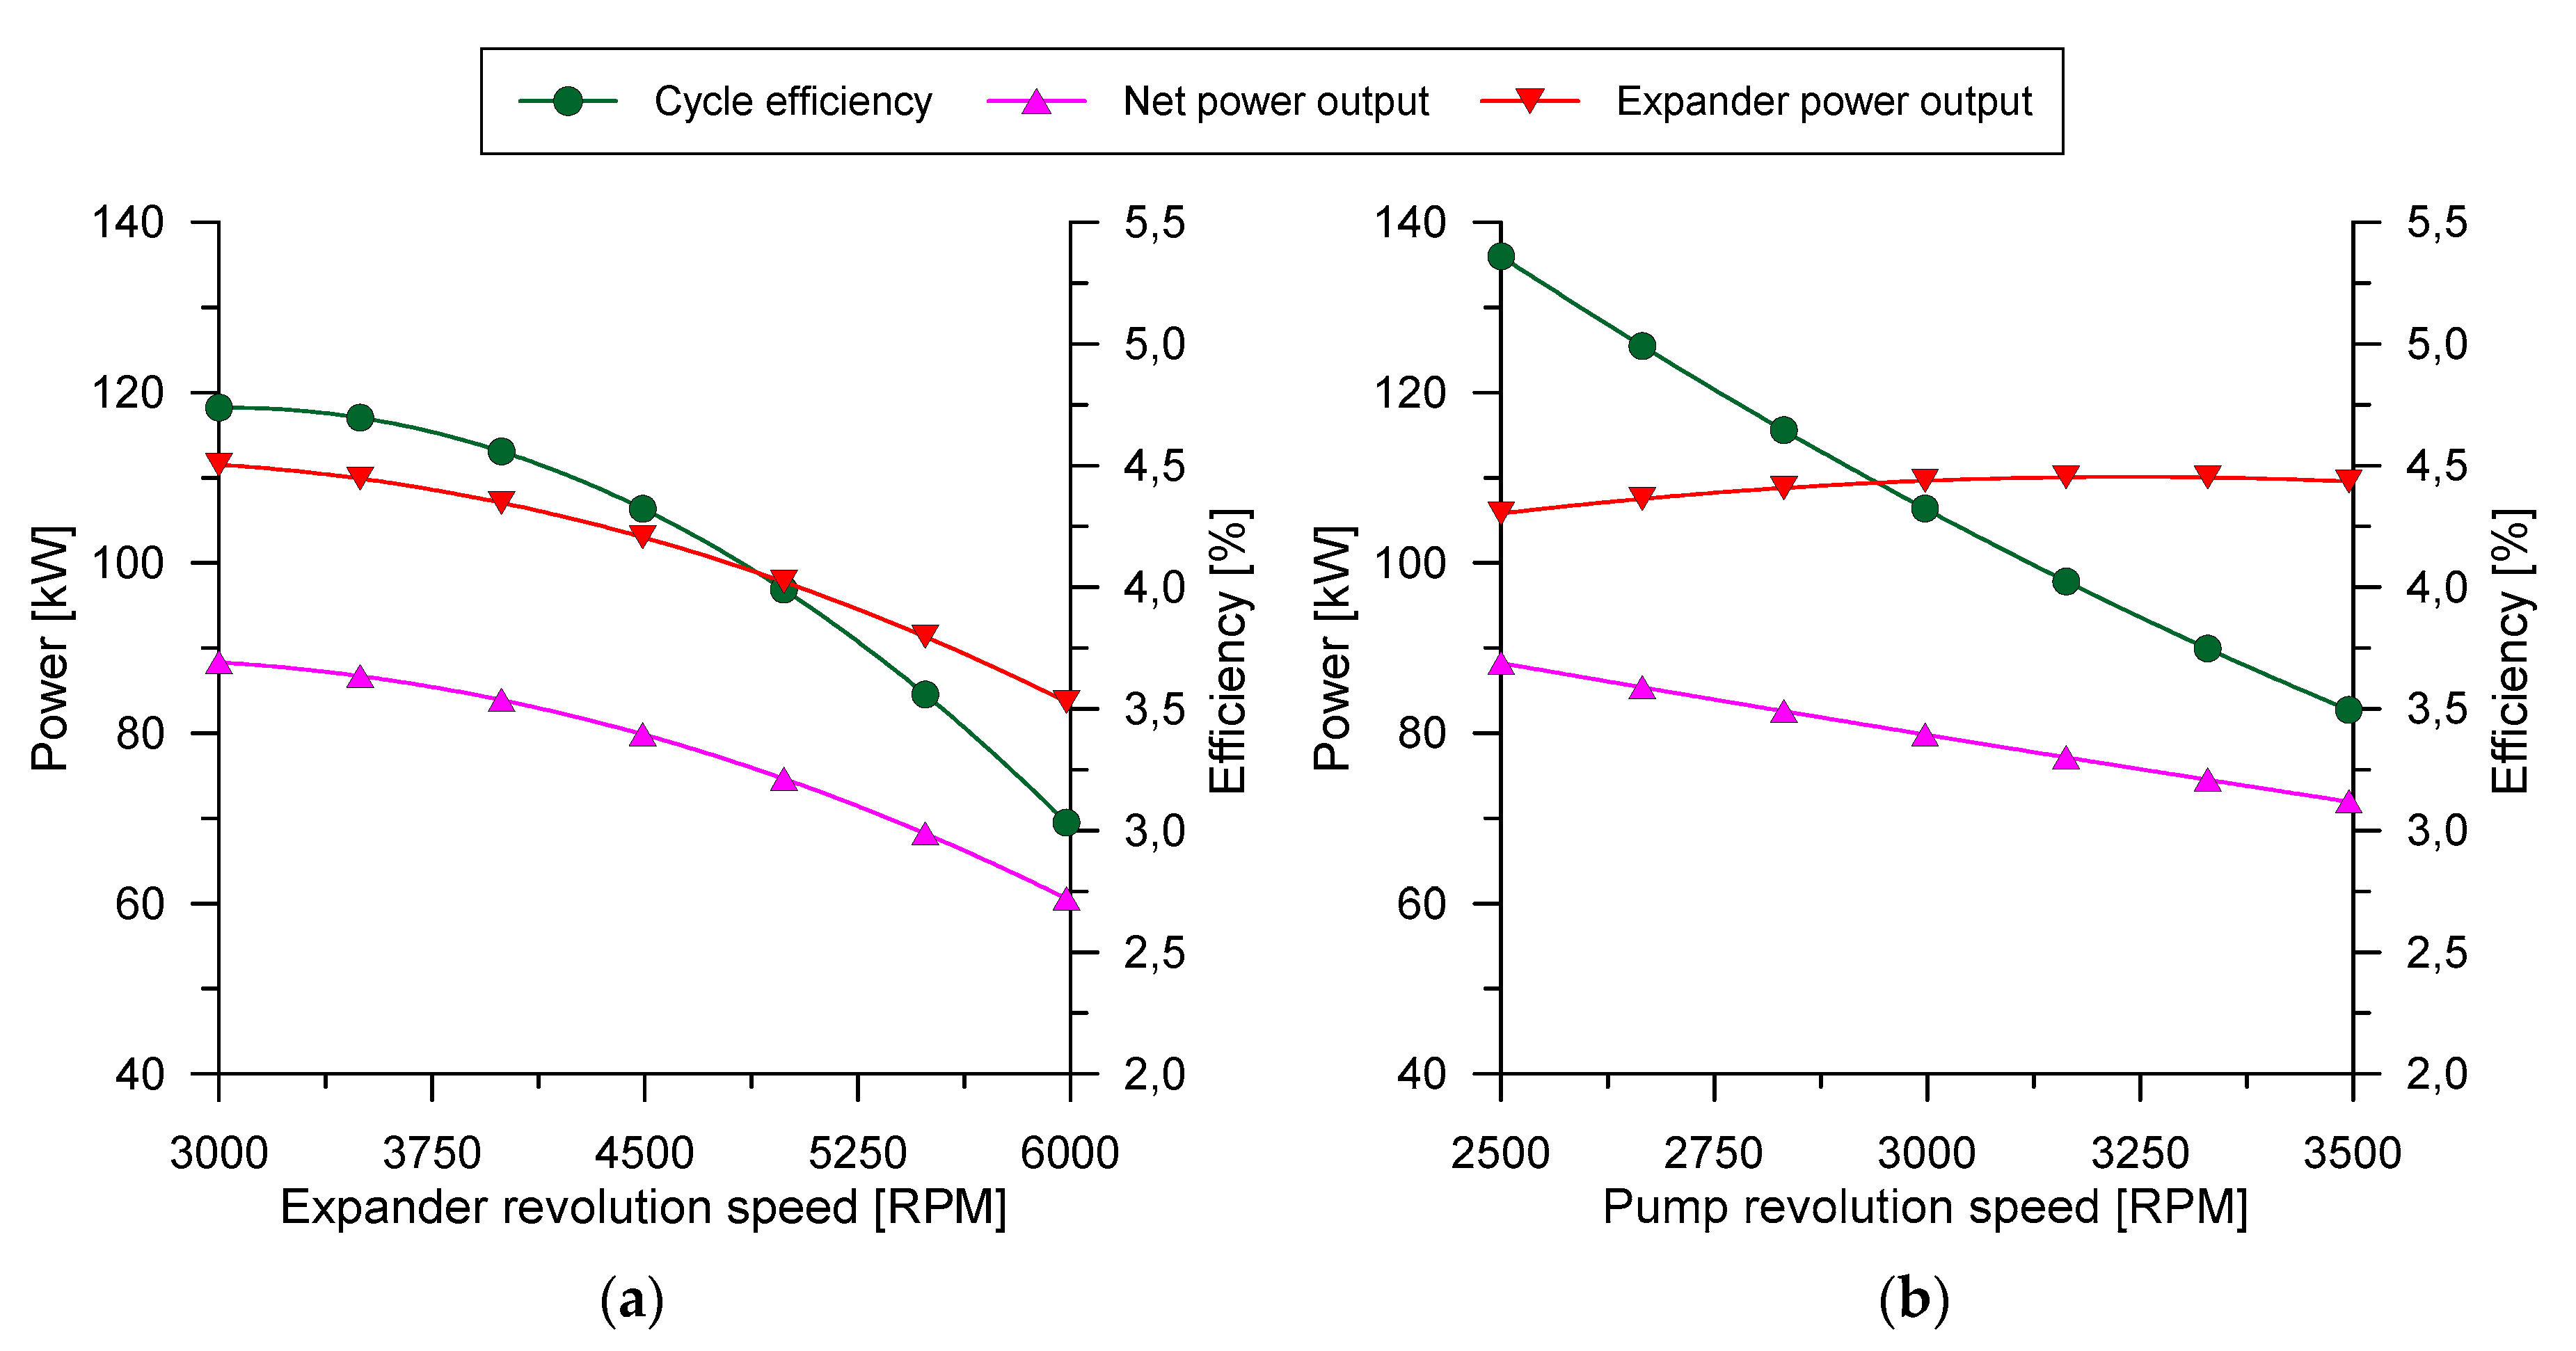
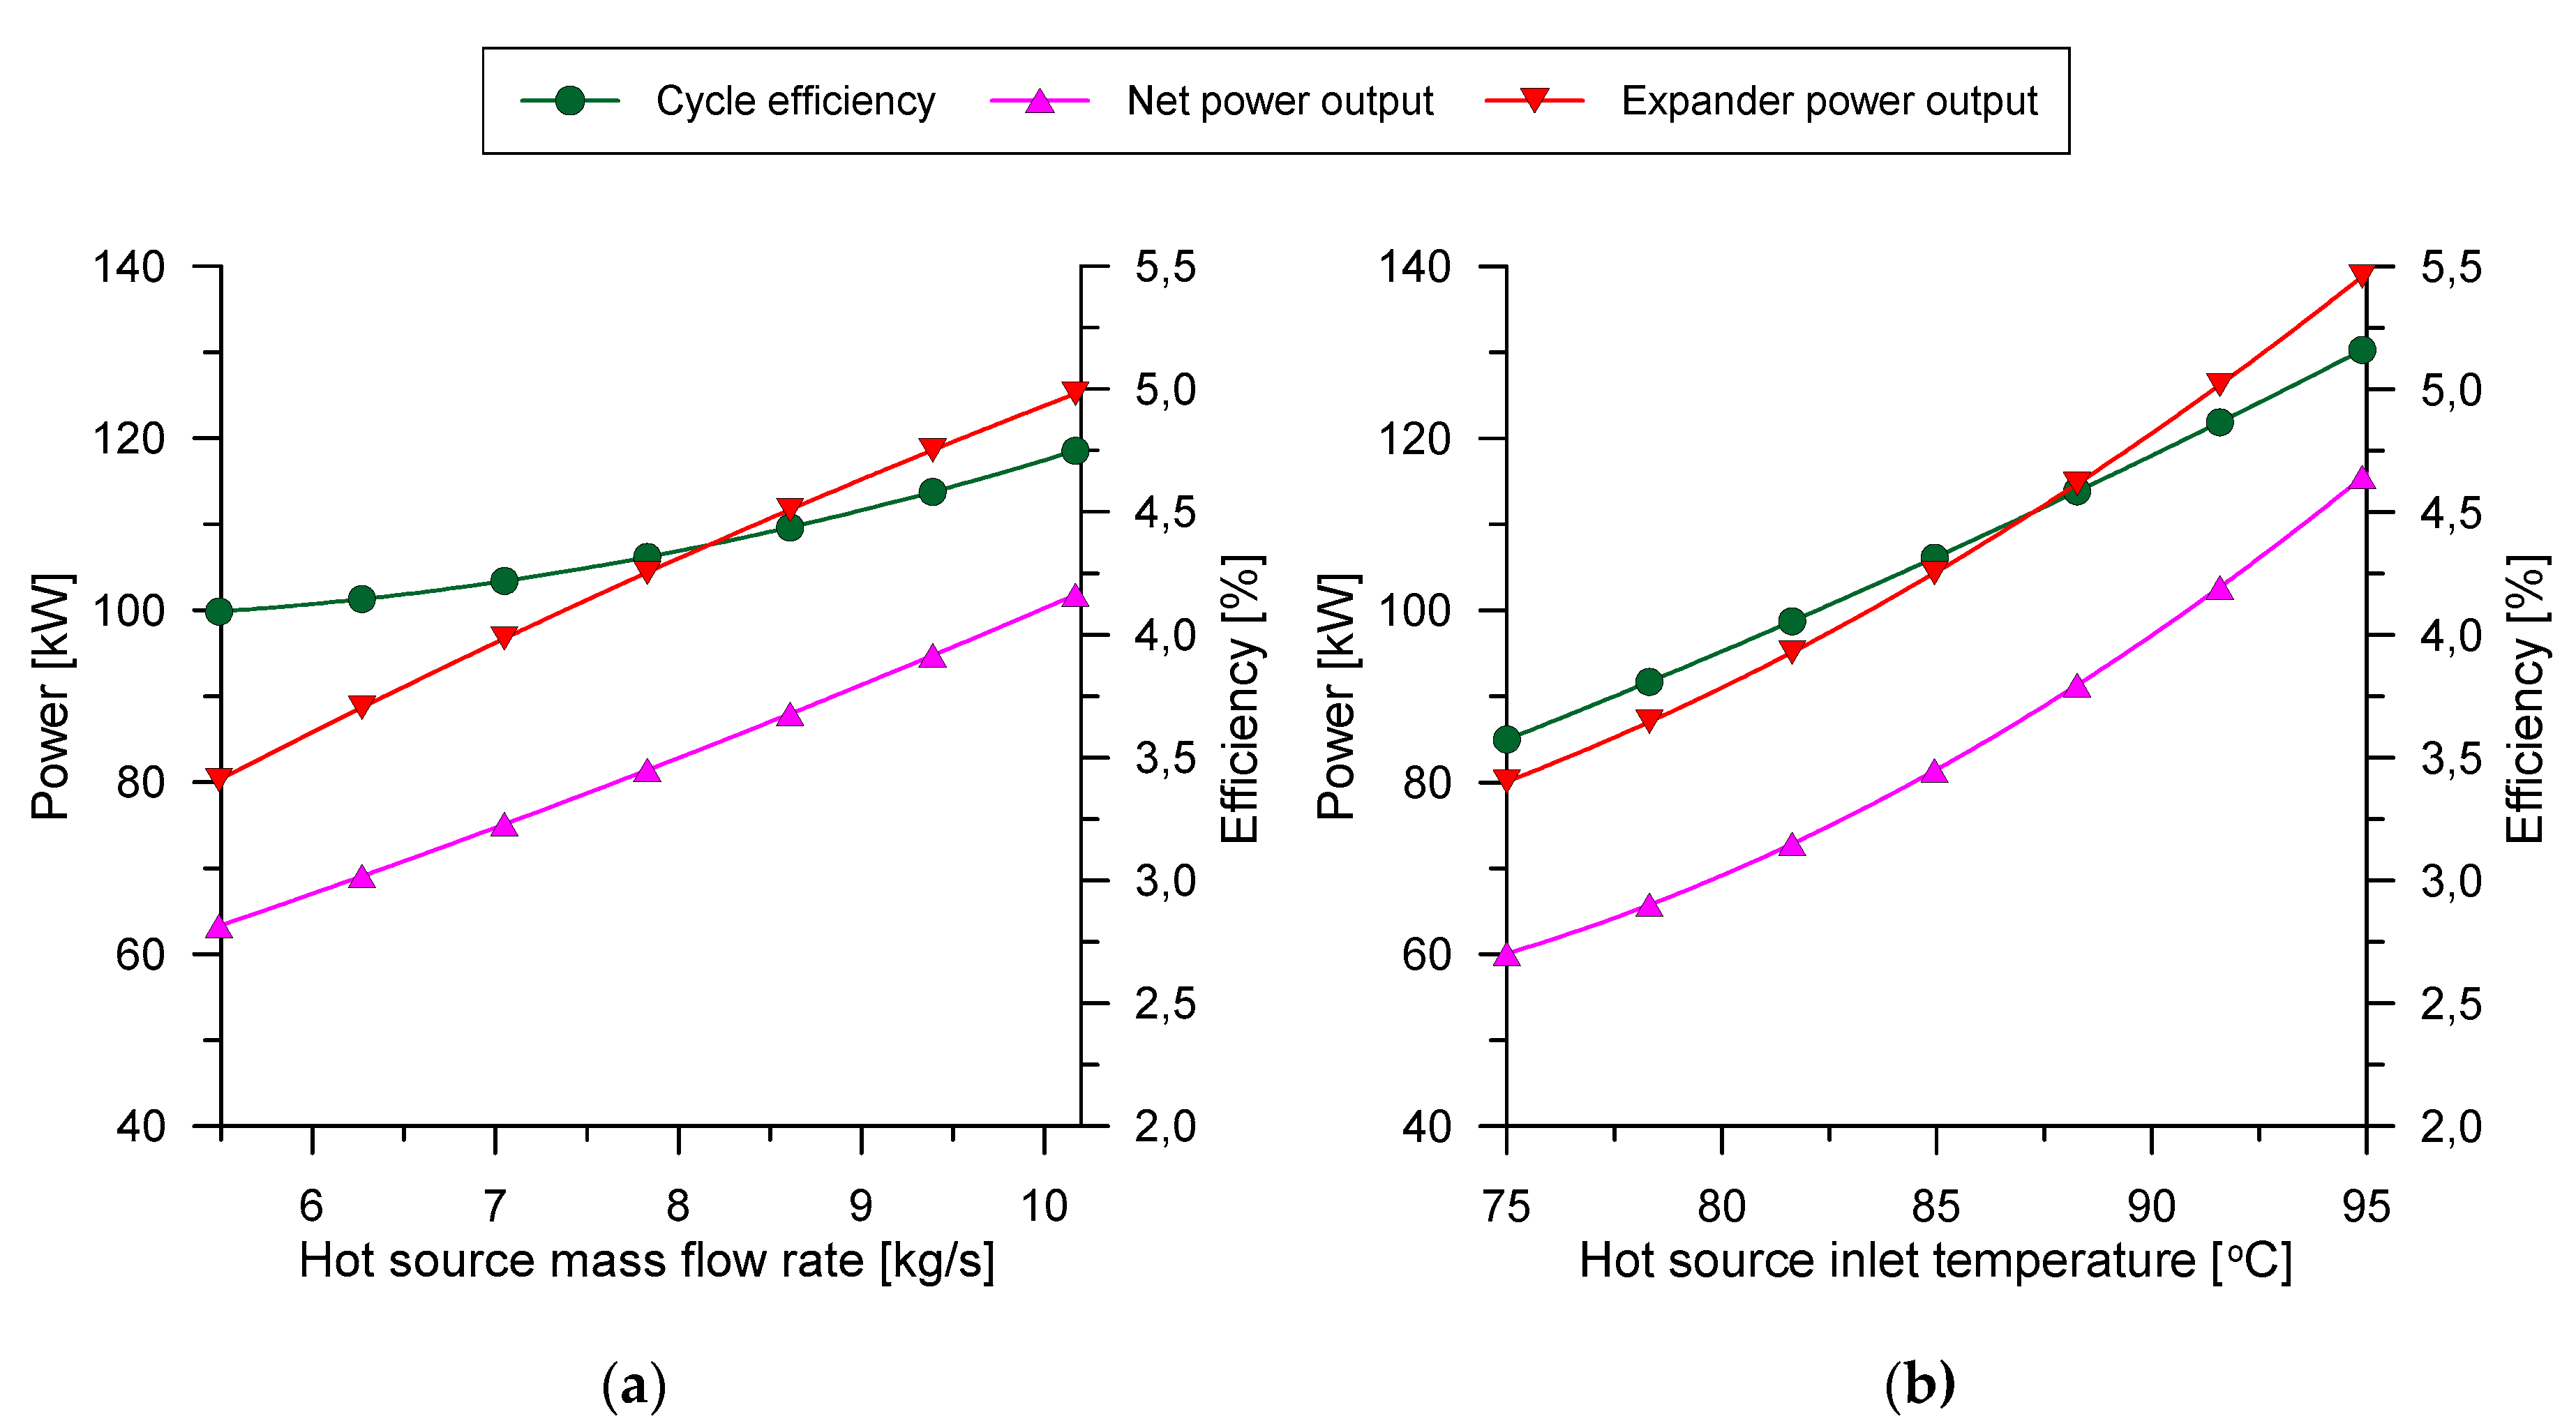
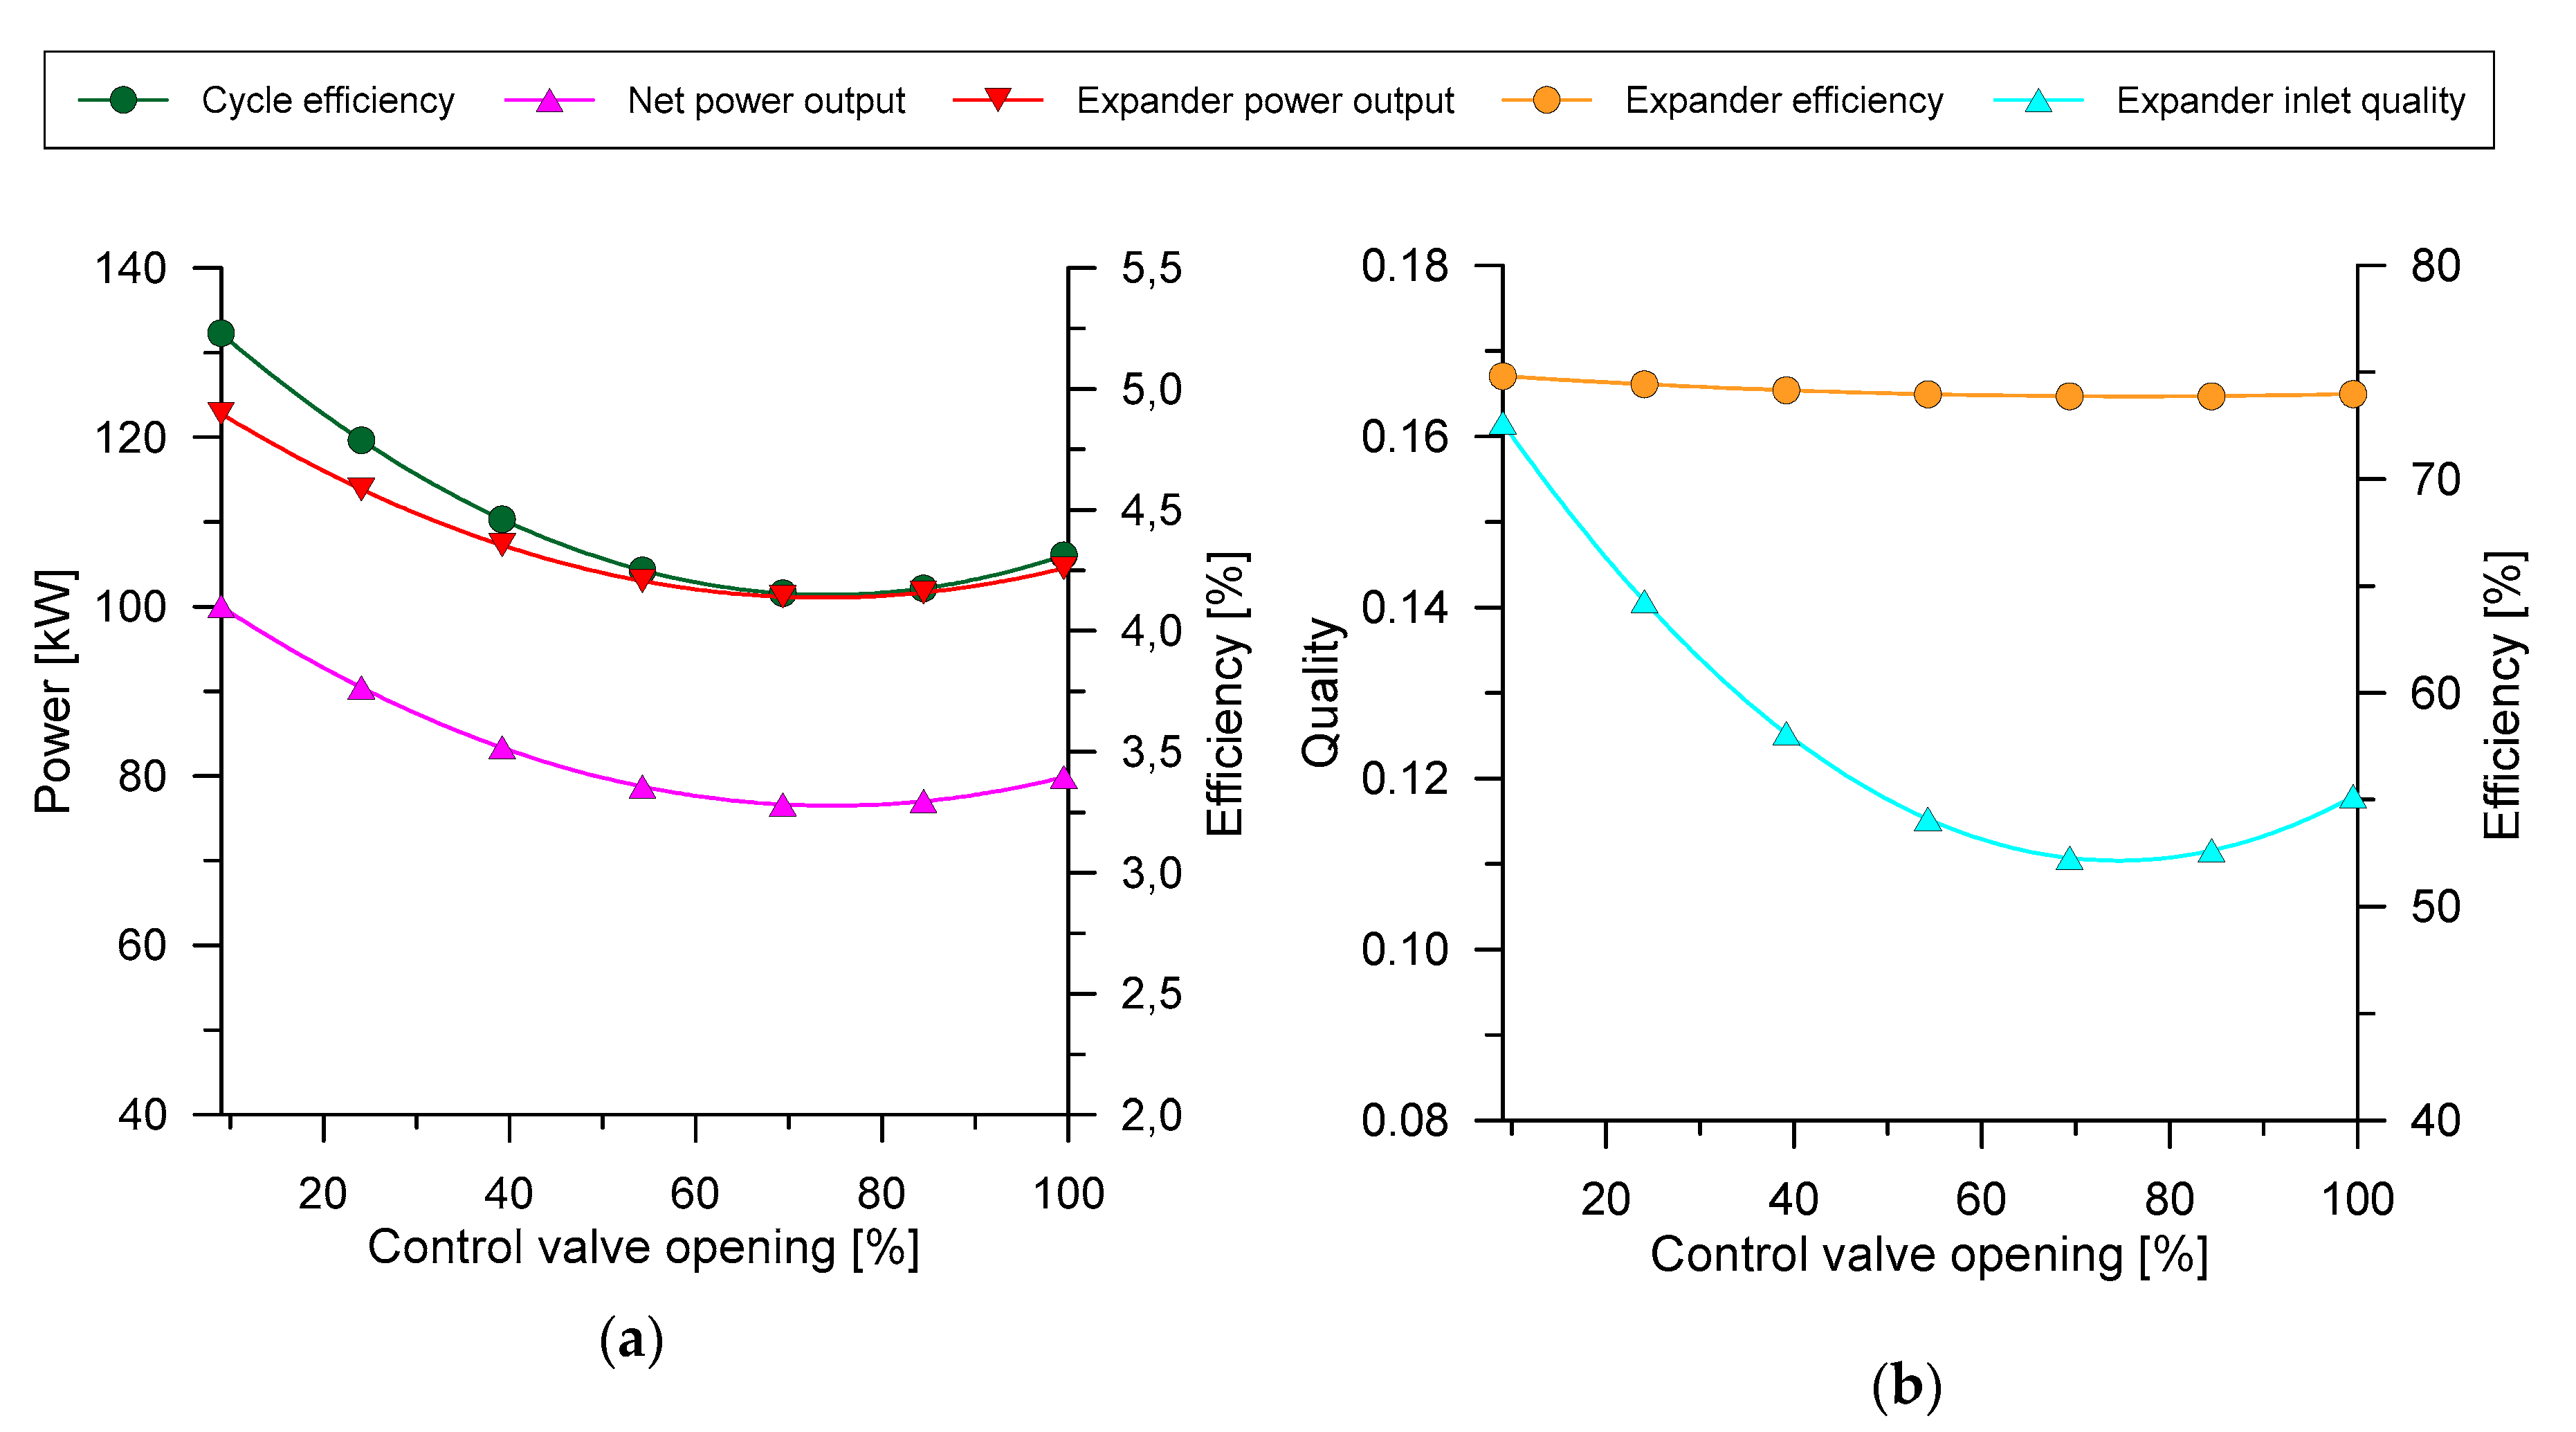
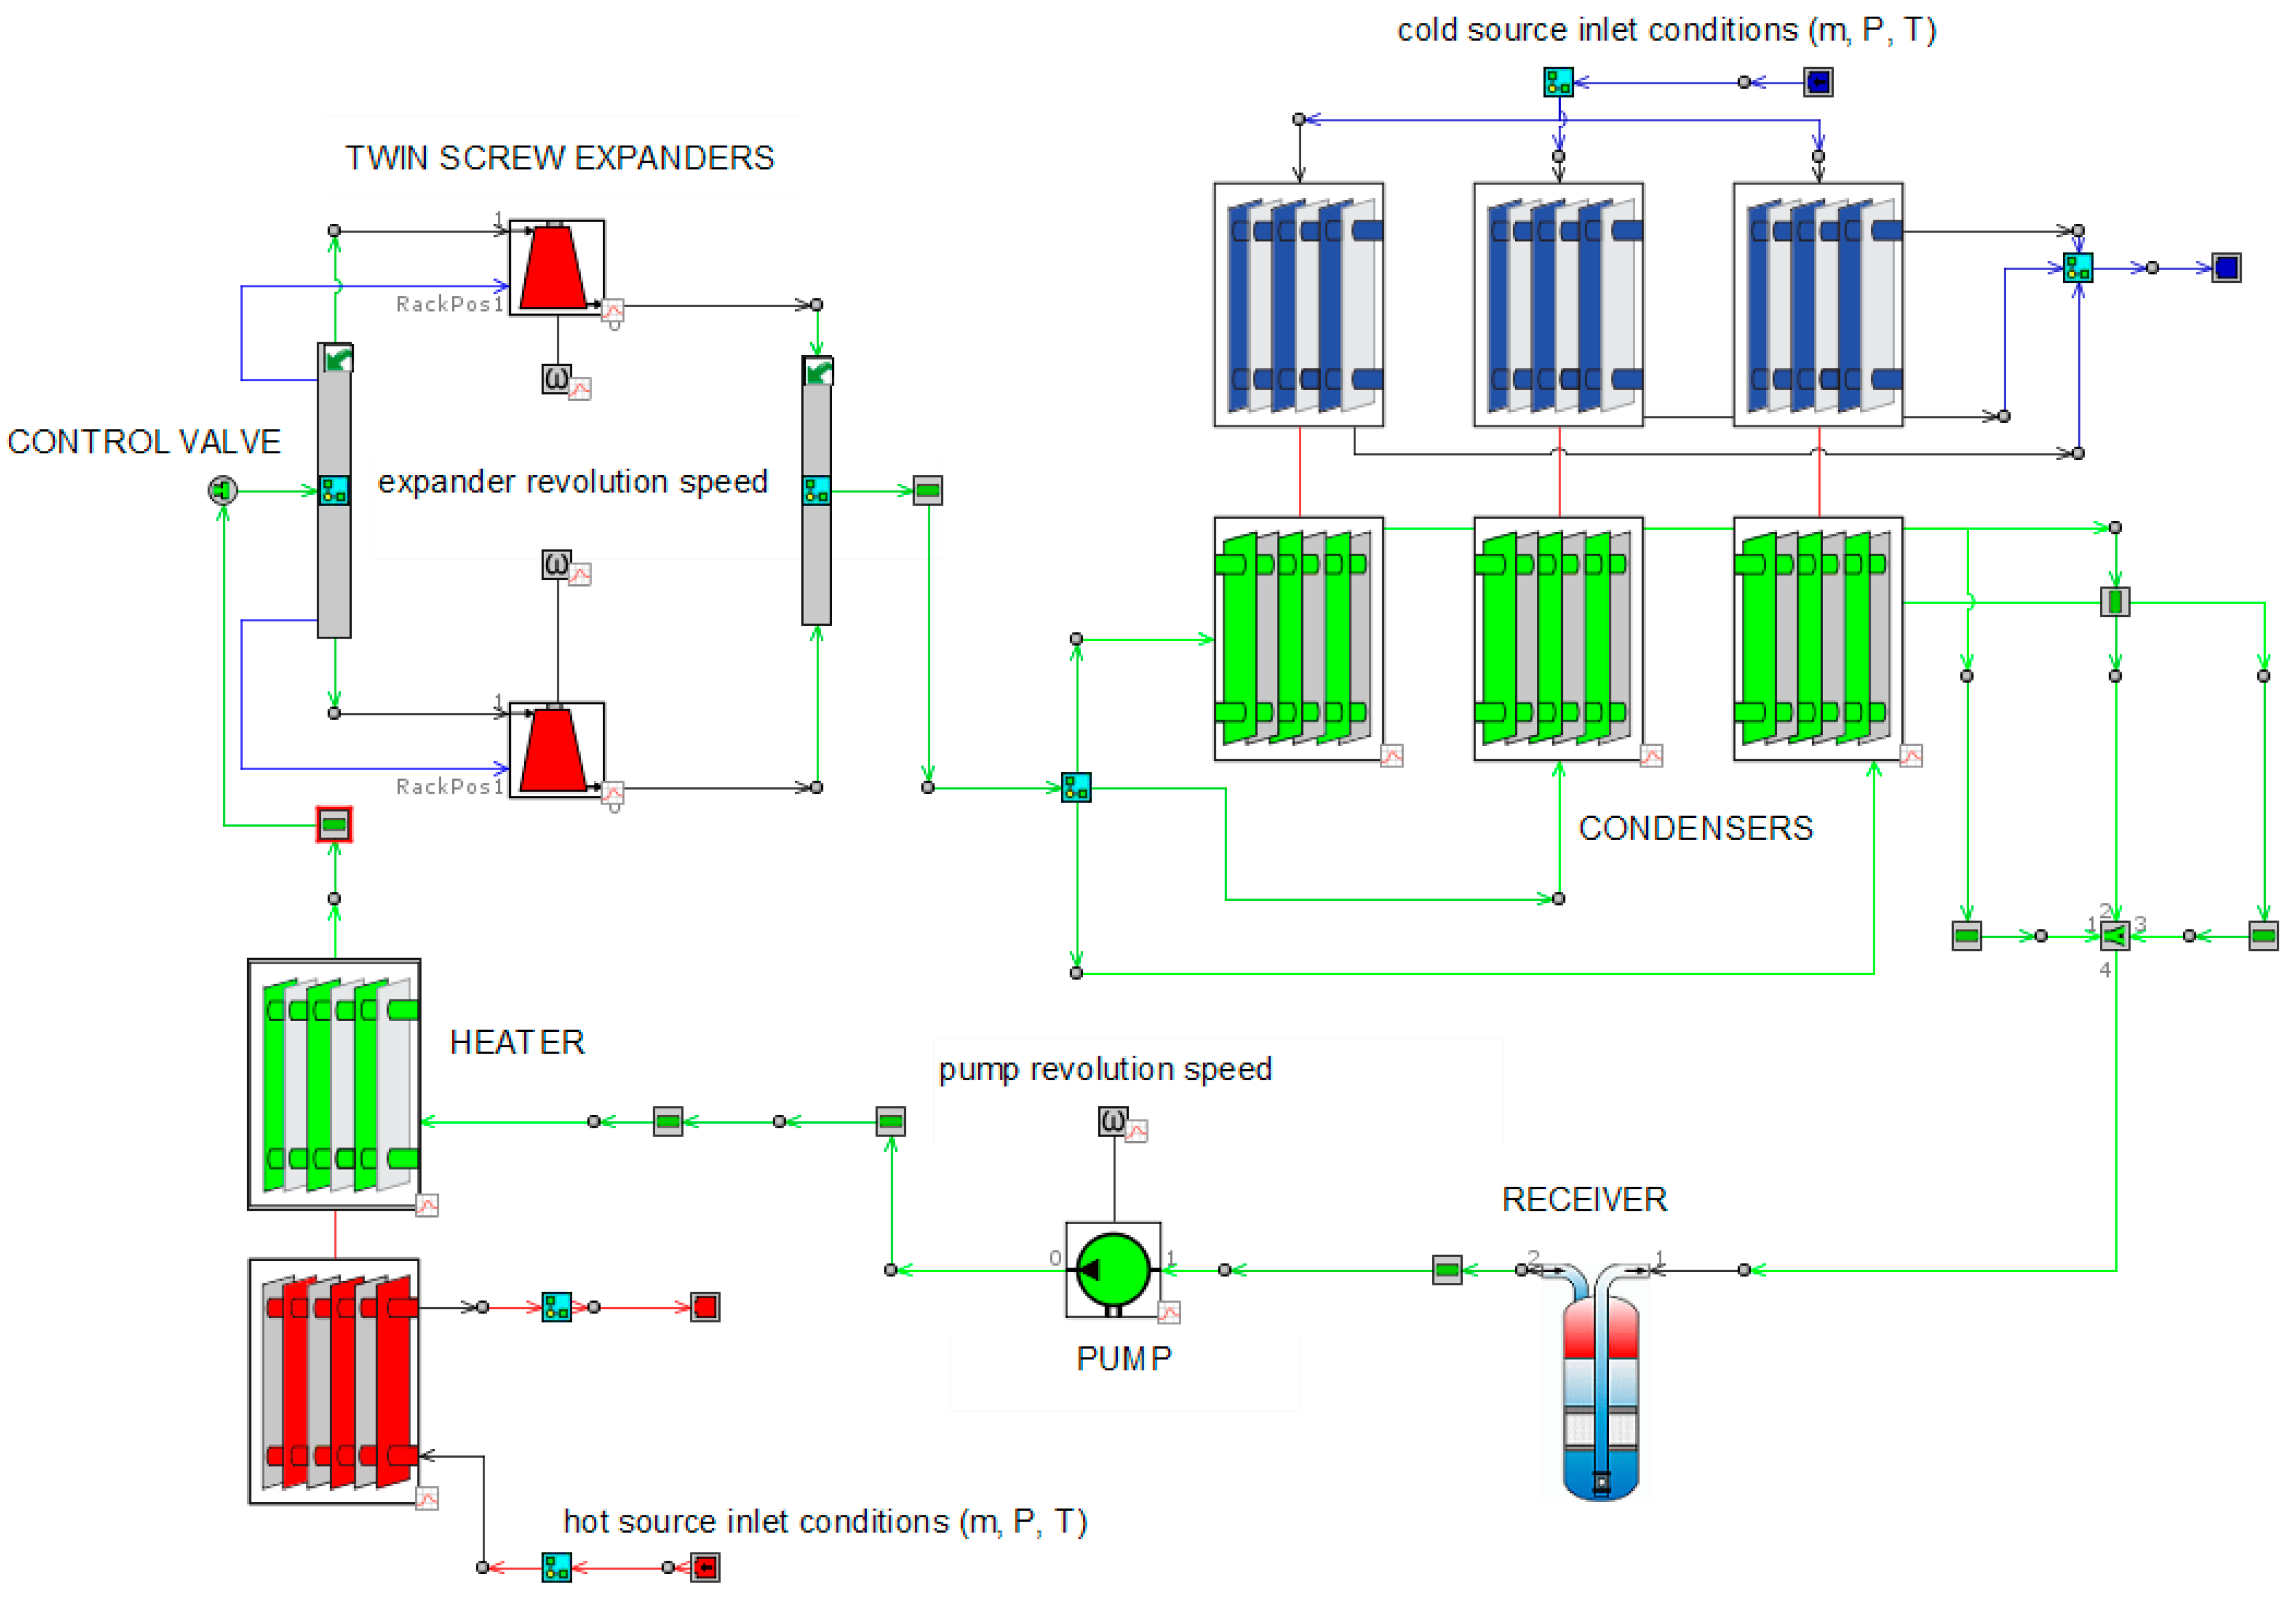
4.2. TFC System
5. Conclusions
Author Contributions
Funding
Acknowledgments
Conflicts of Interest
Abbreviations
| specific total internal energy (J kg−1) | |
| mass (kg) | |
| mass flow rate (kg s−1) | |
| pressure (Pa) | |
| time (s) | |
| velocity at the boundary (m s−1) | |
| area (m2) | |
| total number of boundaries | |
| Fanning friction factor | |
| (equivalent) diameter (m) | |
| heat transfer coefficient (W m−2 K−1) | |
| pressure loss coefficient | |
| length (m) | |
| temperature (K) | |
| volume (m3) | |
| number of cells | |
| crank angle (°) | |
| ratio of specific heats | |
| spatial reference (m) | |
| density (kg m−3) | |
| revolution speed (RPM) | |
| angular cycle duration (°) | |
| heat transfer surface | |
| simulated |
References
- Tu, J.; Yeoh, G.H.; Liu, C. Computational Fluid Dynamics: A practical Approach; Butterworth-Heinemann: Oxford, UK, 2018. [Google Scholar]
- Patel, K.S.; Patel, S.B.; Patel, U.B.; Ahuja, A.P. CFD Analysis of an Aerofoil. Int. J. Eng. Res. 2014, 3, 154–158. [Google Scholar] [CrossRef]
- Rizzi, A. Modeling and simulating aircraft stability and control—The SimSAC project. Prog. Aerosp. Sci. 2011, 47, 573–588. [Google Scholar] [CrossRef]
- Bianchi, G.; Rane, S.; Kovacevic, A.; Cipollone, R.; Murgia, S.; Contaldi, G. Development of a General Numerical Methodology for CFD Analyses in Sliding Vane Machines and Application on a Mid-Size Oil Injected Air Compressor. In Proceedings of the International Compressor Engineering Conference at Purdue University, West-Lafayette, IN, USA, 11–14 July 2016. [Google Scholar]
- Quoilin, S.; Broek, M.V.D.; Declaye, S.; Dewallef, P.; Lemort, V. Techno-economic survey of Organic Rankine Cycle (ORC) systems. Renew. Sustain. Energy Rev. 2013, 22, 168–186. [Google Scholar] [CrossRef] [Green Version]
- Tocci, L.; Pal, T.; Pesmazoglou, I.; Franchetti, B.; Tocci, L.; Pal, T.; Pesmazoglou, I.; Franchetti, B. Small Scale Organic Rankine Cycle (ORC): A Techno-Economic Review. Energies 2017, 10, 413. [Google Scholar] [CrossRef]
- Fischer, J. Comparison of trilateral cycles and organic Rankine cycles. Energy 2011, 36, 6208–6219. [Google Scholar] [CrossRef]
- Lai, N.A.; Fischer, J. Efficiencies of power flash cycles. Energy 2012, 44, 1017–1027. [Google Scholar] [CrossRef]
- Qi, Y.; Yu, Y. Thermodynamic Simulation on the Performance of Twin Screw Expander Applied in Geothermal Power Generation. Energies 2016, 9, 694. [Google Scholar] [CrossRef]
- Fleming, J.S.; Tang, Y. The Analysis of Leakage in a Twin Screw Compressor and its Application to Performance Improvement, Proceedings of the Institution of Mechanical Engineers. Part E J. Process Mech. Eng. 1995, 209, 125–136. [Google Scholar] [CrossRef]
- Kanno, H.; Shikazono, N. Experimental study on two-phase adiabatic expansion in a reciprocating expander with intake and exhaust processes. Int. J. Heat Mass Transf. 2016, 102, 1004–1011. [Google Scholar] [CrossRef] [Green Version]
- Papes, I.; DeGroote, J.; Vierendeels, J. New insights in twin screw expander performance for small scale ORC systems from 3D CFD analysis. Appl. Therm. Eng. 2015, 91, 535–546. [Google Scholar] [CrossRef] [Green Version]
- Stosic, N.; Smith, I.; Kovacevic, A. Screw Compressors: Mathematical Modelling and Performance Calculation; Springer Science & Business Media: Berlin, Germany, 2005. [Google Scholar]
- Gamma Technologies. GT-SUITE-Flow Theory Manual; Gamma Technologies: Westmont, IL, USA, 2019. [Google Scholar]
- Lemmon, E.W.; Huber, M.L.; Mclinden, M.O. NIST Reference Fluid Thermodynamic and Transport Properties—REFPROP User’s Guide; National Institute of Standards and Technology: Gaithersburg, MD, USA, 2019.
- Marchionni, M.; Bianchi, G.; Karvountzis-Kontakiotis, A.; Pesiridis, A.; Tassou, S.A. Dynamic modeling and optimization of an ORC unit equipped with plate heat exchangers and turbomachines. Energy Procedia. 2017, 129, 224–231. [Google Scholar] [CrossRef]
- Bianchi, G.; Kennedy, S.; Zaher, O.; Tassou, S.A.; Miller, J.; Jouhara, H. Numerical modeling of a two-phase twin-screw expander for Trilateral Flash Cycle applications. Int. J. Refrig. 2018, 88, 248–259. [Google Scholar] [CrossRef]
- Brkić, D. Review of explicit approximations to the Colebrook relation for flow friction. J. Pet. Sci. Eng. 2011, 77, 34–48. [Google Scholar] [CrossRef] [Green Version]
- Dittus, F.; Boelter, L. Heat Transfer in Automobile Radiators of the Tubular Type; University of California Publications: Berkeley, CA, USA, 1930. [Google Scholar]
- Yan, Y.Y.; Lio, H.C.; Lin, T.F. Condensation heat transfer and pressure drop of refrigerant R-134a in a plate heat exchanger. Int. J. Heat Mass Transf. 1999, 42, 993–1006. [Google Scholar] [CrossRef]
- Donowski, V.D.; Kandlikar, S.G. Correlating Evaporation Heat Transfer Coefficient of Refrigerant R-134a in a Plate Heat Exchanger. In Proceedings of the Engineering Foundation Conference on Pool and Flow Boiling, Anchorage, AK, USA, 30 April–5 May2000; pp. 1–18. [Google Scholar]
- Zhang, J.; Kærn, M.R.; Ommen, T.; Elmegaard, B.; Haglind, F. Condensation heat transfer and pressure drop characteristics of R134a, R1234ze(E), R245fa and R1233zd(E) in a plate heat exchanger. Int. J. Heat Mass Transf. 2019, 128, 136–149. [Google Scholar] [CrossRef]
- Bianchi, G.; McGinty, R.; Oliver, D.; Brightman, D.; Zaher, O.; Tassou, S.A.; Miller, J.; Jouhara, H. Development and analysis of a packaged Trilateral Flash Cycle system for low grade heat to power conversion applications. Therm. Sci. Eng. Prog. 2017, 4, 113–121. [Google Scholar] [CrossRef]


| Rotor Diameter | 204.0 mm | Built-In Volume Ratio | 5.0 |
|---|---|---|---|
| Aspect ratio (L/D) | 1.93 | Suction/discharge ports | axial/axial |
| Male/female rotor lobes | 4/6 | Revolution speed range | 1500–6000 RPM |
| Male rotor lead length | 405.0 mm | Tip speed range | 16–64 m/s |
| Female rotor lead length | 607.5 mm | Weight | 887 kg |
| Hot Water | R245fa | Cold Water | |
|---|---|---|---|
| Mass flow rate (kg/s) | 7.84 | 25.34 | 89.56 |
| Inlet/Max pres (bar) | 4.0 | 7.2 | 4.0 |
| Outlet/Min pres (bar) | 3.5 | 1.2 | 4.0 |
| Inlet/Min temp (°C) | 85.0 | 19.0 | 12.0 |
| Outlet/Max temp (°C) | 24.0 | 76.5 | 17.0 |
| Expander isentropic eff. | 75% | ||
| Net power output (kW) | 129 kW | ||
| Cycle thermal efficiency | 6.4% | ||
| Hot Water | R245fa | Cold Water | |
|---|---|---|---|
| Mass flow rate (kg/s) | 7.84 | 24.65 | 130.30 |
| Inlet/Max pres (bar) | 4.0 | 6.4 | 3.0 |
| Outlet/Min pres (bar) | 3.9 | 1.1 | 2.7 |
| Inlet/Min temp (°C) | 85 | 18 | 12 |
| Outlet/Max temp (°C) | 25 | 63 | 17 |
| Pump speed (RPM) | 3000 | ||
| Expanders speed (RPM) | 4500 | ||
| Expander isentropic eff. | 74% | ||
| Net power output (kW) | 80 kW | ||
| Cycle thermal efficiency | 4.3% | ||
© 2019 by the authors. Licensee MDPI, Basel, Switzerland. This article is an open access article distributed under the terms and conditions of the Creative Commons Attribution (CC BY) license (http://creativecommons.org/licenses/by/4.0/).
Share and Cite
Bianchi, G.; Marchionni, M.; Kennedy, S.; Miller, J.; Tassou, S. One-Dimensional Modelling of a Trilateral Flash Cycle System with Two-Phase Twin-Screw Expanders for Industrial Low-Grade Heat to Power Conversion. Designs 2019, 3, 41. https://doi.org/10.3390/designs3030041
Bianchi G, Marchionni M, Kennedy S, Miller J, Tassou S. One-Dimensional Modelling of a Trilateral Flash Cycle System with Two-Phase Twin-Screw Expanders for Industrial Low-Grade Heat to Power Conversion. Designs. 2019; 3(3):41. https://doi.org/10.3390/designs3030041
Chicago/Turabian StyleBianchi, Giuseppe, Matteo Marchionni, Stuart Kennedy, Jeremy Miller, and Savvas Tassou. 2019. "One-Dimensional Modelling of a Trilateral Flash Cycle System with Two-Phase Twin-Screw Expanders for Industrial Low-Grade Heat to Power Conversion" Designs 3, no. 3: 41. https://doi.org/10.3390/designs3030041