Full Water Quality Monitoring of a Traditional Flow-Through Rainbow Trout Farm
by
 and
and
Alexandre Tahar
1,*, 
Alan Kennedy
2,
Richard D. Fitzgerald
3,
Eoghan Clifford
2,3 and
Neil Rowan
1
1
Athlone Institute of Technology, Dublin Road, Athlone, County Westmeath, Ireland
2
Civil Engineering, College of Engineering and Informatics, National University of Ireland, Galway, Ireland
3
Ryan Institute, National University of Ireland, Galway, Ireland
*
Author to whom correspondence should be addressed.
Fishes 2018, 3(3), 28; https://doi.org/10.3390/fishes3030028
Submission received: 10 May 2018
/
Revised: 9 July 2018
/
Accepted: 11 July 2018
/
Published: 17 July 2018
Abstract
:Traditional freshwater rainbow trout farms are still popular in some European countries such as Poland, France and Ireland. These systems generally operate in flow-through configuration. The impact such production systems might have on water quality remains mostly unknown. The present study was set up to fulfil this objective of monitoring water quality on different fish farm locations in order to identify the impacts of the whole farm (comparison of farm inlet and outlet) and at pond scale in order to understand the water quality dynamics and to better understand the impact of multiple water reuse (water passes) in a given pond on water quality. In the absence of any sort of water treatment, an increase in the number of water passes was shown to create an increase in ammonium concentration along the farm. Finally, this traditional flow-through rainbow trout production system was revealed to almost be at its full carrying capacity with respect to internal water quality parameters and fish welfare. To increase fish production, some water treatment techniques (solid/liquid separation, nitrification) would have to be introduced in order to optimize the rearing water quality for fish growth and to minimize the release of pollutants in the receiving water to limit the impact on the environment.
1. Introduction
With the wild fish catching capacities reached and the overall human population increase, fish produced through aquaculture is and will be more and more an important food source for human consumption in the near future [1,2]. Aquaculture production increased more than five-fold from 1990 to 2012, while the world capture fisheries increased by only 8% at the same time [3]. The future and current intensification of this activity is associated with more and more stringent environmental regulations to ensure a sustainable and environmentally friendly production process/model [4,5,6]. At European scale, freshwater fish farming is essentially regulated through the water framework directive (WFD), which aims at achieving good chemical and ecological status of the rivers [1,7,8].
The traditional freshwater fish farming industry generally operates using flow-through systems (FT) without any water treatment, the dissolved oxygen (DO) levels in the culture water being maintained by relatively high volumes of water abstracted and flowing through the fish farm. The oxygen loss due to both fish activity and sediments is generally compensated by mechanical aerators such as paddle-wheels. In traditional FT systems, this aeration allows the fish farmers to use the water several times in different ponds before release (multi-pass); however, the impact of this water reuse on water quality and the potential accumulation of waste in the rearing water has not been clearly identified so far. When the amount of DO is too low in the fish farm inlet water, fish farmers generally use supplementary oxygenation systems such as oxygenation cones in order to maintain optimum DO levels. Furthermore, fish farming activity generates dissolved and solid wastes such as nutrients (nitrogen and phosphorus) and organic matter from fish excreta and uneaten feed. Therefore, if the effluent is discharged untreated, it could potentially impact the discharge water quality compared to make-up water, and as a consequence impact the receiving water quality [9,10,11,12,13,14].
In Ireland, a large proportion of the freshwater production is still carried out using traditional FT systems without, or with very limited, water treatment before discharge. To the best of our knowledge, there is no existing published data on the effluent quality and flow, allowing estimation of pollutants fluxes and the potential impact the fish farming activity might have on water quality in Ireland. Models could be employed for the evaluation of organic matter (OM), nitrogen and phosphorus fluxes from feed composition and fish data (stocking density, average fish mass, overall fish mass) by the nutritional method [15]. However, missing data on fish/feed (especially on feed composition, ingested feed quantity, digestibility coefficients and the proportion of uneaten feed must be available according to [15]) forced us to evaluate the different fluxes by the hydrobiological method (involving flow measurements and water quality analysis).
Traditional flow-through systems generally involve a multi-use (or multi-pass) of water, with water passing through different ponds with no water treatment before being released to the receiving water, although some reuse might involve a supplementary oxygenation step. The objective of this study was to assess the water quality at different farm levels (pond, 1-pass, 2-pass and 3 or more pass ponds, whole farm) of a traditional rainbow trout farm in Ireland. To that aim, the whole farm (inlet/outlet and strategic fish farm locations) was monitored during two consecutive dry days. The monitoring program included water physico-chemical quality (dissolved oxygen, turbidity, nitrate, ammonium, and pH) and flow measurement in order to determine the flow dynamic of the whole farm and its different ponds. Each parameter was monitored on an hourly basis at the different selected farm locations in order to study fluxes and to identify any diurnal variation.
2. Results and Discussion
2.1. Fish and Flow Parameters
The table below summarizes the data related to (i) the biomass for each pond (i.e., total biomass, number of fish, average fish weight and stocking densities) that were obtained from the fish farmers, and (ii) flow values that were measured for each monitored pond (Table 1 and Table 2).
Table 1 shows the range of fish sizes being reared at the time of the experiment (170–1600 g/fish). Different stocking densities were also observed in the different ponds (4–89 kg/m3).
The flow measurements showed a flow dynamic slightly different than what was expected initially in terms of number of water passes. For example, a negative flow value was obtained between 21 and 22 ponds (Table 2). This might be a consequence of the recirculation pump in operation in 21 that would have applied a suction of the water from 22 (average recirculation flow of 66 L/s, see Table 2). This demonstrated that 22 was completely isolated from 21 and therefore isolated from any recirculated water. This is the reason why, contrary to initial expectations where it would have been a “3-pass pond”, 22 was considered as a “2-pass pond”, as it only received water from 18–12 ponds (i.e., “1-pass ponds”). Furthermore, we observed that the average flow from 22 to 23 pond was very limited (i.e., 6 L/s, see Table 2). This is why 23 pond was considered a “mostly 2-pass pond”, as it received water from six “1-pass ponds” (i.e., 113–18 ponds at 7 L/s each, see Table 2) and only one “2-pass pond” (i.e., 22 pond at 6 L/s, see Table 2).
Temperature was monitored in different ponds during the experiment and water temperature was 8–9.5 °C in all ponds during the whole experiment.
2.2. Impact of the Whole Fish Farm on Water Quality
The objective was to assess the overall impact of the farm on water quality (i.e., farm influent vs. effluent water quality). Farm inlet (before oxygenation, feeding channel, i.e., 00) and farm outlet water quality were compared. Differential concentrations (ΔC(t), see Equation (1)) were calculated between inlet and mean outlet concentrations between the two outlets (considering the two farm outlets from 23 and 33 ponds had similar flows, see Table 2) monitored during the two days of experiment for all the studied parameters (see Section 3.2).
The figure below presents an outcome of the differential values obtained between the fish farm outlets and inlet for five parameters (i.e., DO, turbidity, nitrate (NO3–N), ammonium (NH4–N) and pH) during the two days of monitoring (Figure 1).
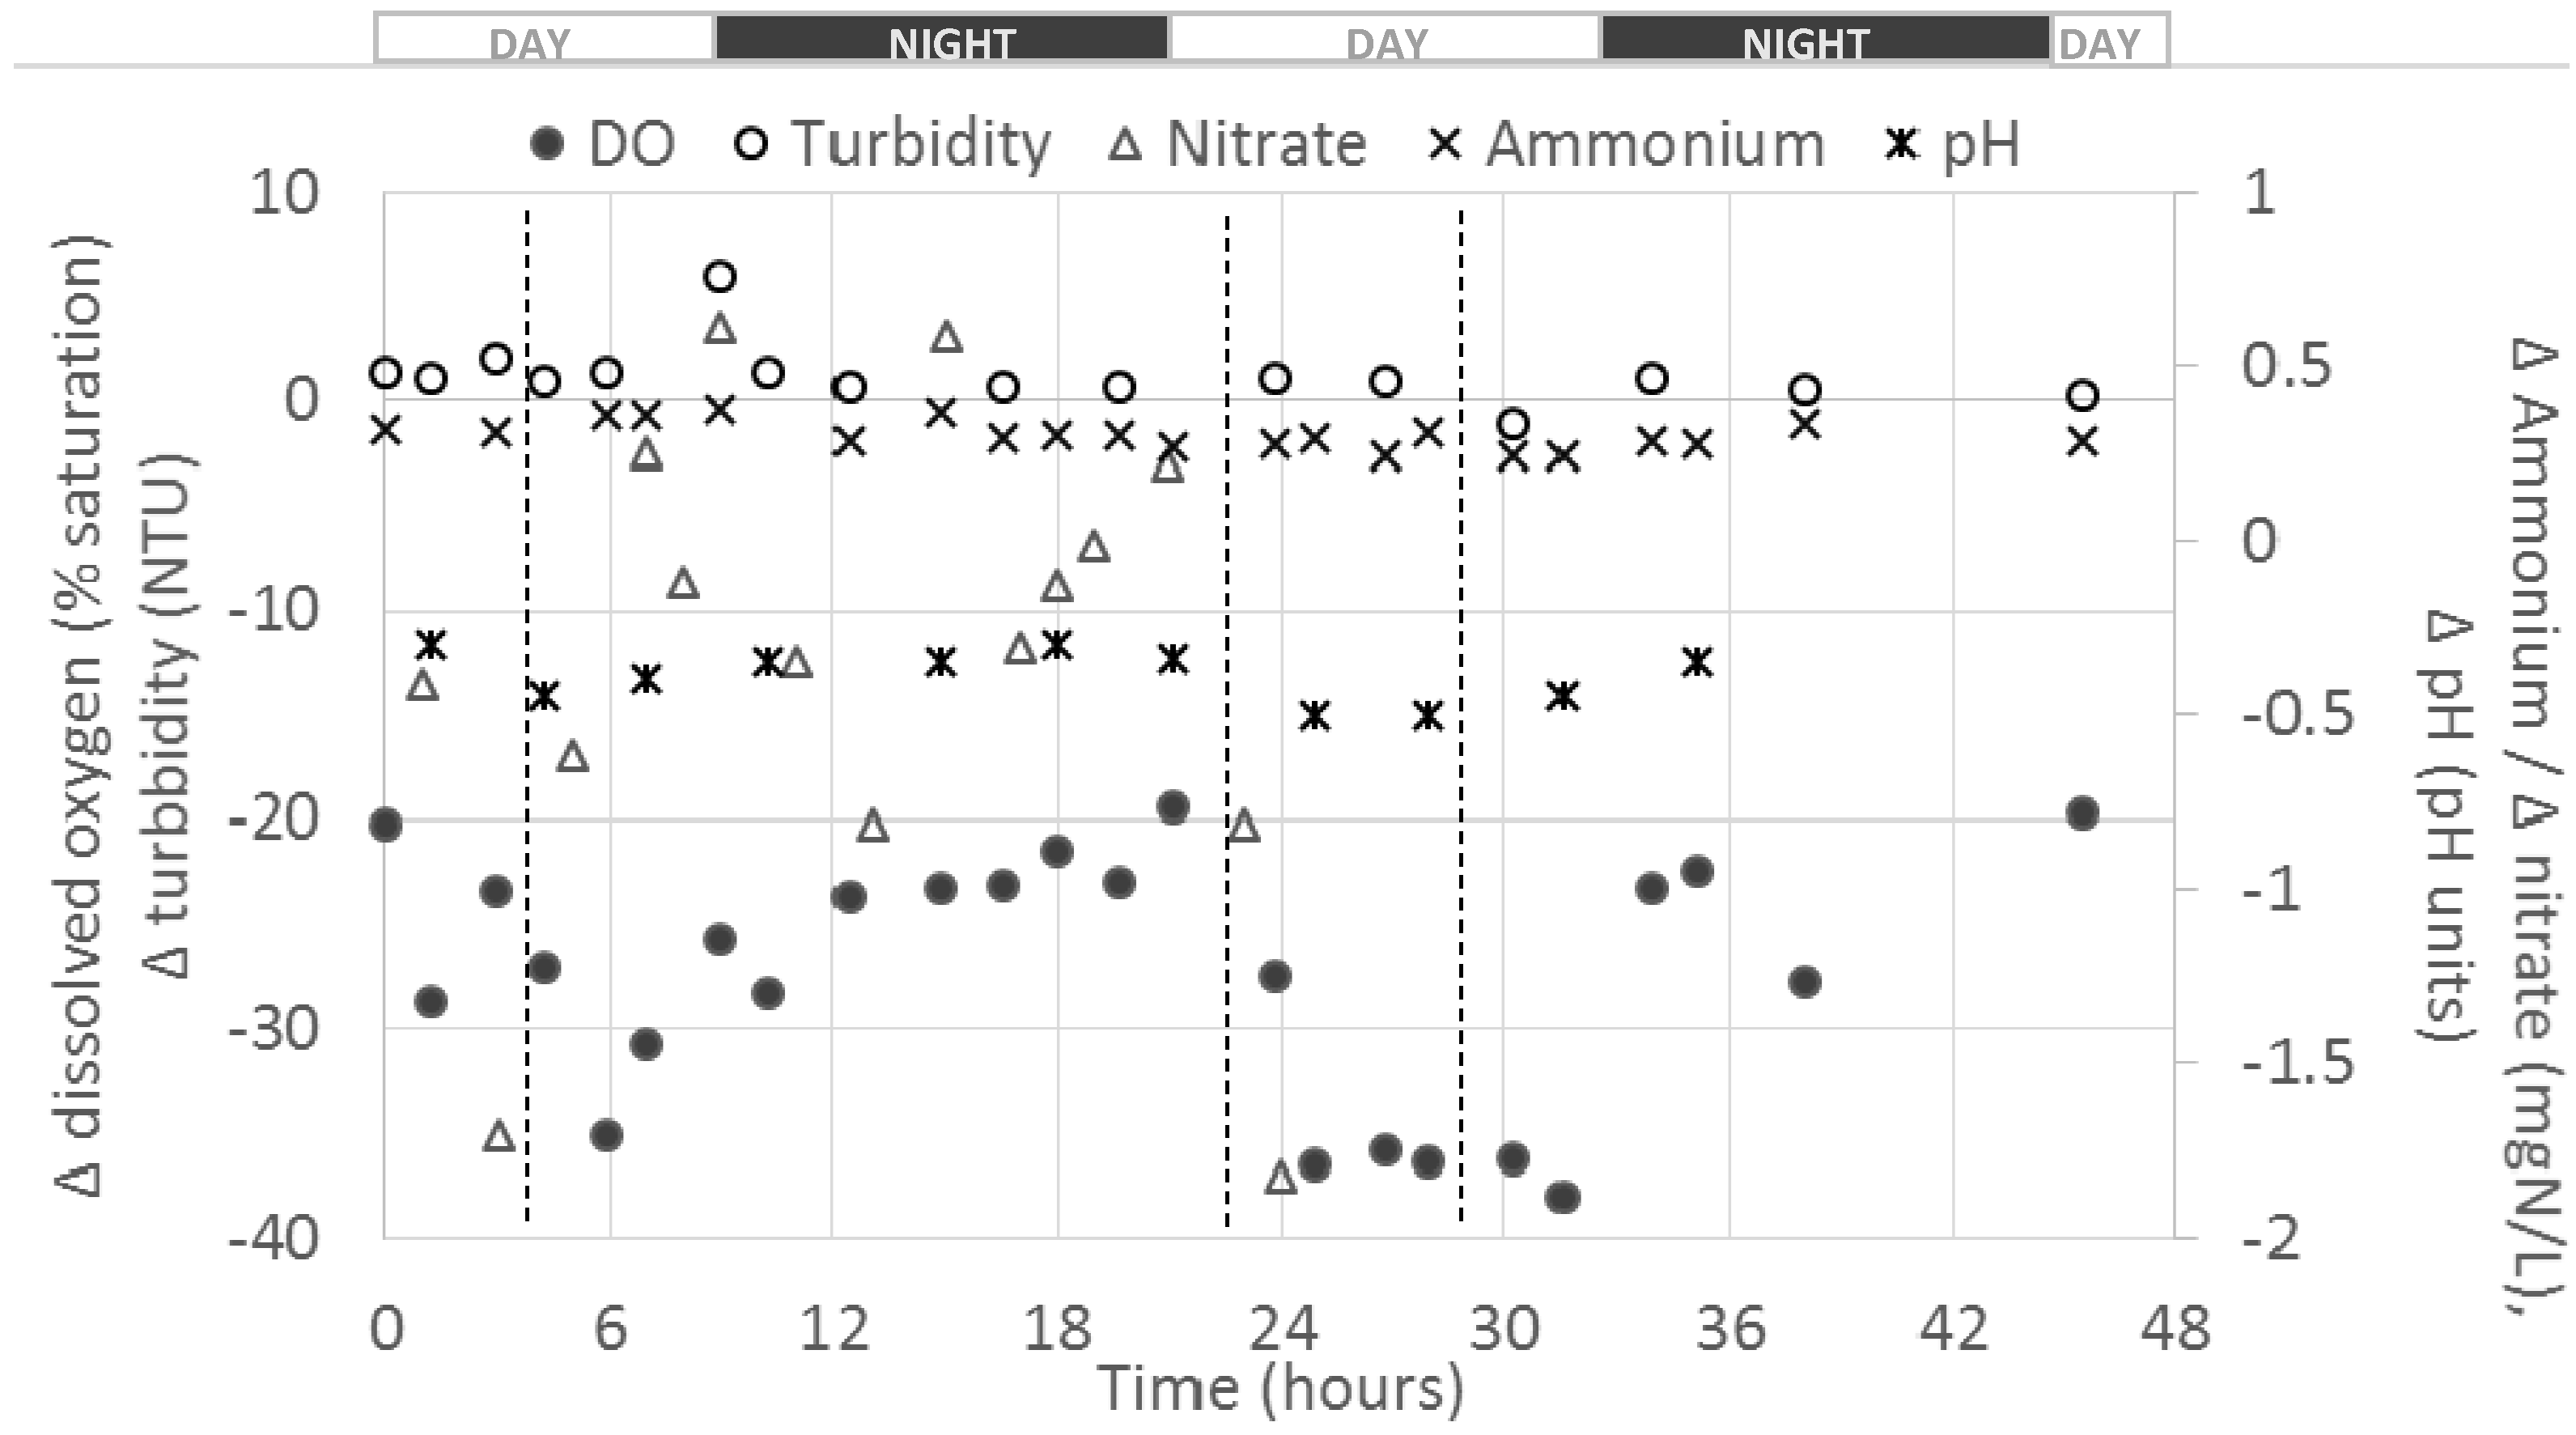
Globally, negative ΔC were observed for DO, pH and NO3–N for the duration of the monitoring. Such results were expected for DO and pH due to O2 consumption by fish and sediments and the CO2 production leading to a pH drop, as observed on other studies [16,17]. However, positive ΔC were observed for turbidity and NH4–N, meaning that the farm activity “created” solids and NH4–N. Except for NO3–N and DO, ΔC(t) appeared relatively stable all along the experiment and no diurnal effect was observed at this overall farm scale. For DO, higher absolute ΔC(t) (i.e., down to almost −40%) were observed during the days compared to night times (i.e., about −20%); this might be due to the higher O2 consumption by fish during the day due to the occurrences of feedings and higher fish activity [18].
The table below summarizes these data by providing average and associated standard deviation of the overall farm ΔC(t) values (Table 3). This presentation of the overall farm mean ΔC shows a global picture of the influence of the fish farm on water quality. Associated fluxes calculated as presented in Section 3.4 (Equations (2) and (3)) are also presented.
One of the parameters most affected by the farm was the DO saturation rate, with an average global “loss” of about 27% between farm inlet and outlet despite supplementary aeration/oxygenation steps on the farm (see Figure 7). Considering the total biomass and the outlet flows measured, mean DO F value was −18.4 mgO2/h/kgfish.
An increase in turbidity values from farm inlet to outlet was observed with an average positive ΔC of about 1.2 Nephelometric Turbidity Unit (NTU). This value appears relatively low compared to values measured at the outlets of some ponds (up to 20 NTU), and this may be due to the sedimentation of suspended solids in ponds, which would have lowered the release of suspended solids at the farm outlet. A peak in turbidity increase (i.e., ΔC(t) of 6 NTU) was observed at the beginning of the first night of the monitoring (Figure 1) which could be due to fish metabolism and the release of faeces a few hours after the afternoon feeding [16,17,18]. In terms of flux, average F value was 7.1 NTU/h/kgfish.
A global average drop in NO3–N concentrations of about 0.36 mgN/L between farm inlet and outlet was observed (Table 3). As shown on Figure 1, and regarding the relatively high standard deviation associated to the average differential value for this parameter (i.e., 0.72 mgN/L), a high variability of NO3–N ΔC during the experiment (i.e., range −1.83–+0.61) was observed. A negative value of average flux of −2.2 mgN/h/kgfish was obtained.
As expected, NH4–N appeared to be “produced” by the farm, with a positive average ΔC of 0.30 mgN/L (see Table 3). This represents a significant increase regarding the average farm inlet concentration of about 0.30 mgN/L (see Supplementary Materials). This ΔC remained stable all along the experiment, with a relatively narrow range observed (0.24–0.38 mgN/L). Therefore, the release of NH4–N by the farm seemed not be affected by light and feeding regimes. It is noticed that this apparent NH4–N “production” might be an artefact due to the overall pH drop of 0.39 units (Table 3) that would have changed the ammonia equilibrium through the ionized form, NH4–N. An average F value of 1.8 mgN/h/kgfish was obtained.
An average pH decrease of about 0.39 pH units between farm inlet and outlet was observed (Table 3) that might a consequence of a CO2 production by fish metabolism [16,17,18]. This ΔC remained stable all along the experiment with a relatively narrow range observed (−0.50–−0.30 pH units, see Table 3).
2.3. Comparison of the Water Quality from Inlet/1-Pass/2-Pass/3 Pass Ponds
The objective of this part of the study was to identify trends between the water quality of the farm inlet, 1-pass, 2-pass and 3-pass waters in order (i) to check if fish farm inlet water impacted water quality flowing through the farm and (ii) to identify potential trends in water quality parameters throughout the farm.
According to the flow measurements performed, only 22 and 23 ponds were considered as “2-pass ponds” (see Table 2 and Section 2.1). Ponds 32 and 33 were considered as “at least 3-pass ponds” because, as explained before, they received some recirculated water from 21 (see Table 2 and Section 2.1). It is noticed that 21 pond was kept alone for this analysis because it had the specificity to receive directly recirculated water from 11–7. This made the number of water passes of this pond difficult to evaluate from the flow measurements performed.
Average values for inlets (after supplementary oxygenation, i.e., 113 and 115 inlets), 1-pass (113 and 115 outlets), 2-pass (or “mostly 2-pass ponds”, i.e., 22 and 23 outlets) and “at least 3-pass ponds” (i.e., 32 and 33 outlets), 21 outlet and associated standard deviation were calculated. The two “1-pass ponds” monitored (i.e., 113 and 115) were considered separately because of the 113 pond harvesting that occurred after 24 h into the monitoring period. For more simplicity, in the following paragraphs the terms “2-pass ponds” and “3-pass ponds” will be employed instead of “mostly 2-pass ponds” and “at least 3-pass ponds”, respectively. The overall results for all the different pond categories (number of water passes) and for all the monitored parameters are presented on the figure below (Figure 2).
2.3.1. Dissolved Oxygen
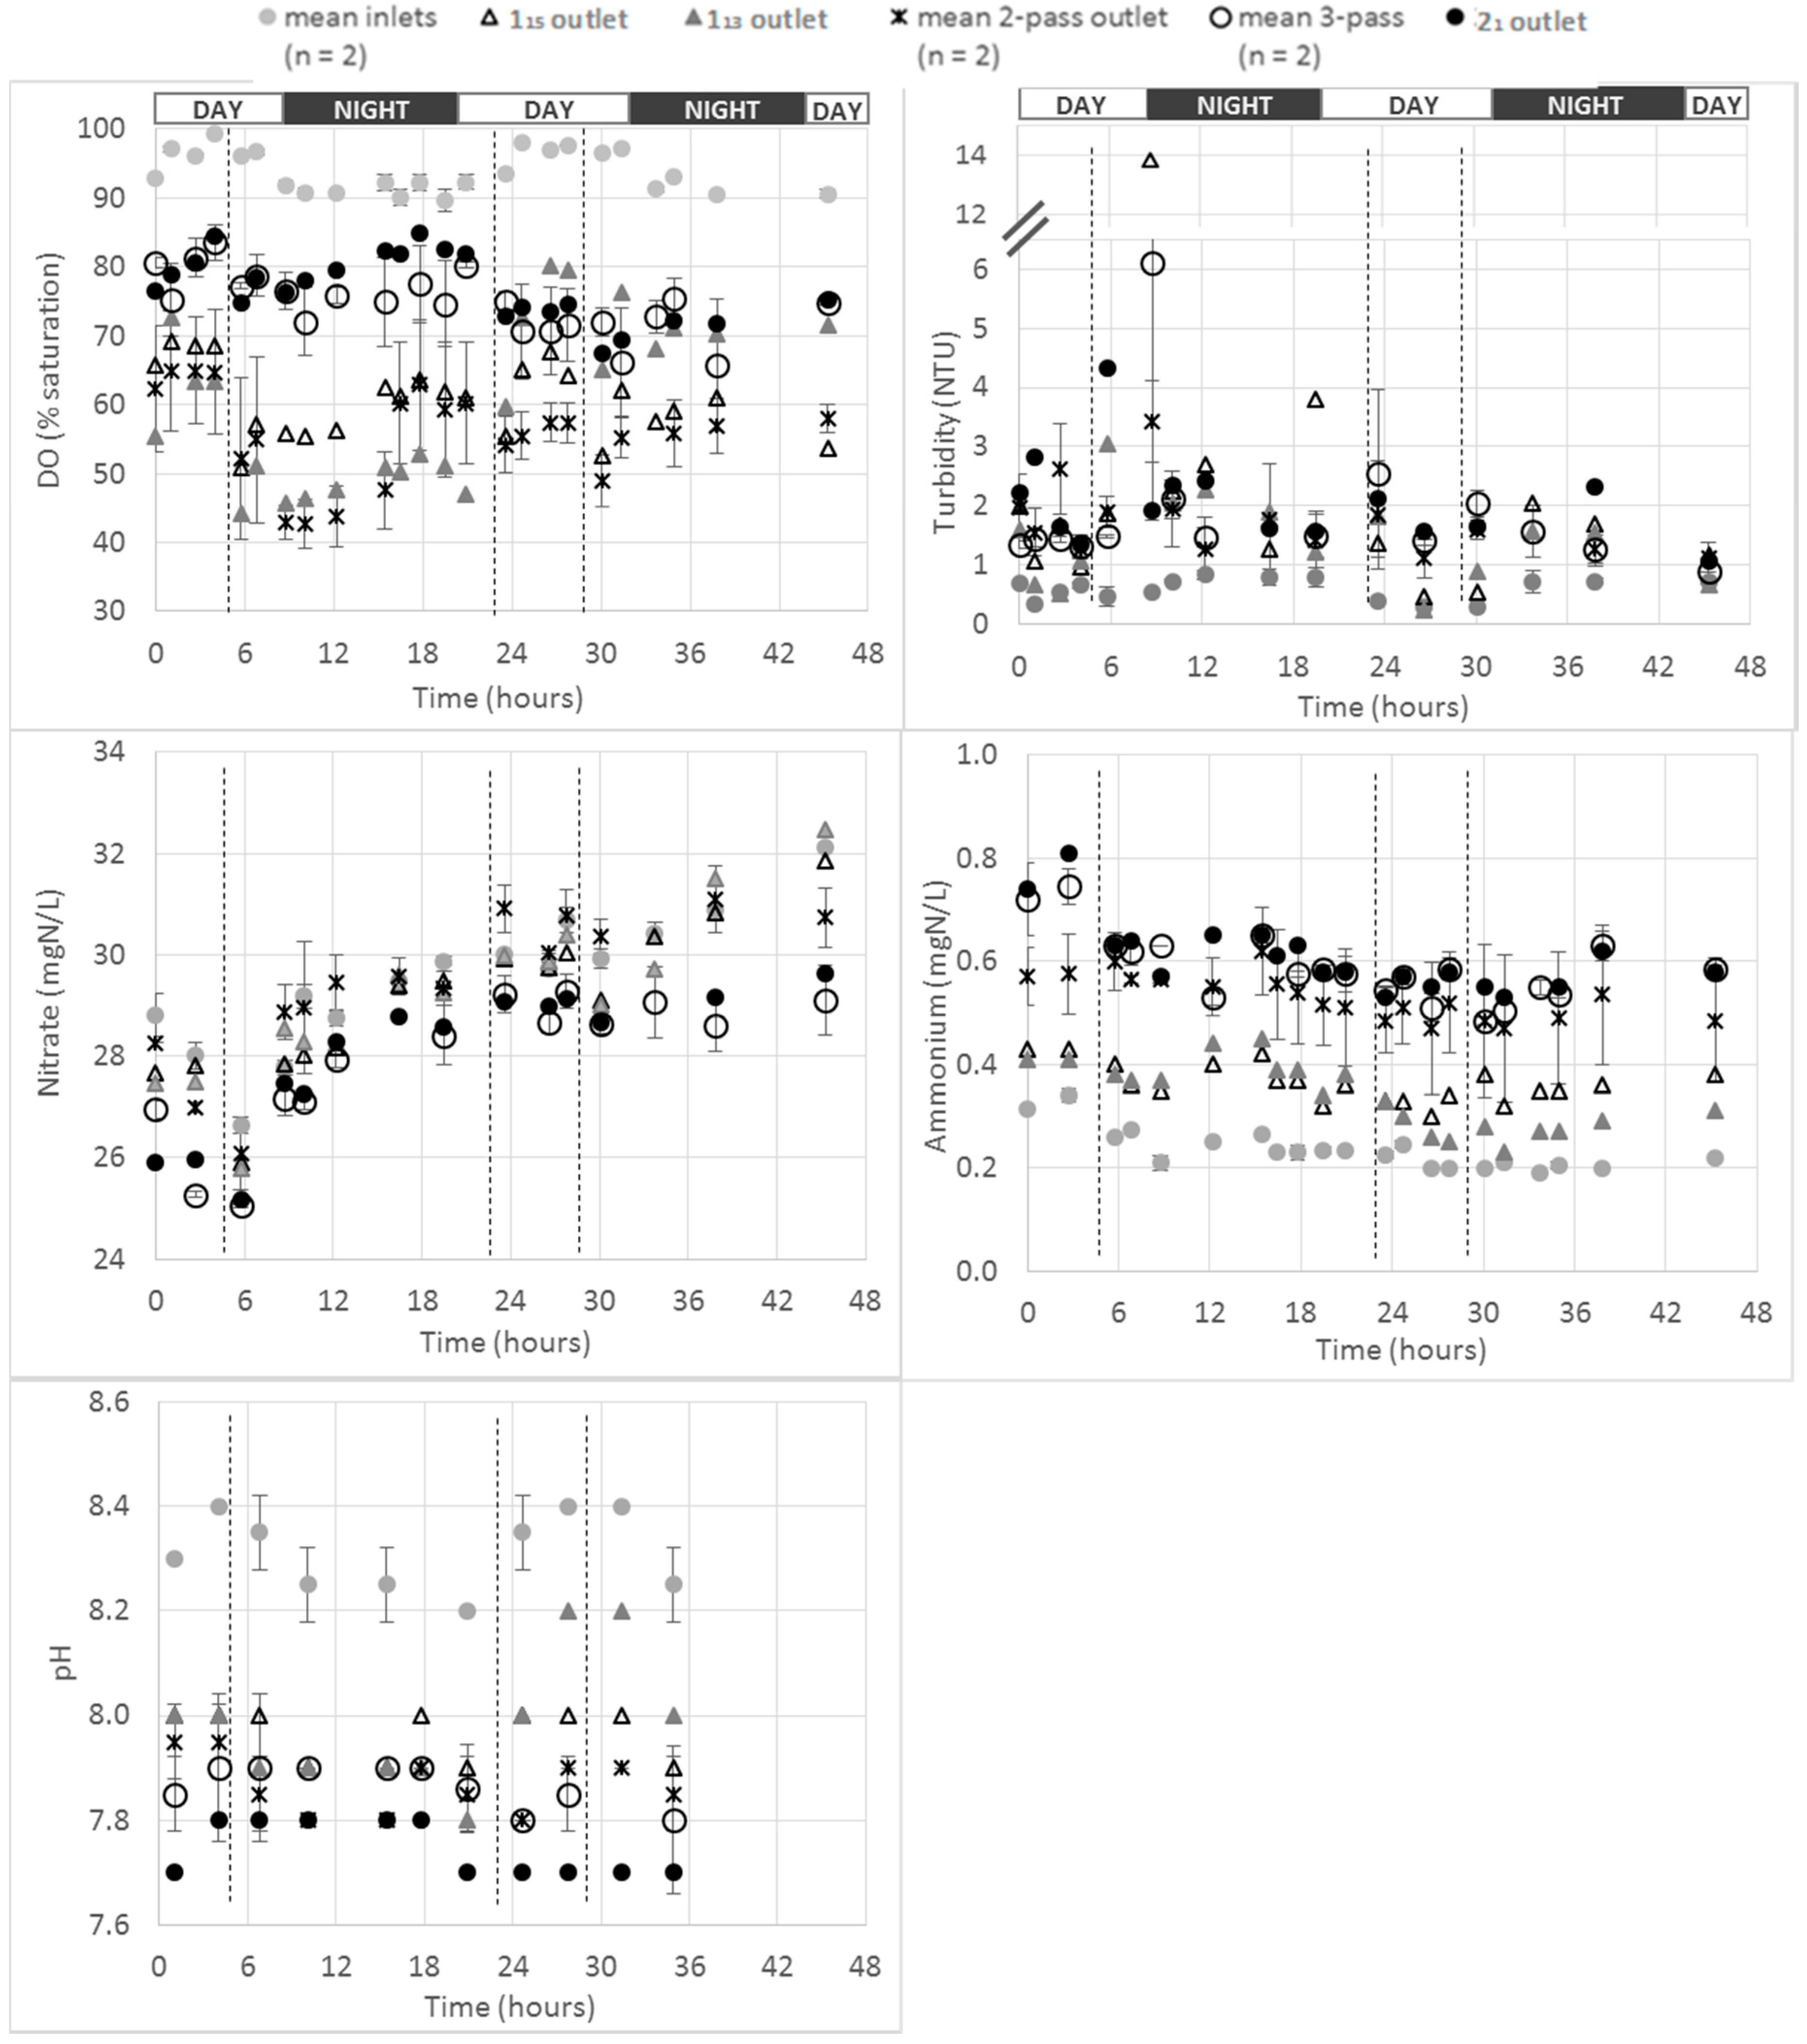
As expected, over the whole farm, the most oxygenated waters were the fish farm inlet waters, with saturation values in the range 85–100%. A higher DO saturation rate was measured during day time compared to night time (average DO values of 96% and 84%, respectively). These higher DO values during the day might be a consequence of the plants and phytoplankton photosynthesis occurring with sunlight and producing O2 [17]. The same trend was observed at the inlets of 113/115 ponds after supplementary oxygenation by the two oxygenation cones located in the inlet channels 02 and 03 (see Figure 7) and that were in operation continuously during the whole monitoring program. However, the impact of the oxygenation cones on the level of DO saturation of the water appeared to be negligible during day time (i.e., 2–3% higher in the oxygenated water (i.e., 113/115 ponds inlets) than in the inlet water from the inlet channel 00, see Supplementary Materials). This impact was revealed to be higher at night time with a difference between oxygenated and non-oxygenated water up to 10% (i.e., 84% and 94% for non-oxygenated and oxygenated water respectively, see Supplementary Materials).
The monitoring of the three “1-pass ponds” showed that a systematic drop in the DO level was observed after every feeding event. This drop appeared to occur immediately after feeding. This would coincide with an increase in fish activity and in the metabolic demands associated with digestion [18].
Interestingly, the “3-pass ponds” did not show the least oxygenated water, with values in the range 65–85% of DO saturation at their outlets. According to the flow measurement performed (see Table 1), it was demonstrated that those ponds were fed more or less directly by recirculated water (i.e., water from 21 pond). This demonstrated the efficiency of applying recirculation/supplementary oxygenation and the associated impact on DO saturation rate observed all along the farm from 21 pond to the 33 farm outlet (see Figure 7).
The least oxygenated ponds were the “2-pass ponds”, with values in the range 45–65%. These values were in the same range than the ones observed for “1-pass ponds” water from 115 (i.e., 50–70%), demonstrating the ability of paddle-wheel aerators to compensate for the loss of oxygen that occurred in those “2-pass ponds” due to fish/sediments consumption. Furthermore, the two “2-pass ponds” were not fed in any way by recirculated water (aeration of these ponds relied only on paddle-wheel aerators, see Table 2 and Section 3.1), and that could explain the relative low oxygen saturation levels observed in those ponds compared to the “3-pass ponds”. Among the two “2-pass ponds”, 23 pond had a higher DO saturation at its outlet than 22 pond during the whole monitoring period (see Supplementary Materials); this might be due to the differences in aeration systems from one pond to another (i.e., 22 being aerated with two paddle-wheel aerators and 23 with only one paddle-wheel, see Figure 7). This observation would confirm the ability of paddle-wheel aerators in compensating for the DO loss due to fish and sediments. Furthermore, 21 and 32 ponds outlets had similar DO profiles during the experiment (see Supplementary Materials). Thus, the aeration systems in operation in 32 (i.e., two paddle-wheels see Figure 7) were efficient enough to maintain the DO saturation levels higher than 70%. However, it was observed that DO levels were generally lower in 33 than in 21/32 ponds showing that the aeration system (i.e., one paddle-wheel, see Figure 7) was not efficient enough to maintain the same DO level in this pond.
2.3.2. Turbidity
As expected, the lowest turbidity levels and variability were observed for the farm inlet waters. However, the comparison of the different pond classes is not straightforward. The potential sedimentation of solids along the farm might be a potential explanation of the difficulty to analyze the results for this parameter [16,18]. The relatively low turbidity values measured (a few NTU) and the potentially high uncertainty associated with turbidity measurements at these low levels might be another potential explanation. However, the same peak of turbidity was observed for the two “1-pass ponds” (113 and 115) on the first day of monitoring (at about 8 h monitoring time) and the same general turbidity profiles were observed for those two ponds (Figure 2). The fact that the turbidity measurements were repeatable from those two ponds with similar fish characteristics (i.e., same total biomass and average fish weight, see Table 1) indicates that the turbidity measurements performed were accurate and reliable. The greater variability in turbidity was observed for the 1-pass ponds outlets (i.e., 113 and 115). This may be due to the sedimentation of suspended solids all along the farm that would have smoothed the associated turbidity profiles [16,18].
2.3.3. Nitrate
The same profile was observed for NO3–N concentrations at any farm level for the duration of the monitoring. The general increase of concentration observed at farm inlet was also observed at each level of water passes. However, the ponds associated to the highest levels of passes (i.e., “3-pass ponds” and 21) were associated to the lowest NO3–N concentrations (i.e., in the range 25–29 mgN/L) while the farm inlet concentrations were in the range 26–32 mg/L. It is noteworthy that the “3-pass ponds” and 21 pond (all fed with recirculated water) showed similar NO3–N profile. This demonstrated that, as for the DO profile, 21 pond could not be considered a “2-pass pond” for the NO3–N profile. Additionally, the “2-pass ponds” were not affected in terms of the NO3–N concentration profile by the fish farming activity. This was highlighted by the comparison with the farm inlet NO3–N concentrations that were observed to be in similar range than 2-pass ponds all along the experiment (range of 2-pass ponds 27–32 mgN/L).
2.3.4. Ammonium
A clear distinction between NH4–N levels at the farm inlets, “1-pass”, “2-pass” and “3-pass ponds” outlets was observed. As expected, the higher the number of passes is, the higher the NH4–N concentration. This demonstrates the progressive accumulation of NH4–N across the whole farm due to fish excretion and/or to progressive dissolution of sediments [16,18].
Farm inlet NH4–N concentrations were in the range 0.20–0.34 mgN/L.
The “1-pass pond” outlets’ NH4–N concentrations were in the range 0.30–0.45 mgN/L (before 113 harvest). It is noteworthy that almost the exact same NH4–N profile was obtained at the outlet of both “1-pass ponds” (i.e., 113 before harvest and 115); then, lower values were observed after 113 harvest during the second day of monitoring. This highlighted both (i) the good quality and reproducibility of the data generated regarding the use of the multisensor probes in terms of NH4–N monitoring and (ii) the impact of fish in NH4–N production in a pond.
The “2-pass ponds” average NH4–N outlet concentrations were in the range 0.47–0.62 mgN/L, which is a higher level than the ones observed for “1-pass ponds”. A great variability between the values measured for the two “2-pass ponds” considered (i.e., 22 and 23) was observed; the NH4–N concentrations were indeed systematically higher for 22, by about 0.1 mgN/L. This could be due to the different receiving waters for those two ponds (22 received water from the five 18–12 “1-pass ponds” (not monitored during this study) and 23 pond received water from the six 113–18 “1-pass ponds”). This could also be due to the different biomass reared in both 22 and 23 ponds (see Table 1).
The “3-pass” and 21 ponds NH4–N outlet concentrations were in the range 0.49–0.81 mgN/L, which was the highest range recorded over the whole farm. This observation is in agreement with both (i) the expected NH4–N accumulation across the whole farm and (ii) the water recirculation without any nitrification step to oxidize NH4–N (into NO2–N and NO3–N) leading to an NH4–N accumulation within the recirculation loop. This underpinned the impact of recirculation on the 21 pond water quality. It is noticed that the 22 pond outlet NH4–N concentrations were in the same range that those measured at “3-pass pond” outlets.
2.3.5. pH
As expected, an impact of the farm on pH values was observed with a general decrease of pH across the whole farm, likely due to the CO2 production by fish metabolism [17].
The inlet mean values were in the range 8.2–8.4 pH units with lower values generally observed at night. The “1-pass pond” outlets’ pH values were measured in the range 7.9–8.0 (before harvest for 113 pond). It is interesting to observe values up to 8.2 pH units after harvest at the 113 pond outlet (similar to the values observed at the inlet). This highlights the impact of fish on pH variation. The “2-pass ponds”, “3-pass ponds” and 21 pond outlets pH values were in the range 7.8–7.95 and 7.8–7.9 and 7.7–7.8 pH units, respectively. The lowest values were therefore observed for the recirculated water from the 21 pond. This again demonstrated the impact of recirculation on water quality. This could be due to the recirculation loop that could have brought back water with low pH into this pond. As mentioned before, this could explain the high NH4–N concentration measured in this pond.
Of note is that the ponds with the highest number of water passes had the lowest pH values and the highest NH4–N concentrations. At low pH (i.e., <8), and at the temperatures measured during this monitoring program, the ionized form of ammonia (NH4–N, relatively non-toxic to fish) is highly predominating compared to the toxic unionized form (NH3–N). Therefore, the highest NH4–N concentrations observed in the high number of passes ponds could be just an artefact due to pH variation and not due to an accumulation of fish wastes.
2.4. Impact of 1-Pass Ponds on Water Quality
Three different “1-pass ponds” were intensively monitored during the experiment (i.e., 15, 113 and 115, see Figure 7). As for the whole farm, ΔC(t), calculated as explained in Section 3.4 and using Equation (1), are presented. Fluxes, calculated as explained in Section 3.4 (Equations (2) and (3)), are also presented. The flux values will be specifically discussed in Section 2.5 below.
2.4.1. 115 Pond
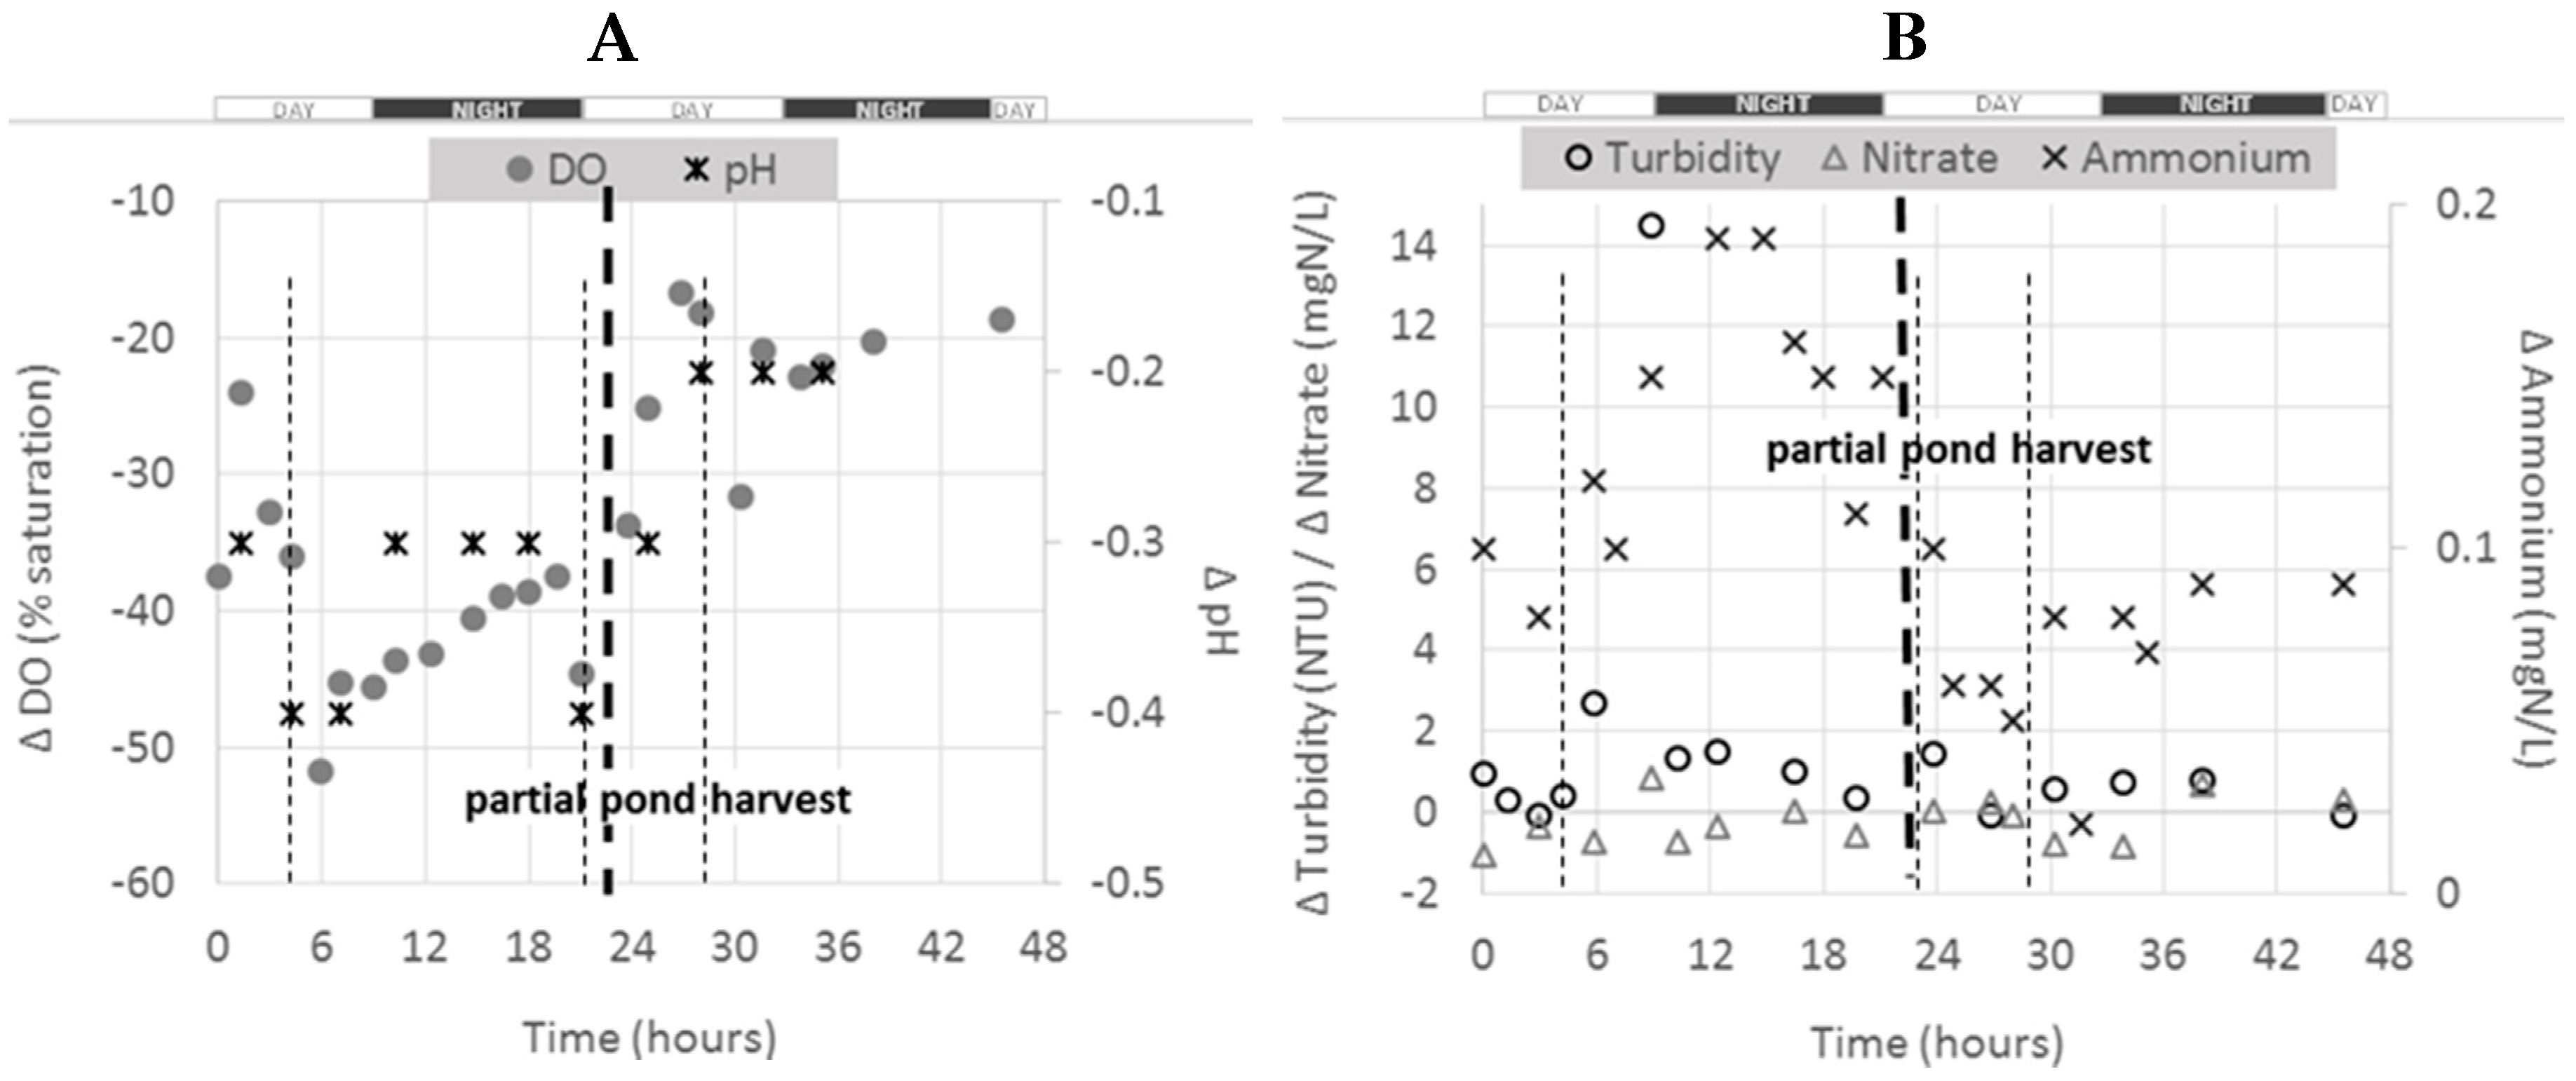
The figure below presents the pattern of ΔC between the outlet and inlet of 115 pond during the monitoring program (Figure 3).
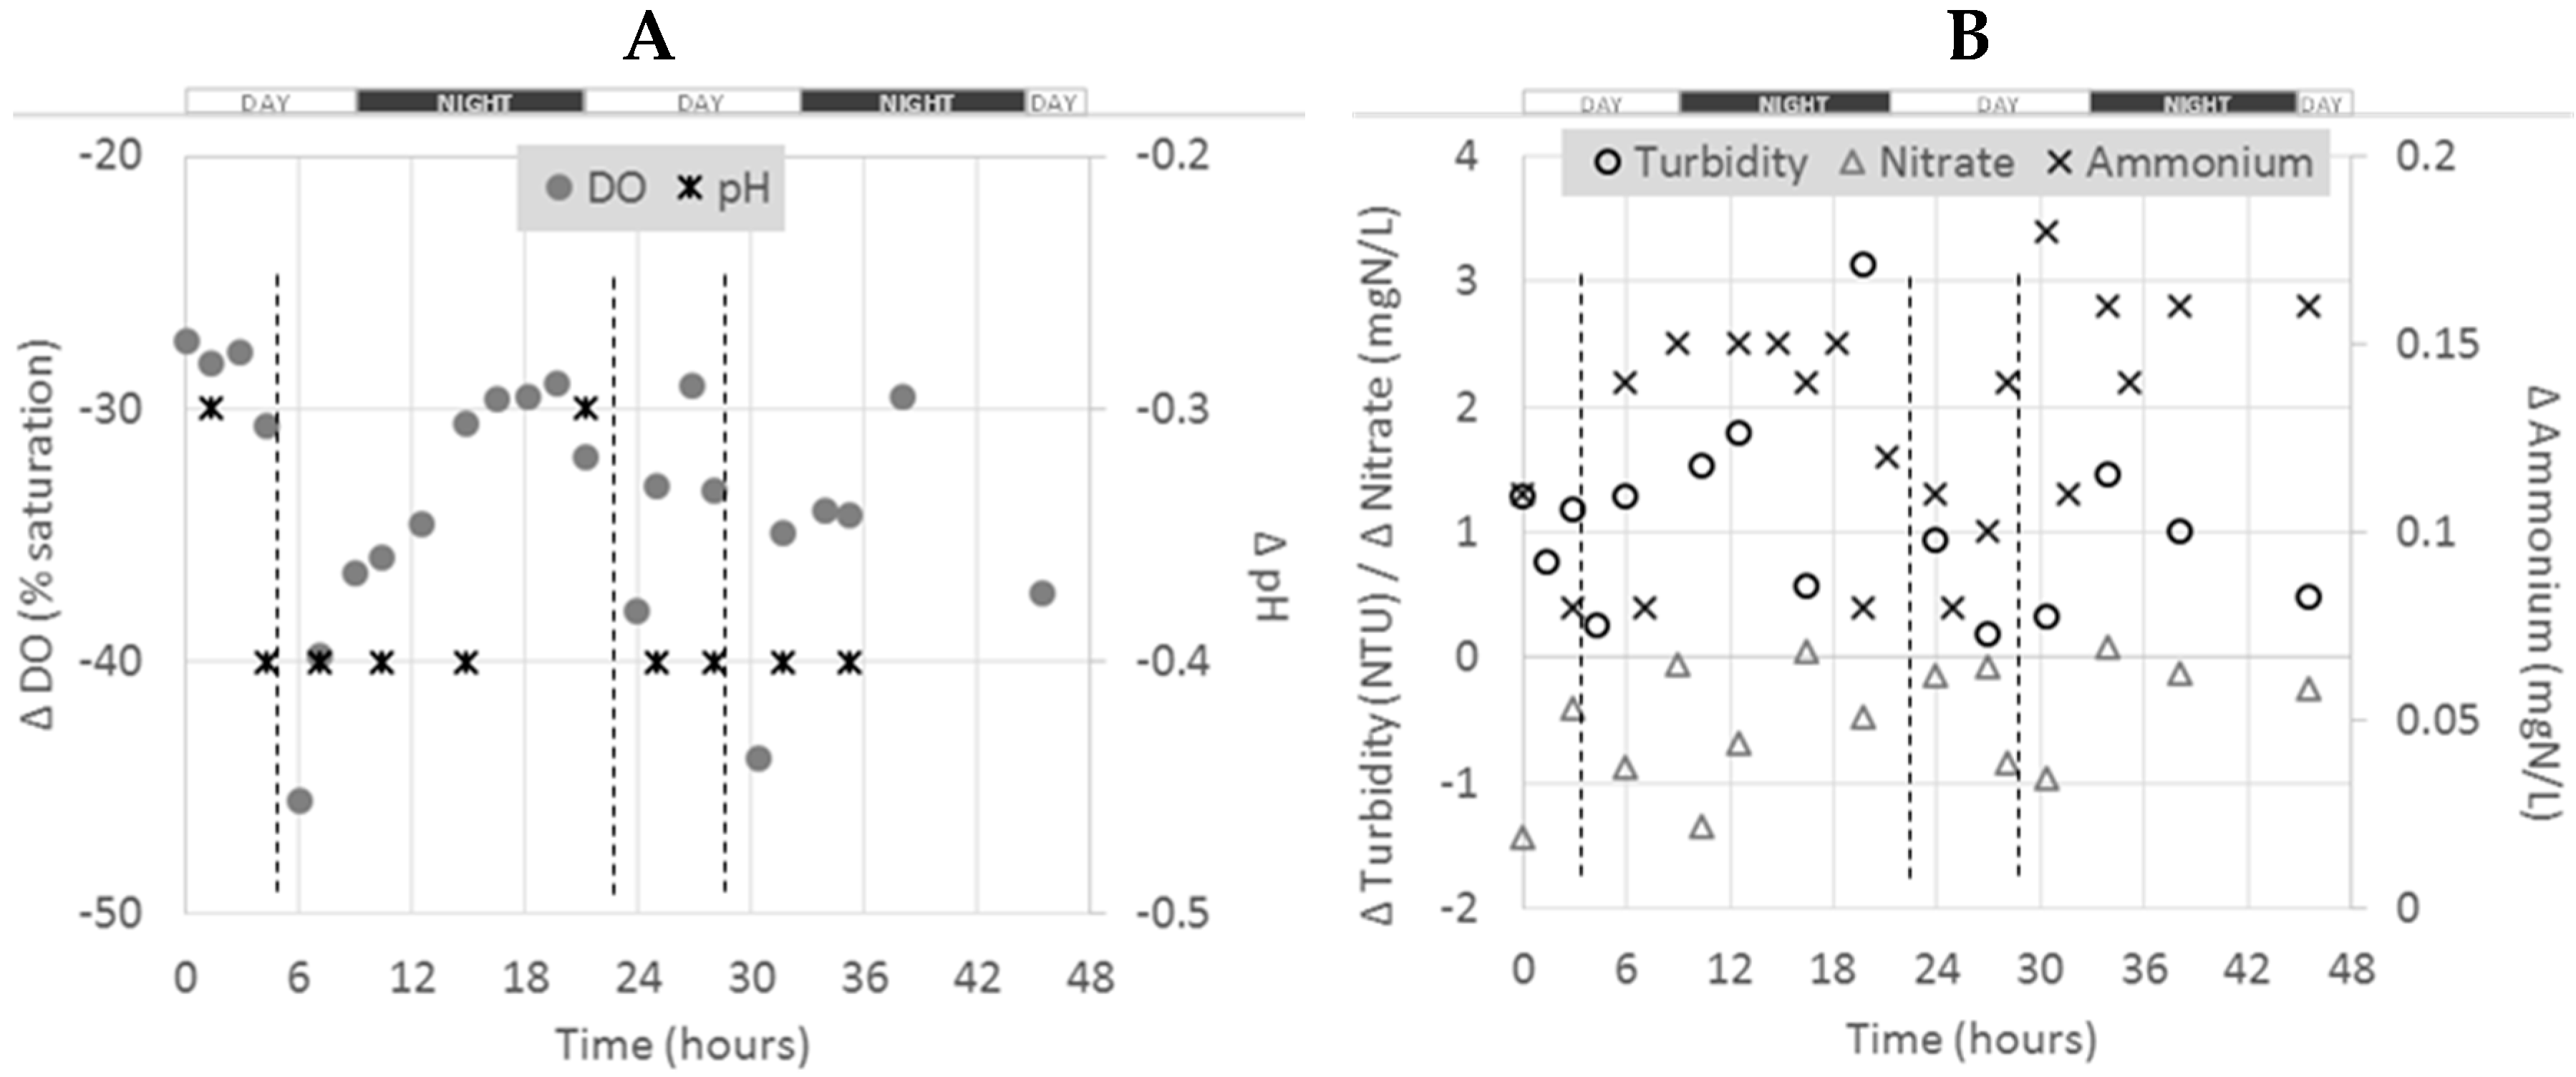
As for the whole farm scale, different trends were observed, depending on the parameter considered at this pond scale. Negative ΔC were obtained for pH, DO and NO3–N. Positive values were obtained for turbidity and NH4–N. For NO3–N, a general increase in ΔC from the beginning to the end of the experiment (from −1.5 to about 0 mgN/L) was observed. The ΔC for NH4–N was higher during night times. Dissolved oxygen showed diurnal variation also, with higher consumption (or lower ΔC) during day time with drops likely to be due to feedings [19]. No clear trends or diurnal variation were observed for the other parameters.
The ΔC data are summarized in the table below, which provides average values, associated standard deviation and the calculated fluxes for each parameter (Table 4). Fluxes data, as described in Section 3.4 are also presented.
2.4.2. 113 Pond
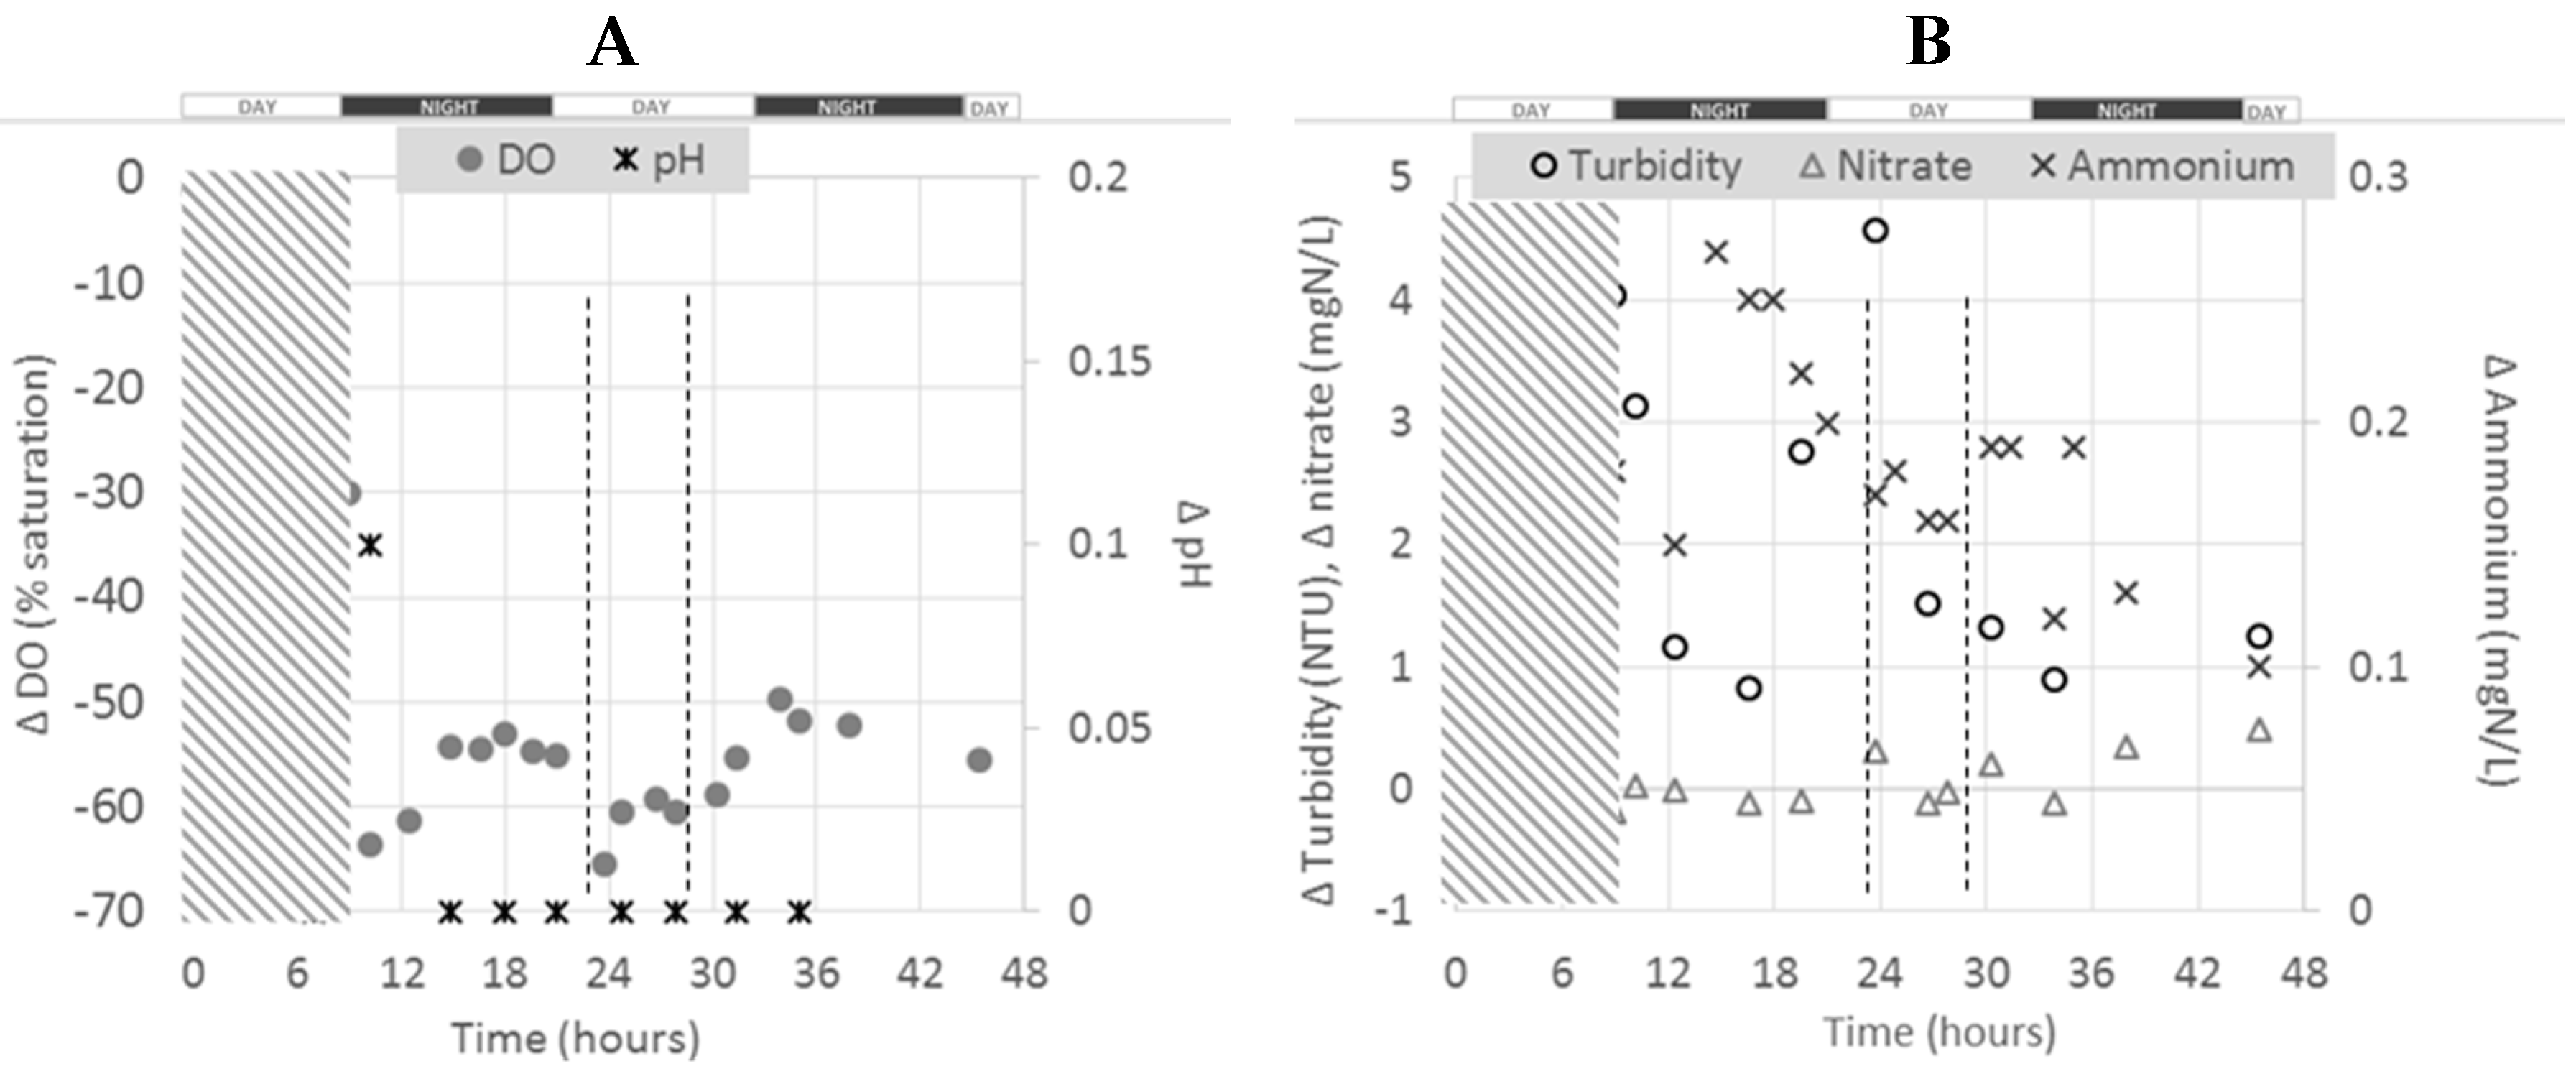
As for 115 pond, the figure below presents the evolution of ΔC between outlet and inlet of 113 pond during all the monitoring program (Figure 4). It is noticed that this pond was partially harvested on day two of the experiment (after about 24 h of monitoring) (see Table 1).
As for the whole farm and the 115 pond, negative ΔC values were observed for NO3–N, pH and DO and positive ones for turbidity and NH4–N. Before harvest, ΔC for NH4–N were higher at night, confirming the observations made for 115 pond (see Section 2.4.1). After harvest, all ΔC profiles changed for all parameters and all the absolute values were lower. As expected, the effect of the fish activity in this pond was therefore reduced after harvesting, as the total biomass was reduced (see Table 1).
The ΔC data are summarized in the table below, which provides average values, associated standard deviation and the calculated fluxes for each parameter before and after harvest (Table 5). Fluxes data, as described in Section 2.4 and according to Equations (2) and (3) are also presented.
The comparison of 115 and 113 ponds before harvest (similar total and average fish weight in those two ponds as presented in Table 1) showed very similar values, demonstrating the reproducibility of our approach. The effect of harvesting on the differential values appears very clear when results before and after harvest are compared. Mean DO consumption dropped from 40 to 23%, the mean pH difference dropped from 0.34 to 0.23 pH units, mean turbidity production dropped from 2.30 to 0.56 NTU and the mean NH4–N production dropped from 0.14 to 0.07 mgN/L.
It is noteworthy that despite the fact that the 113 pond was harvested and that only 600 kg of fish remained after harvest, the pond fluxes in terms of DO and NH4–N are not negligible. This underpins the potential impact of the sediments accumulated at the bottom of the tank might have on DO consumption or NH4–N production. The role of sediments on the residual ΔC values obtained after harvest will be discussed in Section 2.5.
2.4.3. 15 Pond
The figure below presents the evolution of ΔC between outlet and inlet of 113 pond during the entire monitoring program (Figure 5).
This pond had three main particularities compared to 113/115 ponds regarding DO:
- (1)
- It was supplied with super-saturated water from the recirculation loop (average 140% saturation rate, see Supplementary Materials),
- (2)
- It had a paddle-wheel aerator running during the experiment (see Figure 7),
- (3)
- Bigger fish than in 113/115 ponds were reared (average weight of 800 g and 220–240 g respectively, see Table 1)
The table below presents a summary of the ΔC values observed for all parameters during the whole experiment (Table 6). The amount of data is lower for this pond because the initial inlet monitoring location had to be changed for another during the experiment as the initial one was observed to be unsuitable for monitoring.
A relatively high DO consumption rate of 59 mgO2/h/kgfish compared to the ones found for 113/115 ponds (43 and 48 mgO2/h/kgfish, respectively; see Table 3 and Table 4) was observed. The NH4–N production rate was found to be similar to what was found for the other “1-pass ponds” and for the whole farm (Table 3).
Contrary to the other “1-pass ponds” monitored (i.e., 113 and 115), a paddle-wheel aerator was employed in this pond for supplementary aeration (Figure 7) and thus, had to be considered in the DO mass balance for this 15 pond. However, the impact of the paddle-wheel aerator in increasing DO levels in the pond could not be assessed.
These results regarding the higher DO consumption rate in 15 compared to 113/115 ponds was unexpected for at least two reasons:
- (1)
- The presence of a paddle-wheel aerator should have increased the DO amount received by the pond, and therefore decreased the overall consumption rate (because the calculation did not into account the O2 input from the paddle-wheel aerator).
- (2)
- From the literature [16], bigger fish are supposed to consume less O2 by mass unit than smaller ones, and the comparisons of results obtained for 15 and 113/115 ponds appeared not to confirm this statement.
The different hypotheses that might explain these results could be:
- In relation to the very high initial DO saturation rate at the inlet of this 15 pond (i.e., 140% on average) that would have modified the O2 liquid/air equilibrium and therefore could have caused a faster decrease in DO concentration within the pond (which would have caused the O2 loss by liquid/air transfer higher and give a higher apparent consumption rate).
- In relation to sediment amount at the bottom of this pond that could be higher per square meter than in 113/115 ponds that could have caused a higher sediment DO consumption rate for this 15 pond.
2.5. Outcome on Fluxes
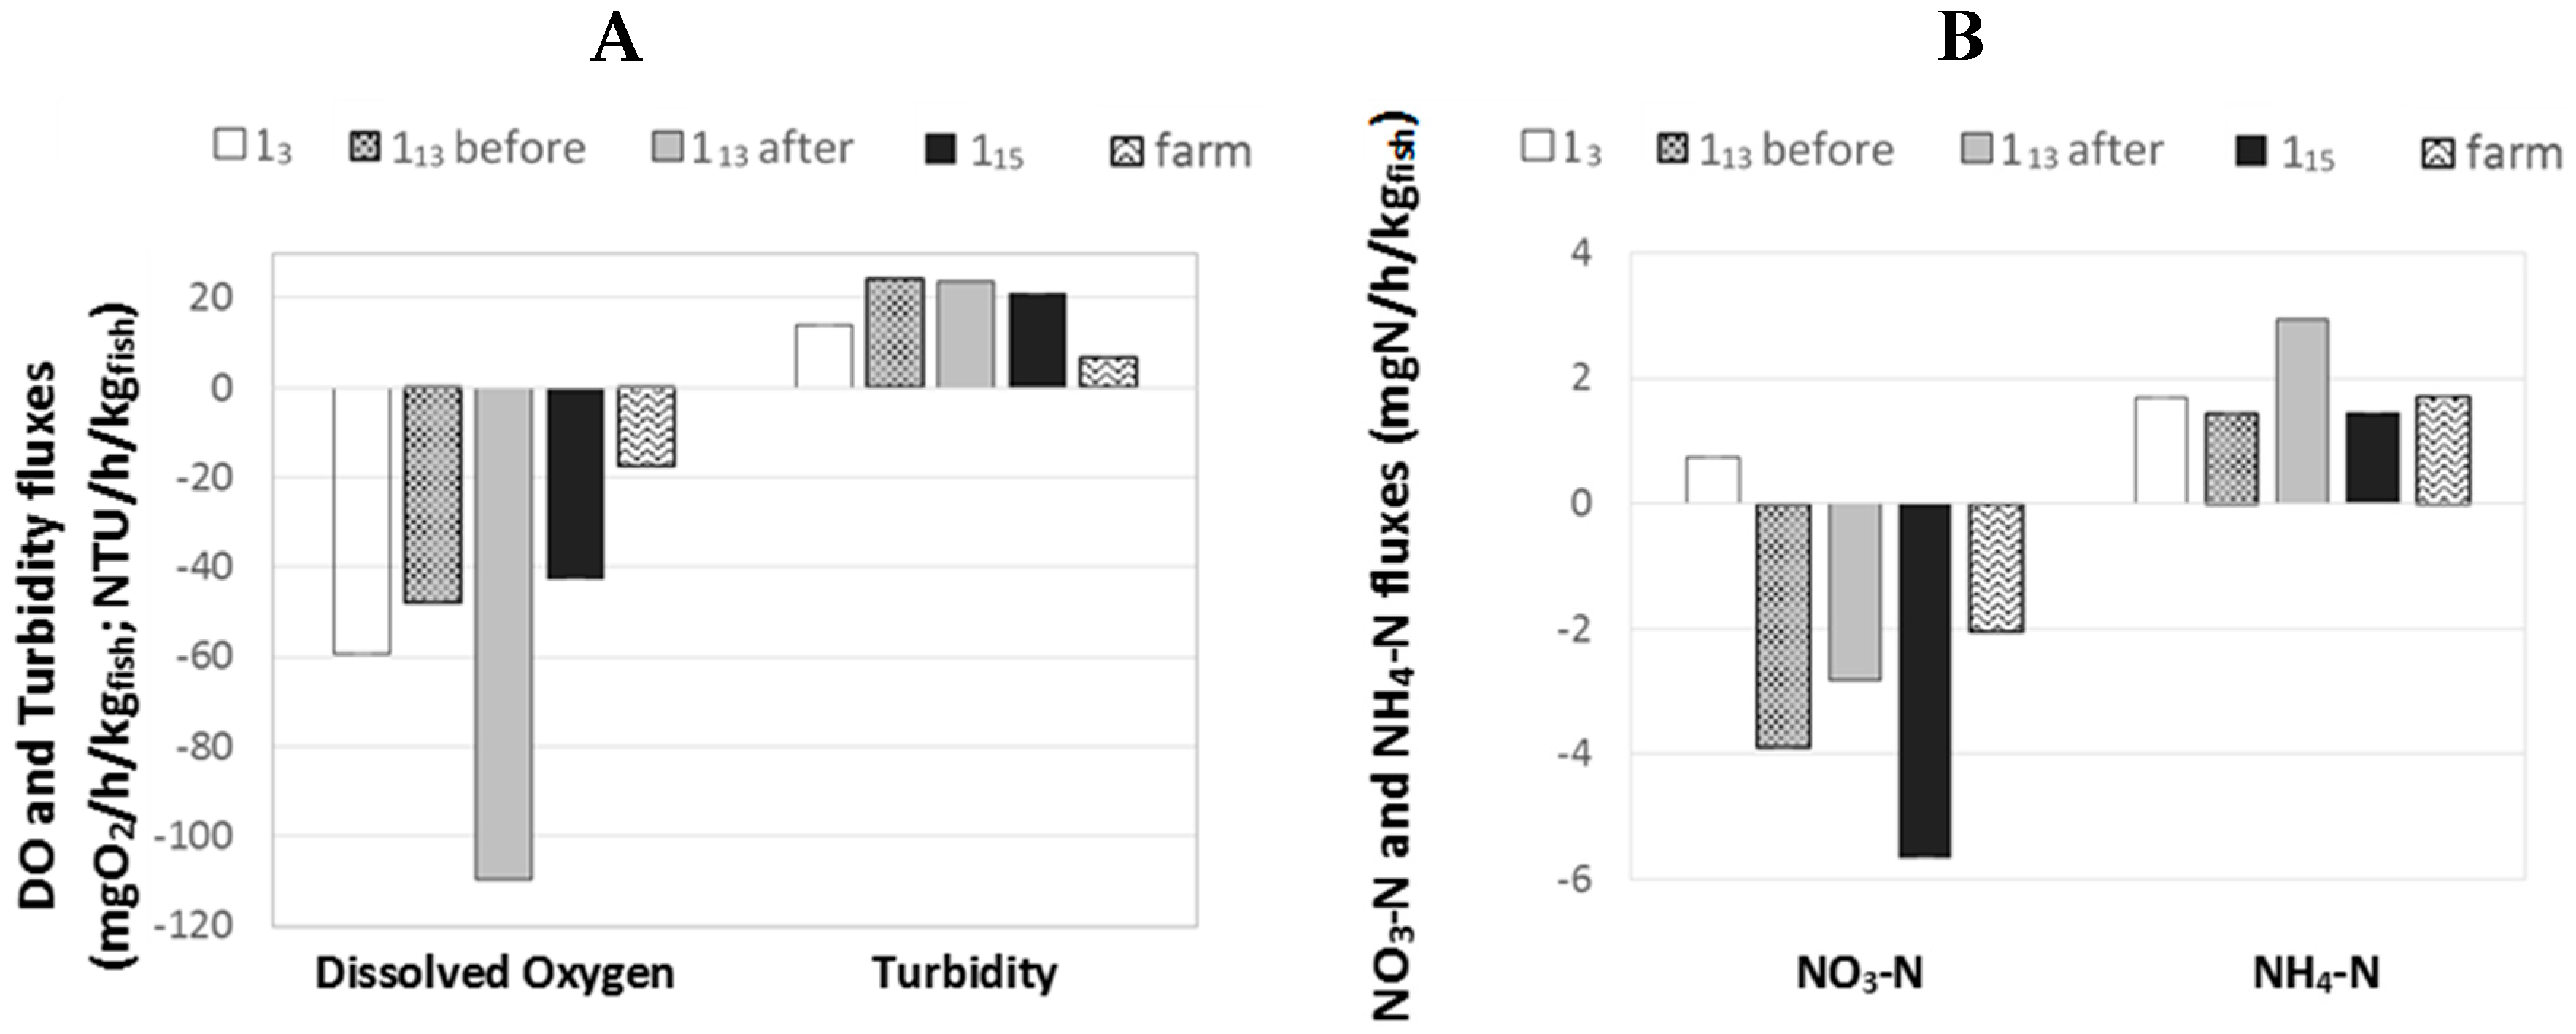
The figure below presents the mean F(t) values calculated from Equation (3) for (i) the three “1-pass ponds” monitored (i.e., 15, 113 before and after harvest and 115 ponds) and (ii) the whole farm (Figure 6).
The differences in DO fluxes between 13 and the other “1-pass ponds” were already discussed in a previous Section (Section 2.4.3) and it was assumed that the higher fluxes observed in 13 pond were due to a higher initial DO saturation rate. It is confirmed here that 113 pond before harvest and 115 pond had similar DO fluxes, with F values being −48 and −43 mgO2/h/kgfish respectively. The lower F value observed for the whole farm (i.e., F = −18 mgO2/h/kgfish) can be explained by the supply of oxygen given by both aeration and oxygenation devices across the farm that would have lowered the apparent loss of O2 at farm scale. The highest F value observed for 113 pond after harvest (i.e., −109 mgO2/h/kgfish) could be an artefact due the impact of sediments (fish faeces and uneaten feed) on the overall DO consumption. The same observation can be done for NH4–N flux with a very high F value observed for 113 after harvest compared to other ponds. It is noteworthy that no data were generated in order to quantify the potential impact of other compartments (plants, algae, phytoplankton, soil etc.) on the DO/NH4–N levels in ponds. However, no diurnal variation was observed in DO consumption after harvest in pond 113 (Figure 5); this observation would confirm that the impact of phytoplankton and plants was negligible compared to the impact of sediments and fish.
For turbidity, F values for 113 before and after harvest and for 115 were similar (i.e., 24.1, 23.6 and 20.8 NTU/h/kgfish respectively). The F value for 15 pond was slightly lower (i.e., 13.8 NTU/h/kgfish), which could be caused by the higher size of this pond and lower water velocity, which would enhance the settling capacities of this pond, increasing the amount of solids removed from water and thus the F value for turbidity. At farm scale, F value was even lower (i.e., 7.1 NTU/h/kgfish); this observation could be due to the settling capacity of the whole farm [16,18].
For NO3–N, a negative flux was observed for all ponds except 13 pond. This pond was the only one to receive some recirculated water which could have created this flux difference and this apparent NO3–N production by the pond by bringing back some low NO3–N content water into the loop.
3. Materials and Methods
3.1. Farm Description
The studied fish farm was an earth pond-based rainbow trout farm operating mostly in FT configuration with an additional recirculation loop involving a supplementary oxygenation step. The general layout of the fish farm and the different monitoring locations are presented on the figure below (Figure 7). Fish of different growth stages were distributed into the different ponds according to their weight. Fish were fed manually twice a day until apparent satiation with manufactured pellets (Efico Alfa from Biomar, Brande, Denmark, 41−44% protein, 25−28% lipid, 16−19% carbohydrate, 0.8−2.4% fiber, 4–7% ash, 0.9% total phosphorus, according to the supplier) of different size (pellets diameter) according to the size/weight of fish to be fed in each of the different ponds (see Table 1).
Supplementary oxygenation of the inlet water was achieved using oxygenation cones with supplementary aeration provided within the ponds by mechanical aerators (paddle-wheels) (Figure 7). Additionally, there was a partial recirculation of the water from 21 pond to 01 pond also involving a supplementary oxygenation step. It is noteworthy that this recirculation was applied without any water treatment system (i.e., neither solid removal nor nitrification step applied), hence this farm would still fall within the classification of “flow-through farm”.
According to the farm layout and the flow dynamic we initially defined the expected number of water passes for each pond. For one given pond, the number of water passes was defined as the number of ponds the water flowed through. As an example, all the ponds labelled 11–18 were considered as 1-pass ponds.
3.2. Water Quality and Flow Monitoring
Water quality parameters (pH, DO, NO3–N, NH4–N, temperature) were analyzed in situ using a multi-sensor probe (YSI, Xylem Inc., Tunbridge Wells, United Kingdom).
Flows were monitored in different farm locations (Figure 7) using ultrasonic flow meters (Nivus PCM4 portable ultrasonic flow measurement devices, Eppingen, Germany). Both 23 and 33 ponds outlets were monitored continuously and some other locations (15, 113, 115, 21, 22 and 32 ponds outlets) were monitored at set intervals during the monitoring program in order to understand the whole farm dynamic and to be able calculate/estimate fluxes at (i) farm outlet, and (ii) within the farm. It is noteworthy that the assumption was made that farm inlet flow (not measured) was equal to the farm outlet flow and that no water loss occurred within the farm.
3.3. Experimental Set-Up
The objective was to assess flows and water quality dynamic over the whole fish farm. As all the fish farm locations could not be monitored continuously due to lack of both time and human resources, choices of the farm locations to monitor were made in order to cover most of the farm operation and to fulfil the objectives presented in Section 1. To that aim, the farm locations monitored were the following:
- (1)
- The general inlet channel 00 as the fish farm inlet (i.e., before supplementary oxygenation by the cones, see Figure 7).
- (2)
- The inlets and outlets of three “1-pass ponds” (i.e., 15, 113 and 115, see Figure 7) that were chosen both to represent the diversity of the farm (i.e., different average fish weights, total biomass in 15 and 113/115 ponds with larger fish in 15 as presented in Table 1) and to generate results from similar ponds in order to obtain a duplication of the results and confirm that the protocol set-up was accurate (i.e., 113 and 115 with similar average fish weight and total biomass, see Table 1).
- (3)
- The outlets of all the other ponds (i.e., 2-pass, 3-pass and more) in order to identify the dynamic of the farm and to assess the influence of the number of water passes on water quality.
- (4)
- The recirculated water (from 21 to inlet channel 01, see Figure 7) in order to assess the impact of the recirculation loop on water quality.
Due to limited personnel resources and time operational constraints, only the ponds outlets’ water quality was monitored. For simplification purposes, outlet concentrations were considered as equal to those encountered within the pond themselves.
A period of two consecutive dry-weather days of monitoring was considered in order to avoid any effect on flows that would have been created by rain. It was checked that no rain event was observed upstream during the whole experiment and the week before.
3.4. Data Treatment
Differential concentrations (ΔC(t)) were calculated as being the difference between outlet and inlet concentrations for a given parameter at a given time. These concentrations were calculated using the following equation (Equation (1)):
where ΔC(t), generally expressed in mg/L (except for turbidity and pH), represents the differential concentration of a given parameter at the given time t.
These ΔC(t) were calculated at (i) farm scale (Coutlet(t) being the mean value calculated for the two farm outlets (i.e., 23 and 33) for a given time and Cinlet(t) the value measured at farm inlet (i.e., 00) at the same time for a given parameter) in order to study the impact of the whole farm on water quality, and (ii) at pond scale in order to study the impact of each monitored pond on water quality and to assess the influence of water passes on water quality. The ΔC(t) were calculated for all monitored times and also averaged for the duration of the monitoring. Hence, a positive value for ΔC(t) would mean an increase in the concentration of a given parameter from inlet to outlet, and therefore a “production” by the farm (or by the pond considered); similarly, a negative ΔC(t) value would mean a decrease in the concentration of a given parameter from inlet to outlet and therefore a “consumption” by the farm (or by the pond considered).
From the obtained ΔC(t) values, flow values were used to calculate fluxes (f(t), generally expressed in mg/h, except for pH and turbidity) both at farm and pond scales for all the monitored parameters. The f(t) were calculated as follow (Equation (2)):
where f(t) (mg/h) is the flux of a given parameter from the whole farm or from a given pond and Qoutlet (L/h) the flow at the outlet of the farm or of a given pond.
Those fluxes were converted using the total biomass in presence in each pond (see Table 1) to obtain fluxes in mg/h/kgfish. according to the following equation (Equation (3)):
With mT,pond (kgfish), the total biomass in the pond considered.
All F(t) values were averaged for the farm and for the monitored ponds for all the monitored parameters to obtain comparable mean flux values between the different ponds monitored.
4. Conclusions
A traditional flow-through rainbow trout farm was monitored extensively for the first time in Ireland. It is recalled that traditional flow-through systems still represent 90% of the trout production at the country scale today, and even if practices are evolving through recirculated aquaculture systems (RAS), this type of practice remains very common at the EU scale (France, Poland, Czech Republic, etc.). Therefore, the results and observations from this study are very relevant to the industry.
A combination of flow and water quality monitoring made it possible to understand the dynamics of water and its nutrient and dissolved oxygen content. To allow for a better understanding and analysis of the results, the concept of “multi water passes” was defined as the number of ponds the water flows through before release at the farm outlet. The flow measurements performed illustrated the difficulty in assigning a number of water passes to each pond, and the results obtained were not in agreement with the expected number of water passes (negligible or even negative flows observed at some farm locations). Thus, this study gives the impact and limits of multi water reuse on water quality and of the implementation of supplementary aeration/oxygenation, still practiced broadly in Ireland and in Europe. Furthermore, this study made it possible to attain proper and independent monitoring of the effluent water quality of the farm effluent and of the impact it might have on the receiving water quality.
The impact of water passes on water quality was identified, with a notable increase in NH4–N concentrations when the number of water passes increases. However, the loss in DO was globally compensated by the oxygenation/aeration technologies (oxygenation cones, recirculation loop and paddlewheel aerators) employed onsite. The role of sediments in DO consumption and NH4–N production was clearly identified as being substantial, and sediments could be responsible for a significant DO consumption, which has to be compensated by the operation of some oxygenation/aeration devices with their associated costs (energy, investment). It is, therefore, recommended for fish farmers still employing traditional flow-through systems to “de-sludge” their ponds more frequently in order to limit DO loss and NH4–N increase in the rearing water.
The industry has to produce more to be economically viable in the future [20]. However, it was shown during the present study that ammonium levels increased with the number of water passes, and that it could reach concentrations up to almost 1 mgN/L in ponds. This shows that increasing production in the same farm configuration would increase nutrients concentration even more, which could hamper production due to an expected impact on fish health from this concentration [21]. Thus, with regards to fish welfare, the outcomes of this study make it possible to identify areas and practices within the FT systems that show water quality levels close to threshold levels for fish welfare. From this, appropriate actions and practices can be implemented. Therefore, if this fish farm were to produce more, some water treatment processes (solid/liquid separation, nitrification) would have to be set up in order to both limit the build-up of nutrients in the rearing water and to reduce the nutrient release in the effluent to fulfil the WFD objectives. It also identifies performances of the industry with respect to the WFD, criteria thereby facilitating gap analysis for the implementation of water treatment technologies. Finally, this study also acts as a benchmark for the industry to define what improvements are required and develop a roadmap for the sustainable development of the freshwater aquaculture sector in Ireland and beyond (specifically for trout production).
Supplementary Materials
The following are available online at https://www.mdpi.com/2410-3888/3/3/28/s1, raw data excel files.
Author Contributions
Conceptualization, A.T. and R.D.F.; Data curation, A.T. and A.K.; Formal analysis, A.T., R.D.F. and E.C.; Funding acquisition, A.K. and R.D.F.; Investigation, E.C. and N.R.; Methodology, A.T. and A.K.; Project administration, A.K. and E.C.; Supervision, E.C. and N.R.; Validation, A.K., E.C. and N.R.; Visualization, R.D.F.; Writing—original draft, A.T.; Writing—review & editing, A.T.
Funding
The authors express gratitude to Ireland’s Department of Agriculture, Food and the Marine for supporting this study through the MOREFISH project and Bord Iascaigh Mhara for supporting the EcoAqua project.
Acknowledgments
The authors would like to acknowledge Ronan Cooney (MSc. NUIG) and Conor Behan (MSc. NUIG) for their active participation to the monitoring campaigns.
Conflicts of Interest
The authors declare no conflict of interest.
References
- Guilpart, A.; Roussel, J.-M.; Aubin, J.; Caquet, T.; Marle, M.; Le Bris, H. The use of benthic invertebrate community and water quality analyses to assess ecological consequences of fish farm effluents in rivers. Ecol. Indic. 2012, 23, 356–365. [Google Scholar] [CrossRef]
- Donnely, N. Potential Diversification Opportunities for the Land-Based Aquaculture Sector in Northern Ireland; European Union: Brussels, Belgium, 2011; p. 144. [Google Scholar]
- Krause, G.; Brugere, C.; Diedrich, A.; Ebeling, M.W.; Ferse, S.C.A.; Mikkelsen, E.; Pérez Agúndez, J.A.; Stead, S.M.; Stybel, N.; Troell, M. A revolution without people? Closing the people-policy gap in aquaculture development. Aquaculture 2015, 447, 44–55. [Google Scholar] [CrossRef]
- Jokumsen, A.; Svendsen, L.M. Farming of Freshwater Rainbow Trout in Denmark; Technical University of Denmark, National Institute of Aquatic Resources, DTU Aqua: Charlottenlund, Denmark, 2010; p. 50. [Google Scholar]
- Sturrock, H.; Newton, R.; Paffrath, S.; Bostock, J.; Muir, J.; Young, J.; Immink, A.; Dickson, M. Prospective Analysis of the Aquaculture Sector in the EU—Part 2: Characterisation of Emerging Aquaculture Systems; JRC—European Commission: Ispra, Italy, 2008. [Google Scholar]
- Martins, C.I.M.; Eding, E.H.; Verdegem, M.C.J.; Heinsbroek, L.T.N.; Schneider, O.; Blancheton, J.P.; d’Orbcastel, E.R.; Verreth, J.A.J. New developments in recirculating aquaculture systems in Europe: A perspective on environmental sustainability. Aquac. Eng. 2010, 43, 83–93. [Google Scholar] [CrossRef]
- European Commission (EC). Directive 2000/60/EC of the European Parliament and of the Council Establishing a Framework for the Community Action in the Field of Water Policy; European Commission, Ed.; European Commission: Ispra, Italy, 2000. [Google Scholar]
- Aubin, J.; Tocqueville, A.; Kaushik, S. Characterization of waste output from flow-through trout farms in France: Comparison of nutrient mass-balance modelling and hydrological methods. Aquat. Living Resour. 2011, 24, 63–70. [Google Scholar] [CrossRef]
- Garcia, F.; Kimpara, J.M.; Valenti, W.C.; Ambrosio, L.A. Emergy assessment of tilapia cage farming in a hydroelectric reservoir. Ecol. Eng. 2014, 68, 72–79. [Google Scholar] [CrossRef]
- Lalonde, B.A.; Ernst, W.; Garron, C. Chemical and physical characterization of effluents from land-based fish farms in Atlantic Canada. Aquac. Int. 2015, 23, 535–546. [Google Scholar] [CrossRef]
- Lazzari, R.; Baldisserotto, B. Nitrogen and phosphorus waste in fish farming. Bol. Inst. Pesca 2008, 34, 591–600. [Google Scholar]
- Sindilariu, P.D.; Brinker, A.; Reiter, R. Factors influencing the efficiency of constructed wetlands used for the treatment of intensive trout farm effluent. Ecol. Eng. 2009, 35, 711–722. [Google Scholar] [CrossRef]
- Verdegem, M.C.J. Nutrient discharge from aquaculture operations in function of system design and production environment. Rev. Aquac. 2013, 5, 158–171. [Google Scholar] [CrossRef]
- Caramel, B.; Moraes, M.; Carmo, C.; Vaz-dos-Santos, A.; Tabata, Y.; Osti, J.; Ishikawa, C.; Cerqueira, M.; Mercante, C. Water quality assessment of a trout farming effluent, Bocaina, Brazil. J. Water Resour. Prot. 2014, 6, 909–915. [Google Scholar] [CrossRef]
- Roque d’Orbcastel, E.; Person-Le Ruyet, J.; Le Bayon, N.; Blancheton, J.P. Comparative growth and welfare in rainbow trout reared in recirculating and flow through rearing systems. Aquac. Eng. 2009, 40, 79–86. [Google Scholar] [CrossRef]
- Boyd, C.; Tucker, C. Pond Aquaculture Water Quality Management; Kluwer Academic Publishers: Boston, MA, USA, 1998; p. 700. [Google Scholar]
- Lawson, T.B. Fundamentals of Aquacultural Engineering; Kluwer Academic Publishers: Boston, MA, USA, 1995; p. 362. [Google Scholar]
- Hargreaves, J.A.; Tucker, C.S. Managing Ammonia in Fish Ponds; Southern Regional Aquaculture Center: Stoneville, MS, USA, 2004. [Google Scholar]
- Alsop, D.; Wood, C. The interactive effects of feeding and exercise on oxygen consumption, swimming performance and protein usage in juvenile rainbow trout (Oncorhynchus mykiss). J. Exp. Biol. 1997, 200, 2337. [Google Scholar] [PubMed]
- Irish Department of Agriculture, Food and the Marine (DAFM). National Strategic Plan for Sustainable Aquaculture; Irish Department of Agriculture, Food and the Marine: Dublin, Ireland, 2015.
- Haywood, G.P. Ammonia toxicity in teleost fishes: A review. In Canadian Technical Report of Fisheries and Aquatic Sciences; Department of Fisheries and Oceans–Fisheries Research Branch: Nanaimo, British Colombia, Canada, 1983; Volume 1177. [Google Scholar]
Figure 1.
Whole farm differential values between outlets and inlet of dissolved oxygen (DO), turbidity (in NTU (Nephelometric Turbidity Unit)), nitrate, ammonium and pH during the monitoring program. Vertical dash lines represent feeding times.
Figure 1.
Whole farm differential values between outlets and inlet of dissolved oxygen (DO), turbidity (in NTU (Nephelometric Turbidity Unit)), nitrate, ammonium and pH during the monitoring program. Vertical dash lines represent feeding times.

Figure 2.
Average evolution of water quality (i.e., dissolved oxygen saturation rate, turbidity, nitrate, ammonium and pH) at the farm inlets and in “1-pass”, “2-pass”, “3-pass” and 21 ponds outlets. Vertical dash lines represent feeding times.
Figure 2.
Average evolution of water quality (i.e., dissolved oxygen saturation rate, turbidity, nitrate, ammonium and pH) at the farm inlets and in “1-pass”, “2-pass”, “3-pass” and 21 ponds outlets. Vertical dash lines represent feeding times.

Figure 3.
Pond 115 differential values between outlet and inlet for dissolved oxygen and pH (A) and for turbidity, nitrate and ammonium (B) during the monitoring program. Vertical dash lines represent feeding times.
Figure 3.
Pond 115 differential values between outlet and inlet for dissolved oxygen and pH (A) and for turbidity, nitrate and ammonium (B) during the monitoring program. Vertical dash lines represent feeding times.

Figure 4.
Pond 113 differential values between outlet and inlet for dissolved oxygen and pH (A) and for turbidity, nitrate and ammonium (B) during the monitoring program. Vertical light dash lines represent feeding times.
Figure 4.
Pond 113 differential values between outlet and inlet for dissolved oxygen and pH (A) and for turbidity, nitrate and ammonium (B) during the monitoring program. Vertical light dash lines represent feeding times.

Figure 5.
Pond 15 differential values between outlet and inlet for dissolved oxygen and pH (A) and for turbidity, nitrate and ammonium (B) during the monitoring program. The inlet monitoring location was changed after 8 h of monitoring. Vertical dash lines represent feeding times.
Figure 5.
Pond 15 differential values between outlet and inlet for dissolved oxygen and pH (A) and for turbidity, nitrate and ammonium (B) during the monitoring program. The inlet monitoring location was changed after 8 h of monitoring. Vertical dash lines represent feeding times.

Figure 6.
Mean fluxes calculated for DO, turbidity (A), NO3–N and NH4–N (B) at different farm levels (1-pass ponds and whole farm).
Figure 6.
Mean fluxes calculated for DO, turbidity (A), NO3–N and NH4–N (B) at different farm levels (1-pass ponds and whole farm).

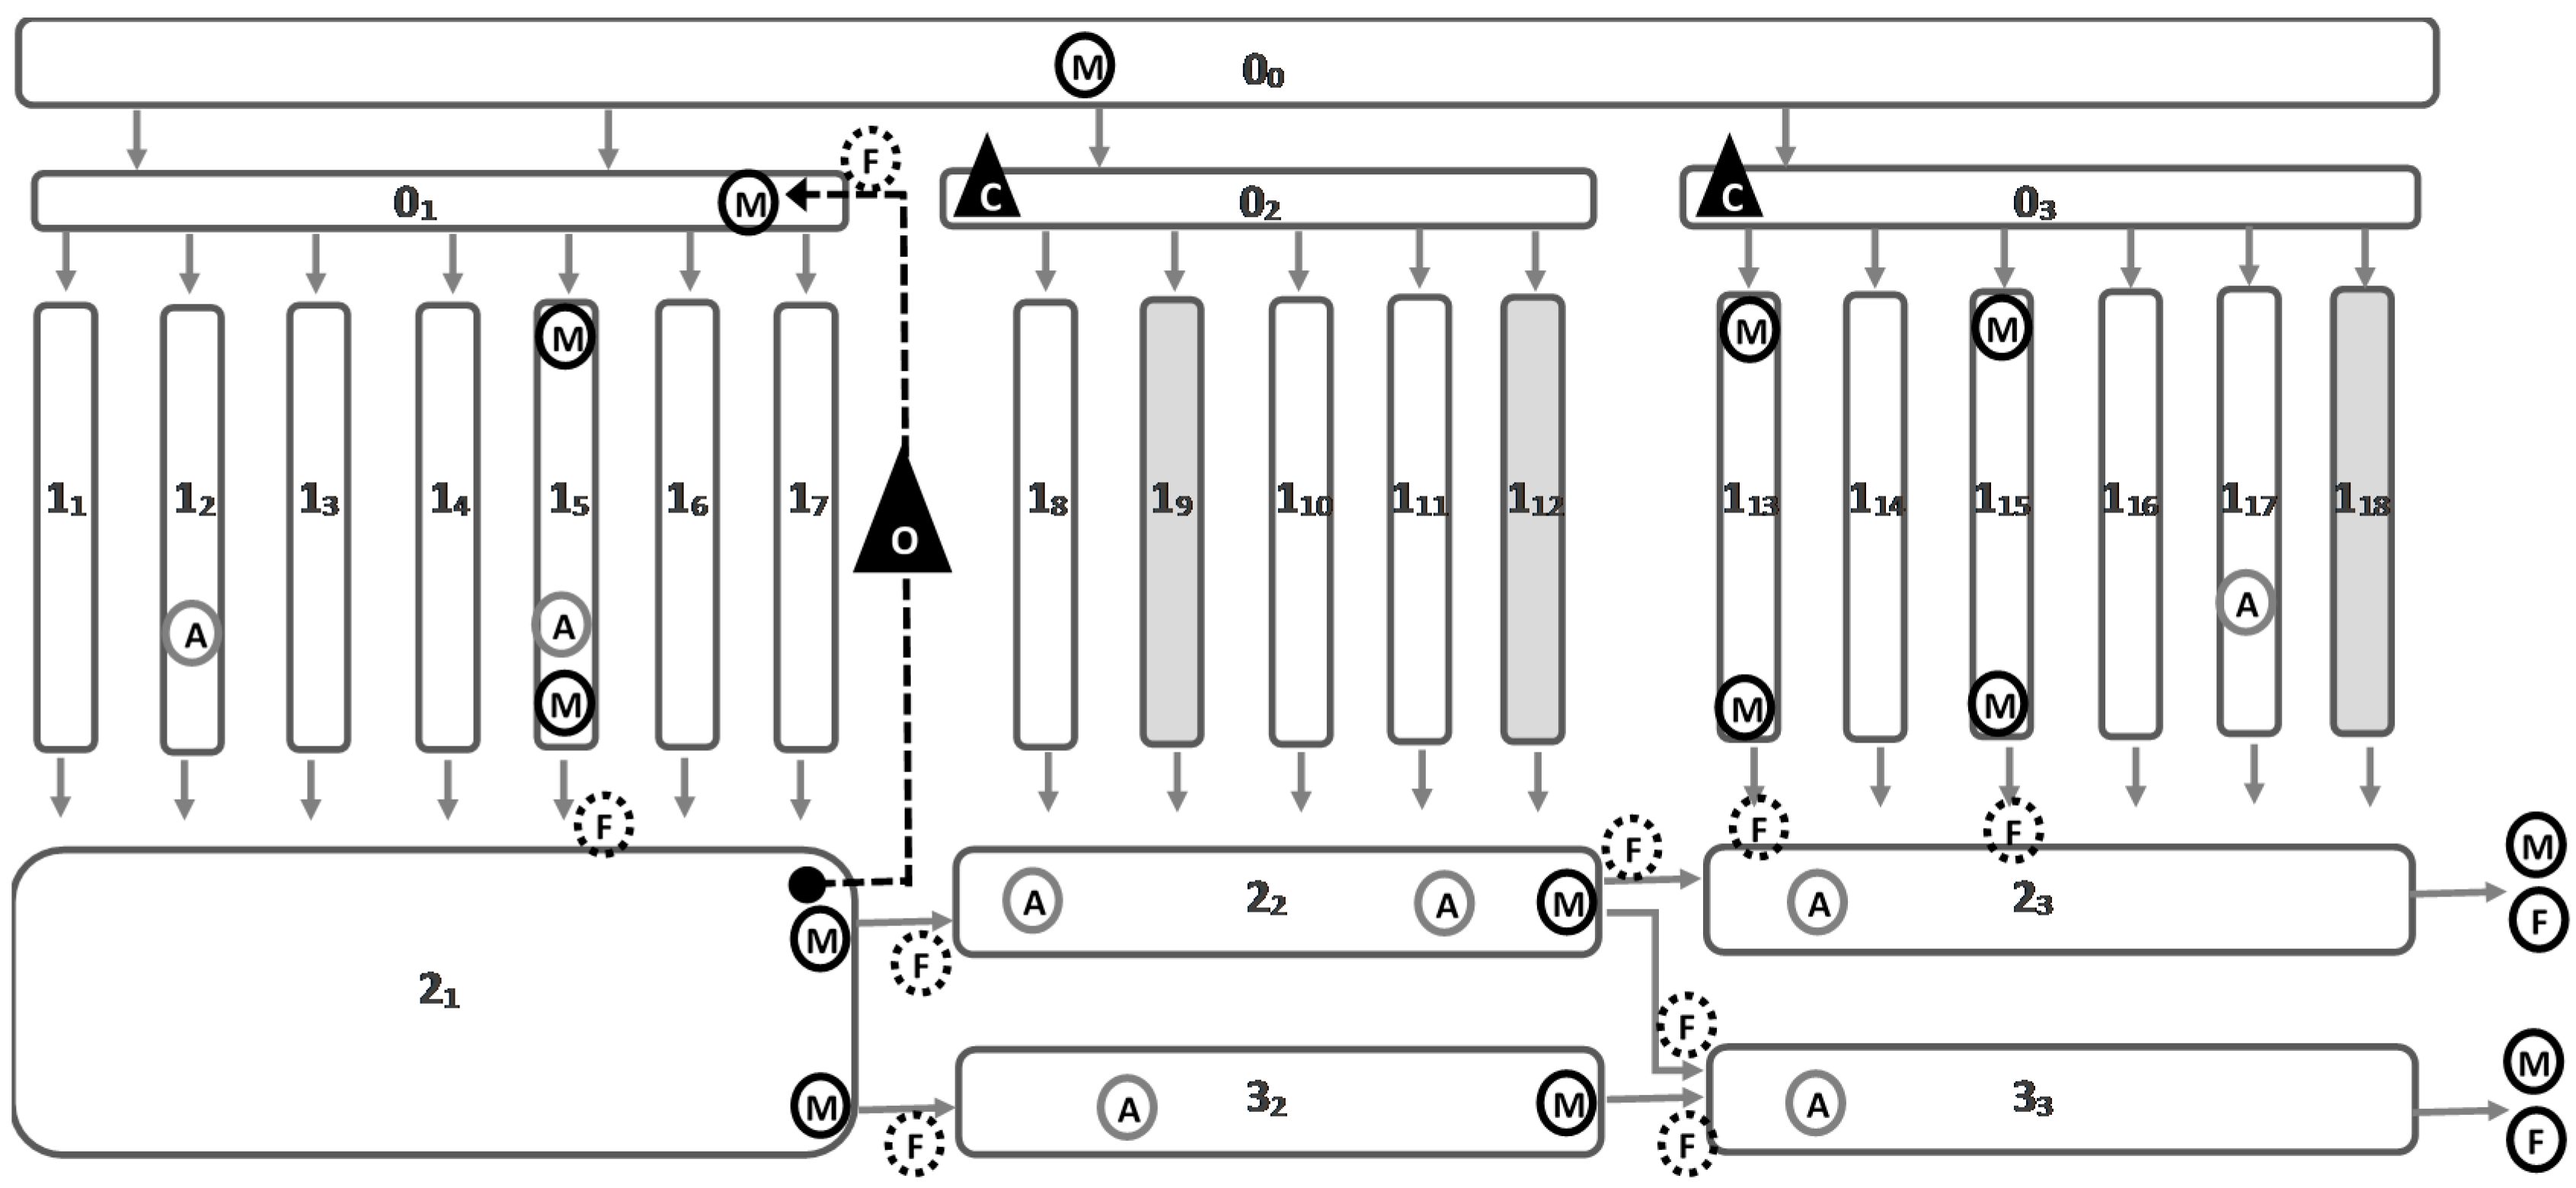
Figure 7.
Fish farm general layout (A: paddle-wheel aerator, C: oxygen cone; O: high pressure oxygenator; M: physico-chemical monitoring location; F: water flow monitoring location). Some ponds (i.e., 19, 112 and 118) were not stocked at the moment of monitoring, they are represented in grey. The figures 0, 1, 2 and 3 are theoretical numbers of water uses.

Table 1.
Outcome of fish data for the whole fish farm at the moment of the experiment. The figures 0, 1, 2 and 3 for ponds number are theoretical numbers of water uses (see Figure 7).
Table 1.
Outcome of fish data for the whole fish farm at the moment of the experiment. The figures 0, 1, 2 and 3 for ponds number are theoretical numbers of water uses (see Figure 7).
| FISH | |||||
|---|---|---|---|---|---|
| Pond | Volume | No. of Fish | Average Weight | Biomass | Stocking Density |
| m3 | g/Fish | kg | kg/m3 | ||
| 11 | 121 | 3000 | 667 | 2000 | 17 |
| 12 | 144 | 3069 | 558 | 1713 | 12 |
| 13 | 147 | 12,000 | 170 | 2040 | 14 |
| 14 | 153 | 7696 | 610 | 4695 | 31 |
| 15 | 140 | 9736 | 800 | 7789 | 56 |
| 16 | 159 | 12,000 | 170 | 2040 | 13 |
| 17 | 122 | 5409 | 980 | 5301 | 43 |
| 18 | 86 | 15,750 | 200 | 3150 | 37 |
| 19 | 68 | 0 | / | 0 | 0 |
| 110 | 56 | 10,500 | 260 | 2730 | 49 |
| 111 | 44 | 10,500 | 260 | 2730 | 62 |
| 112 | 41 | 0 | / | 0 | 0 |
| 113 | 33 | 10,080 | 240 | 2400 | 73 |
| after harvest | nd | 600 | 19 | ||
| 114 | 25 | 10,080 | 220 | 2218 | 89 |
| 115 | 32 | 8000 | 280 | 2240 | 70 |
| 116 | 39 | 8000 | 220 | 1760 | 45 |
| 117 | 36 | 8000 | 220 | 1760 | 49 |
| 118 | 16 | 0 | / | 0 | 0 |
| 21 | 592 | 6000 | 1600 | 9600 | 16 |
| 22 | 207 | 6500 | 1300 | 8450 | 41 |
| 23 | 256 | 11,041 | 1330 | 14,685 | 57 |
| 32 | 301 | 1800 | 1100 | 1980 | 7 |
| 33 | 435 | 1283 | 1400 | 1796 | 4 |
Table 2.
Outcome of flow data measured on the selected fish farm locations at the moment of the experiment. Standard deviation (St. Dev.); Minimum (Min.); Maximum (Max.).
Table 2.
Outcome of flow data measured on the selected fish farm locations at the moment of the experiment. Standard deviation (St. Dev.); Minimum (Min.); Maximum (Max.).
| FLOW | ||||||
|---|---|---|---|---|---|---|
| Pond | Mean Value | St. Dev. | Min. | Max. | Number | Comment |
| L/s | L/s | L/s | L/s | |||
| 15 | 19.9 | 17.5 | 24.5 | 35 | ||
| 113 | 7.3 | 0.1 | 7.3 | 7.4 | 10 | |
| 115 | 6.8 | 0.7 | 5.9 | 7.5 | 39 | |
| 21 | −1.8 | 0.2 | −1.3 | −2.1 | 11 | 21 outlet 1 |
| 35.2 | 2.3 | 29.8 | 37.2 | 42 | 21 outlet 2 | |
| 66.1 | 4.3 | 0.0 | 96.3 | 370 | recirculation | |
| 22 | 6.0 | 0.8 | 4.4 | 7.7 | 23 | 22 outlet 1 |
| 34.5 | 0.8 | 33.2 | 35.7 | 21 | 22 outlet 2 | |
| 23 | 76.1 | 7.8 | 57.6 | 148.5 | 473 | Farm outlet 1 |
| 32 | 50.3 | 7.7 | 34.1 | 63.9 | 20 | |
| 33 | 58.1 | 21.5 | 0.0 | 112.7 | 565 | Farm outlet 2 |
Table 3.
Summary of the overall farm differential data between outlets and inlet. Turbidity (Turb.); nitrate (NO3–N); ammonium (NH4–N); not applicable (NA).
Table 3.
Summary of the overall farm differential data between outlets and inlet. Turbidity (Turb.); nitrate (NO3–N); ammonium (NH4–N); not applicable (NA).
| DO | Turb. | NO3–N | NH4–N | pH | ||
|---|---|---|---|---|---|---|
| % | mg/L | NTU | mgN/L | mgN/L | ||
| mean difference | −27.39 | −3.09 | 1.19 | −0.36 | 0.30 | −0.39 |
| st. dev. | 6.05 | 0.67 | 1.44 | 0.72 | 0.04 | 0.07 |
| min. | −38.10 | −4.33 | −1.10 | −1.83 | 0.24 | −0.50 |
| max. | −19.40 | −2.25 | 6.01 | 0.61 | 0.38 | −0.30 |
| count | 24 | 16 | 15 | 21 | 11 | |
| flux (mg/s) * | NA | −413.9 | 159.3 | −48.6 | 40.4 | NA |
| flux (g/h) * | −1489.9 | 573.5 | −174.8 | 145.4 | ||
| flux (g/h/kgfish) ** | −0.018 | 0.007 | −0.002 | 0.002 | ||
| flux (mg/h/kgfish) ** | −18.37 | 7.07 | −2.16 | 1.79 | ||
Table 4.
Summary of the 115 pond differential data and fluxes between outlets and inlet.
| DO | Turb. | NO3–N | NH4–N | pH | ||
|---|---|---|---|---|---|---|
| % | mg/L | NTU | mgN/L | mgN/L | ||
| mean difference | −33.50 | −3.80 | 1.85 | −0.50 | 0.13 | −0.38 |
| st. dev. | 4.88 | 0.53 | 3.15 | 0.50 | 0.03 | 0.04 |
| min. | −45.50 | −5.04 | 0.18 | −1.43 | 0.08 | −0.40 |
| max. | −27.30 | −2.92 | 13.32 | 0.08 | 0.18 | −0.30 |
| count | 24 | 16 | 15 | 21 | 10 | |
| flux (mg/s) * | NA | −26.6 | 12.9 | −3.5 | 0.9 | NA |
| flux (g/h) * | −95.7 | 46.5 | −12.7 | 3.2 | ||
| flux (g/h/kgfish) ** | −0.043 | 0.021 | −0.006 | 0.001 | ||
| flux (mg/h/kgfish) ** | −42.74 | 20.76 | −5.65 | 1.44 | ||
Table 5.
Summary of the 113 pond differential data and fluxes between outlets and inlet before and after harvest.
Table 5.
Summary of the 113 pond differential data and fluxes between outlets and inlet before and after harvest.
| Before Harvest | After Harvest | |||||||||||
|---|---|---|---|---|---|---|---|---|---|---|---|---|
| DO | Turb. | NO3–N | NH4–N | pH | DO | Turb. | NO3–N | NH4–N | pH | |||
| % | mg/L | NTU | mgN/L | mgN/L | % | mg/L | NTU | mgN/L | mgN/L | |||
| mean difference | −40 | −4.55124 | 2.295 | −0.37125 | 0.136364 | −0.34286 | −23.01 | −2.607 | 0.561667 | −0.06714 | 0.07 | −0.225 |
| st. dev. | 6.685 | 0.708759 | 4.367466 | 0.590507 | 0.036952 | 0.053452 | 5.641208 | 0.630768 | 0.579738 | 0.568997 | 0.02357 | 0.05 |
| min. | −51.8 | −5.73 | −0.06 | −1.06 | 0.08 | −0.4 | −33.7 | −3.83 | −0.08 | −0.85 | 0.02 | −0.3 |
| max. | −24.1 | −2.87 | 14.52 | 0.86 | 0.19 | −0.3 | −16.8 | −1.92 | 1.45 | 0.67 | 0.1 | −0.2 |
| count | 14 | 10 | 8 | 11 | 7 | 10 | 6 | 7 | 10 | 4 | ||
| flux (mg/s) * | NA | −31.8587 | 16.065 | −2.59875 | 0.954545 | NA | NA | −18.249 | 3.931667 | −0.47 | 0.49 | NA |
| flux (g/h) * | −114.691 | 57.834 | −9.3555 | 3.436364 | −65.6964 | 14.154 | −1.692 | 1.764 | ||||
| flux (g/h/kgfish) ** | −0.04779 | 0.024098 | −0.0039 | 0.001432 | −0.10949 | 0.02359 | −0.00282 | 0.00294 | ||||
| flux (mg/h/kgfish) ** | −47.788 | 24.0975 | −3.89813 | 1.431818 | −109.494 | 23.59 | −2.82 | 2.94 | ||||
Table 6.
Summary of the 15 pond differential data and fluxes between outlets and inlet.
| DO | Turb. | NO3–N | NH4–N | pH | ||
|---|---|---|---|---|---|---|
| % | mg/L | NTU | mgN/L | mgN/L | ||
| mean difference | −56.82 | −6.41 | 1.49 | 0.08 | 0.18 | 0.01 |
| st. dev. | 4.42 | 0.49 | 1.87 | 0.22 | 0.05 | 0.04 |
| min. | −65.50 | −7.39 | −2.57 | −0.12 | 0.10 | 0.00 |
| max. | −49.70 | −5.48 | 4.58 | 0.49 | 0.27 | 0.10 |
| count | 17 | 17 | 10 | 11 | 16 | 8 |
| flux (mg/s) * | NA | −128.1 | 29.8 | 1.6 | 3.7 | NA |
| flux (g/h) * | −461.2 | 107.1 | 5.8 | 13.2 | ||
| flux (g/h/kgfish) ** | −0.059 | 0.014 | 0.001 | 0.002 | ||
| flux (mg/h/kgfish) ** | −59.21 | 13.75 | 0.75 | 1.69 | ||
© 2018 by the authors. Licensee MDPI, Basel, Switzerland. This article is an open access article distributed under the terms and conditions of the Creative Commons Attribution (CC BY) license (http://creativecommons.org/licenses/by/4.0/).
Share and Cite
MDPI and ACS Style
Tahar, A.; Kennedy, A.; Fitzgerald, R.D.; Clifford, E.; Rowan, N. Full Water Quality Monitoring of a Traditional Flow-Through Rainbow Trout Farm. Fishes 2018, 3, 28. https://doi.org/10.3390/fishes3030028
AMA Style
Tahar A, Kennedy A, Fitzgerald RD, Clifford E, Rowan N. Full Water Quality Monitoring of a Traditional Flow-Through Rainbow Trout Farm. Fishes. 2018; 3(3):28. https://doi.org/10.3390/fishes3030028
Chicago/Turabian StyleTahar, Alexandre, Alan Kennedy, Richard D. Fitzgerald, Eoghan Clifford, and Neil Rowan. 2018. "Full Water Quality Monitoring of a Traditional Flow-Through Rainbow Trout Farm" Fishes 3, no. 3: 28. https://doi.org/10.3390/fishes3030028